Consolidated Financial Summary Third Quarter of FY2015 (April 1, 2014 – December 31, 2014) This document is an English translation of the Japanese language version of the consolidated financial summary that TS TECH Co., Ltd. has produced as reference purpose. In the event of any discrepancy between this translated document and the Japanese original, the original shall prevail.

Welcome message from author
This document is posted to help you gain knowledge. Please leave a comment to let me know what you think about it! Share it to your friends and learn new things together.
Transcript

Consolidated Financial Summary
Third Quarter of FY2015
(April 1, 2014 – December 31, 2014)
This document is an English translation of the Japanese language version of the consolidated
financial summary that TS TECH Co., Ltd. has produced as reference purpose.
In the event of any discrepancy between this translated document and the Japanese original, the
original shall prevail.

Consolidated Financial Summary for the Third Quarter of FY2015
(based on Japanese accounting standards) January 30, 2015
Company name: TS TECH CO., LTD. Stock exchange listing: Tokyo Stock Exchange
Stock code: 7313 URL: http://www.tstech.co.jp
Representative: Michio Inoue, President
Contact: Mahoro Kurata, Manager, Public Relations Section,
Administration Department Tel. 048-462-1121
Scheduled date for filing of quarterly securities report: February 9, 2015
Scheduled date of commencement of dividend payment: ─
Preparation of supplementary explanatory material: None
Quarterly results briefing: None
(Amounts of less than one million yen are rounded down to the nearest million yen)
1. Consolidated Financial Results for the Third Quarter of FY2015 (April 1, 2014 – December 31, 2014)
(1) Consolidated Financial Results (Accumulated Total) (% of change from the same period of previous year)
Net sales Operating income Ordinary income Net income Million yen % Million yen % Million yen % Million yen %
Third quarter of FY2015 320,204 -3.8 25,965 -13.6 29,479 -10.0 17,401 -7.6 Third quarter of FY2014 332,778 24.3 30,051 65.8 32,750 64.9 18,825 54.4
(Note) Comprehensive income Third quarter of FY2015 31,272 million yen (-8.6%)
Third quarter of FY2014 34,222 million yen (116.7%)
Net income per share Diluted net income
per share
Yen Yen
Third quarter of FY2015 255.91 ─ Third quarter of FY2014 276.85 ─
(2) Consolidated Financial Position
Total assets Net assets Equity ratio Net assets per share Million yen Million yen % Yen
Third quarter of FY2015 275,103 195,936 63.4 2,566.77 FY 2014 264,635 170,714 57.3 2,229.53
(Reference) Shareholders’ equity: Third quarter of FY2015 174,535 million yen
FY2014 151,604 million yen
2. Cash Dividends
Annual cash dividends
End of 1Q End of 2Q End of 3Q End of year Annual Yen Yen Yen Yen Yen
FY2014 ─ 24.00 ─ 30.00 54.00
FY2015 ─ 30.00 ─
FY2015 (forecast) 30.00 60.00
(Notes) 1 Revision from the most recent announcement of cash dividends forecasts: None
3. Consolidated Forecasts for FY2015 (April 1, 2014 - March 31, 2015)
(% of change from the same period of previous year)
Net sales Operating income Ordinary income Net income Net income per
share Million yen % Million yen % Million yen % Million yen % Yen
FY2015 433,000 -5.3 35,000 -10.6 38,500 -10.3 21,900 -8.4 322.07
(Note) Revision from the most recent announcement of consolidated financial forecasts: None

4. Others
(1) Changes in important subsidiaries during the quarter
(Changes in significant subsidiaries affecting the scope of consolidation during this period) : None
New subsidiaries ― companies ( ) Excluded subsidiaries ― companies ( )
(2) Application of special accounting treatment for quarterly consolidated financial statements : Yes
(Note) For details, refer to “2. Matters Concerning Summary (Notes) Information, (2) Application of Special
Accounting Treatment for Quarterly Consolidated Financial Statements” on page 5.
(3) Changes in accounting policies and accounting estimates, or re-statement
1) Changes in accounting policies associated with the revision of accounting standards, etc. : Yes
2) Changes other than 1) : None
3) Changes in accounting estimates : None
4) Re-statement : None
(Note) For details, refer to "2. Matters Concerning Summary (Notes) Information, (3)
Changes in Accounting Policies, Accounting Estimates, or Re-statement” on page 5.
(4) Number of shares issued (common stock)
1) Number of shares issued at the end
of the term including treasury stock 3Q of FY2015 68,000,000 shares FY2014 68,000,000 shares
2) Number of treasury stock at the end
of the term 3Q of FY2015 1,764 shares FY2014 1,748 shares
3) Average number of shares during
the term (cumulative) 3Q of FY2015 67,998,245 shares 3Q of FY2014 67,998,291 shares
(*Presentation concerning the implementation status for quarterly review procedure)
Quarterly reviews based on the Financial Instruments and Exchange Act are not undertaken for quarterly financial statements at the time this financial summary is disclosed.
(*Explanation regarding the appropriate use of forecasts of financial results and other notes)
The consolidated forecasts presented above are projections made by managers of TS TECH Co., Ltd. (hereinafter the “Company”) on the basis of information available at the time of preparation. For that reason, they involve risks and uncertainties. Accordingly, we request readers of this document to avoid making investment decisions based exclusively on these forecasts. Please bear in mind the possibility for actual results may differ materially from these forecasts, due to various important factors. Readers are asked to proceed to “(3) Qualitative Information Concerning Consolidated Forecasts” on page 4 for assumptions and other information that form the premise for the operating results forecast above.

○Table of Contents
1. Qualitative Information Concerning Quarterly Results .......................................................................................2
(1) Qualitative Information Concerning Consolidated Financial Results ..........................................................2
(2) Qualitative Information Concerning Consolidated Financial Positions .......................................................4
(3) Qualitative Information Concerning Consolidated Forecasts ......................................................................4
2. Matters Concerning Summary (Notes) Information ............................................................................................5
(1) Changes in Important Subsidiaries during the Current Period .....................................................................5
(2) Application of Special Accounting Treatment for Quarterly Consolidated Financial Statements................5
(3) Changes in Accounting Policies, Accounting Estimates, or Re-statement. ..................................................5
3. Quarterly Consolidated Financial Statements......................................................................................................6
(1) Quarterly Consolidated Balance Sheets .......................................................................................................6
(2) Quarterly Consolidated Statements of Income and Comprehensive Income ...............................................8
(3) Notes Concerning Quarterly Consolidated Financial Statements .............................................................. 10
Notes Concerning Going Concern Assumption ......................................................................................... 10
Notes Concerning Significant Changes in the Amount of Shareholders’ Equity ....................................... 10
Segment Information, etc. .......................................................................................................................... 10
-1-

1. Qualitative Information Concerning Quarterly Results
(1) Qualitative Information Concerning Consolidated Financial Results
Net sales for the first three quarters of FY2015 (April 1, 2014 - December 31, 2014) amounted to 320,204
million yen on a consolidated basis, down 12,574 million yen (3.8%) from the same period in FY2014. The impact
of exchange rates driven by the weaker yen (roughly 16,000 million yen) was offset by a decrease in order volume
from major customers in the Americas and Thailand.
Looking at profits, operating income stood at 25,965 million yen, a decrease of 4,086 million yen (13.6%) year-
on-year, primarily reflecting the effects of a decrease in revenue, which offset the positive impact of exchange rates.
Ordinary income totaled 29,479 million yen, a decrease of 3,270 million yen (10.0%) from the same period in
FY2014, and net income amounted to 17,401 million yen, a decrease of 1,424 million yen (7.6%) year-on-year.
Operating performance by segment is as follows:
(Japan)
(Unit: Million yen)
First three quarters
of FY2014
First three quarters
of FY2015 Year-on-year Changes
Net sales 75,674 66,785 -8,889 -11.7%
Operating income 5,078 5,158 80 1.6%
Main factors for year-on-year change
Net sales Net sales decreased due to a higher percentage of light motor vehicles in the makeup
of models and a decline in sales of parts supplied from Japan, which outweighed the
effects of increased order volume from major customers.
Operating income Operating income increased primarily due to lower operating expenses, offsetting the
effects of the aforementioned decrease in net sales.
(Americas)
(Unit: Million yen)
First three quarters
of FY2014 First three quarters
of FY2015 Year-on-year Changes
Net sales 159,440 161,033 1,592 1.0%
Operating income 12,170 11,575 -595 -4.9%
Main factors for year-on-year change
Net sales Net sales increased due to the positive impact of exchange rates, offsetting a decrease
in revenue stemming from a decline in order volume from major customers.
Operating income The impact of a decrease in order volume from major customers resulted in a decline
in operating income, offsetting the effects of the aforementioned increase in net sales.
-2-

(China)
(Unit: Million yen)
First three quarters
of FY2014 First three quarters
of FY2015 Year-on-year Changes
Net sales 72,151 72,626 474 0.7%
Operating income 9,156 12,162 3,006 32.8%
Main factors for year-on-year change
Net sales Net sales were virtually unchanged year-on-year due to the effects of changes in the
makeup of models caused by a decline in luxury models, offsetting the positive impact
of exchange rates and increased order volume from major customers.
Operating income Operating income increased primarily due to the effects of cost reductions,
outweighing the effects of flat net sales due to the aforementioned reason.
(Asia and Europe)
(Unit: Million yen)
First three quarters
of FY2014 First three quarters
of FY2015 Year-on-year Changes
Net sales 51,786 43,351 -8,435 -16.3%
Operating income 7,266 2,238 -5,027 -69.2%
Main factors for year-on-year change
Net sales Although order volume from major customers increased in countries such as
Indonesia, a decrease in order volume in Thailand resulted in a sharp decline in net
sales.
Operating income Operating income decreased, reflecting factors such as increased various expenses and
the reasons outlined above.
Sales by business segment are as follows:
(Unit: Million yen)
First three quarters of
FY2014 First three quarters of
FY2015 Year-on-
year Changes
Sales ratio Sales ratio
Motorcycles 4,993 1.5% 4,639 1.5% -353 -7.1%
Automobiles 324,418 97.5% 311,578 97.3% -12,840 -4.0%
(Seats) 287,760 86.5% 278,120 86.9% -9,640 -3.4%
(Interior products) 36,658 11.0% 33,458 10.4% -3,200 -8.7%
Other businesses 3,366 1.0% 3,986 1.2% 620 18.4%
Total 332,778 100.0% 320,204 100.0% -12,574 -3.8%
-3-

(2) Qualitative Information Concerning Consolidated Financial Positions
(Total assets)
Total assets at the end of the third quarter of FY2015 stood at 275,103 million yen, up 10,468 million yen
from the end of FY2014, primarily reflecting the positive impact of exchange rates, as well as an increase in
property, plant and equipment due in part to building expansion projects in North America and investments
in new models. These factors offset a decrease in notes and accounts receivable-trade, the result of factors
such as a decline in orders from major customers.
(Liabilities)
Total liabilities at the end of the third quarter of FY2015 amounted to 79,166 million yen, decreasing
14,753 million yen from the end of FY2014. The decrease resulted primarily from a decline in notes and
accounts payable-trade and a decrease in other current liabilities, chiefly due to payment of cash dividends,
offsetting increases stemming from the impact of exchange rates.
(Net assets)
Net assets at the end of the third quarter of FY2015 were 195,936 million yen, up 25,221 million yen from
the end of FY2014. The increase was chiefly due to an increase in both retained earnings and foreign
currency translation adjustments.
(3) Qualitative Information Concerning Consolidated Forecasts
Taking into account consolidated operating results for the first three quarters of FY2015 as well as the
current trend in orders from main customers and foreign exchange rates, the Group is keeping the
consolidated forecasts announced on October 30, 2014 unchanged.
-4-

2. Matters Concerning Summary (Notes) Information
(1) Changes in Important Subsidiaries during the Current Period
Not applicable
(2) Application of Special Accounting Treatment for Quarterly Consolidated Financial Statements
(Calculation of tax expense)
Tax expense is calculated by rationally estimating the effective tax rate for income before income taxes for the
fiscal year, including the first three quarters of FY2015, following the application of tax effect accounting, and
multiplying quarterly income before income taxes by the estimated effective tax rate.
(3) Changes in Accounting Policies, Accounting Estimates, or Re-statement
The provisions of the main clause of paragraph 35 of the Accounting Standard for Retirement Benefits (ASBJ
Statement No. 26, May 17, 2012) and the provisions of the main clause of paragraph 67 of the Guidance on
Accounting Standard for Retirement Benefits (ASBJ Guidance No. 25, May 17, 2012) have been applied from
the first quarter of FY2015. The calculation method for liabilities concerning retirement benefits and service
costs was revised, and the method of attributing expected benefit to periods was changed from a straight-line
basis to a benefit formula basis. The method for determining the discount rate has also been changed from a
method that uses a period approximate to the average remaining service period for employees to a single
weighted average discount rate reflecting the estimated timing and amount of benefit payment.
The Accounting Standard for Retirement Benefits, etc. was adopted in accordance with the transitional
treatment stipulated in paragraph 37 of the Accounting Standard for Retirement Benefits. At the beginning of the
third quarter of FY2015, the effects of the change in the calculation method for liabilities concerning retirement
benefits and service costs were reflected in the retained earnings.
As a result, retained earnings at the beginning of the third quarter of FY2015 increased by 423 million yen. In
addition, the impact on operating income, ordinary income and net income before taxes for the current period
under review is minimal.
-5-

3. Quarterly Consolidated Financial Statements
(1) Quarterly Consolidated Balance Sheets
(Unit: Million yen)
FY2014
(As of March 31, 2014)
Third quarter of FY2015
(As of December 31, 2014)
Assets
Current assets
Cash and deposits 78,181 84,064
Notes and accounts receivable-trade 65,530 52,560
Merchandise and finished goods 2,609 2,105
Work in process 3,325 4,117
Raw materials and supplies 19,681 21,755
Other 8,106 11,198
Allowance for doubtful accounts -40 -18
Total current assets 177,394 175,783
Noncurrent assets
Property, plant and equipment
Buildings and structures, net 23,940 28,806
Machinery, equipment and vehicles, net 14,272 15,039
Other, net 24,040 29,234
Total property, plant and equipment 62,253 73,080
Intangible assets 1,546 3,004
Investments and other assets 23,441 23,235
Total noncurrent assets 87,240 99,320
Total assets 264,635 275,103
Liabilities
Current liabilities
Notes and accounts payable-trade 56,932 47,526
Short-term loans payable 1,869 2,091
Long-term loans scheduled for payment within one year 167 75
Income taxes payable 3,049 1,592
Provision 3,204 2,194
Other 19,548 15,530
Total current liabilities 84,772 69,011
Noncurrent liabilities
Long-term loans payable 69 18
Provision 60 ─
Liabilities concerning retirement benefits 2,663 950
Other 6,354 9,186
Total noncurrent liabilities 9,148 10,155
Total liabilities 93,920 79,166
-6-

(Unit: Million yen)
FY2014
(As of March 31, 2014)
Third quarter of FY2015
(As of December 31, 2014)
Net assets
Shareholders’ equity
Capital stock 4,700 4,700
Capital surplus 5,163 5,163
Retained earnings 133,858 147,564
Treasury stock -3 -3
Total shareholders’ equity 143,718 157,424
Valuation and translation adjustments
Valuation difference on available-for-sale securities 8,533 8,550
Foreign currency translation adjustment 290 8,780
Adjustments concerning retirement benefits -937 -219
Total valuation and translation adjustments 7,886 17,111
Minority interests 19,110 21,400
Total net assets 170,714 195,936
Total liabilities and net assets 264,635 275,103
-7-
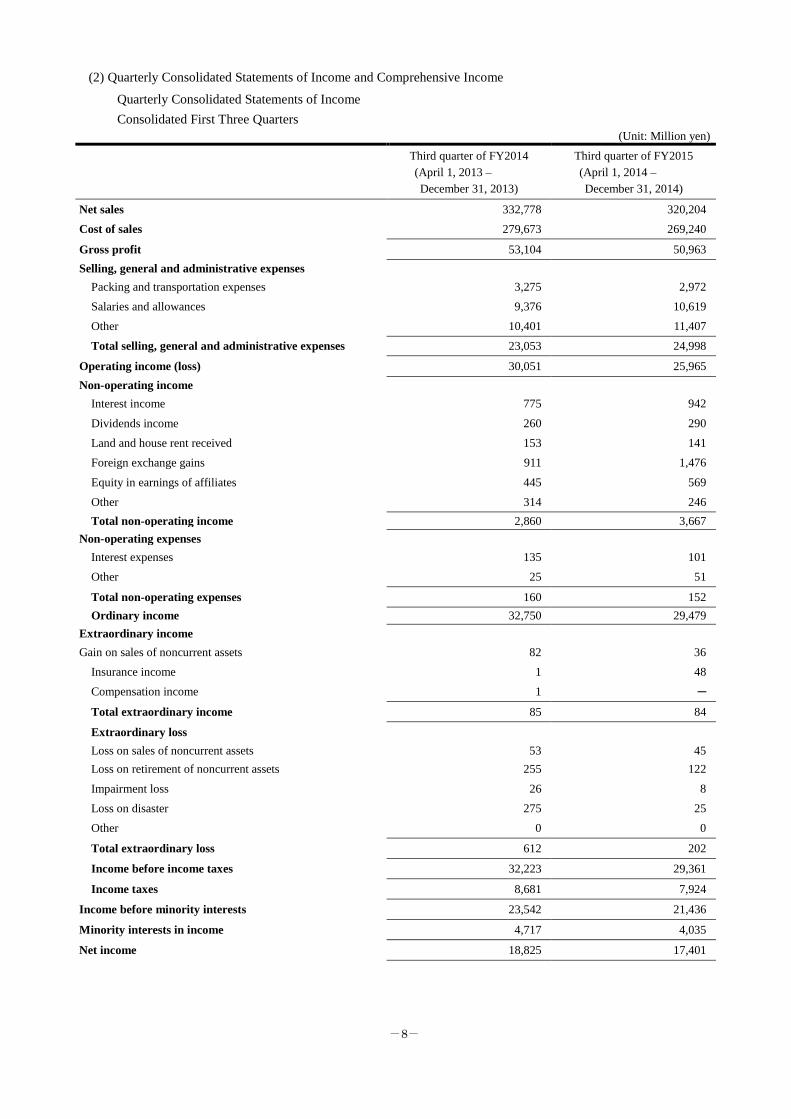
(2) Quarterly Consolidated Statements of Income and Comprehensive Income
Quarterly Consolidated Statements of Income
Consolidated First Three Quarters
(Unit: Million yen)
Third quarter of FY2014
(April 1, 2013 –
December 31, 2013)
Third quarter of FY2015
(April 1, 2014 –
December 31, 2014)
Net sales 332,778 320,204
Cost of sales 279,673 269,240
Gross profit 53,104 50,963
Selling, general and administrative expenses
Packing and transportation expenses 3,275 2,972
Salaries and allowances 9,376 10,619
Other 10,401 11,407
Total selling, general and administrative expenses 23,053 24,998
Operating income (loss) 30,051 25,965
Non-operating income
Interest income 775 942
Dividends income 260 290
Land and house rent received 153 141
Foreign exchange gains 911 1,476
Equity in earnings of affiliates 445 569
Other 314 246
Total non-operating income 2,860 3,667
Non-operating expenses
Interest expenses 135 101
Other 25 51
Total non-operating expenses 160 152
Ordinary income 32,750 29,479
Extraordinary income
Gain on sales of noncurrent assets 82 36
Insurance income 1 48
Compensation income 1 ─
Total extraordinary income 85 84
Extraordinary loss
Loss on sales of noncurrent assets 53 45
Loss on retirement of noncurrent assets 255 122
Impairment loss 26 8
Loss on disaster 275 25
Other 0 0
Total extraordinary loss 612 202
Income before income taxes 32,223 29,361
Income taxes 8,681 7,924
Income before minority interests 23,542 21,436
Minority interests in income 4,717 4,035
Net income 18,825 17,401
-8-

Quarterly Consolidated Statements of Comprehensive Income
Consolidated First Three Quarters
(Unit: Million yen)
Third quarter of FY2014
(April 1, 2013 –
December 31, 2013)
Third quarter of FY2015
(April 1, 2014 –
December 31, 2014)
Income before minority interests 23,542 21,436
Other comprehensive income
Valuation difference on available-for-sale securities 2,200 25
Foreign currency translation adjustment 8,361 9,096
Adjustments concerning retirement benefits ─ 713
Share of other comprehensive income of associates
accounted for using equity method 118 1
Other comprehensive income 10,679 9,835
Comprehensive income 34,222 31,272
Comprehensive income attributable to
Comprehensive income attributable to owners of the
parents 27,683 26,626
Comprehensive income attributable to minority interests 6,538 4,645
-9-

(3) Notes Concerning Quarterly Consolidated Financial Statements
(Notes Concerning Going Concern Assumption)
Not applicable
(Notes Concerning Significant Changes in the Amount of Shareholders’ Equity)
Not applicable
(Segment Information, etc.)
Third quarter of FY2014 (April 1, 2013 – December 31, 2013)
1. Information about net sales, profits and losses according to reporting segments
(Unit: Million yen)
Reporting segments
Adjustments (Note) 1
Amounts stated in
quarterly P/L (Note) 2
Japan Americas China Asia and Europe
Total
Net sales
Sales to customers 55,148 159,356 66,933 51,339 332,778 - 332,778
Inter-area transfer 20,525 84 5,217 446 26,274 -26,274 -
Total 75,674 159,440 72,151 51,786 359,053 -26,274 332,778
Segment profits 5,078 12,170 9,156 7,266 33,671 -3,620 30,051
(Notes) 1. Adjustments of -3,620 million yen for segment profits include a deduction of -317 million yen for transactions
among segments, and operating expenses of -3,245 million yen associated with the administration division of the
headquarters of the parent company, which could not be allocated.
2. Segment profits are adjusted to operating income in quarterly consolidated statements of income.
2 Information about impairment loss of noncurrent assets or goodwill according to reporting segments
(Significant impairment loss on noncurrent assets)
The Company fully wrote off the carrying value of idle assets in the Japan and Americas segments to the
extent of the recoverable value, and recorded its write-down under extraordinary loss as an impairment
loss. The impairment loss stood at 7 million yen in the Japan segment and 18 million yen in the Americas
segment for the current period under review.
(Significant change in goodwill value)
TS TECH AMERICAS, INC., a consolidated subsidiary, acquired equity in TS TECH DO BRASIL
LTDA., which was held by other companies, during the first quarter of FY2015. As a result, the
Company posted goodwill of 192 million yen in the Americas segment.
-10-

Third quarter of FY2015 (April 1, 2014 – December 31, 2014)
1. Information about net sales, profits and losses according to reporting segments
(Unit: Million yen)
Reporting segments
Adjustments (Note) 1
Amounts stated in
quarterly P/L (Note) 2
Japan Americas China Asia and Europe
Total
Net sales
Sales to customers 48,326 160,587 68,653 42,636 320,204 - 320,204
Inter-area transfer 18,458 445 3,972 714 23,591 -23,591 -
Total 66,785 161,033 72,626 43,351 343,796 -23,591 320,204
Segment profits 5,158 11,575 12,162 2,238 31,135 -5,170 25,965
(Notes) 1. Adjustments of -5,170 million yen for segment profits include a deduction of -202 million yen for transactions
among segments, and operating expenses of -3,503 million yen associated with the administration division of the
headquarters of the parent company, which could not be allocated.
2. Segment profits are adjusted to operating income in quarterly consolidated statements of income.
2 Matters concerning changes in reporting segments, etc.
As stated in "Changes in Accounting Policies," the calculation method for liabilities concerning
retirement benefits and service costs was changed from the first quarter of FY2015. The impact on
segment profits for the current period under review is minimal.
-11-
Related Documents