Spur Corporation Ltd Integrated Report 2015 75 CONSOLIDATED AND SEPARATE FINANCIAL STATEMENTS ABOUT THESE FINANCIAL STATEMENTS The consolidated and separate financial statements on pages 86 to 184 of this report have been audited in accordance with the requirements of section 30 of the Companies Act of South Africa (Act No. 71 of 2008, as amended) and have been prepared under the supervision of the group chief financial officer, Ronel van Dijk CA(SA).

Welcome message from author
This document is posted to help you gain knowledge. Please leave a comment to let me know what you think about it! Share it to your friends and learn new things together.
Transcript
Spur Corporation Ltd Integrated Report 2015 75
CONSOLIDATED AND SEPARATE FINANCIAL STATEMENTSABOUT THESE FINANCIAL STATEMENTSThe consolidated and separate financial statements on pages 86 to 184 of this report have been audited in accordance with the requirements of section 30 of the Companies Act of South Africa (Act No. 71 of 2008, as amended) and have been prepared under the supervision of the group chief financial officer, Ronel van Dijk CA(SA).
Spur Corporation Ltd Integrated Report 201576
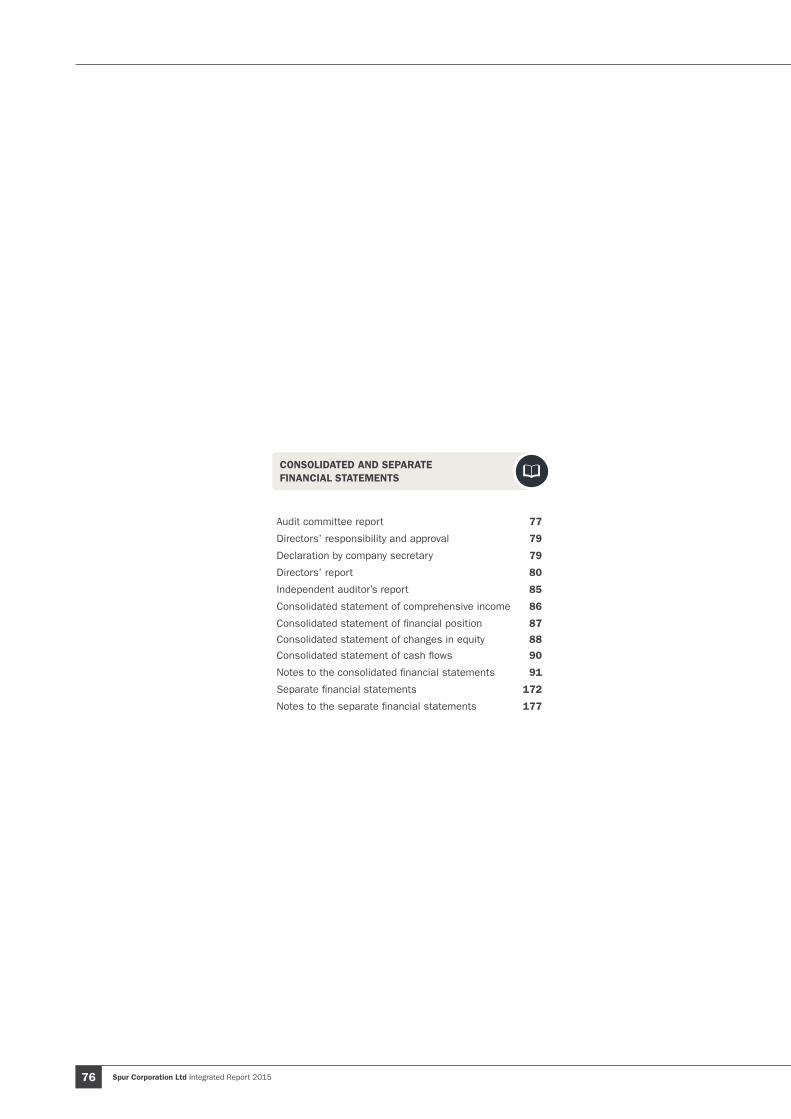
CONSOLIDATED AND SEPARATE FINANCIAL STATEMENTS
Audit committee report 77
Directors’ responsibility and approval 79
Declaration by company secretary 79
Directors’ report 80
Independent auditor’s report 85
Consolidated statement of comprehensive income 86
Consolidated statement of financial position 87
Consolidated statement of changes in equity 88
Consolidated statement of cash flows 90
Notes to the consolidated financial statements 91
Separate financial statements 172
Notes to the separate financial statements 177

Spur Corporation Ltd Integrated Report 2015 77
AUDIT COMMITTEE REPORT
AUDIT COMMITTEE REPORT
COMPANIES ACT COMPLIANCEThe company has complied with section 94 of the Companies Act relating to audit committees. In addition, the board is of the opinion that the requirements of regulation 42 of the Companies Act, which require at least one-third of the members of a company’s audit committee to have academic qualifications, or experience, in economics, law, corporate governance, finance, accounting, commerce, industry, public affairs or human resource management, are complied with.
FUNCTIONING OF THE COMMITTEEThe committee operates within formal terms of reference approved by the board. The committee is satisfied that it has met its responsibilities as stipulated in the terms of reference. The committee is also satisfied that it has complied with its legal, regulatory and other responsibilities.
The committee discharges its responsibilities by meeting formally at least twice a year to review the group’s interim and annual results before publication, and to receive and review internal audit reports, external audit reports and the written report from the board’s risk committee. It also meets with management to review their progress on key issues relating to financial controls and risks, and deals with other matters falling within its terms of reference. Committee members review company trading statements on an ad hoc basis. The findings and recommendations of the committee are reported to the board at the following board meeting, which is typically held within a week of the committee meeting.
The committee meets informally on an ad hoc basis with internal audit, the external auditor and management to address key issues as the need arises, specifically to consider risk assessment and management, review the audit plans of the external and internal auditors and to review accounting, auditing, financial reporting, corporate governance, and compliance matters. The internal audit plan and internal audit conclusions are similarly reviewed and approved by the committee.
Management meets with the external auditor on a regular basis to identify audit risks which, if significant, are reported to the committee.
Management presents the chairman of the committee and the external auditor with summarised financial information relating to the performance of the group on a regular basis.
The committee discharges all audit committee responsibilities of all the subsidiaries within the group. The external and internal auditors have unrestricted access to the committee.
CHAIRMAN’S ATTENDANCE AT THE ANNUAL GENERAL MEETINGKing III recommends that the chairman of the committee be present at the annual general meeting (“AGM”) to answer questions on the integrated report, the committee’s activities and matters within the scope of the committee’s responsibilities.
The chairman of the audit committee is not ordinarily resident in the Western Cape. Given the limited attendance by shareholders at the AGM, the board is of the opinion that the cost of making the chairman of the committee available at the AGM is not warranted. The chairman of the committee has agreed to be available telephonically in the event that any shareholder wishes to address him at the AGM. In addition, a member of the committee will be available at the AGM to address questions raised.
EXTERNAL AUDITOR APPOINTMENT AND INDEPENDENCEThe audit committee has satisfied itself that the external auditor is independent of the company, as set out in section 94(8) of the Companies Act, which includes considering previous appointments of the auditor, the extent of other work undertaken by the auditor for the company and compliance with criteria relating to independence or conflicts of interest as prescribed by the Independent Regulatory Board for Auditors. Requisite assurance was sought and provided by the auditor that internal governance processes within the audit firm support and demonstrate its claim to independence.
The committee ensured that the appointment of the auditor complied with the Companies Act and any other legislation relating to the appointment of auditors. There is a formal procedure that governs the process whereby the auditor is considered for non-audit services. In general, the auditor is not engaged for non-audit services, unless, in the opinion of the committee, it is appropriate to do so and the extent of the service is not significant. The committee recognises that there may be circumstances where it would be to the group’s advantage to engage the auditor for non-audit services that are significant and these will be considered on a case-by-case basis. Minimal pre-approved non-audit services were provided by the auditor for the year under review.
The audit committee has satisfied itself that the audit firm and designated auditor are accredited on the JSE’s list of auditors and their advisors.
FINANCIAL STATEMENTS AND ACCOUNTING PRACTICESThe audit committee has reviewed the accounting policies and the financial statements of the company and is satisfied that they are appropriate and comply with International Financial Reporting Standards.
The audit committee has established a formal process to receive and deal appropriately with any concerns and complaints relating to the reporting practices of the company. No such matters were brought to the attention of the committee during the year under review.
Spur Corporation Ltd Integrated Report 201578
INTERNAL FINANCIAL CONTROLSIn considering the integrity of the company’s financial information and the effectiveness of internal financial controls, the committee relies on the work performed by internal audit, representations by management and the external auditor’s management report. The committee acknowledges that it is not the external auditor’s responsibility to identify control deficiencies, but considers the content of the report to be a key indicator of the effectiveness of the general financial control environment.
Based on these interactions, nothing has come to the committee’s attention that would lead it to believe that an adequate and appropriate system of internal control is not in place. The committee has advised the board accordingly.
INTEGRATED REPORTING AND COMBINED ASSURANCEKing III recommends that the committee should recommend that the board engage an external service provider to provide assurance over material elements of the sustainability part of the integrated report. The board has considered this recommendation and determined that the cost of such an assurance exercise would exceed any benefits to stakeholders. As the group progresses its journey towards more enhanced sustainability reporting, the board will review this decision.
The audit committee has considered the company’s sustainability information as disclosed in the integrated report and has assessed its consistency with operational and other information known to audit committee members, and for consistency with the annual financial statements. Nothing has come to the audit committee’s attention, which would lead it to conclude that the sustainability information is not reliable.
The committee has reviewed this integrated report and recommended it to the board for approval.
GOING CONCERNThe audit committee has considered the going concern status of the company and of the group and has made recommendations to the board in this regard. The board’s statement on the going concern status of the company and of the group is supported by the audit committee.
GOVERNANCE OF RISKThe risks identified by the risk committee insofar as they relate to financial and integrated reporting or internal controls are highlighted to the audit committee in a formal report from the risk committee. The audit committee fulfils an oversight role regarding financial reporting risks, internal financial controls, fraud risk as it relates to financial reporting and information technology risks as they relate to financial reporting.
INTERNAL AUDITThe board has outsourced the internal audit function to an independent, reputable service provider. The committee is responsible for overseeing the internal audit function.
The audit committee is responsible for ensuring that the company’s internal audit function is independent and has the necessary resources, standing and authority within the company to enable it to discharge its duties. Furthermore, the committee oversees cooperation between the internal and external auditors, and serves as a link between the board of directors and these functions.
The audit committee considered and recommended the internal audit charter for approval by the board. The charter governs the authority and responsibilities of the various role players. The engagement partner of the outsourced service provider has been appointed as the chief audit executive in terms of the charter and reports directly to the audit committee.
The audit committee has approved a five-year risk-based audit programme in terms of which the outsourced service provider will address, inter alia, those risks and controls identified by the committee as being key to financial reporting, operational sustainability and stakeholder reporting. Deliverables will include written reports to the committee on the respective audit areas.
EVALUATION OF THE EXPERTISE AND EXPERIENCE OF THE FINANCIAL DIRECTOR AND FINANCE FUNCTIONIn accordance with the JSE Listings Requirements, the committee must consider and be satisfied, on an annual basis, of the appropriateness of the expertise and experience of the financial director. The committee has concluded that Ronel van Dijk, the group chief financial officer and financial director, possesses the appropriate expertise and experience to meet her responsibilities in that position. The committee has further assessed the appropriateness of the expertise and adequacy of resources of the finance function and experience of the senior members of management responsible for the finance function and concluded that these are adequate.
OTHER CONCLUSIONS BY THE COMMITTEEThe committee is satisfied that to the date of this report:
– Financial reporting risks have been identified and mitigated – A satisfactory system of internal financial controls is in place – Fraud risks relating to financial reporting have been considered and mitigated – IT risks relating to financial reporting have been considered and mitigated
No material weaknesses in financial controls that resulted in material financial loss, fraud or errors were identified during the year under review.
Dean Hyde Audit committee chairman
Spur Corporation Ltd Integrated Report 2015 79
DIRECTORS’ RESPONSIBILITY AND APPROVAL
DIRECTORS’ RESPONSIBILITY AND APPROVALThe directors are responsible for the preparation and fair presentation of the consolidated and separate annual financial statements of Spur Corporation Ltd, comprising the statements of financial position at 30 June 2015, the statements of comprehensive income, changes in equity and cash flows for the year then ended and the notes to the financial statements, which include a summary of significant accounting policies and other explanatory notes, in accordance with International Financial Reporting Standards and the requirements of the Companies Act of South Africa. In addition, the directors are responsible for preparing the directors’ report.
The directors are also responsible for such internal control as the directors determine is necessary to enable the preparation of financial statements that are free from material misstatement, whether due to fraud or error, and for maintaining adequate accounting records and an effective system of risk management as well as the preparation of the supplementary schedules included in these financial statements.
Based on the results of reviews of the design, implementation and effectiveness of the internal financial controls conducted by the internal audit function during the 2015 financial year and considering information and explanations given by management and discussions with the external auditor on the results of the audit, assessed by the audit committee, nothing has come to the attention of the board that caused it to believe that the company’s system of internal controls and risk management, to the extent this has any impact on this integrated report, is not effective and that the internal financial controls do not form a sound basis for the preparation of reliable financial statements. The board’s opinion is supported by the audit committee.
The directors have made an assessment of the ability of the company and its subsidiaries to continue as going concerns and have no reason to believe that the businesses will not be going concerns in the year ahead.
The auditor is responsible for reporting on whether the consolidated and separate annual financial statements are fairly presented in accordance with the applicable financial reporting framework.
The board of directors furthermore acknowledges its responsibility to ensure the integrity of the integrated report. The board has accordingly applied its mind to the integrated report in its entirety and in the opinion of the board the integrated report addresses all material issues, and presents fairly the integrated performance of the group and its impacts. The integrated report has been prepared in line with best practice pursuant to the recommendations of King III.
The consolidated and separate annual financial statements of Spur Corporation Ltd, as identified in the first paragraph, as well as the integrated report in its entirety, were approved by the board of directors on 5 October 2015 and are signed on its behalf by
Allen Ambor Executive chairman
Pierre van Tonder Group chief executive officer
DECLARATION BY COMPANY SECRETARYIn terms of Section 88(2)(e) of the Companies Act 2008, as amended, I certify that the Company has lodged with the Commissioner all such returns and notices as required by the Companies Act and that all such returns and notices appear to be true, correct and up to date.
Nazrana HawaSecretary5 October 2015
Spur Corporation Ltd Integrated Report 201580
DIRECTORS’ REPORTThe directors present their sixteenth annual report for the year ended 30 June 2015.
NATURE OF THE BUSINESSSpur Corporation Ltd (company registration number: 1998/000828/06), which is domiciled and incorporated in the Republic of South Africa and listed on the JSE Ltd, the recognised securities exchange in South Africa, is an investment holding company. Through its subsidiaries, primarily Spur Group (Pty) Ltd, John Dory’s Franchise (Pty) Ltd, RocoMamas Franchise Co (Pty) Ltd, Steak Ranches International BV, Spur Franchise Namibia (Pty) Ltd, Spur Corporation UK Ltd and Spur Corporation Australia Pty Ltd, the group carries on the business of franchisor in predominantly the family sit-down and quick service restaurant markets. Through subsidiaries, Spur Advertising (Pty) Ltd, Panarottis Advertising (Pty) Ltd, John Dory’s Advertising (Pty) Ltd, The Ad Workshop (Pty) Ltd (trading as Captain DoRegos Advertising), Marocap (Pty) Ltd (trading as RocoMamas Advertising), Estalor (Pty) Ltd (trading as The Hussar Grill Advertising), Spur Advertising Namibia (Pty) Ltd, Spur Advertising UK Ltd, Spur Advertising Australia Pty Ltd, Panarottis Advertising Australia Pty Ltd and Steak Ranches International BV (operating separate divisions as marketing funds for African territories), the group provides marketing and promotional services to franchisees. A subsidiary of the company, Spur Group Properties (Pty) Ltd, owns certain properties which are owner-occupied from a group perspective. A subsidiary, Share Buy-back (Pty) Ltd, holds treasury shares as authorised by shareholders by way of special resolution on an annual basis. The company also has indirect interests in various companies in the United Kingdom which own and operate retail Spur restaurants in that territory as well as three local entities that operate three The Hussar Grills in South Africa.
FINANCIAL REVIEWThe group’s statement of comprehensive income is presented on page 86 and reflects the group’s financial results.
Spur Corporation delivered another competitive performance in the year to June 2015 and continued to gain market share as worldwide restaurant sales increased by 12.1% to R6.2 billion. Restaurant sales in South Africa proved resilient and grew by 11.3% in an environment of continued slowdown in middle-income spending and consumer confidence sinking to its lowest levels in over a decade. Trading conditions were compounded by load-shedding which reduced local restaurant turnover by an estimated 3%. Generators have been installed in 283 of the group’s local restaurants, including 74% of Spur outlets, at a cost to franchisees of approximately R106 million. Spend in outlets in shopping malls is nevertheless negatively impacted when other stores in the malls are forced to close during power outages.
Spur Steak Ranches increased local restaurant sales by 9.0% as promotions proved successful in attracting value conscious customers. These include the Unreal Breakfast, with breakfasts now accounting for almost 20% of Spur’s meals sold, and weekday evening promotions such as the Monday night Buy One Get One Free burger offer. In this environment, the Spur Family Card continues to attract customers and promote loyalty, gaining over 15 000 new members each month. The loyalty programme now has 1.9 million active members who account for 45% of Spur’s restaurant sales.
Panarottis Pizza Pasta continued its strong growth trend of recent years and increased local restaurant sales by 25.4%. Growth was driven mainly by opening 11 new stores, revamping existing stores, upgrading kids’ play areas as well as marketing campaigns to promote the brand’s authentic Italian offering.
John Dory’s Fish Grill Sushi local restaurant sales grew by a pleasing 12.0%, benefiting from the addition of six new outlets.
Captain DoRegos local restaurant sales, representing 2.3% of group restaurant turnover, declined by 13.2% as consumer spending among the lower-income market remains constrained. During the year, 16 non-performing Captain DoRegos outlets were closed (2014: 15 closures), while 12 new outlets were opened in better trading sites.
The Hussar Grill performed well in its first full financial year in the group as its higher-income target customer proved more resilient to the current economic challenges. Two new franchised outlets were opened and management plans to leverage the brand equity to expand nationally in the year ahead.
In March 2015, the group bought a 51% stake in RocoMamas, a trendy, fast-casual dining restaurant brand offering hand-made “smash-style” burgers, ribs and wings. At the time of the acquisition the chain had five franchised restaurants in Gauteng and a further four were opened before year-end. The brand has strong appeal in the 18 to 35 age group and has exciting growth prospects nationally.
International restaurant sales increased by 18.6%. Applying a constant exchange rate, sales grew by 16.5%. Three additional Spur outlets were opened in Namibia, bringing the number of outlets in the country to 11. In addition, a Spur and a Panarottis outlet were opened in Tanzania and the first international John Dory’s was opened in Zambia. A further Spur franchised outlet opened in Perth, Australia.
In the United Kingdom (UK), the first Spur RBW (Ribs Burgers Wings) company-owned restaurant was opened in Corby (near Northampton) in June 2015.
Following the opening of 15 Spur, 12 Panarottis, seven John Dory’s, 12 Captain DoRegos, two The Hussar Grill and four RocoMamas outlets during the past year, the group’s restaurant base increased to 522.
In the past year franchisees invested over R310 million in opening, relocating or revamping restaurants, highlighting their confidence in the brands.
Group revenue increased by 3.7% to R760.1 million, with revenue generated in South Africa growing by 11.7%. Franchise revenue in Spur increased by 9.5%, Panarottis by 31.7% and John Dory’s by 13.7%, with improved margins in each of these franchise divisions.
Franchise revenue for Captain DoRegos declined by 25.8%. As a result of increased pressure on the disposable income of the brand’s target market, and the resultant underperformance of the division, the directors have impaired the trademark by R13.9 million. Management has implemented measures to reverse the fortunes of Captain DoRegos and to focus on profitability and franchisee sustainability.
Spur Corporation Ltd Integrated Report 2015 81
DIRECTORS’ REPORT
The Hussar Grill generated R33.2 million in franchise and retail revenue in its first full year in the group.
Revenue in the manufacturing and distribution division was 1.5% lower owing to the impact of the closure of the Captain DoRegos warehouse and distribution centre in the previous financial year. Comparable revenue increased by 13.0%.
International revenue, comprising franchise revenue and company-owned restaurant turnover, declined 11.5% to R223.1 million, partially due to the closure of a retail outlet in the UK and the disposal of all three retail outlets in Australia during the year.
The performance in the UK and Ireland was disappointing with revenue 6.3% lower than the previous year. Losses grew further owing mainly to high levels of competition in the quick-service restaurant market and escalating labour, occupancy and food costs. The loss in the current year includes an impairment of R1.1 million relating to the Spur outlet at the O2 Arena in London. The Spur in Wandsworth, which was previously impaired, closed during the year. All eight restaurants in the UK and Ireland are company-owned.
The group has shifted its strategy in the UK to focus on a smaller format Spur brand, known as RBW (Ribs Burgers Wings). The first Spur RBW company-owned outlet opened shortly before year-end and initial customer response has been encouraging. The RBW concept requires a lower investment by franchisees than a regular Spur restaurant and is considered a more sustainable formula in the current climate.
The Australian operations experienced a more positive trading period and returned to profitability. The group sold its remaining interests in two Panarottis and one Spur outlet to franchisees and the Australian business is now a fully franchised operation. A further franchised Spur restaurant was opened in Perth in the first half of the year.
The franchise operation in Africa, including Mauritius, delivered strong growth in revenue and profitability, boosted by the opening of six new outlets during the year. The group’s footprint in the region expanded to 41 outlets.
The group’s performance was impacted by a share-based payment expense of R33.0 million relating to the broad-based black economic empowerment transaction with Grand Parade Investments Ltd effected on 30 October 2014. The transaction resulted in the issue of 10.848 million new ordinary shares which increased the weighted average number of shares in issue from 85.633 million in the prior year to 92.636 million shares.
Profit before income tax increased by 1.8% to R205.4 million. This includes the charge relating to the GPI transaction of R33.0 million, a net charge of R4.9 million (2014: R10.2 million) related to the long-term share-linked employee retention scheme, R15.0 million (2014: R6.0 million) impairments and related losses, a foreign exchange gain of R1.9 million (2014: loss of R0.8 million) and other one-off and exceptional items in the current and previous comparable periods.
Comparable profit before tax, excluding exceptional and one-off items (including those listed above) and the impact of the GPI transaction, increased by 10.8%.
Headline earnings increased by 4.7% to R141.5 million with diluted headline earnings per share 3.2% lower at 152.8 cents per share. Excluding the impact of the GPI transaction and other exceptional and one-off items listed above, comparable headline earnings per share increased by 14.3%.
The total dividend increased by 9.1% to 132 cents per share. This equates to a dividend payment of R143.2 million, an increase of 21.2% on the prior year.
AUDIT AND RISK COMMITTEESPages 77 to 78 and 67 to 68 of this report set out the responsibilities of the audit and risk committees and how these responsibilities have been discharged during the year.
SHARE CAPITALThe number of authorised shares has remained at 201 000 000 ordinary shares of 0.001 cents each, for the year ended 30 June 2015.
On 3 October 2014, shareholders approved the issue of 10 848 093 new ordinary shares pursuant to a broad-based black economic empowerment deal (refer note 21.2 of the consolidated financial statements), increasing the total number of shares in issue from 97 632 833 to 108 480 926.
On 3 October 2014, shareholders further approved the donation of 500 000 (100 000 per annum) shares by Share Buy-back (Pty) Ltd (a wholly-owned subsidiary of the company) to The Spur Foundation Trust, a benevolent foundation that is a consolidated structured entity. The first donation of 100 000 shares was made in October 2014.
During the year, Share Buy-back (Pty) Ltd purchased 361 273 shares at an average cost of R31.52 per share, totalling R11.387 million taking the total number of treasury shares held by the group to 5 572 401 (2014: 5 311 128). In addition, 6 688 698 (2014: 6 688 698) shares are held by The Spur Management Share Trust and, as noted above, 100 000 (2014: nil) shares are held by the Spur Foundation Trust (refer note 21 of the consolidated financial statements). The Spur Management Share Trust and The Spur Foundation Trust are special purpose entities that are required to be consolidated by the group for financial reporting purposes only. Consequently, the net number of shares in issue at 30 June 2015 was 96 119 827 (2014: 85 633 007).

Spur Corporation Ltd Integrated Report 201582
INTEREST IN SUBSIDIARY COMPANIESDetails of the share capital and the company’s interests in the subsidiary companies are as follows:
Country of incorporation/
place of business
IssuedcapitalR’000
Loans to subsidiaries
R’000% interest in
company
Trading– Estalor (Pty) Ltd* trading as The Hussar Grill Advertising
Company South Africa 0.1 100.0– John Dory’s Advertising (Pty) Ltd* South Africa 0.1 100.0– John Dory’s Franchise (Pty) Ltd* South Africa 0.1 100.0– Marocap (Pty) Ltd* trading as RocoMamas Advertising South Africa 0.1 100.0– Nickilor (Pty) Ltd* trading as The Hussar Grill Rondebosch South Africa 0.1 100.0– Opilor (Pty) Ltd* trading as The Hussar Grill Green Point South Africa 0.1 100.0– Opiset (Pty) Ltd* trading as The Hussar Grill Camps Bay South Africa 0.1 100.0– Panarottis Advertising (Pty) Ltd* South Africa 0.1 100.0– RocoMamas Franchise Co (Pty) Ltd*# South Africa 0.1 51.0– Share Buy–back (Pty) Ltd South Africa 0.1 100.0– Spur Advertising (Pty) Ltd* South Africa 0.1 100.0– Spur Group (Pty) Ltd South Africa 0.1 277 893 100.0– Spur Group Properties (Pty) Ltd South Africa 0.1 3 265 100.0– The Ad Workshop (Pty) Ltd* trading as Captain DoRegos
Advertising South Africa 0.1 100.0– Spur International Ltd* British Virgin Islands 1.4 100.0– Steak Ranches International BV* The Netherlands 156 493.6 100.0– Spur Advertising Namibia (Pty) Ltd* Namibia 0.1 100.0– Spur Franchise Namibia (Pty) Ltd* Namibia 0.1 100.0– Caspur Pty Ltd* Australia 772.0 100.0– Panarottis Advertising Australia Pty Ltd* Australia 0.6 100.0– Panatug Pty Ltd* Australia 0.6 100.0– Panhold Pty Ltd* Australia 5.0 100.0– Spur Advertising Australia Pty Ltd* Australia 0.6 100.0– Spur Corporation Australia Pty Ltd* Australia 16 129.1 100.0– Spur Steak Ranches Unit Trust* Australia 0.1 100.0– Spurcentral Pty Ltd* Australia 0.6 100.0– Larkspur One Ltd* United Kingdom 1.4 100.0– Larkspur Two Ltd* United Kingdom 1.4 100.0– Larkspur Three Ltd* United Kingdom 1.3 80.0– Larkspur Six Ltd* United Kingdom 0.1 100.0– Larkspur Seven Ltd* United Kingdom 0.1 100.0– Larkspur Nine Ltd* United Kingdom 0.1 100.0– Larkspur Ten Ltd* United Kingdom 1.8 100.0– Mohawk Spur Ltd* United Kingdom 15.1 100.0– Spur Advertising UK Ltd* United Kingdom 1.3 100.0– Spur Corporation UK Ltd* United Kingdom 3.5 100.0– Trinity Leasing Ltd* United Kingdom 13.0 100.0– Larkspur Eight Ltd* Ireland 0.1 100.0Dormant 1.4 100.0
281 158* Indirect# Acquired on 1 March 2015
The group disposed of its interests in Australian subsidiaries Panpen Pty Ltd and Panawest Pty Ltd during the year. Vantini Spur Ltd (Gibraltar) and Larkspur Five Ltd (United Kingdom) were deregistered during the year.
The interest of the company in the aggregate after tax profits and losses of subsidiaries is as follows:
2015 R’000
2014R’000
Profits 144 554 149 545Losses (12 888) (11 142)
The group also consolidates The Spur Management Share Trust and the Spur Foundation Trust, both consolidated structured entities in which it does not hold shares, but which it controls as determined in accordance with IFRS.
CASH DIVIDENDA final cash dividend in respect of the 2014 financial year of 64.0 cents per share was paid to shareholders on 6 October 2014. An interim cash dividend in respect of the 2015 financial year of 62.0 cents per share was paid to shareholders on 30 March 2015.
The directors declared a final cash dividend in respect of the 2015 financial year of 70.0 cents per share, funded by income reserves, on 9 September 2015, to be paid on 5 October 2015 to those shareholders of the company who are recorded in the company’s register on 2 October 2015. As this dividend was declared after the reporting date, it will only be accounted for in the 2016 financial year.

Spur Corporation Ltd Integrated Report 2015 83
SPECIAL RESOLUTIONSAt a general shareholders meeting held on 3 October 2014, special resolutions were passed in terms of which, pursuant to the Broad-based Black Economic Empowerment deal concluded with Grand Parade Investments Ltd (“GPI”), the directors were authorised to: provide financial assistance to a wholly-owned subsidiary of GPI for the purposes of acquiring shares in the company; and reacquire up to a maximum of 10 848 093 shares from the same entity, subject to applicable statutory and regulatory requirements.
On 5 December 2014, at the company’s annual general meeting, a special resolution was passed in terms of which the directors were granted the authority to contract the company, or one of its wholly-owned subsidiaries, to acquire shares in the company issued by it, should the company comply with the relevant statutes and authorities applicable thereto. At the same meeting, special resolutions were passed in terms of which the directors were granted the authority to cause the company to provide financial assistance to any entity which is related or inter-related to the company, and to remunerate non-executive directors for their services in their capacity as directors.
Full details of the special resolutions passed will be made available to shareholders on request.
MATERIAL CHANGESSave as disclosed herein, no material changes in the financial or trading position of the company or its subsidiaries have taken place to the date of this report.
DIRECTORS AND SECRETARYDetails of the directors as at the date of this report, together with the name, business and postal address of the company secretary, are set out on pages 12, 13 and the inside back cover of this report.
On 9 September 2015, the board appointed Nazrana Hawa as company secretary. Ronel van Dijk served as company secretary until this date. Nazrana Hawa has certified that the company has lodged with the Companies and Intellectual Property Commission (“CIPC”) all such returns as required by a public company in terms of the Companies Act and that all such returns appear to be true, correct and up to date.
Pursuant to the Broad-based Black Economic Empowerment transaction with GPI referred to above, Alan Keet, as representative of GPI, was appointed to the board on 2 February 2015.
In terms of the company’s Memorandum of Incorporation, Mr Mntungwa Morojele and Ms Dineo Molefe, as well as Mr Alan Keet, retire at the forthcoming annual general meeting. These directors, all being eligible, offer themselves for re-election. Service agreements with the directors of Spur Corporation at the date hereof do not impose any abnormal notice periods on the company or the directors in question.
DIRECTORS’ INTERESTSNo contracts in which the directors or officers of the company or group had an interest and that significantly affected the affairs or business of the company or any of its subsidiaries, were entered into during the year.
SharesDetails of directors’ interests in the ordinary shares are as follows:
2015 2014Direct
beneficialIndirect
beneficialHeld by
associatesDirect
beneficialIndirect
beneficialHeld by
associates
Allen Ambor 3 086 685 464 609 – 3 086 685 464 609 –Ronel van Dijk 73 244 – – 73 244 – –Keith Madders 779 372 332 650 – – 1 112 022 –Keith Getz 2 491 – 820 2 491 – 820Total 3 941 792 797 259 820 3 162 420 1 576 631 820% interest* 3.8 0.8 0.0 3.4 1.7 0.0
* These percentages are based on shares in issue less shares repurchased by a subsidiary company, Share Buy-back (Pty) Ltd.
The transfer of Keith Madders’ shares resulting in the change from indirect beneficial to direct beneficial was executed on 17 December 2014.
There have been no changes in directors’ interests in share capital from 30 June 2015 to the date of issue of this annual report.
SHAREHOLDERS’ INTEREST IN SHARESMajor shareholdersThe following are shareholders (excluding directors) holding 3% or more of the company’s issued share capital at 30 June 2015:
No. of shares %*
Allan Gray 12 732 611 12.4Grand Parade Investments 10 848 093 10.5Investec 10 033 051 9.7Coronation Fund Managers 9 197 694 8.9Fidelity 8 915 491 8.7Spur Management Share Trust** 6 688 698 6.5State Street Bank & Trust Co 3 894 317 3.8
* These percentages are based on shares in issue less shares repurchased by a subsidiary company, Share Buy-back (Pty) Ltd.** This holding relates to shares utilised in the group’s short-term profit share incentive scheme, details of which are disclosed in note 25 to the
consolidated financial statements on page 125 of this report.
DIRECTORS’ REPORT
Spur Corporation Ltd Integrated Report 201584
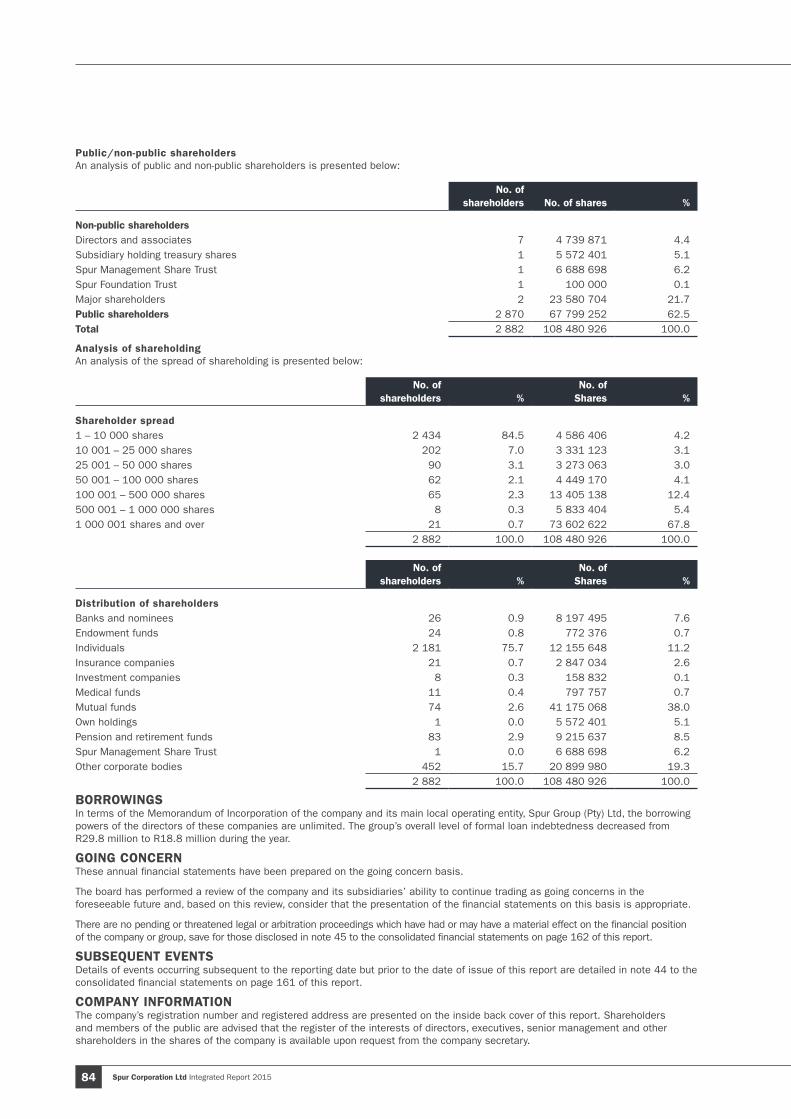
Public/non-public shareholders An analysis of public and non-public shareholders is presented below:
No. of shareholders No. of shares %
Non-public shareholdersDirectors and associates 7 4 739 871 4.4Subsidiary holding treasury shares 1 5 572 401 5.1Spur Management Share Trust 1 6 688 698 6.2Spur Foundation Trust 1 100 000 0.1Major shareholders 2 23 580 704 21.7Public shareholders 2 870 67 799 252 62.5Total 2 882 108 480 926 100.0
Analysis of shareholdingAn analysis of the spread of shareholding is presented below:
No. of shareholders %
No. of Shares %
Shareholder spread1 – 10 000 shares 2 434 84.5 4 586 406 4.210 001 – 25 000 shares 202 7.0 3 331 123 3.125 001 – 50 000 shares 90 3.1 3 273 063 3.050 001 – 100 000 shares 62 2.1 4 449 170 4.1100 001 – 500 000 shares 65 2.3 13 405 138 12.4500 001 – 1 000 000 shares 8 0.3 5 833 404 5.41 000 001 shares and over 21 0.7 73 602 622 67.8
2 882 100.0 108 480 926 100.0
No. of shareholders %
No. of Shares %
Distribution of shareholdersBanks and nominees 26 0.9 8 197 495 7.6Endowment funds 24 0.8 772 376 0.7Individuals 2 181 75.7 12 155 648 11.2Insurance companies 21 0.7 2 847 034 2.6Investment companies 8 0.3 158 832 0.1Medical funds 11 0.4 797 757 0.7Mutual funds 74 2.6 41 175 068 38.0Own holdings 1 0.0 5 572 401 5.1Pension and retirement funds 83 2.9 9 215 637 8.5Spur Management Share Trust 1 0.0 6 688 698 6.2Other corporate bodies 452 15.7 20 899 980 19.3
2 882 100.0 108 480 926 100.0
BORROWINGSIn terms of the Memorandum of Incorporation of the company and its main local operating entity, Spur Group (Pty) Ltd, the borrowing powers of the directors of these companies are unlimited. The group’s overall level of formal loan indebtedness decreased from R29.8 million to R18.8 million during the year.
GOING CONCERNThese annual financial statements have been prepared on the going concern basis.
The board has performed a review of the company and its subsidiaries’ ability to continue trading as going concerns in the foreseeable future and, based on this review, consider that the presentation of the financial statements on this basis is appropriate.
There are no pending or threatened legal or arbitration proceedings which have had or may have a material effect on the financial position of the company or group, save for those disclosed in note 45 to the consolidated financial statements on page 162 of this report.
SUBSEQUENT EVENTSDetails of events occurring subsequent to the reporting date but prior to the date of issue of this report are detailed in note 44 to the consolidated financial statements on page 161 of this report.
COMPANY INFORMATIONThe company’s registration number and registered address are presented on the inside back cover of this report. Shareholders and members of the public are advised that the register of the interests of directors, executives, senior management and other shareholders in the shares of the company is available upon request from the company secretary.

Spur Corporation Ltd Integrated Report 2015 85
INDEPENDENT AUDITOR’S REPORTWe have audited the consolidated and separate financial statements of Spur Corporation Ltd, which comprise the consolidated and separate statements of financial position at 30 June 2015, and the consolidated and separate statements of comprehensive income, changes in equity and cash flows for the year then ended, and the notes to the consolidated and separate financial statements which include a summary of significant accounting policies and other explanatory notes, as set out on pages 86 to 184.
DIRECTORS’ RESPONSIBILITY FOR THE FINANCIAL STATEMENTSThe company’s directors are responsible for the preparation and fair presentation of these financial statements in accordance with International Financial Reporting Standards and the requirements of the Companies Act of South Africa, and for such internal control as the directors determine is necessary to enable the preparation of financial statements that are free from material misstatement, whether due to fraud or error.
AUDITOR’S RESPONSIBILITYOur responsibility is to express an opinion on these financial statements based on our audit. We conducted our audit in accordance with International Standards on Auditing. Those standards require that we comply with ethical requirements and plan and perform the audit to obtain reasonable assurance about whether the financial statements are free from material misstatement.
An audit involves performing procedures to obtain audit evidence about the amounts and disclosures in the financial statements. The procedures selected depend on the auditor’s judgement, including the assessment of the risks of material misstatement of the financial statements, whether due to fraud or error. In making those risk assessments, the auditor considers internal control relevant to the entity’s preparation and fair presentation of the financial statements in order to design audit procedures that are appropriate in the circumstances, but not for the purpose of expressing an opinion on the effectiveness of the entity’s internal control. An audit also includes evaluating the appropriateness of accounting policies used and the reasonableness of accounting estimates made by management, as well as evaluating the overall presentation of the financial statements.
We believe that the audit evidence we have obtained is sufficient and appropriate to provide a basis for our audit opinion.
OPINION In our opinion, these financial statements present fairly, in all material respects, the consolidated and separate financial position of Spur Corporation Ltd at 30 June 2015, and its consolidated and separate financial performance and consolidated and separate cash flows for the year then ended in accordance with International Financial Reporting Standards and the requirements of the Companies Act of South Africa.
OTHER REPORTS REQUIRED BY THE COMPANIES ACTAs part of our audit of the financial statements for the year ended 30 June 2015, we have read the Directors’ Report, the Audit Committee Report and the Declaration by Company Secretary for the purpose of identifying whether there are material inconsistencies between these reports and the audited financial statements. These reports are the responsibility of the respective preparers. Based on reading these reports we have not identified material inconsistencies between these reports and the audited financial statements. However, we have not audited these reports and accordingly do not express an opinion on these reports.
KPMG Inc. Registered Auditor
Per BR HeuvelChartered Accountant (SA), Registered Auditor, Director 8th Floor, MSC House, 1 Mediterranean Street Cape Town, 8001
Cape Town, 5 October 2015
INDEPENDENT AUDITOR’S REPORT
Spur Corporation Ltd Integrated Report 201586
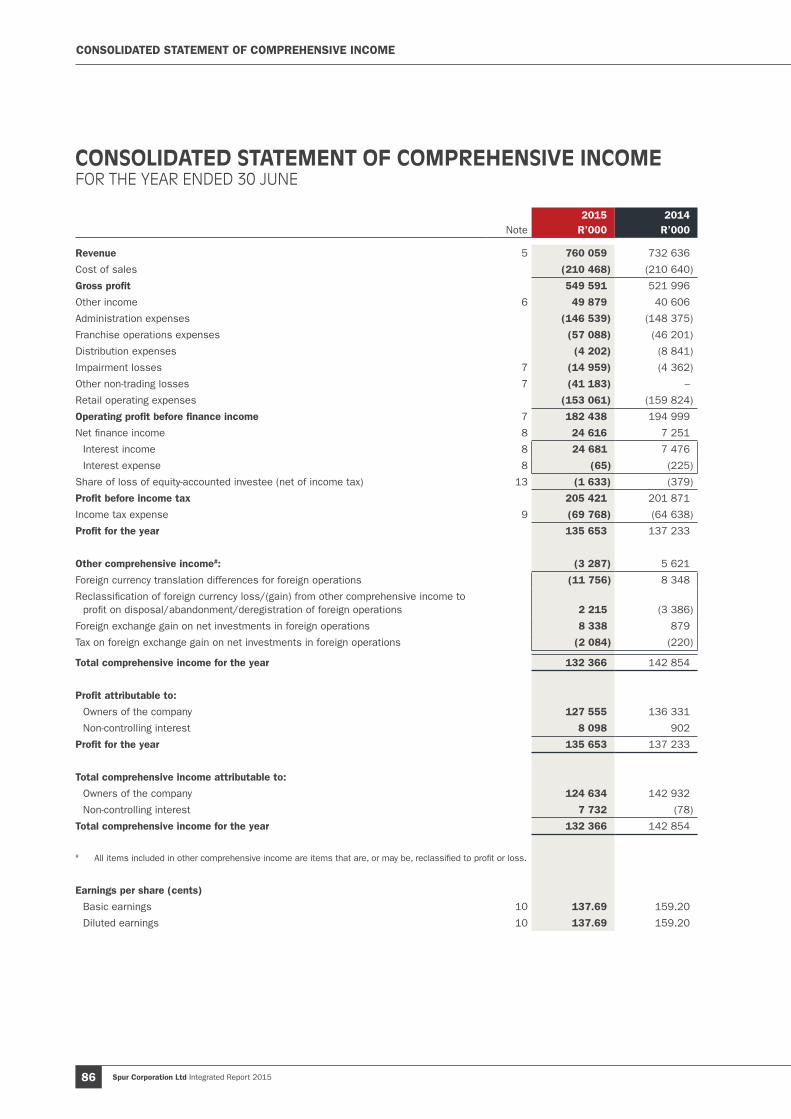
CONSOLIDATED STATEMENT OF COMPREHENSIVE INCOME
2015 2014Note R’000 R’000
Revenue 5 760 059 732 636
Cost of sales (210 468) (210 640)
Gross profit 549 591 521 996
Other income 6 49 879 40 606
Administration expenses (146 539) (148 375)
Franchise operations expenses (57 088) (46 201)
Distribution expenses (4 202) (8 841)
Impairment losses 7 (14 959) (4 362)
Other non-trading losses 7 (41 183) –
Retail operating expenses (153 061) (159 824)
Operating profit before finance income 7 182 438 194 999
Net finance income 8 24 616 7 251
Interest income 8 24 681 7 476
Interest expense 8 (65) (225)
Share of loss of equity-accounted investee (net of income tax) 13 (1 633) (379)
Profit before income tax 205 421 201 871
Income tax expense 9 (69 768) (64 638)
Profit for the year 135 653 137 233
Other comprehensive income#: (3 287) 5 621
Foreign currency translation differences for foreign operations (11 756) 8 348
Reclassification of foreign currency loss/(gain) from other comprehensive income to profit on disposal/abandonment/deregistration of foreign operations 2 215 (3 386)
Foreign exchange gain on net investments in foreign operations 8 338 879
Tax on foreign exchange gain on net investments in foreign operations (2 084) (220)
Total comprehensive income for the year 132 366 142 854
Profit attributable to:
Owners of the company 127 555 136 331
Non-controlling interest 8 098 902
Profit for the year 135 653 137 233
Total comprehensive income attributable to:
Owners of the company 124 634 142 932
Non-controlling interest 7 732 (78)
Total comprehensive income for the year 132 366 142 854
# All items included in other comprehensive income are items that are, or may be, reclassified to profit or loss.
Earnings per share (cents)
Basic earnings 10 137.69 159.20
Diluted earnings 10 137.69 159.20
CONSOLIDATED STATEMENT OF COMPREHENSIVE INCOMEFOR THE YEAR ENDED 30 JUNE

Spur Corporation Ltd Integrated Report 2015 87
CONSOLIDATED STATEMENT OF FINANCIAL POSITION
2015 2014Note R’000 R’000
ASSETSNon-current assets 632 409 512 900Property, plant and equipment 11 86 481 77 289Intangible assets and goodwill 12 384 610 359 742Interest in equity-accounted investee 13 – 21Loans receivable 14 142 996 53 450Deferred tax 15 4 446 6 536Leasing rights 16 2 855 3 352Derivative financial assets 17 11 021 12 510
Current assets 473 875 225 071Inventories 18 11 729 12 132Tax receivable 17 164 10 719Trade and other receivables 19 97 828 82 650Loans receivable 14 25 143 5 447Derivative financial asset 17 17 160 22 157Cash and cash equivalents 20 304 851 91 966
TOTAL ASSETS 1 106 284 737 971
EQUITYTotal equity 854 095 519 620Ordinary share capital 21 1 1Share premium 21 294 663 6Shares repurchased by subsidiaries 21 (88 622) (77 235)Foreign currency translation reserve 21 22 314 25 235Retained earnings 618 675 575 670Total equity attributable to equity holders of the parent 847 031 523 677Non-controlling interests 22 7 064 (4 057)
LIABILITIESNon-current liabilities 108 440 82 526Contingent consideration liability 34.1 31 409 – Employee benefits 23 8 826 10 909Derivative financial liability 17 – 319Operating lease liability 24 1 200 1 776Deferred tax 15 67 005 69 522
Current liabilities 143 749 135 825Bank overdrafts 20 3 557 539Tax payable 1 893 4 559Trade and other payables 25 83 235 78 453Loans payable 26 18 818 29 846Contingent consideration liability 34.1 15 974 – Employee benefits 23 19 790 22 017Shareholders for dividend 482 411
TOTAL EQUITY AND LIABILITIES 1 106 284 737 971
CONSOLIDATED STATEMENT OF FINANCIAL POSITIONAT 30 JUNE

Spur Corporation Ltd Integrated Report 201588
Attributable to owners of the company Number
of shares (net of
treasury shares)
Ordinary share
capitalShare
premium
Shares repurchased
by subsidiaries
Foreign currency
translation reserve
Retained earnings Total
Non-controlling
interestsTotal
equityNote 000 R’000 R’000 R’000 R’000 R’000 R’000 R’000 R’000
Balance at 1 July 2013 85 633 1 6 (77 235) 18 634 536 060 477 466 (4 940) 472 526
Total comprehensive income for the yearProfit for the year – – – – – 136 331 136 331 902 137 233 Other comprehensive income – – – – 6 601 – 6 601 (980) 5 621 Foreign currency translation differences for foreign operations – – – – 8 348 – 8 348 – 8 348 Reclassification of foreign currency gain from other comprehensive income to profit or
loss on abandonment of foreign operations36.1 – – – – (3 386) – (3 386) – (3 386)
Foreign exchange gain on net investments in foreign subsidiaries – – – – 879 – 879 – 879 Tax on foreign exchange gain on net investments in foreign subsidiaries – – – – (220) – (220) – (220)Foreign exchange effect on non-controlling interests – – – – 980 – 980 (980) –
Total comprehensive income for the year – – – – 6 601 136 331 142 932 (78) 142 854
Transactions with owners recorded directly in equityContributions by and distributions to owners – – – – – (96 766) (96 766) – (96 766)Distributions to equity holders 27 – – – – – (96 766) (96 766) – (96 766)
Changes in ownership interests in subsidiaries – – – – – 45 45 961 1 006 Acquisition of non-controlling interest in subsidiary without a change in control – – – – – 45 45 (45) – Derecognition of non-controlling interest in subsidiary resulting in loss of control 35.4 – – – – – – – 1 006 1 006
Total transactions with owners – – – – – (96 721) (96 721) 961 (95 760)
Balance at 30 June 2014 85 633 1 6 (77 235) 25 235 575 670 523 677 (4 057) 519 620
Total comprehensive income for the yearProfit for the year – – – – – 127 555 127 555 8 098 135 653Other comprehensive income – – – – (2 921) – (2 921) (366) (3 287)Foreign currency translation differences for foreign operations – – – – (11 756) – (11 756) – (11 756)Reclassification of foreign currency loss from other comprehensive income
to profit or loss on disposal/abandonment/deregistration of foreign operations 35 & 36 – – – – 2 215 – 2 215 – 2 215 Foreign exchange gain on net investments in foreign subsidiaries – – – – 8 338 – 8 338 – 8 338 Tax on foreign exchange gain on net investments in foreign subsidiaries – – – – (2 084) – (2 084) – (2 084)Foreign exchange effect on non-controlling interests – – – – 366 – 366 (366) –
Total comprehensive income for the year – – – – (2 921) 127 555 124 634 7 732 132 366
Transactions with owners recorded directly in equityContributions by and distributions to owners 10 487 – 294 657 (11 387) – (82 450) 200 820 – 200 820 Issue of ordinary shares 21.2 10 848 – 294 657 – – (991) 293 666 – 293 666 Equity-settled share-based payment 21.2 – – – – – 32 957 32 957 – 32 957 Purchase of treasury shares 21.3 (361) – – (11 387) – – (11 387) – (11 387)Distributions to equity holders 27 – – – – – (114 416) (114 416) – (114 416)
Changes in ownership interests in subsidiaries – – – – – (2 100) (2 100) 3 389 1 289 Acquisition of subsidiary with non-controlling interest 34.1 – – – – – – – 3 135 3 135 Acquisition of non-controlling interest in subsidiary without a change in control 34.2 – – – – – (2 100) (2 100) 108 (1 992)Derecognition of non-controlling interest in subsidiary resulting in loss of control 35.1 – – – – – – – 146 146
Total transactions with owners 10 487 – 294 657 (11 387) – (84 550) 198 720 3 389 202 109
Balance at 30 June 2015 96 120 1 294 663 (88 622) 22 314 618 675 847 031 7 064 854 095
CONSOLIDATED STATEMENT OF CHANGES IN EQUITY FOR THE YEAR ENDED 30 JUNE
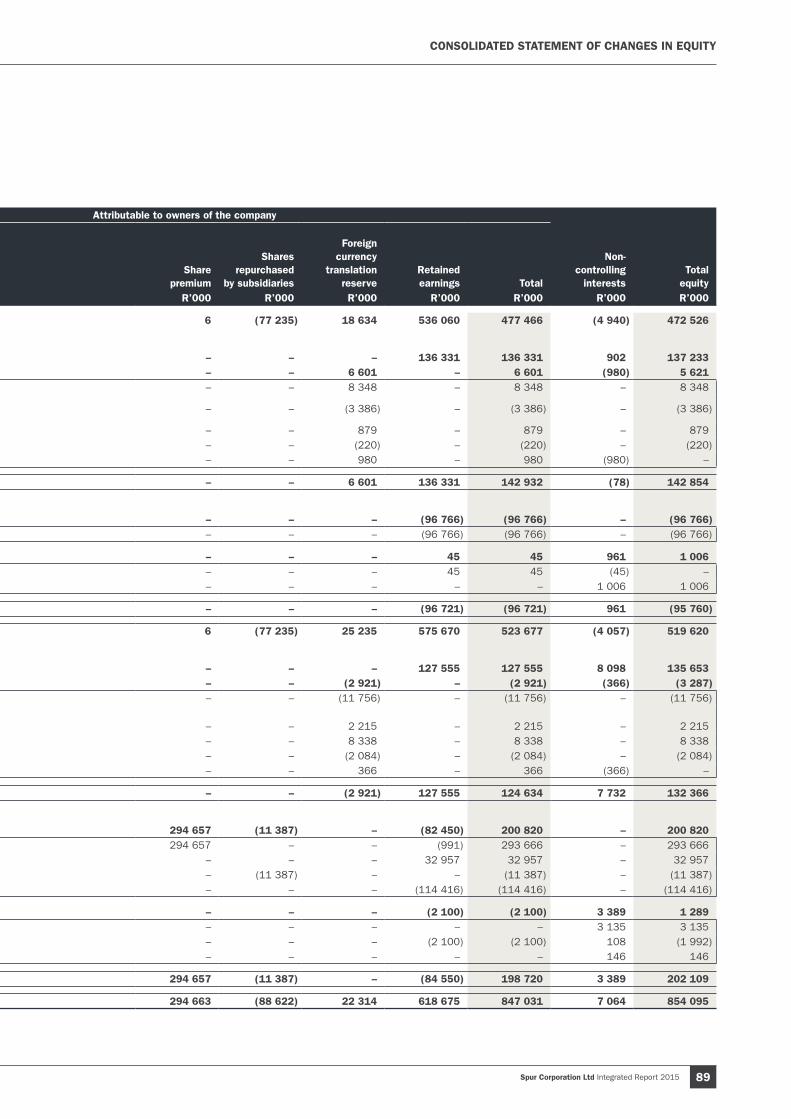
Spur Corporation Ltd Integrated Report 2015 89
CONSOLIDATED STATEMENT OF CHANGES IN EQUITY
Attributable to owners of the company Number
of shares (net of
treasury shares)
Ordinary share
capitalShare
premium
Shares repurchased
by subsidiaries
Foreign currency
translation reserve
Retained earnings Total
Non-controlling
interestsTotal
equityNote 000 R’000 R’000 R’000 R’000 R’000 R’000 R’000 R’000
Balance at 1 July 2013 85 633 1 6 (77 235) 18 634 536 060 477 466 (4 940) 472 526
Total comprehensive income for the yearProfit for the year – – – – – 136 331 136 331 902 137 233 Other comprehensive income – – – – 6 601 – 6 601 (980) 5 621 Foreign currency translation differences for foreign operations – – – – 8 348 – 8 348 – 8 348 Reclassification of foreign currency gain from other comprehensive income to profit or
loss on abandonment of foreign operations36.1 – – – – (3 386) – (3 386) – (3 386)
Foreign exchange gain on net investments in foreign subsidiaries – – – – 879 – 879 – 879 Tax on foreign exchange gain on net investments in foreign subsidiaries – – – – (220) – (220) – (220)Foreign exchange effect on non-controlling interests – – – – 980 – 980 (980) –
Total comprehensive income for the year – – – – 6 601 136 331 142 932 (78) 142 854
Transactions with owners recorded directly in equityContributions by and distributions to owners – – – – – (96 766) (96 766) – (96 766)Distributions to equity holders 27 – – – – – (96 766) (96 766) – (96 766)
Changes in ownership interests in subsidiaries – – – – – 45 45 961 1 006 Acquisition of non-controlling interest in subsidiary without a change in control – – – – – 45 45 (45) – Derecognition of non-controlling interest in subsidiary resulting in loss of control 35.4 – – – – – – – 1 006 1 006
Total transactions with owners – – – – – (96 721) (96 721) 961 (95 760)
Balance at 30 June 2014 85 633 1 6 (77 235) 25 235 575 670 523 677 (4 057) 519 620
Total comprehensive income for the yearProfit for the year – – – – – 127 555 127 555 8 098 135 653Other comprehensive income – – – – (2 921) – (2 921) (366) (3 287)Foreign currency translation differences for foreign operations – – – – (11 756) – (11 756) – (11 756)Reclassification of foreign currency loss from other comprehensive income
to profit or loss on disposal/abandonment/deregistration of foreign operations 35 & 36 – – – – 2 215 – 2 215 – 2 215 Foreign exchange gain on net investments in foreign subsidiaries – – – – 8 338 – 8 338 – 8 338 Tax on foreign exchange gain on net investments in foreign subsidiaries – – – – (2 084) – (2 084) – (2 084)Foreign exchange effect on non-controlling interests – – – – 366 – 366 (366) –
Total comprehensive income for the year – – – – (2 921) 127 555 124 634 7 732 132 366
Transactions with owners recorded directly in equityContributions by and distributions to owners 10 487 – 294 657 (11 387) – (82 450) 200 820 – 200 820 Issue of ordinary shares 21.2 10 848 – 294 657 – – (991) 293 666 – 293 666 Equity-settled share-based payment 21.2 – – – – – 32 957 32 957 – 32 957 Purchase of treasury shares 21.3 (361) – – (11 387) – – (11 387) – (11 387)Distributions to equity holders 27 – – – – – (114 416) (114 416) – (114 416)
Changes in ownership interests in subsidiaries – – – – – (2 100) (2 100) 3 389 1 289 Acquisition of subsidiary with non-controlling interest 34.1 – – – – – – – 3 135 3 135 Acquisition of non-controlling interest in subsidiary without a change in control 34.2 – – – – – (2 100) (2 100) 108 (1 992)Derecognition of non-controlling interest in subsidiary resulting in loss of control 35.1 – – – – – – – 146 146
Total transactions with owners 10 487 – 294 657 (11 387) – (84 550) 198 720 3 389 202 109
Balance at 30 June 2015 96 120 1 294 663 (88 622) 22 314 618 675 847 031 7 064 854 095
Spur Corporation Ltd Integrated Report 201590
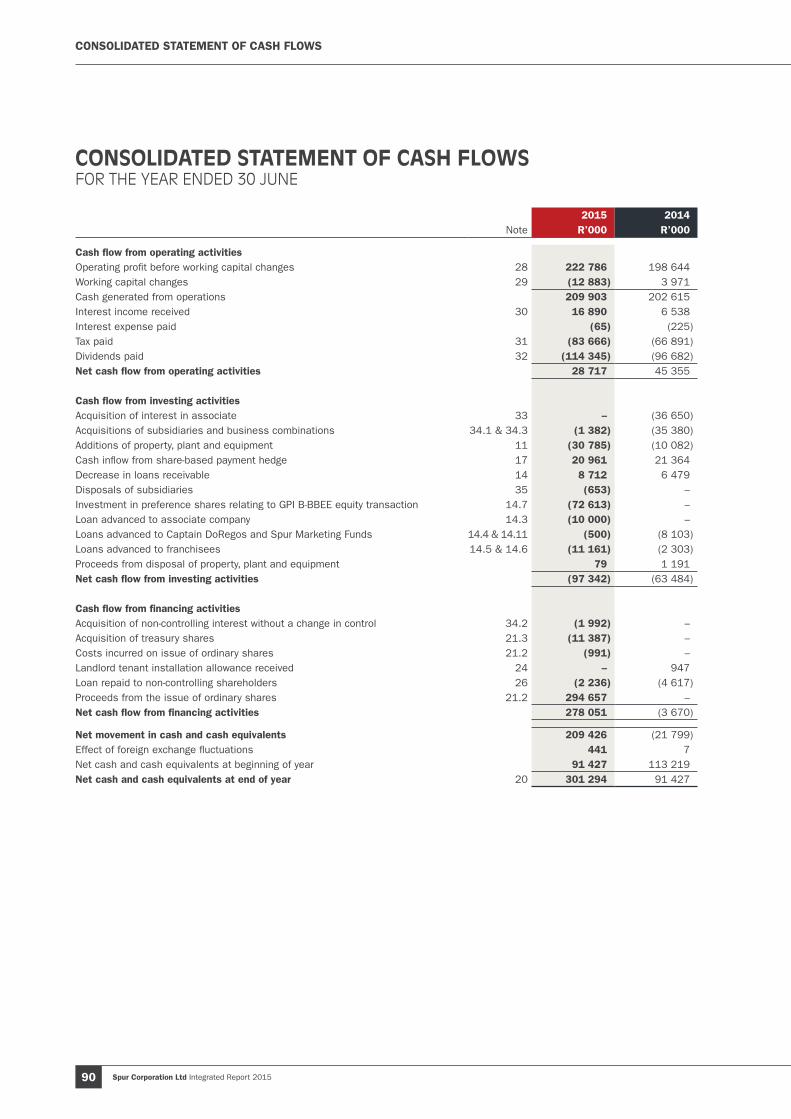
CONSOLIDATED STATEMENT OF CASH FLOWS
2015 2014Note R’000 R’000
Cash flow from operating activitiesOperating profit before working capital changes 28 222 786 198 644 Working capital changes 29 (12 883) 3 971 Cash generated from operations 209 903 202 615 Interest income received 30 16 890 6 538 Interest expense paid (65) (225)Tax paid 31 (83 666) (66 891)Dividends paid 32 (114 345) (96 682)Net cash flow from operating activities 28 717 45 355
Cash flow from investing activitiesAcquisition of interest in associate 33 – (36 650)Acquisitions of subsidiaries and business combinations 34.1 & 34.3 (1 382) (35 380)Additions of property, plant and equipment 11 (30 785) (10 082)Cash inflow from share-based payment hedge 17 20 961 21 364 Decrease in loans receivable 14 8 712 6 479 Disposals of subsidiaries 35 (653) – Investment in preference shares relating to GPI B-BBEE equity transaction 14.7 (72 613) – Loan advanced to associate company 14.3 (10 000) – Loans advanced to Captain DoRegos and Spur Marketing Funds 14.4 & 14.11 (500) (8 103)Loans advanced to franchisees 14.5 & 14.6 (11 161) (2 303)Proceeds from disposal of property, plant and equipment 79 1 191 Net cash flow from investing activities (97 342) (63 484)
Cash flow from financing activities Acquisition of non-controlling interest without a change in control 34.2 (1 992) – Acquisition of treasury shares 21.3 (11 387) – Costs incurred on issue of ordinary shares 21.2 (991) – Landlord tenant installation allowance received 24 – 947 Loan repaid to non-controlling shareholders 26 (2 236) (4 617)Proceeds from the issue of ordinary shares 21.2 294 657 – Net cash flow from financing activities 278 051 (3 670)
Net movement in cash and cash equivalents 209 426 (21 799)Effect of foreign exchange fluctuations 441 7 Net cash and cash equivalents at beginning of year 91 427 113 219 Net cash and cash equivalents at end of year 20 301 294 91 427
CONSOLIDATED STATEMENT OF CASH FLOWSFOR THE YEAR ENDED 30 JUNE

Spur Corporation Ltd Integrated Report 2015 91
NOTES TO THE CONSOLIDATED FINANCIAL STATEMENTS
NOTES TO THE CONSOLIDATED FINANCIAL STATEMENTS
1. ABOUT THESE FINANCIAL STATEMENTS
1.1 REPORTING ENTITYSpur Corporation Limited (“the company”) is a company domiciled in South Africa. The consolidated financial statements of the company as at and for the year ended 30 June 2015 comprise the company, its subsidiaries, consolidated structured entities and the group’s interests in equity-accounted investees, together referred to as “the group”.
Where reference is made to “the group” in the accounting policies, it should be interpreted as referring to the company where the context requires, unless otherwise stated.
1.2 BASIS OF ACCOUNTINGThe separate and consolidated financial statements have been prepared in accordance with International Financial Reporting Standards (“IFRS”), the SAICA Financial Reporting Guides as issued by the Accounting Practices Committee, Financial Reporting Pronouncements as issued by the Financial Reporting Standards Council, the JSE Listings Requirements and the Companies Act of South Africa (Act no. 71 of 2008, as amended).
Details of the group’s accounting policies are set out in note 46 and have been applied consistently, in all material respects, to all years presented in these consolidated and separate financial statements.
The financial statements were prepared under the supervision of the group chief financial officer, Ronel van Dijk CA(SA), and authorised for issue by the directors on 5 October 2015. The financial statements were published on 12 October 2015.
The financial statements are presented in South African rands, which is the company’s functional currency, rounded to the nearest thousand, unless otherwise stated. They are prepared on the going concern basis.
The financial statements have been prepared on the historical cost basis except for the following material items in the statement of financial position:
– Derivative financial instruments are measured at fair value (refer note 17); – Contingent consideration liability is measured at fair value (refer note 34.1); and – Liabilities for cash-settled share-based payment arrangements are measured at fair value (refer note 23).
2. ACCOUNTING ESTIMATES AND JUDGEMENTS
The preparation of the consolidated and separate financial statements in conformity with IFRS requires management to make judgements, estimates and assumptions that affect the application of accounting policies and reported amounts of assets, liabilities, income and expenses. The estimates and associated assumptions are based on historical experience and various other factors that are believed to be reasonable under the circumstances, the results of which form the basis of making the judgements about carrying values of assets and liabilities. Actual results may differ from these estimates.
Estimates and underlying assumptions are reviewed on an ongoing basis. Revisions to estimates are recognised prospectively.
Judgements, assumptions and estimates made in applying the group’s accounting policies that potentially have a significant effect on the amounts recognised in the financial statements are as follows:
2.1 JUDGEMENTSAccounting for marketing funds (note 39)The group administers a number of marketing funds which have been established by the group to meet the group’s obligations in terms of the franchise agreements concluded between various subsidiaries of the group and external franchisees. In terms of these franchise agreements, the franchisor (the group) is mandated to spend the marketing fund receipts on behalf of the respective bodies of franchisees on marketing related costs for the benefit of those bodies of franchisees. The franchise agreements permit the franchisor to retain so much of the fund receipts necessary to defray the costs of administering the respective marketing funds. Each marketing fund is housed in a separate legal entity that is ring-fenced from the franchisor and other marketing funds. IAS18 – Revenue requires that revenue be recognised in the instance where an entity is acting as principal; and that revenue should not be recognised in the instance where an entity is acting as agent and collects amounts on behalf of the principal. In terms of IAS18, an entity is acting as agent when it does not have exposure to the significant risks and rewards associated with the sale of goods or the rendering of services. The board has exercised judgement in concluding that the group is not exposed to the significant risks and rewards associated with the marketing fund receipts and therefore acts as agent, save to the extent that marketing fund receipts are retained to defray the costs of administering the marketing funds in which case the group acts as principal. Consequently, to the extent that marketing fund receipts are retained to defray the costs of administering the marketing funds, these are recognised as income (refer note 6), and the balance of the marketing fund receipts are not recognised as income (refer notes 14.9 and 26).
Spur Corporation Ltd Integrated Report 201592
2. ACCOUNTING ESTIMATES AND JUDGEMENTS continued
2.1 JUDGEMENTS continuedControl of subsidiaries (note 3)The group has considered whether it controls certain entities, despite not owning a majority of shareholder rights. The board has determined that the group controls the entities below.
The Spur Foundation Trust is a benevolent foundation established by the group on Mandela Day 2012 with an initial donation of R670 000. The purpose of the trust is to consolidate and implement the group’s corporate social investment projects which have reputational benefits for the group. The reputational benefits are considered to be a key return to the group from its involvement with the trust. The trust deed defines who the beneficiaries of the trust are and these beneficiaries exclude any group entity. While there is no direct economic benefit to the group from the trust, in light of the fact that the trustees of the trust are appointed by the group and are currently all employees of the group, the group is able to control the key activities of the trust which affect the intangible returns for the group arising from the trust’s activities.
The Spur Management Share Trust was established in 2004. It initially served as a finance vehicle for the purchase of shares for the group’s 2004-2009 management incentive scheme. Upon winding up of that scheme, the trust acquired shares in the company which continue to be used in the group’s short-term profit share incentive scheme. The trustees of the trust serve at the behest of the company. The company is the only capital beneficiary of the trust. The main objective of the trust is to maintain a motivated and content work force through monetary incentives in order to improve future profitability of the group. On this basis, the group has concluded that it is able to exercise control over the relevant activities of the trust in order to influence the intangible returns for the group arising from the trust’s activities.
Intangible assets (note 12)The directors re-assess at each reporting date the appropriateness of the indefinite useful life assumption with regard to certain of the group’s intangible assets, with particular reference to trademarks and related intellectual property. In this regard, the board considers its strategy relating to the intangible assets in question and the company’s ability to execute that strategy, whether there is any technical, technological, commercial or other type of obsolescence applicable to the assets, expected usage and lifecycle of the assets, future costs required to continue to obtain benefits from the assets and the period over which the group is legally able to control the assets.
2.2 ASSUMPTIONS AND ESTIMATESContingent consideration liability (note 34.1)In assessing the possible aggregate purchase consideration due in terms of the contingent consideration arrangement for the acquisition of RocoMamas Franchise Co (Pty) Ltd, the directors needed to estimate the subsidiary’s profit to February 2018. The directors needed to extrapolate a store development plan and quantify the associated costs and revenues. A number of scenarios were considered and a probability applied to each scenario to determine the most likely outcome. These assumptions will need to be reassessed at each reporting date until the liability is settled. The other variables in determining the carrying value of the liability at the reporting date as well as the sensitivities thereto are detailed in note 37.2.
Deferred tax (note 15)Within the group, each entity assesses the recoverability of deferred tax assets and the recognition of deferred tax assets in respect of computed tax losses. The recognition is based on the entities’ abilities to utilise these computed tax losses based on expected future taxable income. In note 9.3, the total unrecognised computed tax losses are disclosed. The rationale for recognising deferred tax assets in respect of tax losses is disclosed in note 15.
Derivative financial instruments (note 17)Certain assumptions are applied by an independent external valuations expert in determining the value of the derivative financial instruments used to hedge economically the group’s exposure to share appreciation rights granted in terms of the group’s long-term share-linked employee retention scheme. These assumptions and the key inputs into the pricing model are disclosed in note 17.
Employee benefits (note 23)Certain assumptions are applied by an independent external valuations expert in determining the liability in respect of the group’s long-term share-linked employee retention scheme. The key inputs into the pricing model are disclosed in note 23.
Spur Corporation Ltd Integrated Report 2015 93
Fair valuesA number of the group’s accounting policies and disclosures require the measurement of fair values for both financial and non-financial assets and liabilities.
Fair value measurements and adjustments are made under the supervision of the group’s chief financial officer. To the extent practicable, fair values are derived by external experts and, as far as possible, utilising market observable data. Any significant valuation issues are reported to the group’s audit committee.
Fair values are categorised into different levels in a fair value hierarchy based on inputs used in the valuation techniques as follows:
– Level 1 – quoted prices (unadjusted) in active markets for identical assets or liabilities. – Level 2 – inputs other than quoted prices included in Level 1 that are observable for the asset or liability, either directly
(i.e. as prices) or indirectly (i.e. derived from prices). – Level 3 – inputs for the asset or liability that are not based on observable market data (unobservable inputs).
If the inputs used to measure the fair value of an asset or a liability are categorised in different levels of the fair value hierarchy, then the fair value measurement is categorised in its entirety in the same level of the fair value hierarchy as the lowest level input that is significant to the entire measurement.
Further information about the assumptions made in measuring fair values is included in the following notes:
– Business combinations (refer note 34) – Financial instruments including contingent consideration liability (refer note 37) – Employee benefits (refer note 23)
Financial assetsCertain assumptions are made in respect of the recoverability of the group’s financial assets. These assets mainly comprise loans receivable from associate companies and external parties and trade receivables.
At each reporting date, the group evaluates whether there is any objective evidence that a financial asset is impaired. If there is objective evidence that loans or receivables are impaired, the amount of the loss is determined without reference to future irrecoverable debts that have not been incurred. Refer note 19 for the amount of any impairment allowance recognised or reversed against trade receivables.
Intangible assets (note 12)In respect of intangible assets with finite useful lives, the remaining useful lives and residual values of these assets are reviewed and considered at each reporting date, taking into account the nature of the assets as indicated in note 12.
Impairment of non-financial assets (notes 11 and 12)Goodwill and intangible assets with indefinite useful lives are tested for impairment at least annually. Intangible assets which do not have indefinite useful lives and property, plant and equipment are considered for impairment when an indication of possible impairment exists. An asset is impaired when its carrying value exceeds its recoverable amount. The recoverable amount is the higher of an asset’s fair value less costs of disposal, and its value-in-use.
Determining if non-financial assets are impaired requires an estimation of the values-in-use of the cash-generating units to which goodwill, intangible assets and property, plant and equipment have been allocated. The value-in-use calculation requires the directors to estimate the future cash flows expected to arise from the cash-generating unit and a suitable pre-tax discount rate that is reflective of the cash-generating unit’s risk profile in order to calculate the present value. The variables applied in determining the above have been disclosed in the relevant notes to the financial statements with specific reference to notes 11 and 12.
Property, plant and equipment (note 11)Items of property, plant and equipment are depreciated over the assets’ remaining useful lives, taking into consideration their estimated residual values. The remaining useful lives and residual values of these assets are reviewed and considered at each reporting date, taking into account the nature and condition of the assets.
NOTES TO THE CONSOLIDATED FINANCIAL STATEMENTS

Spur Corporation Ltd Integrated Report 201594
3. GROUP ENTITIES
3.1 GROUP STRUCTUREThe group’s structure, including applicable ownership interests, is detailed on page 10 of this report and note 3 to the separate financial statements on page 178.
In addition to those entities in which the group holds a majority shareholder interest, the group has concluded that it controls The Spur Management Share Trust and The Spur Foundation Trust (refer note 2.1). These entities are consequently consolidated.
Changes to the group structure are detailed in notes 33, 34, 35 and 36.
Details of material non-controlling interests are included in note 22.
There are no significant restrictions on the ability of the group to realise assets or settle liabilities of any of its subsidiaries.
3.2 CONSOLIDATED STRUCTURED ENTITIESWith regards consolidated structured entities, The Spur Management Share Trust and The Spur Foundation Trust:
– There are no contractual obligations on the company or any of its subsidiaries to provide financial support; – Wholly-owned subsidiaries donated R0.280 million (2014: R0.252 million) and 100 000 (2014: nil) treasury shares
to the Spur Foundation Trust during the year to assist in funding the trust’s benevolent activities. Although not obliged to, the same subsidiaries intend continuing to provide assistance to the trust by donating similar amounts of cash and shares on an annual basis (where the latter is a shareholder approved donation of 100 000 treasury shares per annum for each of the 2016 to 2019 financial years).
3.3 UNCONSOLIDATED STRUCTURED ENTITIESDuring the year, the group concluded a B-BBEE equity transaction with Grand Parade Investments Ltd (“GPI”) as more fully explained in note 21.2. The group partly financed the indirect acquisition by GPI of 10% of the share capital of the company through a preference share investment in GPI Spur (Pty) Ltd, an indirectly wholly-owned subsidiary of GPI.
The investment in preference shares is recorded as a loan receivable as detailed in note 14.7. The group’s maximum exposure relating to the entity is represented by the carrying value of the preference shares.
The entity is an investment holding vehicle whose key activities comprise the investment in, and financing of, Spur Corporation Ltd shares. The group has no influence over the investing or financing decisions of the entity and consequently, the group does not have any power over the relevant activities of the entity. Therefore, the group concluded that it does not control, and therefore should not consolidate, the entity.
4. OPERATING SEGMENTS
Operating segments are identified based on financial information regularly reviewed by the Spur Corporation Ltd executive directors (identified as the Chief Operating Decision Maker (“CODM”) of the group for IFRS8 – Operating Segments reporting purposes) for performance assessments and resource allocations. In accordance with IFRS8, no segment assets or liabilities have been disclosed as such information is not regularly provided to the CODM.
The group identified 10 reportable segments, as listed below, with no individual customer accounting for more than 10% of turnover:
– South Africa Manufacturing and distribution – South Africa Franchise – Spur – South Africa Franchise – Panarottis – South Africa Franchise – John Dory’s – South Africa Franchise – Captain DoRegos – South Africa Franchise – The Hussar Grill – South Africa Franchise – RocoMamas – South Africa Retail – The Hussar Grill – United Kingdom – Australia

Spur Corporation Ltd Integrated Report 2015 95
The group’s South African business comprises largely the franchise businesses of its six trading brands, Spur Steak Ranches, Panarottis Pizza Pasta, John Dory’s Fish Grill Sushi, Captain DoRegos, The Hussar Grill and RocoMamas, its South African retail division comprising three company-owned The Hussar Grill restaurants (operating in Camps Bay, Rondebosch and Green Point in the Western Cape) and its sauce manufacturing, warehousing and product distribution business. Smaller operating segments include the group’s training division, export business, décor manufacturing business, call centre and radio station which are each individually not material. The CODM reviews the performance of each of the franchise brands, the retail business and other business units independently of each other to assess the risks and contribution of each business unit, including the relevant return on investment and where appropriate the possibility and financial feasibility of expanding, ceasing or outsourcing operations.
The group’s International business comprises largely its operations in the United Kingdom (incorporating Ireland for the purposes of the segmental analysis) and Australia. Other international operating segments include franchise operations in Africa, the United Arab Emirates and Mauritius which have been aggregated – while Africa comprises the majority of the other international segments, the United Arab Emirates and Mauritius components are not individually material, operate on the same basis as the Africa region and are exposed to similar risks. Whilst the businesses in the UK and Australia comprise both a franchise and retail outlet (group-owned restaurant) component, in assessing the performance of these two divisions, the CODM acknowledges that the franchise and retail outlet businesses are intricately linked. In assessing the return on investment in these territories, it is not practicable to allocate contributions between the franchise and retail outlet businesses.
From a statutory reporting perspective, the CODM reviews the profit/loss before income tax of each segment. In managing risks, performance and resource allocations, the CODM considers earnings before interest, tax, depreciation and amortisation (“EBITDA”) as a more meaningful measure, particularly in light of the group’s expansion strategy in international territories and its intention to establish a footprint in those territories, which is anticipated to carry significant depreciation and funding costs. Accordingly, the group has elected to disclose segmental EBITDA in addition to the minimum disclosure required by IFRS8, as the board and management are of the view that this provides meaningful information to stakeholders.
NOTES TO THE CONSOLIDATED FINANCIAL STATEMENTS
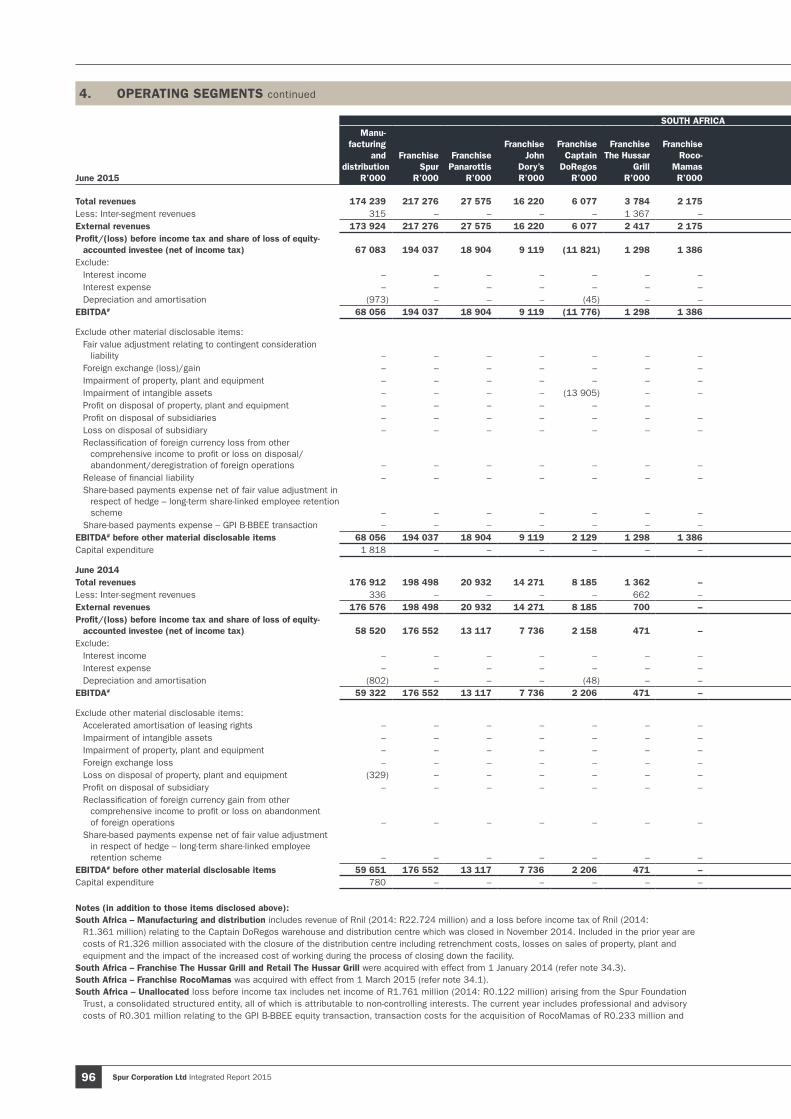
Spur Corporation Ltd Integrated Report 201596
SOUTH AFRICA INTERNATIONAL
June 2015
Manu-facturing
and distribution
R’000
Franchise Spur
R’000
Franchise Panarottis
R’000
Franchise John
Dory’sR’000
Franchise Captain
DoRegos R’000
FranchiseThe Hussar
Grill R’000
Franchise Roco-
MamasR’000
Retail The Hussar
Grill R’000
Other segments
R’000
Total segments
R’000
Un-allocated
R’000
Total South
Africa R’000
United Kingdom
R’000 Australia
R’000
Other segments
R’000
Total segments
R’000
Un-allocated
R’000
Total Inter-
national R’000
TotalR’000
Total revenues 174 239 217 276 27 575 16 220 6 077 3 784 2 175 30 760 59 381 537 487 10 118 547 605 147 657 55 729 19 668 223 054 – 223 054 770 659 Less: Inter-segment revenues 315 – – – – 1 367 – – 520 2 202 8 398 10 600 – – – – – – 10 600 External revenues 173 924 217 276 27 575 16 220 6 077 2 417 2 175 30 760 58 861 535 285 1 720 537 005 147 657 55 729 19 668 223 054 – 223 054 760 059 Profit/(loss) before income tax and share of loss of equity-
accounted investee (net of income tax) 67 083 194 037 18 904 9 119 (11 821) 1 298 1 386 4 645 327 284 978 (81 818) 203 160 (4 714) 4 488 10 616 10 390 (6 496) 3 894 207 054 Exclude:
Interest income – – – – – – – – – – 24 360 24 360 – 246 – 246 75 321 24 681 Interest expense – – – – – – – – – – (8) (8) (34) (23) – (57) – (57) (65)Depreciation and amortisation (973) – – – (45) – – (214) (204) (1 436) (4 038) (5 474) (7 199) (1 272) (16) (8 487) (59) (8 546) (14 020)
EBITDA# 68 056 194 037 18 904 9 119 (11 776) 1 298 1 386 4 859 531 286 414 (102 132) 184 282 2 519 5 537 10 632 18 688 (6 512) 12 176 196 458
Exclude other material disclosable items: Fair value adjustment relating to contingent consideration
liability – – – – – – – – – – (3 681) (3 681) – – – – – – (3 681)Foreign exchange (loss)/gain – – – – – – – – – – – – (170) (19) – (189) 2 088 1 899 1 899 Impairment of property, plant and equipment – – – – – – – – – – – – (1 054) – – (1 054) – (1 054) (1 054)Impairment of intangible assets – – – – (13 905) – – – – (13 905) – (13 905) – – – – – – (13 905)Profit on disposal of property, plant and equipment – – – – – – – – – 65 65 – – – – – – 65 Profit on disposal of subsidiaries – – – – – – – – – – – – – 5 120 – 5 120 – 5 120 5 120 Loss on disposal of subsidiary – – – – – – – – – – – – – (4 545) – (4 545) – (4 545) (4 545)Reclassification of foreign currency loss from other
comprehensive income to profit or loss on disposal/ abandonment/deregistration of foreign operations – – – – – – – – – – – – – (295) – (295) (1 920) (2 215) (2 215)
Release of financial liability – – – – – – – – – – – – 5 173 – – 5 173 – 5 173 5 173 Share-based payments expense net of fair value adjustment in
respect of hedge – long-term share-linked employee retention scheme – – – – – – – – – – (4 941) (4 941) – – – – – – (4 941)
Share-based payments expense – GPI B-BBEE transaction – – – – – – – – – – (32 957) (32 957) – – – – – – (32 957)EBITDA# before other material disclosable items 68 056 194 037 18 904 9 119 2 129 1 298 1 386 4 859 531 300 319 (60 618) 239 701 (1 430) 5 276 10 632 14 478 (6 680) 7 798 247 499 Capital expenditure 1 818 – – – – – – 1 032 – 2 850 16 744 19 594 7 469 3 617 70 11 156 35 11 191 30 785
June 2014Total revenues 176 912 198 498 20 932 14 271 8 185 1 362 – 14 988 51 915 487 063 1 595 488 658 157 565 79 366 15 002 251 933 – 251 933 740 591 Less: Inter-segment revenues 336 – – – – 662 – – 6 957 7 955 – 7 955 – – – – – – 7 955 External revenues 176 576 198 498 20 932 14 271 8 185 700 – 14 988 44 958 479 108 1 595 480 703 157 565 79 366 15 002 251 933 – 251 933 732 636 Profit/(loss) before income tax and share of loss of equity-
accounted investee (net of income tax) 58 520 176 552 13 117 7 736 2 158 471 – 2 354 (160) 260 748 (60 020) 200 728 (2 232) (157) 8 829 6 440 (4 918) 1 522 202 250 Exclude:
Interest income – – – – – – – – – – 7 220 7 220 1 249 – 250 6 256 7 476 Interest expense – – – – – – – – – – (101) (101) (43) (81) – (124) – (124) (225)Depreciation and amortisation (802) – – – (48) – – (29) (224) (1 103) (3 110) (4 213) (7 136) (2 755) – (9 891) (48) (9 939) (14 152)
EBITDA# 59 322 176 552 13 117 7 736 2 206 471 – 2 383 64 261 851 (64 029) 197 822 4 946 2 430 8 829 16 205 (4 876) 11 329 209 151
Exclude other material disclosable items: Accelerated amortisation of leasing rights – – – – – – – – – – – – (1 612) – – (1 612) – (1 612) (1 612)Impairment of intangible assets – – – – – – – – – – – – (1 866) – – (1 866) – (1 866) (1 866)Impairment of property, plant and equipment – – – – – – – – – – – – – (2 496) – (2 496) – (2 496) (2 496)Foreign exchange loss – – – – – – – – – – – – (75) (8) – (83) (687) (770) (770)Loss on disposal of property, plant and equipment (329) – – – – – – – – (329) (115) (444) – – – – – – (444)Profit on disposal of subsidiary – – – – – – – – – – – – – 2 154 – 2 154 – 2 154 2 154 Reclassification of foreign currency gain from other
comprehensive income to profit or loss on abandonment of foreign operations – – – – – – – – – – – – – – – – 3 386 3 386 3 386
Share-based payments expense net of fair value adjustment in respect of hedge – long-term share-linked employee retention scheme – – – – – – – – – – (10 195) (10 195) – – – – – – (10 195)
EBITDA# before other material disclosable items 59 651 176 552 13 117 7 736 2 206 471 – 2 383 64 262 180 (53 719) 208 461 8 499 2 780 8 829 20 108 (7 575) 12 533 220 994 Capital expenditure 780 – – – – – – 447 – 1 227 5 466 6 693 1 799 1 590 – 3 389 – 3 389 10 082
Notes (in addition to those items disclosed above): South Africa – Manufacturing and distribution includes revenue of Rnil (2014: R22.724 million) and a loss before income tax of Rnil (2014:
R1.361 million) relating to the Captain DoRegos warehouse and distribution centre which was closed in November 2014. Included in the prior year are costs of R1.326 million associated with the closure of the distribution centre including retrenchment costs, losses on sales of property, plant and equipment and the impact of the increased cost of working during the process of closing down the facility.
South Africa – Franchise The Hussar Grill and Retail The Hussar Grill were acquired with effect from 1 January 2014 (refer note 34.3).South Africa – Franchise RocoMamas was acquired with effect from 1 March 2015 (refer note 34.1).South Africa – Unallocated loss before income tax includes net income of R1.761 million (2014: R0.122 million) arising from the Spur Foundation
Trust, a consolidated structured entity, all of which is attributable to non-controlling interests. The current year includes professional and advisory costs of R0.301 million relating to the GPI B-BBEE equity transaction, transaction costs for the acquisition of RocoMamas of R0.233 million and
4. OPERATING SEGMENTS continued

Spur Corporation Ltd Integrated Report 2015 97
professional advisory fees of R0.481 million relating to defending the tax queries detailed in notes 45.1 and 45.2. The prior year includes transaction costs for the acquisition of The Hussar Grill of R1.620 million (refer note 34.3) and costs of R0.413 million relating to the international group restructure undertaken during the prior year (refer note 36.1) and defending the tax assessments issued in respect of the group’s controlled foreign companies (refer note 45.1).
United Kingdom – Revenue was impacted by the closure of the Mohawk Spur (refer note 36.2).Australia – Revenue was impacted by the disposal of the outlets detailed in note 35.International – Unallocated loss before income tax includes professional advisory costs of R0.829 million relating to the group’s international tax
structure. The prior year includes costs of R1.674 million relating to the group restructure undertaken during the prior year (refer also note 36.1).
# EBITDA is earnings (profit/loss) before interest, tax, depreciation and amortisation.
SOUTH AFRICA INTERNATIONAL
June 2015
Manu-facturing
and distribution
R’000
Franchise Spur
R’000
Franchise Panarottis
R’000
Franchise John
Dory’sR’000
Franchise Captain
DoRegos R’000
FranchiseThe Hussar
Grill R’000
Franchise Roco-
MamasR’000
Retail The Hussar
Grill R’000
Other segments
R’000
Total segments
R’000
Un-allocated
R’000
Total South
Africa R’000
United Kingdom
R’000 Australia
R’000
Other segments
R’000
Total segments
R’000
Un-allocated
R’000
Total Inter-
national R’000
TotalR’000
Total revenues 174 239 217 276 27 575 16 220 6 077 3 784 2 175 30 760 59 381 537 487 10 118 547 605 147 657 55 729 19 668 223 054 – 223 054 770 659 Less: Inter-segment revenues 315 – – – – 1 367 – – 520 2 202 8 398 10 600 – – – – – – 10 600 External revenues 173 924 217 276 27 575 16 220 6 077 2 417 2 175 30 760 58 861 535 285 1 720 537 005 147 657 55 729 19 668 223 054 – 223 054 760 059 Profit/(loss) before income tax and share of loss of equity-
accounted investee (net of income tax) 67 083 194 037 18 904 9 119 (11 821) 1 298 1 386 4 645 327 284 978 (81 818) 203 160 (4 714) 4 488 10 616 10 390 (6 496) 3 894 207 054 Exclude:
Interest income – – – – – – – – – – 24 360 24 360 – 246 – 246 75 321 24 681 Interest expense – – – – – – – – – – (8) (8) (34) (23) – (57) – (57) (65)Depreciation and amortisation (973) – – – (45) – – (214) (204) (1 436) (4 038) (5 474) (7 199) (1 272) (16) (8 487) (59) (8 546) (14 020)
EBITDA# 68 056 194 037 18 904 9 119 (11 776) 1 298 1 386 4 859 531 286 414 (102 132) 184 282 2 519 5 537 10 632 18 688 (6 512) 12 176 196 458
Exclude other material disclosable items: Fair value adjustment relating to contingent consideration
liability – – – – – – – – – – (3 681) (3 681) – – – – – – (3 681)Foreign exchange (loss)/gain – – – – – – – – – – – – (170) (19) – (189) 2 088 1 899 1 899 Impairment of property, plant and equipment – – – – – – – – – – – – (1 054) – – (1 054) – (1 054) (1 054)Impairment of intangible assets – – – – (13 905) – – – – (13 905) – (13 905) – – – – – – (13 905)Profit on disposal of property, plant and equipment – – – – – – – – – 65 65 – – – – – – 65 Profit on disposal of subsidiaries – – – – – – – – – – – – – 5 120 – 5 120 – 5 120 5 120 Loss on disposal of subsidiary – – – – – – – – – – – – – (4 545) – (4 545) – (4 545) (4 545)Reclassification of foreign currency loss from other
comprehensive income to profit or loss on disposal/ abandonment/deregistration of foreign operations – – – – – – – – – – – – – (295) – (295) (1 920) (2 215) (2 215)
Release of financial liability – – – – – – – – – – – – 5 173 – – 5 173 – 5 173 5 173 Share-based payments expense net of fair value adjustment in
respect of hedge – long-term share-linked employee retention scheme – – – – – – – – – – (4 941) (4 941) – – – – – – (4 941)
Share-based payments expense – GPI B-BBEE transaction – – – – – – – – – – (32 957) (32 957) – – – – – – (32 957)EBITDA# before other material disclosable items 68 056 194 037 18 904 9 119 2 129 1 298 1 386 4 859 531 300 319 (60 618) 239 701 (1 430) 5 276 10 632 14 478 (6 680) 7 798 247 499 Capital expenditure 1 818 – – – – – – 1 032 – 2 850 16 744 19 594 7 469 3 617 70 11 156 35 11 191 30 785
June 2014Total revenues 176 912 198 498 20 932 14 271 8 185 1 362 – 14 988 51 915 487 063 1 595 488 658 157 565 79 366 15 002 251 933 – 251 933 740 591 Less: Inter-segment revenues 336 – – – – 662 – – 6 957 7 955 – 7 955 – – – – – – 7 955 External revenues 176 576 198 498 20 932 14 271 8 185 700 – 14 988 44 958 479 108 1 595 480 703 157 565 79 366 15 002 251 933 – 251 933 732 636 Profit/(loss) before income tax and share of loss of equity-
accounted investee (net of income tax) 58 520 176 552 13 117 7 736 2 158 471 – 2 354 (160) 260 748 (60 020) 200 728 (2 232) (157) 8 829 6 440 (4 918) 1 522 202 250 Exclude:
Interest income – – – – – – – – – – 7 220 7 220 1 249 – 250 6 256 7 476 Interest expense – – – – – – – – – – (101) (101) (43) (81) – (124) – (124) (225)Depreciation and amortisation (802) – – – (48) – – (29) (224) (1 103) (3 110) (4 213) (7 136) (2 755) – (9 891) (48) (9 939) (14 152)
EBITDA# 59 322 176 552 13 117 7 736 2 206 471 – 2 383 64 261 851 (64 029) 197 822 4 946 2 430 8 829 16 205 (4 876) 11 329 209 151
Exclude other material disclosable items: Accelerated amortisation of leasing rights – – – – – – – – – – – – (1 612) – – (1 612) – (1 612) (1 612)Impairment of intangible assets – – – – – – – – – – – – (1 866) – – (1 866) – (1 866) (1 866)Impairment of property, plant and equipment – – – – – – – – – – – – – (2 496) – (2 496) – (2 496) (2 496)Foreign exchange loss – – – – – – – – – – – – (75) (8) – (83) (687) (770) (770)Loss on disposal of property, plant and equipment (329) – – – – – – – – (329) (115) (444) – – – – – – (444)Profit on disposal of subsidiary – – – – – – – – – – – – – 2 154 – 2 154 – 2 154 2 154 Reclassification of foreign currency gain from other
comprehensive income to profit or loss on abandonment of foreign operations – – – – – – – – – – – – – – – – 3 386 3 386 3 386
Share-based payments expense net of fair value adjustment in respect of hedge – long-term share-linked employee retention scheme – – – – – – – – – – (10 195) (10 195) – – – – – – (10 195)
EBITDA# before other material disclosable items 59 651 176 552 13 117 7 736 2 206 471 – 2 383 64 262 180 (53 719) 208 461 8 499 2 780 8 829 20 108 (7 575) 12 533 220 994 Capital expenditure 780 – – – – – – 447 – 1 227 5 466 6 693 1 799 1 590 – 3 389 – 3 389 10 082
4. OPERATING SEGMENTS continued
NOTES TO THE CONSOLIDATED FINANCIAL STATEMENTS
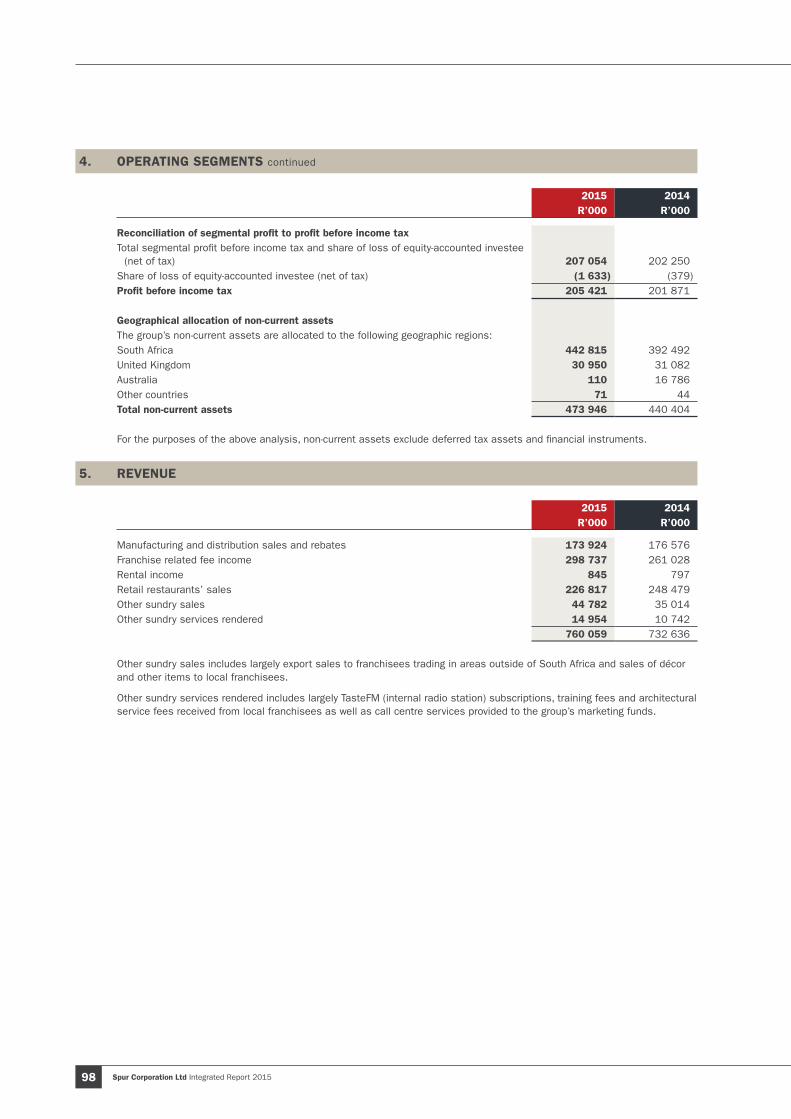
Spur Corporation Ltd Integrated Report 201598
4. OPERATING SEGMENTS continued
2015 2014 R’000 R’000
Reconciliation of segmental profit to profit before income taxTotal segmental profit before income tax and share of loss of equity-accounted investee
(net of tax) 207 054 202 250 Share of loss of equity-accounted investee (net of tax) (1 633) (379)Profit before income tax 205 421 201 871
Geographical allocation of non-current assetsThe group’s non-current assets are allocated to the following geographic regions:South Africa 442 815 392 492 United Kingdom 30 950 31 082 Australia 110 16 786 Other countries 71 44 Total non-current assets 473 946 440 404
For the purposes of the above analysis, non-current assets exclude deferred tax assets and financial instruments.
5. REVENUE
2015 2014 R’000 R’000
Manufacturing and distribution sales and rebates 173 924 176 576Franchise related fee income 298 737 261 028Rental income 845 797Retail restaurants’ sales 226 817 248 479Other sundry sales 44 782 35 014Other sundry services rendered 14 954 10 742
760 059 732 636
Other sundry sales includes largely export sales to franchisees trading in areas outside of South Africa and sales of décor and other items to local franchisees.
Other sundry services rendered includes largely TasteFM (internal radio station) subscriptions, training fees and architectural service fees received from local franchisees as well as call centre services provided to the group’s marketing funds.
Spur Corporation Ltd Integrated Report 2015 99
6. OTHER INCOME
2015 2014 R’000 R’000
Fair value gain on derivative financial instruments at fair value through profit or loss (refer note 17) 14 794 17 922
Foreign exchange gain 1 899 – Insurance recoveries 1 660 – Marketing fund administration fees 18 246 15 702 Profit on disposal of property, plant and equipment 65 – Profit on disposal of subsidiaries (refer notes 35.1, 35.2 and 35.4) 5 120 2 154 Reclassification of foreign currency gain from other comprehensive income to profit or
loss on abandonment of foreign operations (refer note 36.1) – 3 386 Release of financial liability (refer note 36.3) 5 173 – Spur Foundation donation income 2 860 1 373 Other 62 69
49 879 40 606
Marketing fund administration fees relate to administrative support services rendered by the group in respect of marketing funds (refer note 39).
Spur Foundation donation income relates to donations received by The Spur Foundation Trust, a consolidated structured entity, from parties external to the group. The income may be used exclusively for the benefit of the beneficiaries of the trust in accordance with the trust deed (which exclude any group entities). Related expenditure is included in Administration expenses in the statement of comprehensive income.
NOTES TO THE CONSOLIDATED FINANCIAL STATEMENTS
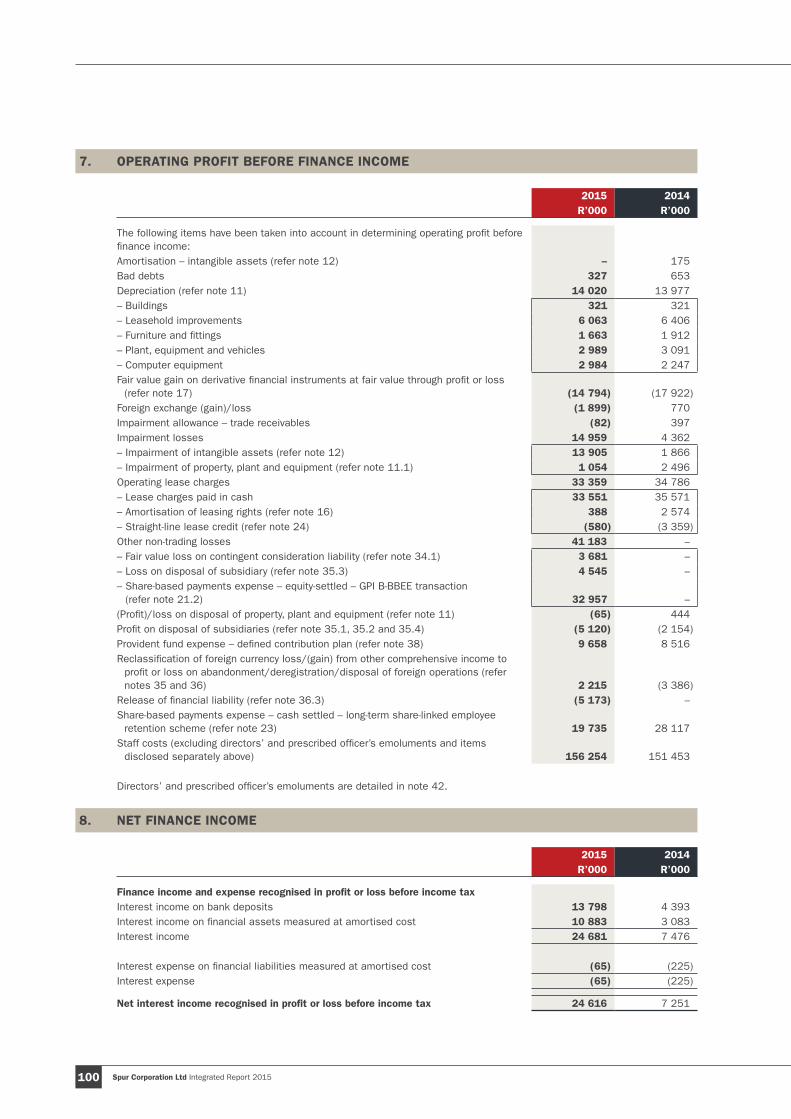
Spur Corporation Ltd Integrated Report 2015100
7. OPERATING PROFIT BEFORE FINANCE INCOME
2015 2014 R’000 R’000
The following items have been taken into account in determining operating profit before finance income:Amortisation – intangible assets (refer note 12) – 175 Bad debts 327 653 Depreciation (refer note 11) 14 020 13 977 – Buildings 321 321 – Leasehold improvements 6 063 6 406 – Furniture and fittings 1 663 1 912 – Plant, equipment and vehicles 2 989 3 091 – Computer equipment 2 984 2 247 Fair value gain on derivative financial instruments at fair value through profit or loss
(refer note 17) (14 794) (17 922)Foreign exchange (gain)/loss (1 899) 770Impairment allowance – trade receivables (82) 397Impairment losses 14 959 4 362 – Impairment of intangible assets (refer note 12) 13 905 1 866 – Impairment of property, plant and equipment (refer note 11.1) 1 054 2 496 Operating lease charges 33 359 34 786 – Lease charges paid in cash 33 551 35 571 – Amortisation of leasing rights (refer note 16) 388 2 574 – Straight-line lease credit (refer note 24) (580) (3 359)Other non-trading losses 41 183 – – Fair value loss on contingent consideration liability (refer note 34.1) 3 681 – – Loss on disposal of subsidiary (refer note 35.3) 4 545 – – Share-based payments expense – equity-settled – GPI B-BBEE transaction
(refer note 21.2) 32 957 – (Profit)/loss on disposal of property, plant and equipment (refer note 11) (65) 444 Profit on disposal of subsidiaries (refer note 35.1, 35.2 and 35.4) (5 120) (2 154)Provident fund expense – defined contribution plan (refer note 38) 9 658 8 516 Reclassification of foreign currency loss/(gain) from other comprehensive income to
profit or loss on abandonment/deregistration/disposal of foreign operations (refer notes 35 and 36) 2 215 (3 386)
Release of financial liability (refer note 36.3) (5 173) – Share-based payments expense – cash settled – long-term share-linked employee
retention scheme (refer note 23) 19 735 28 117 Staff costs (excluding directors’ and prescribed officer’s emoluments and items
disclosed separately above) 156 254 151 453
Directors’ and prescribed officer’s emoluments are detailed in note 42.
8. NET FINANCE INCOME
2015 2014 R’000 R’000
Finance income and expense recognised in profit or loss before income taxInterest income on bank deposits 13 798 4 393 Interest income on financial assets measured at amortised cost 10 883 3 083 Interest income 24 681 7 476
Interest expense on financial liabilities measured at amortised cost (65) (225)Interest expense (65) (225)
Net interest income recognised in profit or loss before income tax 24 616 7 251
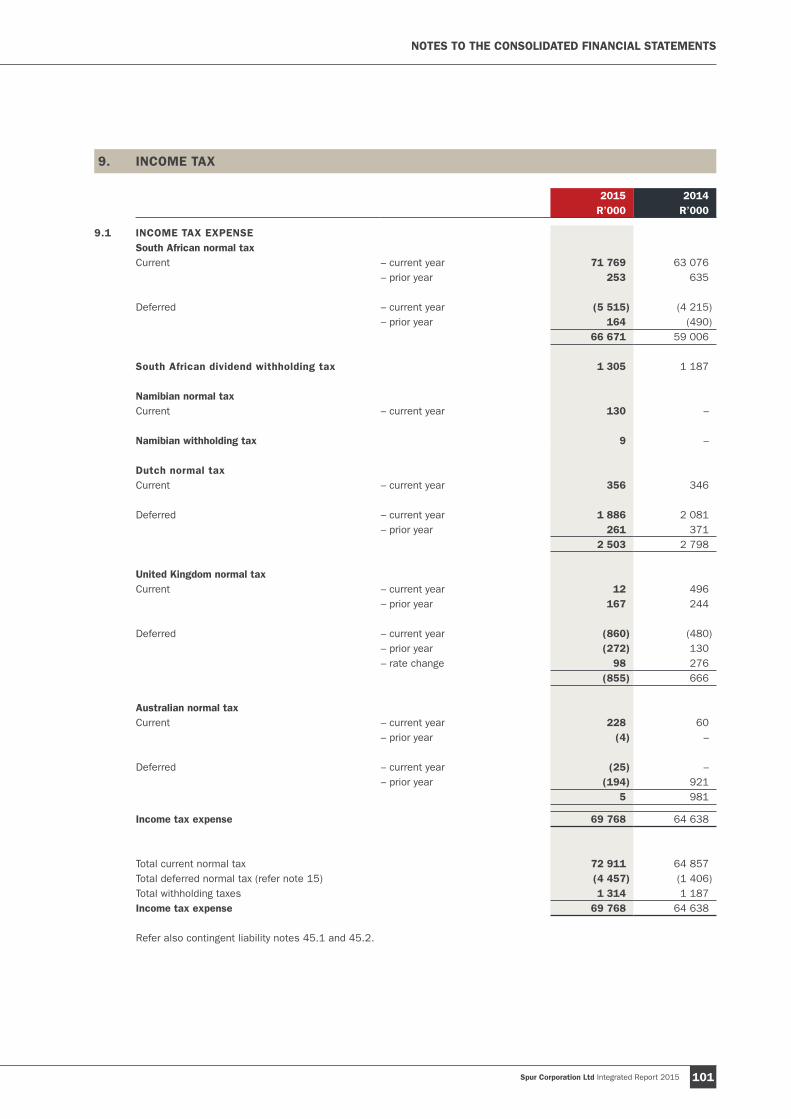
Spur Corporation Ltd Integrated Report 2015 101
9. INCOME TAX
2015 2014 R’000 R’000
9.1 INCOME TAX EXPENSESouth African normal taxCurrent – current year 71 769 63 076
– prior year 253 635
Deferred – current year (5 515) (4 215)– prior year 164 (490)
66 671 59 006
South African dividend withholding tax 1 305 1 187
Namibian normal taxCurrent – current year 130 –
Namibian withholding tax 9 –
Dutch normal taxCurrent – current year 356 346
Deferred – current year 1 886 2 081 – prior year 261 371
2 503 2 798
United Kingdom normal taxCurrent – current year 12 496
– prior year 167 244
Deferred – current year (860) (480)– prior year (272) 130 – rate change 98 276
(855) 666
Australian normal taxCurrent – current year 228 60
– prior year (4) –
Deferred – current year (25) – – prior year (194) 921
5 981
Income tax expense 69 768 64 638
Total current normal tax 72 911 64 857 Total deferred normal tax (refer note 15) (4 457) (1 406)Total withholding taxes 1 314 1 187 Income tax expense 69 768 64 638
Refer also contingent liability notes 45.1 and 45.2.
NOTES TO THE CONSOLIDATED FINANCIAL STATEMENTS
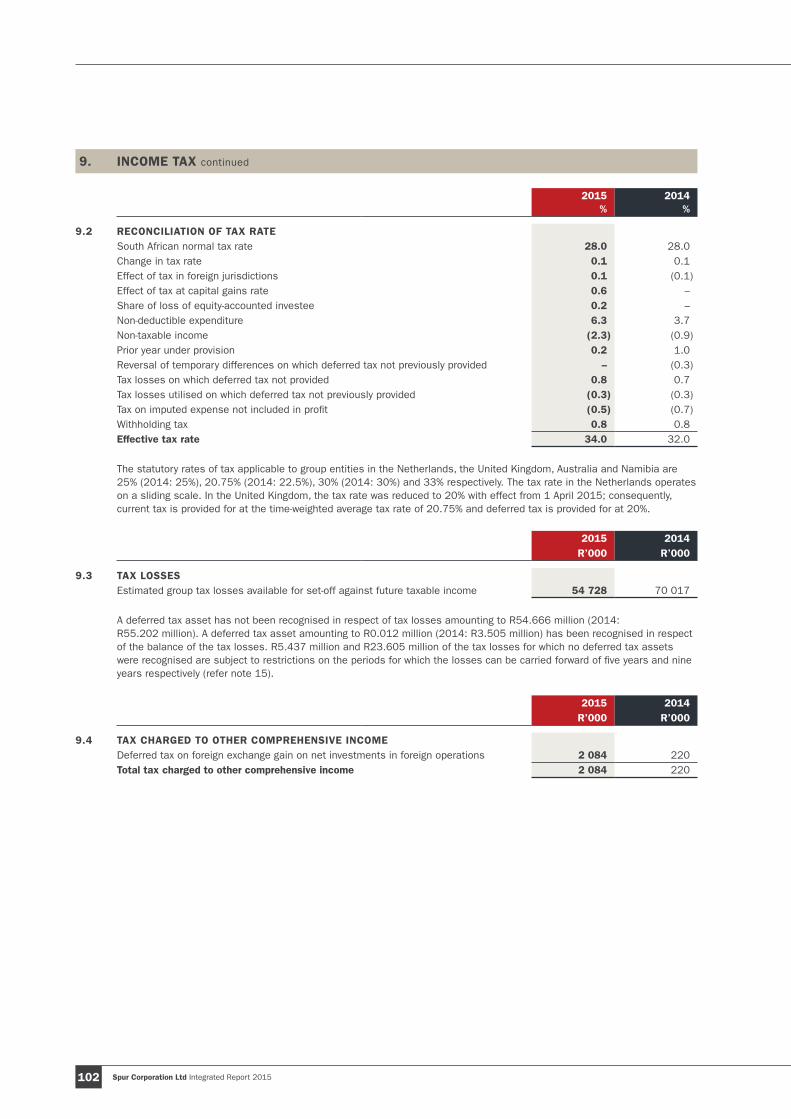
Spur Corporation Ltd Integrated Report 2015102
9. INCOME TAX continued
2015%
2014%
9.2 RECONCILIATION OF TAX RATESouth African normal tax rate 28.0 28.0 Change in tax rate 0.1 0.1 Effect of tax in foreign jurisdictions 0.1 (0.1)Effect of tax at capital gains rate 0.6 – Share of loss of equity-accounted investee 0.2 – Non-deductible expenditure 6.3 3.7 Non-taxable income (2.3) (0.9)Prior year under provision 0.2 1.0 Reversal of temporary differences on which deferred tax not previously provided – (0.3)Tax losses on which deferred tax not provided 0.8 0.7 Tax losses utilised on which deferred tax not previously provided (0.3) (0.3)Tax on imputed expense not included in profit (0.5) (0.7)Withholding tax 0.8 0.8 Effective tax rate 34.0 32.0
The statutory rates of tax applicable to group entities in the Netherlands, the United Kingdom, Australia and Namibia are 25% (2014: 25%), 20.75% (2014: 22.5%), 30% (2014: 30%) and 33% respectively. The tax rate in the Netherlands operates on a sliding scale. In the United Kingdom, the tax rate was reduced to 20% with effect from 1 April 2015; consequently, current tax is provided for at the time-weighted average tax rate of 20.75% and deferred tax is provided for at 20%.
2015 2014 R’000 R’000
9.3 TAX LOSSESEstimated group tax losses available for set-off against future taxable income 54 728 70 017
A deferred tax asset has not been recognised in respect of tax losses amounting to R54.666 million (2014: R55.202 million). A deferred tax asset amounting to R0.012 million (2014: R3.505 million) has been recognised in respect of the balance of the tax losses. R5.437 million and R23.605 million of the tax losses for which no deferred tax assets were recognised are subject to restrictions on the periods for which the losses can be carried forward of five years and nine years respectively (refer note 15).
2015 2014 R’000 R’000
9.4 TAX CHARGED TO OTHER COMPREHENSIVE INCOMEDeferred tax on foreign exchange gain on net investments in foreign operations 2 084 220 Total tax charged to other comprehensive income 2 084 220
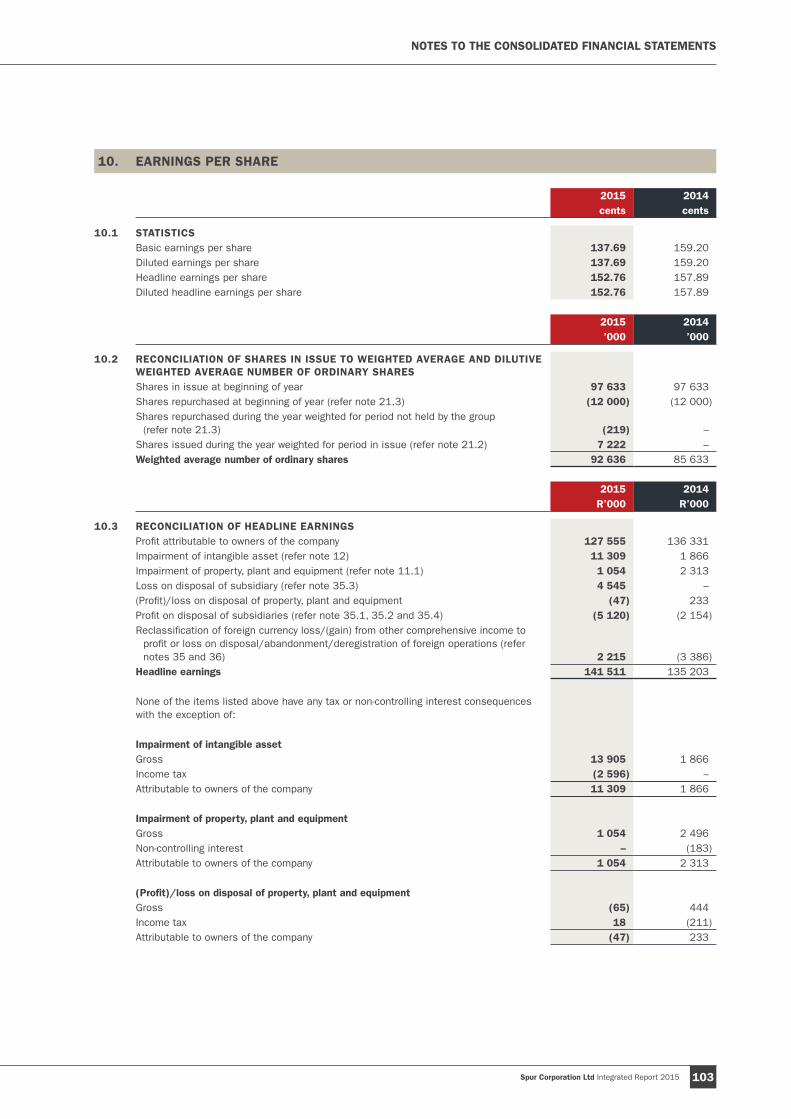
Spur Corporation Ltd Integrated Report 2015 103
10. EARNINGS PER SHARE
2015 2014cents cents
10.1 STATISTICSBasic earnings per share 137.69 159.20Diluted earnings per share 137.69 159.20Headline earnings per share 152.76 157.89Diluted headline earnings per share 152.76 157.89
2015 2014’000 ’000
10.2 RECONCILIATION OF SHARES IN ISSUE TO WEIGHTED AVERAGE AND DILUTIVE WEIGHTED AVERAGE NUMBER OF ORDINARY SHARESShares in issue at beginning of year 97 633 97 633 Shares repurchased at beginning of year (refer note 21.3) (12 000) (12 000)Shares repurchased during the year weighted for period not held by the group
(refer note 21.3) (219) – Shares issued during the year weighted for period in issue (refer note 21.2) 7 222 – Weighted average number of ordinary shares 92 636 85 633
2015 2014R’000 R’000
10.3 RECONCILIATION OF HEADLINE EARNINGSProfit attributable to owners of the company 127 555 136 331 Impairment of intangible asset (refer note 12) 11 309 1 866 Impairment of property, plant and equipment (refer note 11.1) 1 054 2 313 Loss on disposal of subsidiary (refer note 35.3) 4 545 – (Profit)/loss on disposal of property, plant and equipment (47) 233 Profit on disposal of subsidiaries (refer note 35.1, 35.2 and 35.4) (5 120) (2 154)Reclassification of foreign currency loss/(gain) from other comprehensive income to
profit or loss on disposal/abandonment/deregistration of foreign operations (refer notes 35 and 36) 2 215 (3 386)
Headline earnings 141 511 135 203
None of the items listed above have any tax or non-controlling interest consequences with the exception of:
Impairment of intangible assetGross 13 905 1 866 Income tax (2 596) – Attributable to owners of the company 11 309 1 866
Impairment of property, plant and equipmentGross 1 054 2 496 Non-controlling interest – (183)Attributable to owners of the company 1 054 2 313
(Profit)/loss on disposal of property, plant and equipment Gross (65) 444 Income tax 18 (211)Attributable to owners of the company (47) 233
NOTES TO THE CONSOLIDATED FINANCIAL STATEMENTS

Spur Corporation Ltd Integrated Report 2015104
11. PROPERTY, PLANT AND EQUIPMENT
Land and buildings
Leaseholdimprove-
ments
Furniture and
fittings
Plant, equipment
and vehicles
Computerequipment Total
R’000 R’000 R’000 R’000 R’000 R’000
2015COSTBalance at 1 July 2014 35 011 95 858 21 741 37 961 15 826 206 397 Disposals of subsidiaries (refer note 35) – (20 696) (7 988) (10 488) (2 686) (41 858) Additions 13 297 6 208 2 967 5 701 2 612 30 785 Disposals – – – (90) (66) (156) Effect of foreign exchange fluctuations – 1 999 (203) 191 (66) 1 921 Balance at 30 June 2015 48 308 83 369 16 517 33 275 15 620 197 089
ACCUMULATED DEPRECIATION AND IMPAIRMENT LOSSESBalance at 1 July 2014 (2 079) (68 613) (16 232) (31 193) (10 991) (129 108) Disposals of subsidiaries (refer note 35) – 16 104 7 309 9 101 2 118 34 632 Disposals – – – 90 52 142 Depreciation (321) (6 063) (1 663) (2 989) (2 984) (14 020) Impairment (refer note 11.1) – (839) (99) (109) (7) (1 054) Effect of foreign exchange fluctuations – (1 304) 216 (158) 46 (1 200) Balance at 30 June 2015 (2 400) (60 715) (10 469) (25 258) (11 766) (110 608)
CARRYING VALUEBalance at 1 July 2014 32 932 27 245 5 509 6 768 4 835 77 289 Disposals of subsidiaries (refer note 35) – (4 592) (679) (1 387) (568) (7 226) Additions 13 297 6 208 2 967 5 701 2 612 30 785 Disposals – – – – (14) (14) Depreciation (321) (6 063) (1 663) (2 989) (2 984) (14 020) Impairment (refer note 11.1) – (839) (99) (109) (7) (1 054) Effect of foreign exchange fluctuations – 695 13 33 (20) 721 Balance at 30 June 2015 45 908 22 654 6 048 8 017 3 854 86 481
2014COSTBalance at 1 July 2013 35 011 87 652 18 893 36 160 12 338 190 054 Disposals of subsidiaries (refer note 35) – (3 071) (192) (539) (76) (3 878) Additions – 2 069 1 331 2 208 4 474 10 082 Disposals – (759) – (2 676) (1 449) (4 884) Effect of foreign exchange fluctuations – 9 967 1 709 2 808 539 15 023 Balance at 30 June 2014 35 011 95 858 21 741 37 961 15 826 206 397
ACCUMULATED DEPRECIATION AND IMPAIRMENT LOSSESBalance at 1 July 2013 (1 758) (58 424) (13 101) (27 412) (9 584) (110 279) Disposals of subsidiaries (refer note 35) – 3 071 192 539 58 3 860 Disposals – 503 – 1 323 1 423 3 249 Depreciation (321) (6 406) (1 912) (3 091) (2 247) (13 977) Impairment (refer note 11.1) – (1 926) (177) (206) (187) (2 496) Effect of foreign exchange fluctuations – (5 431) (1 234) (2 346) (454) (9 465) Balance at 30 June 2014 (2 079) (68 613) (16 232) (31 193) (10 991) (129 108)
CARRYING VALUEBalance at 1 July 2013 33 253 29 228 5 792 8 748 2 754 79 775 Disposals of subsidiaries (refer note 35) – – – – (18) (18) Additions – 2 069 1 331 2 208 4 474 10 082 Disposals – (256) – (1 353) (26) (1 635) Depreciation (321) (6 406) (1 912) (3 091) (2 247) (13 977) Impairment (refer note 11.1) – (1 926) (177) (206) (187) (2 496) Effect of foreign exchange fluctuations – 4 536 475 462 85 5 558 Balance at 30 June 2014 32 932 27 245 5 509 6 768 4 835 77 289

Spur Corporation Ltd Integrated Report 2015 105
11.1 IMPAIRMENTSCheyenne Spur O2 Arena, London (England)The Cheyenne Spur in the O2 Arena in London commenced trading in 2007. During the current year, the increased costs of occupancy, labour and raw material inputs impacted negatively on the profitability of the outlet. Increased competition also kept revenue growth contained. As a consequence, the outlet incurred a cash flow loss for the year, indicating a possible impairment.
In assessing the recoverable amount of the restaurant as a cash-generating unit, the directors have estimated the value-in-use of the cash-generating unit. Given the nature of the restaurant industry and the limited presence of the group’s trading brands in the UK, the directors assert that the cash-generating unit’s fair value less costs of disposal is unlikely to be significant in relation to its value-in-use.
The cash-generating unit comprises predominantly property, plant and equipment and net working capital.
In determining the value-in-use of the cash-generating unit, the directors applied the following key assumptions which are based on historic performance:
– Cash inflows, comprising restaurant turnovers, were estimated based on conservative budgets for the 2016 financial year and inflationary increases of 2% per annum for the 2017 to 2020 forecast horizon;
– Cash outflows for the 2016 financial year were estimated based on the most recent expense budgets prepared by management and adjusted for the remainder of the forecast period as detailed below;
– Variable costs were estimated to increase in line with turnover; – Fixed costs were estimated to increase at the UK targeted inflation rate of 2%; – Semi-variable costs were adjusted in part for anticipated inflation and in part by the change in anticipated turnover; – Rental cost was forecast in accordance with the lease agreement; – Growth in perpetuity of cash flows beyond the five year forecast horizon was estimated at 2%; – Pre-tax cash flows were discounted at a pre-tax rate of 10.0%, being the risk-free rate of 0.5% (the Bank of England base
rate) adjusted for risk factors; and – The present value of the cash flows was translated to the reporting currency at the exchange rate prevailing at the
reporting date.
Based on the value-in-use calculation, the cash-generating unit’s recoverable amount of R2.845 million was determined to be less than its carrying value of R3.899 million. Consequently, the carrying value of property, plant and equipment was partially impaired by R1.054 million at the reporting date.
Despite the conclusion to impair the property, plant and equipment partially, management has implemented a number of measures which are anticipated to improve expense management and increase turnover in the forthcoming financial year. The board is confident that the restaurant remains a sustainable business and intends continuing to trade the outlet for the foreseeable future.
Panarottis Blacktown (Australia) – prior yearPanarottis Blacktown, a restaurant operated by a former subsidiary of the group, Panawest Pty Ltd (an entity in which the group had a 92.7% interest), commenced trading in Blacktown (Australia) in October 2006. Due to increases in the cost of occupancy and minimum wage rates in Australia, coupled with a decrease in foot traffic in the centre in which the restaurant is situated, the restaurant did not achieve the cash flows that were anticipated, indicating a possible impairment at 30 June 2014.
During the prior year, at 30 June 2014, the directors determined the recoverable amount of the restaurant as a cash-generating unit, based on its value-in-use, which was significantly less than its carrying value. Consequently, the full carrying value of property, plant and equipment was impaired amounting AU$249 476, the equivalent of R2.496 million, at 30 June 2014.
The entity was sold during the current year (refer note 35.1).
11.2 CONTRACT IN PROGRESSDuring the year, the group acquired land (at a cost of R8.219 million) adjacent to the group’s existing corporate head office building in Century City, Cape Town. The group has started construction of a new corporate office on the site and costs incurred up to the reporting date totalled R5.078 million. Refer note 41 for capital commitments in this regard.
NOTES TO THE CONSOLIDATED FINANCIAL STATEMENTS

Spur Corporation Ltd Integrated Report 2015106
12. INTANGIBLE ASSETS AND GOODWILL
Trademarks and
intellectual property Goodwill
Franchise rights Total
R’000 R’000 R’000 R’000
2015COSTBalance at 1 July 2014 321 421 44 833 3 327 369 581 Acquisition through business combination (refer note 34) 7 114 42 439 – 49 553 Disposals – – (3 616) (3 616)Disposals of subsidiaries (refer note 35) – (10 050) – (10 050)Effect of foreign exchange fluctuations – (730) 289 (441)Balance at 30 June 2015 328 535 76 492 – 405 027
ACCUMULATED AMORTISATION AND IMPAIRMENT LOSSESBalance at 1 July 2014 – (6 512) (3 327) (9 839)Disposals – – 3 616 3 616 Impairment (refer note 12.1) (13 905) – – (13 905)Effect of foreign exchange fluctuations – – (289) (289)Balance at 30 June 2015 (13 905) (6 512) – (20 417)
CARRYING VALUEBalance at 1 July 2014 321 421 38 321 – 359 742 Acquisition through business combination (refer note 34) 7 114 42 439 – 49 553 Disposals of subsidiaries (refer note 35) – (10 050) – (10 050)Impairment (refer note 12.1) (13 905) – – (13 905)Effect of foreign exchange fluctuations – (730) – (730)Balance at 30 June 2015 314 630 69 980 – 384 610
2014COSTBalance at 1 July 2013 311 517 16 811 2 634 330 962 Acquisition through business combination (refer note 34) 9 904 26 918 – 36 822 Effect of foreign exchange fluctuations – 1 104 693 1 797 Balance at 30 June 2014 321 421 44 833 3 327 369 581
ACCUMULATED AMORTISATION AND IMPAIRMENT LOSSESBalance at 1 July 2013 – (6 512) (817) (7 329)Amortisation – – (175) (175)Impairment (refer note 12.3) – – (1 866) (1 866)Effect of foreign exchange fluctuations – – (469) (469)Balance at 30 June 2014 – (6 512) (3 327) (9 839)
CARRYING VALUEBalance at 1 July 2013 311 517 10 299 1 817 323 633 Acquisition through business combination (refer note 34) 9 904 26 918 – 36 822 Amortisation – – (175) (175)Impairment (refer note 12.3) – – (1 866) (1 866)Effect of foreign exchange fluctuations – 1 104 224 1 328 Balance at 30 June 2014 321 421 38 321 – 359 742
None of the above intangible assets are internally generated.
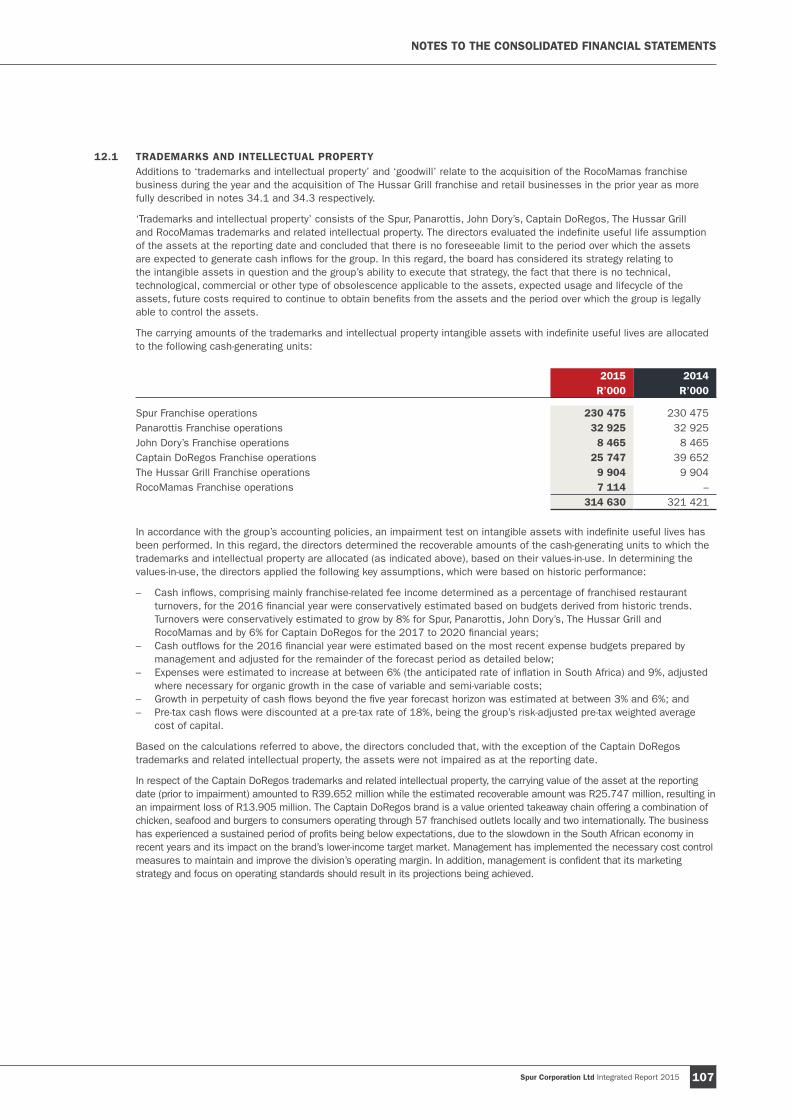
Spur Corporation Ltd Integrated Report 2015 107
NOTES TO THE CONSOLIDATED FINANCIAL STATEMENTS
12.1 TRADEMARKS AND INTELLECTUAL PROPERTYAdditions to ‘trademarks and intellectual property’ and ‘goodwill’ relate to the acquisition of the RocoMamas franchise business during the year and the acquisition of The Hussar Grill franchise and retail businesses in the prior year as more fully described in notes 34.1 and 34.3 respectively.
‘Trademarks and intellectual property’ consists of the Spur, Panarottis, John Dory’s, Captain DoRegos, The Hussar Grill and RocoMamas trademarks and related intellectual property. The directors evaluated the indefinite useful life assumption of the assets at the reporting date and concluded that there is no foreseeable limit to the period over which the assets are expected to generate cash inflows for the group. In this regard, the board has considered its strategy relating to the intangible assets in question and the group’s ability to execute that strategy, the fact that there is no technical, technological, commercial or other type of obsolescence applicable to the assets, expected usage and lifecycle of the assets, future costs required to continue to obtain benefits from the assets and the period over which the group is legally able to control the assets.
The carrying amounts of the trademarks and intellectual property intangible assets with indefinite useful lives are allocated to the following cash-generating units:
2015 2014 R’000 R’000
Spur Franchise operations 230 475 230 475Panarottis Franchise operations 32 925 32 925John Dory’s Franchise operations 8 465 8 465Captain DoRegos Franchise operations 25 747 39 652The Hussar Grill Franchise operations 9 904 9 904RocoMamas Franchise operations 7 114 –
314 630 321 421
In accordance with the group’s accounting policies, an impairment test on intangible assets with indefinite useful lives has been performed. In this regard, the directors determined the recoverable amounts of the cash-generating units to which the trademarks and intellectual property are allocated (as indicated above), based on their values-in-use. In determining the values-in-use, the directors applied the following key assumptions, which were based on historic performance:
– Cash inflows, comprising mainly franchise-related fee income determined as a percentage of franchised restaurant turnovers, for the 2016 financial year were conservatively estimated based on budgets derived from historic trends. Turnovers were conservatively estimated to grow by 8% for Spur, Panarottis, John Dory’s, The Hussar Grill and RocoMamas and by 6% for Captain DoRegos for the 2017 to 2020 financial years;
– Cash outflows for the 2016 financial year were estimated based on the most recent expense budgets prepared by management and adjusted for the remainder of the forecast period as detailed below;
– Expenses were estimated to increase at between 6% (the anticipated rate of inflation in South Africa) and 9%, adjusted where necessary for organic growth in the case of variable and semi-variable costs;
– Growth in perpetuity of cash flows beyond the five year forecast horizon was estimated at between 3% and 6%; and– Pre-tax cash flows were discounted at a pre-tax rate of 18%, being the group’s risk-adjusted pre-tax weighted average
cost of capital.
Based on the calculations referred to above, the directors concluded that, with the exception of the Captain DoRegos trademarks and related intellectual property, the assets were not impaired as at the reporting date.
In respect of the Captain DoRegos trademarks and related intellectual property, the carrying value of the asset at the reporting date (prior to impairment) amounted to R39.652 million while the estimated recoverable amount was R25.747 million, resulting in an impairment loss of R13.905 million. The Captain DoRegos brand is a value oriented takeaway chain offering a combination of chicken, seafood and burgers to consumers operating through 57 franchised outlets locally and two internationally. The business has experienced a sustained period of profits being below expectations, due to the slowdown in the South African economy in recent years and its impact on the brand’s lower-income target market. Management has implemented the necessary cost control measures to maintain and improve the division’s operating margin. In addition, management is confident that its marketing strategy and focus on operating standards should result in its projections being achieved.

Spur Corporation Ltd Integrated Report 2015108
12. INTANGIBLE ASSETS AND GOODWILL continued
2015 2014 R’000 R’000
12.2 GOODWILLFor the purposes of impairment testing, goodwill is allocated to the following cash-generating units:John Dory’s Franchise operations 178 178 Panarottis Penrith (Australia) – 3 215 RocoMamas Franchise operations 42 439 – Silver Lake Spur (United Kingdom) 445 417 Silver Spur (Australia) – 7 593 The Hussar Grill Franchise operations 12 945 12 945 The Hussar Grill Retail operations 13 973 13 973
69 980 38 321
In addition to the above, goodwill implicit in the carrying value of the interest in the equity-accounted associate, Braviz Fine Foods (Pty) Ltd, amounts to R0.606 million (2014: R0.606 million) (refer note 13).
The recoverable amounts of the cash-generating units were based on their values-in-use for all cash-generating units, with the exception of the Silver Lake Spur, which was based on its fair value less costs of disposal.
The directors have determined that the recoverable amounts of all the cash-generating units listed above exceed their carrying values and consequently concluded that none of the goodwill is impaired.
John Dory’s Franchise, RocoMamas Franchise and The Hussar Grill Franchise operationsImpairment of goodwill was considered as part of the trademark and intellectual property impairment test referred to in 12.1.
The Hussar Grill Retail operationsIn determining the value-in-use, the directors applied the following key assumptions, which were based on historic performance: – Cash inflows, comprising mainly restaurant turnovers, for the 2016 financial year were conservatively estimated based
on historic trends. Turnovers were estimated to grow by 8% per annum for the 2017 to 2020 financial years, slightly ahead of the South African targeted rate of inflation;
– Cash outflows for the 2016 financial year were estimated based on the most recent expense budgets prepared by management and adjusted for the remainder of the forecast period as detailed below;
– Variable costs were estimated to increase in line with turnover; – Fixed costs were estimated to increase at anticipated inflation of 6.5% throughout the forecast horizon; – Semi-variable costs were adjusted in part for anticipated inflation and in part by the change in anticipated turnover; – Rental costs were forecast in accordance with the respective lease agreements; – Growth in perpetuity of cash flows beyond the five year forecast horizon was estimated at 3%; – Pre-tax cash flows were discounted at a pre-tax rate of 18%, being the group’s risk-adjusted pre-tax weighted average
cost of capital.
Silver Lake Spur (United Kingdom)Subsequent to the reporting date, on 15 July 2015, the group sold the lease and assets of the cash-generating unit to an independent party in an arm’s-length transaction for £412 500 (the equivalent of R7.946 million at the transaction date) in cash (refer note 44.2). At 30 June 2015, the carrying value of the cash-generating unit amounted to R4.907 million, comprising principally property, plant and equipment of R4.405 million and goodwill. The excess of the fair value over the carrying value of the cash-generating unit amounts to R3.039 million. Although the costs of selling the business have yet to be finalised, they are not anticipated to exceed this excess.
12.3 FRANCHISE RIGHTSThese rights were acquired in the 2008 financial year as part of the acquisition of the non-controlling shareholder’s interest in Mohawk Spur Ltd, the subsidiary company operating the Mohawk Spur in Wandsworth (UK), and were impaired in the prior year. The restaurant in question ceased trading in February 2015 and the rights in question consequently expired. Refer note 36.2.
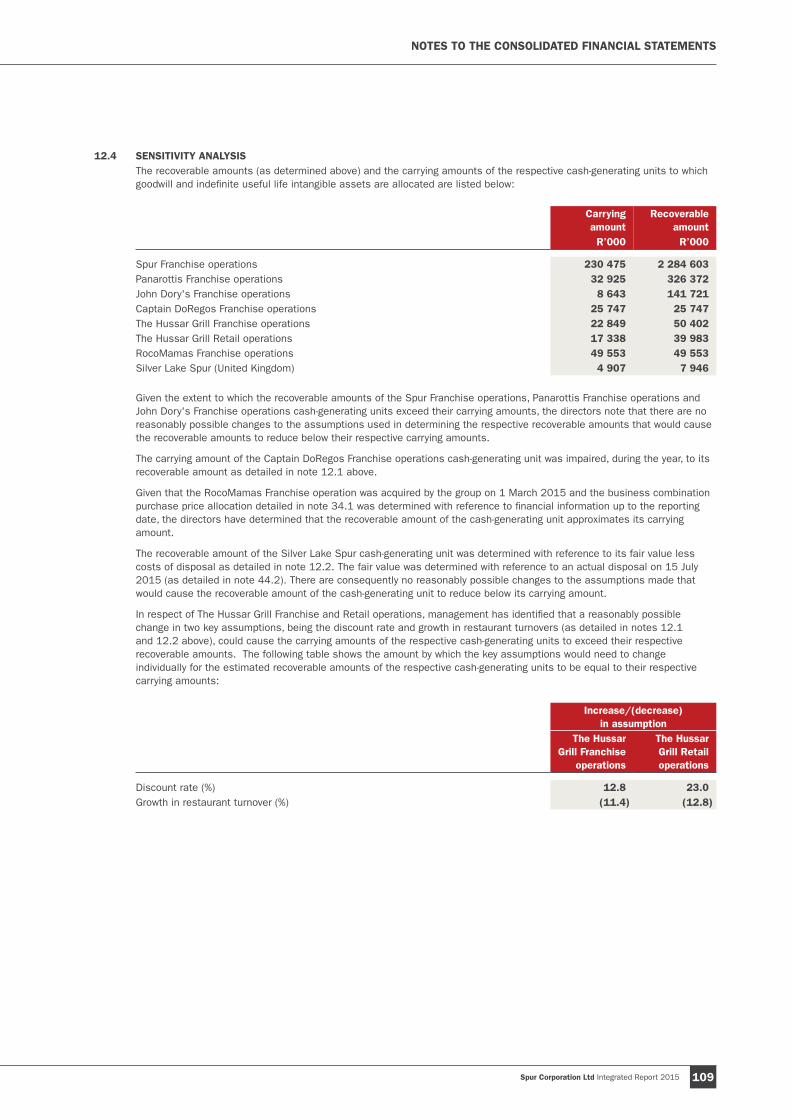
Spur Corporation Ltd Integrated Report 2015 109
12.4 SENSITIVITY ANALYSISThe recoverable amounts (as determined above) and the carrying amounts of the respective cash-generating units to which goodwill and indefinite useful life intangible assets are allocated are listed below:
Carrying amount
Recoverable amount
R’000 R’000
Spur Franchise operations 230 475 2 284 603 Panarottis Franchise operations 32 925 326 372 John Dory's Franchise operations 8 643 141 721 Captain DoRegos Franchise operations 25 747 25 747 The Hussar Grill Franchise operations 22 849 50 402 The Hussar Grill Retail operations 17 338 39 983 RocoMamas Franchise operations 49 553 49 553 Silver Lake Spur (United Kingdom) 4 907 7 946
Given the extent to which the recoverable amounts of the Spur Franchise operations, Panarottis Franchise operations and John Dory's Franchise operations cash-generating units exceed their carrying amounts, the directors note that there are no reasonably possible changes to the assumptions used in determining the respective recoverable amounts that would cause the recoverable amounts to reduce below their respective carrying amounts.
The carrying amount of the Captain DoRegos Franchise operations cash-generating unit was impaired, during the year, to its recoverable amount as detailed in note 12.1 above.
Given that the RocoMamas Franchise operation was acquired by the group on 1 March 2015 and the business combination purchase price allocation detailed in note 34.1 was determined with reference to financial information up to the reporting date, the directors have determined that the recoverable amount of the cash-generating unit approximates its carrying amount.
The recoverable amount of the Silver Lake Spur cash-generating unit was determined with reference to its fair value less costs of disposal as detailed in note 12.2. The fair value was determined with reference to an actual disposal on 15 July 2015 (as detailed in note 44.2). There are consequently no reasonably possible changes to the assumptions made that would cause the recoverable amount of the cash-generating unit to reduce below its carrying amount.
In respect of The Hussar Grill Franchise and Retail operations, management has identified that a reasonably possible change in two key assumptions, being the discount rate and growth in restaurant turnovers (as detailed in notes 12.1 and 12.2 above), could cause the carrying amounts of the respective cash-generating units to exceed their respective recoverable amounts. The following table shows the amount by which the key assumptions would need to change individually for the estimated recoverable amounts of the respective cash-generating units to be equal to their respective carrying amounts:
Increase/(decrease) in assumption
The Hussar Grill Franchise
operations
The Hussar Grill Retail operations
Discount rate (%) 12.8 23.0 Growth in restaurant turnover (%) (11.4) (12.8)
NOTES TO THE CONSOLIDATED FINANCIAL STATEMENTS

Spur Corporation Ltd Integrated Report 2015110
13. INTEREST IN EQUITY-ACCOUNTED INVESTEE
2015 2014 R’000 R’000
Balance at beginning of year 21 – Acquisition of equity-accounted investee (refer note 33) – 400 Share of loss of equity-accounted investee (net of income tax) (21) (379)Balance at end of year – 21
Net investment in equity-accounted investee for the purposes of recognising subsequent losses:
Carrying value of equity-accounted investee – 21 Loan to equity-accounted investee (refer note 14.2) 39 161 37 188
Gross loan 40 773 37 188 Cumulative share of loss of equity-accounted investee (net of income tax) (1 612) –
Total net investment in equity-accounted investee 39 161 37 209
Allocation of share of loss of equity-accounted investee (net of income tax):Allocated to interest in equity-accounted investee (21) (379)Allocated to loan to equity-accounted investee (1 612) – Share of loss of equity-accounted investee (net of income tax) (1 633) (379)
The interest in equity-accounted investee comprises a 30% equity interest in associate Braviz Fine Foods (Pty) Ltd, a start-up rib manufacturing facility based in Johannesburg (South Africa) acquired with effect from 18 March 2014 (refer note 33). The entity commenced operations in January 2015. The loss incurred for the year relates primarily to interest on shareholder loans and start-up losses relating to the commencement of formal production.
No other comprehensive income is attributable to the equity-accounted investee.
Refer note 14.2 for details on restrictions on the ability of the associate to transfer cash to the group.
The following is summarised financial information for Braviz Fine Foods (Pty) Ltd based on its financial statements prepared in accordance with IFRS:
Non-current assets (100%) 167 038 50 355 Current assets (100%) 45 254 21 137 Non-current liabilities (100%) (160 162) (73 329)Current liabilities (100%) (59 522) (113)Net liabilities (100%) (7 392) (1 950)
Group’s share of net liabilities (30%) (2 218) (585)Goodwill implicit in carrying value of equity-accounted investee 606 606 Cumulative losses allocated to loan to equity-accounted investee 1 612 – Carrying amount of interest in associate – 21
Revenue (100%) 58 965 – Loss from continuing operations (100%) (5 442) (1 265)Other comprehensive income (100%) – – Total comprehensive income (100%) (5 442) (1 265)
Attributable to investee’s non-controlling interests (30%) (1 633) (379)Attributable to investee’s shareholders (3 809) (886)
Included in the net liabilities above are the following loans owed to the group:Shareholder loan (refer note 14.2) 40 773 37 188 Short-term bridging finance (refer note 14.3) 10 000 –

Spur Corporation Ltd Integrated Report 2015 111
14. LOANS RECEIVABLE
2015 2014 R’000 R’000
Total gross loans receivable at end of year 169 751 58 897 Cumulative share of loss of equity-accounted investee (net of tax) (refer note 13) (1 612) – Current portion included in current assets (25 143) (5 447) Total non-current loans receivable 142 996 53 450
These loans comprise:
14.1 AVECOR INVESTMENTS PTY LTDGross loan receivable at end of year 1 287 1 863 Current portion included in current assets (466) (496)Non-current portion 821 1 367
Avecor is the former 20% partner of the Panarottis Tuggerah Partnership (in which the group was an 80% partner), which previously operated the Panarottis outlet in Tuggerah (Australia). The partnership was dissolved during the prior year and certain of the assets sold to Avecor on loan account. Avecor continues to trade the Panarottis outlet in Tuggerah under franchise.
This loan is denominated in Australian dollars and at the reporting date amounted to AU$136 680 (2014: AU$186 179). The loan is interest free and secured by a personal suretyship from the sole shareholder of Avecor as well as a pledge of the shares in Avecor held by that shareholder. The loan is repayable in fixed monthly instalments of at least AU$4 125 per month with any balance on the loan being repayable on 5 October 2017 (unless the lease relating to the outlet is renewed by Avecor, in which case the fixed monthly payments will continue until the loan is repaid in full).
14.2 BRAVIZ FINE FOODS (PTY) LTD – 1Gross loan receivable at end of year 40 773 37 188 Cumulative share of loss of equity-accounted investee (net of tax) (refer note 13) (1 612) – Current portion included in current assets – – Non-current portion 39 161 37 188
This loan was granted on 18 March 2014 to an associate of the group (refer note 13). The loan bears interest at the prime overdraft rate of interest. This loan is intended to be part of the investment in the associate and, as such, there are no repayment terms and the loan is unsecured. However, the associate is contractually precluded from declaring any dividend until such time as it has repaid all shareholder loans. In the event that the associate repays any shareholder loan, it is contractually bound to repay all shareholders’ loans on a pro rata basis. No shareholder of the associate shall be permitted to demand repayment of the loan unless authorised by a special resolution of the shareholders of the associate. No such resolution has been passed.
14.3 BRAVIZ FINE FOODS (PTY) LTD – 2Gross loan receivable at end of year 10 000 – Current portion included in current assets (10 000) – Non-current portion – –
This loan was advanced during the year to serve as short-term bridging finance for the associate in question. The loan bears interest at 4% above the prime overdraft rate of interest and is secured by way of a cession of trade debtors and general notarial bond over moveable assets. The loan was due to be settled by 31 July 2015. However, subsequent to the reporting date, negotiations commenced between the parties to defer repayment of the loan, which negotiations have yet to be finalised. The directors are of the view that the loan is not impaired due to the extent of the security.
NOTES TO THE CONSOLIDATED FINANCIAL STATEMENTS
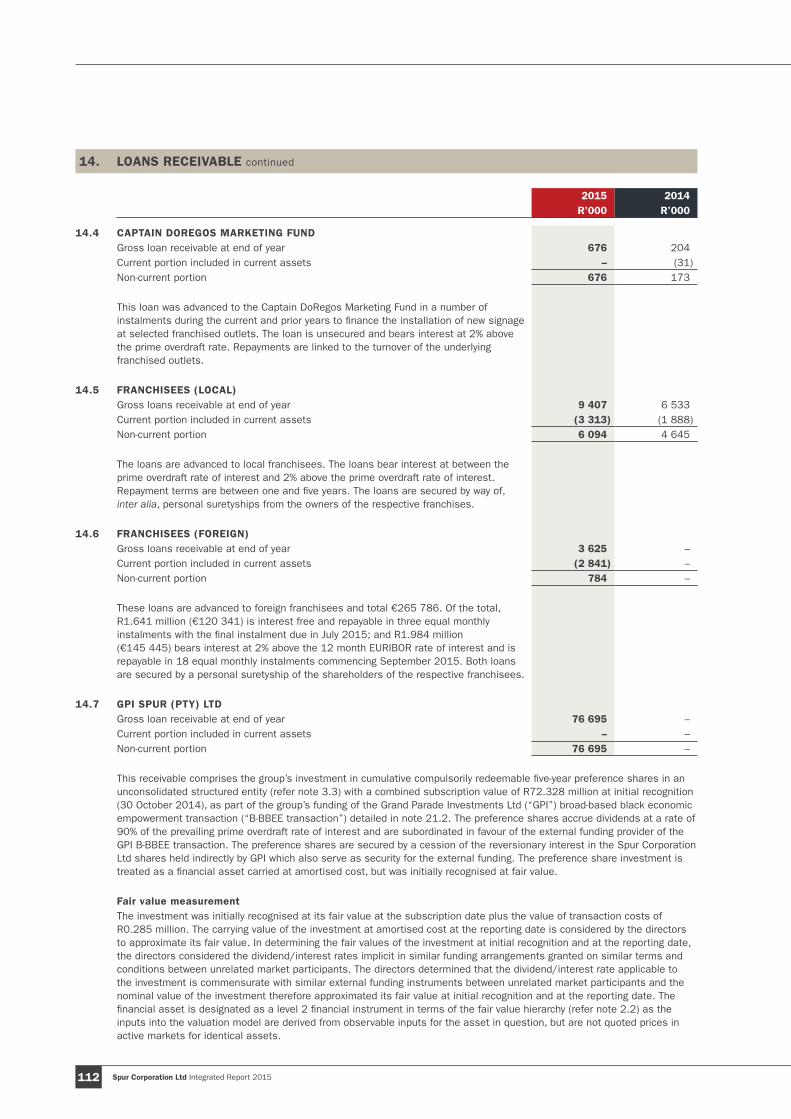
Spur Corporation Ltd Integrated Report 2015112
14. LOANS RECEIVABLE continued
2015 2014 R’000 R’000
14.4 CAPTAIN DOREGOS MARKETING FUNDGross loan receivable at end of year 676 204 Current portion included in current assets – (31) Non-current portion 676 173
This loan was advanced to the Captain DoRegos Marketing Fund in a number of instalments during the current and prior years to finance the installation of new signage at selected franchised outlets. The loan is unsecured and bears interest at 2% above the prime overdraft rate. Repayments are linked to the turnover of the underlying franchised outlets.
14.5 FRANCHISEES (LOCAL)Gross loans receivable at end of year 9 407 6 533 Current portion included in current assets (3 313) (1 888) Non-current portion 6 094 4 645
The loans are advanced to local franchisees. The loans bear interest at between the prime overdraft rate of interest and 2% above the prime overdraft rate of interest. Repayment terms are between one and five years. The loans are secured by way of, inter alia, personal suretyships from the owners of the respective franchises.
14.6 FRANCHISEES (FOREIGN)Gross loans receivable at end of year 3 625 – Current portion included in current assets (2 841) – Non-current portion 784 –
These loans are advanced to foreign franchisees and total €265 786. Of the total, R1.641 million (€120 341) is interest free and repayable in three equal monthly instalments with the final instalment due in July 2015; and R1.984 million (€145 445) bears interest at 2% above the 12 month EURIBOR rate of interest and is repayable in 18 equal monthly instalments commencing September 2015. Both loans are secured by a personal suretyship of the shareholders of the respective franchisees.
14.7 GPI SPUR (PTY) LTD Gross loan receivable at end of year 76 695 – Current portion included in current assets – – Non-current portion 76 695 –
This receivable comprises the group’s investment in cumulative compulsorily redeemable five-year preference shares in an unconsolidated structured entity (refer note 3.3) with a combined subscription value of R72.328 million at initial recognition (30 October 2014), as part of the group’s funding of the Grand Parade Investments Ltd (“GPI”) broad-based black economic empowerment transaction (“B-BBEE transaction”) detailed in note 21.2. The preference shares accrue dividends at a rate of 90% of the prevailing prime overdraft rate of interest and are subordinated in favour of the external funding provider of the GPI B-BBEE transaction. The preference shares are secured by a cession of the reversionary interest in the Spur Corporation Ltd shares held indirectly by GPI which also serve as security for the external funding. The preference share investment is treated as a financial asset carried at amortised cost, but was initially recognised at fair value.
Fair value measurementThe investment was initially recognised at its fair value at the subscription date plus the value of transaction costs of R0.285 million. The carrying value of the investment at amortised cost at the reporting date is considered by the directors to approximate its fair value. In determining the fair values of the investment at initial recognition and at the reporting date, the directors considered the dividend/interest rates implicit in similar funding arrangements granted on similar terms and conditions between unrelated market participants. The directors determined that the dividend/interest rate applicable to the investment is commensurate with similar external funding instruments between unrelated market participants and the nominal value of the investment therefore approximated its fair value at initial recognition and at the reporting date. The financial asset is designated as a level 2 financial instrument in terms of the fair value hierarchy (refer note 2.2) as the inputs into the valuation model are derived from observable inputs for the asset in question, but are not quoted prices in active markets for identical assets.

Spur Corporation Ltd Integrated Report 2015 113
2015 2014 R’000 R’000
14.8 HUNGA BUSTERS PTY LTDGross loan receivable at end of year 11 396 – Current portion included in current assets (1 499) – Non-current portion 9 897 –
This loan arose on the disposal of the shares in Panpen Pty Ltd and the disposal of the net assets of Silver Spur during the year as detailed in notes 35.2 and 35.3 respectively. The loan is denominated in Australian dollars and was recognised initially at AU$1 200 000 (R11.165 million), with a carrying value of AU$1 210 531 at the reporting date. The loan bears interest at 1.5% above the Reserve Bank of Australia’s cash rate of interest and is repayable in 60 equal monthly instalments commencing October 2015. The loan is secured by a pledge of the shares in Panpen Pty Ltd owned by the borrower as well as a pledge of the shares in the borrower from the shareholders of the borrower.
Fair value measurementThe receivable is treated as a financial asset carried at amortised cost but was initially recognised at its fair value at the disposal date of the businesses referred to above. The carrying value at amortised cost at the reporting date is considered by the directors to approximate its fair value. In determining the fair values of the receivable at initial recognition and at the reporting date, the directors considered the interest rates implicit in similar funding arrangements granted on similar terms and conditions between unrelated market participants. The directors determined that the interest rate applicable to the receivable is commensurate with similar receivables between unrelated market participants and the nominal values of the receivable therefore approximated their fair values at initial recognition and at the reporting date. The financial assets are designated as level 2 financial instruments in terms of the fair value hierarchy (refer note 2.2) as the inputs into the valuation model are derived from observable inputs for the assets in question, but are not quoted prices in active markets for identical assets.
14.9 MARKETING FUNDSGross loans receivable at end of year 2 497 89 Current portion included in current assets (2 497) (89)Non-current portion – –
The loans owing by marketing funds represent the net liabilities and cumulative over-spend of certain of the marketing funds as at the reporting date. The amounts are recovered through controlled under-spending of marketing funds in subsequent years. Refer note 39 for more details.
14.10 PANAWEST PTY LTDGross loan receivable at end of year 3 051 –Current portion included in current assets (1 269) –Non-current portion 1 782 –
This loan arose on the disposal of the shares in Panawest Pty Ltd during the year as detailed in note 35.1. The loan is denominated in Australian dollars and was recognised initially at AU$400 000 (R3.911 million), with a carrying value of AU$324 139 at the reporting date. The loan bears interest at a fixed 4.5% and is repayable in 35 equal monthly instalments which commenced December 2014. The loan is secured by a pledge of the shares in Panawest Pty Ltd owned by the borrower.
Fair value measurementThe receivable is treated as a financial asset carried at amortised cost but was initially recognised at its fair value at the disposal date of the business referred to above. The carrying value at amortised cost at the reporting date is considered by the directors to approximate its fair value. In determining the fair values of the receivable at initial recognition and at the reporting date, the directors considered the interest rates implicit in similar funding arrangements granted on similar terms and conditions between unrelated market participants. The directors determined that the interest rate applicable to the receivable is commensurate with similar receivables between unrelated market participants and the nominal values of the receivable therefore approximated their fair values at initial recognition and at the reporting date. The financial assets are designated as level 2 financial instruments in terms of the fair value hierarchy (refer note 2.2) as the inputs into the valuation model are derived from observable inputs for the assets in question, but are not quoted prices in active markets for identical assets.
NOTES TO THE CONSOLIDATED FINANCIAL STATEMENTS
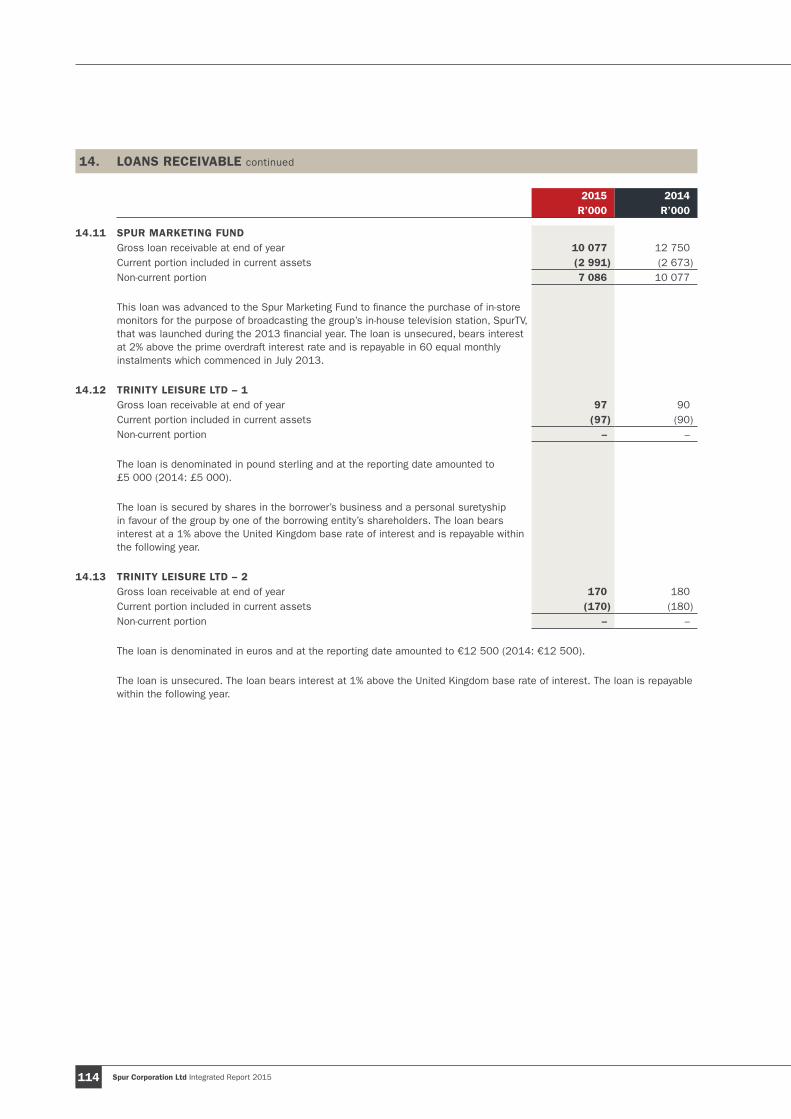
Spur Corporation Ltd Integrated Report 2015114
14. LOANS RECEIVABLE continued
2015 2014 R’000 R’000
14.11 SPUR MARKETING FUNDGross loan receivable at end of year 10 077 12 750 Current portion included in current assets (2 991) (2 673) Non-current portion 7 086 10 077
This loan was advanced to the Spur Marketing Fund to finance the purchase of in-store monitors for the purpose of broadcasting the group’s in-house television station, SpurTV, that was launched during the 2013 financial year. The loan is unsecured, bears interest at 2% above the prime overdraft interest rate and is repayable in 60 equal monthly instalments which commenced in July 2013.
14.12 TRINITY LEISURE LTD – 1Gross loan receivable at end of year 97 90 Current portion included in current assets (97) (90)Non-current portion – –
The loan is denominated in pound sterling and at the reporting date amounted to £5 000 (2014: £5 000).
The loan is secured by shares in the borrower’s business and a personal suretyship in favour of the group by one of the borrowing entity’s shareholders. The loan bears interest at a 1% above the United Kingdom base rate of interest and is repayable within the following year.
14.13 TRINITY LEISURE LTD – 2Gross loan receivable at end of year 170 180Current portion included in current assets (170) (180) Non-current portion – –
The loan is denominated in euros and at the reporting date amounted to €12 500 (2014: €12 500).
The loan is unsecured. The loan bears interest at 1% above the United Kingdom base rate of interest. The loan is repayable within the following year.

Spur Corporation Ltd Integrated Report 2015 115
NOTES TO THE CONSOLIDATED FINANCIAL STATEMENTS
15. DEFERRED TAX
Balance at beginning
of year
Recognised in profit or loss
Recognised in other compre-hensive income
Acquisition through business
combi-nation*
Transfer to tax payable
(UK group tax relief)#
Balance at end of year
R’000 R’000 R’000 R’000 R’000 R’000
2015Accruals 3 270 (629) – – – 2 641Derivative financial instruments (9 618) 1 727 – – – (7 891)Intangible assets (72 114) 2 595 – (1 328) – (70 847)Leasing rights (200) 33 (12) – – (179)Leave pay accrual 759 48 (3) – – 804Loans payable – (1 361) 11 – – (1 350)Long-term employee benefits 9 219 (1 207) – – – 8 012Operating lease liability 52 184 – – – 236Prepayments (339) 74 – – – (265)Property, plant and equipment 2 480 772 222 – – 3 474Short-term employee incentives – 2 794 – – – 2 794Tax losses 3 505 (573) (2 237) – (683) 12– The Netherlands (at 25%
(2014: 25%)) 3 024 (787) (2 237) – – –– United Kingdom (at 20%
(2014: 20.75%)) 481 214 – – (683) 12
Total deferred tax assets/(liabilities) (62 986) 4 457 (2 019) (1 328) (683) (62 559)
Current year deferred tax charge 4 555Change in tax rate (98)Tax on foreign exchange gain on net
investments in foreign operations (2 084)Effect of foreign exchange
fluctuations 65
2014Accruals 1 384 1 886 – – – 3 270Derivative financial instruments (10 582) 964 – – – (9 618)Intangible assets (70 265) – – (1 849) – (72 114)Intellectual property – International 2 440 (2 623) 183 – – –Leasing rights (241) 84 (43) – – (200)Leave pay accrual 595 137 – 27 – 759Long-term employee benefits 7 886 1 333 – – – 9 219Operating lease liability 76 (24) – – – 52Prepayments (334) (5) – – – (339)Property, plant and equipment 2 930 (1 056) 606 – – 2 480Tax losses 3 174 710 65 – (444) 3 505– The Netherlands (at 25%
(2013: 25%)) 2 789 170 65 – – 3 024– United Kingdom (at 20.75%
(2013: 23%)) 385 540 – – (444) 481
Total deferred tax assets/(liabilities) (62 937) 1 406 811 (1 822) (444) (62 986)
Current year deferred tax charge 1 682Change in tax rate (276)Tax on foreign exchange gain on net
investments in foreign operations (220)Effect of foreign exchange
fluctuations 1 031
* Refer note 34# Refer note 31
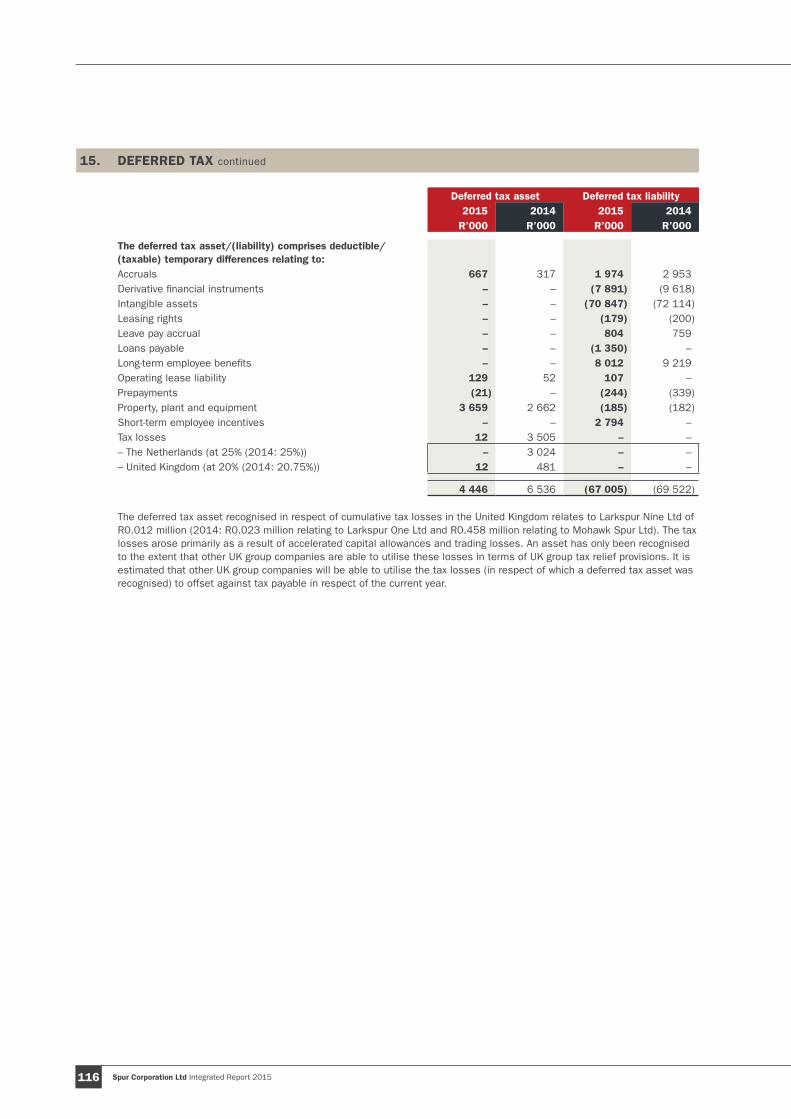
Spur Corporation Ltd Integrated Report 2015116
15. DEFERRED TAX continued
Deferred tax asset Deferred tax liability2015 2014 2015 2014
R’000 R’000 R’000 R’000
The deferred tax asset/(liability) comprises deductible/(taxable) temporary differences relating to:Accruals 667 317 1 974 2 953Derivative financial instruments – – (7 891) (9 618)Intangible assets – – (70 847) (72 114)Leasing rights – – (179) (200)Leave pay accrual – – 804 759Loans payable – – (1 350) –Long-term employee benefits – – 8 012 9 219Operating lease liability 129 52 107 –Prepayments (21) – (244) (339)Property, plant and equipment 3 659 2 662 (185) (182)Short-term employee incentives – – 2 794 –Tax losses 12 3 505 – –– The Netherlands (at 25% (2014: 25%)) – 3 024 – –– United Kingdom (at 20% (2014: 20.75%)) 12 481 – –
4 446 6 536 (67 005) (69 522)
The deferred tax asset recognised in respect of cumulative tax losses in the United Kingdom relates to Larkspur Nine Ltd of R0.012 million (2014: R0.023 million relating to Larkspur One Ltd and R0.458 million relating to Mohawk Spur Ltd). The tax losses arose primarily as a result of accelerated capital allowances and trading losses. An asset has only been recognised to the extent that other UK group companies are able to utilise these losses in terms of UK group tax relief provisions. It is estimated that other UK group companies will be able to utilise the tax losses (in respect of which a deferred tax asset was recognised) to offset against tax payable in respect of the current year.

Spur Corporation Ltd Integrated Report 2015 117
16. LEASING RIGHTS
2015 2014 R’000 R’000
Balance at beginning of year 3 352 5 290 Recognised in profit or loss before income tax (388) (2 574)
Monthly amortisation (388) (962)Accelerated amortisation – (1 612)
Effect of foreign exchange fluctuations (109) 636Balance at end of year 2 855 3 352
The leasing rights relate to:
– The premises occupied by Larkspur Seven Ltd, a wholly-owned subsidiary of the group operating the Two Rivers Spur in Staines (UK). The rights were acquired during the 2013 year as part of the acquisition of Trinity Leasing Ltd and were initially recognised at a value of £69 496 (the equivalent of R0.934 million). The value of the leasing rights is being expensed to profit or loss as part of the outlet’s rent expense over the remaining lease term which expires in December 2016.
– The premises occupied by Larkspur Eight Ltd, a wholly-owned subsidiary of the group operating the Rapid River Spur in Dublin (Ireland). The rights were acquired during the 2013 year for €206 763 (the equivalent of R2.453 million). The value of the leasing rights is being expensed to profit or loss as part of the outlet’s rent expense over the remaining lease term which expires in October 2023.
– The premises previously occupied by Mohawk Spur Ltd, a wholly-owned subsidiary of the group which previously operated the Mohawk Spur in Wandsworth (UK). The outlet in question ceased trading in February 2015. During the prior year, in considering the ability of the entity in question to continue trading, the group accelerated the amortisation of the leasing rights, resulting in a further charge of R1.612 million to profit or loss before income tax in that year.
17. DERIVATIVE FINANCIAL ASSETS/(LIABILITY)
2015 2014 R’000 R’000
Forward purchase contracts in respect of: – tranche 2 of share appreciation rights – 22 157 – tranche 3 of share appreciation rights 17 160 12 510 – tranche 4 of share appreciation rights 2 568 (319) – tranche 5 of share appreciation rights 8 453 –
28 181 34 348
Current portion included in current assets 17 160 22 157 Non-current portion included in non-current assets 11 021 12 510 Non-current portion included in non-current liabilities – (319)
28 181 34 348
The movement in the asset/(liability) during the year was as follows:Balance at beginning of year 34 348 37 790 Fair value gain recognised in profit or loss before income tax 14 794 17 922 Settled in cash from counterparty (19 725) (19 920)Refund of difference in guaranteed dividend from counterparty settled in cash (1 236) (1 444)Balance at end of year 28 181 34 348
The contracts were concluded to hedge the upside price risk of the Spur Corporation Ltd share price that the group is exposed to in respect of the share appreciation rights detailed in note 23. The forward purchase contracts for the second, third, fourth and fifth tranches of the share appreciation rights were concluded on 30 December 2011, 9 October 2012, 13 December 2013 and 15 December 2014 respectively.
The second tranche of share appreciation rights vested on 15 December 2014 and was settled in cash during the year. The related forward purchase contract matured on the same date resulting in a payment to the group from the counterparty as indicated above.
The fair values of the forward purchase contracts are determined at each reporting date and any changes in the values are recognised in profit or loss.
NOTES TO THE CONSOLIDATED FINANCIAL STATEMENTS
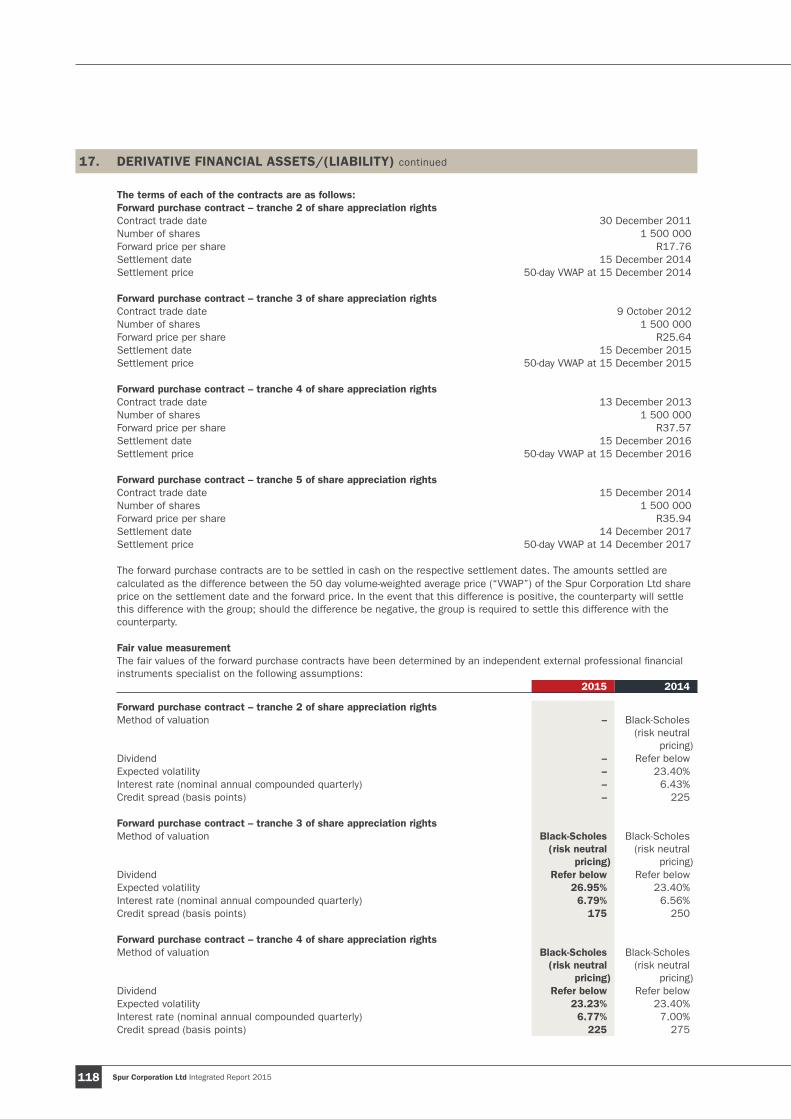
Spur Corporation Ltd Integrated Report 2015118
17. DERIVATIVE FINANCIAL ASSETS/(LIABILITY) continued
The terms of each of the contracts are as follows:Forward purchase contract – tranche 2 of share appreciation rightsContract trade date 30 December 2011Number of shares 1 500 000 Forward price per share R17.76Settlement date 15 December 2014Settlement price 50-day VWAP at 15 December 2014
Forward purchase contract – tranche 3 of share appreciation rightsContract trade date 9 October 2012Number of shares 1 500 000 Forward price per share R25.64Settlement date 15 December 2015Settlement price 50-day VWAP at 15 December 2015
Forward purchase contract – tranche 4 of share appreciation rightsContract trade date 13 December 2013Number of shares 1 500 000 Forward price per share R37.57Settlement date 15 December 2016Settlement price 50-day VWAP at 15 December 2016
Forward purchase contract – tranche 5 of share appreciation rightsContract trade date 15 December 2014Number of shares 1 500 000 Forward price per share R35.94Settlement date 14 December 2017Settlement price 50-day VWAP at 14 December 2017
The forward purchase contracts are to be settled in cash on the respective settlement dates. The amounts settled are calculated as the difference between the 50 day volume-weighted average price (“VWAP”) of the Spur Corporation Ltd share price on the settlement date and the forward price. In the event that this difference is positive, the counterparty will settle this difference with the group; should the difference be negative, the group is required to settle this difference with the counterparty.
Fair value measurementThe fair values of the forward purchase contracts have been determined by an independent external professional financial instruments specialist on the following assumptions:
2015 2014
Forward purchase contract – tranche 2 of share appreciation rightsMethod of valuation – Black-Scholes
(risk neutral pricing)
Dividend – Refer belowExpected volatility – 23.40%Interest rate (nominal annual compounded quarterly) – 6.43%Credit spread (basis points) – 225
Forward purchase contract – tranche 3 of share appreciation rightsMethod of valuation Black-Scholes
(risk neutral pricing)
Black-Scholes (risk neutral
pricing)Dividend Refer below Refer belowExpected volatility 26.95% 23.40%Interest rate (nominal annual compounded quarterly) 6.79% 6.56%Credit spread (basis points) 175 250
Forward purchase contract – tranche 4 of share appreciation rightsMethod of valuation Black-Scholes
(risk neutral pricing)
Black-Scholes (risk neutral
pricing) Dividend Refer below Refer below Expected volatility 23.23% 23.40%Interest rate (nominal annual compounded quarterly) 6.77% 7.00%Credit spread (basis points) 225 275
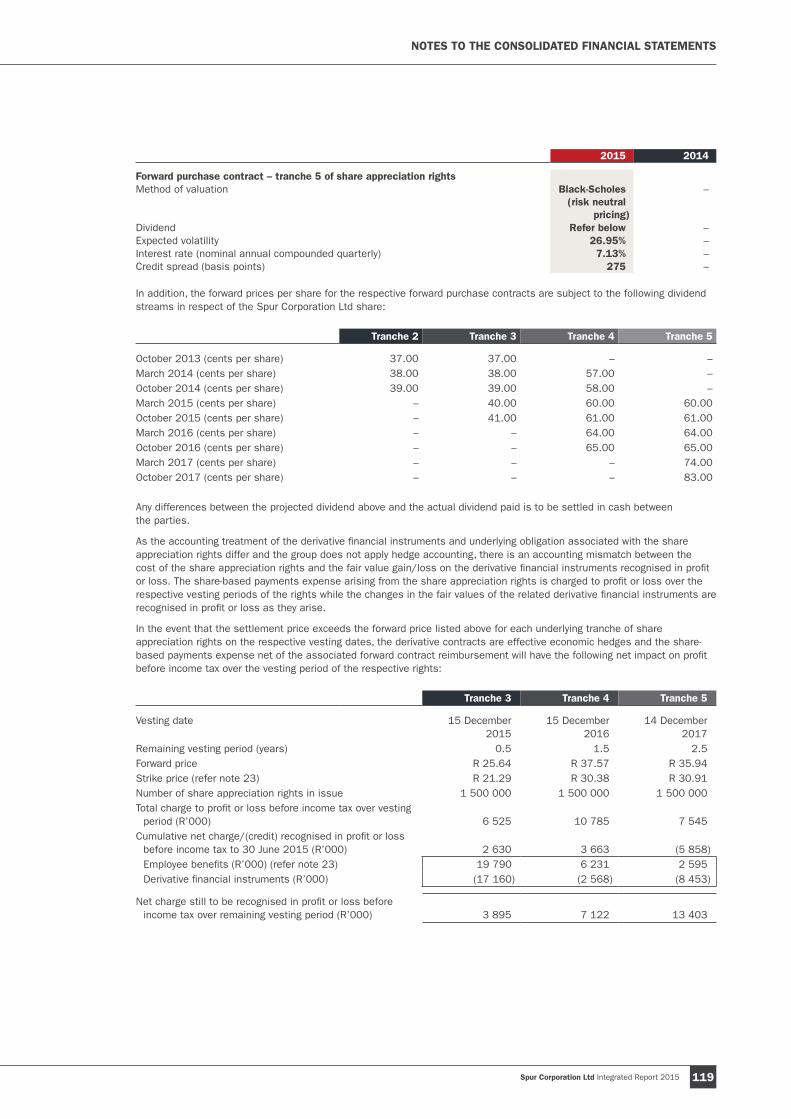
Spur Corporation Ltd Integrated Report 2015 119
2015 2014
Forward purchase contract – tranche 5 of share appreciation rightsMethod of valuation Black-Scholes
(risk neutral pricing)
–
Dividend Refer below – Expected volatility 26.95% – Interest rate (nominal annual compounded quarterly) 7.13% – Credit spread (basis points) 275 –
In addition, the forward prices per share for the respective forward purchase contracts are subject to the following dividend streams in respect of the Spur Corporation Ltd share:
Tranche 2 Tranche 3 Tranche 4 Tranche 5
October 2013 (cents per share) 37.00 37.00 – – March 2014 (cents per share) 38.00 38.00 57.00 – October 2014 (cents per share) 39.00 39.00 58.00 – March 2015 (cents per share) – 40.00 60.00 60.00October 2015 (cents per share) – 41.00 61.00 61.00March 2016 (cents per share) – – 64.00 64.00October 2016 (cents per share) – – 65.00 65.00March 2017 (cents per share) – – – 74.00October 2017 (cents per share) – – – 83.00
Any differences between the projected dividend above and the actual dividend paid is to be settled in cash between the parties.
As the accounting treatment of the derivative financial instruments and underlying obligation associated with the share appreciation rights differ and the group does not apply hedge accounting, there is an accounting mismatch between the cost of the share appreciation rights and the fair value gain/loss on the derivative financial instruments recognised in profit or loss. The share-based payments expense arising from the share appreciation rights is charged to profit or loss over the respective vesting periods of the rights while the changes in the fair values of the related derivative financial instruments are recognised in profit or loss as they arise.
In the event that the settlement price exceeds the forward price listed above for each underlying tranche of share appreciation rights on the respective vesting dates, the derivative contracts are effective economic hedges and the share-based payments expense net of the associated forward contract reimbursement will have the following net impact on profit before income tax over the vesting period of the respective rights:
Tranche 3 Tranche 4 Tranche 5
Vesting date 15 December 2015
15 December 2016
14 December 2017
Remaining vesting period (years) 0.5 1.5 2.5Forward price R 25.64 R 37.57 R 35.94Strike price (refer note 23) R 21.29 R 30.38 R 30.91Number of share appreciation rights in issue 1 500 000 1 500 000 1 500 000 Total charge to profit or loss before income tax over vesting
period (R’000) 6 525 10 785 7 545 Cumulative net charge/(credit) recognised in profit or loss
before income tax to 30 June 2015 (R’000) 2 630 3 663 (5 858)Employee benefits (R’000) (refer note 23) 19 790 6 231 2 595 Derivative financial instruments (R’000) (17 160) (2 568) (8 453)
Net charge still to be recognised in profit or loss before income tax over remaining vesting period (R’000) 3 895 7 122 13 403
NOTES TO THE CONSOLIDATED FINANCIAL STATEMENTS
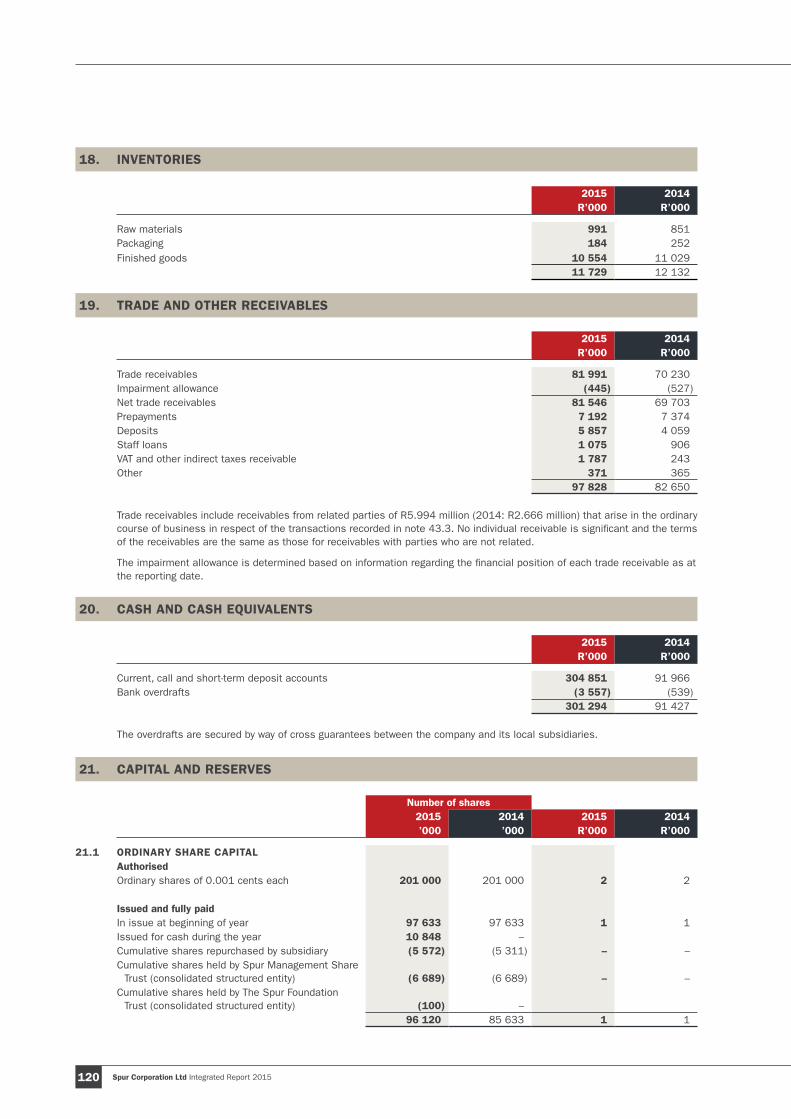
Spur Corporation Ltd Integrated Report 2015120
18. INVENTORIES
2015 2014 R’000 R’000
Raw materials 991 851Packaging 184 252Finished goods 10 554 11 029
11 729 12 132
19. TRADE AND OTHER RECEIVABLES
2015 2014 R’000 R’000
Trade receivables 81 991 70 230Impairment allowance (445) (527)Net trade receivables 81 546 69 703Prepayments 7 192 7 374Deposits 5 857 4 059Staff loans 1 075 906VAT and other indirect taxes receivable 1 787 243Other 371 365
97 828 82 650
Trade receivables include receivables from related parties of R5.994 million (2014: R2.666 million) that arise in the ordinary course of business in respect of the transactions recorded in note 43.3. No individual receivable is significant and the terms of the receivables are the same as those for receivables with parties who are not related.
The impairment allowance is determined based on information regarding the financial position of each trade receivable as at the reporting date.
20. CASH AND CASH EQUIVALENTS
2015 2014 R’000 R’000
Current, call and short-term deposit accounts 304 851 91 966Bank overdrafts (3 557) (539)
301 294 91 427
The overdrafts are secured by way of cross guarantees between the company and its local subsidiaries.
21. CAPITAL AND RESERVES
Number of shares2015 2014 2015 2014 ’000 ’000 R’000 R’000
21.1 ORDINARY SHARE CAPITALAuthorisedOrdinary shares of 0.001 cents each 201 000 201 000 2 2
Issued and fully paidIn issue at beginning of year 97 633 97 633 1 1 Issued for cash during the year 10 848 – Cumulative shares repurchased by subsidiary (5 572) (5 311) – – Cumulative shares held by Spur Management Share
Trust (consolidated structured entity) (6 689) (6 689) – – Cumulative shares held by The Spur Foundation
Trust (consolidated structured entity) (100) – 96 120 85 633 1 1

Spur Corporation Ltd Integrated Report 2015 121
The ordinary shares have equal rights to dividends declared by the company.
In terms of the company’s Memorandum of Incorporation, the unissued shares of the company may be issued by the directors of the company only with the approval of the shareholders by way of an ordinary resolution passed at a general meeting. No such authority has been granted.
The company does not have any unlisted shares.
21.2 ISSUE OF ORDINARY SHARES RELATING TO GPI B-BBEE SHARE TRANSACTIONAs detailed in the circular to shareholders of 4 September 2014, and approved by shareholders at a general meeting on 3 October 2014, the company concluded various agreements to issue 10 848 093 new ordinary shares indirectly to Grand Parade Investments Ltd (“GPI”), a strategic black empowerment partner, and separately donate 500 000 of the company’s shares (100 000 shares per annum over five years), held as treasury shares, to the Spur Foundation, a benevolent foundation that is a consolidated structured entity. Both transactions were executed on 30 October 2014. In terms of the agreements, GPI is restricted from trading the shares in question without the express permission of the company for a period of five years from the effective date of the transaction and is furthermore required to maintain its broad-based black economic empowerment credentials for the same period.
The shares were issued at a price of R27.16 per share, representing a 10% discount to the volume-weighted average trading price of the company’s shares on the JSE for the 90 trading days prior to 30 July 2014, resulting in the aggregate proceeds from the issue of shares amounting to R294.657 million. The market price of the shares on 30 October 2014 was R30.20 per share, equating to an effective discount of R32.957 million in aggregate. This discount has been recognised as a share-based payment expense in accordance with IFRS2 – Share-based Payments and included in profit before income tax for the period, with a corresponding credit to equity (retained earnings).
The group partially funded GPI’s share acquisition through a subscription of cumulative compulsorily redeemable five-year preference shares in an unconsolidated structured entity with a combined subscription value of R72.328 million (representing 24.5% of the total funding requirement for the transaction) (refer note 14.7). GPI has funded 24.5% of the total funding requirement and an external funding provider has funded the balance of 51% of the total funding requirement.
The transaction resulted in a net cash inflow of R222.328 million for the group.
Of the total transaction costs of R1.577 million: R0.285 million relate directly to the subscription of the preference shares referred to above and are included in the carrying value of the preference shares; R0.991 million relate directly to the issue of the company’s ordinary shares and have been charged directly against equity (retained earnings); and the balance of R0.301 million is included in profit before income tax.
21.3 SHARES REPURCHASED BY SUBSIDIARIESDuring the year, a wholly-owned subsidiary of the company, Share Buy-back (Pty) Ltd, acquired 361 273 (2014: nil) Spur Corporation Ltd shares at an average cost of R31.52 per share, totalling R11.387 million. In addition, as referred to above, 100 000 shares were transferred to the Spur Foundation Trust. At the reporting date, the group owns 5 572 401 (2014: 5 311 128) Spur Corporation Ltd treasury shares, held by Share Buy-back (Pty) Ltd, at a total cost of R79.977 million (2014: R70.057 million).
The balance per the statement of financial position comprises the cost of the Spur Corporation Ltd shares that have been repurchased by Share Buy-back (Pty) Ltd, those held by the Spur Management Share Trust, a consolidated structured entity, for the purposes of the group’s short-term profit share incentive scheme (refer note 25) and those held by The Spur Foundation Trust, a consolidated structured entity. At the reporting date, the entities in question held 12 361 099 (2014: 11 999 826) of the company’s shares in aggregate.
21.4 FOREIGN CURRENCY TRANSLATION RESERVEThe foreign currency translation reserve comprises all foreign currency differences arising from the translation of the financial statements of foreign operations as well as foreign exchange gains/losses relating to loans that are considered part of the net investments in foreign operations.
NOTES TO THE CONSOLIDATED FINANCIAL STATEMENTS
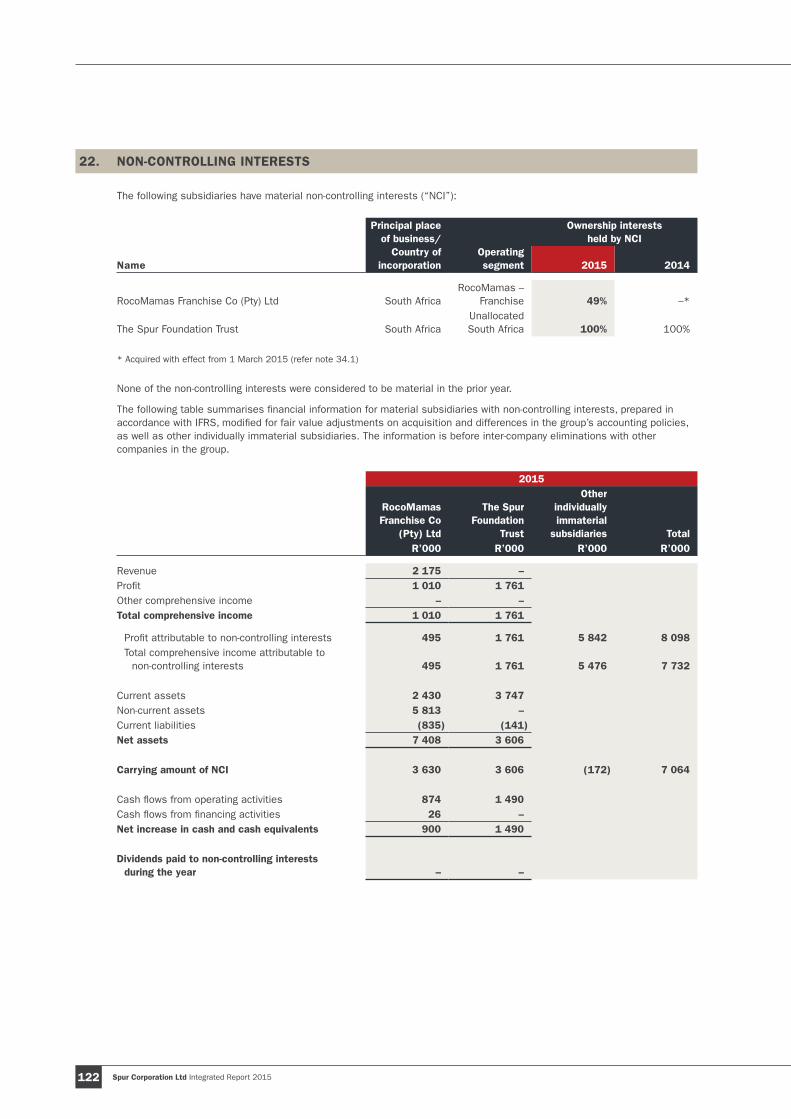
Spur Corporation Ltd Integrated Report 2015122
22. NON-CONTROLLING INTERESTS
The following subsidiaries have material non-controlling interests (“NCI”):
Name
Principal place of business/
Country ofincorporation
Operating segment
Ownership interests held by NCI
2015 2014
RocoMamas Franchise Co (Pty) Ltd South AfricaRocoMamas –
Franchise 49% –*
The Spur Foundation Trust South AfricaUnallocated
South Africa 100% 100%
* Acquired with effect from 1 March 2015 (refer note 34.1)
None of the non-controlling interests were considered to be material in the prior year.
The following table summarises financial information for material subsidiaries with non-controlling interests, prepared in accordance with IFRS, modified for fair value adjustments on acquisition and differences in the group’s accounting policies, as well as other individually immaterial subsidiaries. The information is before inter-company eliminations with other companies in the group.
2015
RocoMamas Franchise Co
(Pty) Ltd
The Spur Foundation
Trust
Other individually immaterial
subsidiaries TotalR’000 R’000 R’000 R’000
Revenue 2 175 – Profit 1 010 1 761 Other comprehensive income – – Total comprehensive income 1 010 1 761
Profit attributable to non-controlling interests 495 1 761 5 842 8 098 Total comprehensive income attributable to
non-controlling interests 495 1 761 5 476 7 732
Current assets 2 430 3 747Non-current assets 5 813 – Current liabilities (835) (141)Net assets 7 408 3 606
Carrying amount of NCI 3 630 3 606 (172) 7 064
Cash flows from operating activities 874 1 490 Cash flows from financing activities 26 – Net increase in cash and cash equivalents 900 1 490
Dividends paid to non-controlling interests during the year – –
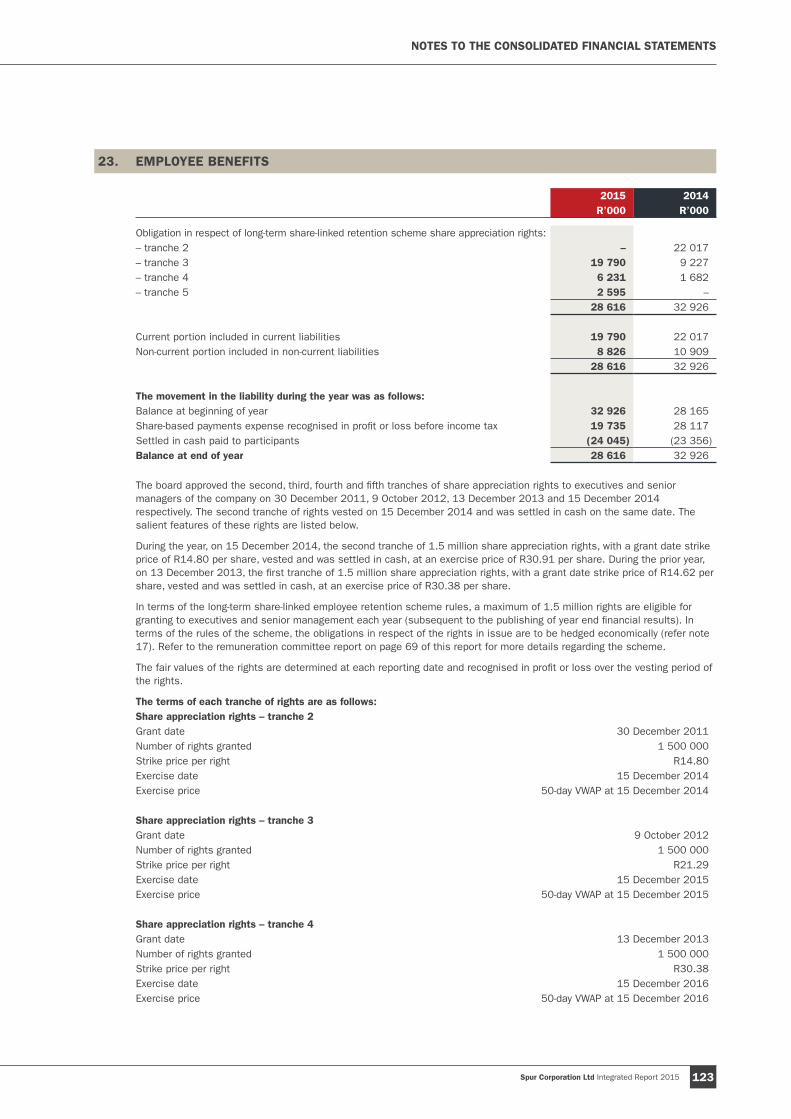
Spur Corporation Ltd Integrated Report 2015 123
23. EMPLOYEE BENEFITS
2015 2014 R’000 R’000
Obligation in respect of long-term share-linked retention scheme share appreciation rights:– tranche 2 – 22 017 – tranche 3 19 790 9 227 – tranche 4 6 231 1 682 – tranche 5 2 595 –
28 616 32 926
Current portion included in current liabilities 19 790 22 017 Non-current portion included in non-current liabilities 8 826 10 909
28 616 32 926
The movement in the liability during the year was as follows:Balance at beginning of year 32 926 28 165 Share-based payments expense recognised in profit or loss before income tax 19 735 28 117 Settled in cash paid to participants (24 045) (23 356)Balance at end of year 28 616 32 926
The board approved the second, third, fourth and fifth tranches of share appreciation rights to executives and senior managers of the company on 30 December 2011, 9 October 2012, 13 December 2013 and 15 December 2014 respectively. The second tranche of rights vested on 15 December 2014 and was settled in cash on the same date. The salient features of these rights are listed below.
During the year, on 15 December 2014, the second tranche of 1.5 million share appreciation rights, with a grant date strike price of R14.80 per share, vested and was settled in cash, at an exercise price of R30.91 per share. During the prior year, on 13 December 2013, the first tranche of 1.5 million share appreciation rights, with a grant date strike price of R14.62 per share, vested and was settled in cash, at an exercise price of R30.38 per share.
In terms of the long-term share-linked employee retention scheme rules, a maximum of 1.5 million rights are eligible for granting to executives and senior management each year (subsequent to the publishing of year end financial results). In terms of the rules of the scheme, the obligations in respect of the rights in issue are to be hedged economically (refer note 17). Refer to the remuneration committee report on page 69 of this report for more details regarding the scheme.
The fair values of the rights are determined at each reporting date and recognised in profit or loss over the vesting period of the rights.
The terms of each tranche of rights are as follows:Share appreciation rights – tranche 2Grant date 30 December 2011Number of rights granted 1 500 000 Strike price per right R14.80Exercise date 15 December 2014Exercise price 50-day VWAP at 15 December 2014
Share appreciation rights – tranche 3Grant date 9 October 2012Number of rights granted 1 500 000 Strike price per right R21.29Exercise date 15 December 2015Exercise price 50-day VWAP at 15 December 2015
Share appreciation rights – tranche 4Grant date 13 December 2013Number of rights granted 1 500 000 Strike price per right R30.38Exercise date 15 December 2016Exercise price 50-day VWAP at 15 December 2016
NOTES TO THE CONSOLIDATED FINANCIAL STATEMENTS
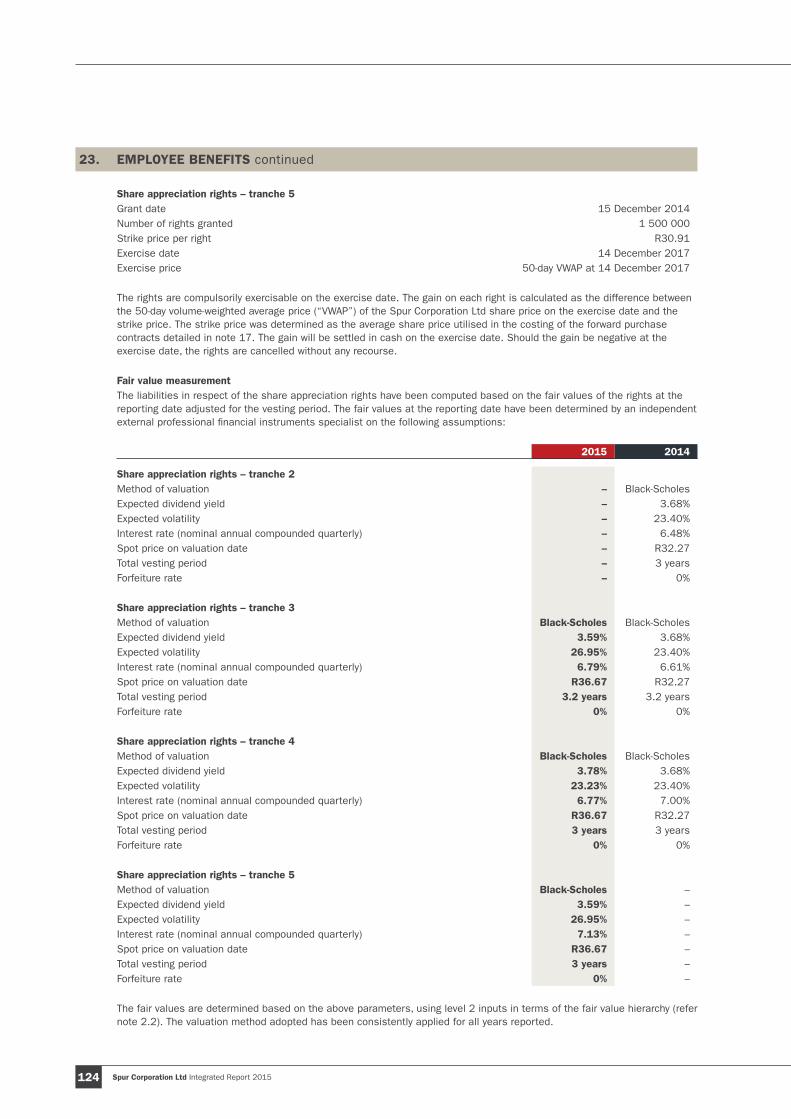
Spur Corporation Ltd Integrated Report 2015124
23. EMPLOYEE BENEFITS continued
Share appreciation rights – tranche 5Grant date 15 December 2014Number of rights granted 1 500 000 Strike price per right R30.91Exercise date 14 December 2017Exercise price 50-day VWAP at 14 December 2017
The rights are compulsorily exercisable on the exercise date. The gain on each right is calculated as the difference between the 50-day volume-weighted average price (“VWAP”) of the Spur Corporation Ltd share price on the exercise date and the strike price. The strike price was determined as the average share price utilised in the costing of the forward purchase contracts detailed in note 17. The gain will be settled in cash on the exercise date. Should the gain be negative at the exercise date, the rights are cancelled without any recourse.
Fair value measurementThe liabilities in respect of the share appreciation rights have been computed based on the fair values of the rights at the reporting date adjusted for the vesting period. The fair values at the reporting date have been determined by an independent external professional financial instruments specialist on the following assumptions:
2015 2014
Share appreciation rights – tranche 2Method of valuation – Black-ScholesExpected dividend yield – 3.68%Expected volatility – 23.40%Interest rate (nominal annual compounded quarterly) – 6.48%Spot price on valuation date – R32.27Total vesting period – 3 yearsForfeiture rate – 0%
Share appreciation rights – tranche 3Method of valuation Black-Scholes Black-ScholesExpected dividend yield 3.59% 3.68%Expected volatility 26.95% 23.40%Interest rate (nominal annual compounded quarterly) 6.79% 6.61%Spot price on valuation date R36.67 R32.27Total vesting period 3.2 years 3.2 yearsForfeiture rate 0% 0%
Share appreciation rights – tranche 4Method of valuation Black-Scholes Black-ScholesExpected dividend yield 3.78% 3.68%Expected volatility 23.23% 23.40%Interest rate (nominal annual compounded quarterly) 6.77% 7.00%Spot price on valuation date R36.67 R32.27Total vesting period 3 years 3 yearsForfeiture rate 0% 0%
Share appreciation rights – tranche 5Method of valuation Black-Scholes –Expected dividend yield 3.59% –Expected volatility 26.95% –Interest rate (nominal annual compounded quarterly) 7.13% –Spot price on valuation date R36.67 –Total vesting period 3 years –Forfeiture rate 0% –
The fair values are determined based on the above parameters, using level 2 inputs in terms of the fair value hierarchy (refer note 2.2). The valuation method adopted has been consistently applied for all years reported.
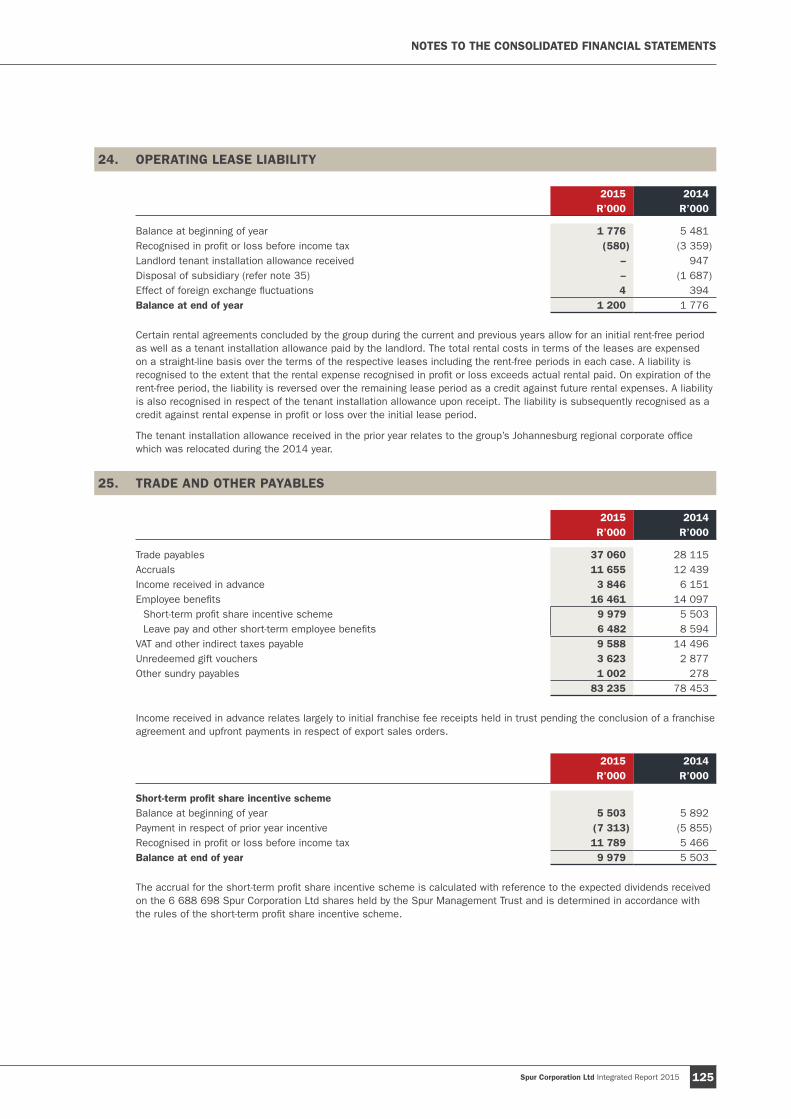
Spur Corporation Ltd Integrated Report 2015 125
24. OPERATING LEASE LIABILITY
2015 2014 R’000 R’000
Balance at beginning of year 1 776 5 481 Recognised in profit or loss before income tax (580) (3 359)Landlord tenant installation allowance received – 947 Disposal of subsidiary (refer note 35) – (1 687)Effect of foreign exchange fluctuations 4 394 Balance at end of year 1 200 1 776
Certain rental agreements concluded by the group during the current and previous years allow for an initial rent-free period as well as a tenant installation allowance paid by the landlord. The total rental costs in terms of the leases are expensed on a straight-line basis over the terms of the respective leases including the rent-free periods in each case. A liability is recognised to the extent that the rental expense recognised in profit or loss exceeds actual rental paid. On expiration of the rent-free period, the liability is reversed over the remaining lease period as a credit against future rental expenses. A liability is also recognised in respect of the tenant installation allowance upon receipt. The liability is subsequently recognised as a credit against rental expense in profit or loss over the initial lease period.
The tenant installation allowance received in the prior year relates to the group’s Johannesburg regional corporate office which was relocated during the 2014 year.
25. TRADE AND OTHER PAYABLES
2015 2014 R’000 R’000
Trade payables 37 060 28 115 Accruals 11 655 12 439 Income received in advance 3 846 6 151 Employee benefits 16 461 14 097
Short-term profit share incentive scheme 9 979 5 503 Leave pay and other short-term employee benefits 6 482 8 594
VAT and other indirect taxes payable 9 588 14 496 Unredeemed gift vouchers 3 623 2 877 Other sundry payables 1 002 278
83 235 78 453
Income received in advance relates largely to initial franchise fee receipts held in trust pending the conclusion of a franchise agreement and upfront payments in respect of export sales orders.
2015 2014 R’000 R’000
Short-term profit share incentive schemeBalance at beginning of year 5 503 5 892 Payment in respect of prior year incentive (7 313) (5 855)Recognised in profit or loss before income tax 11 789 5 466 Balance at end of year 9 979 5 503
The accrual for the short-term profit share incentive scheme is calculated with reference to the expected dividends received on the 6 688 698 Spur Corporation Ltd shares held by the Spur Management Trust and is determined in accordance with the rules of the short-term profit share incentive scheme.
NOTES TO THE CONSOLIDATED FINANCIAL STATEMENTS
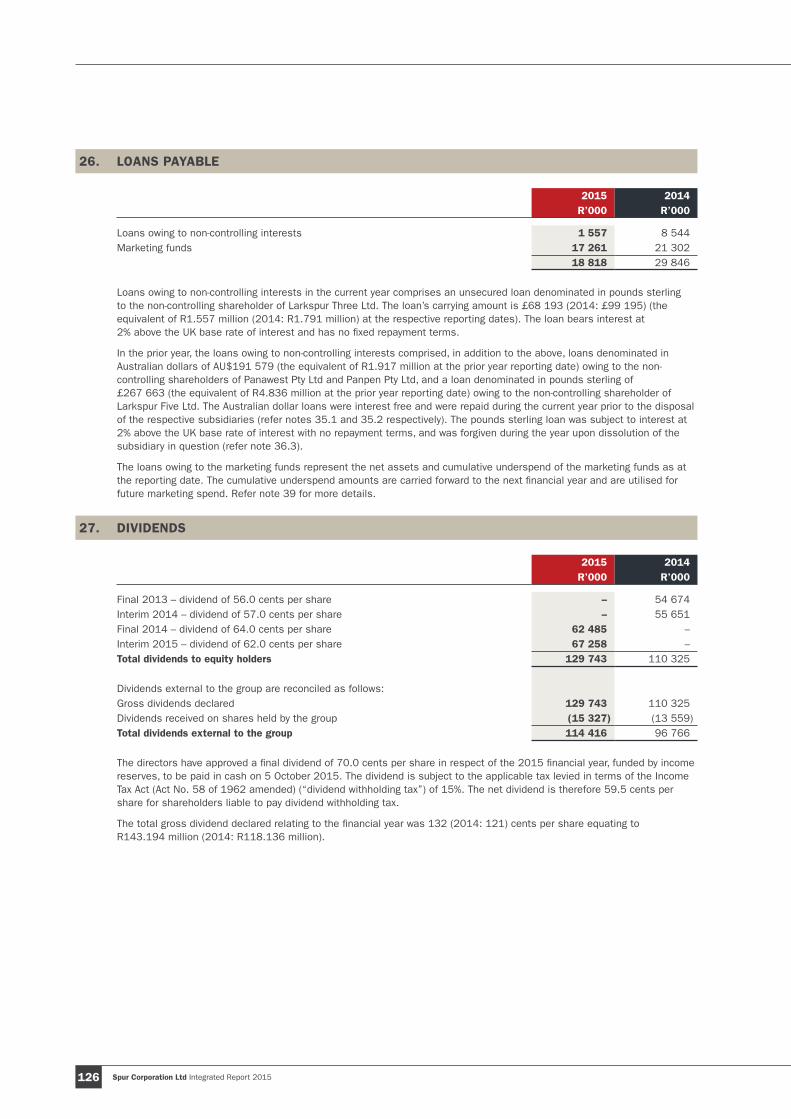
Spur Corporation Ltd Integrated Report 2015126
26. LOANS PAYABLE
2015 2014 R’000 R’000
Loans owing to non-controlling interests 1 557 8 544 Marketing funds 17 261 21 302
18 818 29 846
Loans owing to non-controlling interests in the current year comprises an unsecured loan denominated in pounds sterling to the non-controlling shareholder of Larkspur Three Ltd. The loan’s carrying amount is £68 193 (2014: £99 195) (the equivalent of R1.557 million (2014: R1.791 million) at the respective reporting dates). The loan bears interest at 2% above the UK base rate of interest and has no fixed repayment terms.
In the prior year, the loans owing to non-controlling interests comprised, in addition to the above, loans denominated in Australian dollars of AU$191 579 (the equivalent of R1.917 million at the prior year reporting date) owing to the non-controlling shareholders of Panawest Pty Ltd and Panpen Pty Ltd, and a loan denominated in pounds sterling of £267 663 (the equivalent of R4.836 million at the prior year reporting date) owing to the non-controlling shareholder of Larkspur Five Ltd. The Australian dollar loans were interest free and were repaid during the current year prior to the disposal of the respective subsidiaries (refer notes 35.1 and 35.2 respectively). The pounds sterling loan was subject to interest at 2% above the UK base rate of interest with no repayment terms, and was forgiven during the year upon dissolution of the subsidiary in question (refer note 36.3).
The loans owing to the marketing funds represent the net assets and cumulative underspend of the marketing funds as at the reporting date. The cumulative underspend amounts are carried forward to the next financial year and are utilised for future marketing spend. Refer note 39 for more details.
27. DIVIDENDS
2015 2014 R’000 R’000
Final 2013 – dividend of 56.0 cents per share – 54 674 Interim 2014 – dividend of 57.0 cents per share – 55 651 Final 2014 – dividend of 64.0 cents per share 62 485 – Interim 2015 – dividend of 62.0 cents per share 67 258 – Total dividends to equity holders 129 743 110 325
Dividends external to the group are reconciled as follows:Gross dividends declared 129 743 110 325 Dividends received on shares held by the group (15 327) (13 559)Total dividends external to the group 114 416 96 766
The directors have approved a final dividend of 70.0 cents per share in respect of the 2015 financial year, funded by income reserves, to be paid in cash on 5 October 2015. The dividend is subject to the applicable tax levied in terms of the Income Tax Act (Act No. 58 of 1962 amended) (“dividend withholding tax”) of 15%. The net dividend is therefore 59.5 cents per share for shareholders liable to pay dividend withholding tax.
The total gross dividend declared relating to the financial year was 132 (2014: 121) cents per share equating to R143.194 million (2014: R118.136 million).

Spur Corporation Ltd Integrated Report 2015 127
28. OPERATING PROFIT BEFORE WORKING CAPITAL CHANGES
2015 2014 R’000 R’000
Profit before income tax 205 421 201 871Adjusted for:
Amortisation – intangible assets (refer note 12) – 175 Amortisation – leasing rights (refer note 16) 388 2 574 Bad debts 327 653 Depreciation (refer note 11) 14 020 13 977 Fair value gain on derivative financial instruments at fair value through profit or loss
(refer note 17) (14 794) (17 922)Fair value loss on contingent consideration liability (refer note 34.1) 3 681 – Foreign exchange (gain)/loss (excluding gains/losses on intercompany accounts) (63) 1 076 Foreign currency translations not disclosed elsewhere in the cash flow statement (2 557) 2 047 Impairment of property, plant and equipment (refer note 11.1) 1 054 2 496 Impairment of intangible asset (refer note 12) 13 905 1 866 Interest expense 65 225 Interest income (24 681) (7 476)Loss on disposal of subsidiary (refer note 35.3) 4 545 – Movement in operating lease liability (refer note 24) (580) (3 359)Movement in trade receivable impairment allowance (82) 397 (Profit)/loss on disposal of property, plant and equipment (65) 444 Profit on disposal of subsidiaries (refer note 35.1, 35.2 and 35.4) (5 120) (2 154)Reclassification of foreign currency loss/(gain) from other comprehensive income to
profit or loss on abandonment/deregistration/disposal of foreign operations (refer notes 35 and 36) 2 215 (3 386)
Release of financial liability (refer note 36.3) (5 173) – Share-based payments expense – equity-settled – GPI B-BBEE transaction (refer
note 21.2) 32 957 – Share-based payments expense – cash settled – long-term share-linked employee
retention scheme (refer note 23) 19 735 28 117 Share-based payments cash settlement – long-term share-linked employee retention
scheme (refer note 23) (24 045) (23 356)Share of loss of equity-accounted investee (net of income tax) (refer note 13) 1 633 379
222 786 198 644
29. WORKING CAPITAL CHANGES
2015 2014 R’000 R’000
(Increase)/decrease in inventories (165) 5 302 Increase in trade and other receivables (15 547) (994)Increase/(decrease) in trade and other payables 9 165 (9 350)(Increase)/decrease in short-term loans receivable (2 321) 666 (Decrease)/increase in short-term loans payable (4 015) 8 347
(12 883) 3 971
NOTES TO THE CONSOLIDATED FINANCIAL STATEMENTS
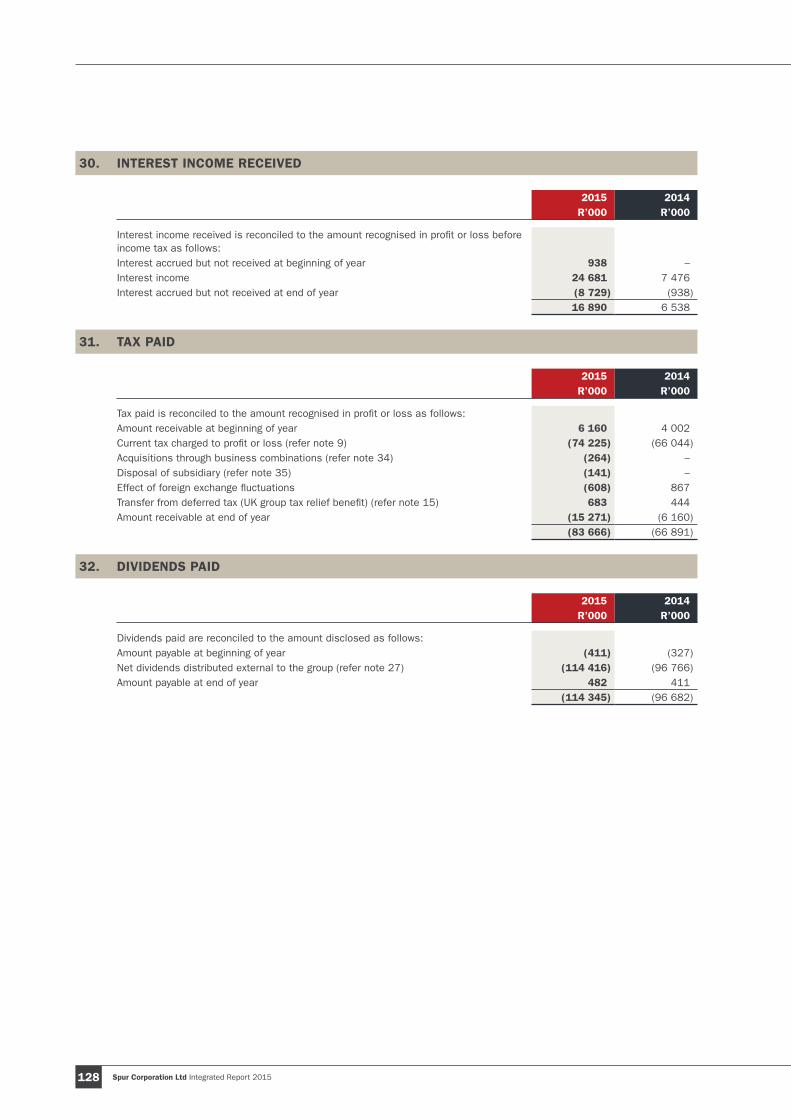
Spur Corporation Ltd Integrated Report 2015128
30. INTEREST INCOME RECEIVED
2015 2014 R’000 R’000
Interest income received is reconciled to the amount recognised in profit or loss before income tax as follows:Interest accrued but not received at beginning of year 938 – Interest income 24 681 7 476 Interest accrued but not received at end of year (8 729) (938)
16 890 6 538
31. TAX PAID
2015 2014 R’000 R’000
Tax paid is reconciled to the amount recognised in profit or loss as follows:Amount receivable at beginning of year 6 160 4 002 Current tax charged to profit or loss (refer note 9) (74 225) (66 044)Acquisitions through business combinations (refer note 34) (264) – Disposal of subsidiary (refer note 35) (141) – Effect of foreign exchange fluctuations (608) 867 Transfer from deferred tax (UK group tax relief benefit) (refer note 15) 683 444 Amount receivable at end of year (15 271) (6 160)
(83 666) (66 891)
32. DIVIDENDS PAID
2015 2014 R’000 R’000
Dividends paid are reconciled to the amount disclosed as follows:Amount payable at beginning of year (411) (327)Net dividends distributed external to the group (refer note 27) (114 416) (96 766)Amount payable at end of year 482 411
(114 345) (96 682)
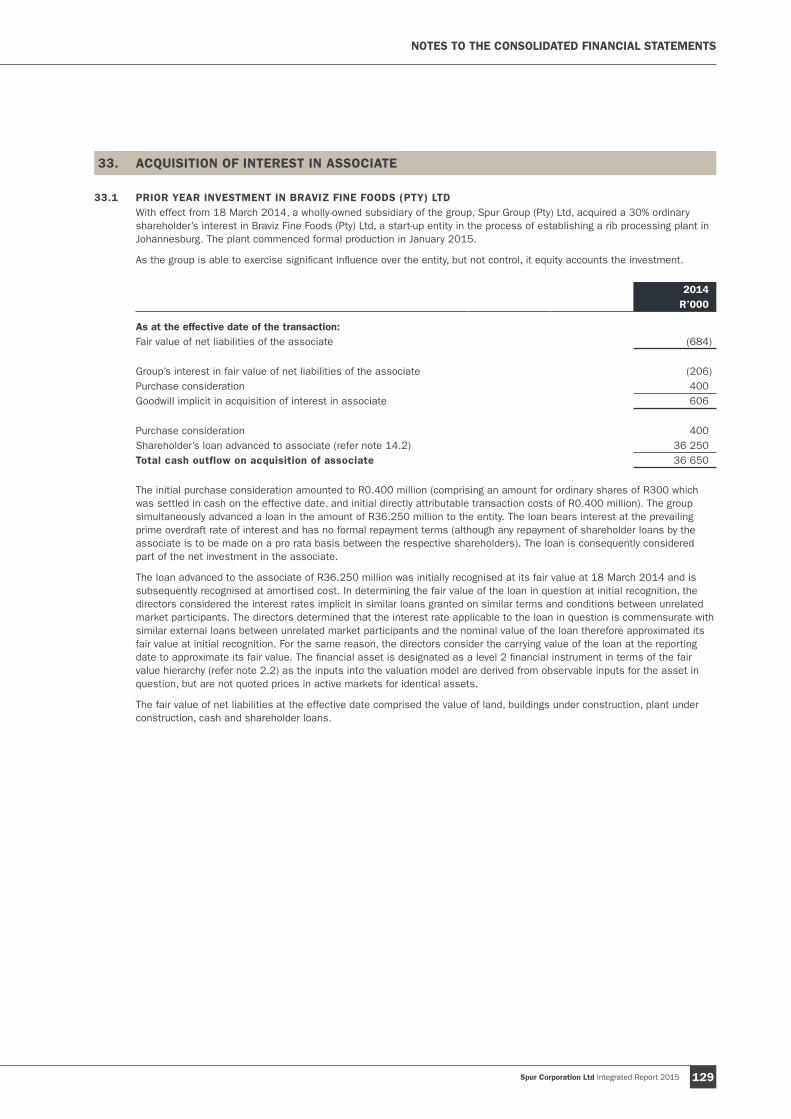
Spur Corporation Ltd Integrated Report 2015 129
33. ACQUISITION OF INTEREST IN ASSOCIATE
33.1 PRIOR YEAR INVESTMENT IN BRAVIZ FINE FOODS (PTY) LTDWith effect from 18 March 2014, a wholly-owned subsidiary of the group, Spur Group (Pty) Ltd, acquired a 30% ordinary shareholder’s interest in Braviz Fine Foods (Pty) Ltd, a start-up entity in the process of establishing a rib processing plant in Johannesburg. The plant commenced formal production in January 2015.
As the group is able to exercise significant influence over the entity, but not control, it equity accounts the investment.
2014 R’000
As at the effective date of the transaction:Fair value of net liabilities of the associate (684)
Group’s interest in fair value of net liabilities of the associate (206)Purchase consideration 400 Goodwill implicit in acquisition of interest in associate 606
Purchase consideration 400 Shareholder’s loan advanced to associate (refer note 14.2) 36 250 Total cash outflow on acquisition of associate 36 650
The initial purchase consideration amounted to R0.400 million (comprising an amount for ordinary shares of R300 which was settled in cash on the effective date, and initial directly attributable transaction costs of R0.400 million). The group simultaneously advanced a loan in the amount of R36.250 million to the entity. The loan bears interest at the prevailing prime overdraft rate of interest and has no formal repayment terms (although any repayment of shareholder loans by the associate is to be made on a pro rata basis between the respective shareholders). The loan is consequently considered part of the net investment in the associate.
The loan advanced to the associate of R36.250 million was initially recognised at its fair value at 18 March 2014 and is subsequently recognised at amortised cost. In determining the fair value of the loan in question at initial recognition, the directors considered the interest rates implicit in similar loans granted on similar terms and conditions between unrelated market participants. The directors determined that the interest rate applicable to the loan in question is commensurate with similar external loans between unrelated market participants and the nominal value of the loan therefore approximated its fair value at initial recognition. For the same reason, the directors consider the carrying value of the loan at the reporting date to approximate its fair value. The financial asset is designated as a level 2 financial instrument in terms of the fair value hierarchy (refer note 2.2) as the inputs into the valuation model are derived from observable inputs for the asset in question, but are not quoted prices in active markets for identical assets.
The fair value of net liabilities at the effective date comprised the value of land, buildings under construction, plant under construction, cash and shareholder loans.
NOTES TO THE CONSOLIDATED FINANCIAL STATEMENTS

Spur Corporation Ltd Integrated Report 2015130
34. ACQUISITIONS OF SUBSIDIARIES, NON-CONTROLLING INTERESTS AND BUSINESS COMBINATIONS
34.1 ACQUISITION OF ROCOMAMAS (BUSINESS COMBINATION)With effect from 1 March 2015, a wholly-owned subsidiary of the group, Spur Group (Pty) Ltd, acquired a 51% interest in RocoMamas Franchise Co (Pty) Ltd (“RocoMamas”), an entity owning the trademarks and related intellectual property of the RocoMamas brand. RocoMamas offers affordable, gourmet, hand-made “smash-style” burgers, ribs and wings in the casual dining market within a nostalgic American rock ambience, giving the group exposure to a market that its existing brands did not cater for directly. The company had five franchised outlets, based in Gauteng, at the date of acquisition.
2015 R’000
The fair values of the identifiable assets and liabilities acquired at the effective date were as follows:Intangible assets 7 114 Trade and other receivables 288 Inventory 38 Cash and cash equivalents 618 Trade and other payables (68)Tax payable (264)Deferred tax (1 328)Fair value of net assets acquired 6 398 Attributable to non-controlling interest (3 135)Group’s share of net assets acquired 3 263 Goodwill arising on acquisition 42 439 Total purchase consideration 45 702
In cash 2 000 Contingent consideration 43 702
Consideration settled in cash (2 000)Cash and cash equivalents acquired 618 Net cash flow on acquisition of subsidiary (1 382)
Contingent consideration liabilityArising from acquisition 43 702 Fair value adjustment recognised in profit or loss before income tax 3 681 Balance at end of year 47 383
Current portion included in current liabilities 15 974 Non-current portion included in non-current liabilities 31 409
Intangible assets comprise the RocoMamas trademarks and related intellectual property. The fair value was determined by an independent valuations expert utilising a discounted cash flow model based on the relief from royalty method. In this regard:
– the directors projected anticipated franchise restaurant sales for a forecast horizon of five years applying a reasonable rollout plan, and basing sales on historic averages increasing at 8% per annum;
– franchise restaurant sales beyond the forecast horizon were projected to grow at 5.5%, in line with the local inflation target of the South African Reserve Bank;
– a ‘royalty rate’ of 5.5% was applied to the projected franchise restaurant sales, where the royalty rate was considered reasonable as the range of royalty rates identified by an industry benchmarking exercise yielded a range of between 0.3% and 7%;
– the resulting ’royalty’ cash flow, adjusted for income tax of 28%, was discounted at an adjusted weighted average cost of capital of 27.8%;
Trade and other receivables comprise amounts receivable from franchisees in respect of inventory sales and franchise fees relating to trading in the month prior to acquisition. Given the short-term nature of the receivables and assessing subsequent collections, the contractual values of the receivables were deemed to approximate their fair values.
Inventory comprises largely sauces, clothing and marketing items for resale to franchisees. The inventory was valued at its replacement cost. Given the nature of the inventory, it is considered that the replacement cost is the most likely value to approximate the fair value of the inventory.
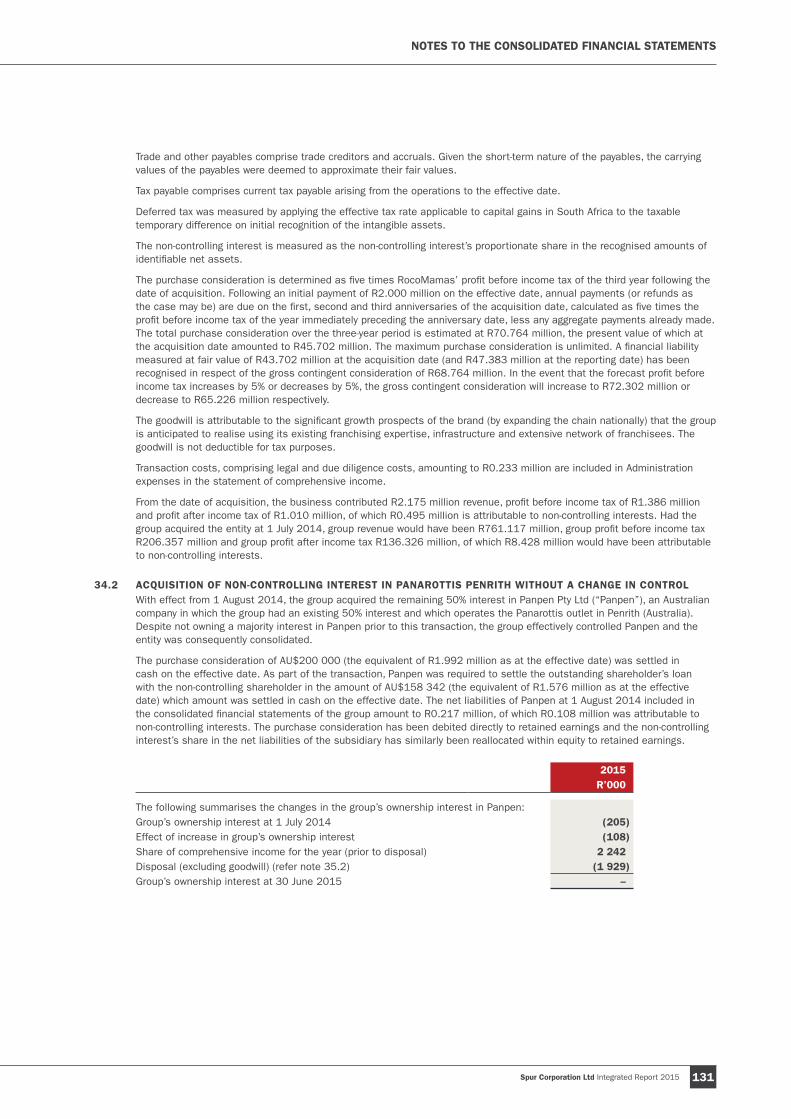
Spur Corporation Ltd Integrated Report 2015 131
Trade and other payables comprise trade creditors and accruals. Given the short-term nature of the payables, the carrying values of the payables were deemed to approximate their fair values.
Tax payable comprises current tax payable arising from the operations to the effective date.
Deferred tax was measured by applying the effective tax rate applicable to capital gains in South Africa to the taxable temporary difference on initial recognition of the intangible assets.
The non-controlling interest is measured as the non-controlling interest’s proportionate share in the recognised amounts of identifiable net assets.
The purchase consideration is determined as five times RocoMamas’ profit before income tax of the third year following the date of acquisition. Following an initial payment of R2.000 million on the effective date, annual payments (or refunds as the case may be) are due on the first, second and third anniversaries of the acquisition date, calculated as five times the profit before income tax of the year immediately preceding the anniversary date, less any aggregate payments already made. The total purchase consideration over the three-year period is estimated at R70.764 million, the present value of which at the acquisition date amounted to R45.702 million. The maximum purchase consideration is unlimited. A financial liability measured at fair value of R43.702 million at the acquisition date (and R47.383 million at the reporting date) has been recognised in respect of the gross contingent consideration of R68.764 million. In the event that the forecast profit before income tax increases by 5% or decreases by 5%, the gross contingent consideration will increase to R72.302 million or decrease to R65.226 million respectively.
The goodwill is attributable to the significant growth prospects of the brand (by expanding the chain nationally) that the group is anticipated to realise using its existing franchising expertise, infrastructure and extensive network of franchisees. The goodwill is not deductible for tax purposes.
Transaction costs, comprising legal and due diligence costs, amounting to R0.233 million are included in Administration expenses in the statement of comprehensive income.
From the date of acquisition, the business contributed R2.175 million revenue, profit before income tax of R1.386 million and profit after income tax of R1.010 million, of which R0.495 million is attributable to non-controlling interests. Had the group acquired the entity at 1 July 2014, group revenue would have been R761.117 million, group profit before income tax R206.357 million and group profit after income tax R136.326 million, of which R8.428 million would have been attributable to non-controlling interests.
34.2 ACQUISITION OF NON-CONTROLLING INTEREST IN PANAROTTIS PENRITH WITHOUT A CHANGE IN CONTROLWith effect from 1 August 2014, the group acquired the remaining 50% interest in Panpen Pty Ltd (“Panpen”), an Australian company in which the group had an existing 50% interest and which operates the Panarottis outlet in Penrith (Australia). Despite not owning a majority interest in Panpen prior to this transaction, the group effectively controlled Panpen and the entity was consequently consolidated.
The purchase consideration of AU$200 000 (the equivalent of R1.992 million as at the effective date) was settled in cash on the effective date. As part of the transaction, Panpen was required to settle the outstanding shareholder’s loan with the non-controlling shareholder in the amount of AU$158 342 (the equivalent of R1.576 million as at the effective date) which amount was settled in cash on the effective date. The net liabilities of Panpen at 1 August 2014 included in the consolidated financial statements of the group amount to R0.217 million, of which R0.108 million was attributable to non-controlling interests. The purchase consideration has been debited directly to retained earnings and the non-controlling interest’s share in the net liabilities of the subsidiary has similarly been reallocated within equity to retained earnings.
2015 R’000
The following summarises the changes in the group’s ownership interest in Panpen:Group’s ownership interest at 1 July 2014 (205)Effect of increase in group’s ownership interest (108)Share of comprehensive income for the year (prior to disposal) 2 242 Disposal (excluding goodwill) (refer note 35.2) (1 929)Group’s ownership interest at 30 June 2015 –
NOTES TO THE CONSOLIDATED FINANCIAL STATEMENTS
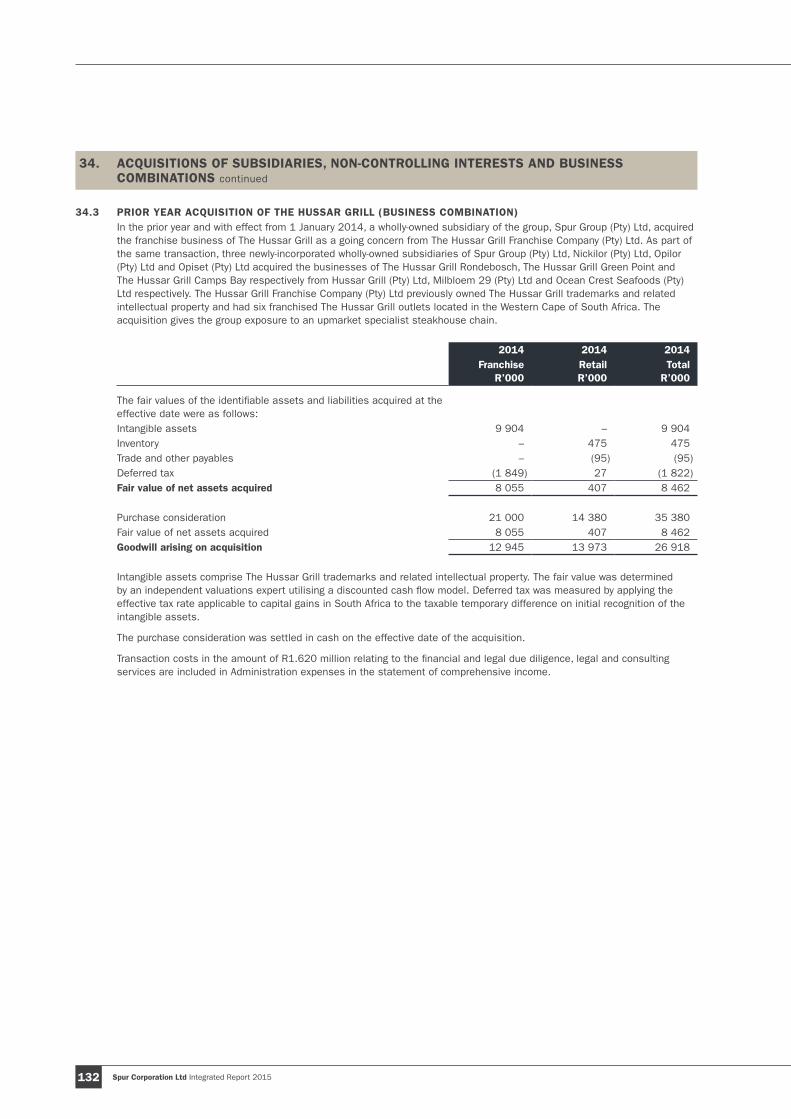
Spur Corporation Ltd Integrated Report 2015132
34. ACQUISITIONS OF SUBSIDIARIES, NON-CONTROLLING INTERESTS AND BUSINESS COMBINATIONS continued
34.3 PRIOR YEAR ACQUISITION OF THE HUSSAR GRILL (BUSINESS COMBINATION)In the prior year and with effect from 1 January 2014, a wholly-owned subsidiary of the group, Spur Group (Pty) Ltd, acquired the franchise business of The Hussar Grill as a going concern from The Hussar Grill Franchise Company (Pty) Ltd. As part of the same transaction, three newly-incorporated wholly-owned subsidiaries of Spur Group (Pty) Ltd, Nickilor (Pty) Ltd, Opilor (Pty) Ltd and Opiset (Pty) Ltd acquired the businesses of The Hussar Grill Rondebosch, The Hussar Grill Green Point and The Hussar Grill Camps Bay respectively from Hussar Grill (Pty) Ltd, Milbloem 29 (Pty) Ltd and Ocean Crest Seafoods (Pty) Ltd respectively. The Hussar Grill Franchise Company (Pty) Ltd previously owned The Hussar Grill trademarks and related intellectual property and had six franchised The Hussar Grill outlets located in the Western Cape of South Africa. The acquisition gives the group exposure to an upmarket specialist steakhouse chain.
2014 2014 2014Franchise
R’000RetailR’000
TotalR’000
The fair values of the identifiable assets and liabilities acquired at the effective date were as follows:Intangible assets 9 904 – 9 904 Inventory – 475 475 Trade and other payables – (95) (95)Deferred tax (1 849) 27 (1 822)Fair value of net assets acquired 8 055 407 8 462
Purchase consideration 21 000 14 380 35 380 Fair value of net assets acquired 8 055 407 8 462 Goodwill arising on acquisition 12 945 13 973 26 918
Intangible assets comprise The Hussar Grill trademarks and related intellectual property. The fair value was determined by an independent valuations expert utilising a discounted cash flow model. Deferred tax was measured by applying the effective tax rate applicable to capital gains in South Africa to the taxable temporary difference on initial recognition of the intangible assets.
The purchase consideration was settled in cash on the effective date of the acquisition.
Transaction costs in the amount of R1.620 million relating to the financial and legal due diligence, legal and consulting services are included in Administration expenses in the statement of comprehensive income.

Spur Corporation Ltd Integrated Report 2015 133
35. DISPOSALS OF SUBSIDIARIES
35.1 PANAROTTIS BLACKTOWN (AUSTRALIA)With effect from 15 November 2014, the group disposed of its 92.67% interest in Panawest Pty Ltd, the Australian subsidiary operating the Panarottis outlet in Blacktown, for AU$1, as part of its strategy to exit from company-owned restaurants in Australia. A new franchise agreement was concluded between the group and the entity disposed of and the entity continues to trade the restaurant in question.
2015 R’000
The carrying values of the assets/(liabilities) disposed of comprised:Property, plant and equipment 2 000 Inventory 128 Trade and other receivables 121 Tax receivable 141 Cash and cash equivalents 206 Trade and other payables (682)Loans payable (to the group) (3 911)Total carrying value of net liabilities disposed of (1 997)Attributable to non-controlling interest 146 Group’s share of net liabilities disposed of (1 851)Profit on disposal of subsidiary 1 851 Proceeds on disposal of subsidiary –
Consideration settled in cash – Cash and cash equivalents disposed of (206)Net cash flow on disposal of subsidiary (206)
In addition to the profit on disposal of the subsidiary, foreign exchange losses of R0.345 million arising on the translation of the foreign operation previously recognised in other comprehensive income (FCTR), were reclassified from other comprehensive income to profit before income tax, resulting in a net profit before income tax on disposal of R1.506 million. As part of the transaction, the former subsidiary will continue to repay the previous shareholder’s loan with the group of AU$400,000 (the equivalent of R3.911 million on the date of the transaction), in equal instalments over 35 months to October 2017.
The receivable relating to the disposal of AU$400 000 is treated as a financial asset carried at amortised cost but was initially recognised at its fair value at the disposal date (refer note 14.10).
The business contributed revenue for the period of R5.493 million (2014: R14.986 million) and a loss before income tax of R0.067 million (excluding the profit on disposal) (2014: R3.732 million (which included an impairment loss of R2.496 million)), of which profit of R0.263 million (2014: loss of R0.342 million) was attributable to non-controlling interests.
The profit on disposal is included in Other income, and the foreign exchange losses recycled from other comprehensive income to profit or loss before income tax are included in Administration expenses, in the statement of comprehensive income.
NOTES TO THE CONSOLIDATED FINANCIAL STATEMENTS

Spur Corporation Ltd Integrated Report 2015134
35. DISPOSALS OF SUBSIDIARIES continued
35.2 PANAROTTIS PENRITH (AUSTRALIA)With effect from 31 March 2015, the group disposed of its 100% interest in Panpen for AU$880 000, the equivalent of R8.188 million at the date of disposal, to Hunga Busters Pty Ltd, an unrelated entity, as part of its strategy to exit from company-owned restaurants in Australia. A new franchise agreement was concluded between the group and the entity disposed of and the entity continues to trade the restaurant in question.
2015 R’000
The carrying values of the assets/(liabilities) disposed of comprised:Goodwill 2 990 Property, plant and equipment 2 439 Inventory 169 Trade and other receivables 146 Cash and cash equivalents 155 Trade and other payables (980)Total carrying value of net assets disposed of 4 919 Profit on disposal of subsidiary 3 269 Proceeds on disposal of subsidiary 8 188
In cash – On loan account 8 188
Consideration settled in cash – Cash and cash equivalents disposed of (155)Net cash flow on disposal of subsidiary (155)
In addition to the profit on disposal of the subsidiary, foreign exchange gains of R0.179 million arising on the translation of the foreign operation previously recognised in other comprehensive income (FCTR), were reclassified from other comprehensive income to profit before income tax, resulting in a net profit before income tax on disposal of R3.448 million.
The sale consideration is to be settled in 60 equal monthly instalments commencing on 1 October 2015, with the receivable being subject to interest at the Reserve Bank of Australia’s cash rate plus 1.5%. The receivable relating to the disposal of AU$880 000 is treated as a financial asset carried at amortised cost but was initially recognised at its fair value at the disposal date (refer note 14.8).
The business contributed revenue for the period prior to disposal of R17.875 million (2014: R21.581 million) and a profit before and after income tax of 1.052 million (excluding the profit on disposal) (2014: R0.724 million), of which R0.095 million (2014: R0.362 million) is attributable to non-controlling interests.
The profit on disposal is included in Other income, and the foreign exchange gains recycled from other comprehensive income to profit or loss before income tax are included in Administration expenses, in the statement of comprehensive income.
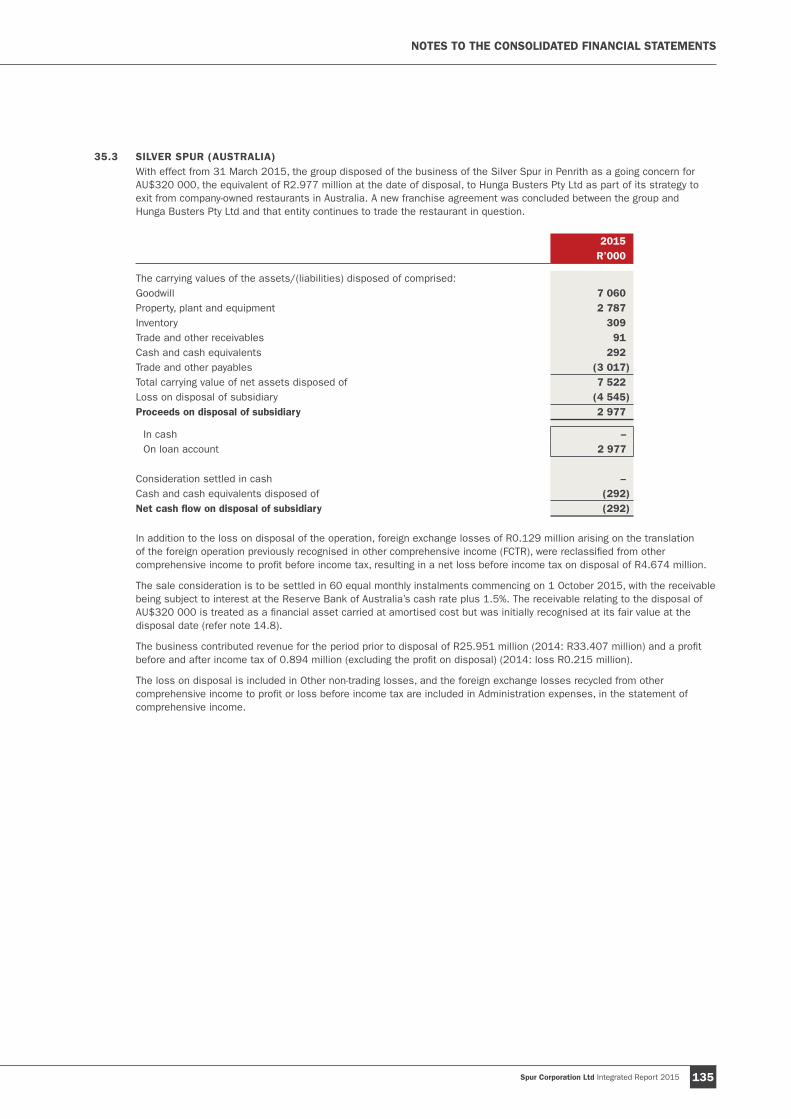
Spur Corporation Ltd Integrated Report 2015 135
35.3 SILVER SPUR (AUSTRALIA)With effect from 31 March 2015, the group disposed of the business of the Silver Spur in Penrith as a going concern for AU$320 000, the equivalent of R2.977 million at the date of disposal, to Hunga Busters Pty Ltd as part of its strategy to exit from company-owned restaurants in Australia. A new franchise agreement was concluded between the group and Hunga Busters Pty Ltd and that entity continues to trade the restaurant in question.
2015 R’000
The carrying values of the assets/(liabilities) disposed of comprised:Goodwill 7 060 Property, plant and equipment 2 787 Inventory 309 Trade and other receivables 91 Cash and cash equivalents 292 Trade and other payables (3 017)Total carrying value of net assets disposed of 7 522 Loss on disposal of subsidiary (4 545)Proceeds on disposal of subsidiary 2 977
In cash – On loan account 2 977
Consideration settled in cash – Cash and cash equivalents disposed of (292)Net cash flow on disposal of subsidiary (292)
In addition to the loss on disposal of the operation, foreign exchange losses of R0.129 million arising on the translation of the foreign operation previously recognised in other comprehensive income (FCTR), were reclassified from other comprehensive income to profit before income tax, resulting in a net loss before income tax on disposal of R4.674 million.
The sale consideration is to be settled in 60 equal monthly instalments commencing on 1 October 2015, with the receivable being subject to interest at the Reserve Bank of Australia’s cash rate plus 1.5%. The receivable relating to the disposal of AU$320 000 is treated as a financial asset carried at amortised cost but was initially recognised at its fair value at the disposal date (refer note 14.8).
The business contributed revenue for the period prior to disposal of R25.951 million (2014: R33.407 million) and a profit before and after income tax of 0.894 million (excluding the profit on disposal) (2014: loss R0.215 million).
The loss on disposal is included in Other non-trading losses, and the foreign exchange losses recycled from other comprehensive income to profit or loss before income tax are included in Administration expenses, in the statement of comprehensive income.
NOTES TO THE CONSOLIDATED FINANCIAL STATEMENTS
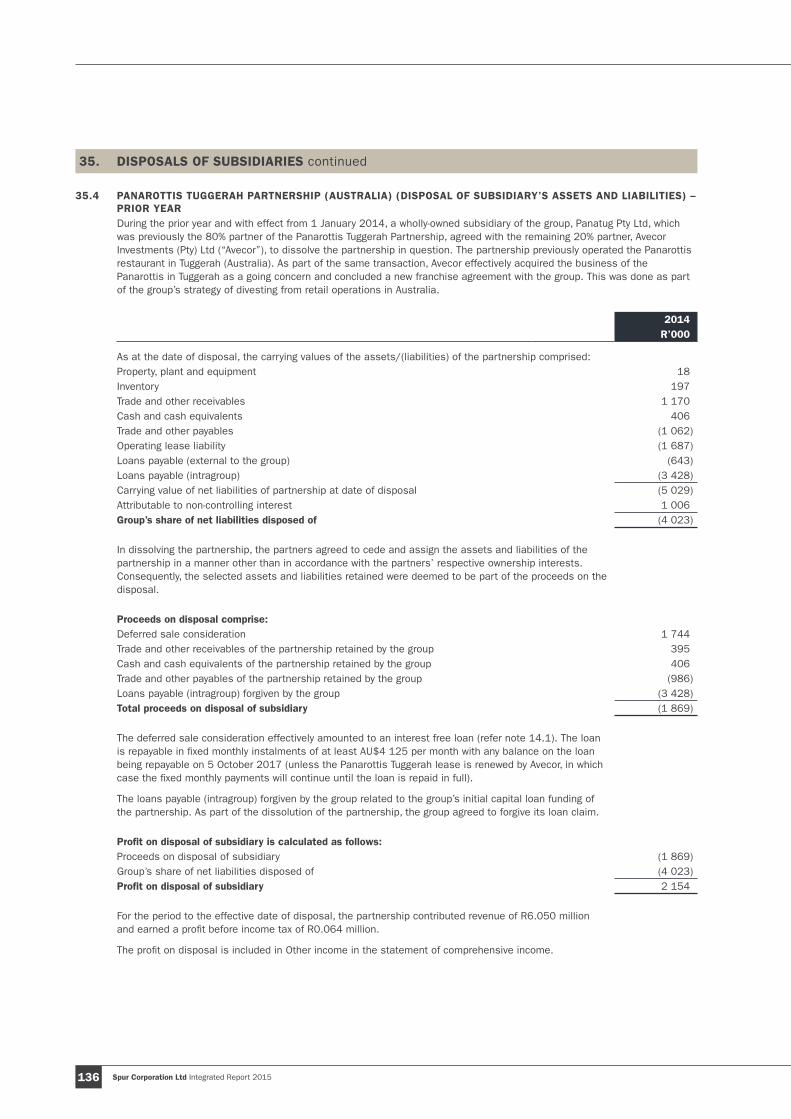
Spur Corporation Ltd Integrated Report 2015136
35. DISPOSALS OF SUBSIDIARIES continued
35.4 PANAROTTIS TUGGERAH PARTNERSHIP (AUSTRALIA) (DISPOSAL OF SUBSIDIARY’S ASSETS AND LIABILITIES) – PRIOR YEARDuring the prior year and with effect from 1 January 2014, a wholly-owned subsidiary of the group, Panatug Pty Ltd, which was previously the 80% partner of the Panarottis Tuggerah Partnership, agreed with the remaining 20% partner, Avecor Investments (Pty) Ltd (“Avecor”), to dissolve the partnership in question. The partnership previously operated the Panarottis restaurant in Tuggerah (Australia). As part of the same transaction, Avecor effectively acquired the business of the Panarottis in Tuggerah as a going concern and concluded a new franchise agreement with the group. This was done as part of the group’s strategy of divesting from retail operations in Australia.
2014 R’000
As at the date of disposal, the carrying values of the assets/(liabilities) of the partnership comprised:Property, plant and equipment 18 Inventory 197 Trade and other receivables 1 170 Cash and cash equivalents 406 Trade and other payables (1 062)Operating lease liability (1 687)Loans payable (external to the group) (643)Loans payable (intragroup) (3 428)Carrying value of net liabilities of partnership at date of disposal (5 029)Attributable to non-controlling interest 1 006 Group’s share of net liabilities disposed of (4 023)
In dissolving the partnership, the partners agreed to cede and assign the assets and liabilities of the partnership in a manner other than in accordance with the partners’ respective ownership interests. Consequently, the selected assets and liabilities retained were deemed to be part of the proceeds on the disposal.
Proceeds on disposal comprise:Deferred sale consideration 1 744 Trade and other receivables of the partnership retained by the group 395 Cash and cash equivalents of the partnership retained by the group 406 Trade and other payables of the partnership retained by the group (986)Loans payable (intragroup) forgiven by the group (3 428)Total proceeds on disposal of subsidiary (1 869)
The deferred sale consideration effectively amounted to an interest free loan (refer note 14.1). The loan is repayable in fixed monthly instalments of at least AU$4 125 per month with any balance on the loan being repayable on 5 October 2017 (unless the Panarottis Tuggerah lease is renewed by Avecor, in which case the fixed monthly payments will continue until the loan is repaid in full).
The loans payable (intragroup) forgiven by the group related to the group’s initial capital loan funding of the partnership. As part of the dissolution of the partnership, the group agreed to forgive its loan claim.
Profit on disposal of subsidiary is calculated as follows:Proceeds on disposal of subsidiary (1 869)Group’s share of net liabilities disposed of (4 023)Profit on disposal of subsidiary 2 154
For the period to the effective date of disposal, the partnership contributed revenue of R6.050 million and earned a profit before income tax of R0.064 million.
The profit on disposal is included in Other income in the statement of comprehensive income.
Spur Corporation Ltd Integrated Report 2015 137
36. OTHER NON-CASH TRANSACTIONS
36.1 INTERNATIONAL GROUP RESTRUCTURE – PRIOR YEAR In June 2004, a wholly-owned foreign subsidiary of the group, Vantini Spur Ltd (“Vantini”), the owner of the group’s international trademarks and intellectual property, granted a 10-year usufruct of the trademarks and intellectual property to another foreign wholly-owned subsidiary of the group, Steak Ranches International BV (“SRIBV”). SRIBV is the primary franchisor of the group’s brands outside of South Africa.
During the prior year, between 31 March 2014 and 30 June 2014, in anticipation of the expiration of the usufruct rights referred to above, the group restructured certain of its international subsidiaries in order to ensure the continued validity of franchise agreements concluded between SRIBV and its franchisees. The restructure resulted in certain foreign subsidiaries commencing deregistration procedures or becoming dormant which resulted in foreign exchange gains on translation of these foreign operations previously recognised in equity (FCTR) through other comprehensive income being recycled, through other comprehensive income, back to profit in the amount of R3.386 million. Legal, consulting and other advisory costs relating to the restructure amounted to R2.169 million for the prior year and were included in profit before income tax for the prior year.
36.2 MOHAWK SPUR (ENGLAND) As a consequence of sustained trading losses incurred by the Mohawk Spur in Wandsworth (England), the group impaired the franchise rights intangible asset of R1.866 million attributable to the cash-generating unit in the prior year. Furthermore, in considering the ability of the restaurant in question to continue trading, the group accelerated the amortisation of the lease previously acquired by the group relating to the restaurant, resulting in a further charge of R1.612 million to profit before income tax in the prior year.
At 28 February 2015, the group ceased trading the outlet. The outlet contributed revenue of R8.544 million (2014: R14.587 million) for the year and incurred a loss before income tax of R0.925 million (2014: 2.291 million). As a consequence of ceasing to trade the outlet, R1.317 million of foreign exchange losses arising on the translation of the foreign operation previously recognised in other comprehensive income (FCTR) were reclassified to profit before income tax during the year.
36.3 LARKSPUR FIVE LTD (ENGLAND) Larkspur Five Ltd was a subsidiary in which the group owned a 70.6% equity interest and which previously operated the Golden Gate Spur in Gateshead (England). The restaurant in question ceased trading in October 2013. On 16 June 2015, the company was dissolved. The group had previously recognised a liability in respect of a shareholder’s loan to the non-controlling shareholder. On dissolution of the company, the liability, amounting to R5.173 million at 15 June 2015, was released to profit before income tax. In addition, foreign exchange losses amounting to R0.603 million arising from the translation of the foreign operation previously recognised in other comprehensive income (FCTR) were reclassified to profit before income tax during the year. The winding up of the company resulted in a net profit attributable to non-controlling interests of R5.599 million.
NOTES TO THE CONSOLIDATED FINANCIAL STATEMENTS

Spur Corporation Ltd Integrated Report 2015138
37. FINANCIAL INSTRUMENTS
37.1 ACCOUNTING CLASSIFICATION AND FAIR VALUESThe following table shows the carrying amounts and fair values of financial assets and financial liabilities, including their levels in the fair value hierarchy (refer note 2.2). It does not include fair value information for financial assets and liabilities not measured at fair value if the carrying amount is a reasonable approximation of fair value.
Carrying amount (R’000) Carrying amount (R’000) Fair value (R’000)
2015 Note Held for
trading Loans and
receivables
Financial liabilities at fair
value through profit or loss
Other financial liabilities Total Level 2 Level 3 Total
Financial assets measured at fair valueDerivative financial assets 17 28 181 – – – 28 181 28 181 – 28 181
Financial assets not measured at fair valueLoans receivable 14 – 168 139 – – 168 139 Financial assets included in trade and other receivables1 19 – 88 849 – – 88 849 Cash and cash equivalents 20 – 304 851 – – 304 851
– 561 839 – – 561 839
Financial liabilities measured at fair valueContingent consideration liability 34.1 – – 47 383 – 47 383 – 47 383 47 383
Financial liabilities not measured at fair valueLoans payable 26 – – – 18 818 18 818 Bank overdrafts 20 – – – 3 557 3 557 Financial liabilities included in trade and other payables2 25 – – – 53 340 53 340 Shareholders for dividend – – – 482 482
– – – 76 197 76 197
Carrying amount (R’000) Carrying amount (R’000) Fair value (R’000)
2014 Note Held for
trading Loans and
receivables
Financial liabilities at fair
value through profit or loss
Other financial liabilities Total Level 2 Level 3 Total
Financial assets measured at fair valueDerivative financial assets 17 34 667 – – – 34 667 34 667 – 34 667
Financial assets not measured at fair valueLoans receivable 14 – 58 897 – – 58 897 Financial assets included in trade and other receivables1 19 – 75 033 – – 75 033 Cash and cash equivalents 20 – 91 966 – – 91 966
– 225 896 – – 225 896
Financial liabilities measured at fair valueDerivative financial liability 17 – – 319 – 319 319 – 319
Financial liabilities not measured at fair valueLoans payable 26 – – – 29 846 29 846 Bank overdrafts 20 – – – 539 539 Financial liabilities included in trade and other payables2 25 – – – 43 709 43 709 Shareholders for dividend – – – 411 411
– – – 74 505 74 505
1 Includes trade receivables, staff loans, deposits and other financial assets as defined in terms of IAS32 – Financial Instruments: Disclosure and Presentation.
2 Includes trade payables, accruals, unredeemed gift voucher liability and other financial liabilities as defined in terms of IAS32 – Financial Instruments: Disclosure and Presentation.
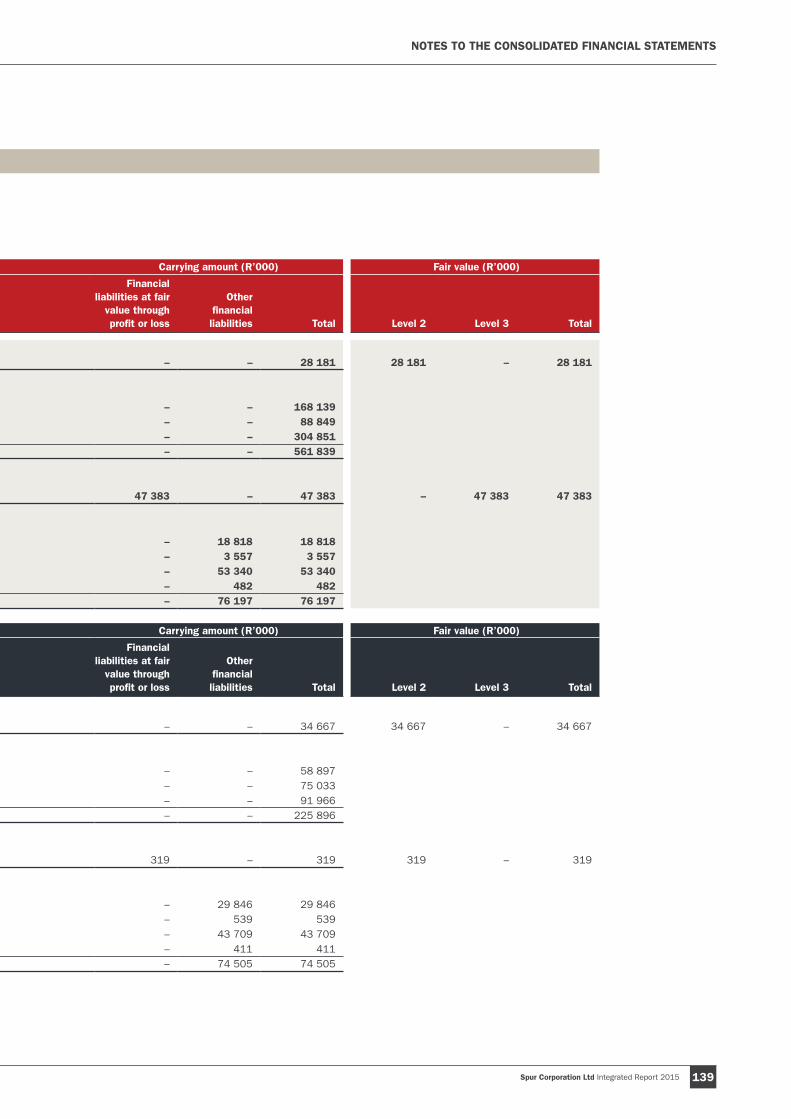
Spur Corporation Ltd Integrated Report 2015 139
37. FINANCIAL INSTRUMENTS
37.1 ACCOUNTING CLASSIFICATION AND FAIR VALUESThe following table shows the carrying amounts and fair values of financial assets and financial liabilities, including their levels in the fair value hierarchy (refer note 2.2). It does not include fair value information for financial assets and liabilities not measured at fair value if the carrying amount is a reasonable approximation of fair value.
Carrying amount (R’000) Carrying amount (R’000) Fair value (R’000)
2015 Note Held for
trading Loans and
receivables
Financial liabilities at fair
value through profit or loss
Other financial liabilities Total Level 2 Level 3 Total
Financial assets measured at fair valueDerivative financial assets 17 28 181 – – – 28 181 28 181 – 28 181
Financial assets not measured at fair valueLoans receivable 14 – 168 139 – – 168 139 Financial assets included in trade and other receivables1 19 – 88 849 – – 88 849 Cash and cash equivalents 20 – 304 851 – – 304 851
– 561 839 – – 561 839
Financial liabilities measured at fair valueContingent consideration liability 34.1 – – 47 383 – 47 383 – 47 383 47 383
Financial liabilities not measured at fair valueLoans payable 26 – – – 18 818 18 818 Bank overdrafts 20 – – – 3 557 3 557 Financial liabilities included in trade and other payables2 25 – – – 53 340 53 340 Shareholders for dividend – – – 482 482
– – – 76 197 76 197
Carrying amount (R’000) Carrying amount (R’000) Fair value (R’000)
2014 Note Held for
trading Loans and
receivables
Financial liabilities at fair
value through profit or loss
Other financial liabilities Total Level 2 Level 3 Total
Financial assets measured at fair valueDerivative financial assets 17 34 667 – – – 34 667 34 667 – 34 667
Financial assets not measured at fair valueLoans receivable 14 – 58 897 – – 58 897 Financial assets included in trade and other receivables1 19 – 75 033 – – 75 033 Cash and cash equivalents 20 – 91 966 – – 91 966
– 225 896 – – 225 896
Financial liabilities measured at fair valueDerivative financial liability 17 – – 319 – 319 319 – 319
Financial liabilities not measured at fair valueLoans payable 26 – – – 29 846 29 846 Bank overdrafts 20 – – – 539 539 Financial liabilities included in trade and other payables2 25 – – – 43 709 43 709 Shareholders for dividend – – – 411 411
– – – 74 505 74 505
1 Includes trade receivables, staff loans, deposits and other financial assets as defined in terms of IAS32 – Financial Instruments: Disclosure and Presentation.
2 Includes trade payables, accruals, unredeemed gift voucher liability and other financial liabilities as defined in terms of IAS32 – Financial Instruments: Disclosure and Presentation.
NOTES TO THE CONSOLIDATED FINANCIAL STATEMENTS

Spur Corporation Ltd Integrated Report 2015140
37. FINANCIAL INSTRUMENTS continued
37.1 ACCOUNTING CLASSIFICATION AND FAIR VALUES continued The group has not disclosed the fair values of loans receivable, financial assets included in trade and other receivables, cash and cash equivalents, loans payable, bank overdrafts, financial liabilities included in trade and other payables and shareholders for dividend as their carrying amounts are a reasonable approximation of their fair values.
In the case of loans receivable and loans payable, the directors consider the terms of the loans (including in particular, the interest rates applicable) to be commensurate with similar financial instruments between unrelated market participants and the carrying values are therefore assumed to approximate their fair values. In this regard, with reference to the fair values at initial recognition of the loans granted to Braviz Fine Foods (Pty) Ltd, GPI Spur (Pty) Ltd, Hunga Busters Pty Ltd and Panawest Pty Ltd, refer to notes 14.2, 14.7, 14.8 and 14.10 respectively for further fair value considerations. The directors consider there to have been no significant changes in assumptions or variables impacting on the fair values of the loans during the period from initial recognition to the reporting date.
In the case of financial assets included in trade and other receivables, cash and cash equivalents, bank overdrafts, financial liabilities included in trade and other payables and shareholders for dividend, the durations of the financial instruments are short and it is therefore assumed that the carrying values approximate their fair values.
37.2 MEASUREMENT OF FAIR VALUESFinancial instruments measured at fair value – level 2: derivative financial assets/liability The valuation technique as well as the key assumptions into the valuation model for the derivative financial assets/liability are detailed in note 17.
Financial instruments measured at fair value – level 3: contingent consideration liability relating to the acquisition of RocoMamas The liability for the contingent consideration referred to in note 34.1 was initially recognised at fair value and is subsequently recognised at fair value at each reporting date. The liability is designated as a level 3 financial instrument in terms of the fair value hierarchy as inputs into the valuation model are not based on observable market data.
The fair value is determined based on the expected aggregate purchase consideration payments, discounted to present value using a risk-adjusted discount rate of 25.27%, being the weighted average cost of capital specific to the acquired entity. The expected purchase consideration payments were determined by considering various possible scenarios, and the probability of each scenario.
The significant unobservable inputs are the forecast profit before income tax and the risk-adjusted discount rate.
Contingent consideration liability2015
R’0002014
R’000
Balance at beginning of year – –Arising on acquisition of RocoMamas (refer note 34.1) 43 702 –Fair value adjustment recognised in profit or loss before income tax 3 681 –Balance at end of year 47 383 –
The fair value adjustment included in profit before income tax for the year relates largely to the adjustment for the time value of money from the initial acquisition date to the reporting date.
The estimated fair values of the contingent consideration liability at initial recognition and at the reporting date, would change if the forecast profit before income tax or the risk-adjusted discount rate were to change as follows:
Forecast profit before income tax
Increase by 5%R’000
Decrease by 5%R’000
Increase/(decrease) in carrying value at initial recognition 2 265 (2 265)Increase/(decrease) in carrying value at reporting date 2 456 (2 456)Increase/(decrease) in fair value adjustment recognised in profit or loss before
income tax 191 (191)
Risk-adjusted discount rate
Increase by 2%R’000
Decreaseby 2%R’000
Increase/(decrease) in carrying value at initial recognition (1 321) 1 392 Increase/(decrease) in carrying value at reporting date (1 150) 1 208 Increase/(decrease) in fair value adjustment recognised in profit or loss before
income tax 171 (184)

Spur Corporation Ltd Integrated Report 2015 141
37.3 FINANCIAL RISK MANAGEMENTThe group has exposure to the following risks from its use of financial instruments:
– credit risk; – liquidity risk; and – market risk.
This note presents information about the group’s exposure to each of the above risks, the group’s objectives, policies and processes for measuring and managing these risks, and the group’s management of capital. Further quantitative disclosures are included throughout these consolidated financial statements.
The group’s objective is to manage effectively each of the above risks associated with its financial instruments, in order to limit the group’s exposure as far as possible to any financial loss associated with these risks.
The board of directors has overall responsibility for the establishment and overseeing of the group’s risk management framework. The board has established the risk committee, which is responsible for developing and monitoring the group’s risk management policies. The committee reports regularly to the board of directors on its activities.
The group’s risk management policies are established to identify and analyse the risks faced by the group, to set appropriate risk limits and controls, and to monitor risks and adherence to limits. Risk management policies and systems are reviewed regularly to reflect changes in market conditions and the group’s activities. The group, through its training and management standards and procedures, aims to develop a disciplined and constructive control environment in which all employees understand their roles and obligations.
The audit committee oversees how management monitors compliance with the group’s risk management policies and procedures and reviews the adequacy of the risk management framework in relation to the risks faced by the group to the extent that these have an impact on this integrated report.
37.3.1 Credit risk Credit risk is the risk of financial loss to the group if a counterparty to a financial asset fails to meet its contractual obligations, and arises principally from the counterparty to the derivative financial assets, the group’s receivables from customers, franchisees, operating partners and associated entities, and financial institutions with which the group holds monetary deposits.
Exposure to credit risk The aggregate of the carrying amounts of financial assets represents the maximum credit risk exposure. The maximum exposure to credit risk at the reporting date was:
Carrying amount
2015R’000
2014R’000
Cash and cash equivalents (refer note 20) 304 851 91 966Derivative financial assets (refer note 17) 28 181 34 667Financial assets included in trade and other receivables (refer note 19) 88 849 75 033Loans receivable (refer note 14) 168 139 58 897
590 020 260 563
NOTES TO THE CONSOLIDATED FINANCIAL STATEMENTS
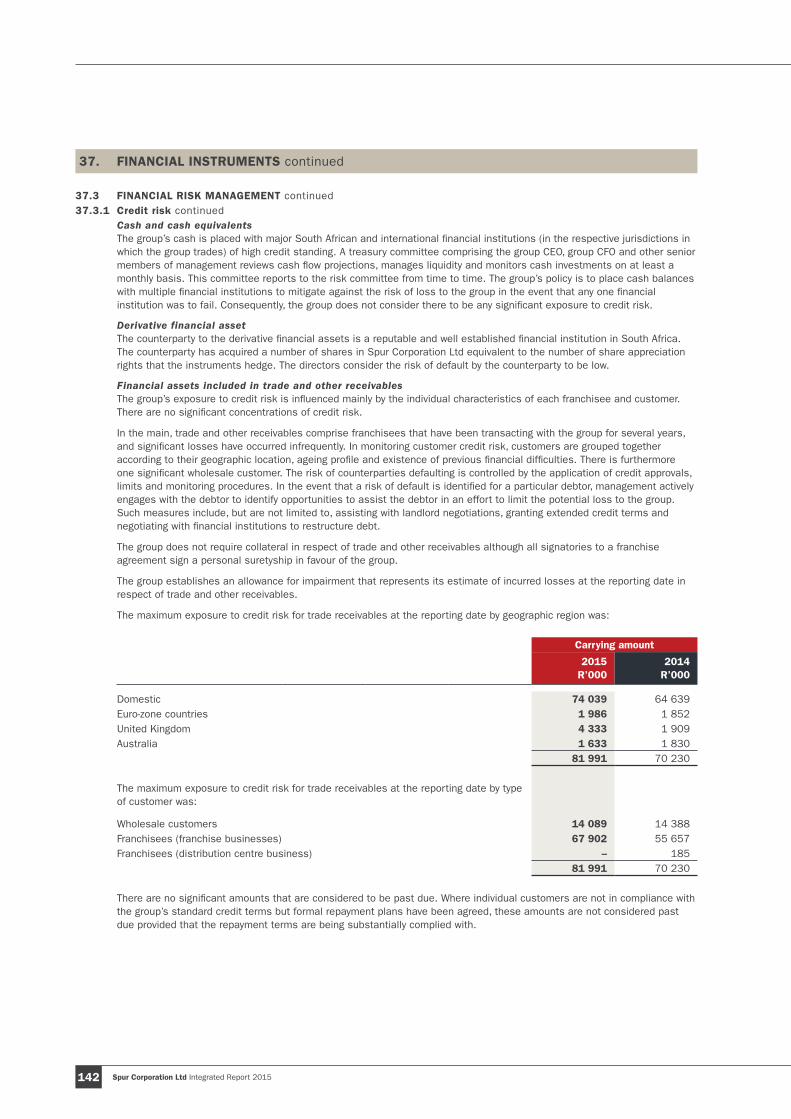
Spur Corporation Ltd Integrated Report 2015142
37. FINANCIAL INSTRUMENTS continued
37.3 FINANCIAL RISK MANAGEMENT continued37.3.1 Credit risk continued
Cash and cash equivalents The group’s cash is placed with major South African and international financial institutions (in the respective jurisdictions in which the group trades) of high credit standing. A treasury committee comprising the group CEO, group CFO and other senior members of management reviews cash flow projections, manages liquidity and monitors cash investments on at least a monthly basis. This committee reports to the risk committee from time to time. The group’s policy is to place cash balances with multiple financial institutions to mitigate against the risk of loss to the group in the event that any one financial institution was to fail. Consequently, the group does not consider there to be any significant exposure to credit risk.
Derivative financial asset The counterparty to the derivative financial assets is a reputable and well established financial institution in South Africa. The counterparty has acquired a number of shares in Spur Corporation Ltd equivalent to the number of share appreciation rights that the instruments hedge. The directors consider the risk of default by the counterparty to be low.
Financial assets included in trade and other receivables The group’s exposure to credit risk is influenced mainly by the individual characteristics of each franchisee and customer. There are no significant concentrations of credit risk.
In the main, trade and other receivables comprise franchisees that have been transacting with the group for several years, and significant losses have occurred infrequently. In monitoring customer credit risk, customers are grouped together according to their geographic location, ageing profile and existence of previous financial difficulties. There is furthermore one significant wholesale customer. The risk of counterparties defaulting is controlled by the application of credit approvals, limits and monitoring procedures. In the event that a risk of default is identified for a particular debtor, management actively engages with the debtor to identify opportunities to assist the debtor in an effort to limit the potential loss to the group. Such measures include, but are not limited to, assisting with landlord negotiations, granting extended credit terms and negotiating with financial institutions to restructure debt.
The group does not require collateral in respect of trade and other receivables although all signatories to a franchise agreement sign a personal suretyship in favour of the group.
The group establishes an allowance for impairment that represents its estimate of incurred losses at the reporting date in respect of trade and other receivables.
The maximum exposure to credit risk for trade receivables at the reporting date by geographic region was:
Carrying amount
2015R’000
2014R’000
Domestic 74 039 64 639Euro-zone countries 1 986 1 852United Kingdom 4 333 1 909Australia 1 633 1 830
81 991 70 230
The maximum exposure to credit risk for trade receivables at the reporting date by type of customer was:
Wholesale customers 14 089 14 388Franchisees (franchise businesses) 67 902 55 657Franchisees (distribution centre business) – 185 81 991 70 230
There are no significant amounts that are considered to be past due. Where individual customers are not in compliance with the group’s standard credit terms but formal repayment plans have been agreed, these amounts are not considered past due provided that the repayment terms are being substantially complied with.
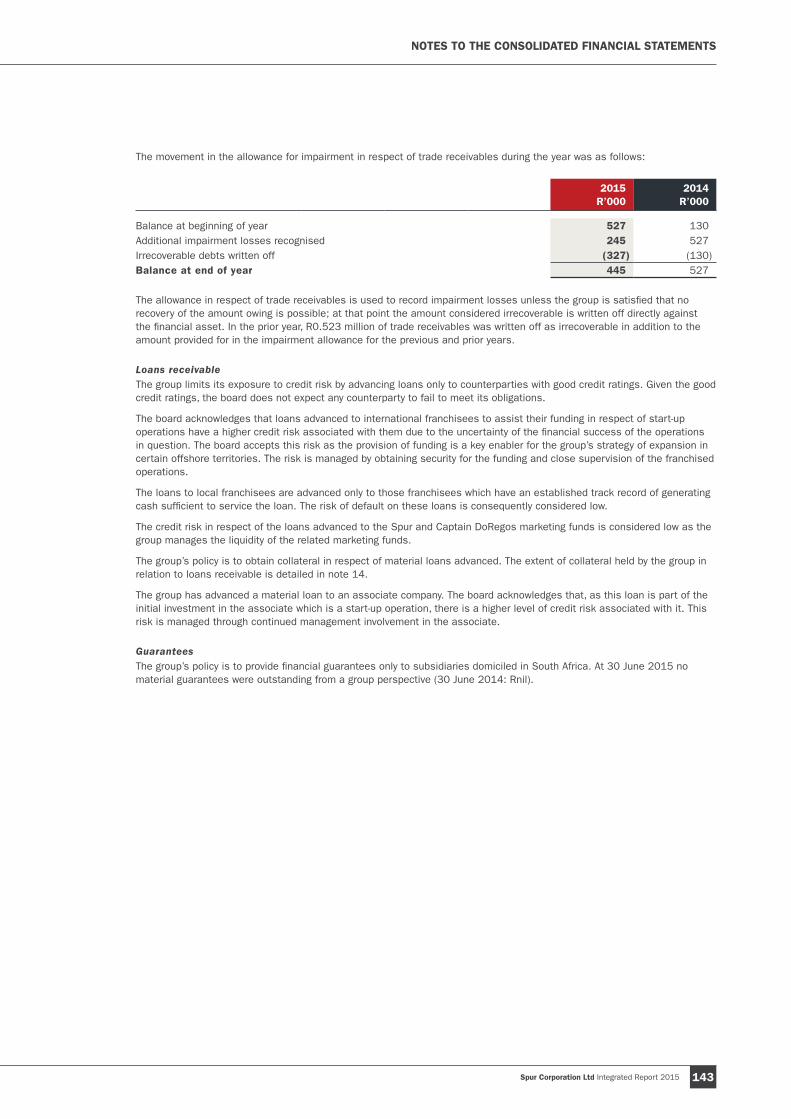
Spur Corporation Ltd Integrated Report 2015 143
The movement in the allowance for impairment in respect of trade receivables during the year was as follows:
2015R’000
2014R’000
Balance at beginning of year 527 130Additional impairment losses recognised 245 527Irrecoverable debts written off (327) (130)Balance at end of year 445 527
The allowance in respect of trade receivables is used to record impairment losses unless the group is satisfied that no recovery of the amount owing is possible; at that point the amount considered irrecoverable is written off directly against the financial asset. In the prior year, R0.523 million of trade receivables was written off as irrecoverable in addition to the amount provided for in the impairment allowance for the previous and prior years.
Loans receivable The group limits its exposure to credit risk by advancing loans only to counterparties with good credit ratings. Given the good credit ratings, the board does not expect any counterparty to fail to meet its obligations.
The board acknowledges that loans advanced to international franchisees to assist their funding in respect of start-up operations have a higher credit risk associated with them due to the uncertainty of the financial success of the operations in question. The board accepts this risk as the provision of funding is a key enabler for the group’s strategy of expansion in certain offshore territories. The risk is managed by obtaining security for the funding and close supervision of the franchised operations.
The loans to local franchisees are advanced only to those franchisees which have an established track record of generating cash sufficient to service the loan. The risk of default on these loans is consequently considered low.
The credit risk in respect of the loans advanced to the Spur and Captain DoRegos marketing funds is considered low as the group manages the liquidity of the related marketing funds.
The group’s policy is to obtain collateral in respect of material loans advanced. The extent of collateral held by the group in relation to loans receivable is detailed in note 14.
The group has advanced a material loan to an associate company. The board acknowledges that, as this loan is part of the initial investment in the associate which is a start-up operation, there is a higher level of credit risk associated with it. This risk is managed through continued management involvement in the associate.
Guarantees The group’s policy is to provide financial guarantees only to subsidiaries domiciled in South Africa. At 30 June 2015 no material guarantees were outstanding from a group perspective (30 June 2014: Rnil).
NOTES TO THE CONSOLIDATED FINANCIAL STATEMENTS
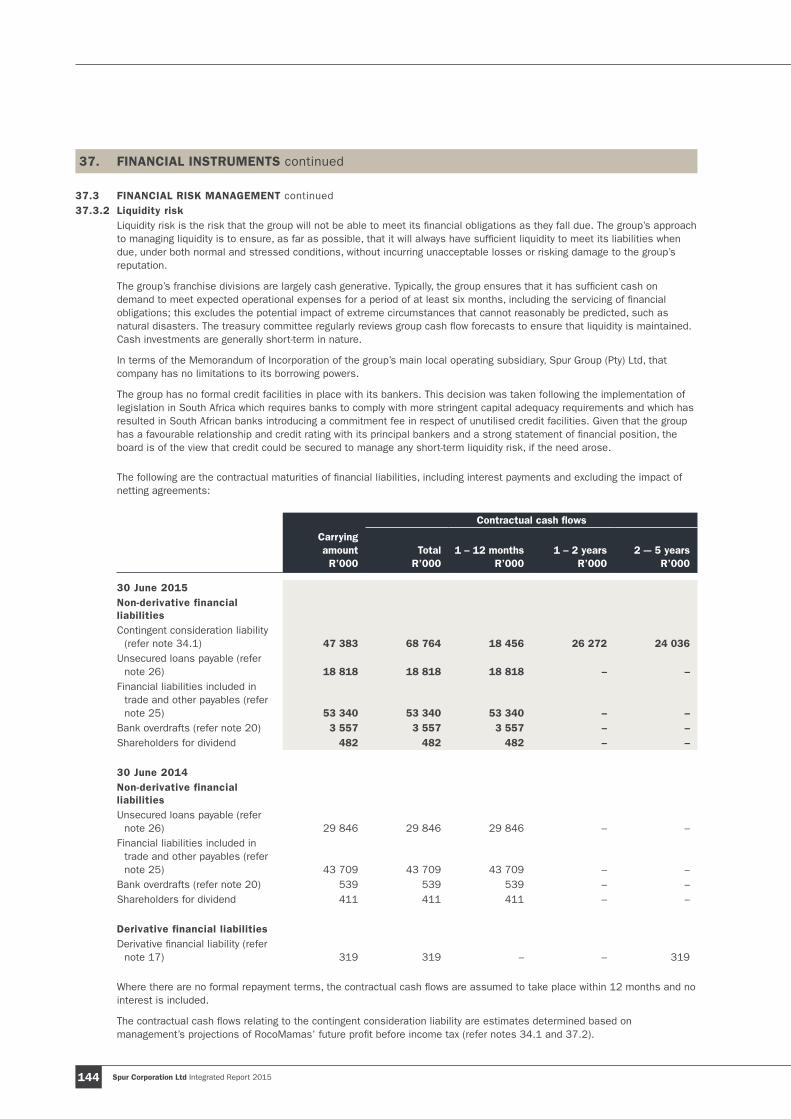
Spur Corporation Ltd Integrated Report 2015144
37. FINANCIAL INSTRUMENTS continued
37.3 FINANCIAL RISK MANAGEMENT continued37.3.2 Liquidity risk
Liquidity risk is the risk that the group will not be able to meet its financial obligations as they fall due. The group’s approach to managing liquidity is to ensure, as far as possible, that it will always have sufficient liquidity to meet its liabilities when due, under both normal and stressed conditions, without incurring unacceptable losses or risking damage to the group’s reputation.
The group’s franchise divisions are largely cash generative. Typically, the group ensures that it has sufficient cash on demand to meet expected operational expenses for a period of at least six months, including the servicing of financial obligations; this excludes the potential impact of extreme circumstances that cannot reasonably be predicted, such as natural disasters. The treasury committee regularly reviews group cash flow forecasts to ensure that liquidity is maintained. Cash investments are generally short-term in nature.
In terms of the Memorandum of Incorporation of the group’s main local operating subsidiary, Spur Group (Pty) Ltd, that company has no limitations to its borrowing powers.
The group has no formal credit facilities in place with its bankers. This decision was taken following the implementation of legislation in South Africa which requires banks to comply with more stringent capital adequacy requirements and which has resulted in South African banks introducing a commitment fee in respect of unutilised credit facilities. Given that the group has a favourable relationship and credit rating with its principal bankers and a strong statement of financial position, the board is of the view that credit could be secured to manage any short-term liquidity risk, if the need arose.
The following are the contractual maturities of financial liabilities, including interest payments and excluding the impact of netting agreements:
Contractual cash flows
Carrying amount
R’000Total
R’0001 – 12 months
R’0001 – 2 years
R’0002 -– 5 years
R’000
30 June 2015Non-derivative financial liabilitiesContingent consideration liability
(refer note 34.1) 47 383 68 764 18 456 26 272 24 036Unsecured loans payable (refer
note 26) 18 818 18 818 18 818 – –Financial liabilities included in
trade and other payables (refer note 25) 53 340 53 340 53 340 – –
Bank overdrafts (refer note 20) 3 557 3 557 3 557 – –Shareholders for dividend 482 482 482 – –
30 June 2014Non-derivative financial liabilitiesUnsecured loans payable (refer
note 26) 29 846 29 846 29 846 – –Financial liabilities included in
trade and other payables (refer note 25) 43 709 43 709 43 709 – –
Bank overdrafts (refer note 20) 539 539 539 – –Shareholders for dividend 411 411 411 – –
Derivative financial liabilitiesDerivative financial liability (refer
note 17) 319 319 – – 319
Where there are no formal repayment terms, the contractual cash flows are assumed to take place within 12 months and no interest is included.
The contractual cash flows relating to the contingent consideration liability are estimates determined based on management’s projections of RocoMamas’ future profit before income tax (refer notes 34.1 and 37.2).
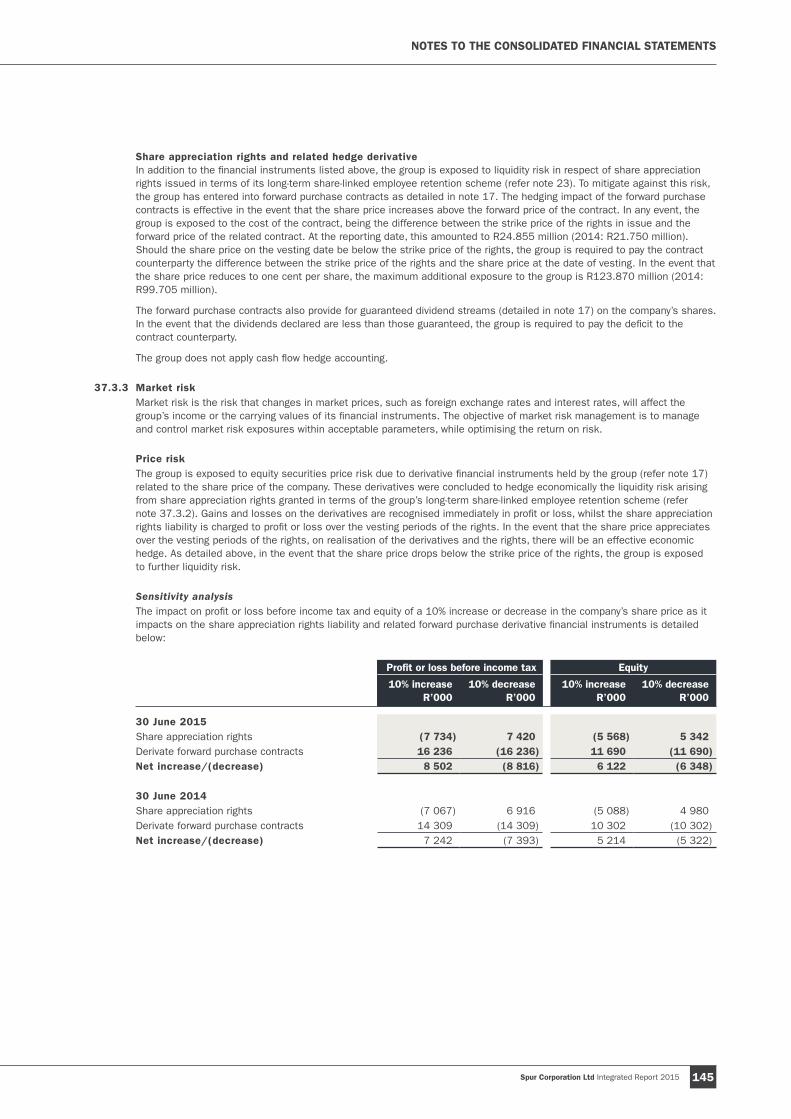
Spur Corporation Ltd Integrated Report 2015 145
Share appreciation rights and related hedge derivative In addition to the financial instruments listed above, the group is exposed to liquidity risk in respect of share appreciation rights issued in terms of its long-term share-linked employee retention scheme (refer note 23). To mitigate against this risk, the group has entered into forward purchase contracts as detailed in note 17. The hedging impact of the forward purchase contracts is effective in the event that the share price increases above the forward price of the contract. In any event, the group is exposed to the cost of the contract, being the difference between the strike price of the rights in issue and the forward price of the related contract. At the reporting date, this amounted to R24.855 million (2014: R21.750 million). Should the share price on the vesting date be below the strike price of the rights, the group is required to pay the contract counterparty the difference between the strike price of the rights and the share price at the date of vesting. In the event that the share price reduces to one cent per share, the maximum additional exposure to the group is R123.870 million (2014: R99.705 million).
The forward purchase contracts also provide for guaranteed dividend streams (detailed in note 17) on the company’s shares. In the event that the dividends declared are less than those guaranteed, the group is required to pay the deficit to the contract counterparty.
The group does not apply cash flow hedge accounting.
37.3.3 Market risk Market risk is the risk that changes in market prices, such as foreign exchange rates and interest rates, will affect the group’s income or the carrying values of its financial instruments. The objective of market risk management is to manage and control market risk exposures within acceptable parameters, while optimising the return on risk.
Price risk The group is exposed to equity securities price risk due to derivative financial instruments held by the group (refer note 17) related to the share price of the company. These derivatives were concluded to hedge economically the liquidity risk arising from share appreciation rights granted in terms of the group’s long-term share-linked employee retention scheme (refer note 37.3.2). Gains and losses on the derivatives are recognised immediately in profit or loss, whilst the share appreciation rights liability is charged to profit or loss over the vesting periods of the rights. In the event that the share price appreciates over the vesting periods of the rights, on realisation of the derivatives and the rights, there will be an effective economic hedge. As detailed above, in the event that the share price drops below the strike price of the rights, the group is exposed to further liquidity risk.
Sensitivity analysis The impact on profit or loss before income tax and equity of a 10% increase or decrease in the company’s share price as it impacts on the share appreciation rights liability and related forward purchase derivative financial instruments is detailed below:
Profit or loss before income tax Equity
10% increaseR’000
10% decreaseR’000
10% increaseR’000
10% decreaseR’000
30 June 2015Share appreciation rights (7 734) 7 420 (5 568) 5 342Derivate forward purchase contracts 16 236 (16 236) 11 690 (11 690)Net increase/(decrease) 8 502 (8 816) 6 122 (6 348)
30 June 2014Share appreciation rights (7 067) 6 916 (5 088) 4 980Derivate forward purchase contracts 14 309 (14 309) 10 302 (10 302)Net increase/(decrease) 7 242 (7 393) 5 214 (5 322)
NOTES TO THE CONSOLIDATED FINANCIAL STATEMENTS
Spur Corporation Ltd Integrated Report 2015146
37. FINANCIAL INSTRUMENTS continued
37.3 FINANCIAL RISK MANAGEMENT continued37.3.3 Market risk continued
Currency riskInternational operations The group’s international operations are structured such that items of revenue, expenses, monetary assets and monetary liabilities attributed to group entities are all denominated in the respective group companies’ functional currencies to the extent possible, with the exception of the group’s international franchise company, Steak Ranches International BV. That company is exposed to currency risk as revenue and related receivables are denominated in currencies other than that company’s functional currency which is the euro. That company is, furthermore, exposed to currency risk in respect of loan receivables denominated in currencies other than the euro. The most significant of these other currencies are the Australian dollar and pound sterling.
Trade and loan receivables and payables are not hedged as the group’s international operations trade in jurisdictions that are considered to have relatively stable currencies.
Exchange gains/losses relating to loans that are considered to be part of the net investment in a foreign operation are included in other comprehensive income.
Local operations The group’s local operations are exposed to exchange risk only to the extent that it imports raw materials and certain merchandise for resale from time to time. The number and value of these transactions are not considered significant. The group uses forward exchange contracts to hedge its exposure to currency risk in respect of imports. The group does not use forward exchange contracts or other derivative contracts for speculative purposes.
Consolidation The group’s consolidated results are influenced by exchange fluctuations between the functional currencies of group entities and the group’s reporting currency. The group entities’ functional currencies include primarily the euro, pound sterling and Australian dollar.

Spur Corporation Ltd Integrated Report 2015 147
Exposure to currency riskThe group’s exposure to foreign currency risk was as follows as at 30 June:
GBP’000
USD’000
AUD’000
EUR’000
BWP’000
MUR’000
TZS’000
KES’000
AED’000
NGN’000
ZMK’000
2015AssetsCash and cash
equivalents 268 68 379 346 – – – – – – – Trade and other
receivables 212 79 182 112 88 474 12 016 949 – 684 52 Loans receivable 5 – 1 698 290 – – – – – – – Total assets 485 147 2 259 748 88 474 12 016 949 – 684 52
LiabilitiesLoans payable (81) – (39) (45) – – – – – – – Trade and other payables (668) – (22) (83) (24) – – – – – – Total liabilities (749) – (61) (128) (24) – – – – – –
Total net exposure (264) 147 2 198 620 64 474 12 016 949 – 684 52
2014AssetsCash and cash
equivalents 537 158 615 510 – – – – – – – Trade and other
receivables 275 32 126 98 78 423 13 310 951 5 663 20 306 Loans receivable 6 – 195 13 – – – – – – – Total assets 818 190 936 621 78 423 13 310 951 5 663 20 306
LiabilitiesLoans payable (367) – (201) – – – – – – – – Trade and other payables (338) – (331) (169) (24) – – – – – – Total liabilities (705) – (532) (169) (24) – – – – – –
Total net exposure 113 190 404 452 54 423 13 310 951 5 663 20 306
The following significant exchange rates applied during the year.
Average rate Reporting date spot rate
2015 2014 2015 2014
AUD1 = R 9.5616 9.5365 9.4137 10.0047GBP1 = R 18.0282 16.9112 19.3259 18.0687Euro1 = R 13.7440 14.1106 13.6377 14.4741
NOTES TO THE CONSOLIDATED FINANCIAL STATEMENTS

Spur Corporation Ltd Integrated Report 2015148
37. FINANCIAL INSTRUMENTS continued
37.3 FINANCIAL RISK MANAGEMENT continued37.3.3 Market risk continued
Currency risk continuedSensitivity analysis A 10% strengthening of the rand against the following currencies at 30 June would have increased/(decreased) profit or loss before income tax and equity by the amounts shown below. This analysis assumes that all other variables, in particular interest rates, remain constant.
Profit or lossbefore
income taxR’000
EquityR’000
30 June 2015Euro (197) (2 232)GBP 5 680AUD 2 (1 917)
30 June 2014Euro 748 (18 954)GBP 421 (2 043)AUD 1 364 (1 943)
A 10% weakening of the rand against the above currencies at 30 June would have had the equal but opposite effect on the above currencies to the amounts shown above on the basis that all other variables remain constant.
Interest rate risk The group adopts a policy of ensuring that its exposure to changes in interest rates is on a floating rate basis as far as possible. No derivative instruments are used to hedge interest rate risk.
Interest rate risk profileAt the reporting date the interest rate profile of the group’s interest-bearing financial instruments was:
Carrying amount
2015R’000
2014R’000
Fixed rate instrumentsFinancial assets 3 051 –Financial liabilities – –
Variable rate instrumentsFinancial assets 464 514 148 911 Financial liabilities 5 114 7 166
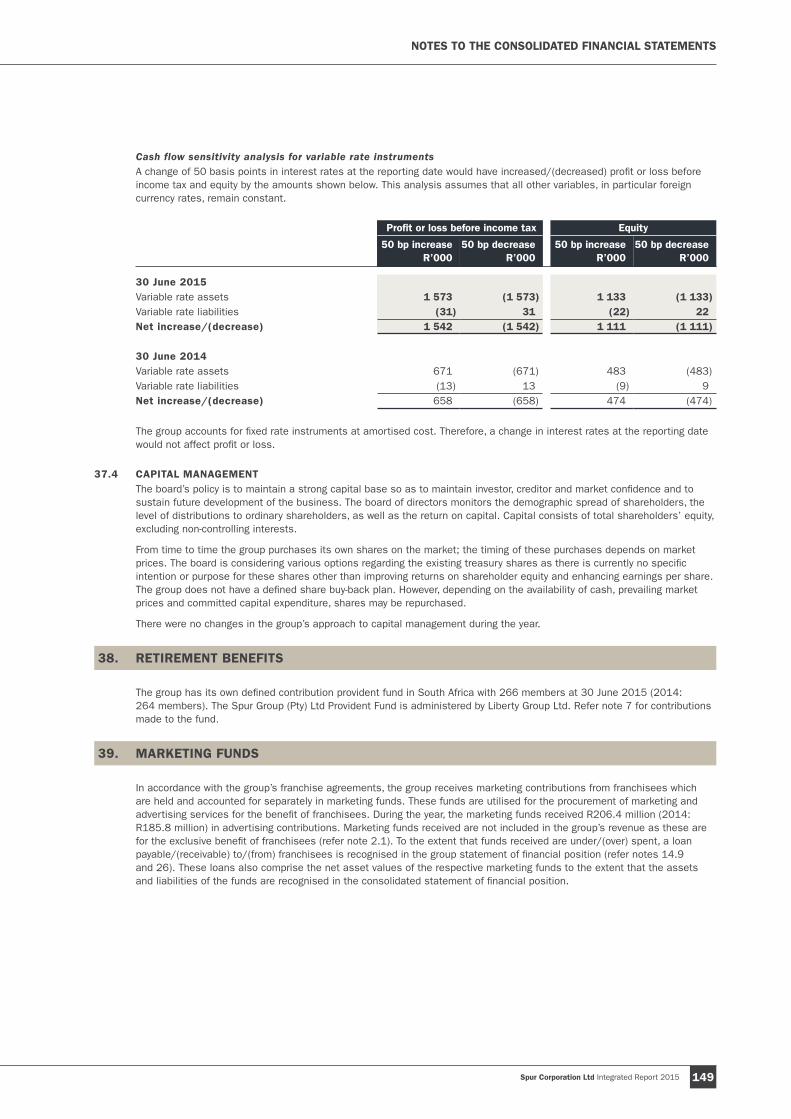
Spur Corporation Ltd Integrated Report 2015 149
Cash flow sensitivity analysis for variable rate instruments A change of 50 basis points in interest rates at the reporting date would have increased/(decreased) profit or loss before income tax and equity by the amounts shown below. This analysis assumes that all other variables, in particular foreign currency rates, remain constant.
Profit or loss before income tax Equity
50 bp increaseR’000
50 bp decreaseR’000
50 bp increaseR’000
50 bp decreaseR’000
30 June 2015Variable rate assets 1 573 (1 573) 1 133 (1 133)Variable rate liabilities (31) 31 (22) 22 Net increase/(decrease) 1 542 (1 542) 1 111 (1 111)
30 June 2014Variable rate assets 671 (671) 483 (483)Variable rate liabilities (13) 13 (9) 9Net increase/(decrease) 658 (658) 474 (474)
The group accounts for fixed rate instruments at amortised cost. Therefore, a change in interest rates at the reporting date would not affect profit or loss.
37.4 CAPITAL MANAGEMENT The board’s policy is to maintain a strong capital base so as to maintain investor, creditor and market confidence and to sustain future development of the business. The board of directors monitors the demographic spread of shareholders, the level of distributions to ordinary shareholders, as well as the return on capital. Capital consists of total shareholders’ equity, excluding non-controlling interests.
From time to time the group purchases its own shares on the market; the timing of these purchases depends on market prices. The board is considering various options regarding the existing treasury shares as there is currently no specific intention or purpose for these shares other than improving returns on shareholder equity and enhancing earnings per share. The group does not have a defined share buy-back plan. However, depending on the availability of cash, prevailing market prices and committed capital expenditure, shares may be repurchased.
There were no changes in the group’s approach to capital management during the year.
38. RETIREMENT BENEFITS
The group has its own defined contribution provident fund in South Africa with 266 members at 30 June 2015 (2014: 264 members). The Spur Group (Pty) Ltd Provident Fund is administered by Liberty Group Ltd. Refer note 7 for contributions made to the fund.
39. MARKETING FUNDS
In accordance with the group’s franchise agreements, the group receives marketing contributions from franchisees which are held and accounted for separately in marketing funds. These funds are utilised for the procurement of marketing and advertising services for the benefit of franchisees. During the year, the marketing funds received R206.4 million (2014: R185.8 million) in advertising contributions. Marketing funds received are not included in the group’s revenue as these are for the exclusive benefit of franchisees (refer note 2.1). To the extent that funds received are under/(over) spent, a loan payable/(receivable) to/(from) franchisees is recognised in the group statement of financial position (refer notes 14.9 and 26). These loans also comprise the net asset values of the respective marketing funds to the extent that the assets and liabilities of the funds are recognised in the consolidated statement of financial position.
NOTES TO THE CONSOLIDATED FINANCIAL STATEMENTS
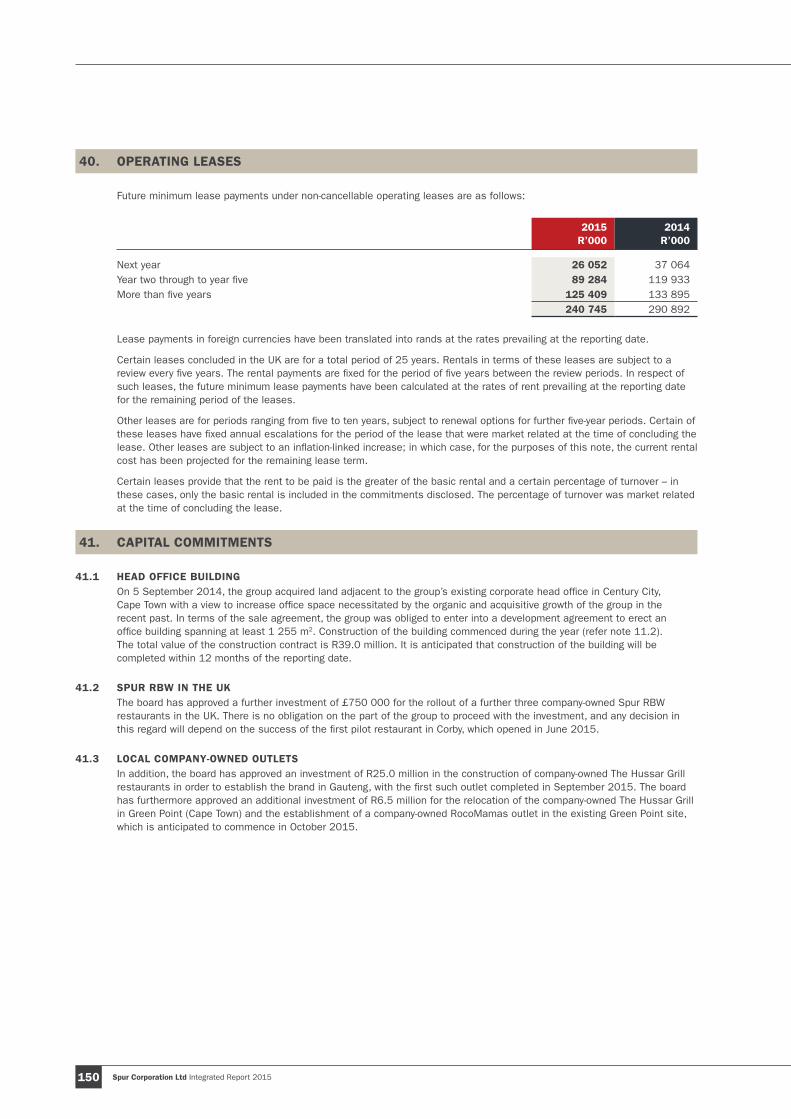
Spur Corporation Ltd Integrated Report 2015150
40. OPERATING LEASES
Future minimum lease payments under non-cancellable operating leases are as follows:
2015R’000
2014R’000
Next year 26 052 37 064 Year two through to year five 89 284 119 933 More than five years 125 409 133 895
240 745 290 892
Lease payments in foreign currencies have been translated into rands at the rates prevailing at the reporting date.
Certain leases concluded in the UK are for a total period of 25 years. Rentals in terms of these leases are subject to a review every five years. The rental payments are fixed for the period of five years between the review periods. In respect of such leases, the future minimum lease payments have been calculated at the rates of rent prevailing at the reporting date for the remaining period of the leases.
Other leases are for periods ranging from five to ten years, subject to renewal options for further five-year periods. Certain of these leases have fixed annual escalations for the period of the lease that were market related at the time of concluding the lease. Other leases are subject to an inflation-linked increase; in which case, for the purposes of this note, the current rental cost has been projected for the remaining lease term.
Certain leases provide that the rent to be paid is the greater of the basic rental and a certain percentage of turnover – in these cases, only the basic rental is included in the commitments disclosed. The percentage of turnover was market related at the time of concluding the lease.
41. CAPITAL COMMITMENTS
41.1 HEAD OFFICE BUILDING On 5 September 2014, the group acquired land adjacent to the group’s existing corporate head office in Century City, Cape Town with a view to increase office space necessitated by the organic and acquisitive growth of the group in the recent past. In terms of the sale agreement, the group was obliged to enter into a development agreement to erect an office building spanning at least 1 255 m2. Construction of the building commenced during the year (refer note 11.2). The total value of the construction contract is R39.0 million. It is anticipated that construction of the building will be completed within 12 months of the reporting date.
41.2 SPUR RBW IN THE UK The board has approved a further investment of £750 000 for the rollout of a further three company-owned Spur RBW restaurants in the UK. There is no obligation on the part of the group to proceed with the investment, and any decision in this regard will depend on the success of the first pilot restaurant in Corby, which opened in June 2015.
41.3 LOCAL COMPANY-OWNED OUTLETSIn addition, the board has approved an investment of R25.0 million in the construction of company-owned The Hussar Grill restaurants in order to establish the brand in Gauteng, with the first such outlet completed in September 2015. The board has furthermore approved an additional investment of R6.5 million for the relocation of the company-owned The Hussar Grill in Green Point (Cape Town) and the establishment of a company-owned RocoMamas outlet in the existing Green Point site, which is anticipated to commence in October 2015.
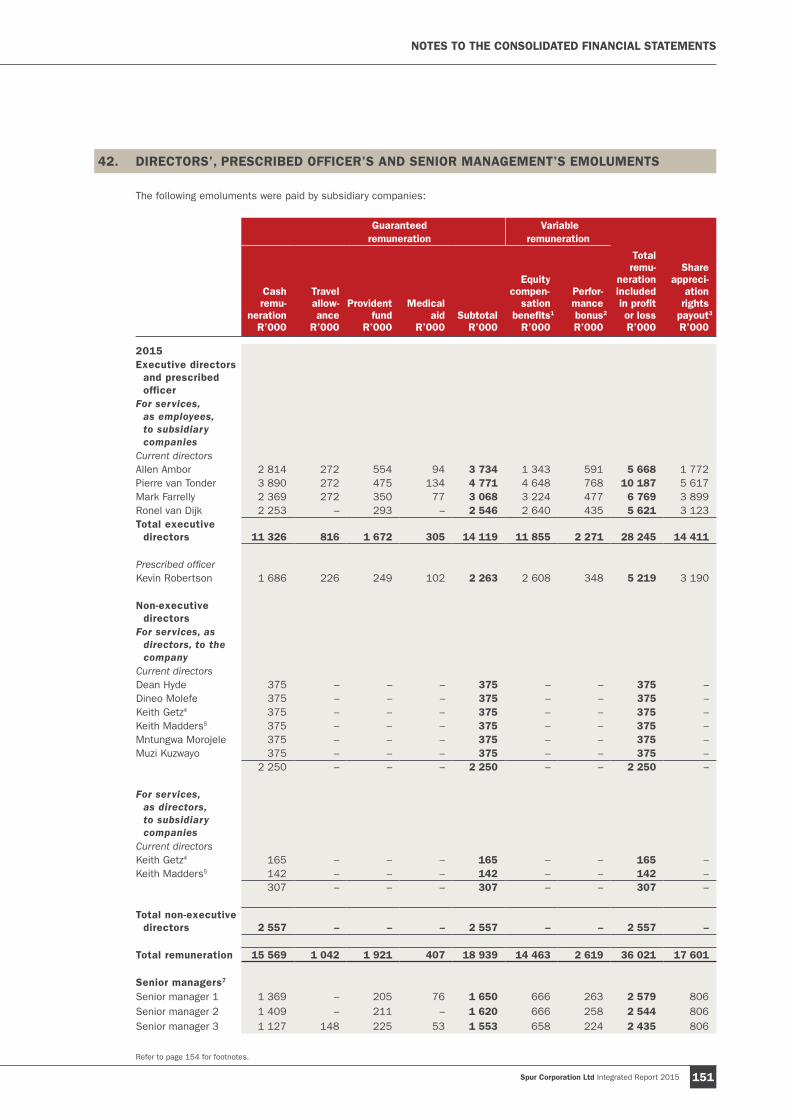
Spur Corporation Ltd Integrated Report 2015 151
42. DIRECTORS’, PRESCRIBED OFFICER’S AND SENIOR MANAGEMENT’S EMOLUMENTS
The following emoluments were paid by subsidiary companies:
Guaranteed
remuneration Variable
remuneration
Cashremu-
nerationR’000
Travelallow-ance
R’000
Providentfund
R’000
Medicalaid
R’000Subtotal
R’000
Equity compen-
sationbenefits1
R’000
Perfor-mancebonus2
R’000
Totalremu-
nerationincludedin profitor lossR’000
Shareappreci-
ationrights
payout3
R’000
2015Executive directors
and prescribed officer
For services, as employees, to subsidiary companies
Current directorsAllen Ambor 2 814 272 554 94 3 734 1 343 591 5 668 1 772 Pierre van Tonder 3 890 272 475 134 4 771 4 648 768 10 187 5 617 Mark Farrelly 2 369 272 350 77 3 068 3 224 477 6 769 3 899 Ronel van Dijk 2 253 – 293 – 2 546 2 640 435 5 621 3 123 Total executive
directors 11 326 816 1 672 305 14 119 11 855 2 271 28 245 14 411
Prescribed officerKevin Robertson 1 686 226 249 102 2 263 2 608 348 5 219 3 190
Non-executive directors
For services, as directors, to the company
Current directorsDean Hyde 375 – – – 375 – – 375 –Dineo Molefe 375 – – – 375 – – 375 –Keith Getz4 375 – – – 375 – – 375 –Keith Madders5 375 – – – 375 – – 375 –Mntungwa Morojele 375 – – – 375 – – 375 –Muzi Kuzwayo 375 – – – 375 – – 375 – 2 250 – – – 2 250 – – 2 250 –
For services, as directors, to subsidiary companies
Current directorsKeith Getz4 165 – – – 165 – – 165 –Keith Madders5 142 – – – 142 – – 142 – 307 – – – 307 – – 307 –
Total non-executive directors 2 557 – – – 2 557 – – 2 557 –
Total remuneration 15 569 1 042 1 921 407 18 939 14 463 2 619 36 021 17 601
Senior managers7
Senior manager 1 1 369 – 205 76 1 650 666 263 2 579 806 Senior manager 2 1 409 – 211 – 1 620 666 258 2 544 806 Senior manager 3 1 127 148 225 53 1 553 658 224 2 435 806
Refer to page 154 for footnotes.
NOTES TO THE CONSOLIDATED FINANCIAL STATEMENTS
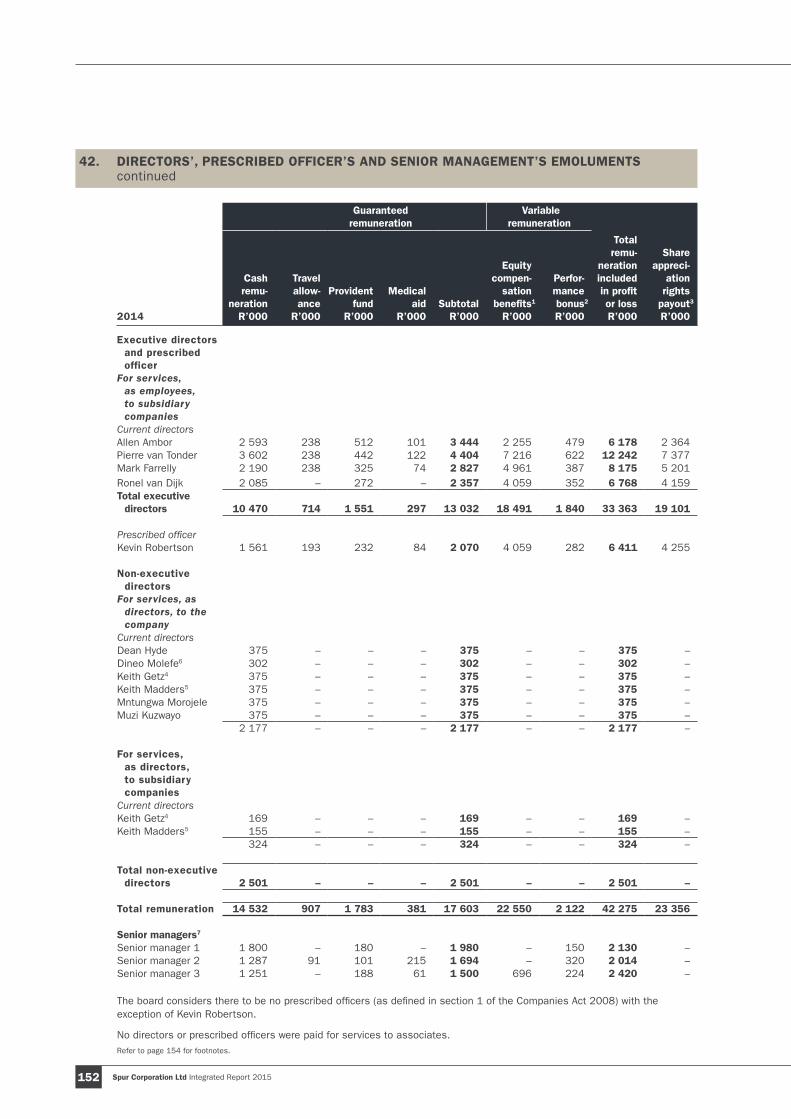
Spur Corporation Ltd Integrated Report 2015152
42. DIRECTORS’, PRESCRIBED OFFICER’S AND SENIOR MANAGEMENT’S EMOLUMENTS continued
Guaranteed
remuneration Variable
remuneration
2014
Cashremu-
nerationR’000
Travelallow-ance
R’000
Providentfund
R’000
Medicalaid
R’000Subtotal
R’000
Equity compen-
sationbenefits1
R’000
Perfor-mancebonus2
R’000
Totalremu-
nerationincludedin profitor lossR’000
Shareappreci-
ationrights
payout3
R’000
Executive directors and prescribed officer
For services, as employees, to subsidiary companies
Current directorsAllen Ambor 2 593 238 512 101 3 444 2 255 479 6 178 2 364 Pierre van Tonder 3 602 238 442 122 4 404 7 216 622 12 242 7 377 Mark Farrelly 2 190 238 325 74 2 827 4 961 387 8 175 5 201 Ronel van Dijk 2 085 – 272 – 2 357 4 059 352 6 768 4 159 Total executive
directors 10 470 714 1 551 297 13 032 18 491 1 840 33 363 19 101
Prescribed officerKevin Robertson 1 561 193 232 84 2 070 4 059 282 6 411 4 255
Non-executive
directorsFor services, as
directors, to the company
Current directorsDean Hyde 375 – – – 375 – – 375 –Dineo Molefe6 302 – – – 302 – – 302 –Keith Getz4 375 – – – 375 – – 375 –Keith Madders5 375 – – – 375 – – 375 –Mntungwa Morojele 375 – – – 375 – – 375 –Muzi Kuzwayo 375 – – – 375 – – 375 – 2 177 – – – 2 177 – – 2 177 –
For services, as directors, to subsidiary companies
Current directorsKeith Getz4 169 – – – 169 – – 169 –Keith Madders5 155 – – – 155 – – 155 – 324 – – – 324 – – 324 –
Total non-executive directors 2 501 – – – 2 501 – – 2 501 –
Total remuneration 14 532 907 1 783 381 17 603 22 550 2 122 42 275 23 356
Senior managers7
Senior manager 1 1 800 – 180 – 1 980 – 150 2 130 –Senior manager 2 1 287 91 101 215 1 694 – 320 2 014 –Senior manager 3 1 251 – 188 61 1 500 696 224 2 420 –
The board considers there to be no prescribed officers (as defined in section 1 of the Companies Act 2008) with the exception of Kevin Robertson.
No directors or prescribed officers were paid for services to associates.Refer to page 154 for footnotes.

Spur Corporation Ltd Integrated Report 2015 153
The following number of share appreciation rights have been allocated to directors, prescribed officers and senior managers in terms of the long-term share-linked retention scheme and were outstanding as at the reporting date (refer note 23):
Rights – tranche 2
2015000’s
2014000’s
Executive directors and prescribed officerAllen Ambor – 110 Pierre van Tonder – 352 Mark Farrelly – 242 Ronel van Dijk – 198 Kevin Robertson (prescribed officer) – 198
– 1 100 Senior managers7
Senior manager 1 – –Senior manager 2 – –Senior manager 3 – 50
– 50
Total rights allocated – 1 150
Rights – tranche 3
2015000’s
2014000’s
Executive directors and prescribed officerAllen Ambor 110 110 Pierre van Tonder 352 352 Mark Farrelly 242 242 Ronel van Dijk 198 198 Kevin Robertson (prescribed officer) 198 198
1 100 1 100 Senior managers7
Senior manager 1 50 –Senior manager 2 50 –Senior manager 3 50 50
150 50
Total rights allocated 1 250 1 150
Rights – tranche 4
2015000’s
2014000’s
Executive directors and prescribed officerAllen Ambor 110 110 Pierre van Tonder 352 352 Mark Farrelly 242 242 Ronel van Dijk 198 198 Kevin Robertson (prescribed officer) 198 198
1 100 1 100 Senior managers7
Senior manager 1 50 –Senior manager 2 50 –Senior manager 3 50 50
150 50
Total rights allocated 1 250 1 150
Refer to page 154 for footnotes.
NOTES TO THE CONSOLIDATED FINANCIAL STATEMENTS
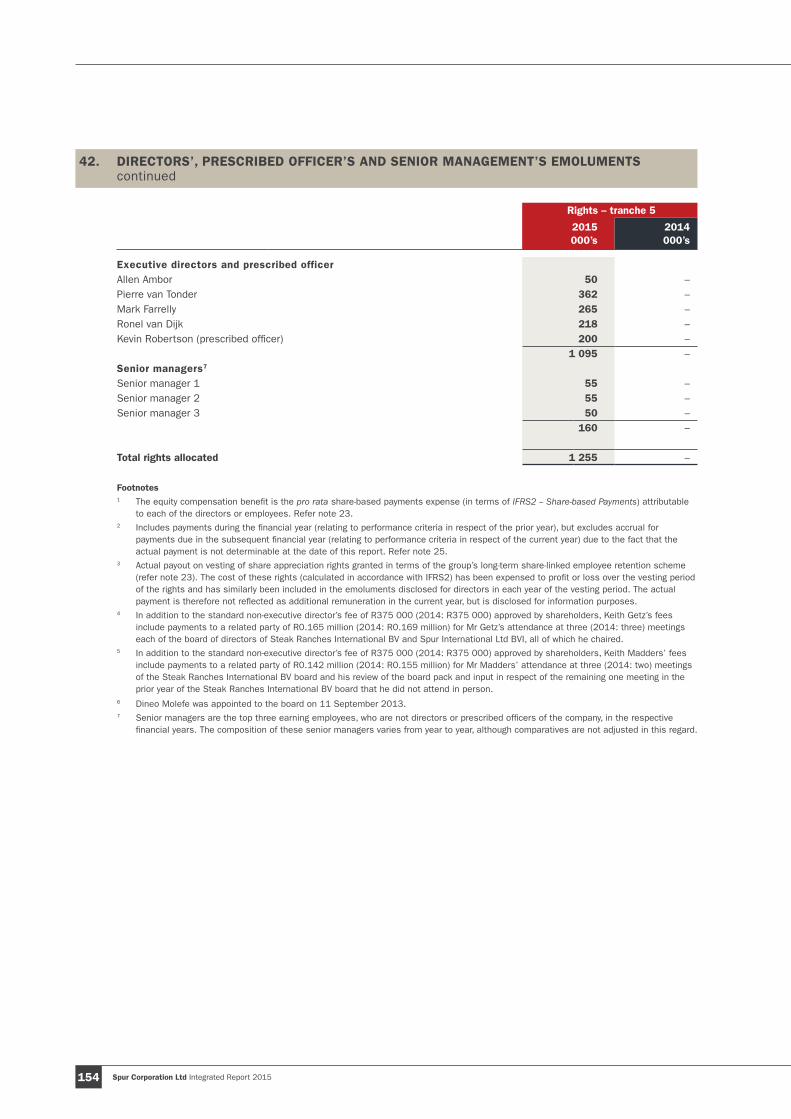
Spur Corporation Ltd Integrated Report 2015154
42. DIRECTORS’, PRESCRIBED OFFICER’S AND SENIOR MANAGEMENT’S EMOLUMENTS continued
Rights – tranche 5
2015000’s
2014000’s
Executive directors and prescribed officerAllen Ambor 50 –Pierre van Tonder 362 –Mark Farrelly 265 –Ronel van Dijk 218 –Kevin Robertson (prescribed officer) 200 –
1 095 –Senior managers7
Senior manager 1 55 –Senior manager 2 55 –Senior manager 3 50 –
160 –
Total rights allocated 1 255 –
Footnotes1 The equity compensation benefit is the pro rata share-based payments expense (in terms of IFRS2 – Share-based Payments) attributable
to each of the directors or employees. Refer note 23.2 Includes payments during the financial year (relating to performance criteria in respect of the prior year), but excludes accrual for
payments due in the subsequent financial year (relating to performance criteria in respect of the current year) due to the fact that the actual payment is not determinable at the date of this report. Refer note 25.
3 Actual payout on vesting of share appreciation rights granted in terms of the group’s long-term share-linked employee retention scheme (refer note 23). The cost of these rights (calculated in accordance with IFRS2) has been expensed to profit or loss over the vesting period of the rights and has similarly been included in the emoluments disclosed for directors in each year of the vesting period. The actual payment is therefore not reflected as additional remuneration in the current year, but is disclosed for information purposes.
4 In addition to the standard non-executive director’s fee of R375 000 (2014: R375 000) approved by shareholders, Keith Getz’s fees include payments to a related party of R0.165 million (2014: R0.169 million) for Mr Getz’s attendance at three (2014: three) meetings each of the board of directors of Steak Ranches International BV and Spur International Ltd BVI, all of which he chaired.
5 In addition to the standard non-executive director’s fee of R375 000 (2014: R375 000) approved by shareholders, Keith Madders’ fees include payments to a related party of R0.142 million (2014: R0.155 million) for Mr Madders’ attendance at three (2014: two) meetings of the Steak Ranches International BV board and his review of the board pack and input in respect of the remaining one meeting in the prior year of the Steak Ranches International BV board that he did not attend in person.
6 Dineo Molefe was appointed to the board on 11 September 2013.7 Senior managers are the top three earning employees, who are not directors or prescribed officers of the company, in the respective
financial years. The composition of these senior managers varies from year to year, although comparatives are not adjusted in this regard.

Spur Corporation Ltd Integrated Report 2015 155
43. RELATED PARTY DISCLOSURES
43.1 TRANSACTIONS BETWEEN GROUP ENTITIES During the year, in the ordinary course of business, certain companies within the group entered into transactions which have been eliminated on consolidation. Notes 14.2 and 14.3 provide detail on the loans to associate. Also refer to note 10 of the separate financial statements on page 181 for guarantees given to subsidiary companies.
Interest income for the year on the loans to associate detailed in notes 14.2 and 14.3 amounted to R4.093 million (2014: R0.938 million).
43.2 IDENTITY OF RELATED PARTIES A number of the group’s directors, previous directors, prescribed officers and key management personnel (or parties related to them) hold positions in other entities, where they may have significant influence over the financial or operating policies of those entities. To the extent that the group has any relationship or dealings with those entities, they are listed as follows:
Director/former director/prescribed officer Entity Relationship with entity
Keith Getz Bernadt Vukic Potash & Getz Partner
Keith Madders Gemini Mood Trading 294 (Pty) Ltd (note i)Kamplans Ltd2
Spur Ekwiti Restaurants (Pty) Ltd (note ii)
49% Shareholder100% Indirect49% Shareholder
Keith Madders (Son 1) Gold Rush Steak Ranch (Pty) Ltd (trading as Gold Rush Spur)1 5% Shareholder
Keith Madders (Son 2) Gold Rush Steak Ranch (Pty) Ltd (trading as Gold Rush Spur)1 5% Shareholder
Kevin Robertson Randtip 29 (Pty) Ltd (trading as Arrow Ridge Spur)1 15% Shareholder
Kevin Robertson (Spouse) Bravopix 359 CC (trading as Panarottis Lakeside Mall)1, 5
Brentwood Restaurant (Pty) Ltd (trading as Lone Spur)1, 3
Clearpan (Pty) Ltd (trading as Panarottis Clear Water Mall)1
Limorox (Pty) Ltd (trading as Albuquerque Spur)1, 3
25% Member25% Shareholder20% Shareholder25% Shareholder
Mark Farrelly Amarillo Steak Ranch (Pty) Ltd (trading as Amarillo Spur)1
Apache Dawn (Pty) Ltd (trading as The Hussar Grill Somerset West)1, 3
Barleda 293 CC (trading as Cancun Spur)1
Calma Investments (Pty) Ltd (trading as John Dory’s Middelburg)1, 3
Gold Rush Steak Ranch (Pty) Ltd (trading as Gold Rush Spur)1
Lexmar Entertainment CCStone Eagle Steak Ranch (Pty) Ltd (trading as 7 Eagles Spur)1
25% Shareholder
20% Shareholder25% Member
10% Shareholder22% Shareholder50% Member20% Shareholder
Mark Farrelly (Brother) Amarillo Steak Ranch (Pty) Ltd (trading as Amarillo Spur)1 10% Shareholder
Mark Farrelly (Daughter) Dog and Deer Productions Sole proprietor
Pierre van TonderMeltrade 286 CC (trading as Silver Dollar Spur)1
Seasons Find 976 CC (trading as Ottawa Spur)1
25% Member25% Member
Refer to page 160 for notes and footnotes.
NOTES TO THE CONSOLIDATED FINANCIAL STATEMENTS
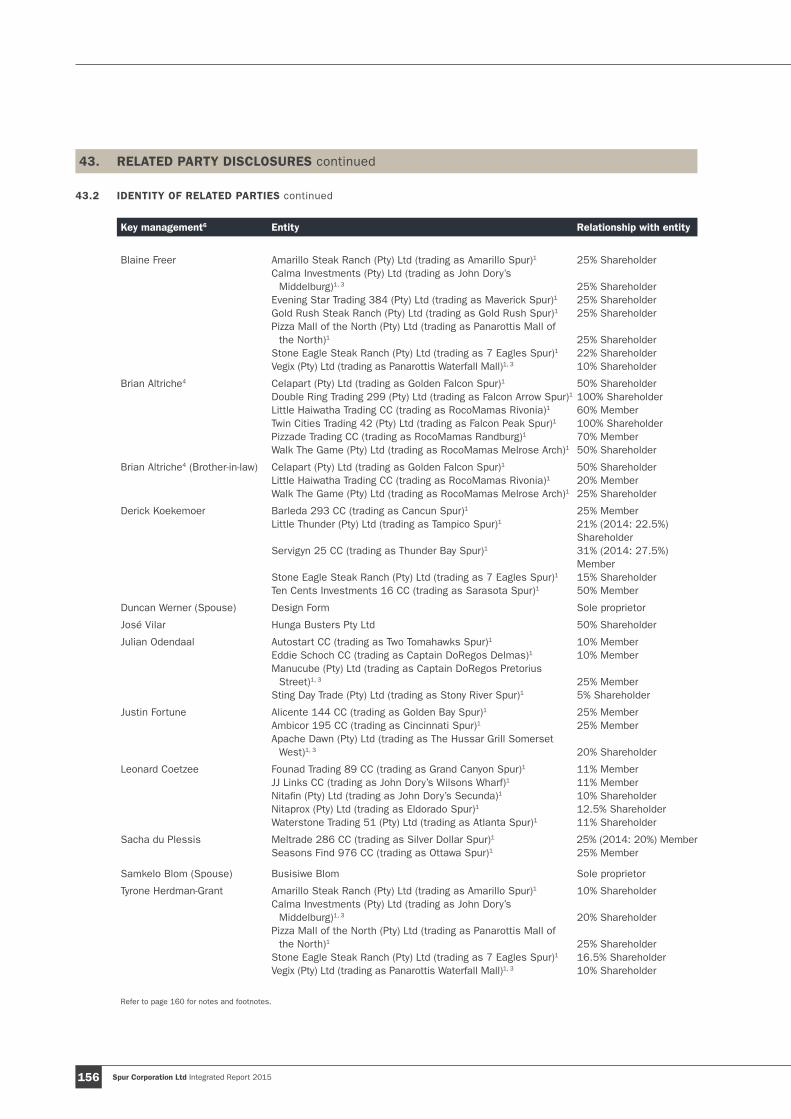
Spur Corporation Ltd Integrated Report 2015156
43. RELATED PARTY DISCLOSURES continued
43.2 IDENTITY OF RELATED PARTIES continued
Key management6 Entity Relationship with entity
Blaine Freer Amarillo Steak Ranch (Pty) Ltd (trading as Amarillo Spur)1
Calma Investments (Pty) Ltd (trading as John Dory’s Middelburg)1, 3
Evening Star Trading 384 (Pty) Ltd (trading as Maverick Spur)1
Gold Rush Steak Ranch (Pty) Ltd (trading as Gold Rush Spur)1
Pizza Mall of the North (Pty) Ltd (trading as Panarottis Mall of the North)1
Stone Eagle Steak Ranch (Pty) Ltd (trading as 7 Eagles Spur)1
Vegix (Pty) Ltd (trading as Panarottis Waterfall Mall)1, 3
25% Shareholder
25% Shareholder25% Shareholder25% Shareholder
25% Shareholder22% Shareholder10% Shareholder
Brian Altriche4 Celapart (Pty) Ltd (trading as Golden Falcon Spur)1
Double Ring Trading 299 (Pty) Ltd (trading as Falcon Arrow Spur)1
Little Haiwatha Trading CC (trading as RocoMamas Rivonia)1
Twin Cities Trading 42 (Pty) Ltd (trading as Falcon Peak Spur)1
Pizzade Trading CC (trading as RocoMamas Randburg)1
Walk The Game (Pty) Ltd (trading as RocoMamas Melrose Arch)1
50% Shareholder100% Shareholder60% Member100% Shareholder70% Member50% Shareholder
Brian Altriche4 (Brother-in-law) Celapart (Pty) Ltd (trading as Golden Falcon Spur)1
Little Haiwatha Trading CC (trading as RocoMamas Rivonia)1
Walk The Game (Pty) Ltd (trading as RocoMamas Melrose Arch)1
50% Shareholder20% Member25% Shareholder
Derick Koekemoer Barleda 293 CC (trading as Cancun Spur)1
Little Thunder (Pty) Ltd (trading as Tampico Spur)1
Servigyn 25 CC (trading as Thunder Bay Spur)1
Stone Eagle Steak Ranch (Pty) Ltd (trading as 7 Eagles Spur)1
Ten Cents Investments 16 CC (trading as Sarasota Spur)1
25% Member21% (2014: 22.5%) Shareholder31% (2014: 27.5%) Member15% Shareholder50% Member
Duncan Werner (Spouse) Design Form Sole proprietor
José Vilar Hunga Busters Pty Ltd 50% Shareholder
Julian Odendaal Autostart CC (trading as Two Tomahawks Spur)1
Eddie Schoch CC (trading as Captain DoRegos Delmas)1
Manucube (Pty) Ltd (trading as Captain DoRegos Pretorius Street)1, 3
Sting Day Trade (Pty) Ltd (trading as Stony River Spur)1
10% Member10% Member
25% Member5% Shareholder
Justin Fortune Alicente 144 CC (trading as Golden Bay Spur)1
Ambicor 195 CC (trading as Cincinnati Spur)1
Apache Dawn (Pty) Ltd (trading as The Hussar Grill Somerset West)1, 3
25% Member25% Member
20% Shareholder
Leonard Coetzee Founad Trading 89 CC (trading as Grand Canyon Spur)1
JJ Links CC (trading as John Dory’s Wilsons Wharf)1
Nitafin (Pty) Ltd (trading as John Dory’s Secunda)1
Nitaprox (Pty) Ltd (trading as Eldorado Spur)1
Waterstone Trading 51 (Pty) Ltd (trading as Atlanta Spur)1
11% Member11% Member10% Shareholder12.5% Shareholder11% Shareholder
Sacha du Plessis Meltrade 286 CC (trading as Silver Dollar Spur)1
Seasons Find 976 CC (trading as Ottawa Spur)1
25% (2014: 20%) Member25% Member
Samkelo Blom (Spouse) Busisiwe Blom Sole proprietor
Tyrone Herdman-Grant Amarillo Steak Ranch (Pty) Ltd (trading as Amarillo Spur)1
Calma Investments (Pty) Ltd (trading as John Dory’s Middelburg)1, 3
Pizza Mall of the North (Pty) Ltd (trading as Panarottis Mall of the North)1
Stone Eagle Steak Ranch (Pty) Ltd (trading as 7 Eagles Spur)1
Vegix (Pty) Ltd (trading as Panarottis Waterfall Mall)1, 3
10% Shareholder
20% Shareholder
25% Shareholder16.5% Shareholder10% Shareholder
Refer to page 160 for notes and footnotes.

Spur Corporation Ltd Integrated Report 2015 157
43.3 TRANSACTIONS WITH RELATED PARTIESRefer note 19 for details on trade receivables from related parties. No individual trade receivable is material. The trade receivables with related party franchisees are subject to the same credit terms as for independent franchisees. None of the trade receivables are overdue. The trade receivables are secured by personal suretyships issued by the signatories to the franchise agreements, as with all other franchise agreements.
Amarillo Steak Ranch (Pty) Ltd (trading as Amarillo Spur) (Mark Farrelly; Mark Farrelly’s brother; Blaine Freer; Tyrone Herdman-Grant) This outlet serves as a training facility used by the group’s training department to train other franchisees. The group paid this outlet R62 048 (2014: R134 164) for the training services provided (refer note iii).
The group paid the franchisee an amount in respect of sales incentives (refer note v) of Rnil (2014: R775).
Apache Dawn (Pty) Ltd (trading as The Hussar Grill Somerset West) (Justin Fortune; Mark Farrelly)The group has granted this outlet temporary franchise fee concessions (refer note vi) in the amount of R5 847.
The group provided marketing assistance (refer note iv) to the outlet in the amount of R3 400.
Autostart CC (trading as Two Tomahawks Spur) (Julian Odendaal)The group paid the franchisee an amount in respect of sales incentives (refer note v) of Rnil (2014: R1 550).
The group provided marketing assistance (refer note iv) to the outlet in the amount of R1 700.
Barleda 293 CC (trading as Cancun Spur) (Mark Farrelly; Derick Koekemoer)This outlet serves as a training facility used by the group’s training department to train other franchisees. The group paid this outlet Rnil (2014: R80 950) for the training services provided (refer note iii).
Bernadt Vukic Potash & Getz (Keith Getz) Bernadt Vukic Potash & Getz serves as the group’s principal legal counsel and has provided legal services (other than services included with directors’ emoluments per note 42) on various matters in the ordinary course of business to the value of R1 636 829 (2014: R2 340 428). Bernadt Vukic Potash & Getz charges the group hourly rates that are commensurate with the rates charged to its other clients.
Busisiwe Blom (Samkelo Blom’s spouse)The group paid an amount of R1 440 (2014: Rnil) to Mrs Blom for catering services provided to the group.
Bravopix 359 CC (trading as Panarottis Lakeside Mall) (Kevin Robertson’s spouse)The group provided marketing assistance (refer note iv) to the outlet in the amount of Rnil (2014: R4 847).
Calma Investments (Pty) Ltd (trading as John Dory’s Middelburg) (Blaine Freer; Mark Farrelly; Tyrone Herdman-Grant) This outlet serves as a training facility used by the group’s training department to train other franchisees. The group paid this outlet R6 600 for the training services provided (refer note iii).
The group has granted this outlet temporary marketing and franchise fee concessions (refer note vi) in the amount of R93 570.
The group provided marketing assistance (refer note iv) to the outlet in the amount of R18 806.
Clearpan (Pty) Ltd (trading as Panarottis Clear Water Mall) (Kevin Robertson’s spouse)The group provided marketing assistance (refer note iv) to the outlet in the amount of R4 386.
Design Form (Duncan Werner’s spouse) Karen Werner trading as Design Form provided architectural and design services to the group in the amount of R445 127 (2014: R324 576). The services are provided largely to franchisees (with their consent) and any costs so incurred by the group are recovered, for the most part, from franchisees. The fee charged to the group’s franchisees is consistent with the fee that Design Form charges any other party. In addition, during the year, Design Form provided the group with project management services relating to the building of the group’s new corporate offices in Century City (refer note 11.2).
Dog and Deer Productions (Mark Farrelly’s daughter)Dog and Deer Productions provided internal marketing-related services to the group in the amount of Rnil (2014: R20 000).
Eddie Schoch CC (Captain DoRegos Delmas) (Julian Odendaal) The group has granted this outlet temporary marketing and franchise fee concessions (refer note vi) in the amount of R138 130 (2014: R25 835).
Refer to page 160 for notes and footnotes.
NOTES TO THE CONSOLIDATED FINANCIAL STATEMENTS
Spur Corporation Ltd Integrated Report 2015158
43. RELATED PARTY DISCLOSURES continued
43.3 TRANSACTIONS WITH RELATED PARTIES continuedFounad Trading 89 CC (trading as Grand Canyon Spur) (Leonard Coetzee)The group paid the franchisee an amount of R51 068 (2014: R94 684) in respect of outdoor events catering (refer note vii).
The group provided marketing assistance (refer note iv) to the outlet in the amount of Rnil (2014: R4 884).
Golden Gate Steak Ranch (Pty) Ltd (trading as Golden Gate Spur) (Keith Madders) The group had previously granted this outlet temporary marketing and franchise fee concessions (refer note vi) in the amount of R203 877 in the prior year, prior to Mr Madders’ disposing of his interest in this outlet.
Gold Rush Steak Ranch (Pty) Ltd (trading as Gold Rush Spur) (Mark Farrelly; Blaine Freer; Keith Madders; Keith Madders’ sons) This outlet serves as a training facility used by the group’s training department to train other franchisees. The group paid this outlet R86 879 (2014: R59 800) for the training services provided (refer note iii).
The group paid the franchisee an amount in respect of sales incentives (refer note v) of Rnil (2014: R543).
Hunga Busters Pty Ltd (José Vilar) During the year, the group disposed of its equity interest in Panpen Pty Ltd (Australia), and the business of Silver Spur (Australia) as a going concern, to Hunga Busters Pty Ltd for an aggregate purchase consideration of AU$1 200 000 (the equivalent of R11.165 million) on loan account. Details of the transactions are included in notes 35.2 and 35.3 respectively and the terms of the loan together with the outstanding balance at the reporting date are included in note 14.8. The directors determined the sales prices of the respective businesses by employing an earnings-multiple valuation technique (which is a generally accepted valuation technique in the restaurant industry), using the expected profit of the respective businesses and a multiple which the directors considered reasonable in relation to similar transactions of this nature.
JJ Links CC (trading as John Dory’s Wilsons Wharf) (Leonard Coetzee)The group paid the franchisee an amount in respect of sales incentives (refer note v) of R1 947 (2014: R4 000).
The group reimbursed the restaurant for catering services of R3 750.
This outlet serves as a training facility used by the group’s training department to train other franchisees. The group paid this outlet Rnil (2014: R21 086) for the training services provided (refer note iii).
Kamplans Ltd (Keith Madders) Kamplans Ltd provided the consulting services of Keith Madders to the group (other than services included with directors’ emoluments per note 42). An amount of £50 698 (2014: £789), the equivalent of R919 494 (2014: R13 335), was paid in respect of direct and incidental costs relating to services provided to group. The fees are charged in terms of a consultancy agreement that was terminated during the year.
Lexmar Entertainment CC (Mark Farrelly) Lexmar Entertainment CC has provided conference facilities to the group amounting to Rnil (2014: R28 527). The board is satisfied that the cost of the facilities provided is reasonable in relation to competitive quotes obtained.
Little Haiwatha Trading CC (trading as RocoMamas Rivonia) (Brian Altriche; Brian Altriche’s brother-in-law) This outlet serves as a training facility used by the group’s training department to train other franchisees. The group paid this outlet R36 800 for the training services provided (refer note iii).
Little Thunder (Pty) Ltd (trading as Tampico Spur) (Derick Koekemoer)The group has granted this outlet temporary marketing and franchise fee concessions (refer note vi) in the amount of R159 537 (2014: Rnil).
The group assisted this outlet with the purchase of kitchen equipment in the amount of R14 740.
Refer to page 160 for notes and footnotes.
Spur Corporation Ltd Integrated Report 2015 159
Manucube (Pty) Ltd (trading as Captain DoRegos Pretorius Street) (Julian Odendaal)The group has granted this outlet temporary marketing and franchise fee concessions (refer note vi) in the amount of R112 026.
The group has granted this entity a loan in the amount of R35 682 to partially fund the refurbishment of the restaurant. The loan bears interest at 1% above the prime rate of interest and is repayable in fixed monthly instalments of R1 000. The carrying value of the loan at the reporting date was R28 388.
Meltrade 286 CC (trading as Silver Dollar Spur) (Pierre van Tonder; Sacha du Plessis)The group paid the franchisee an amount in respect of sales incentives (refer note v) of R2 500.
Nitafin (Pty) Ltd (trading as John Dory’s Secunda) (Leonard Coetzee) The group has granted this outlet temporary marketing and franchise fee concessions (refer note vi) in the amount of R294 438 (2014: R192 810).
The group provided marketing assistance (refer note iv) to the outlet in the amount of R29 549 (2014: Rnil).
Nitaprox (Pty) Ltd (trading as Eldorado Spur) (Leonard Coetzee) The group has granted this outlet temporary marketing and franchise fee concessions (refer note vi) in the amount of R56 362 (2014: Rnil).
The group paid the franchisee an amount in respect of sales incentives (refer note v) of Rnil (2014: R1 550).
The group provided marketing assistance (refer note iv) to the outlet in the amount of R4 386 (2014: Rnil).
Pizza Mall of the North (Pty) Ltd (trading as Panarottis Mall of the North) (Blaine Freer; Tyrone Herdman-Grant) The group has granted this outlet temporary marketing and franchise fee concessions (refer note vi) in the amount of R156 838 (2014: R271 226).
This outlet serves as a training facility used by the group’s training department to train other franchisees. The group paid this outlet R4 510 (2014: R27 547) for the training services provided (refer note iii).
Seasons Find CC (trading as Ottawa Spur) (Pierre van Tonder, Sacha du Plessis)The group provided marketing assistance (refer note iv) to the outlet in the amount of R9 000 (2014: R2 352).
The group paid the franchisee an amount in respect of sales incentives (refer note v) of R24 842 (2014: Rnil).
Servigyn 25 CC (trading as Thunder Bay Spur) (Derick Koekemoer) The group has granted this outlet temporary marketing and franchise fee concessions (refer note vi) in the amount of R315 912 (2014: R37 072).
The group assisted this outlet with the purchase of kitchen equipment in the amount of R14 740.
Stone Eagle Steak Ranch (Pty) Ltd (trading as 7 Eagles Spur) (Mark Farrelly; Derick Koekemoer; Blaine Freer; Tyrone Herdman-Grant) This outlet serves as a training facility used by the group’s training department to train other franchisees. The group paid this outlet R24 349 (2014: R94 386) for the training services provided (refer note iii).
Ten Cents Investments 16 CC (trading as Sarasota Spur) (Derick Koekemoer) The group has granted this outlet temporary marketing and franchise fee concessions (refer note vi) in the amount of Rnil (2014: R363 697).
The group paid the franchisee an amount in respect of sales incentives (refer note v) of Rnil (2014: R620).
Waterstone Trading 51 (Pty) Ltd (trading as Atlanta Spur) (Leonard Coetzee)The group paid the franchisee an amount in respect of sales incentives (refer note v) of Rnil (2014: R542).
The group provided marketing assistance (refer note iv) to the outlet in the amount of Rnil (2014: R822).
Refer to page 160 for notes and footnotes.
NOTES TO THE CONSOLIDATED FINANCIAL STATEMENTS
Spur Corporation Ltd Integrated Report 2015160
43. RELATED PARTY DISCLOSURES continued
43.3 TRANSACTIONS WITH RELATED PARTIES continuedNotes i) Gemini Moon Trading 294 (Pty) Ltd holds a 28% interest in Gold Rush Steak Ranch (Pty) Ltd (trading as Gold
Rush Spur)1.
ii) Spur Ekwiti Restaurants (Pty) Ltd previously owned a 30% interest in Golden Gate Steak Ranch (Pty) Ltd (trading as Golden Gate Spur)1, but the entity disposed of this interest during the prior year.
iii) Training fees: Fees to outlets which serve as training facilities are determined based on the number of delegates trained and the number of days each delegate is trained. The fee charged is the same fee charged by other training stores (which are not related parties).
iv) Marketing assistance: Marketing assistance is provided to franchisees as the need arises. Typically, this is to compensate a franchisee for piloting a new concept or to assist a franchisee in minimising the negative impact of competing brands in the outlet’s proximity. The basis for determining the assistance is the same as for any other franchisee (which is not a related party).
v) Sales incentives: Sales incentives are paid to franchisees based on sales of a particular item which is subject to promotion. The incentives are usually financed in the main by the suppliers whose products are the subject of the promotion. The terms applicable to the incentive payments are the same as for any other franchisee (which is not a related party).
vi) Temporary concession: The concession is a percentage of franchise and/or advertising fee income that would ordinarily be collected by the group in terms of the standard franchise agreement. Franchise and marketing fee concessions are granted to franchisees in the ordinary course of business to provide relief from some temporary external influence (outside of the franchisee’s control) which has a negative impact on the franchisee’s profitability and may threaten the sustainability of the outlet. Examples of such circumstances include increased competitive activity in the proximity of the restaurant, construction or other interference impeding foot traffic and excessive rentals (provided that these are in the process of being renegotiated). The concession is subject to strict authorisation protocols and is conditional upon the franchisee complying with all of the group’s operational requirements. The concession may be withdrawn at the group’s discretion at any time. Any franchisee (including one which is not a related party) is eligible for a concession should the circumstances so dictate and each case is considered on its own merits after careful scrutiny of franchisee financial records and other supporting documentation.
vii) Outdoor events catering: The group has outsourced its outdoor events catering trailers to certain franchisees. The franchisees in question are paid a vending fee for each event depending on the duration of the event and the distance travelled. The terms applied are the same as those applied to any other franchisee (which is not a related party) who manages an outdoor catering trailer.
viii) With reference to notes iii, iv, vi and vii above, in terms of the group’s Conflict of Interest Policy, the director, previous director, prescribed officer or member of key management personnel in question is excluded from participating in any decision in these matters. With reference to note vi, any concession granted to a restaurant in which a director or prescribed officer has an interest must be approved by a disinterested quorum of the board.
Footnotes1 These entities are franchisees. Franchise fees and advertising fees of between 3% and 5% and between 2% and 4% of restaurant
turnover respectively (depending on the brand) are collected by the group in terms of the standard franchise agreement, unless otherwise indicated under the related party transactions described above.
2 This interest is held indirectly through a trust. The director in question is a beneficiary of the trust.3 These interests were acquired during the current year.4 These individuals became key management personnel during the current year.5 These interests were disposed of during the year.6 Key management are listed on page 13 and exclude directors and prescribed officers (directors’ and prescribed officer’s emoluments are
detailed in note 42).7 Actual payout on vesting of share appreciation rights granted in terms of the group’s long-term share-linked employee retention scheme
(refer note 23). The cost of these rights (calculated in accordance with IFRS2) has been expensed to profit or loss over the vesting period of the rights and has similarly been included in the key management personnel compensation in each year of the vesting period. The actual payment is therefore not reflected as additional compensation in the current year, but is disclosed for information purposes.

Spur Corporation Ltd Integrated Report 2015 161
43.4 KEY MANAGEMENT6
The key management personnel compensation is as follows:
2015R’000
2014R’000
Short-term employee benefits 20 778 18 535Other long-term benefits 2 302 2 015Equity compensation benefits (refer note 23) 5 271 5 567Total remuneration included in profit or loss before income tax 28 351 26 117
In addition to the above, payments made in terms of the group’s long-term share-linked employee retention scheme7 6 444 –
Key management comprises 17 (2014: 16) employees.
In addition to the above, emoluments to directors and prescribed officers amounted to (refer note 42) 36 021 42 275
Refer to page 160 for footnotes.
44. SUBSEQUENT EVENTS
Subsequent to the reporting date, but prior to the date of issue of this report, the following significant transactions occurred:
44.1 DIVIDENDS The board declared a final dividend of 70.0 cents per ordinary share in respect of the 2015 financial year payable on 5 October 2015 as referred to in note 27 and in the directors’ report on page 82 of this report.
44.2 DISPOSAL OF SILVER LAKE SPUR (ENGLAND) Subsequent to the reporting date, on 15 July 2015, the group sold the lease and certain assets of Larkspur Two Ltd, a wholly-owned UK subsidiary operating the Silver Lake Spur in Lakeside, for £412 500 (the equivalent of R7.946 million at the transaction date) in cash. At 30 June 2015, the carrying value of the property, plant and equipment in the statement of financial position amounted to R4.405 million and goodwill of R0.445 million was attributable to the cash-generating unit. The outlet earned revenue of R21.893 million for the year and incurred a loss before income tax of R1.739 million. The final profit/loss arising from the transaction has yet to be determined.
44.3 DISPOSAL OF APACHE SPUR (SCOTLAND) Subsequent to the reporting date, on 22 September 2015, the group surrendered the lease and certain assets of Larkspur Three Ltd, a UK subsidiary in which the group holds an 80% equity interest, operating the Apache Spur in Aberdeen, in exchange for £450 000 (the equivalent of R9.341 million at the transaction date) in cash. At 30 June 2015, the carrying value of the property, plant and equipment in the statement of financial position amounted to R6.235 million. The outlet earned revenue of R19.739 million for the year and incurred a loss before income tax of R1.446 million. The final profit/loss arising from the transaction has yet to be determined.
NOTES TO THE CONSOLIDATED FINANCIAL STATEMENTS

Spur Corporation Ltd Integrated Report 2015162
45. CONTINGENT LIABILITIES
45.1 INCOME TAX IN RESPECT OF CONTROLLED FOREIGN COMPANIES As reported previously, on 24 June 2013, SARS issued Spur Group (Pty) Ltd, a wholly-owned subsidiary of the group, with additional assessments in respect of the additional income relating to controlled foreign companies of the group in the amount of R1.993 million (comprising income tax of R1.561 million and interest of R0.432 million) for the 2009, 2010 and 2011 years of assessment. The assessments were settled in cash in the prior year. The board of the company in question appealed SARS’ decision to partially disallow an objection to the additional assessments and alternate dispute resolution proceedings were initiated in November 2014 with SARS. The company awaits the final determination of the alternate dispute resolution process from SARS. The board continues to be of the view that it is able to defend its position. Consequently, a liability has not been raised in respect of the assessments issued, or the possible liability arising from the same disputed issue for the 2012 to 2015 years of assessment.
45.2 INCOME TAX IN RESPECT OF 2004-2009 SHARE INCENTIVE SCHEME On 9 December 2014, following an audit of Spur Group (Pty) Ltd, SARS issued additional assessments to that company in respect of the 2010 to 2012 years of assessment totalling R6.589 million (comprising R5.098 million in tax and R1.491 million in interest). The additional assessments were issued following the disallowance of a deduction claimed in respect of the 2004-2009 share incentive scheme. The assessments were settled in cash on 30 January 2015. The board of the company in question objected to the additional assessments on 19 March 2015 but the objection was disallowed by SARS on 11 June 2015. The board appealed the disallowance of the objection on 14 July 2015, requesting that the matter be referred to alternate dispute resolution proceedings. On 28 July 2015, SARS issued additional assessments regarding the same matter for the 2005 to 2009 years of assessment amounting to R15.445 million (comprising R8.898 million in additional income tax and R6.547 million in interest). The board objected to these assessments on 13 August 2015. The board, in consultation with its tax advisors, remains confident that it will be able to prove that SARS has erred in disallowing the deduction and consequently, no liability has been raised in respect of the assessments issued to date.
45.3 LEGAL DISPUTE WITH FORMER ZAMBIAN FRANCHISEE As reported in the prior year, in 2012 Steak Ranches Ltd (“SRL”) instituted action against a wholly-owned subsidiary of the group, Steak Ranches International BV (“SRIBV”), a company incorporated and domiciled in The Netherlands, for allegedly repudiating a franchise agreement previously concluded between the parties. SRL is an unrelated entity incorporated and domiciled in Zambia. SRIBV previously concluded a franchise agreement with SRL for a franchised outlet in Zambia, but cancelled that agreement after SRL breached the terms of the agreement.
SRL is claiming for special damages in the amount of US$648 152, pecuniary damages in the amount of US$4 236 041 and an unquantified amount of general damages arising out of the alleged repudiation, together with interest and costs.
SRIBV is defending the action, denying the repudiation of the franchise agreement. SRIBV avers that it validly cancelled the agreement as SRL breached the terms thereof. The board of SRIBV is confident that it will be able to defend the claim successfully. A court date has yet to be determined.
Spur Corporation Ltd Integrated Report 2015 163
46. SIGNIFICANT ACCOUNTING POLICIES
The significant accounting policies set out below have been applied consistently, in all material respects, to all years presented in these consolidated financial statements.
46.1 BASIS OF CONSOLIDATION46.1.1 Investment in subsidiaries
The group financial statements include the financial statements of the company and the entities that it controls. The group controls an entity when it is exposed to, or has the right to, variable returns from its involvement with that entity and has the ability to affect those returns through its power over that entity. The financial statements of subsidiaries are included in the consolidated financial statements of the group from the date that control commences until the date that control ceases.
The company carries its investments in subsidiaries at cost less impairment losses in its separate financial statements.
46.1.2 Investment in associatesAssociates are those entities in which the group has significant influence, but not control, over the financial and operating policies. Significant influence is presumed to exist when the group holds between 20% and 50% of the voting power of another entity. Associates are accounted for using the equity method and are initially recognised at cost, which includes transaction costs. The consolidated financial statements include the group’s share of the profit or loss and other comprehensive income of equity-accounted investees, after adjustments to align the accounting policies with those of the group from the date that significant influence commences until the date that significant influence ceases. When the group’s share of losses exceeds its investment in an equity-accounted investee (including any loan receivable or other financial instrument that forms part of the net investment in the investee), the carrying amount of the investment (including any loan receivable or other financial instrument that forms part of the net investment in the investee) is reduced to nil and recognition of further losses is discontinued except to the extent that the group has incurred legal or constructive obligations or made payments on behalf of the investee.
46.1.3 Transactions eliminated on consolidationIntragroup balances and any unrealised gains and losses or income and expenses arising from intragroup transactions are eliminated in preparing the consolidated financial statements. Unrealised gains arising from transactions with equity-accounted investees are eliminated against the investment to the extent of the group’s interest in the entity. Unrealised losses are eliminated in the same way as unrealised gains, but only to the extent that there is no evidence of impairment.
46.1.4 Functional and presentation currencyAll items in the financial statements of the group’s subsidiaries are measured using the currency of the primary economic environment in which the subsidiary operates (“the functional currency”). The group’s consolidated financial statements are presented in South African rands, which is the company’s functional currency and the group’s presentation currency.
46.1.5 Financial statements of foreign operationsThe assets and liabilities of foreign operations, including goodwill and fair value adjustments arising on acquisition, are translated to rands at foreign exchange rates ruling at the reporting date. The revenues and expenses of foreign operations are translated to rands at rates approximating the foreign exchange rates ruling at the dates of the transactions. Foreign exchange differences arising on translation are recognised in other comprehensive income and presented in equity in the foreign currency translation reserve (“FCTR”).
46.1.6 Net investment in foreign operationsWhen the settlement of a monetary item receivable from or payable to a foreign operation is neither planned nor likely in the foreseeable future, the exchange differences arising from such monetary item are considered to be part of the net investment in foreign operations and are recognised in other comprehensive income and presented in equity in the FCTR. When the investment in foreign operation is disposed of (including deregistration or abandonment of a foreign operation), the relevant amount in the FCTR is transferred to profit or loss.
46.1.7 Non-controlling interestsNon-controlling interests in subsidiaries are identified separately from the group’s equity therein. The interest of non-controlling shareholders may be initially measured either at fair value or at the non-controlling interests’ proportionate share of the fair value of the acquiree’s identifiable net assets. The choice of measurement basis is made on an acquisition-by-acquisition basis, although the group has applied the latter in all cases to date. Subsequent to acquisition, the carrying amount of non-controlling interests is the amount of those interests at initial recognition plus the non-controlling interests’ shares of subsequent changes in equity.
Total comprehensive income is attributed to non-controlling interests even if this results in the non-controlling interests having a deficit balance.
NOTES TO THE CONSOLIDATED FINANCIAL STATEMENTS
Spur Corporation Ltd Integrated Report 2015164
46. SIGNIFICANT ACCOUNTING POLICIES continued
46.1 BASIS OF CONSOLIDATION continued46.1.8 Business combinations and goodwill
Business combinations after 1 July 2009Business combinations occurring on or after 1 July 2009 are accounted for using the acquisition method as at the acquisition date, which is the date on which control is transferred to the group. The cost of an acquisition is measured as the aggregate of the consideration transferred, measured at acquisition date fair value, and the amount of any non-controlling interest in the acquiree. Acquisition costs incurred are recognised as an expense in profit or loss.
If the business combination is achieved in stages, the acquisition date fair value of the acquirer’s previously held equity interest in the acquiree is remeasured to fair value as at the acquisition date through profit or loss.
Any contingent consideration to be transferred by the acquirer is measured at fair value at the acquisition date. Subsequent changes to the fair value of the contingent consideration which is deemed to be an asset or liability will be recognised in accordance with IAS39 – Financial Instruments: Recognition and Measurement in profit or loss. If the contingent consideration is classified as equity, it shall not be remeasured until it is finally settled within equity.
Goodwill is initially measured at cost being the excess of the consideration transferred over the group’s net identifiable assets acquired and liabilities assumed. If this consideration is lower than the fair value of the net assets of the subsidiary acquired, the difference is recognised immediately in profit or loss. After initial recognition, goodwill is measured at cost less any accumulated impairment losses.
Where goodwill forms part of a cash-generating unit and part of the operation within that unit is disposed of, the goodwill associated with the operation disposed of is included in the carrying amount of the operation when determining the gain or loss on disposal of the operation. Goodwill disposed of under these circumstances is measured based on the relative values of the operation disposed of and the portion of the cash-generating unit retained.
Business combinations prior to 30 June 2009In comparison to the above mentioned requirements, the following differences apply:
– Business combinations were accounted for using the purchase method. Transaction costs directly attributable to the acquisition formed part of the acquisition costs. The non-controlling interest was measured at the proportionate share of the acquiree’s identifiable net assets;
– Business combinations achieved in stages were accounted for as separate transactions. Any additional shares acquired did not affect previously recognised goodwill; and
– Contingent consideration was recognised if, and only if, the group had a present obligation, the economic outflow was more likely than not and a reliable estimate was determinable. Subsequent adjustments to the contingent consideration affected goodwill.
46.1.9 Transactions with non-controlling interestsChanges in the group’s interest in a subsidiary that do not result in a loss of control are accounted for as equity transactions. The carrying amounts of the group’s interests and the non-controlling interests are adjusted to reflect the changes in their relative interests in the subsidiary. Any difference between the amount by which the non-controlling interests are adjusted and the fair value of the consideration paid or received is recognised directly in equity and attributed to owners of the company.
46.1.10 Loss of controlWhen the group loses control of a subsidiary, it derecognises the assets and liabilities of the subsidiary and any related non-controlling interest and other components of equity. The profit or loss on disposal is calculated as the difference between (i) the aggregate of the fair value of the consideration received and the fair value of any retained interest and (ii) the previous carrying amount of the assets (including goodwill), and liabilities of the subsidiary and any non-controlling interests. Amounts previously recognised in other comprehensive income in relation to the subsidiary are accounted for (i.e. reclassified to profit or loss or transferred directly to retained earnings) in the same manner as would be required if the relevant assets or liabilities were disposed of.
The fair value of any investment retained in the former subsidiary at the date when control is lost is regarded as the fair value on initial recognition for subsequent accounting under IAS39 – Financial Instruments: Recognition and Measurement or, when applicable, the cost on initial recognition of an investment in an associate or jointly controlled entity.

Spur Corporation Ltd Integrated Report 2015 165
46.2 FOREIGN CURRENCY TRANSACTIONSTransactions denominated in foreign currencies are translated to the respective functional currencies of group entities at the foreign exchange rate ruling at the date of the transaction. Monetary assets and liabilities denominated in foreign currencies at the reporting date are translated to the respective functional currencies at the foreign exchange rate ruling at that date. The foreign currency gain or loss on monetary items is the difference between amortised cost in the functional currency at the beginning of the period, adjusted for effective interest and payments during the period, and amortised cost in foreign currency translated at the exchange rate at the end of the period. Non-monetary assets and liabilities that are measured in terms of historical cost in a foreign currency are translated to the respective functional currencies using the exchange rate at the date of the transaction. Non-monetary assets and liabilities denominated in foreign currencies that are stated at fair value are translated to the respective functional currencies at the foreign exchange rate ruling at the date the fair value was determined. Foreign exchange differences arising on retranslation are recognised in profit or loss, except for differences arising on the retranslation of a financial liability designated as a hedge of the net investment in a foreign operation which are recognised in other comprehensive income and presented in equity in the FCTR.
46.3 PROPERTY, PLANT AND EQUIPMENT46.3.1 Recognition and measurement
Items of property, plant and equipment, including owner-occupied buildings, are stated at cost less accumulated depreciation and accumulated impairment losses. Land is stated at cost less impairment losses. Cost includes expenditure that is directly attributable to the acquisition of the asset. The cost of self-constructed assets includes the cost of material and direct labour, any other costs directly attributable to bringing the assets to a working condition for their intended use, the costs of dismantling and removing the items and restoring the site on which they are located when the group has an obligation to remove the asset or restore the site and capitalised borrowing costs (refer note 46.14.2). Purchased software that is integral to the functionality of the related equipment is capitalised as part of that equipment.
Where parts of an item of property, plant and equipment have different useful lives, they are accounted for as separate components of property, plant and equipment.
46.3.2 Subsequent costsThe group recognises in the carrying amount of an item of property, plant and equipment the cost of replacing a part of such an item when the cost is incurred if it is probable that the economic benefits embodied within the item will flow to the group and the cost of the item can be measured reliably. In such cases, the carrying amount of the replaced part is derecognised. All other costs are recognised in profit or loss in the period they are incurred.
46.3.3 DepreciationDepreciation is recognised in profit or loss on a straight-line basis over the estimated useful lives of each part of an item of property, plant and equipment from the date that they are ready for use. Leasehold improvements are depreciated over the shorter of the lease term or estimated useful life of the assets. Land is not depreciated.
Typically, the estimated useful lives for the current and prior periods are as follows:
– buildings 50 years – plant, equipment and vehicles 3 – 5 years – furniture and fittings 5 – 6.67 years – computer equipment 3 years – leasehold improvement lesser of lease term and 10 years
Depreciation methods, useful lives and residual values are reassessed annually.
46.3.4 DisposalGains or losses on disposal of an item of property, plant and equipment are determined by comparing the proceeds from disposal with the carrying amount of the item and are recognised in profit or loss.
46.4 INTANGIBLE ASSETS (OTHER THAN GOODWILL)46.4.1 Trademarks and franchise rights
Intangible assets are initially recognised at cost if acquired externally, or at fair value if acquired as part of a business combination. Intangible assets which have finite useful lives are stated at cost less accumulated amortisation and accumulated impairment losses. Amortisation is recognised in profit or loss on a straight-line basis over the estimated useful lives of each asset from the date they are ready for use. Intangible assets which have indefinite useful lives are not amortised but are tested for impairment annually. No value is attached to internally developed and maintained trademarks or brand names. Expenditure incurred to maintain trademarks and brand names is recognised in profit or loss as incurred.
Amortisation methods, useful lives and residual values are reassessed annually and are disclosed in the relevant notes to the financial statements (refer note 12).
NOTES TO THE CONSOLIDATED FINANCIAL STATEMENTS
Spur Corporation Ltd Integrated Report 2015166
46. SIGNIFICANT ACCOUNTING POLICIES continued
46.4 INTANGIBLE ASSETS (OTHER THAN GOODWILL) continued46.4.2 Research and development
Expenditure on research activities, undertaken with the prospect of gaining new scientific or technical knowledge and understanding, is recognised in profit or loss as incurred.
Expenditure on development activities, whereby research findings are applied to a plan or design for the production of new or substantially improved products and processes, is capitalised if the product or process is technically and commercially feasible, costs can be measured reliably, future economic benefits are probable and the group has sufficient resources to complete development in order to use or sell the asset. The expenditure capitalised includes the cost of materials, direct labour and an appropriate proportion of overheads. Other development expenditure is recognised in profit or loss as incurred. Capitalised development expenditure is stated at cost less accumulated amortisation and accumulated impairment losses.
46.4.3 Subsequent expenditureSubsequent expenditure on capitalised intangible assets is capitalised only when it increases the future economic benefits embodied in the specific asset to which it relates. All other expenditure is recognised in profit or loss as incurred.
46.4.4 DerecognitionThe gain or loss arising from the derecognition of an intangible asset is the difference between the net disposal proceeds and the carrying amount of the asset, and is recognised in profit or loss when the asset is derecognised.
46.5 IMPAIRMENT46.5.1 Non-financial assets
The carrying amounts of the group’s non-financial assets, other than inventories and deferred tax assets, are reviewed at each reporting date to determine whether there is any indication of impairment. If any such indication exists, the asset’s recoverable amount is estimated.
For goodwill and intangible assets that have an indefinite useful life or that are not yet available for use, the recoverable amount is estimated at each reporting date.
An impairment loss is recognised whenever the carrying amount of an asset or its cash-generating unit exceeds its recoverable amount. Impairment losses are recognised in profit or loss.
Impairment losses recognised in respect of cash-generating units are allocated first to reduce the carrying amount of any goodwill allocated to cash-generating units (group of units) and then to reduce the carrying amount of the other assets in the unit (group of units) on a pro rata basis.
The recoverable amount of an asset or cash-generating unit is the greater of its fair value less costs of disposal and value-in-use. In assessing value-in-use, the estimated future cash flows relating to the asset are discounted to their present value using a pre-tax discount rate that reflects current market assessments of the time value of money and the risks specific to the asset. Fair value less costs of disposal is the price that would be received, at the measurement date, from the sale of an asset or cash-generating unit in an orderly transaction between market participants, less the costs of disposal. For an asset or cash-generating unit that does not generate largely independent cash inflows, the recoverable amount is determined for the cash-generating unit to which the asset belongs.
An impairment loss in respect of goodwill is not reversed. In respect of other non-financial assets, an impairment loss is reversed if there has been a change in the estimates used to determine the recoverable amount. An impairment loss is reversed only to the extent that the asset’s carrying amount does not exceed the carrying amount that would have been determined, net of depreciation or amortisation, if no impairment loss had been recognised. Impairment reversals are recognised in profit or loss.
Spur Corporation Ltd Integrated Report 2015 167
46.5.2 Financial assetsA financial asset is considered to be impaired if objective evidence indicates that one or more events have had a negative effect on the estimated future cash flows of the asset that can be estimated reliably.
An impairment loss in respect of a financial asset measured at amortised cost is reversed if the subsequent increase in recoverable amount can be related objectively to an event occurring after the impairment loss was recognised. Significant financial assets are tested for impairment on an individual basis. The remaining financial assets are assessed collectively in groups that share similar credit risk characteristics.
The recoverable amount of the group’s receivables carried at amortised cost is calculated as the present value of estimated future cash flows, discounted at the original effective interest rate (i.e. the effective interest rate computed at initial recognition of these financial assets). Receivables with a short duration are not discounted. Where the carrying value of an asset exceeds its recoverable amount, the difference is recognised as an impairment loss in profit or loss.
In assessing collective impairment, the group uses historical trends of the probability of default, the timing of recoveries and the amount of loss incurred, adjusted for management’s judgement as to whether current economic and credit conditions are such that the actual losses are likely to be greater or less than suggested by historical trends.
46.6 INVENTORIESInventories are measured at the lower of cost, determined on the first-in-first-out basis, and net realisable value. Net realisable value is the estimated selling price in the ordinary course of business, less the estimated cost of completion and selling expenses. The cost of inventory includes costs incurred in acquiring the inventory and costs incurred in bringing the inventory to its current location and condition.
Cost of manufactured goods includes direct material costs, direct labour costs and an appropriate share of overheads based on normal operating capacity.
46.7 OPERATING LEASESLeases of assets under which all the risks and rewards of ownership are effectively retained by the lessor, are classified as operating leases. Lease payments under an operating lease are recognised as an expense included in profit or loss on a straight-line basis over the lease term. Lease incentives received are recognised as an integral part of the total lease expense, over the term of the lease. Lease premium payments made in order to acquire a lease are initially recognised as a prepayment at cost and subsequently charged to profit or loss on a straight-line basis over the lease term.
46.8 CASH AND CASH EQUIVALENTSCash and cash equivalents include cash on hand and cash with banks. Cash equivalents are short-term, highly liquid investments that are readily convertible to known amounts of cash. Bank overdrafts that are repayable on demand are included as a component of cash and cash equivalents for the purpose of the statement of cash flows.
46.9 TAXIncome tax on profit or loss for the year comprises current and deferred tax. Income tax is recognised in profit or loss except to the extent that it relates to items recognised in other comprehensive income or directly in equity, in which case the tax is recognised in other comprehensive income or in equity, respectively.
Current tax is the expected tax payable on the taxable income for the year, using tax rates enacted or substantively enacted at the reporting date, and any adjustment to tax payable in respect of previous years.
Deferred tax is recognised for all temporary differences between the carrying amounts of assets and liabilities for financial reporting purposes and the amounts used for tax purposes. Deferred tax is not recognised for: goodwill not deductible for tax purposes, the initial recognition of assets or liabilities in a transaction that is not part of a business combination that affects neither accounting nor taxable profit, and differences relating to investments in subsidiaries, associates and joint ventures to the extent that the group is able to control the timing of the reversal of the temporary differences and they will probably not reverse in the foreseeable future. The amount of deferred tax provided is based on the expected manner of realisation or settlement of the carrying amount of assets and liabilities, using tax rates enacted or substantively enacted at the reporting date.
A deferred tax asset is recognised only to the extent that it is probable that future taxable profits will be available against which the asset can be utilised. Deferred tax assets are reviewed at each reporting date and are reduced to the extent that it is no longer probable that the related tax benefit will be realised.
Where the company withholds tax on behalf of its shareholders on dividends declared, such amounts are not recognised as part of the company’s tax charge but rather as part of the dividend paid recognised directly in equity. Where withholding tax is withheld on dividends received, the dividend is recognised at the gross amount with the related withholdings tax recognised as part of income tax expense unless it is reimbursable, in which case it is recognised as an asset.
NOTES TO THE CONSOLIDATED FINANCIAL STATEMENTS
Spur Corporation Ltd Integrated Report 2015168
46. SIGNIFICANT ACCOUNTING POLICIES continued
46.10 SHARE CAPITAL46.10.1 Ordinary share capital
Ordinary share capital represents the par value of ordinary shares issued. Ordinary shares are classified as equity. Incremental costs directly attributable to the issue of ordinary shares are recognised as a deduction from equity, net of taxes.
46.10.2 Share premiumShare premium represents the excess consideration received by the company over the par value of ordinary shares issued, and is classified as equity.
46.10.3 Repurchase of share capitalWhen shares of the company are acquired by the group, the amount of the consideration paid, including directly attributable costs, is recognised as a deduction from equity. Repurchased shares are classified as treasury shares and presented as a deduction from total equity and the number of shares is deducted from the weighted average number of shares. Dividends received on treasury shares are eliminated on consolidation.
When treasury shares are sold or reissued subsequently, the amount received is recognised as an increase in equity.
46.10.4 DividendsDividends and capital distributions are recognised as a liability in the period in which they are declared and approved by shareholders.
46.11 FINANCIAL INSTRUMENTS46.11.1 Recognition
The group initially recognises loans and receivables and debt securities issued on the date when they originated. All other financial assets and financial liabilities are initially recognised on the trade date.
46.11.2 MeasurementNon-derivative financial instruments are initially measured at fair value, plus directly attributable transaction costs, except for financial instruments that are classified as being carried at fair value through profit or loss. Subsequent to initial recognition these instruments are classified according to their nature.
Financial instruments are classified at fair value through profit or loss if they are held for trading or are designated as such upon initial recognition. Upon initial recognition, attributable transaction costs are recognised in profit or loss when incurred. Financial instruments at fair value through profit or loss are measured at fair value, and changes therein are recognised in profit or loss.
Subsequent measurement of each financial instrument is explained in more detail below.
Trade and other receivables (including loans)Trade and other receivables (including loans) are stated at amortised cost less impairment losses as appropriate.
Cash and cash equivalentsCash and cash equivalents are measured at amortised cost, based on the relevant exchange rates at the reporting date.
Financial liabilities (other than derivative instruments)Subsequent to initial recognition financial liabilities (other than derivative instruments) are stated at amortised cost using the effective interest method.
Derivative instrumentsSubsequent to initial recognition, derivatives are measured at fair value. The gain or loss on remeasurement of derivative instruments is recognised in profit or loss in the period that the change arises.
Cash flow hedge accounting is not applied.
Spur Corporation Ltd Integrated Report 2015 169
46.11.3 DerecognitionFinancial assetsA financial asset (or, where applicable, a part of a financial asset or part of a group of similar financial assets) is derecognised when the contractual rights to the cash flows from the asset expire, or it transfers the rights to receive the contractual cash flows from the financial asset in a transaction in which substantially all the risks and rewards of ownership of the financial asset are transferred.
Where the group has transferred its rights to receive cash flows from an asset and has neither transferred nor retained substantially all the risks and rewards of the asset nor transferred control of the asset, the asset is recognised to the extent of the group’s continuing involvement in the asset. Continuing involvement that takes the form of a guarantee over the transferred asset is measured at the lower of the original carrying amount of the asset and the maximum amount of consideration that the group could be required to repay.
Financial liabilitiesA financial liability is derecognised when the obligation under the liability is discharged or cancelled or expires. Where an existing financial liability is replaced by another from the same lender on substantially different terms, or the terms of an existing liability are substantially modified, such an exchange or modification is treated as a derecognition of the original liability and the recognition of a new liability, and the difference in the respective carrying amounts is recognised in profit or loss.
46.11.4 OffsetFinancial assets and financial liabilities are offset and the net amount reported in the statement of financial position when the group has a legally enforceable right to set off the recognised amounts, and intends either to settle on a net basis, or to realise the asset and settle the liability simultaneously.
46.12 REVENUERevenue comprises franchise-related fees, rental income, proceeds from the sale of supplies and promotional items and related services. All revenue is stated exclusive of value added tax or other sales taxes and net of transactions with group companies and measured at the fair value of the consideration received or receivable.
Franchise fees are recognised on the accrual basis as services are rendered, or the rights used, in accordance with the substance of the related franchise agreements.
Revenue from the sale of supplies and promotional items is recognised when the significant risks and rewards of ownership are transferred to the buyer, costs can be measured reliably and receipt of the future economic benefits is probable.
Revenue from the rendering of services is recognised as the services are rendered if the costs relating to the rendering of the services can be reliably measured and the receipt of the future economic benefits is probable.
Rental income is recognised as revenue on a straight-line basis over the term of the lease.
Dividend income is recognised when the right to receive payment is established.
46.13 ADMINISTRATION FEE INCOMEAdministration fees included in other income in the statement of comprehensive income are stated exclusive of value added tax or other sales taxes and are recognised as services are rendered.
46.14 FINANCE INCOME AND EXPENSE46.14.1 Finance income
Finance income comprises interest income. Interest income is recognised on a time apportionment basis, taking account of the principal outstanding and the effective rate over the period to maturity, when it is probable that such income will accrue to the group.
46.14.2 Finance expenseFinance expense comprises interest payable on borrowings calculated using the effective interest method.
The interest expense component of finance lease payments is recognised in profit or loss using the effective interest method.
Borrowing costs directly attributable to the acquisition, construction or production of qualifying assets, which are assets that necessarily take a substantial period of time to get ready for their intended use or sale, are added to the cost of those assets, until such time as the assets are substantially ready for their intended use or sale.
NOTES TO THE CONSOLIDATED FINANCIAL STATEMENTS

Spur Corporation Ltd Integrated Report 2015170
46. SIGNIFICANT ACCOUNTING POLICIES continued
46.15 EMPLOYEE BENEFITS46.15.1 Short-term employee benefits
The costs of all short-term employee benefits are recognised in profit or loss during the period in which the employee renders the related service.
The accruals for employee entitlements to salaries and leave represent the amount which the group has a present obligation to pay as a result of employees’ services provided to the reporting date. The accruals have been calculated at undiscounted amounts based on current salary rates.
46.15.2 Other long-term employee benefitsLiabilities for employee benefits which are not expected to be settled within 12 months are discounted using the market yields, at the reporting date, on government bonds with terms which most closely match the terms of maturity of the related liabilities.
46.15.3 Defined contribution plansObligations for contributions to defined contribution pension plans are recognised in profit or loss in the period during which related services are rendered by employees.
46.15.4 Share-based payment transactionsWith regards cash-settled transactions, the fair value of share appreciation rights granted is recognised as an employee expense included in profit or loss with a corresponding liability over the vesting period of the rights. The fair value of the rights granted is measured at each reporting date with any change in fair value being recorded in profit or loss as an employee expense, subject to the vesting period of the rights. The amount recognised as an expense included in profit or loss (and the related liability) is adjusted to reflect the actual number of rights that vest or are expected to vest.
46.16 PROVISIONSA provision is recognised when the group has a present obligation (legal or constructive) as a result of a past event and it is probable that an outflow of resources embodying economic benefits will be required to settle the obligation and a reliable estimate can be made of the amount of the obligation. Provisions are reviewed at each reporting date and adjusted to reflect the current best estimate. Where the effect of discounting is material, provisions are discounted. The discount rate used is a pre-tax rate that reflects current market assessments of the time value of money and, where appropriate, the risks specific to the liability. The unwinding of the discount is recognised as a finance cost.
A provision for onerous contracts is recognised when the expected benefits to be derived by the group from a contract are lower than the unavoidable cost of meeting the obligations under the contract. The provision is measured at the present value of the lower of the expected cost of terminating the contract and the expected net cost of continuing with the contract. Before a provision is established, the group recognises any impairment loss on the assets associated with the contract.
46.17 NON-CURRENT ASSETS HELD FOR SALE AND DISCONTINUED OPERATIONSNon-current assets (or disposal groups comprising assets and liabilities) that are expected to be recovered primarily through sale rather than through continuing use are classified as held for sale.
This condition is regarded as met only when the sale is highly probable and expected to be completed within one year from classification and the asset is available for immediate sale in its present condition.
Immediately before classification as held for sale, the assets (or components of a disposal group) are remeasured in accordance with the group’s accounting policies. Thereafter assets classified as held for sale are measured at the lower of their carrying value and fair value less costs of disposal.
Any impairment loss on a disposal group is first allocated to goodwill, and then to remaining assets and liabilities on a pro rata basis, except that no loss is allocated to inventories, financial assets, deferred tax assets and employee benefit assets, which continue to be measured in accordance with the group’s accounting policies. Impairment losses on initial classification as held for sale and subsequent gains or losses on remeasurement are recognised in profit or loss. Gains are not recognised in excess of any cumulative impairment loss.
Disposal groups are classified as discontinued operations where they represent a major line of business or geographical area of operations that has been disposed of or is held for sale. Classification as a discontinued operation occurs upon disposal or when the operation meets the criteria to be classified as held for sale, if earlier.
Spur Corporation Ltd Integrated Report 2015 171
46.18 GUARANTEESA financial guarantee is a contract that requires the issuer to make specified payments to reimburse the holder for a loss it incurs because a specified debtor fails to make payment when due in accordance with the original or modified terms of a debt instrument.
These financial guarantees are classified as insurance contracts as defined in IFRS4 – Insurance Contracts. A liability is recognised when it is probable that an outflow of resources embodying economic benefits will be required to settle the contract and a reliable estimate can be made of the amount of the obligation. The amount recognised is the best estimate of the expenditure required to settle the contract at the reporting date. Where the effect of discounting is material, the liability is discounted. The discount rate used is a pre-tax rate that reflects current market assessments of the time value of money and, where appropriate, the risks specific to the liability.
46.19 EARNINGS PER SHAREThe group presents basic and diluted earnings per share (“EPS”) and basic and diluted headline earnings per share (“HEPS”) for its ordinary shares.
Basic EPS is calculated by dividing the profit or loss attributable to the ordinary shareholders by the weighted average number of ordinary shares outstanding during the period. Diluted EPS is determined by adjusting the profit or loss attributable to ordinary shareholders and the weighted average number of ordinary shares outstanding for the dilutive effects of all share options granted to employees.
Headline earnings is calculated in accordance with Circular 2/2013: Headline Earnings issued by the South African Institute of Chartered Accountants at the request of the JSE. The JSE Listings Requirements require the calculation of headline earnings for all entities listed on the JSE in South Africa. Basic HEPS is calculated by dividing headline earnings by the weighted average number of ordinary shares outstanding during the period. Diluted HEPS is determined by dividing headline earnings by the weighted average number of ordinary shares outstanding during the period adjusted for the dilutive effects of all share options granted to employees.
47. ACCOUNTING STANDARDS AND INTERPRETATIONS NOT YET EFFECTIVE
A number of new standards, amendments to standards and interpretations applicable to the group are not yet effective for the year ended 30 June 2015, and have not been applied in preparing these consolidated financial statements. Those standards and interpretations which are (or may be) applicable to the group in the future are presented below. Those standards and interpretations which have no bearing on the group’s existing accounting policies, have no impact on the group’s assets and liabilities as at the reporting date or their subsequent measurement and no impact on the accounting treatment of transactions that the group is likely to be party to, are not listed below. All standards and interpretations will be adopted at their effective date.
IAS1 – Presentation of financial statementsAmendments to this standard provide additional guidance on the application of materiality and aggregation when preparing financial statements. The amendments also clarify presentation principles applicable to the order of notes, other comprehensive income of equity-accounted investees, and subtotals presented in the statement of financial position and statement of comprehensive income.
The amendments become mandatory for the group’s 2017 financial statements.
IFRS9 – Financial instrumentsIFRS9, published in July 2014, includes guidance on the classification and measurement of financial instruments, including a new expected credit loss model for recalculating impairment on financial assets, and the new general hedge accounting requirements.
This standard becomes mandatory for the group’s 2019 financial statements and will be applied retrospectively subject to transitional provisions. The impact on the group has yet to be determined.
IFRS15 – Revenue from contracts with customersIFRS15 introduces a new five-step model for determining the timing and amount of revenue to be recognised from contracts with customers. The core principle of the new model is that an entity should recognise revenue to depict the transfer of promised goods or services to customers and that the amount of revenue should reflect the consideration to which it expects to be entitled in exchange for those goods and services.
This standard becomes mandatory for the group’s 2019 financial statements and will be applied retrospectively subject to transitional provisions. The impact on the group has yet to be determined.
NOTES TO THE CONSOLIDATED FINANCIAL STATEMENTS

Spur Corporation Ltd Integrated Report 2015172
SEPARATE FINANCIAL STATEMENTS

Spur Corporation Ltd Integrated Report 2015 173
SEPARATE STATEMENT OF COMPREHENSIVE INCOME
2015 2014Note R’000 R’000
Dividend income 130 786 115 076
Interest income 62 26
Operating expenses (35 484) (1 711)
Profit before income tax 1 95 364 113 391
Income tax expense 2 (16) (3)
Profit for the year 95 348 113 388
Total comprehensive income for the year 95 348 113 388
SEPARATE STATEMENT OF COMPREHENSIVE INCOMEFOR THE YEAR ENDED 30 JUNE

Spur Corporation Ltd Integrated Report 2015174
SEPARATE STATEMENT OF FINANCIAL POSITION
2015 2014
Note R’000 R’000
ASSETS
Non-current assets
Interest in subsidiary companies 3 292 372 14 479
Dividends receivable 4 10 437 22 562
Total non-current assets 302 809 37 041
Current assets
Tax receivable – 6
Cash and cash equivalents 1 180 3 793
Total current assets 1 180 3 799
TOTAL ASSETS 303 989 40 840
EQUITY AND LIABILITIES
Equity
Ordinary share capital 5 1 1
Share premium 294 663 6
Retained earnings 790 3 219
Total equity 295 454 3 226
LIABILITIES
Current liabilities
Trade and other payables 53 60
Shareholders for dividend 482 411
Loans from subsidiary companies 6 8 000 37 143
Total current liabilities 8 535 37 614
TOTAL EQUITY AND LIABILITIES 303 989 40 840
SEPARATE STATEMENT OF FINANCIAL POSITIONAT 30 JUNE

Spur Corporation Ltd Integrated Report 2015 175
SEPARATE STATEMENT OF CASH FLOWS
2015 2014Note R’000 R’000
Cash flow from operating activities
Operating loss before working capital items 7 (2 527) (1 711)
Working capital changes (7) (16)
Cash utilised by operations (2 534) (1 727)
Interest received 62 26
Tax paid 8 (10) (7)
Dividends received 4 142 911 115 076
Dividends paid 9 (129 672) (110 241)
Net cash flow from operating activities 10 757 3 127
Cash flow from investing activities
Increase in loans to subsidiary companies (277 893) –
Net cash flow from investing activities (277 893) –
Cash flow from financing activities
Proceed from the issue of shares 294 657 –
Costs incurred on issue of ordinary shares (991) –
(Decrease)/increase in loans from subsidiary companies (29 143) 300
Net cash flow from financing activities 264 523 300
Net movement in cash and cash equivalents (2 613) 3 427
Cash and cash equivalents at beginning of year 3 793 366
Cash and cash equivalents at end of year 1 180 3 793
SEPARATE STATEMENT OF CASH FLOWSFOR THE YEAR ENDED 30 JUNE

Spur Corporation Ltd Integrated Report 2015176
Ordinary share capital
Share premium
Retained earnings
Total equity
R’000 R’000 R’000 R’000
Balance at 1 July 2013 1 6 156 163
Total comprehensive income for the year
Profit for the year – – 113 388 113 388
Transactions with owners recorded directly in equity
Contributions by and distributions to owners
Distributions to equity holders (refer note 9) – – (110 325) (110 325)
Balance at 30 June 2014 1 6 3 219 3 226
Total comprehensive income for the year
Profit for the year – – 95 348 95 348
Transactions with owners recorded directly in equity
Contributions by and distributions to owners – 294 657 (97 777) 196 880
Issue of ordinary shares (refer note 5.1) – 294 657 (991) 293 666
Equity-settled share-based payment (refer note 5.1) – – 32 957 32 957
Distributions to equity holders (refer note 9) – – (129 743) (129 743)
Balance at 30 June 2015 1 294 663 790 295 454
SEPARATE STATEMENT OF CHANGES IN EQUITYFOR THE YEAR ENDED 30 JUNE
SEPARATE STATEMENT OF CHANGES IN EQUITY
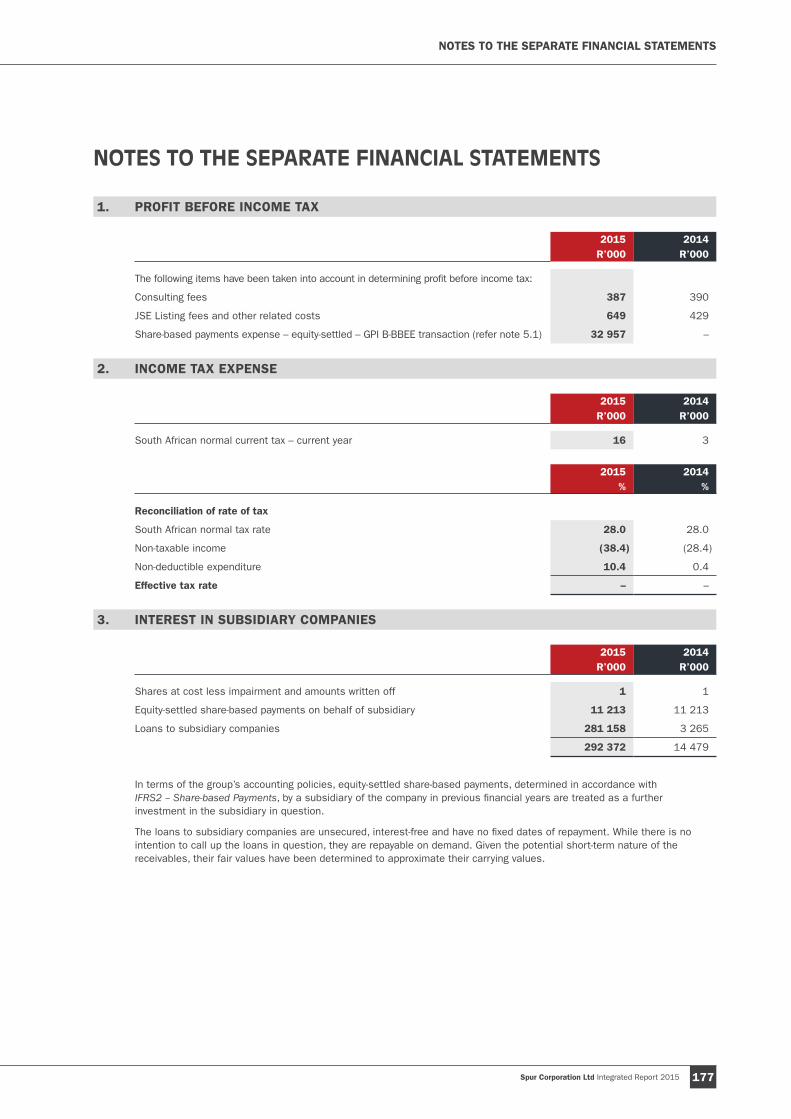
Spur Corporation Ltd Integrated Report 2015 177
NOTES TO THE SEPARATE FINANCIAL STATEMENTS
NOTES TO THE SEPARATE FINANCIAL STATEMENTS
1. PROFIT BEFORE INCOME TAX
2015 2014R’000 R’000
The following items have been taken into account in determining profit before income tax:
Consulting fees 387 390
JSE Listing fees and other related costs 649 429
Share-based payments expense – equity-settled – GPI B-BBEE transaction (refer note 5.1) 32 957 –
2. INCOME TAX EXPENSE
2015 2014R’000 R’000
South African normal current tax – current year 16 3
2015 2014% %
Reconciliation of rate of tax
South African normal tax rate 28.0 28.0
Non-taxable income (38.4) (28.4)
Non-deductible expenditure 10.4 0.4
Effective tax rate – –
3. INTEREST IN SUBSIDIARY COMPANIES
2015 2014R’000 R’000
Shares at cost less impairment and amounts written off 1 1
Equity-settled share-based payments on behalf of subsidiary 11 213 11 213
Loans to subsidiary companies 281 158 3 265
292 372 14 479
In terms of the group’s accounting policies, equity-settled share-based payments, determined in accordance with IFRS2 – Share-based Payments, by a subsidiary of the company in previous financial years are treated as a further investment in the subsidiary in question.
The loans to subsidiary companies are unsecured, interest-free and have no fixed dates of repayment. While there is no intention to call up the loans in question, they are repayable on demand. Given the potential short-term nature of the receivables, their fair values have been determined to approximate their carrying values.

Spur Corporation Ltd Integrated Report 2015178
3. INTEREST IN SUBSIDIARY COMPANIES continued
Details of the share capital and the company’s interests in the subsidiary companies are as follows:
Country ofincorporation/
place of business
Issued capitalR’000
Loans to subsidiaries
R’000% interest
in company
Trading– Estalor (Pty) Ltd* trading as The Hussar Grill
Advertising Company South Africa 0.1 100.0 – John Dory’s Advertising (Pty) Ltd* South Africa 0.1 100.0 – John Dory’s Franchise (Pty) Ltd* South Africa 0.1 100.0 – Marocap (Pty) Ltd* trading as RocoMamas
Advertising South Africa 0.1 100.0 – Nickilor (Pty) Ltd* trading as The Hussar Grill
Rondebosch South Africa 0.1 100.0 – Opilor (Pty) Ltd* trading as The Hussar Grill
Green Point South Africa 0.1 100.0 – Opiset (Pty) Ltd* trading as The Hussar Grill
Camps Bay South Africa 0.1 100.0 – Panarottis Advertising (Pty) Ltd* South Africa 0.1 100.0 – RocoMamas Franchise Co (Pty) Ltd*# South Africa 0.1 51.0 – Share Buy-back (Pty) Ltd South Africa 0.1 100.0 – Spur Advertising (Pty) Ltd* South Africa 0.1 100.0 – Spur Group (Pty) Ltd South Africa 0.1 277 893 100.0 – Spur Group Properties (Pty) Ltd South Africa 0.1 3 265 100.0 – The Ad Workshop (Pty) Ltd* trading as
Captain DoRegos Advertising South Africa 0.1 100.0 – Spur International Ltd* British Virgin
Islands 1.4 100.0 – Steak Ranches International BV* The Netherlands 156 493.6 100.0 – Spur Advertising Namibia (Pty) Ltd* Namibia 0.1 100.0 – Spur Franchise Namibia (Pty) Ltd* Namibia 0.1 100.0 – Caspur Pty Ltd* Australia 772.0 100.0 – Panarottis Advertising Australia Pty Ltd* Australia 0.6 100.0 – Panatug Pty Ltd* Australia 0.6 100.0 – Panhold Pty Ltd* Australia 5.0 100.0 – Spur Advertising Australia Pty Ltd* Australia 0.6 100.0 – Spur Corporation Australia Pty Ltd* Australia 16 129.1 100.0 – Spur Steak Ranches Unit Trust* Australia 0.1 100.0 – Spurcentral Pty Ltd* Australia 0.6 100.0 – Larkspur One Ltd* United Kingdom 1.4 100.0 – Larkspur Two Ltd* United Kingdom 1.4 100.0 – Larkspur Three Ltd* United Kingdom 1.3 80.0 – Larkspur Six Ltd* United Kingdom 0.1 100.0 – Larkspur Seven Ltd* United Kingdom 0.1 100.0 – Larkspur Nine Ltd* United Kingdom 0.1 100.0 – Larkspur Ten Ltd* United Kingdom 1.8 100.0 – Mohawk Spur Ltd* United Kingdom 15.1 100.0 – Spur Advertising UK Ltd* United Kingdom 1.3 100.0 – Spur Corporation UK Ltd* United Kingdom 3.5 100.0 – Trinity Leasing Ltd* United Kingdom 13.0 100.0 – Larkspur Eight Ltd* Ireland 0.1 100.0 Dormant 1.4 100.0
281 158
* Indirect# 51% shareholding acquired 1 March 2015
Investments in subsidiaries are carried at cost less impairment losses in accordance with the company’s accounting policy in this regard.

Spur Corporation Ltd Integrated Report 2015 179
4. DIVIDENDS RECEIVABLE
The dividends receivable relates to dividends received by the Spur Management Share Trust in the financial year ended 30 June 2010 that were vested with the company by the trustees in that year. The amount is unsecured, interest-free and there are no fixed terms of payment. While there is no intention to call up the receivable in question, it is repayable on demand. Given the potential short-term nature of the receivable, its fair value has been determined to approximate its carrying value.
2015 2014R’000 R’000
Dividends received are reconciled to the amount disclosed in profit or loss as follows:
Amount receivable at beginning of year 22 562 22 562
Dividend income recognised in profit or loss before income tax 130 786 115 076
Amount receivable at end of year (10 437) (22 562)
Dividends received 142 911 115 076
5. ORDINARY SHARE CAPITAL
2015 2014R’000 R’000
Authorised
201 000 000 ordinary shares of 0.001 cents each 2 2
Issued and fully paid
97 632 833 ordinary shares of 0.001 cents each at the beginning of the year 1 1
10 848 093 ordinary shares issued for cash during the year – –
108 480 926 ordinary shares of 0.001 cents each at the end of the year 1 1
The ordinary shares have equal rights to dividends declared by the company.
In terms of the company’s Memorandum of Incorporation, the unissued shares of the company may be issued by the directors of the company only with the approval of the shareholders by way of an ordinary resolution passed at a general meeting. No such authority has been granted.
The company does not have any unlisted shares.
5.1 ISSUE OF ORDINARY SHARES RELATING TO GPI B-BBEE SHARE TRANSACTION
As detailed in the circular to shareholders of 4 September 2014, and approved by shareholders at a general meeting on 3 October 2014, the company concluded various agreements to issue 10 848 093 new ordinary shares indirectly to Grand Parade Investments Ltd (“GPI”), a strategic black empowerment partner. The transaction was executed on 30 October 2014. In terms of the agreements, GPI is restricted from trading the shares in question without the express permission of the company for a period of five years from the effective date of the transaction and is furthermore required to maintain its broad-based black economic empowerment credentials for the same period.
The shares were issued at a price of R27.16 per share, representing a 10% discount to the volume-weighted average trading price of the company’s shares on the JSE for the 90 trading days prior to 30 July 2014, resulting in the aggregate proceeds from the issue of shares amounting to R294.657 million. The market price of the shares on 30 October 2014 was R30.20 per share, equating to an effective discount of R32.957 million in aggregate. This discount has been recognised as a share-based payment expense in accordance with IFRS2 – Share-based Payments and included in profit before income tax for the period, with a corresponding credit to equity (retained earnings).
The transaction resulted in a cash inflow of R294.657. Transaction costs of R0.991 million relate directly to the issue of the company’s ordinary shares and have been charged directly against equity (retained earnings) and sundry professional costs of R0.301 million relating to the transaction are included in profit before income tax.
NOTES TO THE SEPARATE FINANCIAL STATEMENTS
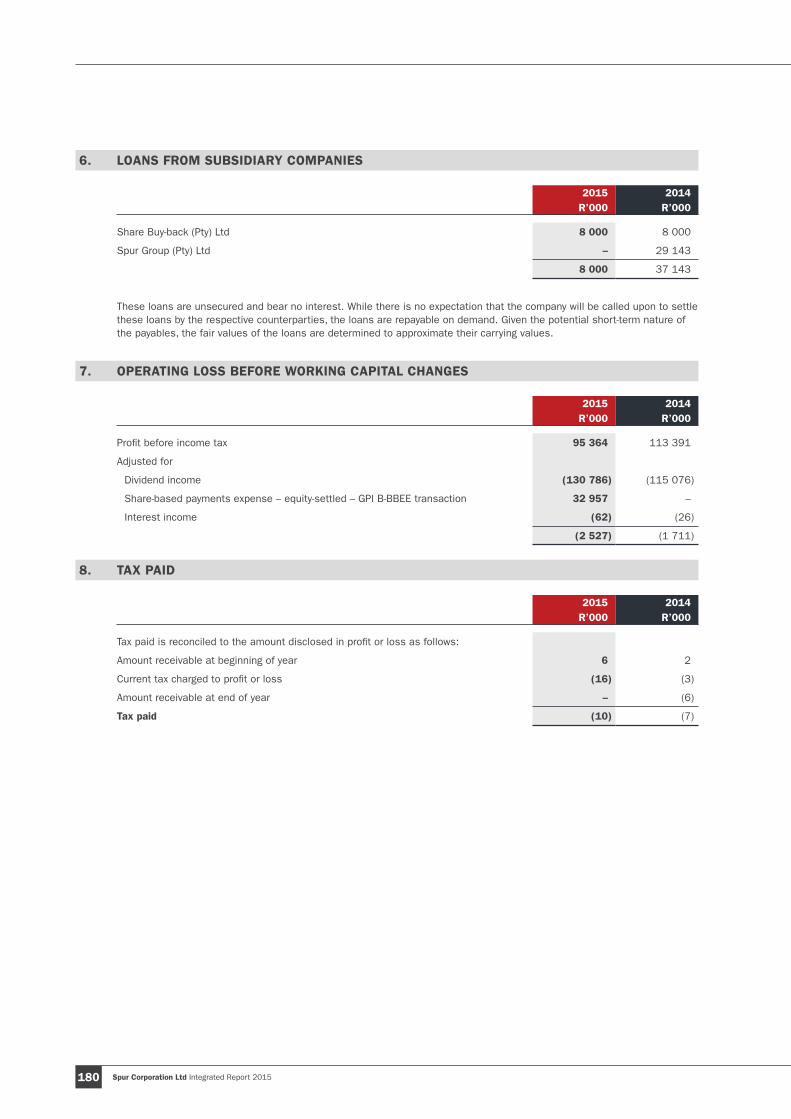
Spur Corporation Ltd Integrated Report 2015180
6. LOANS FROM SUBSIDIARY COMPANIES
2015 2014R’000 R’000
Share Buy-back (Pty) Ltd 8 000 8 000
Spur Group (Pty) Ltd – 29 143
8 000 37 143
These loans are unsecured and bear no interest. While there is no expectation that the company will be called upon to settle these loans by the respective counterparties, the loans are repayable on demand. Given the potential short-term nature of the payables, the fair values of the loans are determined to approximate their carrying values.
7. OPERATING LOSS BEFORE WORKING CAPITAL CHANGES
2015 2014R’000 R’000
Profit before income tax 95 364 113 391
Adjusted for
Dividend income (130 786) (115 076)
Share-based payments expense – equity-settled – GPI B-BBEE transaction 32 957 –
Interest income (62) (26)
(2 527) (1 711)
8. TAX PAID
2015 2014R’000 R’000
Tax paid is reconciled to the amount disclosed in profit or loss as follows:
Amount receivable at beginning of year 6 2
Current tax charged to profit or loss (16) (3)
Amount receivable at end of year – (6)
Tax paid (10) (7)
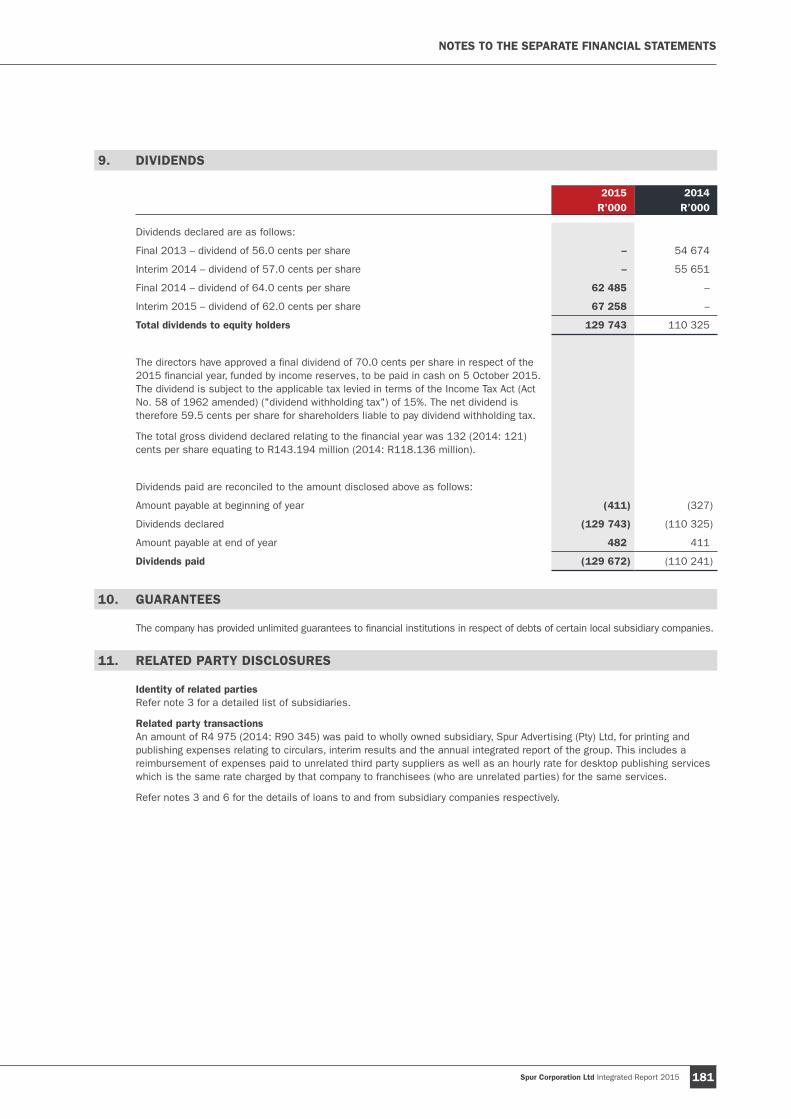
Spur Corporation Ltd Integrated Report 2015 181
9. DIVIDENDS
2015 2014R’000 R’000
Dividends declared are as follows:
Final 2013 – dividend of 56.0 cents per share – 54 674
Interim 2014 – dividend of 57.0 cents per share – 55 651
Final 2014 – dividend of 64.0 cents per share 62 485 –
Interim 2015 – dividend of 62.0 cents per share 67 258 –
Total dividends to equity holders 129 743 110 325
The directors have approved a final dividend of 70.0 cents per share in respect of the 2015 financial year, funded by income reserves, to be paid in cash on 5 October 2015. The dividend is subject to the applicable tax levied in terms of the Income Tax Act (Act No. 58 of 1962 amended) ("dividend withholding tax") of 15%. The net dividend is therefore 59.5 cents per share for shareholders liable to pay dividend withholding tax.
The total gross dividend declared relating to the financial year was 132 (2014: 121) cents per share equating to R143.194 million (2014: R118.136 million).
Dividends paid are reconciled to the amount disclosed above as follows:
Amount payable at beginning of year (411) (327)
Dividends declared (129 743) (110 325)
Amount payable at end of year 482 411
Dividends paid (129 672) (110 241)
10. GUARANTEES
The company has provided unlimited guarantees to financial institutions in respect of debts of certain local subsidiary companies.
11. RELATED PARTY DISCLOSURES
Identity of related partiesRefer note 3 for a detailed list of subsidiaries.
Related party transactionsAn amount of R4 975 (2014: R90 345) was paid to wholly owned subsidiary, Spur Advertising (Pty) Ltd, for printing and publishing expenses relating to circulars, interim results and the annual integrated report of the group. This includes a reimbursement of expenses paid to unrelated third party suppliers as well as an hourly rate for desktop publishing services which is the same rate charged by that company to franchisees (who are unrelated parties) for the same services.
Refer notes 3 and 6 for the details of loans to and from subsidiary companies respectively.
NOTES TO THE SEPARATE FINANCIAL STATEMENTS

Spur Corporation Ltd Integrated Report 2015182
12. FINANCIAL INSTRUMENTS
12.1 ACCOUNTING CLASSIFICATION AND FAIR VALUES The following table shows the carrying amounts of financial assets and liabilities. No financial instruments are required to be subsequently recognised at fair value at the reporting date. Fair value information for financial assets and liabilities not measured at fair value is not disclosed if the carrying amount is a reasonable approximation of fair value.
Carrying amount (R’000)
NoteLoans and
receivables Other financial
liabilities Total
2015Financial assets not measured at fair valueLoans to subsidiary companies 3 281 158 – 281 158 Dividends receivable 4 10 437 – 10 437 Cash and cash equivalents 1 180 – 1 180
292 775 – 292 775
Financial liabilities not measured at fair valueTrade and other payables – 53 53 Shareholders for dividend – 482 482 Loans from subsidiary companies 6 – 8 000 8 000
– 8 535 8 535
2014Financial assets not measured at fair valueLoans to subsidiary companies 3 3 265 – 3 265 Dividends receivable 4 22 562 – 22 562 Cash and cash equivalents 3 793 – 3 793
29 620 – 29 620
Financial liabilities not measured at fair valueTrade and other payables – 60 60 Shareholders for dividend – 411 411 Loans from subsidiary companies 6 – 37 143 37 143
– 37 614 37 614
The company has not disclosed the fair values of the above financial instruments as their carrying amounts are a reasonable approximation of their fair values. Refer notes 3, 4 and 6 for a further explanation in this regard for loans to subsidiary companies, dividends receivable and loans from subsidiary companies, respectively. Due to the short-term nature of cash and cash equivalents, trade and other payables, and shareholders for dividend, their fair values have been determined to approximate their carrying values.
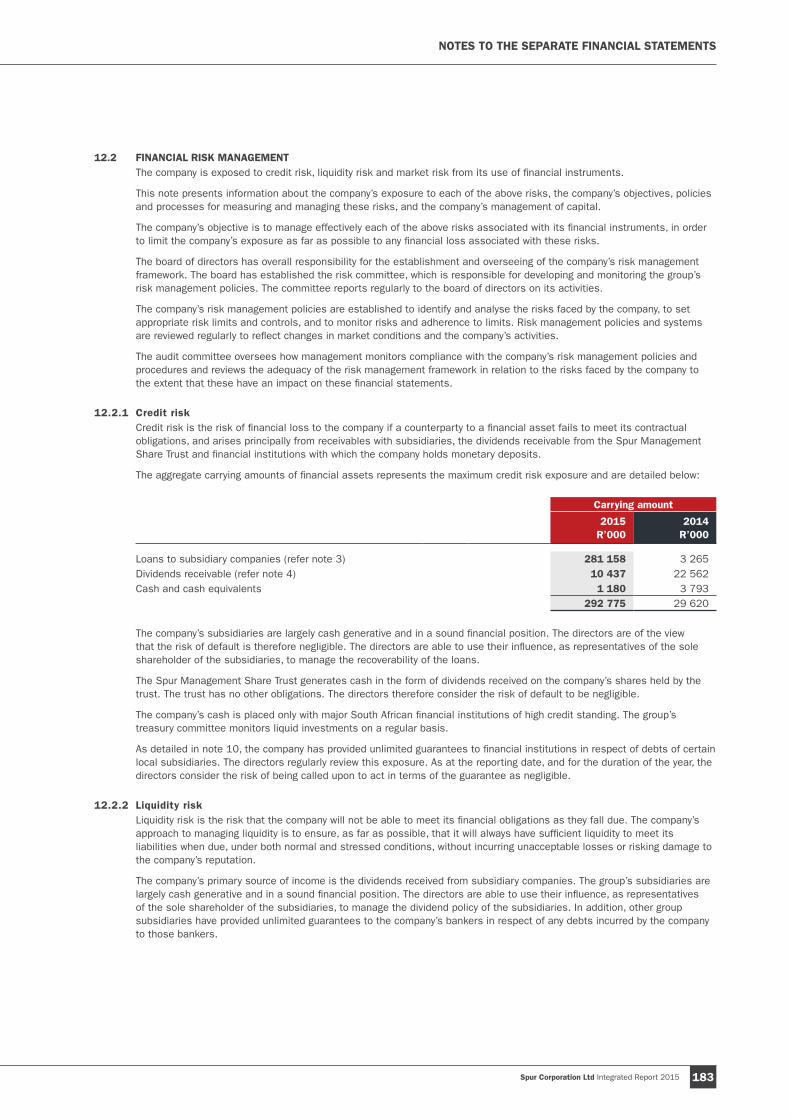
Spur Corporation Ltd Integrated Report 2015 183
12.2 FINANCIAL RISK MANAGEMENTThe company is exposed to credit risk, liquidity risk and market risk from its use of financial instruments.
This note presents information about the company’s exposure to each of the above risks, the company’s objectives, policies and processes for measuring and managing these risks, and the company’s management of capital.
The company’s objective is to manage effectively each of the above risks associated with its financial instruments, in order to limit the company’s exposure as far as possible to any financial loss associated with these risks.
The board of directors has overall responsibility for the establishment and overseeing of the company’s risk management framework. The board has established the risk committee, which is responsible for developing and monitoring the group’s risk management policies. The committee reports regularly to the board of directors on its activities.
The company’s risk management policies are established to identify and analyse the risks faced by the company, to set appropriate risk limits and controls, and to monitor risks and adherence to limits. Risk management policies and systems are reviewed regularly to reflect changes in market conditions and the company’s activities.
The audit committee oversees how management monitors compliance with the company’s risk management policies and procedures and reviews the adequacy of the risk management framework in relation to the risks faced by the company to the extent that these have an impact on these financial statements.
12.2.1 Credit risk Credit risk is the risk of financial loss to the company if a counterparty to a financial asset fails to meet its contractual obligations, and arises principally from receivables with subsidiaries, the dividends receivable from the Spur Management Share Trust and financial institutions with which the company holds monetary deposits.
The aggregate carrying amounts of financial assets represents the maximum credit risk exposure and are detailed below:
Carrying amount
2015R’000
2014R’000
Loans to subsidiary companies (refer note 3) 281 158 3 265 Dividends receivable (refer note 4) 10 437 22 562 Cash and cash equivalents 1 180 3 793
292 775 29 620
The company’s subsidiaries are largely cash generative and in a sound financial position. The directors are of the view that the risk of default is therefore negligible. The directors are able to use their influence, as representatives of the sole shareholder of the subsidiaries, to manage the recoverability of the loans.
The Spur Management Share Trust generates cash in the form of dividends received on the company’s shares held by the trust. The trust has no other obligations. The directors therefore consider the risk of default to be negligible.
The company’s cash is placed only with major South African financial institutions of high credit standing. The group’s treasury committee monitors liquid investments on a regular basis.
As detailed in note 10, the company has provided unlimited guarantees to financial institutions in respect of debts of certain local subsidiaries. The directors regularly review this exposure. As at the reporting date, and for the duration of the year, the directors consider the risk of being called upon to act in terms of the guarantee as negligible.
12.2.2 Liquidity risk Liquidity risk is the risk that the company will not be able to meet its financial obligations as they fall due. The company’s approach to managing liquidity is to ensure, as far as possible, that it will always have sufficient liquidity to meet its liabilities when due, under both normal and stressed conditions, without incurring unacceptable losses or risking damage to the company’s reputation.
The company’s primary source of income is the dividends received from subsidiary companies. The group’s subsidiaries are largely cash generative and in a sound financial position. The directors are able to use their influence, as representatives of the sole shareholder of the subsidiaries, to manage the dividend policy of the subsidiaries. In addition, other group subsidiaries have provided unlimited guarantees to the company’s bankers in respect of any debts incurred by the company to those bankers.
NOTES TO THE SEPARATE FINANCIAL STATEMENTS
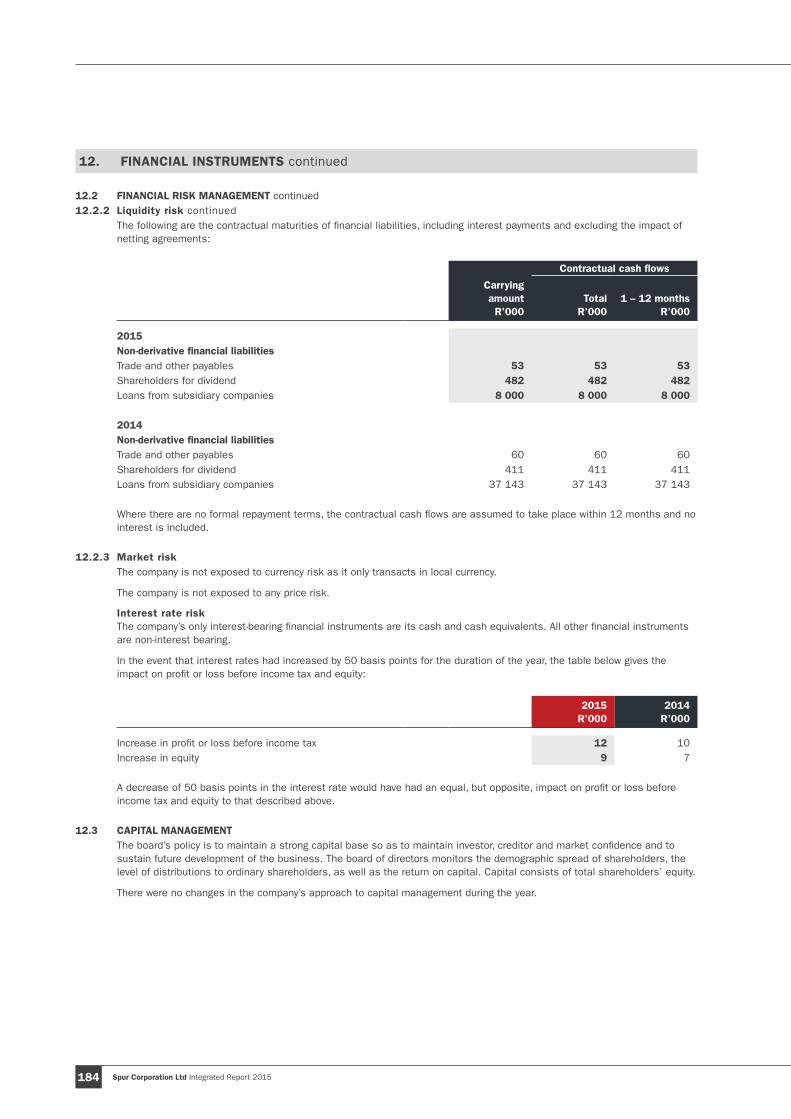
Spur Corporation Ltd Integrated Report 2015184
12. FINANCIAL INSTRUMENTS continued
12.2 FINANCIAL RISK MANAGEMENT continued12.2.2 Liquidity risk continued
The following are the contractual maturities of financial liabilities, including interest payments and excluding the impact of netting agreements:
Contractual cash flows
Carrying amountR’000
TotalR’000
1 – 12 monthsR’000
2015Non-derivative financial liabilitiesTrade and other payables 53 53 53 Shareholders for dividend 482 482 482Loans from subsidiary companies 8 000 8 000 8 000
2014Non-derivative financial liabilitiesTrade and other payables 60 60 60 Shareholders for dividend 411 411 411 Loans from subsidiary companies 37 143 37 143 37 143
Where there are no formal repayment terms, the contractual cash flows are assumed to take place within 12 months and no interest is included.
12.2.3 Market riskThe company is not exposed to currency risk as it only transacts in local currency.
The company is not exposed to any price risk.
Interest rate risk The company’s only interest-bearing financial instruments are its cash and cash equivalents. All other financial instruments are non-interest bearing.
In the event that interest rates had increased by 50 basis points for the duration of the year, the table below gives the impact on profit or loss before income tax and equity:
2015R’000
2014R’000
Increase in profit or loss before income tax 12 10Increase in equity 9 7
A decrease of 50 basis points in the interest rate would have had an equal, but opposite, impact on profit or loss before income tax and equity to that described above.
12.3 CAPITAL MANAGEMENT The board’s policy is to maintain a strong capital base so as to maintain investor, creditor and market confidence and to sustain future development of the business. The board of directors monitors the demographic spread of shareholders, the level of distributions to ordinary shareholders, as well as the return on capital. Capital consists of total shareholders’ equity.
There were no changes in the company’s approach to capital management during the year.
185
CORPORATE INFORMATIONDIVIDENDSInterim dividend: 62 cents per shareRecord date: 27 March 2015Payment date: 30 March 2015
Final dividend: 70 cents per shareRecord date: 2 October 2015Payment date: 5 October 2015
REPORTS 2015Interim for six months ended 31 December 2014 published March 2015Preliminary announcement for year ended 30 June 2015 published September 2015Annual for year ended 30 June 2015 published October 2015
ADMINISTRATIONRegistered address 14 Edison WayCentury Gate Business ParkCentury City7441
Registration number: 1998/000828/06
Postal address: PO Box 166, Century City, 7446
Telephone: +27 21 555 5100
Fax: +27 21 555 5111
Email: [email protected]
Internet: http://www.spurcorporation.com
Transfer secretaries Computershare Investor Services (Pty) Ltd70 Marshall StreetJohannesburg2001PO Box 61051Marshalltown2107Telephone: +27 11 370 5000
External auditors: KPMG Inc.
Internal auditors: Moore Stephens Risk Services (Pty) Ltd
Attorneys: Bernadt Vukic Potash & Getz
Sponsor: Sasfin Capital (a division of Sasfin Bank Ltd)
Company secretary: Nazrana Hawa

www.spurcorporation.com
Related Documents