Consistent correction of census and vital "data for Thailand, 1960-80 Norman Y. Luther, Neramit Dhanasakdi, and Fred Arnold .- OF THE EAST-WEST POPULATION INSTITUTE NUMBER .103. DECEMBER 1986 EASE-WEST CENTFR HONOLULU, HAWAII

Welcome message from author
This document is posted to help you gain knowledge. Please leave a comment to let me know what you think about it! Share it to your friends and learn new things together.
Transcript

Consistent correction of census and vital
data
for Thailand 1960-80
Norman Y Luther
Neramit Dhanasakdi and Fred Arnold
-OF THE
EAST-WEST POPULATION
INSTITUTE
NUMBER 103
DECEMBER 1986
EASE-WEST CENTFR
HONOLULU HAWAII
PAPERS OF THE EAST-WEST POPULATION INSTITUTE published about eighttimes a year facilitate early dissemination of research findings and policyshyrelevant reports on tile populations of Asia the Pacific and the United StatesCost per copy $3 NOTE TO CONTRIBUTORS The Population Institute considers unsoicited aswell as commissioned manuscripts for the Paper Series Appropriate topics aredemographic trends and estimation fertility and tamijy structure economicdevelopment and human resources urbanization and migration and populashytion policies and programs All manuscripts are reviewed In selectingmanus-ripts for publication the Institute considers quality of scholarship anduseful iess to public officials and other professionals in the fieid of populationt also seeks contributions reflecting diverse cultural and disciplinary perspecshytives on population The series c-m accomrnodate articles not necessarily suitedfor journals because of unusual length or treatment of subject All copy mustbe typed double-spaced Foi additional information oit manuscript preparashytion write to Editor Paper Series
OTHER SERIAL PUBLICATIONS OF THE EAST-WEST POPULATION INSTITUTE Working Papers are circulated for comment and to infoirm interested colleaguesabout work in progress at the East-West Population In1itute They are intendedto complement evidence of completed work as reflected in Papers of the East-West Population Institute and the Reprint Series $1 per copy Reprint Seri 2s brings selected articles originating from Institute research butpublished elsewhee to the attention of population specialists who might nototherwise see them Single copies available upon request Asian and Pacific Population Forum brings articles of potential value in policyformulation trogram administration and research to the notice of policymakshyers piofessionals and scholars concerned with populatioc matters in the Asia-Pacific region Published quarterly in November February May and AugustAnnual subscription rate $12 (free to individuals and organizations involvedin popuJation-related ork) Serial publications except Working Papers aie available without charge tolibraries serving populaion specialsts and to pofessionals and scholars in thefield of population Requests describing the nature of the research or programand the intended use of the publications should be addressed to PublicationSales and Distribution East-West Center
Eia-t-West Population InstituteEast-West Center 1777 East-West Road
Director Lee-lay ChoHonolulu Hawaii 96848 Editor David EllisSenior Editor Sandra E Ward
Consistent correction of census
and vital registration data for Thailand 1960-80
Norman Y Luther Neramit Dhanasakdi
and Fred Arnold
Number 103 December 1986
PAPERS OF THE EAST-WEST POPULATION II ISTITUTE
NOR AN Y LUTHER is Associate Professor Department of Pure and Ap plied Mathematics Washingtu State University and Research Fellow East-West Population Institute NERAMIT DHANASAKDI is Chief of the Popu lation and Housing Unit Population Statistics Branch Population Surve) Division National Statistical Office Bangkok FRED ARNOLD is a Researd-Associate EastWes Population Institute
Library of Congress Cataloging-in-Publication Data
Luther Norman Y 1936-Consistent correction of census and vital registrashy
tion data for Thailand 1960-80
(Papers of the East-West Population Institute 103) Bibliography p 1 Registers of births etc-Thailand
2 Thailand-Census 1960 3 Thailand-Census 1970 4 Thailand-Census 1980 5 Thailand-Statistical services 1 Nerarnit Dhanasakdi l46- I1 Arnold Fred 11lTdEi IV Series HA39T4L87 1986 30460723 86-32807 ISBN 0-86638-089-2
CONTENTS
Acknowledgments vii
Births 23
Deaths
Abstract 1
Method 2
Application to Thailand 1960-80 3
Principal findings 6
Censuses 6
Vital registration 9
Life tables 12
Summary and conclusion 19
Appendix A Derivation of the preliminary correction factors 23
Censuses 24 25
Appendix B Tables 29
Appendix C Formulas for deriving the life tables 35
References 37
V
FIGURES AND TABLES
Figures 1 Preliminary and final correction factors for males Thailand censuses
of 1960 1970 and 1980 11
2 Preliminary and final correction factors for females Thailand censuses of 1960 1970 and 1980 12
3 Preliminary and final correction factors for intercensal registered deaths for males Thailand 1960-65 1965-70 1970-75 and 1975-80 17
4 Preliminary and final correction factors for intercensal registered deaths for females Thailand 1960-65 1965-70 1970-75 and 1975-80 18
5 Corrected life table probabilities of dying rq Thailand 1960-65 and 1975-80 19
Tables
1 Reported and final corrected census age distributions and estimates of completeness for nales Thailand censuses of 1960 1970 and 1980 7
2 Reported and final corrected census age distributions and estimates of completeness for females Thailand censuses of 1960 1970 and 1980 8
3 Final correction factors Thailand censuses of 1960 1970 and 1980 9
4 Completeness estimates (percentages) Thailand censuses of 1960 1970 and 1980 10)
5 Registered and final corrected intercensal births and deaths and estishymates of registration completeness for males Thailand 1960-05 1965-70 1970-75 and 1975-80 13
6 Registered and final corrected intercensal births and deaths and estishymates of registration completeness for females Thailand 1960-65 1965-70 1970-7 and 1975-80 14
7 Final correction factors for registered births and deaths Thailand 1960-65 1965-70 1970-75 ald 1975-80 15
8 Completeness estimates (percentages) for death registration Thailand 1960-65 1965-70 1970-75 and t975-80 16
9 Derived intercensal life tables for males Thailand 1960-65 1965-70 1970-75 and 1975-80 20
10 Derived intercensal life tables for females Thailand 1960-65 1965-70 1970-75 and 1t175-80) 20
vi
11 Estimated midcensus age distributions for males and females Thailand 1965 and 1975 (1 April) 22
B 1 Preliminarily corrected census age-sex distributions Thailand 1960 1970 and 1980 30
B2 Preliminary correction factors Thailand censuses of 1960 1970 and 1980 31
B3 Coale-Demeny model North life tables for determining preliminarycorrection factors for registered deaths for males Thailand 1960-65 1965-70 1970-75 and 1975-80 32
B4 Coale-Demeny model North life tables for determining preliminary correction factors for registered deaths for females Thailand 1960-65 1965-70 1970-75 and 1975-80 33
B5 Preliminary correction factors for registered births and deaths Thaishyland 1960-65 1965-70 1970-75 and 1975-80 34
vii
ACKNOWLEDGMENTS
We are grateful to Wiwit Siripak and Chintana Pejaranonda of the National Statistical Office Bangkok to Robert D Retherford of the East-West Popushylation Institute for helpful discussions and comments and to Robin Loomis of the East-West Population Institute for research assistance Support for this research project was provided by the Office of Population US Agency for International Development under a cooperative agreement with the East-West Population Institute
ABSTRACT A new procedure for the simultaneous and consistent corretshytion of two or more censuses and intercensal registered births and deaths is applied to Thailands censuses of 1960 1970 and 1980 and to registered births and deaths for tile period 1960-80 The procedure begins with a set of prelimishynarv correction fctors that are inconsistent because they are derived from a variety of eisting sources File procedure then identifies the set of consisshytent correction factors that are closest to the preliminary factors
The results show marked tinderenuneration fithe 0-4 age group in each Census especially the 1Q0N) Censtl in which age rounding was apparently prevalent Age eaggeration at tihe oldest ages is also iidicated at least in the I)70t and lc80 censuses I3irth registration completeness rose during 100-80 from about 82 to 85 percent lfo males oIdL from about 78 to S5 percent for females NeVtrtlilesS death re istraitin ompleent for both sexes hovered within the t] to 07 pertent ranige declining slightly until the early ly7t)s when it leveled oft Mrbegainll rti atge grolup )-4 had the greatest uIinderregisshytraltion of deatllh and tnderreistratiioin at this age ipparentlly increased tllroLgll)lt the period AlthoughWl lite tpctaIcv increased fol botlh durshysexes ilg tihe perieid temale uperioiitv in life epectaincv alsoIncreased The avershydge MIlnber of Veas Itift expectaicy i esti mated tilihdvt ilcredsd from
to in to-2 fir femllalesQ3 for feniahegt and 5-18 males I)l)t- - h and 581 for mal in 11)7 80
The lha ilaind censuses Of I)00 1970 and 1980 and vital registration during the period N0t)-80) have betn the subject of variolS etimate of ensus tinshydercounlt tdiusted census e-se distributions underregistratiolmof births and datllhs intercensal life tables and other demographic variables many OttwhichI 0re men tit md beliOw I OWtr those estimaltes as a whoile conshytain nynV incolsistncies lhe ptllpos of this paper is to prOvide a neW CI sistetl set f estinai or thes data making sflective use of the previ-OLts tstillIates
Il accomplish thli is pu rp Iso a new pit(icedILre to] the siniultlnetois and Coilsistlt cirloctioll if to or ire tcensu-es and intercensal registered birlths and deaths (Ilther and Ntt hrford It5(a It)Sfb) is appleHd to Thailtnds ceInsuses of I0t)t) 197(0 and 190 nild to the registered births and deaths f ilfh intrveililrg period Of 1t0t0-8( 5pecificallv for each se the procedure provides estinmtes Of (I) cortctioi fctors for intrcensl registered births (2) age-specific correction iactors for ii terce nsal registered deaths (3) age-specific correction factors ftor the age distributii at each CensuS and (4) life tables fol the intr1censl[ pe t tiis such that the corrected registered births anI deaths the cirreedCte l SlS age distributions and the estimated life tables are mutually consistent Furthermore the correctshyId births satisfx - sex ratio Consistencv here leans that the usualspecified intercensal dei ilraplliC balancing equtiaons relating censIs age distribushy
2 Consistent Correction of Thai Data
tions births and deaths by age are exactly satisfied Net international migrashytion was negligible for the period 1960-80 so that it may be ignored Tile volume of permanent immigration and emigration was small throughout this period Temporary migration of contract workers to the Middle East began to increase in 1978 but it did not become substantial until after the 1980 census
METHOD The procedure begins with a set of preliminary correction factors that are not necessarily consistent These preliminary correction factors are derived from previous estimates and by eisting methods of demographic analyshysis as detailed below Starting from this set of preliminary correction facshytors and the demographic data themselves the new procedure specifies a best or Optimal set of final conisistent correction factors that is closest to the set of preliminary correction factors The optimization procedure finds this closest set by Use Of the pri ncipie from the mathematics Of finiteshydimensional vector spaces that there exists in a hyperplane a unique point of iinimmi in dista nce from a fixed Poi nt n0t in tiht hperpla ne The met hshyodologyv is explained in I tther and Retherford ( lt)6a 1986b) tte latter source gives details for the ntn-mathematicallv-inclined reader It is shown in those sources that 1y utilizi nv the concept (f weighted distance thle procedure allows the analyst to weight the preliminary est imattes dccordshying to the analysts asessmnt Otftheir ikcuracY 1e rise of proportional weights as described in the applicatitti n tOfl roCedCrime tt Sot htIKoreaI data for 1970-80 (Luther aMid Retherftord 98ha IL)Sjbb) will spread the COrshyrection evenly over the prelim inalrV correction tacttrs This is also approprishyate for the Thailand application since we would assess all Of the preliminary correction factors derived below to be of comparable accuraCV
The three-census application to Ihailand given in this paper illustrates ami important advantage of this procedure that it may be used to correct consistently more than two censuses at a time along wth intercensa births and deaths In contrast most previous procedures correct just two ciisLses at a time (eg Demenv and Shorter 1968 P reston 1983) and that typically leads to inconsistent results for the intermediate censu ses from the separate applications of the procedure In particular most previotIs analyses of Thailand data have involved just two successive ceIsuIses (eg Fulton 1979 Arnold and Phananiramai 1t75 iPejaranonda Arnold and I lauser 1983)
Another advntage of the consistent correction procedure is that it alshylows the researcher great leeway in the aniount and type of structure that is imposed For example one may reluire the final age-specific correction factors to be the same from census to census as with the Deneny-Shorter technique (Denieny and Shorter 1968) and the variable methods (Preston
3 Application to Thailand 1960-80
1983) No such assumptions are made for the Thai application given here however This latter more flexible approach which is often more realistic and appropriate was adopted for the Korean application as well (Lutherand Retherford 1986a 1986b) Or one may compromise and assume that the final correction factors follow some trend As an example of a different type of restriction that the procedure allows we have fixed the sex ratio for the corrected Thai birth In fact the only conditiolis that must be satisshyfied by the restrictions involving the correction tactors are that these reshystrictions be linear in the factors and hold when all factors are zero
The proced ore however has limitations The primary one is that the final correction factr are snsiIive to errors in the prelininary correction factors ConseI 1uentlV it is inpo0rt ant to estimate the preliminary correcshytion factors as accurately as possible
In alnV case the final correcti~m factor given by the procedure yieldconsistent adjUtstments of the data The degree totwhich these adjustments reactuall corrctiIns depends on the accuracy of the preliminary correcshytion tacdrs
ITI ICAIION TO TI IAILAND 1960-80 All censuses are treated Isif they occurred on I April although the 1960 census wa taken iio 2April [Ie ft or five-Vear intercensal periods that will be tIjslentl V nent iimed are tOSte separated by I April of the yearsIL)(() 10)b IL)7() and 1()1)75 8
The input into thiprocedtre and specifically into theCmLpter proshygram (which may be ohbtaintd trOil the author) consists o f (1)the 1)6011)70 and I )8)reported ceisos ageC distribo tioIs by se and five-year age griops (open-ended at age 70) given in bibles I and 2 in the next section with each censui ag distribution unilormly preolultiplied by a correction factor based tila Lentsos underenlneratioll estimate (the details of this premtltiplication are given with the derivation of the preliminary correcshytion lcttirs inAppenidix A) (21 tttal registered interce nsalI births by sex for each Of tile four five-year inltrcensaI periods given in bibles 5 and 6 (3) total registered intercensal deaths by sex a11d five-yearage groups (openshyended at age 70) h ir each if tile four five-year initercerisal perio ds againgiven in bibles 5 and 6 (0) 1 I and J for each of the fourVl ues by sex five-year intercensal periods obtained from Coale-)enieny model North life tables (levels 16825 17 175 17225 and 17875 respectively for males given inAppendix lable B3 and 170 176 182 and 19) respectively for fenales given in Appendix ible BA) in order to yield alt estimate of the separation factor for deaths at ages 0-4 by sex for each of the four five-year intercensal periods (3)a specified sex ratio at birth of I058 for each of the four fiveshyyear intercensal -eriods and (6) estimated preliminary correction factors
4 Consistent Correction of Thai Data
for each of the demographic quantities listed in (1) (2) and (3) Because there are fifteen age groups (fourteen five-year age groups plus the openshyended one) for each sex there wil be forty-five census correction factors (fifteen for each census) and sixtv c eath correction factor (fifteen for each five-year intercensal period) If we add to this the four correction factors for births for each sex (one for each five-year intercensal perk d) we have a total of 109 correction factors for each sex The preliminary correction factors are put into the computer program with male factors first and feshymale factors following The ordilr of preliminary correction factors for each sex is births first (in chronological order) then censuses (youngest to oldshyest age group in first census in second census etc) then deaths (younshygest to oldest age group in first intercensal period in second intercensal period etc)
Because registered births and deaths (by age) for Thailand are tabushylated by calendar year it was necessary to interpolate to obtain registeredbirths and deaths for the four five-ytar intercensal periods For exampleregistered births for the first five-year intercensal period 1 April 1960 to 1 April 1965 include three-fourths of the births for 1960 all of the births for 1961-64 and one-fourth of the births fo 1965 The same interpolation procedure was used for deaths by age group
Coale-[Demenv model North life tables have been used frequently in the analysis of thai data for example by Pejaranonda Arnold and Choe (1985) and by Fulton (1979) after a careful study comparing the fit of the different Coale-Demenv (1966) model life table families to Thai mortalityexperience We opted for such model tables rather than those resulting from the Surveys of lopulatiOn Change (SPC) of 1964-07 and 1974-76 (ThailandNational Statistical Office 1969 1978) because of the irregularity of some SPC qjvalues probably due to the small sample size At the mnortalitv levshyels listed in (4) above the (Coale-Denmeny model North tables are appliedboth for estimating separation factors for deaths at ages 0-4 and for derivshying the preliminary correction factors for deaths The one exception involves the later adult ages where it Was judged that the SIPC life tables more acshycurately reflect Thai mortality experience during 1960-8() therefore the SPC life tables were employed for both sexes rather than the model North life tables in order to derive the preliminary correction factors for deaths for the 70+ age group for each Of the four five-year intercensal periods
Moreover the life expectancy values (e)from the SPIC life tables detershymined the levels of the model North life tables that were used For examshypie the 1964-67 and 1974-76 SPC male life tables list Cvalues of 5627 and
Application to Thailand 1960-80 5
5800 respectively These values were assumed for the dates 1 April 1965 and I April 1975 which are encompassed by the respective SPCs Model North I k of 170 and 177 were matched to these male c values at these s accordingly life tables for males for each Of the four five-year intershycensal periods were obtained by linear interpolation taking the reference dates to be the midpoints of the five-year periods
The same process was used to obtain a female lite table for each fiveshy1)year intercensal period except that level was used for the period 1April
1975 to 1 April 198i) rather than 188 as would result from linear interpolashytion The decision to use this higher level was based on evidence that life expectancy for females was accelerating in the 1)70s at least in relation to that for males (Ifill 197Q) MoreoVer the results from using the lower figure of 188 contradicted preliminary evidelce from the 1984-86 SPC that death registratin completeness leveled off in the i7(s rather than continuing its earlier decline
The preliminary correction factors for deaths v sex and by five-year intercensal peiod for the 70 1 age group were obtdined from the SPC life tables as follows The SPClife tables for 19614-67 and 1974-76 were ascribed to the dates I April 1N65 and 1 April 1975 respectiveJly Linear interpolation was performed and again the reference dates were taken to be the midshypoints of the five-year intercen sal intervals
The estimate of 1058 as the true sex ratit at birth was based on the average of the values 1055 and 1062 obtained by the 1964-67 and 1975-76SPCs The same value of 1058 was input for each of the five-year intercenshy
sal periods since there is no reasol to expect the sex ratio at birth to vary from one five-year period to the next The correction procedure then reshyqIuires that the corrected registered births satisfy the specified sex ratio of 1058 for each five-yea r ilterensial period This featuore has been added to the correction prcedu re ince its origilnal description in Iuther and Rethershyfoird ( 19 80a 198b)
The complete details Of the derivation of the preliminary correction facshytors art given in Appendix The reader who is interested in the nechanshyics as well as the results of the cnsistent correction proced ure can refer to that appendix As ment ineCL before the more theoretical aspects of the methodolhgy of the prwedlre are g yV lilh r anl Retherford (19 86ain ill 1986b)
Finally it vs w rth noting that the cost 0f running the computer proshygram for this application involving three Thai censuses aId tour five-year intercensal periods is only about $16
6 Consistent Correction of Thai Data
PRINCIPAL FINDINGS The principal findings are given in Tables 1- H Figures 1-5 and Appendix Tables B1-B5
Censuses Tables 1-4 and Figures 1 and 2 present the final results for the censuses In Figures 1and 2 the final correction factors of Table 3 are compared with the corresponding preliminary correction factors given in Appendix Table B2
Especially striking is the high degree of underenumeration of the 0-4 age group for both sexes for all censuses but especially for the 1960 census (Table 4) This is consistent with the observationof Clhamratrithirorg Deshybavalya and Knodel (1978) Panel on Thailand ()1980) United Nations (1966)and others that the 0-4 age group was especially underenunmerated in the 1960 census because of age rounding owing to the fact that the census quesshytion asked for-ages of household members rather than dates of births Thus the ages of children between exact ages 4 and 5 were frequently rounded upward to age 5 This was less likely to occur in the 1070) and 1980 censhysuses in which date of birth was asked rather than age
If there was rounding to the nearest age at all ages in the 1960 census then the count ot say the 5-9 age group (exact ages 5 to 1t) included some children between exact ages 41 and 5 and excluded some between exact ages 91 and 10 Suppose the extent of rounding was substantial and of similar proportions througlhoJt the entire population Since the total popushylation between exact ages 4 and 5 exceeds that between exact ages 92 and 10 such rounding woud tend to result in a relative overcount of tle 5-9 age group and for the same reason those age groups ibove it Thus for those age spans in which enumeration was relatively complete slight overenumeration would appeir The results show this to be true for ages20-49 for both males and females in the 1960 census (see Table 4) Since the 1960 census is belieVed to have given a relatively complete count for ages 5 and above (United Nations 196) -AucIh slight overellumel ation for some age groups is plausible
On the other hand the results imply that the 197(0 census contained considerable undereluileration at ages 20-41) as well as t ages 90-69 Of course the total p pulation fthe 1970 census was substantialh more unshyderenumerated thln thel1961) census (se eg Fulton 1979 Preston and Hill 1980 and IlutherI1983 as well as Thble 4)
Table 4 also indicates considerabie age exaeratiOin at the older agesin both theI1970 and I1980 censuses althilgh the age exaggeration for males in1970 was not so fficient to fftset the gentrla tLIndercoul t One cannot disshycern from the procedue however wChet her such age exaggeration occurred
Table 1 Reported and final corrected census age distributns and estimates of completeness for males Thailand censuses of 1960 1970 and 1980
1961) 197(1 1980 Age group Reported Corrected Reported Corrected Reported Corrected
0-4 214155 2 512313 286562 3234789 2771779 3040599 5-2 20162t 2)u1079 26821 2757912 2979485 3204070
10-14 15o588 155890 2312473 2353701 3006300 3071068 15-19 12 -2 12t479)k5 18344t- 1932295 2696618 2676213 20-24 121435t 1202446 1323314 1500287 2239837 2275485 25-29 1026o54 101970)4 1099473 1236913 1743323 1847351 30-34 885681 875t90 1048610 1141353 1333155 1423980 35-39 6L93448 L)02 10Q 954 16= 9611952 1161496 1170734 40-44 569740 53L)45 775308 818919 1064541 1075500 45-49 494(M01 48718s 5149S7s o34543 927227 891716 50-54 402425 403137 472783 507599 744588 744492 55-59 322258 322 151 388820 424953 543743 555018 60-64 229018 242226 301182 333743 411260 422898 65-69 149291 157901 213227 24568q 29674 3281S7 70+ 177685 187933 250973 267276 408481 395896
Total 13154122 13522828 17123861 18 50923 22328607 23123208
Competeness () 9727 9331 9656
Sources Reported figures are from Thailand Central Statistical Office (1962 table 3 p 9) Thailand National Statistical Office (192 table 4 p 12 1983 table 4 pp 22-23) Unknown ages are allocated proportionally
00 Table 2 Reported and final corrected census age distributions and estimates of completeness for females Thailand censuses of 1960 1970 and 1980
IQ60
Age group Reported Corrected
0-4 2105216 2439170 i-9 1982900 1974806
10-14 1527750) 1520036 15-19 1238223 1242389 20-24 1206012 1198094 25-29 1048097 038303 30-34 871233 865 134 35-39 681001 c77001 40-44 564692 561835 45-49 483720 480027 50-54 410994 418251 55-59 329554 334693 60-64 245371 262045 65-69 163855 174990 70+ 245099 261755
Total 13103737 13448530
Completeness () 9744
Sources Same as Table I
1970
Reported Corrected
2799770 3117372 2609020 2673382 2255500 2308528 1887756 1918301 1363440 1475896 1144824 1200251 1078451 1154181
958819 992093 767302 819472 598210 633529 490414 519371 402239 434036 324633 365000 239-203 271841 353933 347895
17273514 18231149
9475
1980
Reported Corrected
2654067 2954623 2855893 3129504 2898197 3000334 2711643 2616050 2281192 2257910 1811104 1865258 1365493 1426153 1183324 1155458 1i02535 1107333
967187 940695 768793 765667 567740 577231 442596 457181 333312 358791 552857 522357
22495933 23134546
9724
9 PrincipalFindings
ihble 3 Final correction factors Thailand censuses of 1960 1970 and 1980
1960 1970 1981)
Age group Males Females Males Females Males Females
0-4 1173 1158 1129 1113 1097 1113 3-9 992 996 1028 1025 1075 1096 10-14 995 9195 1018 1024 1021 1035 15--19 1026 1003 1053 1010 992 965 20-2-t 990 993 1134 1083 1016 990 25-29 993 QC1 1125 1049 1060 1030 30-34 989 993 1088 1071 1068 1044 35-39 995 994 1007 1034 1008 977 40-44 990 995 1056 1068 1010 1005 45-49 985 992 1058 1059 962 973 50-54 1002 1018 1073 1159 1000 996 55-59 999 1016 1092 1179 1020 1017 60-64 1058 1068 1 I10 1125 1029 1033 65-69 1058 1068 I 152 1136 11(15 1076 70 + 1058 1068 1065 983 969 945
Note l1e ent ries htre nh v be ibtli lwd by dividing the corrected population by the corrnspondshying reported population in labhS I and 2
in the 1960 cenIsus With the choice of the same preliminar correction facshytors for the last three age groups in the fiist of the three ct( qsuses and the use of the proportional weights mentioned earlier to spread the correcshytion eenh it can be shown that the procedure will necessarily yield the same final correction factors for those last three age groups in the first cenus I n the figures 1058 for males and 1068 fir females for th 1960 census should be considered as the final correction factors (and correspondshyingly 945 percent for males and L)36 percent for Iemales as the final comshypleteness estimates) for the combined 0()+ age group rather than for the 60-64 65-61 and 70+ age groups separately
As Figures I and 2 indicate the preliminary and final correction facshytors for the censuses agree quite well except at the late ages This shows that a considerable degree of consistent is already present with the detershyruination of the preliminary correction factors (see Appendix A)
Vital registration The vital registration results are given in Tables 5-8 and in Figures 3 and 4 in which preliminary and final correction factors for deaths are compared
10 Consistent Correction of Thai Data
Table 4 Completeness estimates (percentages) Thailand censuses of 1960 1970 and 1980
1960 1970 1980
Age group Males Females Males Females Males Fenales
0-4 853 804 886 898 912 898 5-9 1008 1004 973 930976 912 10-14 1005 9821003 t77 979 966 15-19 975 950 1008997 984 1036 20-24 1010 882 9841007 923 1010 25-29 1007 1009 889 Q53 943 971 30-34 1011 1007 919 935 936 958 35-39 1005 1006 992 967 992 1024 40-44 1010 1005 947 936 ()90 995 45-49 1015 1008 945 944 104(0 1028 50-54 998 982 932 944 100(0 1004
1(1 1 984 916 2 18)0 983 60-64 945 902 972936 88() 968 o5-69 945 936 8o8 880 Q(5 929 70+ 945 936 939 1017 1032 1058
Note mhe entries here ae the rMcprocls (cprtmtgtdIS t 0Itth(L1titns ( HeIc 3 Alternativel they mayhh olltained kdividing b thtuhe reported popnlaLtill corshyresponding corrected population il abhl Iandt2
The birth registration results are in reasonable agreement with those of the United Nations (1976) US Bureau of the Census (1978) 1fill (1979)and others (See table 7 of Panel oin Thailand 1980 for a good summary of estimates of birth registration completeness prior to 1976) The upwardtrend as well as the level of the estimates of the completeness of birth registration is also consistent With a preliminar birth completeness estishymate of about 89 percent for the coimbined sews from the first year of the 1984-86 SPC (subject to change)
The death registration results also compare quite well with otither estishymates (Again table 7 of Pa nel on Thailand 1981 gives a gO)c d summarv of estimates of death registration completeness) ThC results indicate a decrease in death registration completeness during the 1960s and early 1970s and a slight upturn in the late 1970s on the whole--an upturn formales and a leveling off for females (iables 5 and 6) This trend and tile level are consistent with the resutILts of the 1964--67 and It174--76 S[lCs and a prelimishynary finding of the first year of the 1984-86 SPC which gives an estimate of about 76 percent completeness for death registration of both sexes conshybined (sutbject to change)
1 Principal Findings
Figure 1 Preliminary and final correction factors for males Thailand censuses of 1960 1970 and 1980
11 A 1960 census 1t) B 1970 census 126 126
122 122
118 118 A114 114 - ^
110 110
H106106
U 102 (cent 102 098 -098
094 094 p9) O1 I I 0 9 1 I i
) 10 20 30 40 54) ho 70 0 10 N) 30) 40 30 60 70 Age Age
134) C 198)) Census 126 ---- Preliminary
122 - Final
118 114
bull 110) -S
1l - 106
0d 1402 098
094
0 W 20 0 40 44 00 0
Age
Ntle [1 tlts ut plotted at the nodpo ittullive-year age gtm ps
It is not surprising that the results indicate greatest underregistration of deaths at the VOingest and oldest ages and especially at ages 0-4 (Table 8) It is somewhat surprising however that death registration completeshyness at ages 01-4 declined steadily and substantially during the period 1960-80 ThIS trend is present il1 the prelli inma ry correction factors as well
Another interesting feature Of the results especially evident from inshyspection of Figure 3 is the high degree of underregistration of male deaths at ages 20-29 for all five-year intercensal periods This trend also emerges for females (Figture -4) but only after 1970
The preliminary and final correction factors for deaths show considershyable agreement except at the late ages as was true for the censuses (Figures 3 and 4) Thus the preliminary correction factors as a whole reflect a conshysiderable degree of consistency although less sO at the late ages
12 Consistent Correctionof Thai Data
Figure 2 Preliminary and final correction factors for females Thailand censuses of 1960 1970 and 1980
130 A 1960 census 130 B 1970 census 126 126
122 122
118 118 114 -114
2110 20 110
S106 o
U 112 U
106
102
098 098
094 094 090
0
10 1
20 1 L
30 40 50
L L60 70
090 0 10 20 30 40 50 60 70
Age Age
130- C 1980 census
126 - - - Preliminary
122 - Final118
C110
106
U 102
098
094
01 10 20 34 40 So 60 70 Age
Note Result are 11h0tted at 1he midpOilnts Of five-year age groups
Life tables The intecensal life tables for the four five-year intercensal periods which are derived from the results of the consistent correction procedure are given in Tables 9 and 10 and the life table death probabilities for the extreme periods 1960-05 and 1975-80 are shown in Figure 5 The life tables are comshyputed directly from corrected deaths and population by age as detailed in Appendix C where precise formulas are given The calculations use the estimated midcensus age-sex distributiops of Table II produced by the conshysistent correction procedure which pertain to 1 April 1965 and 1975 and the corrected data given in Tables 1 2 5 and 6
Table 5 Registered and final corrected intercensal births and deaths and estimates of registration completeness for males Thailand 1960-65 19t5-70 1970-73 and 1975-80
Births deaths Birh- eats- 1970-75 1975-80 1 1965-70 and age group Reported CiLrrected Reported Corrected Reported Corrected Reported Corrected
Births 2 31) 151 310478S 2944t3 356274o 3050797 3628987 2811543 3318567
Completeness ( 8233 82 t 8407 8472
Deaths 0-4 224812 40o 581 11302 41P457 161667 408795 114808 353137 5-9 3320o 53298 32834 5b786 30189 60236 26830 58212
10-14 17047 24933 18345 27943 18979 30080 18725 32687 15-19 15724 2622L) 19L579 31394 24350 36402 28405 40395 20-24 1740t 3348 10474 34681 25213 42 118 34247 49555 25-29 17153 30488 18o67 30907 21261 33789 28100 41822 30-34 18542 27638 20938 30441 22404 31309 25424 34895 35-39 20504 2o835 23819 28938 2012 32171 28646 32365 40-44 21800 25428 25539 30134 29430 32950 34024 35861 45-49 2587L) 258L)8 27 100 28957 31377 34913 37724 37489 50-54 29031 30362 3172u 32409 33649 37130 39701 43501 55-59 305h2 31804 34254 35791 36937 39127 39933 43506 60-64 329L72 35689- 38825 40830 42815 47027 47810 49641 65-69 29 125 35765 3553 44602 42954 51940 47423 57736 70+ 7t276 10767 96868 138 10t 116912 164488 135619 182003
Total tlt 129 C180t3 h35817 1011375 t64139 1082462 687419 1092807 Completeness () 664o 6287 6135 6290
Sources Registered births Thailand National Statistical Otfice (nd No 30 1972-73 table 29 p 84 nd No 32 1976-80 table 23 p 951982) Registered deaths Thailand Ministry of Public Health Division of Vital Statistics (1962 1965 1968 1972 1977 1983)
Table 6 Registered and final corrected intercensal births and deaths and estimates of registration completenessfor females Thailand 1960-65 1965-70 1970-75 and 1975-80
Birthsideaths 1960-65 1965-70 1970-75 1975-80 and age group Reported Corrected Reported Corrected Reported Corrected Reported Corrected
Births 2363132 3019648 2715779 3367435 2855596 3430045 2668218 3136641 Completeness () 7826 8065 8325 8507 Deaths 0-4 5-9 10-14 15-19 20-24 25-29 30-34 35-39 40-44 45-49 50-54 55-59 60-64 65-69 70+
179043 28697 13666 12699 17128 17818 18996 i9399 18638 17435 18896 20050 22 i49 21484 80530
32o591 44300 22003 20210 20309 2299) 22721 21737 20457 19517 22208 24879 29241 32793
128951
156281 28574 14417 14951 16315 1t064 18593 20059 19886 19035 21055 22003 27055 26940
103983
322376 44230 23249 23460 22608 21149 23368 23332 23534 21216 23738 26519 32896 38b87
155187
128101 26629 15082 17026 17126 14373 16417 19252 21014 20562 22454 24353 28673 31284
122355
299387 43815 23511 25134 26552 23553 21450 24170 25873 24908 26417 28759 35524 43940
171486
87644 22848 14225 17742 17607 14539 14281 16822 21218 23301 24628 25672 31768 33738
140629
230302 36716 22567 24770 27821 26578 22803 21778 26299 26455 30375 30896 38309 47897
205244 Total 506628 778916 525211 825548 524701 844480 506662 818809 Completeness () n5)4 6362 6213 6188
Sources Same as Table 5
Table 7 Final correction factors for registered births and deaths Thailand 1960-65 1965--70 1970-75 and 1975-80
Births deaths Birth dti11965- 70 1970-75 1975-80 -- and age group Males Fenales Males Females lales Females Males Females
Births 1215 1278 1211) 1240 1190 1201 1180 1176
Deaths 0-4 8(N 1824 2193 20t)3 2529 2337 3076 2628 5-9 1o( 1544 172- 1748 1995 1645 2170 1607
10-14 14h3 1610 1523 1hO13 1585 1559 1746 1586 15-19 1o8 1591 1603 1569 1495 t476 1422 1396 20-2- 1735 1186 1781 1386 1670 1550 1447 1580 25-29 1777 1291 1656 1 317 1589 1639 1488 1828 30-34 1491 1196 1454 1257 1397 1307 1373 1597 35-39 1309 1121 1215 1163 1237 1255 1130 1295 40-44 1166 1098 1180 1183 1120 1231 1054 1239 45-49 1001 1119 1069 1115 1113 1211 994 1135 50-54 1046 1 175 1022 1127 1103 1177 1096 1233 55-1) 141 1 241 104-5 1205 1059 1181 1089 1203 61-64 1082 1320 1052 1216 1099 1239 1038 1206
1228 1526 1220 1436 1209 1405 1217 1420 A) + 4 16(01 1426 1492 1407 1402 1342 1459
Note The entries here mav be obtained by dividing the corrected births or deaths by the corresponding reported births or death in Tables and 6
(-n
Table 8 Completeness estimates (percentages) for death registration Thailand 1960-65 1965-70 1970-75 and 1975-80
1960-65 1965-70 1970-75 1975-80 Age group Males Females Males Females Males Females Males Females
0-4 5-9
10-14
15-19
20-24
25-29
30-34
35-39
40-44 45-49
553 623
684
600
576 563
671 764
858 999
548 o48
621
629
843 775
836
892 911 894
456 578
657 624
561 604
688
823
847 935
485 646
620
637
722
759
796
860
845 897
395 501
631
669 599
629
716
808
893 898
428 608
641
678 645 610
765
797 812 826
325 461 573
703
691
672
728
885
949 1006
381 622
631
716 633
547
626
772
807 881
50-54 55-59
60-64 65-69 70+
956 961
924 814 714
851 806
758 655 625
978 957 951 820 701
887 830
822 696
670
907 944
910 827
711
850 847
807 712 713
912 pound18 963 822
745
811 831
829 704
685
Note The entries here are the reciprocals (epressed as percentages) of the entries of Table 7 Alternativelythey may be obtained by dividingthe reported deaths b the corresponding ci)rrected deaths in Tables 5 and 6
PrincipalFindings 17
Figure 3 Preliminary and final correction factors for intercensal registereddeaths for males Thailand 1960-65 1965-70 1970-75 and 1975-80
31 A 1960-65 intercensal 31 B 1965-70 intercensal 29 deaths 29 deaths 27 27
8 25 5 25 - -- reliminarvt t 23 23 Final 21 521 1 19
t17 shy 17 U 15 U 15
13 13 11 1I 09 I I 09 I I 0 M 20 30 40 50 60 70 010 20 30 40 50 60 70
Age Age
31 C 1970-75 intercensal 3 1 N75-8) intercensal 29 deaths 29 deaths 27 27
825 5 25
C 21 21
19 19 17 C t 17 U 15 U 15
13 13 Ie 11
S10 1 20 301 4(0 50 6 70 ( I0 2(1 30 10 5( W 70 Age Age
Notes Results are plotted at the midptints it live-year oge gromps For births the prel imishynary anid final correction factors are 1960-05 12-I arid 121 19o5-71 1220 and 1210 R70-75 I 199 and I 1)0 1975-80 179 and 1150
The life tables generally show mortality improvements with time as one would expect The improvements are more substantial for females than males (Figure 5) The improvement in life expectancy is greatest for the younshygest age group in accordance with the pattern in most countries Both the 5q estimates based on marked Underregistration of deaths at ages 0-4 and the life expectancy estimates agree quite well with those given by the SPCs for 1964-67 and 1974-76 and by Rungpitarangsi (1974) for 1960 and 1970 Moreove the widening gap between niale and female life expectancies durshying the period 1960-80 is consistent with the conclusions of Hill (197934-35) and the results of the SPCs
18 Consistent Correction of Thai Data
Figure 4 Preliminary and final correction factors for intercensal registered deaths for females Thailand 1960-65 1965-70 1970-75 and 1975-80
31 A 1960-65 intercensal 31 B 1965-70 intercensal 2) deaths 29 deaths 27 27
525 8 25 --- Preliminary 23 23 Final
21 g 21 19 C 19
t 17 - 17 U 15 - 15
13 - 13 11 110
0 1020 30 40 50 ( 71 10 1 20 30 40 50 (A) 70 Age Age
31 170-75 intercensal 31 D 1975-80 intercensal 29 deaths 2() deaths 27 27
25 2 5 2 23 2 2
521 521 i 19 19 o 17 - 17
U 15 o 15shy
13 13 11 1
0 I0 210 40 W060 71) I 10 20 31 40 51 6i0 70 Age Age
Notes Results are plotted at the midpoint ot tive-vear age roups For births the prelimishynary and linal crreition factors are Ilt() (IS131())and I 278 l9o-70) 125 ) and 1240 1970-75 1211 and 1201 l17 8(1 1171 and I 17
Finally comparison of the 1960[-5 and 19(15-7) male life tables reveals a possible slight anomaly in the results The [- value decreases a bit whereas the 17 value increases Fhis means that proportionately more people surshyvived Ia age 70 according to the 1965-70 life table than according to the 1960-65 one but that the greater number lived fewer person-years thereshyafter This reversal mav be teal Another possibilitv is that the SLC life tashybles do not reflect the mortality experience of males accurately at the oldest ages This reversal is slight howover compared with a more pronounced reversal of this same type that results for females when one uses model North life tables rather than the SPC life tables to determine the prelimishy
Summan and Conclusion 19
Figure 5 Corrected life table probabilities of dying 5q Thailand 1960-65 and 1975-80
020 A Males 020 B Females 1 018
( 16 I 016 - - - 1960-65 I R 14 I 014 1975-80
I 012 012
5x 0 5hv0 0 10 008 008
I M004 - -I O 7 002 2 L LO(X) J ) (ILX) ( bull t
0 0 1 0 SO O 71)00 20 40 60)) 0 M1 3t) 50 70
narv correction factors for the 70+ age group It was primaril on this basis that tile [(- life tables Were chosen to determine the preliminary correcshytion tactors for the 7) age group
SUMMARY AND CONCUSION
This paper has applied a njw p)roccire tor the simulanleous and consisshytent corrtction ()tttw) Oit re con tPs dsnd inttrcrnsal registered births di deaths to tile three Iwi omsOtes o1960t) 1970 and l980 and to tile
registered births and dLeaths for the intervening period 1960-80 The results reveal arked u ndere numerition t)t tile 0-4 age gro)up in each Centss and especialiy ill the 1)6) CeSu- illwhich age tLI cllding was apparentlyv prevashylent There is alSo an indicatliorl o age (e4gera ion at the ()ldest ages at least in the 1970 aild 198) censulses
heC results 11lso) indicale that birth rgistratio)n cmMpILlletess rose durshying ()-8() wherealdeath regit rati) 1 omn pleteness dcli ned slightl until the carly It70s and thenI leveled off o)rtgan tt rise TWle greatest Undershyregitratioti of deattIs was at ages 0-4 and the registration completeness tr deatlis at this age appets to have decreascd tih roughout the period
life e ( ti-V rose for h10th males and felales at an average of about Mne-filthl VCar per year for IiieS adc tw i-fifths Year per year for femalesbthweeCn 1960 and I)8 TIMs female superitrity illife expectancy increased during the period Ir(in about 45 Years in l960-65 t abotil seven Vea ls in 1975--80
Final Vit sho(uld be Inlotd that these results are reasonabh consistent with previous estimates Tile resuIts Of this paper howver have the adshyvantage (If providing consistent corrections for multiple sets of data involvshying more censuses and intercensal periods than in previous studies
20
Table 9 Derived intercensal life tables for males Thailand 1960-65
1960-65 1965-71 Age 51h I -I iIA IX I r
0 13134 100 000 150391 12092 1000)0 453974 5 02417 8686( 429551 02192 87908 139061
10 01426 84766 421 F54 01298 85981 427369 15 01850 83557 -114243 01821 84865 42(1906
20 02428 82012 -I05215 02493 83311) 411837 25 02760 80020 394 Qo-I 02536 81243 401200 30 02932 77812 383707 02832 79182 390700 35 03470 75530 371773 03163 76 030 378991
40 04091 72011 357698 04031 74506 365798 45 04945 0cent)927 341421 04861 71500 349523 50 0846 6m401 32171)7 0511 68024 329600 55 08833 61)18 296 ()1)2 08657 3593 305 116
60 12764 564491 205 801 12435 58088 273699
65 18392 4924-4 22 5()7 18223 50805 233 1 1 70 1002(0) 11) 187 421)83 I001)0) 4156 388510
Co) 5483
Thble 10 Derived intercnsal life tables f r females Thailand 1960-65
1)) -3 1065--70)
Age h1 I hI
10 1Hl400 I1)1( -158100 119845 10)000) 142870
5 02048 88851 4-10193 1)177 90 155 -1471)79
10 01283 871)31 432705 )10)97 88572 4-11)039
15 01478 85()15 -I0( 7 )138(1 8760)) 135330
20 1)1665 8-161 11) 3 )1678 80386 428649
25 02065 832361 112152 0 1764 84937 21975
30 0)2415 81518 -1030)78 )2111 83-38 413)10
35 02858 7)557 3L)2721 )253) 81652 403513
40 0)3328 77283 381183 03181 79586 392296
45 03766 71711 366947 03572 771)52 378)13
50 04953 71898 351999 14761 74299 363 195
55 16658 68336 331211 )221 71761 31331)
61) 1)9863 63786 304461 0)428 66357 317479
65 15370 5795 268423 1146) 60 11 281512
7 1))1( 4865-1 538 142 I 1)000 51411 559211)
CO 5926 6087
21
1965-70 1970-75 and 1975-80
1970-75 1975-80
Age 511A -LA 511 1 L
0 11320 100000 455822 10458 100000 453119 5 02039 8868 43915 01826 89542 443680
10 01187 86872 431966 01129 87907 437201 15 01713 85841 425863 01613 86915 431320 20 02488 8371 117213 02372 85513 422966 25 (2492 82272 406660 02533 83485 412752 30 02637 90221 395959 02642 81370 401925 35 03079 78106 381948 02802 79221 390702 40 0372(1 75701 371905 03540 77001 378691 45 04867 72885 356495 04397 74275 363731 50 06556 61)338 336258 06369 71009 344967 55 08426 64792 311001 08230 66486 319893 60 12437 59337 279474 11683 61114 288159 65 18057 51957 238038 17411) 53886 247646 70 1000 (275 4(03076 100000 44499 464938 C1 5654 5807
1965-70 1970-75 1975-80
1970-75 1975-80
Age vL 1 SI IA 1L
(1 08777 100000 465904 0722(- 100000 470985 5 01531 91223 452843 0118t) 92774 461165
10 00950 89826 447 141 00801 91674 456653 15 01199 88973 442431 01011 90941 452559 20 01590 8791 436469) 01343 90021 447349 25 01778 86509 429060 (1617 88812 44(0921 30 01823 84971 421016 01754 87376 433416 3 02262 83421 412961 01887 85844 425213 02878 81534 402287 02517 84224 416178
4t5 03480 79) 187 389823 03029 82 104 404827 50 14616 76432 3741132 0431)5 79617 390341 55 06060) 7290-1 354 164 05666 76118 370668 60 18893 68486 327937 (8596 71815 344588 65 13898 62396 29224) 13151) 65633 307631 70 1((0 53724 643952 1100 56996 7(11 129 C 6292 6524
22
Table 11 Estimated midcensus age distributions for males and females Thailand 1965 and 1975 (1 April)
1965 1975
Age Males Females Vizes Females
0-4 2877805 2767810 33(346 3196146 5-9 2396066 2342268 3116518 3029976
10-14 1961963 1941655 2712754 2639719 15-19 1533324 1498930 2320461 2284206 20-24 1269707 1222121 1893040 1892458 25-29 1172027 1176440 1462338 1450844 30-34 990641 1015443 1204364 1 177749 35-39 848454 842905 1109613 1131371 40-44 664088 655904 928391 967072 45-49 538282 541848 784987 794082 50-54 459053 459164 598521 607866 55-59 372054 394707 4(9471 491783 60-64 288405 307633 381876 4(11894 65-69 206500 231028 28426(0 325268 70+ 221181 291397 322508 426281
Total 15799553 15689261 20897418 20816715
Note These ire fie estimated midctnsus ge-seX distributions given by tle consistent corshyrection procedure
23
APPENDIX A DERIVATION OF THE PRELIMINARY CORRECTION FACTORS
Births A linear increase Was assumed in the birth registration completeness of both sexes combined from 78 percent on I April 1960 to 86 percent on 1 April 1980 This agrees quite well with the estimates of the US Bureau of the Census (1978) and Hill (1979) We should note that the latter estimates are based on the Ministry of Public Itealth (MOPI 1)registration figures whereas ours are based on the Ministry of interior (MCI) figures which are larger in most years see the corrigenda sheet of I till (1979) for a comparison of these figures through 1974 A se ratio at birth of 1058 for each five-year intercensal period was also used to help calculate the preliminary correcshytion fadtors for births by sex
From this assumption regarding birth registration completeness it folshylows that the average birth registraticin completeness for the combined sexes was 79 81 83 and S5 percent for the successive five-year intercensal peshyriods The calculation of the preliminary correction factors for male and female births for the first five-year intercensal period will be shown in deshytail for illustrative purposes
Let k and k1 be the preliminary correction factors for numbers of male and female registered births 1 and 1 respectively for the five-year period Then k1 and kf13j denote the estimated true numbers of male and female births Assuming a 1058 sex ratio at birth one has
k1R31 = 1058kjB1 (1)
Assuming moreover 79 percent birth registration completeness for 1960-65 one may equate two different epressions of the true number of births for the combined sexes as follows
k13 + kj t = ( + Bl)(79) (2)
Since R 263015 1and Bt = 2363 132 are known they may be subshystituted into eq uations (1) and (2) These equations then represent a sysshytem of two linear equa otiOl1s ill the two unknowns k and k which may be solved simultaneoushl to yield the values of km and kt
The same process may be used to find the preliminary correction facshytors for reg istered births for the other five-year intercensal periods The Valus obtained for the successive periods are 1234 1220) 1199 and 1179 for males and 1300 12501 12 11 and I 174 for females The are recorded in Appendix 11ole B5
24 Consistent Correction of Thai Data
Censuses Tile preliminary correction factors for censuses are derived directly from the following corrected census age-sex distributions obtained from outside sources (1)For the 1960 census the correction given in United Nations (1966) (2) for the 1970 census the correction of the 0-4 and 5-9 age groups in Arnold and Phananiramai (1975) and of the other age groups in Fulton (1979) and (3) for the 1980 census the correction given by Pejaranonda Arnold and Hauser (1983) We use the final census report (Thailand Nashytional Statistical Office 1983) rather than the Advance Report (Thailand Nashytional Statistical Office 1981) for the corrected female 1980 census population age 701 52900 rather than 562900 These preliminarily corrected censhysus age-sex distributions are recorded in Appendix Table 131 and the resultshying preliminarv correction factors obtained by divid ing these preliminarily corrected populations by the corresponding reported populations from Tashybles I and 2 are given in Appendix Thble B2
A certain amount of consistency is bUilt into the preliminary correcshytion factors for censuses by the use of the census corrections above each of which is derived in part from the preceding cenIsus correction lIowever the preliminary correctin factors for births are derived independently and to an extent the same may be said for the prelininary ti rrection factors for deaths (see below)
As with Pejaranonda Arnold and I tauser (1983) we have opted for the Fulton (1979) corrections of the 1970 census age-sex distribution rather than those of Arnold and Phananiramai (1975) The preliminarily corrected census age-sex distributions of Appendix Table B1which have been used for deriving the preliminary correction factors for censuses are used to calshyculate total population preliminary correction factors for each sex at each Ce(IStLu [he reciprocals of these factors in turn yield census underenumershyation estimates by sex for each census The total population preliminary correction factors are given in the last row of Appendix Fable 12
The reported census age-sex distributions (given in Tables I and 2) are uniformly premultiplied bV these total population preliminary correction factors of Appendix lhble 12 before being put into the computer For exshyample each female five-year age group is premultiplied by 1051 for the 1970 census and bv 1025 for the 1980 census R)hcompensate each prelimishynary correction factor given in Appendi Table B2 must be divided accordshyingly before it is put into thle computer This will insure that each input census age-sex group population multiplied by the corresponding input preliminary correction factor still yields the preliminarily corrected census age-sex group population of Appendix Table 131Thus for example each preliminary correction factor for females must be divided by 1051 for the 1970 census and by 1025 for the 1980 census before being put into the
Appendix A 25
computer In particular the input preliminary correction factors for females of ages 0-4 for tile 1970 and 1980 censuses are 11041051 = 1050 and 11101025 = 1083 respectively These adjustments of the reported census age-sex distributions as well as of the preliminary correction factors for tile censuses must be put into the computer program to get appropriate census underenumeralion levels in the final results (output) This is true because the comruter program is written so that for the last census (the 1980 one in our case) there is eCtLalitV between tile total input population for botl sexes combined and the total output (corrected) population for both sexes combined This equality was incorporated into the computer program to obtain more control over the census underenumeration levels in the final results
Finillv except for tile 0-4 age group in which underenumeration is very evident because ot age rounding (see section on principal findings) all pieliminarv correction factors fr both sexes for tile 190 census were chosen to be I on the basis of United Nations (1966) First of all the opshyposing effects of age rounding partially compensate in all age groups exshycept 0-4 and 70+ and the effect is relatively small on the 70+ age group Second other than for the 0-4 age group the 196() census count appears to be fairly complete and accurate by five-year age groups (United Nations 1966) Moreover this choice was made simply for lack of better evidence
Deaths Coale-Demeny model North life tables were used to determine tile prelimishynary correction factors for deaths for all age groups below 70 The levels used were based on the e values of the 1964-67 and 1974-76 SlC life tashybles as du-cribed in the section on application of our method to Thailand 160-8J The life tables corresponding to these levels for males and females are given in Appendix ables B3 and 134 respectively
For the 704 age grou p the SI life ables were uaed rather than model tables That is the preliminary correction factors for deaths for the 70+ age group were derived from life tables obtained from the SPC life tables by acm interpolation process described in the section on application of the method
The 1960--65 and 1970-75 preliminary correction factors for deaths were derived from the life tables bv a forward survival method involving th 1960 and 1970 prtoiiminarily corrected census age-sex distributions Similarly the 1965-70 and 1975-80 factors were derived by a reverse survival method inshyvolving the 1970 and 1980 preliminarily corrected census age-sex distribushytions The preliminarily corrected census age-sex diitributions are given in Appendix Table B1 and the preliminary correction factors for deaths are given in Appendix Table B5
26 Consishnt Correction of Thai Data
More precisely the forward survival formula used for the periods1960-65 and 1970-75 to calculate tile preliminary correction factor for deaths (ha) at age a to a + 5ik
SPa 511a)1(i l )I
5 ( - 1 )P -
=L- D (3) where la denotes life table survivors at exact age a 5L denotes life table person-years lived between exact ages a and a + 5 D denotes the numshyber of registered deaths of age a to a plusmn 5 for the period and Pa denotes the preliminarily corrected population of the age group a to a + 5 for tile census immediately preceding the period in question (the 1960 census for the period 1960-65 and the 1970 census for the period 1970-75)
The rationale behind formula (3) is as follows In the first line of forshymula (3) the first factor in the numerator gives the number of those age a - 5 to a in the preliminarily corrected census population at the beginningof the p2riod who have survived to attain age a during the period based on the life table used for the period The second factor in the numerator is the life table probability of d ying between age a and a + 5 for the periodThus the numerator which is the product of these two factors gives an estimate of the true number of deaths between ages a and a + 5 for the period When divided by D1 the registered number of deaths between ages a and a + 5 for the period this yields the estimated (preliminary) correcshytion factor for deaths for this age group
Similarly the reverse survival formula used for the periods 196 70 and 1975-80 is
P Il(1 51(1 ) l D1
5 ( - 1+ )P( 4
9LD (4)
where the notation is as above except that Pa is the preliminarily corrected population of the age group a to a + 5 for the census immediately followshying the period in question
Formula (4) is the same as formula (3) except for the first factor in the numerator In both formulas this first factor estimates the true number of people who have attained age a during the period In formula (4) the numshyber who have attained age a during the period is obtained by reverse stirshyvival of those aged a to a + 5 in the preliminarily corrected census
Aupendix A 27
population at the end of the period rather than by forward survival of those aged a - 5 to a in the preliminarily corrected census population at tile beshyginning of the period as in formula (3)
Clearly the forward survival formula for 1960-65 and 1970-75 is not apshyplicable for tile age group 0-4 However its natural analogue is
h1 (1AD0 (5)
where B denotes the estimated true number of births for tile period and the other notation is as before Equation (5) is used to determine the prelimishynary correction factor for deaths at ages 0-4 B is obtained by using tle preliminary correction factors for births determined above to estimate the true number of births For example the preliminary correction factor for deaths for females of ages 0-4 for the period 1960-65 given in Appendix Table B5 is
= (100000 - 89462) (1300) (2363132) = (100000) (179043) __ 1808
tlere 89462 is the 1 value from the Coalo-Demenv model North level 170 female life table
Special formulas are needed also for the preliminary correction factor for deaths for the 70+ age group Tile approximate reverse survival formula that is used may be obtained from equation (4) by letting a = 70 and a + 5 be an age beyond which anyone lives I lence it is the same as equation (4) with a = 70 1 + c set equal to 0 Pa and D replaced by the preliminarshyily corrected census population P7 and registered deaths D70+ respecshytively and replaced by 17 the life table person-years lived above age 70 Thus
57 (6)
1 D 6
As before P70 refers to tile census immediately following the period in question
For example the value of h70 for males for the period 1965-70 is
5(43881) (280900)(428383) (90868)
(Recall that the interpolated SPC life tables re used for the 70+ age group)
If census and death registration data and SPC life tables for five-year age groups beyond age 70 are available as is true for some periods one mav Lste a nlore precise 1ormula than equation (o) for h1 This formula would consist of a sum with terms like equation (4) for the five-year age
28 Consistent Correction of Thai Data
groups and equation (6) for the open-ended age group However it was found that this more cumbersome formula yielded correction factors that differed little from those given by formula (6)
The reverse survival equation (6) was used to determine h70 not only for the periods 1965-70 and 1975-80 but also for the periods 1960-65 and 1970-75 after forward surviving the age group 65+ preliminarily corrected population of the 1960 and 1970 censuses to 1965 and 1975 respectively It can be shown that the same result is obtained by using the forward surshyvival formula
517o Pj5+
T65 D7 0+
where P6 is the preliminarily corrected population of the age group 65+ for the census immediately pieceding the period in question
APPENDIX B TABLES
Table B1 Preliminarily corrected census age-sex distributions Thailand 1960 1970 and 1980
1960 1970 1980 Age group Males Females Males Females Males Females
0-4 2517000 2448000 3219100 3090100 3074700 2945500 5-9 2016300 1982900 2725400 2644500 3208900 3083900
10-14 1565L)00 1527800 2350 100 2300700 3103700 2975700 15-19 1265200) 1238200 1904900 1919400 2672900 2587500 20-24 1214400 1206000 1475000 1480000 2283800 2265600 25-29 102t700 1048100 1263200 1192300 1866600 1862800 30-34 885700 871200 1147400 1153900 1447200 1421600 35-39 693400 681000 965700 99o200 1178700 1172900 40-44 569700 564700 826100 821400 1063100 1105100 45-49 494700 483700 637800 635800 884600 931100 50-54 402400 411000 512500 519800 732200 761100 55-59 322300 329600 430200 434600 552100 573900 60-64 229000 245400 332400 353900 416400 456400 65-69 149300 163900 244400 263200 321100 357400 70 -r 1777(0 245100 280900 354000 400100 552900
Total 13529700 13446oOO 18315100 18159S00 23206100 23053400
Sources FRr 1960 United Nations (1966) For 1970 Arnold and Phananirdmai (1975 table 11) for ages 0-4 and 5-9 Fulton (1979 tables 1718) for ages 10- For 19$0 Pejaranonda Arnold and i iauser (1983 table 11)
31
Table B2 Preliminary correction factors Thailand censuses of 1960 1970 and 1980
1960 1970 1980 Age group Males Females Males Females Males Females
0-4 1175 1163 1123 1101 1109 1110 5-9 1000 1000 1016 1014 1077 1080
10-14 1000 1000 10 l 1020 1032 1027 15-19 1000 1000 1038 1017 991 954 20-24 1000 1000 1115 1085 1020 993 25-29 1000 1000 1119 1041 1071 1029 30-34 1000 1000 11)9- 1070 1086 1041 35-39 1000 1000 1112 i039 1015 991 40-44 1000 1000 1066 1071 999 1002 45-49 1000 100) 1063 1063 954 963 50-54 1000 1000 108 1060 983 990 55-59 1000 1000 111Oh 1080 1015 1011 60-64 1000 1000 1104 I 090 1012 1031 65-69 1000 1)0 I 146 1100 1082 1072 70 + 1000 1000 1 11) 1101 979 1000
Totals 1020 1026 1070 1051 1039 1025
Note lhe preliminary correction factors for censuses arecalculated Lwsex and age group bydividing the corrected pOp lations of Tble 1t1by the corresponding reported populashytions given in TlbIes I anod 2
Table B3 Coale-Demenv model North life tables for determining preliminary correction factors for registereddeaths for males Thailand 1960-65 1965-70 1970-75 and 1975-80
1960-65 1965-70 1970-75 1975-SO Age l JI1 1 J1 11 L Ix sL
0 100000 451433 100)00 453753 100000 456072 100000 458392 5 87541 43292b 88170 436320 88799 439715 89428 443109
10 85630 42476 86358 429240 87087 433005 S7815 436769 15 8456t1 419212 8-338 423207 86115 427201 86892 431197 20 83124 410557 83-)45 414811 84766 419065 85587 423319 25 sI099 40 354 S1979 404908 82860 409461 83740 414015 30 7 I043 389843 7984 394698 80925 399553 81866 404408 35 7t5 378588 7789t 383754 78897 388921 79898 394087 40 74541I 3 ST 756017 371291 7662 376793 77738 382295 45 71774 350638 72 L10 356490 74045 362341 75181 368193
950 440 331681 0686 337847 70891 344013 72097 350179
S410 37 8(15 65453 314239 66714 320672 67975 327106 60 58L31 277 1 0243 283736 h1 - 29034 62867 296958 65 51919) 3t)(S 53251 243480 54583 250051 55915 256623 70 42844 412342 44141 429776 45438 447210 46735 464644
Note Model North mal_ life table hvIrare h825 17 175 17i25 nd 7875 for 19o0-o5 15-70 1970-75 and 1975-80 respectively SPC malelife tables for 1964-67 and b174 -7 linearlk interpolated were used to determine preliminary correction factors for rniqtered deaths for the age group 711 htr each fixe-year Mtercensal period
Source Coale and Demenv I
Table B4 Coale-Demeny model North life tables for determining preliminary correction factors for registereddeaths for females Thailand 1960-65 1965-70 1970-75 and 1975-80
190-65 1965-70 1971)-75 1975-80 Agex 1 L I L I Lv 1L x
0 100000 459370 101000 462864 100001 466359 100000 4709355 89462 443 154 910425 448401 91 388 453648 92645 460502
10 87800 436542 88936 442444 90072 448346 91556 45606015 86817 431191 88042 437535 89267 443879 9086c 45217920 85660 424759 86973 431559 88286 438360 90010-1 44726825 84244 -t17186 85652 424489 87059 431792 88904 44137230 82630 408648 84144 416517 85658 424386 87645 43472635 80829 399064 82463 407560 84097 416057 86245 42724140 78797 388007 80562 397135 82327 406262 84651 418301
7640o 375313 78292 385051 80179 394 75c 82669 40759350 73732 359 85 75729 370217 77726 380449 80368 394013
7023 340249 72359 351013 74455 361776 77237 37609160 65837 313593 68047 324895 70 256 336198 731Q9 35129065 59600 276099 61912 287767 64223 299435 67317 31509870 50839 526812 53195 562554 598297 58722 64733435551
Note Model North female life table levels are 170 176 182 and 101 for 1960-65 1965-70 1970-75 and 1975-80 respectively SPC female lifetables for 1964-67 and 1974-76 linearly interpolated were ued to determine the preliminary correction factors for registered deathsfor the age group 70- for each five-year intercensal period
Source Same as Table B3
Table B5 Preliminary correction factors for registered births and deaths Thailand 1960-65 1965-70 1970-75 and 1975-80
Births deaths 1960-65 1965-70 1970-75 1975-80
and age group Males Females Males Females Males Females Males Females
Births 1234 130(0 1220 1250 1199 1211 1179 1174
Deaths
0-4 1799) 1808 2194 2045 2534 2325 3088 2624 5-9 1604 1543 1724 1537 2001 1637 2177 1596
10-14 1460 1609 1522 1612 1587 1556 1751 1578 15-19 1682 1594 1601 1568 1503 1478 i424 1393 20-24 174(1 1187 1795 1388 1685 1549 1455 1582
25-29 1773 1286 1667 1318 1602 1645 1503 1827 30-34 1485 1191 1449 1252 1396 1313 1385 1603 35-39 1304 1117 1209 1158 1228 1250 1128 1301
40-44 1162 1095 1175 1180 1108 1224 1045 1234
45-49 50-54
991 1042
1116 1183
1064 1012
1112 1124
1102 1093
1206 1173
982 1085
1128 1228
55-59 1044 1260 1041 1213 1040 1178 1079 1200 60-64 1113 1364 11055 1235 1092 1264 1019 1203 65-69 1287 1596 1251 1480 1219 1459 1211 1445 70- 145 t) 1671 1485 1562 1417 1456 1352 1-514
Note Preliminary correction tactor- for registered births and deaths are determined as described in Appendix A
35
APPENDIX C FORMULAS FOR DERIVING THE LIFE TABLES
The following formulas were used to calculate the intercensal abridged life table fo five-year age groups for the five-year period beginning 1 April of the year 1960 + 5(i-i) (i = 1234)
L0 = (Pi+ IB)(51j)
= La(Pi a+IP11)
7= (L7 ( Pi+ 17+)(P170 - Pi+ 175+)
where La life table person-years lived between ages a and a + 5 T = person-years lived after age 75 Pi = corrected age a to a + 5 population on April of the year 1960 + 5(i-1) i = 12345 (see Tables 1 2 and 11)B = corrected births in the five-year period and 1 = life table survivors at exact age a Fhe second of these three formulas was applied iteratively
All three formulas result from equating the survival ratios of the life table to those of the corrected data In particular the third is obtained by solving for 7 in
T7 5( 5L71 + T71) = Pi+175 4Pi70+
which equates the survival ratio of the life table with that of the corrected data for the open-ended age group
Then
la+ = (5La5)( I - Dl2 a)
where D denotes the corrected number of deaths during the five-year period occurring before exact age a + 5 to those aged a to a + 5 at the beshyginning of the period
37
REFERENCES Arnold Fred and Mathana Phananiramai
1975 Revised Estimates of the 1970 Population of Thailand Research Paper No 1 Bangkok National Statistical Office
Chamratrithirong Apichat Nibhon Debavalya and John Knodel 1978 Age Reporti in ThailandAge at Last Birthday Versus Age at Next Birthshy
day Paper No 25 Institute of Population Studies BangkokChulalongkorn University
Coale Ansley Jand Paul Demeny 1966 Retional Model Life 7Illhs and Stable Popuhtions Princeton Princeton
University Press
Demeny Paul and Frederick C Shorter 1968 Estimating Turkish Mortality Fertility and Age Structure Publication
No 218 Faculty of Economics University of Istanbul Istanbul Istanshybu1l University Press
Fulton John Peter
1975 Evaluation of Selected Aspects of the 1970 Census of Thailand Paper 29 Institute of Population Studies Bangkok Chulalongkorn University
Hill Kenneth
1979 Estimating fertility in Thailand from information on children ever born In The Surve of Population Change 1974-76 Special Report on Fertility Nuptialityand lnfint Mortality Measures pp 1-48 Bangkok National Statistical Office
Luther Norman Y
1983 Measuring changes in census coverage in Asia Asian and PacificCensus Forum 9(3) I-1 I 16
Luther Norman Y and Robert D Retherford 1986a Consistent correction of census and vital registration data Unpubshy
lished paper East-West Population Institute Honolulu 1986b A new method for consistent correction of census and vital registrashy
tion data Working Papers of the East-West Population Institute No 35 l-lonolulu East-West Centc
Panei on TILailand 1980 Fertility and Nhortality Changes in Thailand 1950-75 Committee on
Population and Demography National Academy of Sciences Washington DC National Academy Press
38 Consistent Correction of Thai Datt
Pejaranonda Chintana Fred Arnod and Minja Choe
1985 1980 Population aw Housing Census Provincial Level Fertiliiy Estimates for Thailand 1965-1979 An Application of the Own-Children Method Subject Report No 4 Bangkok National Statistical Office
Pejaranonda Chinana Fred Arnold and Philip M Hauser
1983 Revised Estimates of the 1980 Population of Thailand Bangkok National Statistical Office
Preston Samuel
1983 An integrated system for demographic estimation from two age disshytributions Demography 20(2)213-26
Preston SamLel and Kenneth Hill
1980 Estimating the completeness of death registration Population Studies 34(2)349-66
Rungpitarangsi Benjawan
1974 Mortality Trends in Thailand Estimates for the Period 1937-1970 Paper No 10 Institute of Population Studies Bangkok Chulalongkorn University
Thailand Central Statistical Office
1962 Thailand Population Census 1960 Whole Kingdom Bangkok
Thailand Ministry of Public Health Division of Vital Statistics
1962-83 Public Health Statistics Bangkok
Thailand National Economic and Social Development Board Institute of Populashy
tion Studies Chulalongkorn University and National Statistical Office
1973 Population Projections tur Thailand 1960-2000 Bangkok National Statistical Office
Thailand National Statistical Office
1969 Report The Survey of Population Change 1964-67 Bangkok
1973 1970 Population and Housing Census Whole Kingdom Bangkok
1978 Report The Survey of Population Change 1974-76 Bangkok
1981 Advance Report 1980 Population ail Ilousing Census Bangkok
1982 Statistical landbook of Thailand Bangkok
1980 Population and I-husin Census Whole Kingdon Bangkok
no date Statistical Yearbook Thailand No 30 1972-73 Bangkok
no date Statistical Yearbook Thailand No 32 197680 Bangkok
1983
39 References
United Nations 1966 An evaluation of the demographic statistics of Thailand
Mimeographed Bangkok Economic and Social Commission for Asia and the Pacific (ESCAP) Population Division
1976 Population of Thailand ESCAP Country Monograph Series No 3 Bangkok ESCAP
US Bureau of the Census 1978 Countn DernographicProfiles Thailand Washington DC US Govshy
ernment Printing Office
RECENT AVAILABLE PAPERS OF THE EAST-WEST POPULATION INSTITUTE
No
81 Circulation and interpersonal networks linking rual and urban areas the case of Roi-et Northeastern ThailaNd by Paul Lightfout Theodore Fuller and Peerasit Kaniuansilpa March 1983 vi - 4l pp
85 Development perspectives and population change by Ozzie G Simmons April 1983 vi - 11 pp
86 The effects of induced abortion on subsequent reproductive function and pregnancyoutcome Hawai by Chin Sik Chung and Patricia G Steinhoff in collaboration with Roy G Smith and Ming-Pi Mi June 1983 xii + 1411pp
60 F Influences o i childbearing intentions across the fertility career demographic and soshycioeconomic factors and the value of children by Rodolfo A Bulatao and James T Fawcett Jine 1983 x + 152 pp
87 Population mobility and wealth transfers in Indonesia and other Third World socieshyties by Graerne J Hugo July 1983 vi + 50 pp
88 Structural change and prospects for urbanization in Asian countries by Gavin W Jones August 1983 vi -+ 46 pp
89 ufrban grovth and local taxes in less developed countries by Roy Bahl Daniel Holland and Johannes Linn September 198 vi s 33 pp
910 A false fertility transition the case of American blacks by Paul Wright and Peter Pirie lFbruary 1981 viii + 81 pp
61-U The old-age economic security value of children in the Philippines and Taiwan bySusan l)e Vs March 1984 viii + 72 pp
91 A profih of Hawaiis elderly population by Eleanor C Nordyke Richard KC Lee and Robert W Gardner August 1984 viii + 39 pp
92 City characteristics migration and urban development policies in India by Mahendra K Premi with Judith Ann L 16in June 1985 viii + 127 pp
93 Urbanization in China new insights from the 1982 Census by Sidney Goldstein July 1985 vi + 73 pp
91 Comparison of fertility trends estimated alternatively from birth histories and own children by Robert D Rethecford and lqbal Alam July 1985 viii - 39 pp
95 Population mobility in tlhe Peoples Republic of China by Sidney Goldstein and Alice Goldstein October 1985 vi + 46 pp
96 Factors in tie achievement of below-replacement ferAty in Chiang Mai Thailand by T ng Pardthaisong March 1986 viii - 16 pp
97 Th Population of Burma An analysis of the 1973 Census by M Ismael Khin MaungArril 1916 viii + 32 pp
S kPopulation aging in Australia Implications for social and economic policy by Graeme Itugo April 1086 viii + 47 pp
i9 Marriage and fertility in Tianjin China Fifty years of transition by Burton Pastershynak July 1986 viii + 76 pp
100 Migration in Thailand A twenty-five-year review by Sidney Goldstein and Alice Goldshysteil July 1986 viii - 54 pp
101 Recent fertility trends in the Pacific Islands by Michael JLevin and Robert D Rethershyford August 1986 viii + 72 pp
102 Malnourished children An economic approach to the causes and consequences in rural Thailand by Sirilaksana Chutikul December 1986 viii - 64 pp
THE EAST-WEST CENTER is a public nonprofit educational institution with an international board of governors Snme 2000 research fellows graduate students and professionals in buImess and government each year work with the Centers international staff in cooperative study training and research They examine major issues related to population resources and development the environment culture and communication in Asia the Pacific and the United States The Center was established in 1960 by the United States Congress which provides principal funding Support also comes from more than 20 Asian and Pacific governments as well as prishyvate agencies and corporations
Situated on 21 acres adjaccnt to the University of Hawaiis Manoa Camshypus the Centers facilities include a 300-room office building housing research and administrative offices for an international staff of 250 three residence halls for participants and a conference center with meeting rooms equipped to provide simultaneous translation and a complete range of audiovisual services
THE 12AST-WEST POPULATION INSTITUTE established as a unit of the East-West Center in 1969 carries out multidisciplinary research training and related activities in the field of population placing emphasis on economic social psychological and environmental aspects of population problems in Asia the Pacific and the United States
ISBN 0-86638-089-2 $300
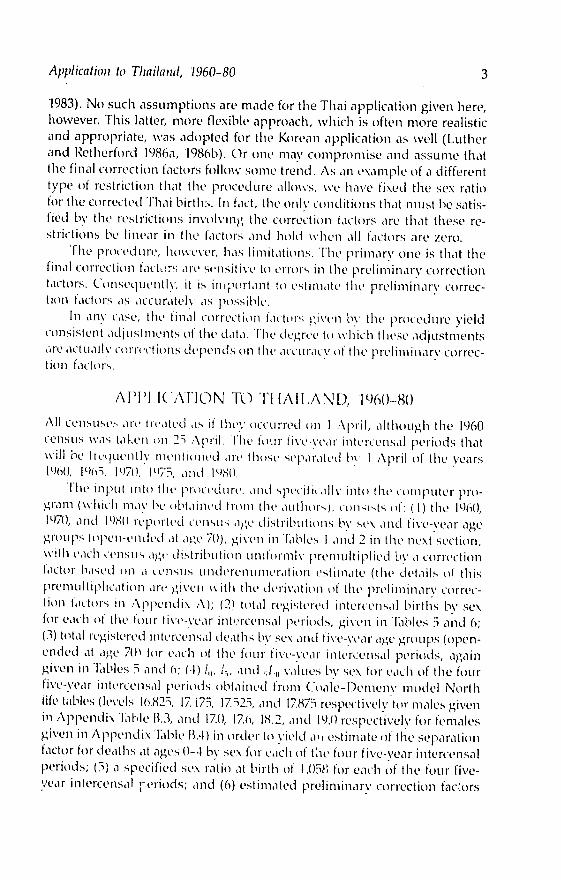
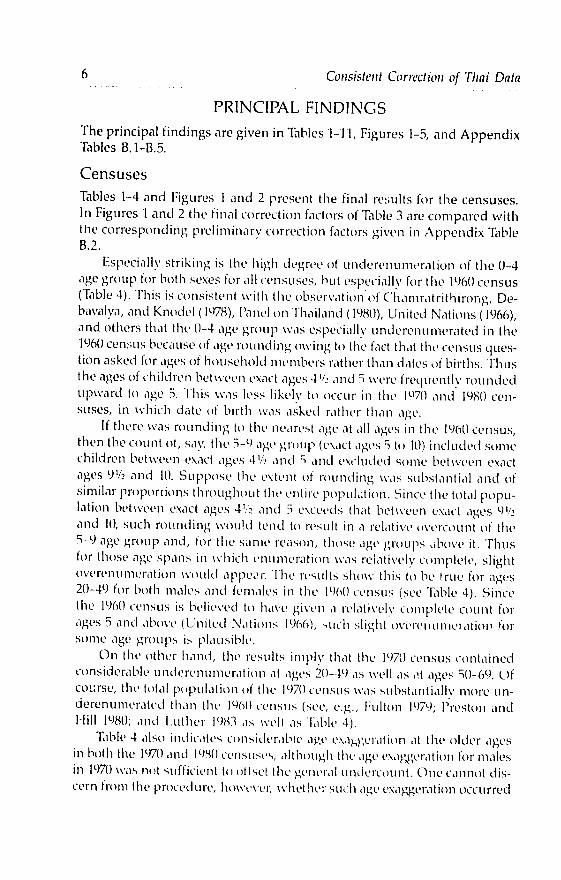
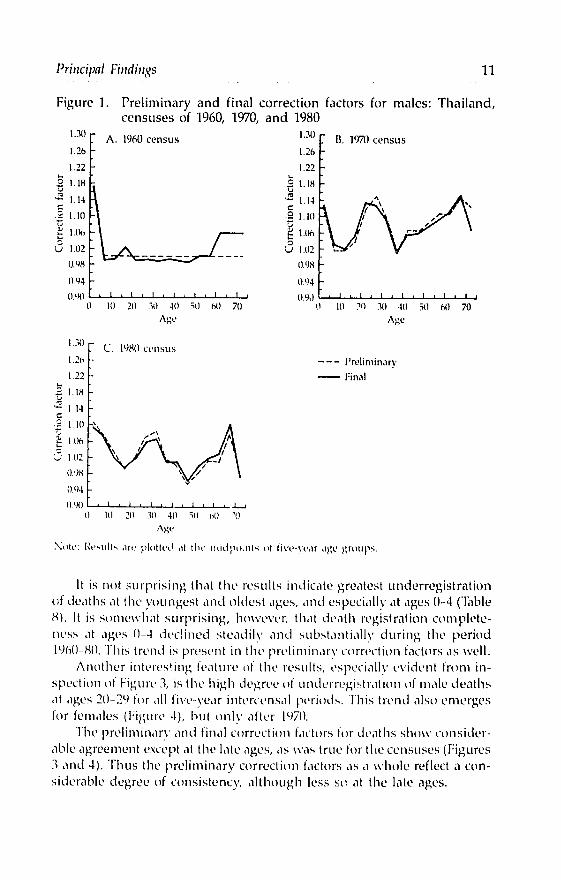
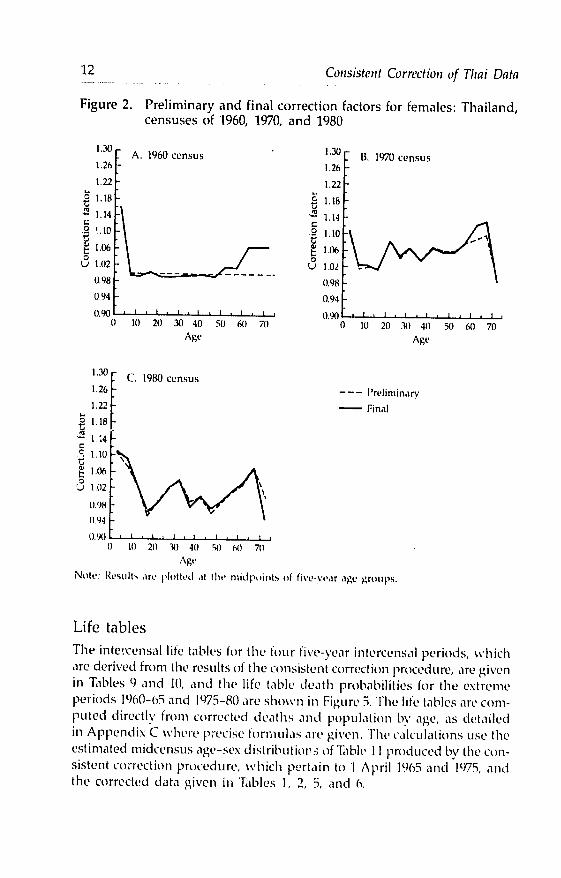
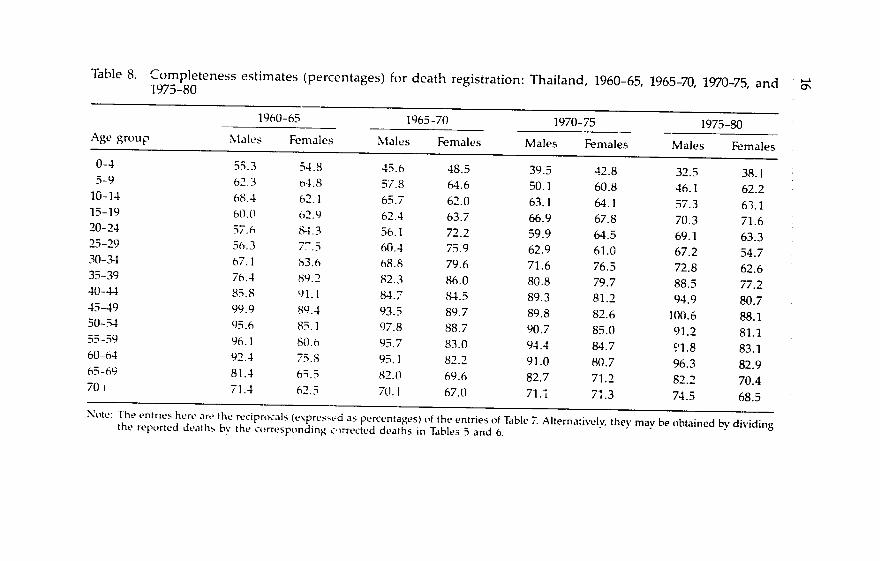
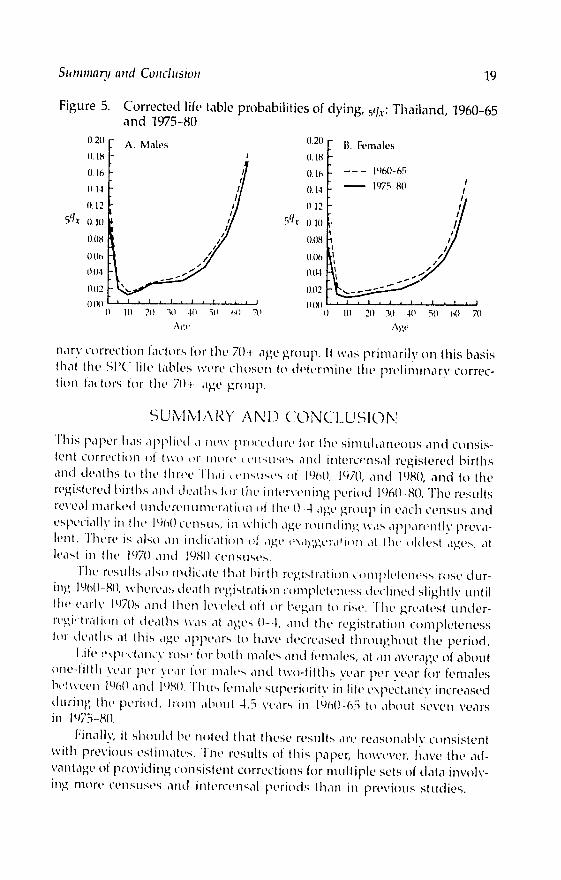
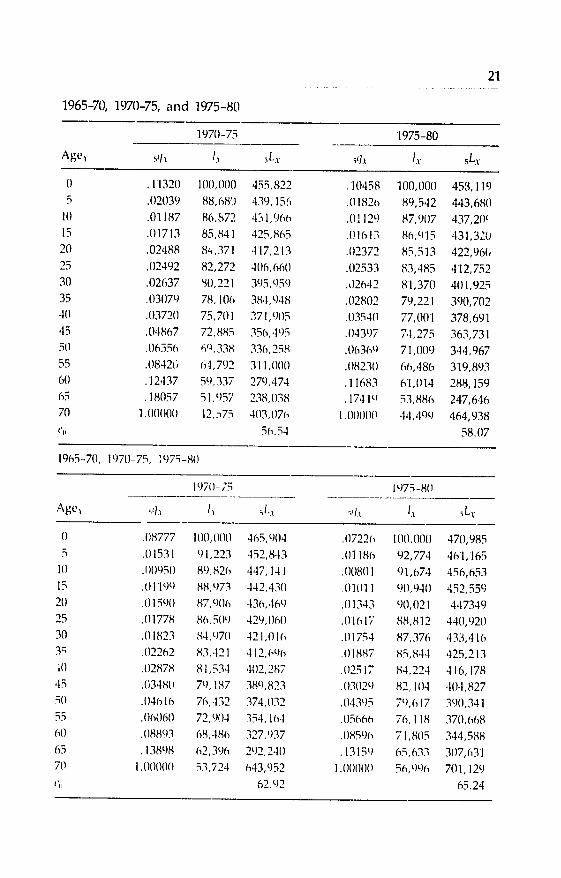
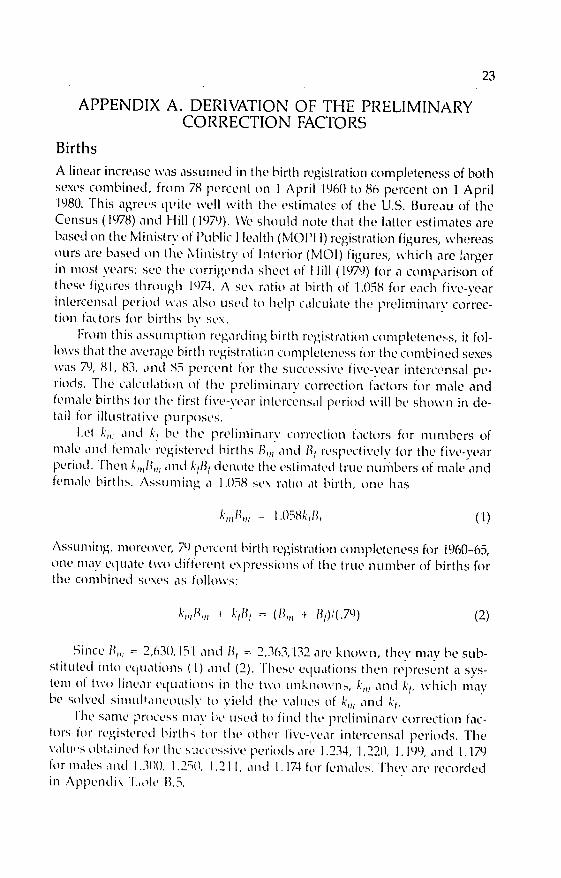
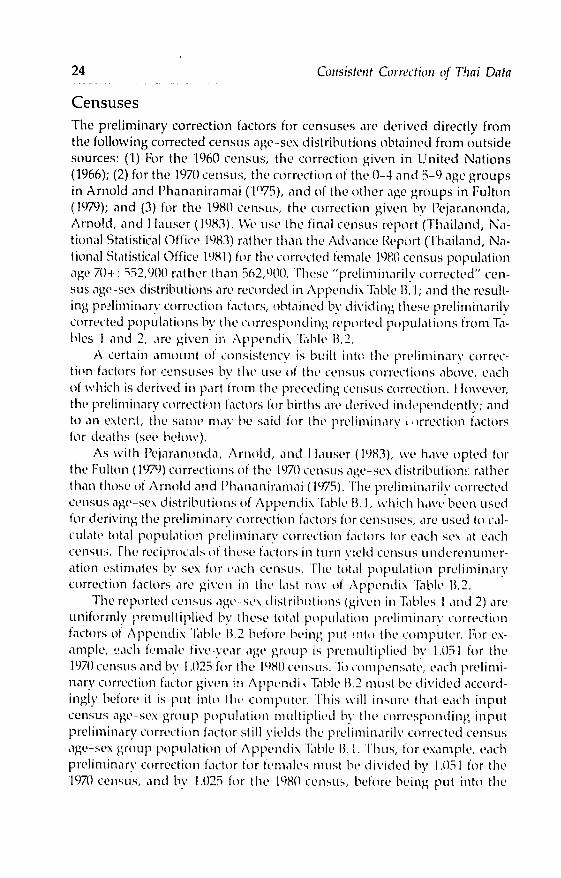
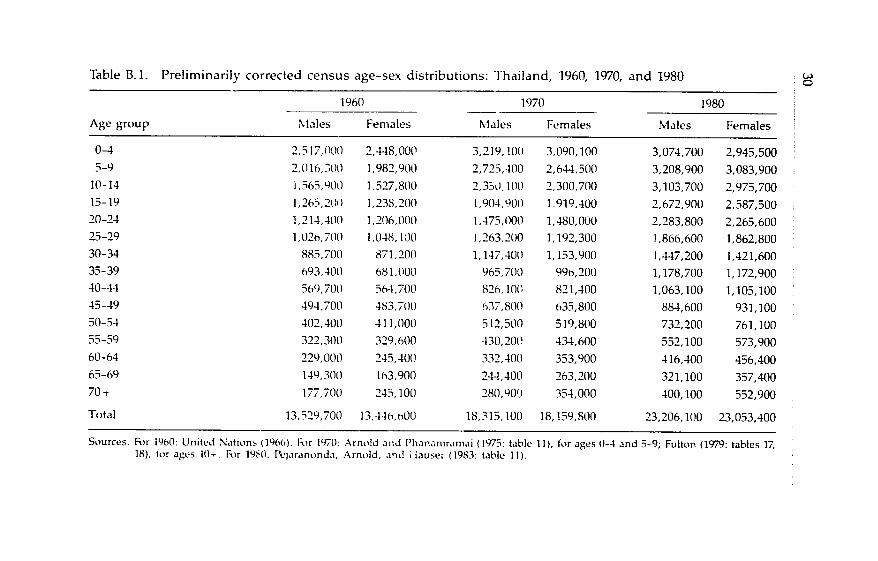
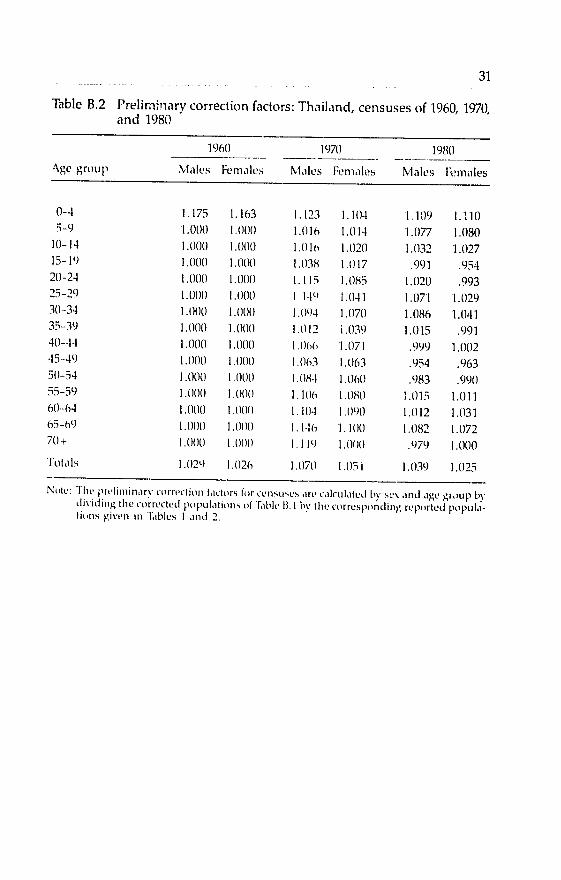
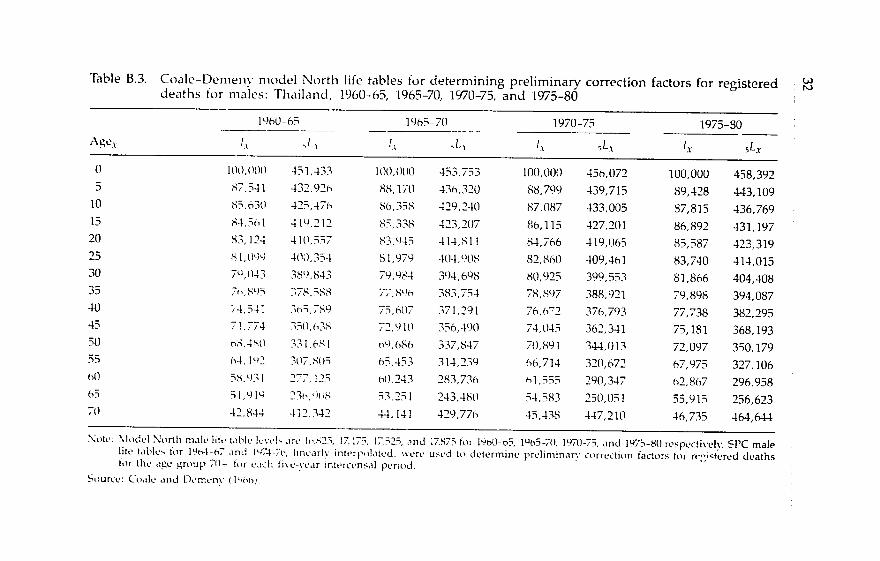
Related Documents