Technical Report Documentation Page 1. Report No. FHWA/TX-07/0-4519-2 2. Government Accession No. 3. Recipient's Catalog No. 4. Title and Subtitle CONSIDERATION OF REGIONAL VARIATIONS IN CLIMATIC AND SOIL CONDITIONS IN THE MODIFIED TRIAXIAL DESIGN METHOD 5. Report Date March 2007 Published: November 2008 6. Performing Organization Code 7. Author(s) Emmanuel G. Fernando, Jeongho Oh, Duchwan Ryu, and Soheil Nazarian 8. Performing Organization Report No. Report 0-4519-2 9. Performing Organization Name and Address Texas Transportation Institute The Texas A&M University System College Station, Texas 77843-3135 10. Work Unit No. (TRAIS) 11. Contract or Grant No. Project 0-4519 12. Sponsoring Agency Name and Address Texas Department of Transportation Research and Technology Implementation Office P. O. Box 5080 Austin, Texas 78763-5080 13. Type of Report and Period Covered Technical Report: Sept. 2002 – Dec. 2005 14. Sponsoring Agency Code 15. Supplementary Notes Project performed in cooperation with the Texas Department of Transportation and the Federal Highway Administration. Project Title: Verification of the Modified Triaxial Design Procedure URL: http://tti.tamu.edu/documents/0-4519-2.pdf 16. Abstract The Texas Department of Transportation (TxDOT) uses the modified triaxial design procedure to check pavement designs from the flexible pavement system program. Since its original development more than 50 years ago, little modification has been made to the original triaxial design method. There is a need to verify the existing load-thickness design chart to assess its applicability for the range in pavement materials used by the districts and the range in service conditions encountered in practice. Additionally, there is a conservatism in the current method, which assumes the worst condition in characterizing the strength properties of the subgrade. While this approach may apply to certain areas of the state such as east Texas, it can lead to unduly conservative assessments of pavement load bearing capacity in districts where the climate is drier, or where the soils are not as moisture susceptible. Clearly, there is a need to consider regional differences to come up with a more realistic assessment of pavement thickness requirements for the given local conditions. To address this need, researchers characterized the variation of climatic and soil conditions across Texas to develop a procedure that accounts for moisture effects and differences in moisture susceptibilities among different soils. Researchers incorporated this procedure in a computer program for triaxial design analysis that offers greater versatility in modeling pavement systems compared to the limited range of approximate layered elastic solutions represented in the existing modified triaxial design curves. This program permits engineers to correct soil strength parameters to values considered representative of expected in-service conditions when such corrections are deemed appropriate for the given local climatic and soil conditions. 17. Key Words Pavement Design, Modified Triaxial Design Method, Environmental Effects, Texas Climatic-Soil Regions, Integrated Climatic Effects Model, Mohr- Coulomb Failure Criterion, Plate Bearing Test, Load Bearing Capacity, Small-Scale Pavement Models 18. Distribution Statement No restrictions. This document is available to the public through NTIS: National Technical Information Service Springfield, VA 22161 http://www.ntis.gov 19. Security Classif.(of this report) Unclassified 20. Security Classif.(of this page) Unclassified 21. No. of Pages 100 22. Price Form DOT F 1700.7 (8-72) Reproduction of completed page authorized

Welcome message from author
This document is posted to help you gain knowledge. Please leave a comment to let me know what you think about it! Share it to your friends and learn new things together.
Transcript

Technical Report Documentation Page 1. Report No. FHWA/TX-07/0-4519-2
2. Government Accession No. 3. Recipient's Catalog No.
4. Title and SubtitleCONSIDERATION OF REGIONAL VARIATIONS IN CLIMATICAND SOIL CONDITIONS IN THE MODIFIED TRIAXIAL DESIGNMETHOD
5. Report DateMarch 2007Published: November 20086. Performing Organization Code
7. Author(s)Emmanuel G. Fernando, Jeongho Oh, Duchwan Ryu, and Soheil Nazarian
8. Performing Organization Report No. Report 0-4519-2
9. Performing Organization Name and Address Texas Transportation Institute The Texas A&M University System College Station, Texas 77843-3135
10. Work Unit No. (TRAIS)
11. Contract or Grant No.Project 0-4519
12. Sponsoring Agency Name and AddressTexas Department of TransportationResearch and Technology Implementation OfficeP. O. Box 5080Austin, Texas 78763-5080
13. Type of Report and Period CoveredTechnical Report:Sept. 2002 – Dec. 200514. Sponsoring Agency Code
15. Supplementary NotesProject performed in cooperation with the Texas Department of Transportation and the Federal HighwayAdministration.Project Title: Verification of the Modified Triaxial Design ProcedureURL: http://tti.tamu.edu/documents/0-4519-2.pdf16. AbstractThe Texas Department of Transportation (TxDOT) uses the modified triaxial design procedure to checkpavement designs from the flexible pavement system program. Since its original development more than 50 years ago, little modification has been made to the original triaxial design method. There is a need toverify the existing load-thickness design chart to assess its applicability for the range in pavement materialsused by the districts and the range in service conditions encountered in practice. Additionally, there is aconservatism in the current method, which assumes the worst condition in characterizing the strengthproperties of the subgrade. While this approach may apply to certain areas of the state such as east Texas, itcan lead to unduly conservative assessments of pavement load bearing capacity in districts where the climateis drier, or where the soils are not as moisture susceptible. Clearly, there is a need to consider regionaldifferences to come up with a more realistic assessment of pavement thickness requirements for the givenlocal conditions. To address this need, researchers characterized the variation of climatic and soil conditionsacross Texas to develop a procedure that accounts for moisture effects and differences in moisturesusceptibilities among different soils. Researchers incorporated this procedure in a computer program fortriaxial design analysis that offers greater versatility in modeling pavement systems compared to the limitedrange of approximate layered elastic solutions represented in the existing modified triaxial design curves. This program permits engineers to correct soil strength parameters to values considered representative ofexpected in-service conditions when such corrections are deemed appropriate for the given local climatic andsoil conditions.17. Key WordsPavement Design, Modified Triaxial DesignMethod, Environmental Effects, Texas Climatic-SoilRegions, Integrated Climatic Effects Model, Mohr-Coulomb Failure Criterion, Plate Bearing Test, LoadBearing Capacity, Small-Scale Pavement Models
18. Distribution StatementNo restrictions. This document is available to thepublic through NTIS:National Technical Information ServiceSpringfield, VA 22161http://www.ntis.gov
19. Security Classif.(of this report)Unclassified
20. Security Classif.(of this page)Unclassified
21. No. of Pages 100
22. Price
Form DOT F 1700.7 (8-72) Reproduction of completed page authorized


CONSIDERATION OF REGIONAL VARIATIONS IN CLIMATIC ANDSOIL CONDITIONS IN THE MODIFIED TRIAXIAL
DESIGN METHOD
by
Emmanuel G. Fernando Research Engineer
Texas Transportation Institute
Jeongho OhAssociate Transportation Researcher
Texas Transportation Institute
Duchwan RyuFormer Graduate Research Assistant
Texas Transportation Institute
and
Soheil NazarianProfessor of Civil Engineering
The University of Texas at El Paso
Report 0-4519-2Project 0-4519
Project Title: Verification of the Modified Triaxial Design Procedure
Performed in cooperation with theTexas Department of Transportation
and theFederal Highway Administration
March 2007Published: November 2008
TEXAS TRANSPORTATION INSTITUTEThe Texas A&M University SystemCollege Station, Texas 77843-3135


v
DISCLAIMER
The contents of this report reflect the views of the authors, who are responsible for the
facts and the accuracy of the data presented. The contents do not necessarily reflect the
official views or policies of the Texas Department of Transportation or the Federal Highway
Administration (FHWA). This report does not constitute a standard, specification, or
regulation, nor is it intended for construction, bidding, or permit purposes. The United States
Government and the State of Texas do not endorse products or manufacturers. Trade or
manufacturers’ names appear herein solely because they are considered essential to the
object of this report. The engineer in charge of the project was Dr. Emmanuel G. Fernando,
P.E. # 69614.

vi
ACKNOWLEDGMENTS
The work reported herein was conducted as part of a research project sponsored by the
Texas Department of Transportation and the Federal Highway Administration. The authors
gratefully acknowledge the support and guidance of the project director, Mr. Mark
McDaniel, of the Materials and Pavements Section of TxDOT. Mr. McDaniel provided a
compilation of Texas triaxial classifications for soils found across the state that researchers
incorporated into the soils database of the LoadGage program developed from this project.
In addition, the authors give thanks to members of the Project Monitoring Committee for
their support of this project. In particular, Ms. Darlene Goehl and Mr. Billy Pigg provided
assistance in identifying and testing materials used in field sections to verify TxDOT’s
modified triaxial design method. Mr. Miguel Arellano of the Austin District also compiled
information on the statewide use of various base materials that was helpful in developing the
field test plan for this project. In addition, Mr. Joe Leidy provided information on typical
pavement designs researchers used in evaluating expected soil moisture conditions across the
state. The authors also acknowledge the significant contributions of their colleagues:
! Ms. Cindy Estakhri developed the construction plans for the full-scale pavement
sections used in verifying the existing triaxial design method and was responsible for
getting the sections built according to plans.
! Mr. Gerry Harrison and Mr. Lee Gustavus provided technical expertise in setting up
and conducting the plate bearing tests on full-scale field sections. In addition,
Mr. Gustavus assisted in monitoring the construction of test sections and conducting
construction quality control and quality assurance tests.
! Ms. Stacy Hilbrich characterized the soil-water characteristic curves of the base and
subgrade materials used in constructing the test sections in this project.
! Dr. Wenting Liu wrote the data acquisition program for the plate bearing test and
assisted in collecting the data from these tests.
Finally, the authors extend a special note of thanks to Dr. Robert Lytton for providing expert
advice in the characterization of regional moisture conditions across Texas, particularly in
the application of the integrated climatic effects model he developed in a project sponsored
by the FHWA.

vii
TABLE OF CONTENTS
Page
LIST OF FIGURES . . . . . . . . . . . . . . . . . . . . . . . . . . . . . . . . . . . . . . . . . . . . . . . . . . . . . . . . ix
LIST OF TABLES . . . . . . . . . . . . . . . . . . . . . . . . . . . . . . . . . . . . . . . . . . . . . . . . . . . . . . . . . xi
CHAPTER
I INTRODUCTION . . . . . . . . . . . . . . . . . . . . . . . . . . . . . . . . . . . . . . . . . . . . . . . . . . . 1
Research Objectives . . . . . . . . . . . . . . . . . . . . . . . . . . . . . . . . . . . . . . . . . . . . . . . . 2Background . . . . . . . . . . . . . . . . . . . . . . . . . . . . . . . . . . . . . . . . . . . . . . . . . . . . . . . 3Scope of Research Report . . . . . . . . . . . . . . . . . . . . . . . . . . . . . . . . . . . . . . . . . . . . 5
II CHARACTERIZATION OF CLIMATIC AND SOILVARIATIONS IN TEXAS . . . . . . . . . . . . . . . . . . . . . . . . . . . . . . . . . . . . . . . . . . . . . 7
Introduction . . . . . . . . . . . . . . . . . . . . . . . . . . . . . . . . . . . . . . . . . . . . . . . . . . . . . . 7Climatic Regions . . . . . . . . . . . . . . . . . . . . . . . . . . . . . . . . . . . . . . . . . . . . . . . . . . 8Soil Regions . . . . . . . . . . . . . . . . . . . . . . . . . . . . . . . . . . . . . . . . . . . . . . . . . . . . . 12
III ASSESSING THE IMPACT OF MOISTURE VARIATION ONLOAD BEARING CAPACITY OF PAVEMENTS . . . . . . . . . . . . . . . . . . . . . . . . . 21
Moisture Correction of Strength Parameters . . . . . . . . . . . . . . . . . . . . . . . . . . . . 21Evaluation of Load Bearing Capacity Based on FieldPlate Bearing Test Data . . . . . . . . . . . . . . . . . . . . . . . . . . . . . . . . . . . . . . . . . . . . 25
Case I Analysis . . . . . . . . . . . . . . . . . . . . . . . . . . . . . . . . . . . . . . . . . . . . . . . . . 25Case II Analysis . . . . . . . . . . . . . . . . . . . . . . . . . . . . . . . . . . . . . . . . . . . . . . . . 32Case III Analysis . . . . . . . . . . . . . . . . . . . . . . . . . . . . . . . . . . . . . . . . . . . . . . . 34Comparison of Load Bearing Capacity Estimates . . . . . . . . . . . . . . . . . . . . . . 37
Evaluation of Load Bearing Capacity Based on UTEP Data fromTests on Small-Scale Pavement Models . . . . . . . . . . . . . . . . . . . . . . . . . . . . . . . . 45
IV EVALUATION OF EXPECTED IN-SERVICE SOILMOISTURE CONTENTS . . . . . . . . . . . . . . . . . . . . . . . . . . . . . . . . . . . . . . . . . . . . 51
Introduction . . . . . . . . . . . . . . . . . . . . . . . . . . . . . . . . . . . . . . . . . . . . . . . . . . . . . 51Compilation of Data for Soil Moisture Prediction . . . . . . . . . . . . . . . . . . . . . . . . 51Verification of the EICM Program . . . . . . . . . . . . . . . . . . . . . . . . . . . . . . . . . . . . 54Prediction of Expected Soil Moisture Contents . . . . . . . . . . . . . . . . . . . . . . . . . . 56
V SUMMARY OF FINDINGS AND RECOMMENDATIONS . . . . . . . . . . . . . . . . . 61

viii
Page
REFERENCES . . . . . . . . . . . . . . . . . . . . . . . . . . . . . . . . . . . . . . . . . . . . . . . . . . . . . . . . . . . 67
APPENDIX
A DATA FOR CHARACTERIZING CLIMATIC AND SOILVARIATIONS ACROSS TEXAS . . . . . . . . . . . . . . . . . . . . . . . . . . . . . . . . . . . . . . 69

ix
LIST OF FIGURES
Figure Page
2.1 Diagram Illustrating the Cluster Analysis . . . . . . . . . . . . . . . . . . . . . . . . . . . . . . . . 10
2.2 Scree Plot to Determine the Number of Climatic Regions . . . . . . . . . . . . . . . . . . . . 11
2.3 Subdivision of Texas into Seven Climatic Regions (counties on map areidentified by corresponding county numbers) . . . . . . . . . . . . . . . . . . . . . . . . . . . . . 12
2.4 Predominant Soils Identified from County Soil Survey Reports(white areas show counties with missing information) . . . . . . . . . . . . . . . . . . . . . . 13
2.5 Scree Plot to Determine the Number of Soil Regions . . . . . . . . . . . . . . . . . . . . . . . 15
2.6 Subdivision of Texas into Nine Soil Regions . . . . . . . . . . . . . . . . . . . . . . . . . . . . . . 17
2.7 Texas Climatic-Soil Regions . . . . . . . . . . . . . . . . . . . . . . . . . . . . . . . . . . . . . . . . . . 18
3.1 TxDOT Test Method Tex-117E Flexible Base Design Chart . . . . . . . . . . . . . . . . . 28
3.2 Tex-117E Thickness Reduction Chart for Stabilized Layers . . . . . . . . . . . . . . . . . . 30
3.3 Results from Soil Suction Tests on Clay Subgrade . . . . . . . . . . . . . . . . . . . . . . . . . 34
3.4 Results from Soil Suction Tests on Sandy Subgrade . . . . . . . . . . . . . . . . . . . . . . . . 35
3.5 LoadGage Run-Time Screen Illustrating Effect of MoistureChange on Soil Suction . . . . . . . . . . . . . . . . . . . . . . . . . . . . . . . . . . . . . . . . . . . . . . . 36
3.6 Differences between Case I, Case II, and Case III Load Bearing CapacityEstimates and 50-mil Reference Loads on Clay Subgrade Sections . . . . . . . . . . . . 39
3.7 Differences between Case I, Case II, and Case III Load Bearing CapacityEstimates and 50-mil Reference Loads on Sandy Subgrade Sections . . . . . . . . . . . 40
3.8 Differences between Case I, Case II, and Case III Load Bearing CapacityEstimates and 50-mil Reference Loads on Stabilized Sections . . . . . . . . . . . . . . . . 40
3.9 Variation of Load Bearing Capacity with Moisture Condition fromSmall-Scale Tests of Models with Base Materials on Clay . . . . . . . . . . . . . . . . . . . 47
3.10 Variation of Load Bearing Capacity with Moisture Condition fromSmall-Scale Tests of Models with Base Materials on Sandy Subgrade . . . . . . . . . . 47

x
Figure Page
3.11 Comparison of Load Bearing Capacity Predictions Corresponding toOptimum Moisture Conditions for Small-Scale Models Built usingClay and Sandy Subgrade Soils . . . . . . . . . . . . . . . . . . . . . . . . . . . . . . . . . . . . . . . . 50
4.1 Typical Pavement Structures for FM Roads in DifferentClimatic Regions . . . . . . . . . . . . . . . . . . . . . . . . . . . . . . . . . . . . . . . . . . . . . . . . . . . . 53
4.2 Comparison of Predicted Initial Soil Suction Profiles for Countieswith Different Climates . . . . . . . . . . . . . . . . . . . . . . . . . . . . . . . . . . . . . . . . . . . . . . . 55
4.3 Comparison of EICM Predictions with TDR Measurements fromLTPP Test Sections Located in Different Counties . . . . . . . . . . . . . . . . . . . . . . . . . 55
4.4 Comparison of EICM Predictions with TDR Measurements atDifferent Depths on Victoria Flexible Pavement Section . . . . . . . . . . . . . . . . . . . . 57
4.5 Comparison of EICM Predictions with TDR Measurements fromBase Layer of Flexible Pavement Test Section in Brownsville . . . . . . . . . . . . . . . . 57
4.6 Comparison of Predicted Subgrade Moisture Contents fromEICM with Estimates Based on Soil Plastic Limits . . . . . . . . . . . . . . . . . . . . . . . . . 58
4.7 Map Showing Variation of Expected Soil Moisture Contentsacross Texas . . . . . . . . . . . . . . . . . . . . . . . . . . . . . . . . . . . . . . . . . . . . . . . . . . . . . . . 59
A1 Variation in Daily Temperature Drops (EF) across Texas Counties(identified by corresponding county numbers on map) . . . . . . . . . . . . . . . . . . . . . . 71
A2 Variation in Mean Air Temperatures (EF) across Texas Counties(identified by corresponding county numbers on map) . . . . . . . . . . . . . . . . . . . . . . 72
A3 Variation in Mean Precipitations across Texas Counties(identified by corresponding county numbers on map) . . . . . . . . . . . . . . . . . . . . . . 73
A4 Variation in Maximum Relative Humidities across Texas Counties(identified by corresponding county numbers on map) . . . . . . . . . . . . . . . . . . . . . . 74
A5 Variation in Minimum Relative Humidities across Texas Counties(identified by corresponding county numbers on map) . . . . . . . . . . . . . . . . . . . . . . 75
A6 Variation in Thornthwaite Moisture Indices across Texas Counties(identified by corresponding county numbers on map) . . . . . . . . . . . . . . . . . . . . . . 76

xi
LIST OF TABLES
Table Page
2.1 Grouping of Texas Counties by Climatic-Soil Regions(counties identified by TxDOT county numbers) . . . . . . . . . . . . . . . . . . . . . . . . . . . 19
3.1 Flexible Base Sections Tested in Phase I of Research Project . . . . . . . . . . . . . . . . . 26
3.2 Stabilized Sections Tested in Phase II of Research Project . . . . . . . . . . . . . . . . . . . 27
3.3 Allowable Loads on Flexible Base Sections . . . . . . . . . . . . . . . . . . . . . . . . . . . . . . . 28
3.4 Cohesiometer Values for Different Materials . . . . . . . . . . . . . . . . . . . . . . . . . . . . . . 31
3.5 Allowable Loads on Stabilized Sections . . . . . . . . . . . . . . . . . . . . . . . . . . . . . . . . . 32
3.6 Layer Strength Assessment Based on FWD Deflections . . . . . . . . . . . . . . . . . . . . . 33
3.7 Load Bearing Capacity Estimates for Sections on Clay Subgrade . . . . . . . . . . . . . . 38
3.8 Load Bearing Capacity Estimates for Sections on Sandy Subgrade . . . . . . . . . . . . 38
3.9 Load Bearing Capacity Estimates for Stabilized Sections . . . . . . . . . . . . . . . . . . . . 39
3.10 Variation of Soil Suction and Strength Properties with Moisture Content . . . . . . . 42
3.11 Measured Moisture Contents of Subgrade Soils from Tests onSmall-Scale Pavement Models . . . . . . . . . . . . . . . . . . . . . . . . . . . . . . . . . . . . . . . . . 46
3.12 Measured Moisture Contents of Base Materials from Tests onSmall-Scale Pavement Models . . . . . . . . . . . . . . . . . . . . . . . . . . . . . . . . . . . . . . . . . 46
3.13 Resilient Modulus Parameters of Base and Subgrade Materials . . . . . . . . . . . . . . . 50
A1 TxDOT List of Districts and Counties . . . . . . . . . . . . . . . . . . . . . . . . . . . . . . . . . . . 77
A2 Thirty-Year Averages of Climatic Variables . . . . . . . . . . . . . . . . . . . . . . . . . . . . . . 78
A3 Estimated Volumetric Water Contents for 2 to 4.8 pF Suction Values . . . . . . . . . . 82
A4 Estimated Soil Permeabilities (cm/hr) for 2 to 4.8 pF Suction Values . . . . . . . . . . . 85


1
CHAPTER I. INTRODUCTION The Texas Department of Transportation (TxDOT) uses the Texas modified triaxial
design procedure as a design check on the Flexible Pavement System (FPS) program. The
current version of this design program, FPS-19, uses the backcalculated layer moduli from
falling weight deflectometer (FWD) measurements and the expected number of 18-kip
equivalent single axle loads (ESALs) to determine design thicknesses for the specified
pavement materials. On many Farm-to-Market (FM) roads where the expected number of
cumulative 18-kip ESALs is low, it is not uncommon to find trucks with wheel loads that
exceed the structural capacity of the pavement. These occasional overloads could give rise to
subgrade shear failure, particularly under conditions where the base or subgrade is wet. Thus,
pavement engineers check the results from FPS against the Texas modified triaxial design
procedure to ensure that the design thickness provides adequate cover to protect the subgrade
against occasional overstressing. In cases where the thickness requirement from the triaxial
method is greater than the pavement thickness determined from FPS, current practice
recommends using the pavement thickness based on the modified triaxial design method
unless the engineer can justify using the FPS results.
Since its original development more than 50 years ago, the original triaxial design
method has had little modification. There is a need to verify the existing load-thickness
curves to assess their applicability for the range in pavement materials used by the districts,
and the range in service conditions that pavements are subjected to. Additionally, there is
conservatism in the existing design method that is manifested in the way the subgrade is
characterized. Specifically, the subgrade material is moisture conditioned prior to testing to
define the Texas triaxial class. While this approach may represent climatic and soil
conditions in certain areas of the state such as east Texas, it can be notably conservative in
districts where the climate is drier, or where the soils are not as moisture susceptible. Clearly,
engineers need to consider regional differences in climatic and soil conditions in the existing
triaxial design method to come up with a more realistic assessment of pavement thickness
requirements for the given climatic and soil moisture conditions, pavement materials, and
design load.

2
RESEARCH OBJECTIVES
The primary objectives of this project are to:
• verify the load-thickness design curves in TxDOT’s Test Method Tex-117E that are
used in the current modified triaxial design method, and
• account for regional variations in climatic and soil conditions across Texas in the
pavement design check of FPS-generated flexible pavement designs.
Researchers accomplished these objectives by carrying out a comprehensive work plan that
covered the following tasks:
• a literature review of the development of the load-thickness design curves that
enabled researchers to re-create the curves based on the review findings,
• development of a plan to verify the load-thickness design curves based on testing full-
scale field sections and small-scale pavement models,
• construction of test sections and fabrication of small-scale pavement models,
• field and laboratory testing to characterize pavement materials and evaluate load
carrying capacity of test sections built to verify the thickness design curves,
• investigation of the correspondence between small-scale and full-scale pavement test
results,
• analysis of test data to verify the current load-thickness design curves,
• compilation of climatic and soils data on the different Texas counties,
• evaluation of expected moisture contents using a comprehensive model of climatic
effects originally developed by Lytton et al. (1990) in a project conducted for the
Federal Highway Administration,
• investigation of the relationships between soil moisture and soil strength properties,
and
• development of a stress-based analysis program for checking FPS-generated
pavement designs based on the Mohr-Coulomb strength criterion.
This report documents the research conducted to develop a methodology to account
for variations in climatic and soil conditions in checking the adequacy of pavement designs
from the FPS program. A companion report by Fernando, Oh, Estakhri, and Nazarian (2007)
documents the research conducted to verify the existing load-thickness design curves in the
modified Texas triaxial design method.

3
BACKGROUND
Chester McDowell, former Soils Engineer of what was then the Texas Highway
Department, spearheaded the development of the Texas triaxial design method in the mid-
1940s to the early 1960s. To verify the load-thickness design curves in this project,
researchers initially reviewed published information to establish how the existing design
method was developed and identify underlying principles and assumptions made to generate
the design charts. Fernando, Oh, Estakhri, and Nazarian (2007) present at length the findings
from this literature review in the companion report (0-4519-1) to this project. From this task,
researchers verified the method used by McDowell to develop the existing triaxial design
curves, which are based on determining the depth of cover required such that the load
induced stresses do not exceed the soil shear strength. The computation of wheel load
stresses for deriving the thickness design curves was done using layered elastic theory along
with assumptions McDowell made regarding the variation of modular ratios with depth.
Researchers demonstrated the methodology by re-creating the existing load-thickness design
curves as documented in research report 0-4519-1.
Based on the findings from the literature review, researchers established a field and
laboratory test program to verify the load-thickness design curves in the modified Texas
triaxial design method. Considering that the design curves in Tex-117E were determined
using layered elastic theory, researchers conducted plate bearing tests on full-scale field
sections. The load configuration for this test most closely approximates the assumptions
used in developing the existing design curves. A total of 30 full-scale pavement sections
were constructed within the Riverside Campus of Texas A&M University for the purpose of
conducting plate bearing tests. In addition, researchers at the University of Texas at El Paso
(UTEP) conducted laboratory plate bearing tests on small-scale pavement models fabricated
with the same base and subgrade materials used on the full-scale field sections. The analyses
of data from these tests verified the conservatism in the existing design method that TxDOT
engineers have previously recognized. In addition, observed differences in load bearing
capacities at various moisture conditions from tests done on small-scale pavement specimens
suggested the need to properly account for moisture effects and differences in moisture
susceptibilities between different soils.

4
This report follows up on the verification work documented in research report
0-4519-1. The report details the efforts to improve the existing triaxial design method in
Tex-117E. These efforts covered the following areas:
• Provide a more refined method of computing wheel load stresses for estimating
pavement load bearing capacity that offers greater versatility in modeling pavement
systems and load configurations.
• Characterize the variation of climatic and soil conditions across Texas, and develop a
procedure that accounts for moisture effects and differences in moisture
susceptibilities among different soils.
• Incorporate a procedure in the triaxial design check that gives engineers the option to
adjust soil strength parameters determined from Tex-117E tests on moisture
conditioned specimens to values representative of expected in-service moisture
conditions. The engineer can then perform the design check based on soil strength
parameters he/she considers to be more representative of in-service conditions.
From these efforts, researchers developed a revised procedure for triaxial design
analysis that is implemented in a computer program called LoadGage, which features the
following enhancements to the current modified triaxial design method:
• a stress-based analysis procedure that provides users with greater versatility in
modeling flexible pavement systems compared to the limited range of approximate
layered elastic solutions represented in the Tex-117E design curves;
• more realistic modeling of pavement wheel loads, in lieu of the current practice of
using a correction factor of 1.3;
• an extensive database of soil properties covering each of the 254 Texas counties for
evaluating the effects of moisture changes on soil strength properties; and
• a moisture correction procedure (to account for differences between wet and dry
regions of the state) that provides users the option of adjusting strength properties
determined from laboratory triaxial tests on soil specimens prepared at a given
moisture content to the expected in-service moisture conditions.
Instructions on the operation of the LoadGage computer program are given in the user’s
manual prepared by Fernando, Oh, and Liu (2007).

5
SCOPE OF RESEARCH REPORT
This report documents the development of a revised procedure for conducting the
triaxial design check of FPS pavement designs. The revised procedure uses a multi-layered
elastic analysis program for computing wheel load stresses and incorporates an option for
correcting failure envelope parameters to account for moisture effects. The report is
organized into the following chapters:
• Chapter I (this chapter) provides the background for this project and states its
objectives.
• Chapter II presents the characterization of climatic and soil variations across Texas,
which resulted in a database of climatic and soil variables that researchers used to
evaluate expected in-service moisture conditions as part of developing the method for
correcting soil strength parameters to consider moisture effects in the triaxial design
check.
• Chapter III presents the procedure for moisture correction developed from this project,
which researchers evaluated using the data from plate bearing tests conducted on full-
scale pavement sections and on small-scale pavement models. The moisture
correction procedure is included as an option in the LoadGage program for cases
where engineers may deem it appropriate to correct strength properties to values they
consider representative of expected in-service soil moisture conditions.
• Chapter IV describes the work done by researchers to estimate expected in-service
soil moisture contents for the purpose of developing a database to support the
application of the moisture correction procedure developed in this project.
• Finally, Chapter V summarizes the findings from the research reported herein and
recommends modifications to the Tex-117E design method.


7
CHAPTER II. CHARACTERIZATION OF CLIMATIC AND SOIL VARIATIONS IN TEXAS
INTRODUCTION
Climatic factors and the properties of soils on which pavements are built affect
pavement design because of the influence of these variables on pavement performance. For
the purpose of evaluating the load bearing capacity of roads to check thickness designs based
on the modified Texas class, or for routing super heavy loads, or establishing load zoning
requirements, it is necessary (in the researchers’ opinion) to consider the variation of climatic
and soil conditions to conduct a proper analysis. Thus, researchers characterized the
variation of climatic and soil conditions throughout Texas to establish climatic-soil regions
for pavement design and pavement evaluation applications.
This task was accomplished by reviewing and collecting available data from weather
stations in Texas and from county soil survey reports published by the Natural Resources
Conservation Service of the U.S. Department of Agriculture (USDA). Climatic data
collected in this project included air temperatures, precipitation, relative humidity, and
Thornthwaite Moisture Index. From published county soil surveys, researchers likewise
identified the predominant soil types by volume in each Texas county, and established
representative soil-water characteristic curves that define the relationship between soil
suction and soil moisture content. Researchers used these curves to group counties into
several soil regions through cluster analysis.
Groups that resulted from the cluster analyses of climatic and soil variables were
superimposed to establish climatic-soil regions for implementing a moisture correction
procedure in the modified triaxial design check developed from this project. This correction
is based on the shear strength equation for unsaturated soils that is presented in Chapter III of
this report. According to this equation, the shear strength of unsaturated soils is a function of
the effective normal stress and soil suction. Since the soil-water characteristic curve defines
the relationship between soil suction and soil moisture content, it provides the linkage
between soil moisture content and shear strength. Thus, researchers compiled a data base of
soil-water characteristic curves to implement the moisture correction procedure developed
from this project. These curves covered the range of soils found across Texas as established
from the characterization of climatic and soil variations documented in this chapter.

8
CLIMATIC REGIONS
Researchers used the following factors to characterize the climatic conditions for each
county:
• mean air temperature,
• mean precipitation,
• daily temperature drop,
• maximum and minimum relative humidities, and
• Thornthwaite Moisture Index.
Thirty-year averages for these variables were determined for each county. It is noted
that some counties did not have weather station data to compute these averages. For these
counties, researchers estimated the missing values by interpolating data from neighboring
counties. The cluster analysis was then performed based on the thirty-year averages of the
climatic variables. Figures A1 to A6 in Appendix A show these averages for each of the six
climatic variables considered. The numbers on each map identify the different counties
following the numbering scheme used by TxDOT that is given in Table A1. In addition,
Table A2 summarizes the averages determined for each county.
Two counties with similar values of the six climatic variables can be classified into
the same climatic region or, alternatively, into two distinct regions if the counties are
dissimilar. The cluster analysis performed by researchers may be explained by defining the
dissimilarity between two counties as:
( )∑=
≠−=6
1
2 ,k
jkikij jiXXD (2.1)
where ikX and jkX are values of the climatic variable k for counties i and j, respectively.
The clustering may be performed beginning with one cluster (representing the entire state of
Texas) and progressing to n clusters, which in the limit will equal the number of Texas
counties (note that researchers characterized the climatic conditions by county, thus
establishing the county as the basic unit for the cluster analysis). This approach is called the
top-down method. Alternatively, the clustering may begin with n clusters that are
systematically reduced to fewer clusters by grouping similar counties (bottom-up method).
To establish Texas climatic regions, researchers implemented this latter method. Hence, at
the first step, two closest counties that have the smallest dissimilarity among all possible
pairs of counties are assigned in the same group. At the next step, the dissimilarity between a

9
group and other counties is defined by the average of dissimilarities between each county of
the group and the other county. The next group will then consist of the two closest counties,
or one county and one group. After some steps, the dissimilarity between groups is
calculated by the average of dissimilarities of all possible pairs of counties that are from
different groups. Hence, two counties, one county and one group, or two groups are
classified in a group. Figure 2.1 displays a diagram explaining the procedure. This
procedure is called the average method of clustering. The average method tends to minimize
the variance of climatic variables in each group.
To decide on the appropriate number of climatic regions for characterizing climatic
conditions, researchers examined the change in the mean square error statistic (given by
equation 2.2) with increase in the number of clusters. For this analysis, let ijkX be the ith
climatic variable for the kth county classified in the jth cluster. Then, for the given number of
clusters Jc, the mean square error indicating the variability of climatic conditions for Jc
clusters is determined as follows:
( ) ( )6 2
.1 1 1
6 254jc KJ
ijk ij ci j k
MSE X X J= = =
= − −∑∑∑ (2.2)
where Kj is the number of counties in the jth cluster. Obviously, the sum of the number of
counties for all clusters equals 254, the total number of counties in the state.
Researchers examined the MSE as the number of clusters is increased. Starting with
one cluster (Jc =1), statistical hypothesis testing (partial F-tests) was found to be too sensitive
to determine the proper number of clusters. Hence, researchers used an alternative graphical
method. Figure 2.2 shows the variation in the mean square errors from the cluster analysis.
This chart is referred to as the “scree” plot (the plot looks like the side of a mountain, and
“scree” refers to the debris fallen from a mountain and lying at its base). When seven
clusters are considered, increasing the number of clusters to eight does not contribute
significantly to the reduction of the MSE. Figure 2.3 shows how the state would be
subdivided into climatic regions when seven clusters are used. Researchers are of the
opinion that seven clusters adequately capture the variation in climatic conditions across
Texas and represent a good compromise between reducing the MSE and keeping the number
of clusters small for simplicity.

10
Figure 2.1. Diagram Illustrating the Cluster Analysis.

11
0.0
0.1
0.2
0.3
0.4
0.5
0.6
0.7
3 4 5 6 7 8 9 10
Number of Clusters
MSE
Figure 2.2. Scree Plot to Determine the Number of Climatic Regions.

12
Figure 2.3. Subdivision of Texas into Seven Climatic Regions (counties on map are identified by corresponding county numbers).
SOIL REGIONS
To establish soil regions, researchers reviewed Texas county soil survey reports to
identify the soil types found across the state and the predominant soils by county based on
the soil volumes reported in the USDA soil surveys. Figure 2.4 shows the predominant soils
based on the unified soil classification system. Given this information, researchers assigned
soil-water characteristic curves to the various soil types using the catalog of soil-water
characteristic curves compiled by Mason et al. (1986) and Lytton et al. (1990). For the
purpose of characterizing soil regions, researchers determined the weighted average (based

13
Figure 2.4. Predominant Soils Identified from County Soil Survey Reports (white areas
show counties with missing information).

14
on soil volume) of the soil-water characteristic curves for the predominant soils in each
county. Specifically, researchers computed the weighted average curve as follows:
w w fj ij ii
m
= ×=∑
1 (2.3)
where,
wj = the weighted average moisture content corresponding to the jth level of soil
suction (j = 1 to ns, where ns is the number of soil suction levels considered
in computing the weighted average),
wij = the moisture content corresponding to the jth level of soil suction for the ith
soil (i = 1 to m, where m is the number of predominant soils in a county), and
fi = the weight assigned to the ith soil based on soil volume.
The weighted average curves were then used in a cluster analysis to subdivide the
state into soil regions. Researchers followed this approach for computational simplicity and
to permit the cluster analysis to be done by county. Researchers note that this approach was
used solely for the purpose of establishing the soil regions into which the state may be
subdivided. With respect to considering the effect of moisture on pavement load bearing
capacity, the methodology developed in this project permits engineers to use the soil-water
characteristic curve applicable to a given design project.
Figure 2.4 shows counties where researchers found no published soil survey reports.
For these cases, researchers computed the weighted average soil-water characteristic curves
by interpolation using the data from neighboring counties. The authors considered this
approach to be reasonable given that the purpose of the cluster analysis was simply to
establish regional trends in the variation of the soil-water characteristic curves across the
counties comprising Texas. For analyzing pavement load bearing capacity, the methodology
developed in this project uses the curve applicable to a given project.
Table A3 gives data that define the weighted average soil-water characteristic curves
used in the cluster analysis. For each county, the table gives the water contents
corresponding to 8 soil suction levels ranging from 2.0 to 4.8 pF, where
1 pF = log10|suction in cm of water|. Researchers used the data in Table A3 in a bottom-up
cluster analysis to subdivide the state into soil regions. This analysis used the sum of the
squared differences between the weighted average curves to quantify the dissimilarity
between two given counties. Figure 2.5 shows the scree plot from the cluster analysis.

15
0.00
0.05
0.10
0.15
0.20
0.25
3 4 5 6 7 8 9 10 11Number of Clusters
MS
E ( ×
0.0
1)
Figure 2.5. Scree Plot to Determine the Number of Soil Regions.

16
Based on the change in the MSEs plotted in Figure 2.5, researchers decided to use nine
clusters to subdivide Texas into soil regions based on the variation of the soil-water
characteristic curves. Figure 2.6 shows the nine soil regions identified from the cluster
analysis. By superimposing these nine soil regions with the seven climatic regions
determined previously, the climatic-soil regions given in Figure 2.7 are determined.
Table 2.1 shows how the Texas counties are classified into the different climatic-soil regions.
Researchers used the results from the characterization of Texas climatic-soil regions
in developing a procedure that considers the effects of environmental factors in the triaxial
design check. This procedure is based on correcting soil failure envelope parameters
determined from triaxial tests to values that are considered representative of expected in-
service soil moisture conditions. The next chapter presents this moisture correction
procedure.

17
Figure 2.6. Subdivision of Texas into Nine Soil Regions.

18
Figure 2.7. Texas Climatic-Soil Regions.

Table 2.1. Grouping of Texas Counties by Climatic-Soil Regions (counties identified by TxDOT county numbers). Climatic Region Soil
Region 1 2 3 4 5 6 7 Count
1
10, 11, 12, 15, 25, 27, 28, 39, 42, 62, 73, 87, 90, 110, 112, 126, 127, 141, 144, 166, 196, 205, 220, 232, 243, 244
19, 32, 75, 81, 92, 113, 183, 194, 225
30, 33, 59, 70, 77, 79, 88, 97, 100, 134, 136, 138, 148, 171, 179, 185, 191, 192, 207, 217, 218, 221
72, 231 109, 137, 142, 253, 254
21, 26, 76, 82, 94, 121, 130, 147, 154, 158, 175, 198, 239
85, 102, 114, 210, 228, 236
83
2 5, 13, 46, 47, 50, 89, 106, 129, 149, 162, 247, 252
34, 93, 103, 155, 172, 230, 250
23, 38, 40, 44, 51, 58, 63, 104, 105, 111, 118, 119, 132, 135, 140, 153, 156, 159, 165, 177, 180, 188, 216, 242
22, 55, 69, 116, 123, 189, 195, 222
24, 66, 67, 125, 214
1, 8, 45, 143, 169, 237, 249
101, 122, 176, 187, 201, 229
69
3 18, 83, 98, 131, 167, 213, 227 53, 84, 168, 223, 233, 251 170, 204 15
4 4, 14, 133, 161, 193, 206, 246
43, 60, 117, 139 35, 48, 99 31, 178,
240 29, 49, 57, 74, 199, 235, 241
20, 36, 80, 124, 146, 181
30
5 150, 157 65, 173, 197 2, 52, 186, 238, 248 71, 108, 145 3, 202,
203, 212 17
6 16, 120, 160, 163, 182 190 86, 164, 226 245 234 37, 174 13
7 7, 68, 184, 215 6, 9, 17, 41, 54, 56, 91, 96, 115, 128, 152, 200, 208, 211, 219
61 20
8 209, 224 78 64 4 9 95 107 151 3
Count 66 21 78 16 15 32 26 254
19


21
CHAPTER III. ASSESSING THE IMPACT OF MOISTURE VARIATION ON LOAD BEARING CAPACITY OF PAVEMENTS
From the findings presented in research report 0-4519-1 (Fernando, Oh, Estakhri, and
Nazarian, 2007), researchers verified that the current modified Texas triaxial design method
gives very conservative estimates of load bearing capacity when compared to small- and
large-scale plate bearing test results. From the analysis of UTEP test data, researchers
observed significant changes in load bearing capacity with changes in the moisture condition
of the base and subgrade layers. Hence, efforts were made to take the effect of moisture
variation into account in a procedure to estimate or predict the load bearing capacity of
pavements.
The moisture variation in the subgrade is a significant factor controlling bearing
capacity, which is a function of the cohesion c, and angle of internal friction φ. Titus-Glover
and Fernando (1995) developed equations to express strength parameters in terms of soil
physical properties and soil suction. In this project, researchers used these equations to
predict the effects of moisture changes on the load bearing capacity of pavements. This work
led to modifications of the modified triaxial (MTRX) program for triaxial analysis that
Fernando et al. (2001) developed in an earlier project. Researchers incorporated a procedure
for adjusting strength properties to account for the effects of moisture changes on pavement
load bearing capacity. This moisture correction procedure is available as an option in the
LoadGage program developed from this project. LoadGage includes an extensive database
of soil properties (covering all 254 Texas counties) that is used to evaluate the effects of
moisture changes on soil strength properties and to account for effects of differences in
moisture susceptibilities among soils in the triaxial design check. A user’s guide to the
program is given in a companion report to this project by Fernando, Oh, and Liu (2007).
MOISTURE CORRECTION OF STRENGTH PARAMETERS
The strength parameters c and φ define the Mohr-Coulomb failure envelope
determined from triaxial tests on laboratory molded specimens. This failure envelope
represents failure points corresponding to different levels of normal and shearing stresses.
The equation for the failure envelope is given by Equation 3.1, which is the shear strength
equation for a saturated soil (Fredlund and Rahardjo, 1993):

22
φστ tannc += (3.1)
where,
τ = shear stress,
σn = net normal stress on the failure plane at failure = (σf – Ua)f,
σf = applied pressure at failure, and
Ua = pore air pressure.
Fredlund and Rahardjo (1993) formulated the shear strength equation of an unsaturated soil
in terms of the normal stress and matric suction as given by:
( ) ( ) bfwafaf UUUc φφστ tantan' −+−+= (3.2)
where,
'c = effective cohesion defined as the intercept of the Mohr-Coulomb
failure envelope on the shear stress axis when the normal stress and the
matric suction are both equal to zero,
φ = angle of internal friction associated with the normal stress
variable (σf – Ua),
(Ua – Uw)f = matric suction on the failure plane at failure,
φb = angle indicating the rate of increase in shear strength relative to the
matric suction, and
Uw = pore water pressure.
Equation 3.2 reduces to the shear strength equation for saturated soils when the pore water
pressure Uw approaches the pore air pressure Ua and the matric suction component vanishes
under saturated conditions. From examination of Equations 3.1 and 3.2, the total cohesion is
determined to be:
( ) bfwa UUcc φtan' −+= (3.3)
Titus-Glover and Fernando (1995) conducted triaxial tests on different types of base
materials and subgrade (sand and clay) at three moisture levels, optimum and ± 2 percent of
optimum. Additional tests were performed to obtain soil physical properties such as
gradation and Atterberg limits, and the soil-water characteristic curves of the various
materials tested. The final form of the equation to predict cohesion was based on
Equation 3.3, which was derived from mechanistic analysis. It is given by:
φtan' UdUbcc ++= (3.4)

23
where,
U = suction in psi and
b, d = constants determined from test data.
Using Equation 3.4 as the functional form of the relationship between cohesion and soil
suction, Titus-Glover and Fernando (1995) found the effective cohesion to be a function of
the plastic limit, gradation, porosity, and specific gravity. The final form of the cohesion
equation developed by these researchers is given by:
φtan117.0141.0998.040006.0373.040229.0167.12 2
UUGPLNnNc sNNN
−+×−−−+=
(3.5)
where,
c = cohesion in psi,
N40 = percent of material passing the No. 40 sieve size,
n = porosity,
N40N = normalized N40 = (N40 – 55.889),
PLN = normalized plastic limit = (PL – 15.896), and
GsN = normalized specific gravity = (Gs – 2.608).
From examination of Equations 3.4 and 3.5, the effective cohesion 'c is found to be given by
the first five terms of Equation 3.5.
From a similar analysis of laboratory test data, Titus-Glover and Fernando (1995)
developed an equation for predicting the angle of internal friction as follows:
spF GUnPI 817.3113.4881.0957.0611.1 +−−−=φ (3.6)
where,
φ = friction angle in degrees,
PI = plasticity index, and
UpF = soil suction in pF.
To convert suction in psi to suction in pF, the following relationship may be used:
847.1+= psipF ULogU (3.7)
Hence, as the soil moisture content varies, its strength parameters are expected to change
since the moisture content is directly associated with soil suction based on Gardner’s (1958)
equation:

24
a
pW hA
n
+=
1θ (3.8)
where,
θ = volumetric moisture content,
hp = soil suction (or negative pore water pressure), and
Aw, a = coefficients of Gardner’s equation.
From Equations 3.5 and 3.6, the following equations for adjusting strength properties due to
changes in moisture content are obtained:
⎟⎟⎠
⎞⎜⎜⎝
⎛+=
ett
initialinitialett U
Ua
arg0arg logφφ (3.9)
( ) ( )ettettinitialinitialinitialettinitialett UUaUUacc argarg2arg1arg tantan φφ −+−+= (3.10)
where,
φtarget = internal friction angle at target moisture content,
φinitial = internal friction angle at initial moisture content,
Utarget = suction (psi) at target moisture content,
Uinitial = suction (psi) at initial moisture content.
ctarget = cohesion at target moisture content,
cinitial = cohesion at initial moisture content,
a0 = friction angle correction coefficient equal to 4.13, and
a1, a2 = cohesion correction coefficients equal to 0.141 and 0.117, respectively.
Note that the moisture correction requires the soil-water characteristic curve that gives the
relationship between volumetric moisture content and soil suction for a given material. The
friction angle and cohesion are adjusted based on the difference between the initial and target
values of soil suction associated with the given change in moisture content. In this analysis,
the initial values correspond to the moisture content at which triaxial tests on laboratory
molded specimens were conducted to determine the cohesion and friction angle. These
material parameters may be determined using the standard test method Tex-117E or the
provisional test method Tex-143E. The target values correspond to the expected in-situ
moisture content during the service life of the pavement.

25
EVALUATION OF LOAD BEARING CAPACITY BASED ON FIELD PLATE BEARING TEST DATA Researchers used the moisture correction procedure described in the preceding in an
evaluation of the load bearing capacity of the clay, sand, and stabilized sections that were
built and tested at the Texas A&M Riverside Campus. Tables 3.1 and 3.2 identify these test
sections. Three different cases were considered:
• Case I: Estimate load bearing capacity using the current modified triaxial design
method given in TxDOT Test Method Tex-117E.
• Case II: Use the LoadGage program to estimate load bearing capacity based on
subgrade strength parameters (cohesion and friction angle) obtained from Tex-117E
laboratory triaxial tests (moisture correction option not used in the analysis).
• Case III: Run the LoadGage program to estimate load bearing capacity with the
moisture correction option turned on to adjust the cohesion and friction angle based
on the difference between the measured field moisture content at the time of the plate
bearing tests and the moisture content of triaxial specimens tested following Test
Method Tex-117E.
Case I Analysis
The load bearing capacities for Case I were evaluated in the companion report to this
project by Fernando, Oh, Estakhri, and Nazarian (2007). Based on the triaxial classifications
of the clay and sandy subgrades, and the nominal thicknesses of the flexible base sections,
researchers used the Tex-117E flexible base design chart (Figure 3.1) to determine the
allowable loads given in Table 3.3 for these sections. Researchers note that the term
“allowable load” as used herein refers to a wheel load characterized by a circular footprint of
uniform pressure and of load magnitude such that the subgrade shear stresses induced under
load are within the Mohr-Coulomb failure envelope of the subgrade material. The term
“allowable load” is not necessarily equivalent to the “design wheel load” that refers to the
wheel load used for the thickness design of a given pavement. In terms of current practice,
the design wheel load shown on the x-axis of the flexible base design chart (Figure 3.1) refers
to one of the following:

26
Table 3.1. Flexible Base Sections Tested in Phase I of Research Project*. Backcalculated Modulus (ksi) Section
Identifier Subgrade Base Material Base Subgrade
Base Thickness
(in)
SSC_12 Clay Sandstone 17.5 7.4 13
UGC_12 Clay Uncrushed Gravel 38.6 10.3 12
CAC_12 Clay Lime-Stabilized Caliche 18.0 8.6 12
G2C_12 Clay Grade 2 Crushed Limestone 20.9 8.3 12
G1C_12 Clay Grade 1 Crushed Limestone 20.3 9.6 12
SSC_6 Clay Sandstone 22.4 9.1 6.5
UGC_6 Clay Uncrushed Gravel 27.5 9.3 7.2
CAC_6 Clay Lime-Stabilized Caliche 23.1 10.4 6.5
G2C_6 Clay Grade 2 Crushed Limestone 40.8 11.4 6.7
G1C_6 Clay Grade 1 Crushed Limestone 33.0 12.3 7
G1S_6 Sand Grade 1 Crushed Limestone 64.6 11.2 6
G2S_6 Sand Grade 2 Crushed Limestone 47.7 12.4 6
CAS_6 Sand Lime-Stabilized Caliche 39.3 11.1 5
UGS_6 Sand Uncrushed Gravel 64.9 12.0 6.8
SSS_6 Sand Sandstone 101.5 12.5 6.6
G1S_12 Sand Grade 1 Crushed Limestone 104.8 16.2 11
G2S_12 Sand Grade 2 Crushed Limestone 28.0 15.5 11.8
CAS_12 Sand Lime-Stabilized Caliche 70.6 14.8 11.5
UGS_12 Sand Uncrushed Gravel 24.0 13.3 11
SSS_12 Sand Sandstone 46.7 15.0 11.2 * Each section was 12 ft wide by 16 ft long.

27
Table 3.2. Stabilized Sections Tested in Phase II of Research Project1. Backcalculated Modulus (ksi) Thickness (in) Section
Identifier Section Composition Stabilized Material Base2 Subgrade Stabilized
Material Base2
6B Grade 2 with 4.5% cement on clay 580.0 14.5 5.8
7B Grade 2 with 3% cement on clay 272.6 13.2 6.4
8B Uncrushed gravel with 2% lime on clay 28.2 9.0 6.3
9B Thin Type D HMAC3 over Grade 1 on clay 132.6 25.0 8.8 3.2 7.0
10B Thick Type D HMAC over Grade 1 on clay 101.7 25.6 9.6 5.1 6.3
11B Thick Type D HMAC over Grade 1 on sand 200.0 38.3 12.7 3.7 7.9
12B Thin Type D HMAC over Grade 1 on sand 200.0 54.8 13.4 2.7 6.3
13B Uncrushed gravel with 2% lime on sand 88.9 12.0 6.2
14B Grade 2 with 3% cement on sand 314.0 12.3 6.1
15B Grade 2 with 4.5% cement on sand 540.0 12.2 6.6
1 Each section was 12 ft wide by 16 ft long. 2 Shaded cells indicate sections where the stabilized material is the base layer. 3 Hot-mix asphaltic concrete pavement temperatures: 114 °F at clay site and 117 °F at sandy site.

28
Table 3.3. Allowable Loads on Flexible Base Sections. Allowable Load (kip) Material Texas Triaxial Class 6-inch sections 12-inch sections
Clay subgrade 6.1 1.0 2.5 Sandy subgrade 3.7 4.6 18.2
Figu
re 3
.1.
TxD
OT
Tes
t Met
hod
Tex
-117
E F
lexi
ble
Bas
e D
esig
n C
hart
.

29
• the average of the ten heaviest wheel loads daily (ATHWLD) if the percent of tandem
axles characterizing the traffic for the given design problem is less than 50 percent, or
• the ATHWLD multiplied by a load adjustment factor of 1.3 if the percent of tandem
axles is equal to or greater than 50 percent.
While the allowable load and the design wheel load as used herein are based on the
shear strength of the subgrade material as determined by its Mohr-Coulomb failure envelope,
the difference in terminology relates to the context in which the terms are used. The design
wheel load refers to the wheel load that the engineer specifies to come up with a thickness
design. On the other hand, the term “allowable load” refers to the wheel load that a given
pavement can structurally support without overstressing the subgrade based on its Mohr-
Coulomb failure envelope. In this report, researchers use the term “allowable load” to
quantify the load bearing capacity of the sections tested in this project. This load is
determined from analyzing test data collected on a given section. Given this distinction, the
results from this analysis should not be misinterpreted as loads used for designing the test
sections.
To determine the allowable loads on the stabilized sections, researchers used the
Texas triaxial design check module in TxDOT’s FPS-19 program (with tandem loads less
than 50 percent) to get the allowable load for an equivalent flexible base section determined
in accordance with the Tex-117E thickness design charts. As an example, consider Section
9B, which consists of 3.2 inches of Type D HMAC, over 7 inches of Grade 1 crushed
limestone base, over clay subgrade with a Texas triaxial class of 6.1. Using FPS-19,
researchers determined this section to be equivalent to about a 12-inch flexible base section
on the same clay subgrade as illustrated below:
• Flexible base thickness required: 12 inches
• Thickness reduction for HMAC: 1.8 inches
• Modified triaxial thickness required: 10.2 inches
The thickness reduction of 1.8 inches is determined from the Tex-117 thickness
reduction chart (Figure 3.2), given the equivalent flexible base thickness of 12 inches and the
cohesiometer value of 300 for the 3.2-inch thick HMAC layer. The cohesiometer value of
300 is taken from Table 3.4, which shows typical values used by TxDOT engineers for
design of flexible pavements. Allowing for a thickness reduction of 1.8 inches, the required
modified triaxial thickness is determined to be 10.2 inches, which equals the total as-built

30
Figure 3.2. Tex-117E Thickness Reduction Chart for Stabilized Layers.

31
Table 3.4. Cohesiometer Values for Different Materials. Material Type Modified Cohesiometer Value
Lime-treated base greater than 3 inches thick 300 Lime-treated subgrade greater than 3 inches thick 250 Cement-treated base greater than 3 inches thick 1000 Cold-mix bituminous materials greater than 3 inches thick 300 Hot-mix bituminous materials greater than 6 inches thick 800 Hot-mix bituminous materials 4 to 6 inches thick 550 Hot-mix bituminous materials 2 to 4 inches thick 300
thickness of the stabilized section. Thus, for the equivalent flexible base section thickness of
12 inches and a subgrade triaxial class of 6.1, researchers determined the allowable load to be
2500 lb from the Tex-117 flexible base design chart given in Figure 3.1.
Researchers note that the above process involves a reversed application of the
modified triaxial design method in Tex-117E. For flexible pavement design using this
method, one would normally determine the required thickness of better material above the
subgrade using the flexible base design chart given the design wheel load and the subgrade
triaxial class. Thus, for the example given, the required depth of cover is determined to be 12
inches for a design wheel load of 2500 lb (assuming tandem loads less than 50 percent) and a
subgrade triaxial class of 6.1. Since the pavement would have a stabilized layer, the engineer
would then use the chart shown in Figure 3.2 to determine the applicable thickness reduction.
From this chart, the thickness reduction is determined to be 1.8 inches, given the 12-inch
depth of cover from the flexible base design chart and the cohesiometer value of 300 for the
3.2-inch thick HMAC layer. Thus, a modified triaxial thickness of (12.0 – 1.8) = 10.2 inches
is determined, of which 3.2 inches is HMAC and the remaining 7 inches is flexible base.
Researchers used FPS-19 following the same procedure as described above to
determine the allowable loads for the other stabilized sections. Table 3.5 shows the results
from this analysis. Except for the HMAC sections, no thickness reductions were determined
for the other stabilized sections, which have base thicknesses of less than 8 inches.
Researchers note that the Tex-117E thickness reduction chart does not provide reductions for
depths of cover below 8 inches as shown in Figure 3.2. In addition, examination of the
cohesiometer curves in this figure shows that the thickness reductions from the curves will
never result in a modified depth of cover less than 8 inches. Note that the cohesiometer
curves are all to the left of the 8-inch line drawn in Figure 3.2 that gives the correction
factors resulting in a modified triaxial thickness of 8 inches. Since no thickness reductions

32
Table 3.5. Allowable Loads on Stabilized Sections.
Section Identifier Section Composition Allowable Load* (kip)
6B Grade 2 with 4.5% cement on clay soil 1.0 7B Grade 2 with 3% cement on clay soil 1.0 8B Uncrushed gravel with 2% lime on clay soil 1.0 9B Thin Type D HMAC over Grade 1 on clay soil 2.5 10B Thick Type D HMAC over Grade 1 on clay soil 4.2 11B Thick Type D HMAC over Grade 1 on sandy soil 36.0 12B Thin Type D HMAC over Grade 1 on sandy soil 13.0 13B Uncrushed gravel with 2% lime on sandy soil 4.6 14B Grade 2 with 3% cement on sandy soil 4.6 15B Grade 2 with 4.5% cement on sandy soil 4.6
*Does not include correction for stabilized material on non-HMAC section
were determined for the non-HMAC stabilized sections using Tex-117E, the allowable loads
given in Table 3.5 do not incorporate corrections for the stabilized materials on these sections.
Case II Analysis
For the Case II analysis, researchers used the cohesion and friction angle determined
from Tex-117E triaxial tests on clay and sandy specimens, along with the backcalculated
layer moduli and thicknesses of the sections built to predict the allowable loads based on the
Mohr-Coulomb failure envelope. From triaxial test results, researchers determined the
failure envelopes for the clay and sandy subgrades. The clay was found to have a cohesion
of 1.7 psi and a friction angle of 10.3°. The sandy subgrade was characterized to have a
cohesion of 6 psi and a friction angle of 32.8°. Tables 3.1 and 3.2 give the layer moduli
backcalculated from falling weight deflectometer measurements taken on the flexible base
and stabilized sections, respectively. Researchers performed the backcalculations using the
MODULUS program (Michalak and Scullion, 1995). In addition, the tables show the layer
thicknesses of the sections built.
Table 3.2 shows that the backcalculated asphalt and base moduli are rather low for
the HMAC sections built on the clay subgrade. Researchers examined the FWD data from
these sections and found that the deflections are rather high for the given sections. Table 3.6
shows the normalized deflections from these sections as well as the assessments of layer
strengths as determined from the remaining life analysis module within the MODULUS
program. In this table, UPR is an indicator of the strength of the upper pavement layers that

33
Table 3.6. Layer Strength Assessment Based on FWD Deflections. Normalized Sensor Deflection (mils) Layer Strength Section Station* 1 2 3 4 7
SCI (mils) UPR LWR SGR
1 37.93 19.99 8.34 5.08 2.51 17.94 PR VP VP 2 45.14 24.66 10.70 6.04 2.66 20.48 VP VP VP 3 39.31 20.21 8.75 5.50 2.53 19.10 PR VP VP 4 41.14 23.44 10.16 6.15 2.55 17.70 PR VP VP
9B
Mean 40.88 22.07 9.49 5.69 2.56 18.81 PR VP VP 1 36.63 19.00 8.48 5.20 2.37 17.63 PR VP VP 2 45.01 24.15 10.03 5.64 2.55 20.86 VP VP VP 3 31.25 16.16 7.80 4.84 2.45 15.10 PR PR VP 4 33.69 18.59 9.14 5.67 2.33 15.11 PR PR VP
10B
Mean 36.64 19.47 8.86 5.34 2.43 17.17 PR VP VP ∗ FWD deflections taken along the longitudinal centerline of the section with plate
positioned at ±2 and ±6 ft from the mid-point of the section. Front of trailer was positioned towards mid-point of section at each test location.
comprise the top eight inches of the pavement structure. This quantity is determined from
the surface curvature index (SCI), which is the difference between the sensor 1 and sensor 2
FWD deflections.
It is observed from Table 3.6 that the SCIs are all high resulting in UPRs that range
from poor (PR) to very poor (VP) for the HMAC sections on the clay subgrade. This
assessment of the upper pavement strength is consistent with the low HMAC and base
moduli backcalculated from the FWD deflections taken on these sections. In addition,
researchers note that the strength of the lower pavement layers (LWR) and that of the
subgrade (SGR) are generally very poor as determined from the base curvature indices (BCIs)
and the sensor 7 FWD deflections. Considering these results, the authors are of the opinion
that the backcalculated values for the HMAC and base layers are indicative of the poor
support provided by the clay subgrade on these sections.
It is noted that that no pavement temperatures were available from the plate bearing
tests on the HMAC sections. Thus, researchers used the HMAC backcalculated moduli
without temperature correction to evaluate the load bearing capacities on the HMAC sections.
While temperature correction was not possible, researchers note that the plate bearing tests
were completed within a week of the FWD tests, and that tests on the HMAC sections were
conducted from about noon to late afternoon under prevailing atmospheric conditions similar
to the FWD tests.
34
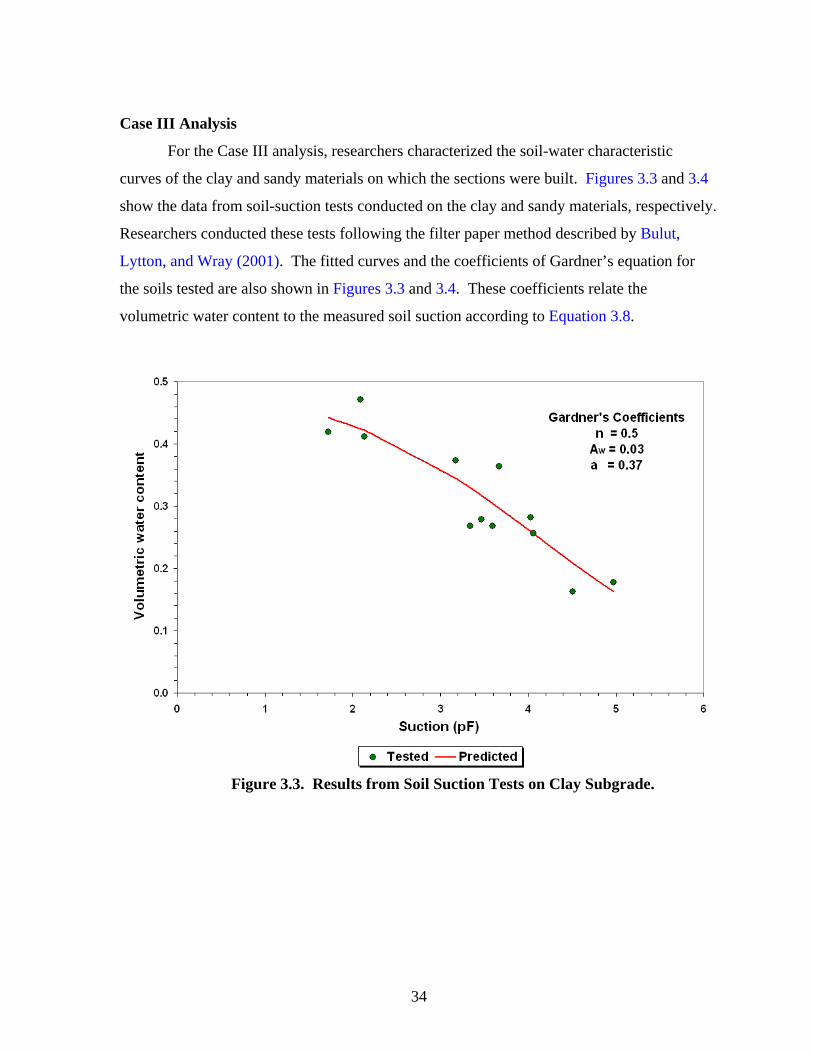
Case III Analysis
For the Case III analysis, researchers characterized the soil-water characteristic
curves of the clay and sandy materials on which the sections were built. Figures 3.3 and 3.4
show the data from soil-suction tests conducted on the clay and sandy materials, respectively.
Researchers conducted these tests following the filter paper method described by Bulut,
Lytton, and Wray (2001). The fitted curves and the coefficients of Gardner’s equation for
the soils tested are also shown in Figures 3.3 and 3.4. These coefficients relate the
volumetric water content to the measured soil suction according to Equation 3.8.
Figure 3.3. Results from Soil Suction Tests on Clay Subgrade.

35
Figure 3.4. Results from Soil Suction Tests on Sandy Subgrade.
Figure 3.5 shows a run-time screen from the LoadGage program that illustrates the
adjustment of subgrade strength properties due to changes in soil suction arising from
moisture content variations. The program gives users the option to view the soil suction
curve for a given material. From the specified initial and field moisture contents, the
program shows on the chart the corresponding soil suction values that are used in
Equations 3.9 and 3.10 to adjust the strength properties from the prescribed initial values to
the in-situ values corresponding to the specified field moisture content. The reader is
referred to the LoadGage user’s guide by Fernando, Oh, and Liu (2007) for more details on
the application of the program to perform a triaxial design check with the moisture correction
option.
Researchers used the LoadGage program for the Case III analysis. In this analysis,
the strength properties of the subgrade materials were determined according to Test Method
Tex-117E (following current practice). Thus, the initial moisture contents correspond to the
condition of the specimens after capillary wetting as prescribed in Tex-117E. For the clay
material, researchers measured the moisture content to be 25 percent for the triaxial
specimens. The corresponding moisture content for the sand specimens was 12.3 percent.

36
Figure 3.5. LoadGage Run-Time Screen Illustrating Effect of Moisture Change on Soil Suction.

37
After plate bearing tests were conducted on the flexible base sections, researchers
took soil samples for determination of moisture content in the laboratory. From these tests,
the average field moisture contents were determined to be 22 and 7 percent at the clay and
sandy sites, respectively. Similar measurements made on these sites after field tests on the
stabilized sections showed the average moisture contents to be 17.4 (clay) and 7 percent
(sandy site). Given this information, researchers used the moisture correction procedure
described previously to adjust the strength properties of the subgrade materials and estimate
representative in-situ values for the Case III analysis.
Comparison of Load Bearing Capacity Estimates
Tables 3.7 to 3.9 show the load bearing capacity estimates for the three cases
considered. For comparison purposes, the tables also show the load bearing capacity
estimates corresponding to a permanent displacement of 50 mils on the sections tested.
These estimates are based on an analysis of the measured deformation response from plate
bearing tests done on these sections that is presented in the companion report to this project
by Fernando, Oh, Estakhri, and Nazarian (2007).
A deformation of 50 mils is hard to discern with the naked eye, and is within the
range of macro-texture of pavement surfaces. Thus, researchers used the load corresponding
to a 50-mil permanent displacement as a reference in comparing the three methods used to
predict pavement load bearing capacity under static loading. For each method, researchers
determined the differences between the load bearing capacity predictions on the sections
tested, and the corresponding reference values based on the 50-mil permanent displacement
tolerance. Tables 3.7 to 3.9 show these differences. In these tables, a negative difference
means that a given method underestimates the load bearing capacity based on the 50-mil
criterion while a positive difference means just the opposite. To facilitate the comparison of
the three methods, researchers plotted the differences from the 50-mil reference loads in
Figures 3.6 to 3.8. The following observations are noted from these figures:

38
Table 3.7. Load Bearing Capacity Estimates for Sections on Clay Subgrade. Load Bearing Capacity (kip) Difference from 50-mil Reference (kip) Section 50-mil Case I Case II Case III Case I Case II Case III
SSC_12 2 2.5 2.8 4.6 0.5 0.8 2.6UGC_12 4.5 2.5 3.1 5 -2 -1.4 0.5CAC_12 3.2 2.5 2.4 4 -0.7 -0.8 0.8G2C_12 2.5 2.5 2.6 4.2 0 0.1 1.7G1C_12 4.9 2.5 2.4 3.9 -2.4 -2.5 -1SSC_6 2.4 1 1.6 2.6 -1.4 -0.8 0.2UGC_6 2.6 1 1.6 2.5 -1.6 -1 -0.1CAC_6 3 1 1.3 2.1 -2 -1.7 -0.9G2C_6 4.7 1 1.6 2.5 -3.7 -3.1 -2.2G1C_6 5.3 1 1.5 2.4 -4.3 -3.8 -2.9
Average difference (kip) -1.8 -1.4 -0.1Minimum difference (kip) -4.3 -3.8 -2.9Maximum difference (kip) 0.5 0.8 2.6
Average of absolute differences (kip) 1.9 1.6 1.3
Table 3.8. Load Bearing Capacity Estimates for Sections on Sandy Subgrade. Load Bearing Capacity (kip) Difference from 50-mil Reference (kip) Section 50-mil Case I Case II Case III Case I Case II Case III
G1S_6 12.6 4.6 12.1 12.5 -8 -0.5 -0.1G2S_6 11.5 4.6 10.1 10.3 -6.9 -1.4 -1.2CAS_6 11.5 4.6 9.6 10.2 -6.9 -1.9 -1.3UGS_6 10 4.6 11.8 12.1 -5.4 1.8 2.1SSS_6 18.5 4.6 15 15.3 -13.9 -3.5 -3.2G1S_12 20 18.2 19.5 20 -1.8 -0.5 0.0G2S_12 12.5 18.2 11.8 12.5 5.7 -0.7 0.0CAS_12 21.8 18.2 17 17.3 -3.6 -4.8 -4.5UGS_12 6.5 18.2 11.2 11.3 11.7 4.7 4.8SSS_12 12.3 18.2 13 13.5 5.9 0.7 1.2
Average difference (kip) -2.3 -0.6 -0.2Minimum difference (kip) -13.9 -4.8 -4.5Maximum difference (kip) 11.7 4.7 4.8
Average of absolute differences (kip) 7.0 2.1 1.8

39
Table 3.9. Load Bearing Capacity Estimates for Stabilized Sections. Load Bearing Capacity (kip) Difference from 50-mil Reference (kip) Section 50-mil Case I Case II Case III Case I Case II Case III
6B 27.5 1 5.4 27.1 -26.5 -22.1 -0.47B 20 1 4 22.7 -19 -16 2.78B 12.5 1 1.5 8.5 -11.5 -11 -49B 13.3 2.5 2.7 15.6 -10.8 -10.6 2.3
10B 17 4.2 3 18.1 -12.8 -14 1.111B 14.5 36 20.6 21 21.5 6.1 6.512B 17.5 13 17.2 17.4 -4.5 -0.3 -0.113B 21 4.6 13.8 14.3 -16.4 -7.2 -6.714B 42.6 4.6 39 39.7 -38 -3.6 -2.915B 44.3 4.6 50 50 -39.7 5.7 5.7
Average difference (kip) -15.8 -7.3 0.4Minimum difference (kip) -39.7 -22.1 -6.7Maximum difference (kip) 21.5 6.1 6.5
Average of absolute differences (kip) 20.1 9.7 3.2
Figure 3.6. Differences between Case I, Case II, and Case III Load Bearing Capacity
Estimates and 50-mil Reference Loads on Clay Subgrade Sections.

40
Figure 3.7. Differences between Case I, Case II, and Case III Load Bearing Capacity
Estimates and 50-mil Reference Loads on Sandy Subgrade Sections.
Figure 3.8. Differences between Case I, Case II, and Case III Load Bearing Capacity
Estimates and 50-mil Reference Loads on Stabilized Sections.

41
• Overall, Figures 3.6 to 3.8 show that Case III exhibits the best agreement with the 50-
mil reference loads. The differences associated with Case III are observed to plot
closest to zero for most of the sections tested.
• For the flexible base sections built on clay subgrade, the Case III analysis gave the
best agreement with the reference values on all but two of the sections, SSC_12 and
G2C_12, where the estimates are higher than the reference loads by 2.6 and 1.7 kips,
respectively (Table 3.7). On the 6-inch flexible base sections, Figure 3.6 shows that
Case III gave the best results among the three methods.
• For the same clay subgrade, Figure 3.8 also shows that Case III gave the best
agreement with the 50-mil reference loads on the stabilized sections.
• In general, Figures 3.6 to 3.8 show that Case I and Case II gave similar estimates of
load bearing capacity on the clay subgrade sections. On the sandy subgrade sections,
the estimates from Case II and Case III are more comparable. These observations
apply to both the flexible base and stabilized sections.
The last bullet item reflects the effect of soil suction on the bearing capacity
predictions. As explained in the beginning of this chapter, changes in soil moisture affect the
strength properties of soils in accordance with the soil-water characteristic curve. For the
clay and sandy subgrade materials investigated in this project, the soil-water characteristic
curves are shown in Figures 3.3 and 3.4, respectively. Given these curves and the soil
moisture contents corresponding to the laboratory and field test conditions, researchers
predicted the change in soil suction with change in moisture content for each material.
Table 3.10 shows the results of this analysis using the LoadGage program. This table
shows the moisture contents of the triaxial soil specimens as well as the subgrade materials at
the times researchers performed the plate bearing tests on the full-scale field sections. At the
measured moisture contents, researchers predicted the corresponding soil suction levels using
the soil-water characteristic curves of the clay and sandy subgrade soils. Note the wider
range in the predicted soil suctions and strength properties for the clay material compared to
the sandy subgrade. Table 3.10 explains why the Case II and Case III analyses show more
differences in bearing capacity estimates on the clay subgrade sections (where the effect of
moisture change is more pronounced), and closer predictions on the sandy subgrade sections,
where the effect of moisture is less significant.

42
Table 3.10. Variation of Soil Suction and Strength Properties with Moisture Content. Strength properties
Subgrade Test Gravimetric
moisture content (%)
Soil suction (psi) Cohesion
(psi)
Friction angle
(degree) Triaxial test 25 2.2 1.7 10.3Plate bearing (flexible base sections)
22 11.3 2.9 7.3Clay
Plate bearing (stabilized sections) 17.4 74.6 11.3 3.9
Triaxial test 12.3 0.1 6 32.8
Sand Plate bearing (flexible base and stabilized sections)
7 1.5 6.1 32.8
It is worth noting the similarity in the Case I and Case II predictions on the flexible
base sections at the clay site (Table 3.7). Of the three methods, Case I and Case II are
conceptually, the most similar in terms of the underlying theory used for computing load
induced stresses, and the characterization of the Mohr-Coulomb failure envelope based on
triaxial test data obtained in accordance with Test Method Tex-117E on moisture-
conditioned specimens. However, on the sandy subgrade sections, Case I and Case II show
more differences in load bearing capacity predictions. In the opinion of the authors, the
differences observed are due to the approximate nature of the existing triaxial design method
(Case I), which characterizes the strength of a given material in terms of the Texas triaxial
class in lieu of c and φ. Note that a given Texas triaxial class can correspond to a range of
failure envelopes defined by different cohesions and friction angles. In contrast, the Case II
analysis is based on the specific c and φ parameters determined from triaxial tests on a given
material. Another likely reason for the observed differences is that the existing thickness
design curves in Test Method Tex-117E are based on certain assumptions regarding the
variation of modular ratios with pavement depth. To the extent that the assumed modular
ratios are in variance with ratios of the layer moduli specified in a Case II analysis,
differences in predictions of load induced pavement stresses and the resulting bearing
capacity estimates will arise. In the researchers’ opinion, the Case II analysis represents a
more refined method of evaluating pavement load bearing capacity compared to the existing
thickness design curves, which are approximate in nature due to the assumptions made in

43
their development. The reader is referred to the review conducted by Fernando, Oh, Estakhri,
and Nazarian (2007) for a detailed discussion of the development of these curves.
Based on the results presented in Tables 3.7 to 3.9, the Case II analysis appears to be
more appropriate for assessment of pavement load bearing capacity compared to Case I. On
the flexible base sections at the clay site, the authors consider the Case I and Case II
predictions to be comparable, with the Case II predictions showing slightly better agreement
with the 50-mil reference loads on the 6-inch sections. However, on the sandy subgrade and
stabilized sections, the Case II predictions show better agreement with the reference loads
compared to Case I, where the load bearing capacity estimates are quite conservative for the
majority of the sections, particularly the 6-inch flexible base sections on the sandy subgrade
(Table 3.8), and the stabilized sections (Table 3.9).
While the Case I results are generally the most conservative relative to the reference
load bearing capacities corresponding to the 50-mil limiting permanent displacement
criterion, there are four sections, SSS_12, UGS_12, G2S_12, and 11B (thick HMAC section
on sandy subgrade) where the Case I predictions are higher than the 50-mil reference loads
and the corresponding Case II and Case III load bearing capacity predictions. Based on the
plate bearing test data, researchers estimated the permanent displacements associated with
the Case I predictions on these sections to be 64, 120, 72, and 136 mils, respectively. On two
of the three sandy subgrade sections (SSS_12, and G2S_12), the Case II and Case III
predictions are significantly lower than the Case I allowable loads, and closer to the
pavement load bearing capacities corresponding to the 50-mil permanent displacement
tolerance.
Comparing the Case II predictions with those from Case III, the authors note the
following observations from the results presented in Tables 3.7 to 3.9:
• The Case III analysis with moisture correction of the failure envelope parameters
generally gave predictions that are closer to the reference loads corresponding to the
50-mil permanent displacement tolerance for flexible base sections on clay (in
particular, the 6-inch sections).
• For the flexible base sections on sand, the Case II and Case III analyses gave similar
results, with Case III being slightly better, in the authors’ opinion. The Case I
predictions significantly underestimate the 50-mil reference loads on the 6-inch
flexible base sections at the sand site, and significantly overestimate the reference

44
loads on three of the five 12-inch flexible base sections, SSS_12, UGS_12 and
G2S_12. On these sections, the estimated permanent displacements associated with
the Case I predictions are 64, 120, and 72 mils, respectively.
• On the stabilized sections, the Case I and Case II predictions are quite conservative
for the sections built on clay (Table 3.9). For these stabilized sections, the Case III
results are better in the researchers’ opinion. For the stabilized sections built on sand,
the Case II and Case III analyses gave similar results. The Case I predictions for the
stabilized sections are generally too conservative, with the exception of the thick
HMAC section on the sandy subgrade, where Case I significantly overestimates the
50-mil reference load.
Considering the above findings, the authors offer the following recommendations with
respect to revising the existing triaxial design check done in accordance with Tex-117E:
• The researchers recommend using a Case II analysis for thin-surfaced roads with
flexible base and no stabilized layers.
• For design of pavement sections with stabilized materials, the researchers recommend
using a Case III analysis for roadways underlain by fine-grained soils such as clays
and silts. For stabilized sections founded on coarse-grained materials such as sandy
soils and gravels, the researchers recommend a Case II analysis.
The results of the evaluation presented herein demonstrated the influence that soil
moisture can have on subgrade strength properties and the predicted load bearing capacity.
In view of this finding, the researchers recommend that the engineer consider running a
Case III analysis to check the Case II analysis results on thin-surfaced roads with flexible
base and no stabilized layers. This check is particularly recommended on thin-surfaced roads
founded on moisture-susceptible fine-grained soils, i.e., clays and silts. On projects (such as
in west Texas) where the expected in-service soil moisture content might be drier than the
moisture content corresponding to the Texas triaxial class or subgrade failure envelope based
on Tex-117E, running a Case III analysis would give the engineer an indication of the factor
of safety associated with the Case II analysis. On the other hand, if the subgrade failure
envelope corresponds to a different moisture content (such as the optimum condition
proposed in Tex-143E), and the expected in-service moisture content is higher than the value
used for triaxial testing, the researchers recommend a Case III analysis (in lieu of Case II) to
check the FPS design on thin-surfaced pavements founded on moisture-susceptible soils.

45
This analysis would permit the engineer to consider the potential reduction in load bearing
capacity arising from a wetter soil condition.
EVALUATION OF LOAD BEARING CAPACITY BASED ON UTEP DATA FROM TESTS ON SMALL-SCALE PAVEMENT MODELS The University of Texas at El Paso carried out laboratory plate bearing tests on small-
scale pavement models during this project. UTEP researchers conducted these tests on
models fabricated with the same base and subgrade materials used for construction of the
full-scale pavement sections tested at the Texas A&M Riverside Campus. The fabrication of
these models and the setup used for the laboratory plate bearing tests are documented in
research report 0-4519-1 by Fernando, Oh, Estakhri, and Nazarian (2007).
Small-scale pavement tests provided researchers the opportunity to study the effects
of moisture on load bearing capacity under controlled laboratory conditions. As described in
research report 0-4519-1, UTEP fabricated small-scale pavement models and ran plate
bearing tests at three different moisture conditions. Moisture conditioning was achieved by
adding water in stages, carefully measuring the amount of water added to the small-scale
model so that the bulk moisture content of the soil in the tank could be calculated during
moisture conditioning. UTEP researchers tested each model at three different times
corresponding to:
• three days after model fabrication (representing optimum condition),
• after moisture conditioning of the subgrade, and
• after moisture conditioning of the base and subgrade.
For the second item, the moisture conditioning was considered complete after the resistance
from the resistivity probes became constant for about 48 hours. For the third item, moisture
conditioning was terminated when either the small-scale model would not absorb moisture as
judged by the volume of water in the container supplying moisture to the model, or when the
surface of the model was completely moist. Tables 3.11 and 3.12 show the moisture contents
of the small-scale models as determined by UTEP from their tests. It is observed that the
clay and caliche materials exhibited significant changes in moisture content as the models
underwent moisture conditioning as compared to the other materials.

46
Table 3.11. Measured Moisture Contents of Subgrade Soils from Tests on Small-Scale Pavement Models.
Small-Scale Pavement Model Subgrade Soil Moisture Content (%)
Subgrade Material Base Material Optimum After Moisture Conditioning
Caliche 10.6 14.7 Grade 1 Crushed Limestone 11.6 14.8 Grade 2 Crushed Limestone 10.7 15.2 Sandstone 10.1 14.7
Sandy
Uncrushed Gravel 11.3 13.5 Caliche 18.3 32.7 Grade 1 Crushed Limestone 20.5 29.4 Grade 2 Crushed Limestone 16.9 28.9 Sandstone 15.0 32.9
Clay
Uncrushed Gravel 17.4 26.6
Table 3.12. Measured Moisture Contents of Base Materials from Tests on Small-Scale Pavement Models.
Base Moisture Content (%) Crushed Limestone Subgrade
Material Model Condition Caliche Grade 1 Grade 2 Sandstone Uncrushed Gravel
Optimum 13.2 7.5 6.1 6.1 7.0 Moisture-Conditioned Subgrade 19.0 9.8 6.4 6.2 8.1 Sandy Moisture-Conditioned Base/Subgrade 21.1 10.7 7.3 7.6 9.2
Optimum 11.6 7.7 7.7 6.2 6.1 Moisture-Conditioned Subgrade 19.0 9.4 8.7 7.4 6.3 Clay Moisture-Conditioned Base/Subgrade. 21.3 9.9 8.9 9.5 8.8
Similar to the analysis of data from full-scale plate bearing tests, researchers
determined the loads corresponding to a permanent displacement of 50 mils using the data
from small-scale pavement tests conducted at UTEP. Figures 3.9 and 3.10 show the results
from these calculations. For comparison, laboratory equivalent values of allowable loads
based on the current triaxial design curves are also shown on the charts. These values were
determined by dividing the Tex-117E allowable loads by four, corresponding to the ratio of
the loaded areas between full-scale and small-scale testing, following similitude rules.

47
Figure 3.9. Variation of Load Bearing Capacity with Moisture Condition from Small-
Scale Tests of Models with Base Materials on Clay.
Figure 3.10. Variation of Load Bearing Capacity with Moisture Condition from Small-
Scale Tests of Models with Base Materials on Sandy Subgrade.

48
Figure 3.9 shows drastic reductions in load bearing capacity between the optimum
moisture condition and after moisture conditioning of the subgrade for small-scale models
where the base materials are placed on clay. On the sand specimens, the reductions in load
bearing capacity are not as dramatic (see Figure 3.10), reflecting lesser susceptibility to
moisture of the sandy subgrade material compared to the clay. It is interesting to note that
the laboratory equivalent Tex-117E loads are more comparable with the results from tests
after the base and subgrade are moisture conditioned, particularly for the clay specimens.
This observation reflects the high degree of conservatism in the current test method. In the
authors’ opinion, the observed differences in the load bearing capacities at various moisture
conditions suggest the need to properly account for these effects in the existing triaxial
design method, considering the range of climatic and soil conditions found across the state.
Researchers used the UTEP data to verify the moisture correction procedure
presented earlier in this chapter. Given the soil suction curves as well as the strength
properties (cohesion and friction angle) of the clay and sandy materials from Tex-117E
triaxial testing, researchers applied the moisture correction procedure (Case III analysis) to
adjust the strength properties determined to values corresponding to the optimum moisture
contents at which plate bearing tests were conducted on small-scale pavement models.
Researchers then used the corrected properties to predict load bearing capacity and compared
the predictions with the allowable loads corresponding to a permanent displacement of 50
mils from the plate bearing test data.
Resilient modulus data for this evaluation were obtained from laboratory resilient
modulus tests conducted at UTEP on the five flexible base materials and two subgrade soils
used for fabricating the small-scale pavement models. Based on the test data collected for a
given material, researchers characterized its modulus as stress-dependent according to the
following relationship proposed by Uzan (1985):
32
11
K
a
oct
K
aaR PP
IPKM ⎟⎟
⎠
⎞⎜⎜⎝
⎛⎟⎟⎠
⎞⎜⎜⎝
⎛=
τ (3.11)
where,
MR = resilient modulus,
Pa = atmospheric pressure (14.5 psi),
I1 = first stress invariant,

49
τoct = octahedral shear stress, and
K1, K2, K3 = stress-dependent material coefficients.
Researchers fitted the above model to the resilient modulus data to determine the stress-
dependent material coefficients for each material. Table 3.13 gives these coefficients for the
two conditions (optimum and after moisture conditioning) at which tests were conducted.
Figure 3.11 compares the predicted load bearing capacities with the corresponding
allowable loads based on the 50-mil limiting permanent displacement criterion. In the
analyses, materials were characterized as stress-dependent using the corresponding K1, K2,
and K3 coefficients in the LoadGage program. The results from the Case III analysis (with
moisture correction) show that the predicted load bearing capacities compare reasonably with
the allowable loads corresponding to the 50-mil permanent displacement criterion,
particularly for the sand specimens. However, the predictions tend to be conservative,
particularly for the clay models where the average of the differences between the predicted
and reference allowable loads is -1 kip. For the sand specimens, the average difference is -
0.34 kip. These differences can arise because of measurement errors during testing, errors in
modeling the response of the small-scale pavement models, and other unexplained or
unaccounted sources of variation. While the predictions reflect some conservatism,
researchers note that even more conservative estimates would have been determined had the
moisture condition of the subgrade soil not been considered in the analysis, as is presently the
case in practice. The proposed moisture correction procedure provides engineers the option
to consider the effect of moisture on load bearing capacity in the triaxial design check. In the
authors’ opinion, the results from this limited laboratory evaluation verified that the
procedure gave reasonable predictions that are in accord with the expected change in load
bearing capacity as the soil moisture condition changes from wet (corresponding to Tex-
117E moisture conditioning) to optimum.

50
Table 3.13. Resilient Modulus Parameters of Base and Subgrade Materials. Base Material Subgrade Material
Limestone Test Condition Parameter Caliche Gr. 1 Gr. 2 Sandstone Uncr. Gravel Sand Clay
K1 2434 3423 657 1901 669 919 1927K2 -0.2 0.35 0.7 0.35 0.7 0.60 0.0K3 -0.2 -0.2 -0.3 -0.1 -0.6 0.0 -0.1Optimum
R2 0.91 0.89 0.94 0.91 0.91 0.86 0.97K1 281 1699 367 2196 490 437 2916K2 0.5 0.20 0.5 0.0 1.0 1.0 0.9K3 -0.4 -0.11 -0.3 0.2 -0.5 -0.24 0.8
After moisture
conditioning R2 0.99 0.97 0.90 0.96 0.94 0.81 0.93
Figure 3.11. Comparison of Load Bearing Capacity Predictions Corresponding to Optimum Moisture Conditions for Small-Scale Models Built using Clay and Sandy
Subgrade Soils.

51
CHAPTER IV. EVALUATION OF EXPECTED IN-SERVICE SOIL MOISTURE CONTENTS
INTRODUCTION
To support implementation of the revised methodology incorporated in LoadGage for
conducting a triaxial design check on FPS pavement designs, researchers compiled a
database of soil characteristics covering all 254 Texas counties. For each county, the
database includes information on Texas triaxial classifications, soil water characteristic
curves, and expected in-service soil moisture contents. To compile this comprehensive
database, researchers first reviewed published county soil survey reports to identify the
different soils (based on the Unified Soil Classification system) found in a given county.
This review identified the predominant soils from the acreage information given in the soil
survey reports. Once the soil types were established, researchers undertook the task of
compiling data on soil characteristics that are needed to run a triaxial design check using
LoadGage. The intent was to compile information that the engineer can use at his or her
discretion in the absence of site-specific data for a given analysis. For the most part, this task
consisted of finding and compiling published information. However, the development of the
database also included analyses of the expected in-service moisture content by soil type and
climatic region. These analyses were done in order to provide information useful for
moisture correction should the engineer decide to take this option. The expected in-service
soil moisture contents were evaluated using a comprehensive model of climatic effects
initially developed by Lytton et al. (1990) for the Federal Highway Administration.
Researchers used an updated version of this model, referred to as the Enhanced Integrated
Climatic Model (EICM), to evaluate expected soil moisture contents in this project. The
present chapter describes this evaluation, which was done as part of developing the soils
database in the LoadGage program.
COMPILATION OF DATA FOR SOIL MOISTURE PREDICTION
Climatic data collected in this project included air temperatures, precipitation, relative
humidity, and Thornthwaite moisture index. Researchers used these variables to characterize
the state into climatic regions as documented in Chapter II of this report. In addition,
representative Texas triaxial classifications, soil-water characteristic curves, and soil
permeability characteristics were compiled for the different soil types identified in each

52
county. For this task, the project director provided researchers with an electronic spreadsheet
of Texas triaxial classifications by soil series, which were compiled over the years from
triaxial tests conducted by TxDOT. Researchers used this information to assign
representative Texas triaxial classifications for the different soil types identified by county.
Similarly, soil suction and permeability characteristics (Tables A3 and A4) were established
from published information given by Mason et al. (1986) and Lytton et al. (1990), and from
data on soil suction tests conducted at the Texas Transportation Institute (TTI) during this
project.
Having compiled a statewide database on climatic and soil characteristics, researchers
used EICM to evaluate expected soil moisture content variations for a representative range of
pavements found in Texas (Oh et al., 2006). For this purpose, TxDOT provided information
on pavement geometric characteristics (structural layers and thicknesses) as well as material
types characterizing typical pavement structures found in the different Texas climatic regions.
Figure 4.1 illustrates typical cross-sections of Farm-to-Market roads considered in this
evaluation. Researchers focused on FM roads because these roads are expected to be the
most susceptible to moisture and environmental effects because of the types of materials used
and the relatively thinner layer thicknesses in comparison to Interstate, U.S., or state
highways. In addition, researchers obtained data through a web search on groundwater table
depths in Texas (National Water Information System, 2006). This parameter significantly
affects the moisture content predictions, and hence, the equilibrium modulus values of the
underlying pavement layers. The groundwater table is used to calculate lower boundary
suction for the entire day. Lower boundary suction data represents the position of the water
table. If the water table is at the bottom of the soil profile, the value of lower boundary
suction is set to zero at that location or node in the EICM program. If the water table is
higher than the bottom node of the soil profile, a positive value for suction is used based on
the hydrostatic pressure (Larson and Dempsey, 1997). If the water table is beneath the
bottom node, the user should input the current suction at that node, which is computed as a
negative hydrostatic pressure.
Previous research has found that, in arid climates, if the water table exists within a
depth of 30 ft below the pavement surface, it will dominate the moisture conditions in the
subgrade (Lytton et al., 1990). In this case, the suction profiles are calculated using
hydrostatic pressure. Where the water table is below 30 ft, moisture movement will largely

53
Figure 4.1. Typical Pavement Structures for FM Roads in Different Climatic Regions.
be controlled by unsaturated flow theory. For these conditions, the Thornthwaite moisture
index may be used to predict the equilibrium soil suction value at the bottom node of the
pavement for the purpose of estimating the initial soil suction profile that is an input to EICM.
This profile affects the predicted moisture variations in the pavement layers. Researchers
used the following equation by Lytton, Aubeny, and Bulut (2004) to predict the equilibrium
soil suction value under unsaturated conditions:
U eeTMI= −35633 0 0051. . (4.1)

54
where Ue is the equilibrium boundary suction at the bottom node. Once this parameter was
determined, researchers computed the suction profile from the bottom node to the top of the
base using the WinPRES (Windows™ version of Pavement Roughness in Expansive Soils)
program by Lytton, Aubeny, and Bulut (2004). The internal boundary condition in EICM
determines how moisture enters the subgrade. For this analysis, the assumption was made
that the subgrade receives most of the water from suction induced by the groundwater table.
Figure 4.2 illustrates initial suction profiles predicted by WinPRES for two different
climatic-soil conditions representing a dry region (El Paso County) and a wet region (Brazos
County). As shown, the program computes two suction profiles for a given analysis — one
representing a drying condition, and the other representing a wetting condition. The suction
profile for Brazos County indicates a wetter condition as reflected in the lower equilibrium
suction value of about 3.7 pF for the bottom node. Researchers used the initial suction
profiles corresponding to a wetting condition in the verification of the EICM program that is
presented subsequently.
VERIFICATION OF THE EICM PROGRAM
Prior to predicting soil moisture contents using EICM, researchers verified the
program by comparing its predictions with field measurements. For this verification,
researchers used Long Term Pavement Performance (LTPP) seasonal monitoring data on
field moisture content measured by Time Domain Reflectometry (TDR) probes installed at
different depths on Texas LTPP seasonal monitoring sites. Figure 4.3 shows the results from
one verification conducted by researchers using LTPP data from test sections located at six
different Texas counties. For these analyses, soil suction and permeability characteristics for
the soils found at the LTPP sites were obtained from the database compiled by researchers.
These properties were used in EICM along with the climatic data compiled for the six
counties to predict subgrade moisture contents at the LTPP sites. It is observed that the
predicted subgrade moisture contents from EICM compare favorably with the TDR
measurements.
Another verification involved the application of EICM to predict the moisture
contents at different depths of an in-service flexible pavement section located along the
northbound lane of US77 near Victoria, Texas. This section consisted of a 7.5-inch hot-mix
asphalt layer, 12 inches of crushed stone base, and 6 inches of lime-stabilized subbase
overlying a silty sand subgrade. Researchers used the soils and climatic data compiled in this

55
Figure 4.2. Comparison of Predicted Initial Soil Suction Profiles for Counties with
Different Climates.
Figure 4.3. Comparison of EICM Predictions with TDR Measurements from LTPP
Test Sections Located in Different Counties.

56
project to verify the EICM program on this Victoria test section. Figure 4.4 compares the
soil moisture contents predicted at different depths with the corresponding measurements
from TDR probes buried under the section. Once more, the predictions compare reasonably
with the TDR measurements, in the authors’ opinion.
Researchers also used the EICM program to predict the soil moisture variations on a
flexible pavement test section located along SH48 in Brownsville. TTI staff instrumented
this test section with multi-depth deflectometers, thermocouples, and TDR probes on another
TxDOT project that evaluated the effects of routine overweight truck traffic on pavement life
(Fernando, et al., 2006). Figure 4.5 shows the average of monthly moisture contents
measured with the TDR probes placed in the base layer. It is observed that the average of the
predicted moisture contents from EICM compare favorably with the average of the TDR
measurements.
PREDICTION OF EXPECTED SOIL MOISTURE CONTENTS
Given the reasonable results from the verifications performed on EICM, researchers
used the program to predict expected in-service subgrade moisture contents for the range of
pavements and climatic-soil conditions considered in this project. Figure 4.6 illustrates
predicted gravimetric subgrade moisture contents for the different Texas climatic-soil regions
presented in Chapter II. For comparison purposes, the plastic limits (PLs) obtained from
county soil survey reports are also shown. The range of in-situ moisture contents may be
estimated as PL ± 3 percent. In Figure 4.6, the tick marks represent the high and low limits
of the range of in situ moisture contents estimated from the plastic limits. The dots denote
the predictions from EICM. On the basis of the plastic limits reported for different soils, the
predicted gravimetric moisture contents appear to be reasonable, and plot within the range of
in situ moisture contents estimated from the plastic limits.
The results given in Figure 4.6 are based on the representative soil suction and
permeability characteristics for a given soil region and the corresponding climatic conditions.
For developing the database of soil characteristics, researchers took a more comprehensive
approach wherein EICM was used to predict expected in-service soil moisture contents for
the different soil types found in each county, and for the range of pavements and climatic
conditions considered in this evaluation. Researchers used the predictions from EICM to
group counties into regions and developed the color-coded map shown in Figure 4.7 based on
the predicted soil moisture contents for the predominant soils found in the different counties.

57
Figure 4.4. Comparison of EICM Predictions with TDR Measurements at Different
Depths on Victoria Flexible Pavement Section.
Figure 4.5. Comparison of EICM Predictions with TDR Measurements from Base
Layer of Flexible Pavement Test Section in Brownsville.

58
Figure 4.6. Comparison of Predicted Subgrade Moisture Contents from EICM with
Estimates Based on Soil Plastic Limits.

59
Figure 4.7 Map Showing Variation of Expected Soil Moisture Contents across Texas.


61
CHAPTER V. SUMMARY OF FINDINGS AND RECOMMENDATIONS The major objectives of this project were to verify the load-thickness design chart in
Test Method Tex-117E and to develop a methodology that accounts for variations in climatic
and soil conditions in the triaxial design check of pavement designs from TxDOT’s FPS
program. To carry out this investigation, researchers executed a comprehensive work plan
that included:
• a literature review of the modified Texas triaxial design method,
• development and execution of a plan to verify the load-thickness design curves based
on testing full-scale field sections and small-scale pavement models,
• investigation of the correspondence between small-scale and full-scale pavement test
results,
• analysis of plate bearing test data to evaluate the deformation response of field sections
and small-scale laboratory specimens,
• assessment of the existing load-thickness design curves against plate bearing test
results,
• compilation of climatic and soils data on the counties comprising the state,
• investigation of the relationships between soil moisture and soil strength properties and
development of a procedure to correct strength properties to consider moisture effects
in the triaxial design check,
• evaluation of expected soil moisture contents using a comprehensive model of climatic
effects to support applications of the moisture correction procedure proposed in this
project for cases where the engineer deems that such corrections are appropriate, and
• development of a computerized method of triaxial design analysis that offers greater
versatility in modeling pavement systems and load configurations compared to the
limited range of approximate solutions represented in the existing thickness design
curves.
The findings from this project are documented in two research reports covering the
verification of the existing design method (0-4519-1) and the development of a methodology
to account for moisture effects and differences in moisture susceptibilities among soils in the
triaxial design check. This report documents the tasks conducted by researchers to improve
the existing design procedure by providing a more realistic method of modeling pavement

62
systems and load configurations in the analysis, and providing the option of correcting
strength properties for cases where such adjustments are deemed approriate. Based on the
research presented in this report, the following findings are noted:
• Three different methods of estimating load bearing capacity (Cases I, II, and III) were
evaluated using the plate bearing test data collected on full-scale pavement sections.
In this evaluation, researchers compared the load bearing capacity estimates on the
sections tested with the loads corresponding to a 50-mil permanent displacement
threshold. Overall, the predictions of load bearing capacity from Case III gave the
best agreement with the 50-mil reference loads. For the flexible base sections built
on clay subgrade, the Case III analysis gave the best agreement with the reference
values on all but two of the sections. For the same clay subgrade, Case III also gave
the best agreement with the 50-mil reference loads on the stabilized sections.
• In general, the analysis results show that Case I and Case II gave similar estimates of
load bearing capacity on the clay subgrade sections. On the sandy subgrade sections,
the estimates from Case II and Case III are more comparable. These observations
apply to both the flexible base and stabilized sections, and reflect the effect of soil
suction on the bearing capacity predictions. For moisture-susceptible soils, changes
in moisture content can have a significant influence on the load bearing capacity of
pavements founded on these soils.
• While Case I and Case II are conceptually the most similar of the three methods in
terms of the underlying theory used to compute load induced stresses and the
characterization of the failure envelope based on Test Method Tex-117E, it was
interesting to observe differences between the Case I and Case II predictions. In the
opinion of the authors, these differences are due to the approximate nature of the
existing triaxial design method (Case I), which characterizes the strength of a given
material in terms of the Texas triaxial class in lieu of the soil failure envelope
parameters that are directly used in the Case II and Case III analyses. Another likely
reason for the observed differences between Case I and Case II is that the existing
thickness design curves are based on certain assumptions regarding the variation of
modular ratios with pavement depth. To the extent that the assumed modular ratios
are in variance with ratios of the layer moduli specified in the Case II analysis,
differences in predictions of load induced stresses and the resulting allowable loads

63
will arise. In the researchers’ opinion, the Case II analysis represents a more refined
method of evaluating pavement load bearing capacity compared to the existing
thickness design curves, which are approximate in nature due to the assumptions
made in their development.
• Based on comparisons with the reference loads corresponding to the 50-mil permanent
displacement tolerance, the Case II analysis appears to be more appropriate for
assessment of pavement load bearing capacity compared to Case I. On the flexible
base sections at the clay site, the Case I and Case II predictions are generally
comparable, with the Case II predictions showing slightly better agreement with the
50-mil reference loads on the 6-inch sections. However, on the sandy subgrade and
stabilized sections, the Case II predictions show better agreement with the reference
loads compared to Case I, where the load bearing capacity estimates are quite
conservative for the majority of the sections, particularly the 6-inch flexible base
sections on the sandy subgrade, and the stabilized sections.
• While the Case I results are generally the most conservative, there are four sections,
SSS_12, UGS_12, G2S_12, and 11B (thick HMAC section on sandy subgrade), where
the Case I predictions are higher than the 50-mil allowable loads. Based on the plate
bearing test data, researchers estimated the permanent displacements associated with
the Case I predictions on these sections to be 64, 120, 72, and 136 mils, respectively.
On two of the three sandy subgrade sections (SSS_12, and G2S_12), the Case II and
Case III predictions are significantly lower than the Case I allowable loads, and are
closer to the pavement load bearing capacities corresponding to the 50-mil limiting
permanent displacement criterion.
• Comparing the Case II predictions with those from Case III, researchers observed that
the Case III analysis with moisture correction of the failure envelope parameters
generally gave predictions that are closer to the reference loads corresponding to the
50-mil limiting permanent displacement tolerance for flexible base sections on clay
(in particular, the 6-inch sections). For the flexible base sections on sand, the Case II
and Case III analyses gave similar results, with Case III being slightly better, in the
authors’ opinion.
• The Case I predictions significantly underestimate the 50-mil reference loads on the
6-inch flexible base sections at the sand site, and significantly overestimate the

64
reference loads on three of the five 12-inch flexible base sections, SSS_12, UGS_12
and G2S_12. On these sections, the estimated permanent displacements associated
with the Case I predictions are 64, 120, and 72 mils, respectively.
• On the stabilized sections, the Case I and Case II predictions are quite conservative for
the sections built on clay. For these stabilized sections, the Case III results are better
in the researchers’ opinion. For the stabilized sections built on sand, the Case II and
Case III analyses gave similar results. The Case I predictions for the stabilized
sections are generally too conservative, with the exception of the thick HMAC section
on the sandy subgrade, where Case I significantly overestimated the 50-mil reference
load.
• Small-scale tests carried out under different moisture conditions demonstrated the
detrimental impact of moisture on the deformation response of small-scale pavement
models fabricated with the same base and subgrade materials used on the full-scale
pavement sections tested in this project. In particular, test results showed drastic
reductions in load bearing capacity between the optimum moisture condition and after
moisture conditioning of the subgrade for small-scale models where the base materials
were placed on clay. On the sand specimens, the reductions in load bearing capacity
were not as dramatic, reflecting lesser susceptibility to moisture in the sandy subgrade
material compared to the clay.
• The verification of the moisture correction procedure (Case III analysis) using plate
bearing test data collected on small-scale pavement models showed that the predicted
load bearing capacities compare reasonably with the allowable loads corresponding to
the 50-mil permanent displacement tolerance, particularly for the small-scale
pavement models fabricated with the sandy subgrade material. However, the
predictions tend to be conservative, particularly for the clay models. While the
predictions reflect some conservatism, researchers note that even more conservative
estimates would have been determined had the moisture condition of the subgrade soil
not been considered in the analysis, as is presently the case in practice. In the authors’
opinion, the results from this limited laboratory evaluation verified that the procedure
gave reasonable predictions that are in accord with the expected change in load
bearing capacity as the soil moisture condition changes from wet (corresponding to
Tex-117E moisture conditioning) to optimum.

65
• Verification of the soil moisture predictions from EICM showed that this program
reasonably predicts the moisture contents measured with TDR probes on instrumented
pavement sections. Researchers used this program to predict subgrade moisture
contents for the different Texas climatic-soil regions and found the predictions to be
within the range of in situ moisture contents estimated from soil plastic limits obtained
from county soil survey reports reviewed in this project. In addition, the evaluation of
expected soil moisture contents revealed that the predictions from EICM approach
equilibrium values over time. This observation implies that the moisture content of
each underlying pavement layer can be expected to reach equilibrium some time after
initial construction and that a representative moisture content value may be
recommended for the purpose of pavement design.
Considering the findings from the investigations presented in this report, researchers offer the
following recommendations with respect to implementing the LoadGage program developed
from this project:
• The findings from field and laboratory tests conducted in this project verified the
conservatism in the existing design method that TxDOT engineers have previously
recognized. For the near term, researchers recommend that TxDOT consider dropping
the load adjustment factor of 1.3 when using the existing design method to check FPS
pavement designs. If an analysis of wheel load stresses under tandem axles is needed,
such an analysis can be accomplished more realistically with the LoadGage program,
which provides the capability for specifying a tandem axle configuration in the
analysis.
• Given the conservatism observed in the existing design method (Case I), and the
range in climatic and soil conditions found across Texas, there will be applications
where the engineer should use the more refined analysis offered by the LoadGage
program, even if simply to check the results from the existing triaxial design method.
Based on the findings from comparisons of the Case I, Case II, and Case III methods
of estimating load bearing capacity, researchers recommend the following:
For thin-surfaced roads with flexible base and no stabilized layers, use a
Case II analysis with subgrade strength properties (cohesion and friction
angle) determined from triaxial tests based on Tex-117E. Since moisture
correction is not done in Case II, this approach would tend to produce

66
conservative results for design checks on thin-surfaced roads founded on
moisture-susceptible soils where the expected in-service moisture content is
drier than the moisture content associated with the soil strength properties
from Tex-117E triaxial tests. However, for design problems where the soil
failure envelope corresponds to a different moisture content (such as the
optimum condition proposed in Tex-143E), and the in-service moisture
content is expected to be higher than the value used for triaxial testing, the
researchers recommend a Case III analysis (in lieu of Case II) to check the
FPS design on thin-surfaced pavements founded on moisture-susceptible soils.
This analysis would permit the engineer to consider the potential reduction in
load bearing capacity arising from a wetter soil condition.
For design of pavement sections with stabilized materials, use a Case III
analysis for roadways underlain by fine-grained soils such as clays and silts.
For stabilized sections founded on coarse-grained materials such as sandy
soils and gravels, use Case II.
The authors recommend an implementation project to provide a phased transition from
the current triaxial design check to the LoadGage program developed from this project. For
implementation, researchers recommend integrating LoadGage into TxDOT’s flexible
pavement system program. The implementation project should include a LoadGage training
course to provide users with the necessary information to properly use the program in
practical applications. As implementation proceeds, pavement design engineers are
encouraged to run LoadGage side-by-side with the existing modified triaxial design method to
assess the potential impact of implementing the program in their Districts.

67
REFERENCES
Applied Research Associates. Guide for Mechanistic-Empirical Design of New and Rehabilitated Pavement Structures. Final Report, National Cooperative Highway Research Program Project 1-37A, Transportation Research Board, Washington, D.C., 2004. Bulut, R., R. L. Lytton, and W. K. Wray. Suction Measurements by Filter Paper. Expansive Clay Soils and Vegetative Influence on Shallow Foundations, ASCE Geotechnical Special Publication No. 115 (eds. C. Vipulanandan, M. B. Addison, and M. Hasen), American Society of Civil Engineers, Reston, VA, pp. 243-261, 2001. Fernando, E. G., W. Liu, T. Lee, and T. Scullion. The Texas Modified Triaxial (MTRX) Design Program. Research Report 1869-3, Texas Transportation Institute, The Texas A&M University System, College Station, TX, 2001. Fernando, E. G., S. Ramos, J. Oh, J. Ragsdale, Z. Xie, R. Atkins, and H. Taylor. Characterizing the Effects of Routine Overweight Truck Traffic on SH4/48. Research Report 0-4184-1, Texas Transportation Institute, The Texas A&M University System, College Station, TX, 2006. Fernando, E. G., J. Oh, and W. Liu. LoadGage User’s Manual. Product 0-4519-P3, Texas Transportation Institute, The Texas A&M University System, College Station, TX, 2007. Fernando, E. G., J. Oh, C. Estakhri, and S. Nazarian. Verification of the Load-Thickness Design Curves in the Modified Triaxial Design Method. Research Report 0-4519-1, Texas Transportation Institute, The Texas A&M University System, College Station, TX, 2007. Fredlund, D. G., and H. Rahardjo. Soil Mechanics for Unsaturated Soils. John Wiley & Sons, Inc., NY, 1993. Gardner, W. R. Some Steady State Solutions of the Unsaturated Moisture Flow Equation with Application of Evaporation from a Water Table. Soil Science, Vol. 85, pp. 223-232, 1958. Larson, G., and B. J. Dempsey. Enhanced Integrated Climatic Model Version 2.0, Final Report. Report No. DTFA MN/DOT 72114, University of Illinois at Urbana-Champaign, 1997. Lytton, R. L., C. P. Aubeny, and R. Bulut. Design Procedures for Pavements on Expansive Soils. Research Report 0-4518-1, Texas Transportation Institute, The Texas A&M University System, College Station, TX, 2004. Lytton, R. L., D. E. Pufahl, C. H. Michalak, H. S. Liang, and B. J. Dempsey. An Integrated Model of the Climatic Effects on Pavement. Report No. FHWA-RD-90-033, Texas Transportation Institute, The Texas A&M University System, College Station, TX, 1990.

68
Mason, J. G., C. W. Ollayos, G. L. Guymon, and R. L. Berg. User’s Guide for the Mathematical Model of Frost Heave and Thaw Settlement in Pavements. Cold Regions Research Engineering Laboratory, Hanover, NH, 1986. Michalak, C. H., and T. Scullion. MODULUS 5.0: User’s Manual. Research Report 1987-1, Texas Transportation Institute, The Texas A&M University System, College Station, TX, 1995. National Water Information System. USGS Ground-Water Data for the Nation. http://nwis.waterdata.usgs.gov/nwis/gw, accessed June 22, 2006. Oh, J., D. Ryu, E. G. Fernando, and R. L. Lytton. Estimation of Expected Moisture Contents for Pavements by Environmental and Soil Characteristics. Transportation Research Record, Journal of the Transportation Research Board, No. 1967, Transportation Research Board, Washington, D.C., pp. 135-147, 2006. Titus-Glover, L., and E. G. Fernando. Evaluation of Pavement Base and Subgrade Material Properties and Test Procedures. Research Report 1335-2, Texas Transportation Institute, The Texas A&M University System, College Station, TX, 1995. Uzan, J. Granular Material Characterization. Transportation Research Record 1022, Transportation Research Board, Washington, D.C., pp. 52-59, 1985.

69
APPENDIX A. DATA FOR CHARACTERIZING CLIMATIC AND SOIL VARIATIONS
ACROSS TEXAS


71
Figure A1. Variation in Daily Temperature Drops (°F) across Texas Counties
(identified by corresponding county numbers on map).

72
Figure A2. Variation in Mean Air Temperatures (°F) across Texas Counties (identified
by corresponding county numbers on map).

73
Figure A3. Variation in Mean Precipitations across Texas Counties (identified by corresponding county numbers on map).

74
Figure A4. Variation in Maximum Relative Humidities across Texas Counties (identified by corresponding county numbers on map).

75
Figure A5. Variation in Minimum Relative Humidities across Texas Counties (identified by corresponding county numbers on map).

76
Figure A6. Variation in Thornthwaite Moisture Indices across Texas Counties (identified by corresponding county numbers on map).

77
Table A1. TxDOT List of Districts and Counties. DISTRICT 1 (Paris) 60 Delta 75 Fannin 81 Franklin 92 Grayson 113 Hopkins 117 Hunt 139 Lamar 190 Rains 194 Red River DISTRICT 2 (Fort Worth) 73 Erath 112 Hood 120 Jack 127 Johnson 182 Palo Pinto 184 Parker 213 Somervell 220 Tarrant 249 Wise DISTRICT 3 (Wichita Falls) 5 Archer 12 Baylor 39 Clay 49 Cook 169 Montague 224 Throckmorton 243 Wichita 244 Wilbarger 252 Young DISTRICT 4 (Amarillo) 6 Armstrong 33 Carson 56 Dallam 59 Deaf Smith 91 Gray 99 Hansford 104 Hartley 107 Hemphill 118 Hutchinson 148 Lipscomb 171 Moore 179 Ochiltree 180 Oldham 188 Potter 191 Randall 197 Roberts 211 Sherman DISTRICT 5 (Lubbock) 9 Bailey 35 Castro 40 Cochran 54 Crosby 58 Dawson 78 Floyd 84 Gaines 86 Garza 96 Hale 111 Hockley 140 Lamb 152 Lubbock 153 Lynn 185 Parmer 219 Swisher 223 Terry 251 Yoakum
DISTRICT 6 (Odessa) 2 Andrews 52 Crane 69 Ector 151 Loving 156 Martin 165 Midland 186 Pecos 195 Reeves 222 Terrell 231 Upton 238 Ward 248 Winkler DISTRICT 7 (San Angelo) 41 Coke 48 Concho 53 Crockett 70 Edwards 88 Glasscock 119 Irion 134 Kimble 164 Menard 192 Reagan 193 Real 200 Runnels 207 Schleicher 216 Sterling 218 Sutton 226 Tom Green DISTRICT 8 (Abilene) 17 Borden 30 Callahan 77 Fisher 105 Haskell 115 Howard 128 Jones 132 Kent 168 Mitchell 177 Nolan 208 Scurry 209 Shackelford 217 Stonewall 221 Taylor DISTRICT 9 (Waco) 14 Bell 18 Bosque 50 Coryell 74 Falls 98 Hamilton 110 Hill 147 Limestone 161 McLennan DISTRICT 10 (Tyler) 1 Anderson 37 Cherokee 93 Gregg 108 Henderson 201 Rusk 212 Smith 234 Van Zandt 250 Wood
DISTRICT 11 (Lufkin) 3 Angelina 114 Houston 174 Nacogdoches 187 Polk 202 Sabine 203 San Augustine 204 San Jacinto 210 Shelby 228 Trinity DISTRICT 12 (Houston) 20 Brazoria 80 Fort Bend 85 Galveston 102 Harris 170 Montgomery 237 Waller DISTRICT 13 (Yoakum) 8 Austin 29 Calhoun 45 Colorado 62 DeWitt 76 Fayette 90 Gonzales 121 Jackson 143 Lavaca 158 Matagorda 235 Victoria 241 Warton DISTRICT 14 (Austin) 11 Bastrop 16 Blanco 27 Burnett 28 Caldwell 87 Gillespie 106 Hays 144 Lee 150 Llano 157 Mason 227 Travis 246 Williamson DISTRICT 15 (San Antonio) 7 Atascosa 10 Bandera 15 Bexar 46 Comal 83 Frio 95 Guadalupe 131 Kendall 133 Kerr 162 McMullen 163 Medina 232 Uvalde 247 Wilson DISTRICT 16 (Corpus Christi) 4 Aransas 13 Bee 89 Goliad 126 Jim Wells 129 Karnes 137 Kleberg 149 Live Oak 178 Nueces 196 Refugio 205 San Patricio
DISTRICT 17 (Bryan) 21 Brazos 26 Burleson 82 Freestone 94 Grimes 145 Leon 154 Madison 166 Milam 198 Robertson 236 Walker 239 Washington DISTRICT 18 (Dallas) 43 Collin 57 Dallas 61 Denton 71 Ellis 130 Kaufman 175 Navarro 199 Rockwall DISTRICT 19 (Atlanta) 19 Bowie 32 Camp 34 Cass 103 Harrison 155 Marion 172 Morris 183 Panola 225 Titus 230 Upshur DISTRICT 20 (Beaumont) 36 Chambers 101 Hardin 122 Jasper 124 Jefferson 146 Liberty 176 Newton 181 Orange 229 Tyler DISTRICT 21 (Pharr) 24 Brooks 31 Cameron 109 Hildago 125 Jim Hogg 66 Kenedy 214 Starr 245 Willacy 253 Zapata DISTRICT 22 (Laredo) 64 Dimmit 67 Duval 136 Kinney 142 La Salle 159 Maverick 233 Val Verde 240 Webb 254 Zavala
DISTRICT 23 (Brownwood) 25 Brown 42 Coleman 47 Comanche 68 Eastland 141 Lampasas 160 McCulloch 167 Mills 206 San Saba 215 Stephens DISTRICT 24 (El Paso) 22 Brewster 55 Culberson 72 El Paso 116 Hudspeth 123 Jeff Davis 189 Presidio DISTRICT 25 (Childress) 23 Briscoe 38 Childress 44 Collingsworth 51 Cottle 63 Dickens 65 Donley 79 Foard 97 Hall 100 Hardeman 135 King 138 Knox 173 Motley 242 Wheeler

78
Table A2. Thirty-Year Averages of Climatic Variables.
Cou
nty
Num
ber
Dai
ly T
empe
ratu
re
Dro
p (°
F)
Mea
n Te
mpe
ratu
re
(°F)
Prec
ipita
tion
(in.)
Max
imum
Rel
ativ
e H
umid
ity (%
) M
inim
um R
elat
ive
Hum
idity
(%)
Thor
nthw
aite
M
oist
ure
Inde
x
Cou
nty
Num
ber
Dai
ly T
empe
ratu
re
Dro
p (°
F)
Mea
n Te
mpe
ratu
re
(°F)
Prec
ipita
tion
(in.)
Max
imum
Rel
ativ
e H
umid
ity (%
) M
inim
um R
elat
ive
Hum
idity
(%)
Thor
nthw
aite
M
oist
ure
Inde
x
1 22 66 46 91 48 14 2 28 64 15 79 30 -40 3 23 67 49 74 63 25 4 15 70 38 88 53 -10 5 27 63 28 88 43 -13 6 28 56 22 82 34 -20 7 25 70 28 89 45 -20 8 22 67 41 90 55 9 9 32 57 17 81 33 -20 10 27 66 36 89 40 -15
11 24 68 36 93 46 -10 12 25 63 26 88 40 -20 13 21 70 33 88 50 -15 14 24 66 35 91 47 -10 15 22 69 30 90 43 -14 16 26 66 33 91 44 -10 17 27 64 20 81 32 -30 18 24 65 34 91 47 -11 19 23 63 51 91 50 43 20 18 69 53 88 55 10 21 22 69 40 94 45 5 22 30 66 13 75 31 -30 23 28 57 22 81 34 -20 24 24 72 25 91 45 -30 25 26 64 28 88 40 -20 26 24 68 39 93 45 0 27 24 65 32 90 45 -15 28 25 68 36 92 47 -10 29 14 71 39 96 53 0 30 24 64 26 82 40 -20 31 17 73 28 95 55 -30 32 23 63 45 91 50 43 33 29 55 22 82 34 -21 34 24 63 49 91 50 40 35 30 56 19 81 33 -20 36 19 69 54 90 61 30 37 21 66 47 85 57 25 38 25 62 23 80 37 -23 39 25 62 32 88 43 -5 40 30 58 18 80 32 -20 41 27 65 23 84 36 -30 42 26 63 27 88 38 -20 43 22 63 41 86 48 29 44 28 63 23 80 36 -20 45 27 68 45 93 53 5 46 24 67 36 90 44 -10 47 26 65 30 88 43 -13 48 29 66 26 84 36 -23 49 23 63 38 86 45 20 50 25 65 32 91 47 -14 51 28 62 24 80 37 -23 52 27 66 15 77 33 -40 53 28 63 19 81 35 -35 54 27 60 21 80 33 -23 55 26 60 14 67 28 -40 56 30 55 15 83 34 -25 57 20 67 38 74 48 3 58 29 61 19 80 31 -30 59 30 57 19 82 34 -20 60 22 63 45 91 50 50 61 23 64 39 86 47 10 62 24 70 36 94 51 -10 63 29 61 20 80 36 -23 64 25 71 21 89 43 -30 65 30 59 24 82 35 -20 66 20 72 28 90 54 -25 67 24 72 25 90 50 -30 68 27 63 29 88 43 -13 69 29 64 14 75 30 -40 70 24 64 24 86 37 -30 71 23 65 38 86 48 0 72 31 64 9 62 24 -40 73 24 63 32 88 46 -10 74 23 68 38 93 47 0 75 22 62 45 86 48 50 76 21 69 39 95 50 0 77 27 62 24 82 37 -23 78 27 58 21 80 33 -20

79
Table A2. Thirty-Year Averages of Climatic Variables (continued).
Cou
nty
Num
ber
Dai
ly T
empe
ratu
re
Dro
p (°
F)
Mea
n Te
mpe
ratu
re
(°F)
Prec
ipita
tion
(in.)
Max
imum
Rel
ativ
e H
umid
ity (%
) M
inim
um R
elat
ive
Hum
idity
(%)
Thor
nthw
aite
M
oist
ure
Inde
x
Cou
nty
Num
ber
Dai
ly T
empe
ratu
re
Dro
p (°
F)
Mea
n Te
mpe
ratu
re
(°F)
Prec
ipita
tion
(in.)
Max
imum
Rel
ativ
e H
umid
ity (%
) M
inim
um R
elat
ive
Hum
idity
(%)
Thor
nthw
aite
M
oist
ure
Inde
x
79 27 62 26 80 38 -21 80 20 69 48 86 55 10 81 22 64 47 91 50 47 82 23 66 41 91 48 9 83 25 70 25 89 45 -23 84 29 61 18 80 31 -30 85 11 71 44 86 56 17 86 27 62 21 80 33 -23 87 24 66 31 88 38 -18 88 29 62 17 83 33 -33 89 24 71 37 90 55 -13 90 22 68 35 93 50 -10 91 26 58 24 82 34 -20 92 21 63 42 86 48 40 93 24 65 49 91 50 33 94 22 68 44 90 48 10 95 23 68 34 91 45 -10 96 25 58 20 80 33 -20 97 28 61 21 80 36 -21 98 24 64 31 90 46 -15 99 30 57 20 83 34 -25 100 28 62 26 80 38 -21
101 22 67 56 90 65 31 102 20 69 50 85 56 15 103 22 64 51 91 50 38 104 30 55 17 83 34 -23 105 25 64 25 82 37 -21 106 23 68 36 91 45 -10 107 29 57 22 83 34 -20 108 22 65 42 91 49 13 109 22 74 23 92 44 -30 110 22 66 37 91 48 -5 111 30 59 20 80 32 -20 112 25 65 32 88 46 -9 113 24 64 48 91 50 50 114 23 66 44 85 60 15 115 26 64 20 81 33 -30 116 33 61 11 65 26 -40 117 22 63 44 86 48 38 118 27 58 22 83 34 -23 119 28 63 20 84 36 -30 120 23 63 31 91 51 -11 121 20 69 42 94 54 3 122 24 66 57 88 63 31 123 29 60 15 69 29 -30 124 20 68 58 96 57 30 125 24 72 24 91 45 -35 126 23 72 28 90 50 -20 127 23 66 35 88 46 -10 128 26 64 25 82 37 -21 129 23 69 29 88 49 -15 130 22 64 39 86 49 10 131 25 65 34 90 40 -10 132 28 61 23 80 36 -23 133 24 64 30 88 38 -15 134 29 65 25 87 36 -25 135 30 61 24 82 37 -23 136 25 69 22 86 40 -30 137 23 72 29 89 53 -25 138 27 63 26 82 38 -21 139 23 63 47 91 50 50 140 30 58 18 81 33 -20 141 26 64 32 90 44 -20 142 26 71 24 89 45 -30 143 22 69 43 95 54 0 144 22 67 37 93 46 -7 145 23 66 42 93 47 9 146 22 67 58 90 61 29 147 25 66 40 93 47 0 148 28 56 23 83 34 -20 149 24 71 25 90 50 -20 150 26 66 27 88 41 -20 151 32 64 13 70 29 -40 152 27 60 17 80 32 -20 153 28 60 21 80 32 -30 154 25 67 43 93 47 7 155 24 63 49 91 50 40 156 28 63 18 79 31 -35

80
Table A2. Thirty-Year Averages of Climatic Variables (continued).
Cou
nty
Num
ber
Dai
ly T
empe
ratu
re
Dro
p (°
F)
Mea
n Te
mpe
ratu
re
(°F)
Prec
ipita
tion
(in.)
Max
imum
Rel
ativ
e H
umid
ity (%
) M
inim
um R
elat
ive
Hum
idity
(%)
Thor
nthw
aite
M
oist
ure
Inde
x
Cou
nty
Num
ber
Dai
ly T
empe
ratu
re
Dro
p (°
F)
Mea
n Te
mpe
ratu
re
(°F)
Prec
ipita
tion
(in.)
Max
imum
Rel
ativ
e H
umid
ity (%
) M
inim
um R
elat
ive
Hum
idity
(%)
Thor
nthw
aite
M
oist
ure
Inde
x
157 28 65 28 88 36 -20 158 17 70 46 92 55 5 159 24 71 21 86 40 -30 160 26 65 28 88 38 -20 161 23 66 35 92 48 -10 162 27 71 23 89 48 -25 163 23 69 28 90 46 -20 164 29 65 25 86 36 -25 165 29 64 15 79 30 -35 166 23 69 35 93 46 -10 167 22 65 29 88 43 -20 168 27 63 19 82 36 -23 169 24 62 33 86 43 8 170 21 68 49 85 57 16 171 28 56 18 83 34 -23 172 23 65 47 91 50 40 173 26 62 22 80 36 -23 174 21 66 50 85 60 30 175 24 65 37 91 49 0 176 24 65 56 88 63 32 177 26 63 24 82 37 -23 178 18 72 32 92 57 -20 179 27 55 21 83 34 -23 180 30 57 18 83 34 -21 181 20 67 61 90 66 31 182 25 66 31 94 56 -10 183 24 65 52 88 53 35 184 25 63 35 91 53 -10 185 29 56 18 81 33 -23 186 29 66 14 75 31 -40 187 25 66 52 85 60 20 188 27 57 20 83 34 -21 189 34 66 14 69 29 -30 190 22 63 44 91 50 30 191 29 59 19 82 34 -20 192 28 63 19 83 33 -35 193 26 65 28 88 40 -20 194 22 63 49 91 50 47 195 32 64 13 69 29 -40 196 22 71 37 90 54 -10 197 27 56 23 83 34 -20 198 22 67 39 93 46 0 199 22 64 39 86 48 18 200 27 65 24 82 37 -21 201 22 65 47 88 55 30 202 24 65 54 88 62 32 203 23 66 52 85 62 31 204 24 67 52 85 58 20 205 20 71 35 90 55 -15 206 25 66 28 88 41 -20 207 28 64 22 85 36 -30 208 28 62 22 82 34 -23 209 26 63 28 85 40 -20 210 24 65 53 88 58 33 211 29 54 18 83 34 -25 212 21 67 45 91 50 25 213 29 64 33 88 46 -10 214 24 74 21 91 45 -40 215 26 65 27 91 48 -15 216 29 63 20 84 36 -30 217 28 63 23 82 37 -23 218 29 63 23 85 37 -30 219 29 57 21 81 33 -20 220 23 65 35 86 45 -3 221 23 64 25 83 38 -21 222 27 64 15 81 35 -40 223 29 60 19 80 32 -30 224 27 63 26 88 41 -20 225 26 63 49 91 50 43 226 27 64 22 85 36 -30 227 21 69 34 91 46 -13 228 25 67 48 85 60 15 229 21 67 56 88 63 30 230 24 63 47 91 50 39 231 26 66 14 79 33 -40 232 26 69 23 89 43 -25 233 25 68 18 84 38 -33 234 22 63 43 91 49 18

81
Table A2. Thirty-Year Averages of Climatic Variables (continued).
Cou
nty
Num
ber
Dai
ly T
empe
ratu
re
Dro
p (°
F)
Mea
n Te
mpe
ratu
re
(°F)
Prec
ipita
tion
(in.)
Max
imum
Rel
ativ
e H
umid
ity (%
) M
inim
um R
elat
ive
Hum
idity
(%)
Thor
nthw
aite
M
oist
ure
Inde
x
Cou
nty
Num
ber
Dai
ly T
empe
ratu
re
Dro
p (°
F)
Mea
n Te
mpe
ratu
re
(°F)
Prec
ipita
tion
(in.)
Max
imum
Rel
ativ
e H
umid
ity (%
) M
inim
um R
elat
ive
Hum
idity
(%)
Thor
nthw
aite
M
oist
ure
Inde
x
235 19 70 39 96 53 -5 236 20 67 49 85 50 13 237 21 68 42 88 54 10 238 33 65 13 73 30 -40 239 23 68 43 94 46 0 240 26 73 21 90 45 -30 241 21 69 46 90 55 5 242 26 58 23 82 35 -20 243 24 63 30 86 41 -15 244 26 62 29 84 39 -20 245 17 72 27 93 54 -30 246 23 67 35 91 46 -13 247 23 69 30 89 45 -18 248 30 64 13 71 30 -40 249 27 64 37 88 49 -1 250 22 62 43 91 50 35 251 29 59 17 80 32 -30 252 27 64 31 91 51 -15 253 22 74 20 91 45 -40 254 24 71 22 89 43 -30

82
Table A3. Estimated Volumetric Water Contents for 2 to 4.8 pF Suction Values. Suction (pF) Suction (pF)
Cou
nty
2.0 2.4 2.8 3.2 3.6 4.0 4.4 4.8 Cou
nty
2.0 2.4 2.8 3.2 3.6 4.0 4.4 4.8
1 0.43 0.38 0.32 0.27 0.22 0.17 0.13 0.10 2 0.34 0.28 0.22 0.17 0.12 0.08 0.05 0.043 0.30 0.26 0.21 0.17 0.13 0.10 0.07 0.05 4 0.11 0.05 0.02 0.01 0.00 0.00 0.00 0.005 0.61 0.38 0.00 0.96 0.37 0.36 0.34 0.30 6 0.30 0.29 0.28 0.26 0.23 0.21 0.18 0.157 0.30 0.29 0.28 0.26 0.23 0.21 0.18 0.15 8 0.34 0.29 0.24 0.20 0.16 0.13 0.10 0.089 0.30 0.29 0.28 0.26 0.23 0.21 0.18 0.15 10 0.40 0.35 0.29 0.24 0.18 0.13 0.09 0.06
11 0.11 0.05 0.02 0.01 0.00 0.00 0.00 0.00 12 0.27 0.23 0.20 0.17 0.14 0.11 0.08 0.0513 0.46 0.40 0.34 0.27 0.21 0.16 0.11 0.08 14 0.11 0.05 0.02 0.01 0.00 0.00 0.00 0.0015 0.30 0.27 0.24 0.21 0.17 0.13 0.09 0.06 16 0.49 0.44 0.39 0.33 0.28 0.24 0.19 0.1617 0.30 0.29 0.28 0.26 0.23 0.21 0.18 0.15 18 0.48 0.43 0.39 0.34 0.27 0.17 0.10 0.0719 0.41 0.39 0.36 0.32 0.26 0.20 0.14 0.10 20 0.11 0.05 0.02 0.01 0.00 0.00 0.00 0.0021 0.11 0.05 0.02 0.01 0.00 0.00 0.00 0.00 22 0.36 0.33 0.30 0.26 0.22 0.17 0.13 0.0923 0.34 0.32 0.29 0.25 0.21 0.16 0.12 0.09 24 0.45 0.37 0.29 0.22 0.17 0.12 0.09 0.0625 0.41 0.39 0.36 0.32 0.26 0.20 0.14 0.10 26 0.11 0.05 0.02 0.01 0.00 0.00 0.00 0.0027 0.41 0.39 0.36 0.32 0.26 0.20 0.14 0.10 28 0.23 0.18 0.15 0.13 0.10 0.08 0.06 0.0429 0.11 0.05 0.02 0.01 0.00 0.00 0.00 0.00 30 0.41 0.39 0.36 0.32 0.26 0.20 0.14 0.1031 0.24 0.20 0.18 0.16 0.14 0.12 0.11 0.09 32 0.23 0.19 0.16 0.14 0.11 0.08 0.06 0.0433 0.23 0.20 0.18 0.16 0.14 0.13 0.11 0.09 34 0.40 0.36 0.32 0.28 0.23 0.19 0.16 0.1335 0.11 0.05 0.02 0.01 0.00 0.00 0.00 0.00 36 0.11 0.05 0.02 0.01 0.00 0.00 0.00 0.0037 0.36 0.31 0.25 0.19 0.14 0.10 0.08 0.06 38 0.44 0.40 0.35 0.29 0.23 0.18 0.12 0.0839 0.40 0.32 0.26 0.20 0.16 0.12 0.09 0.06 40 0.42 0.38 0.33 0.28 0.23 0.19 0.16 0.1241 0.30 0.29 0.28 0.26 0.23 0.21 0.18 0.15 42 0.11 0.05 0.02 0.01 0.00 0.00 0.00 0.0043 0.11 0.05 0.02 0.01 0.00 0.00 0.00 0.00 44 0.36 0.32 0.27 0.23 0.19 0.15 0.11 0.0945 0.34 0.29 0.24 0.20 0.16 0.13 0.10 0.08 46 0.45 0.40 0.35 0.29 0.23 0.18 0.13 0.0947 0.24 0.21 0.18 0.16 0.12 0.08 0.04 0.02 48 0.11 0.05 0.02 0.01 0.00 0.00 0.00 0.0049 0.11 0.05 0.02 0.01 0.00 0.00 0.00 0.00 50 0.35 0.31 0.26 0.22 0.18 0.14 0.11 0.0951 0.39 0.35 0.30 0.26 0.22 0.18 0.14 0.11 52 0.33 0.27 0.21 0.16 0.11 0.08 0.05 0.0353 0.47 0.43 0.38 0.34 0.27 0.17 0.10 0.06 54 0.30 0.29 0.28 0.26 0.23 0.21 0.18 0.1555 0.36 0.33 0.30 0.26 0.22 0.17 0.13 0.09 56 0.30 0.29 0.28 0.26 0.23 0.21 0.18 0.1557 0.11 0.05 0.02 0.01 0.00 0.00 0.00 0.00 58 0.39 0.35 0.30 0.26 0.22 0.18 0.15 0.1259 0.41 0.39 0.36 0.32 0.26 0.20 0.14 0.10 60 0.11 0.05 0.02 0.01 0.00 0.00 0.00 0.0061 0.22 0.19 0.17 0.15 0.14 0.12 0.10 0.09 62 0.48 0.43 0.37 0.31 0.25 0.19 0.14 0.1063 0.36 0.33 0.30 0.26 0.22 0.17 0.13 0.09 64 0.49 0.49 0.49 0.47 0.38 0.19 0.05 0.0165 0.35 0.30 0.24 0.19 0.14 0.10 0.08 0.05 66 0.45 0.37 0.29 0.22 0.17 0.12 0.09 0.0667 0.11 0.05 0.02 0.01 0.00 0.00 0.00 0.00 68 0.23 0.20 0.18 0.17 0.15 0.13 0.11 0.1069 0.36 0.33 0.29 0.25 0.21 0.17 0.13 0.10 70 0.25 0.20 0.16 0.13 0.10 0.08 0.06 0.0571 0.34 0.27 0.20 0.14 0.09 0.06 0.04 0.02 72 0.11 0.05 0.02 0.01 0.00 0.00 0.00 0.0073 0.28 0.24 0.21 0.18 0.15 0.11 0.08 0.05 74 0.11 0.05 0.02 0.01 0.00 0.00 0.00 0.0075 0.11 0.05 0.02 0.01 0.00 0.00 0.00 0.00 76 0.11 0.05 0.02 0.01 0.00 0.00 0.00 0.0077 0.41 0.39 0.36 0.32 0.26 0.20 0.14 0.10 78 0.49 0.49 0.49 0.47 0.38 0.19 0.05 0.0179 0.22 0.19 0.17 0.15 0.13 0.12 0.10 0.09 80 0.11 0.05 0.02 0.01 0.00 0.00 0.00 0.0081 0.40 0.36 0.32 0.28 0.23 0.19 0.16 0.13 82 0.26 0.23 0.20 0.17 0.14 0.10 0.07 0.0583 0.31 0.28 0.25 0.21 0.18 0.14 0.10 0.06 84 0.54 0.46 0.38 0.30 0.23 0.18 0.13 0.1085 0.41 0.39 0.36 0.32 0.26 0.20 0.14 0.10 86 0.34 0.31 0.30 0.28 0.23 0.11 0.03 0.01
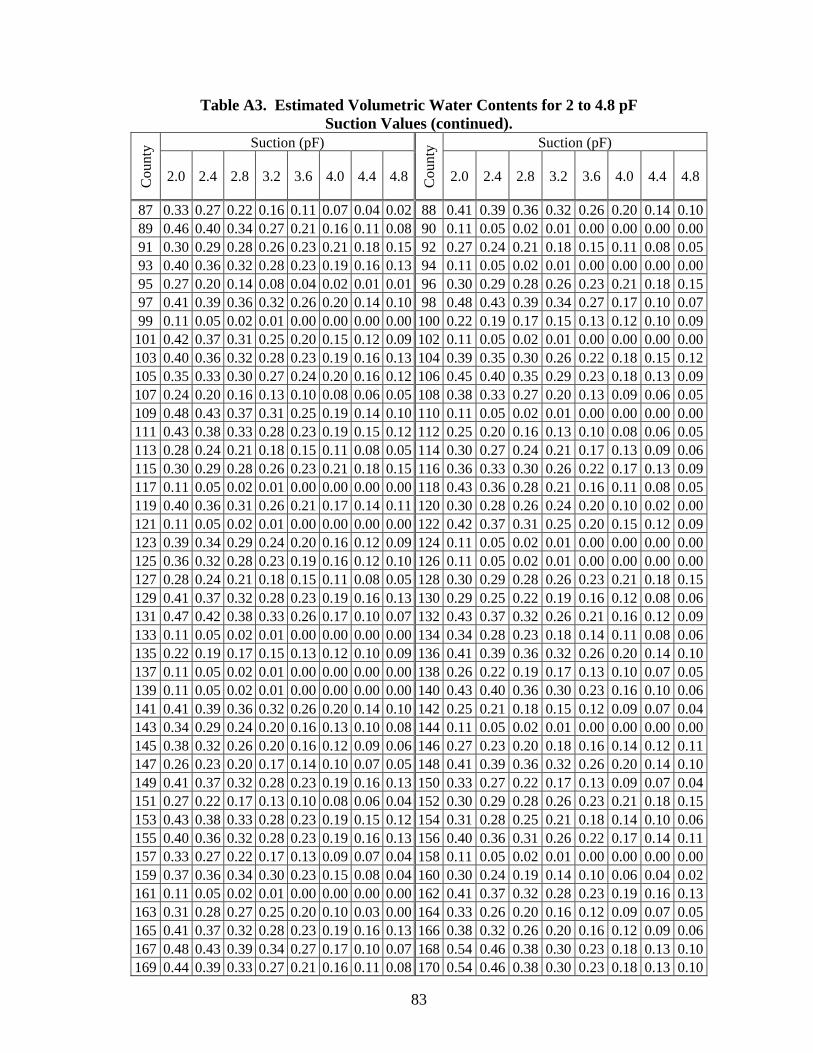
83
Table A3. Estimated Volumetric Water Contents for 2 to 4.8 pF Suction Values (continued).
Suction (pF) Suction (pF) C
ount
y
2.0 2.4 2.8 3.2 3.6 4.0 4.4 4.8 Cou
nty
2.0 2.4 2.8 3.2 3.6 4.0 4.4 4.8
87 0.33 0.27 0.22 0.16 0.11 0.07 0.04 0.02 88 0.41 0.39 0.36 0.32 0.26 0.20 0.14 0.1089 0.46 0.40 0.34 0.27 0.21 0.16 0.11 0.08 90 0.11 0.05 0.02 0.01 0.00 0.00 0.00 0.0091 0.30 0.29 0.28 0.26 0.23 0.21 0.18 0.15 92 0.27 0.24 0.21 0.18 0.15 0.11 0.08 0.0593 0.40 0.36 0.32 0.28 0.23 0.19 0.16 0.13 94 0.11 0.05 0.02 0.01 0.00 0.00 0.00 0.0095 0.27 0.20 0.14 0.08 0.04 0.02 0.01 0.01 96 0.30 0.29 0.28 0.26 0.23 0.21 0.18 0.1597 0.41 0.39 0.36 0.32 0.26 0.20 0.14 0.10 98 0.48 0.43 0.39 0.34 0.27 0.17 0.10 0.0799 0.11 0.05 0.02 0.01 0.00 0.00 0.00 0.00 100 0.22 0.19 0.17 0.15 0.13 0.12 0.10 0.09
101 0.42 0.37 0.31 0.25 0.20 0.15 0.12 0.09 102 0.11 0.05 0.02 0.01 0.00 0.00 0.00 0.00103 0.40 0.36 0.32 0.28 0.23 0.19 0.16 0.13 104 0.39 0.35 0.30 0.26 0.22 0.18 0.15 0.12105 0.35 0.33 0.30 0.27 0.24 0.20 0.16 0.12 106 0.45 0.40 0.35 0.29 0.23 0.18 0.13 0.09107 0.24 0.20 0.16 0.13 0.10 0.08 0.06 0.05 108 0.38 0.33 0.27 0.20 0.13 0.09 0.06 0.05109 0.48 0.43 0.37 0.31 0.25 0.19 0.14 0.10 110 0.11 0.05 0.02 0.01 0.00 0.00 0.00 0.00111 0.43 0.38 0.33 0.28 0.23 0.19 0.15 0.12 112 0.25 0.20 0.16 0.13 0.10 0.08 0.06 0.05113 0.28 0.24 0.21 0.18 0.15 0.11 0.08 0.05 114 0.30 0.27 0.24 0.21 0.17 0.13 0.09 0.06115 0.30 0.29 0.28 0.26 0.23 0.21 0.18 0.15 116 0.36 0.33 0.30 0.26 0.22 0.17 0.13 0.09117 0.11 0.05 0.02 0.01 0.00 0.00 0.00 0.00 118 0.43 0.36 0.28 0.21 0.16 0.11 0.08 0.05119 0.40 0.36 0.31 0.26 0.21 0.17 0.14 0.11 120 0.30 0.28 0.26 0.24 0.20 0.10 0.02 0.00121 0.11 0.05 0.02 0.01 0.00 0.00 0.00 0.00 122 0.42 0.37 0.31 0.25 0.20 0.15 0.12 0.09123 0.39 0.34 0.29 0.24 0.20 0.16 0.12 0.09 124 0.11 0.05 0.02 0.01 0.00 0.00 0.00 0.00125 0.36 0.32 0.28 0.23 0.19 0.16 0.12 0.10 126 0.11 0.05 0.02 0.01 0.00 0.00 0.00 0.00127 0.28 0.24 0.21 0.18 0.15 0.11 0.08 0.05 128 0.30 0.29 0.28 0.26 0.23 0.21 0.18 0.15129 0.41 0.37 0.32 0.28 0.23 0.19 0.16 0.13 130 0.29 0.25 0.22 0.19 0.16 0.12 0.08 0.06131 0.47 0.42 0.38 0.33 0.26 0.17 0.10 0.07 132 0.43 0.37 0.32 0.26 0.21 0.16 0.12 0.09133 0.11 0.05 0.02 0.01 0.00 0.00 0.00 0.00 134 0.34 0.28 0.23 0.18 0.14 0.11 0.08 0.06135 0.22 0.19 0.17 0.15 0.13 0.12 0.10 0.09 136 0.41 0.39 0.36 0.32 0.26 0.20 0.14 0.10137 0.11 0.05 0.02 0.01 0.00 0.00 0.00 0.00 138 0.26 0.22 0.19 0.17 0.13 0.10 0.07 0.05139 0.11 0.05 0.02 0.01 0.00 0.00 0.00 0.00 140 0.43 0.40 0.36 0.30 0.23 0.16 0.10 0.06141 0.41 0.39 0.36 0.32 0.26 0.20 0.14 0.10 142 0.25 0.21 0.18 0.15 0.12 0.09 0.07 0.04143 0.34 0.29 0.24 0.20 0.16 0.13 0.10 0.08 144 0.11 0.05 0.02 0.01 0.00 0.00 0.00 0.00145 0.38 0.32 0.26 0.20 0.16 0.12 0.09 0.06 146 0.27 0.23 0.20 0.18 0.16 0.14 0.12 0.11147 0.26 0.23 0.20 0.17 0.14 0.10 0.07 0.05 148 0.41 0.39 0.36 0.32 0.26 0.20 0.14 0.10149 0.41 0.37 0.32 0.28 0.23 0.19 0.16 0.13 150 0.33 0.27 0.22 0.17 0.13 0.09 0.07 0.04151 0.27 0.22 0.17 0.13 0.10 0.08 0.06 0.04 152 0.30 0.29 0.28 0.26 0.23 0.21 0.18 0.15153 0.43 0.38 0.33 0.28 0.23 0.19 0.15 0.12 154 0.31 0.28 0.25 0.21 0.18 0.14 0.10 0.06155 0.40 0.36 0.32 0.28 0.23 0.19 0.16 0.13 156 0.40 0.36 0.31 0.26 0.22 0.17 0.14 0.11157 0.33 0.27 0.22 0.17 0.13 0.09 0.07 0.04 158 0.11 0.05 0.02 0.01 0.00 0.00 0.00 0.00159 0.37 0.36 0.34 0.30 0.23 0.15 0.08 0.04 160 0.30 0.24 0.19 0.14 0.10 0.06 0.04 0.02161 0.11 0.05 0.02 0.01 0.00 0.00 0.00 0.00 162 0.41 0.37 0.32 0.28 0.23 0.19 0.16 0.13163 0.31 0.28 0.27 0.25 0.20 0.10 0.03 0.00 164 0.33 0.26 0.20 0.16 0.12 0.09 0.07 0.05165 0.41 0.37 0.32 0.28 0.23 0.19 0.16 0.13 166 0.38 0.32 0.26 0.20 0.16 0.12 0.09 0.06167 0.48 0.43 0.39 0.34 0.27 0.17 0.10 0.07 168 0.54 0.46 0.38 0.30 0.23 0.18 0.13 0.10169 0.44 0.39 0.33 0.27 0.21 0.16 0.11 0.08 170 0.54 0.46 0.38 0.30 0.23 0.18 0.13 0.10

84
Table A3. Estimated Volumetric Water Contents for 2 to 4.8 pF Suction Values (continued).
Suction (pF) Suction (pF) C
ount
y
2.0 2.4 2.8 3.2 3.6 4.0 4.4 4.8 Cou
nty
2.0 2.4 2.8 3.2 3.6 4.0 4.4 4.8
171 0.20 0.16 0.14 0.12 0.11 0.10 0.08 0.07 172 0.40 0.36 0.32 0.28 0.23 0.19 0.16 0.13173 0.38 0.33 0.27 0.20 0.13 0.09 0.06 0.04 174 0.36 0.32 0.27 0.23 0.18 0.14 0.11 0.09175 0.26 0.23 0.20 0.17 0.14 0.10 0.07 0.05 176 0.42 0.37 0.31 0.25 0.20 0.15 0.12 0.09177 0.37 0.33 0.29 0.24 0.20 0.16 0.13 0.10 178 0.11 0.05 0.02 0.01 0.00 0.00 0.00 0.00179 0.29 0.26 0.23 0.20 0.16 0.12 0.09 0.06 180 0.37 0.34 0.31 0.27 0.23 0.18 0.13 0.09181 0.42 0.37 0.31 0.25 0.20 0.15 0.12 0.09 182 0.30 0.28 0.26 0.24 0.20 0.10 0.02 0.00183 0.40 0.35 0.29 0.24 0.20 0.16 0.12 0.09 184 0.20 0.17 0.15 0.14 0.13 0.11 0.10 0.09185 0.41 0.39 0.36 0.32 0.26 0.20 0.14 0.10 186 0.36 0.31 0.26 0.21 0.16 0.12 0.09 0.06187 0.44 0.38 0.32 0.26 0.20 0.16 0.12 0.09 188 0.37 0.36 0.34 0.30 0.23 0.15 0.08 0.04189 0.36 0.33 0.30 0.26 0.22 0.17 0.13 0.09 190 0.31 0.29 0.27 0.25 0.21 0.10 0.03 0.00191 0.20 0.17 0.14 0.13 0.11 0.10 0.09 0.07 192 0.41 0.39 0.36 0.32 0.26 0.20 0.14 0.10193 0.25 0.20 0.16 0.13 0.10 0.08 0.06 0.05 194 0.26 0.22 0.19 0.16 0.13 0.10 0.07 0.05195 0.36 0.33 0.30 0.26 0.22 0.17 0.13 0.09 196 0.11 0.05 0.02 0.01 0.00 0.00 0.00 0.00197 0.35 0.30 0.24 0.19 0.14 0.10 0.08 0.06 198 0.38 0.32 0.26 0.20 0.16 0.12 0.09 0.06199 0.11 0.05 0.02 0.01 0.00 0.00 0.00 0.00 200 0.30 0.29 0.28 0.26 0.23 0.21 0.18 0.15201 0.40 0.36 0.32 0.28 0.23 0.19 0.16 0.13 202 0.40 0.35 0.29 0.24 0.20 0.16 0.12 0.09203 0.40 0.35 0.29 0.24 0.20 0.16 0.12 0.09 204 0.44 0.38 0.32 0.26 0.20 0.16 0.12 0.09205 0.11 0.05 0.02 0.01 0.00 0.00 0.00 0.00 206 0.11 0.05 0.02 0.01 0.00 0.00 0.00 0.00207 0.25 0.20 0.16 0.13 0.11 0.08 0.06 0.05 208 0.30 0.29 0.28 0.26 0.23 0.21 0.18 0.15209 0.49 0.49 0.49 0.47 0.38 0.19 0.05 0.01 210 0.40 0.35 0.29 0.24 0.20 0.16 0.12 0.09211 0.30 0.29 0.28 0.26 0.23 0.21 0.18 0.15 212 0.36 0.31 0.25 0.19 0.14 0.10 0.08 0.06213 0.48 0.43 0.39 0.34 0.27 0.17 0.10 0.07 214 0.48 0.42 0.35 0.28 0.22 0.16 0.12 0.08215 0.30 0.29 0.28 0.26 0.23 0.21 0.18 0.15 216 0.39 0.35 0.30 0.25 0.21 0.17 0.14 0.11217 0.22 0.18 0.16 0.14 0.13 0.11 0.10 0.08 218 0.25 0.20 0.16 0.13 0.10 0.08 0.06 0.05219 0.30 0.29 0.28 0.26 0.23 0.21 0.18 0.15 220 0.36 0.31 0.27 0.23 0.18 0.14 0.10 0.07221 0.41 0.39 0.36 0.32 0.26 0.20 0.14 0.10 222 0.46 0.40 0.34 0.27 0.22 0.17 0.13 0.09223 0.52 0.44 0.36 0.28 0.21 0.16 0.11 0.08 224 0.49 0.49 0.49 0.47 0.38 0.19 0.05 0.01225 0.40 0.36 0.32 0.28 0.23 0.19 0.16 0.13 226 0.33 0.27 0.22 0.16 0.11 0.07 0.04 0.02227 0.54 0.46 0.38 0.30 0.23 0.18 0.13 0.10 228 0.44 0.38 0.32 0.26 0.20 0.16 0.12 0.09229 0.42 0.37 0.31 0.25 0.20 0.15 0.12 0.09 230 0.46 0.40 0.34 0.27 0.21 0.16 0.11 0.08231 0.41 0.39 0.36 0.32 0.26 0.20 0.14 0.10 232 0.31 0.28 0.25 0.21 0.18 0.14 0.10 0.06233 0.47 0.43 0.38 0.34 0.27 0.17 0.10 0.06 234 0.31 0.29 0.27 0.25 0.21 0.10 0.03 0.00235 0.11 0.05 0.02 0.01 0.00 0.00 0.00 0.00 236 0.24 0.20 0.17 0.15 0.12 0.09 0.06 0.04237 0.34 0.29 0.24 0.20 0.16 0.13 0.10 0.08 238 0.33 0.27 0.21 0.16 0.11 0.08 0.05 0.03239 0.11 0.05 0.02 0.01 0.00 0.00 0.00 0.00 240 0.11 0.05 0.02 0.01 0.00 0.00 0.00 0.00241 0.11 0.05 0.02 0.01 0.00 0.00 0.00 0.00 242 0.36 0.32 0.28 0.23 0.19 0.16 0.12 0.10243 0.28 0.25 0.22 0.19 0.15 0.12 0.08 0.06 244 0.22 0.19 0.17 0.15 0.13 0.12 0.10 0.09245 0.31 0.28 0.27 0.25 0.20 0.10 0.03 0.00 246 0.11 0.05 0.02 0.01 0.00 0.00 0.00 0.00247 0.45 0.39 0.33 0.27 0.21 0.16 0.11 0.08 248 0.33 0.27 0.21 0.16 0.11 0.08 0.05 0.03249 0.44 0.38 0.31 0.25 0.20 0.15 0.11 0.08 250 0.40 0.36 0.32 0.28 0.23 0.19 0.16 0.13251 0.52 0.44 0.36 0.28 0.21 0.16 0.11 0.08 252 0.30 0.29 0.28 0.26 0.23 0.21 0.18 0.15253 0.11 0.05 0.02 0.01 0.00 0.00 0.00 0.00 254 0.31 0.28 0.25 0.21 0.18 0.14 0.10 0.06

85
Table A4. Estimated Soil Permeabilities (cm/hr) for 2 to 4.8 pF Suction Values. Suction (pF) Suction (pF)
Cou
nty
2.0 2.4 2.8 3.2 3.6 4.0 4.4 4.8 Cou
nty
2.0 2.4 2.8 3.2 3.6 4.0 4.4 4.8
1 0.05 0.048 0.047 0.047 0.047 0.05 0.047 0.047 2 0.068 0.051 0.049 0.049 0.049 0.068 0.049 0.0493 0.105 0.049 0.039 0.038 0.037 0.105 0.037 0.037 5 2E-04 9E-05 4E-05 2E-05 6E-06 2E-04 1E-06 5E-076 2E-04 9E-05 4E-05 2E-05 6E-06 2E-04 1E-06 5E-07 7 2E-04 9E-05 4E-05 2E-05 6E-06 2E-04 1E-06 5E-079 2E-04 9E-05 4E-05 2E-05 6E-06 2E-04 1E-06 5E-07 10 2E-04 9E-05 4E-05 2E-05 6E-06 2E-04 1E-06 5E-07
11 0.052 0.05 0.049 0.049 0.049 0.052 0.049 0.049 12 1E-04 5E-05 2E-05 8E-06 3E-06 1E-04 6E-07 2E-0713 0.095 0.09 0.089 0.089 0.089 0.095 0.089 0.089 14 2E-07 2E-08 2E-09 2E-10 2E-11 2E-07 3E-13 3E-1415 1E-04 5E-05 2E-05 1E-05 4E-06 1E-04 7E-07 3E-07 16 0.099 0.094 0.093 0.092 0.092 0.099 0.092 0.09217 2E-04 9E-05 4E-05 2E-05 6E-06 2E-04 1E-06 5E-07 18 0.11 0.106 0.105 0.105 0.105 0.11 0.105 0.10519 2E-04 9E-05 4E-05 2E-05 6E-06 2E-04 1E-06 5E-07 20 2E-07 2E-08 2E-09 2E-10 2E-11 2E-07 3E-13 3E-1421 2E-07 2E-08 2E-09 2E-10 2E-11 2E-07 3E-13 3E-14 23 0.199 0.105 0.082 0.077 0.076 0.199 0.076 0.07624 0.173 0.149 0.145 0.145 0.144 0.173 0.144 0.144 25 2E-04 9E-05 4E-05 2E-05 6E-06 2E-04 1E-06 5E-0727 0.099 0.094 0.093 0.092 0.092 0.099 0.092 0.092 28 8E-05 3E-05 1E-05 6E-06 2E-06 8E-05 4E-07 2E-0729 2E-07 2E-08 2E-09 2E-10 2E-11 2E-07 3E-13 3E-14 30 2E-04 9E-05 4E-05 2E-05 6E-06 2E-04 1E-06 5E-0731 8E-05 4E-05 1E-05 6E-06 3E-06 8E-05 4E-07 2E-07 32 8E-05 4E-05 1E-05 6E-06 3E-06 8E-05 4E-07 2E-0733 1E-04 5E-05 2E-05 9E-06 4E-06 1E-04 7E-07 3E-07 35 2E-07 2E-08 2E-09 2E-10 2E-11 2E-07 3E-13 3E-1436 2E-07 2E-08 2E-09 2E-10 2E-11 2E-07 3E-13 3E-14 38 0.016 8E-04 5E-05 1E-05 4E-06 0.016 7E-07 3E-0739 0.128 0.121 0.12 0.12 0.119 0.128 0.119 0.119 40 0.097 0.092 0.091 0.091 0.091 0.097 0.091 0.09141 2E-04 9E-05 4E-05 2E-05 6E-06 2E-04 1E-06 5E-07 42 2E-07 2E-08 2E-09 2E-10 2E-11 2E-07 3E-13 3E-1443 2E-07 2E-08 2E-09 2E-10 2E-11 2E-07 3E-13 3E-14 44 0.195 0.094 0.073 0.068 0.067 0.195 0.067 0.06746 0.115 0.112 0.111 0.111 0.111 0.115 0.111 0.111 47 1E-04 4E-05 2E-05 8E-06 3E-06 1E-04 5E-07 2E-0748 2E-07 2E-08 2E-09 2E-10 2E-11 2E-07 3E-13 3E-14 49 2E-07 2E-08 2E-09 2E-10 2E-11 2E-07 3E-13 3E-1450 0.089 0.087 0.086 0.086 0.086 0.089 0.086 0.086 51 0.054 0.051 0.051 0.051 0.051 0.054 0.051 0.05152 0.104 0.051 0.039 0.037 0.036 0.104 0.036 0.036 54 2E-04 9E-05 4E-05 2E-05 6E-06 2E-04 1E-06 5E-0756 2E-04 9E-05 4E-05 2E-05 6E-06 2E-04 1E-06 5E-07 57 2E-07 2E-08 2E-09 2E-10 2E-11 2E-07 3E-13 3E-1458 0.097 0.092 0.091 0.091 0.091 0.097 0.091 0.091 59 2E-04 9E-05 4E-05 2E-05 6E-06 2E-04 1E-06 5E-0761 1E-04 5E-05 2E-05 9E-06 4E-06 1E-04 6E-07 3E-07 62 0.099 0.094 0.093 0.092 0.092 0.099 0.092 0.09263 0.161 0.085 0.066 0.062 0.061 0.161 0.061 0.061 64 2E-04 9E-05 4E-05 2E-05 6E-06 2E-04 1E-06 5E-0765 0.15 0.076 0.062 0.06 0.059 0.15 0.059 0.059 68 1E-04 5E-05 2E-05 1E-05 4E-06 1E-04 7E-07 3E-0769 0.104 0.051 0.039 0.037 0.036 0.104 0.036 0.036 71 0.094 0.057 0.051 0.051 0.05 0.094 0.05 0.0572 2E-07 2E-08 2E-09 2E-10 2E-11 2E-07 3E-13 3E-14 73 1E-04 5E-05 2E-05 8E-06 3E-06 1E-04 6E-07 2E-0774 2E-07 2E-08 2E-09 2E-10 2E-11 2E-07 3E-13 3E-14 75 2E-07 2E-08 2E-09 2E-10 2E-11 2E-07 3E-13 3E-1477 2E-04 9E-05 4E-05 2E-05 6E-06 2E-04 1E-06 5E-07 78 2E-04 9E-05 4E-05 2E-05 6E-06 2E-04 1E-06 5E-0780 2E-07 2E-08 2E-09 2E-10 2E-11 2E-07 3E-13 3E-14 81 8E-05 4E-05 1E-05 6E-06 3E-06 8E-05 4E-07 2E-0782 0.128 0.121 0.12 0.12 0.119 0.128 0.119 0.119 83 0.193 0.183 0.181 0.181 0.181 0.193 0.181 0.18184 0.193 0.183 0.181 0.181 0.181 0.193 0.181 0.181 85 2E-04 9E-05 4E-05 2E-05 6E-06 2E-04 1E-06 5E-0786 1E-04 5E-05 2E-05 9E-06 4E-06 1E-04 6E-07 3E-07 87 5E-04 5E-04 5E-04 5E-04 5E-04 5E-04 5E-04 5E-0488 2E-04 9E-05 4E-05 2E-05 6E-06 2E-04 1E-06 5E-07 91 2E-04 9E-05 4E-05 2E-05 6E-06 2E-04 1E-06 5E-0792 1E-04 5E-05 2E-05 8E-06 3E-06 1E-04 6E-07 2E-07 93 0.097 0.092 0.091 0.091 0.091 0.097 0.091 0.09194 2E-07 2E-08 2E-09 2E-10 2E-11 2E-07 3E-13 3E-14 95 0.135 0.086 0.078 0.077 0.076 0.135 0.076 0.07696 2E-04 9E-05 4E-05 2E-05 6E-06 2E-04 1E-06 5E-07 97 2E-04 9E-05 4E-05 2E-05 6E-06 2E-04 1E-06 5E-0799 2E-07 2E-08 2E-09 2E-10 2E-11 2E-07 3E-13 3E-14 100 1E-04 5E-05 2E-05 8E-06 4E-06 1E-04 6E-07 3E-07102 2E-07 2E-08 2E-09 2E-10 2E-11 2E-07 3E-13 3E-14 103 0.081 0.077 0.076 0.076 0.076 0.081 0.076 0.076104 0.097 0.092 0.091 0.091 0.091 0.097 0.091 0.091 105 0.039 0.03 0.029 0.029 0.029 0.039 0.029 0.029106 0.115 0.112 0.111 0.111 0.111 0.115 0.111 0.111 107 0.006 3E-04 1E-05 4E-07 2E-08 0.006 3E-11 1E-12108 0.09 0.065 0.062 0.061 0.061 0.09 0.061 0.061 109 0.097 0.092 0.091 0.091 0.091 0.097 0.091 0.091

86
Table A4. Estimated Soil Permeabilities (cm/hr) for 2 to 4.8 pF Suction Values (continued).
Suction (pF) Suction (pF) C
ount
y
2.0 2.4 2.8 3.2 3.6 4.0 4.4 4.8 Cou
nty
2.0 2.4 2.8 3.2 3.6 4.0 4.4 4.8
110 2E-07 2E-08 2E-09 2E-10 2E-11 2E-07 3E-13 3E-14 111 0.104 0.099 0.098 0.098 0.098 0.104 0.098 0.098112 0.059 0.059 0.059 0.059 0.059 0.059 0.059 0.059 113 1E-04 5E-05 2E-05 8E-06 3E-06 1E-04 6E-07 2E-07114 1E-04 5E-05 2E-05 1E-05 4E-06 1E-04 7E-07 3E-07 115 2E-04 9E-05 4E-05 2E-05 6E-06 2E-04 1E-06 5E-07117 2E-07 2E-08 2E-09 2E-10 2E-11 2E-07 3E-13 3E-14 118 0.113 0.089 0.086 0.085 0.085 0.113 0.085 0.085119 0.115 0.109 0.108 0.108 0.108 0.115 0.108 0.108 121 2E-07 2E-08 2E-09 2E-10 2E-11 2E-07 3E-13 3E-14122 0.094 0.065 0.064 0.063 0.063 0.094 0.063 0.063 123 0.119 0.118 0.118 0.118 0.118 0.119 0.118 0.118124 2E-07 2E-08 2E-09 2E-10 2E-11 2E-07 3E-13 3E-14 125 0.014 6E-04 2E-05 9E-07 4E-08 0.014 6E-11 2E-12126 2E-07 2E-08 2E-09 2E-10 2E-11 2E-07 3E-13 3E-14 127 1E-04 5E-05 2E-05 8E-06 3E-06 1E-04 6E-07 2E-07128 2E-04 9E-05 4E-05 2E-05 6E-06 2E-04 1E-06 5E-07 129 0.089 0.084 0.083 0.083 0.083 0.089 0.083 0.083130 1E-04 5E-05 2E-05 9E-06 4E-06 1E-04 6E-07 3E-07 131 0.109 0.106 0.105 0.105 0.105 0.109 0.105 0.105132 0.041 0.002 8E-05 4E-06 2E-07 0.041 3E-10 1E-11 133 2E-07 2E-08 2E-09 2E-10 2E-11 2E-07 3E-13 3E-14134 0.103 0.1 0.099 0.099 0.099 0.103 0.099 0.099 136 2E-04 9E-05 4E-05 2E-05 6E-06 2E-04 1E-06 5E-07138 1E-04 4E-05 2E-05 8E-06 3E-06 1E-04 5E-07 2E-07 139 2E-07 2E-08 2E-09 2E-10 2E-11 2E-07 3E-13 3E-14140 0.072 0.068 0.067 0.067 0.067 0.072 0.067 0.067 141 2E-04 9E-05 4E-05 2E-05 6E-06 2E-04 1E-06 5E-07142 9E-05 4E-05 2E-05 7E-06 3E-06 9E-05 5E-07 2E-07 143 0.054 0.051 0.051 0.051 0.051 0.054 0.051 0.051145 0.094 0.066 0.062 0.062 0.062 0.094 0.062 0.062 146 2E-07 2E-08 2E-09 2E-10 2E-11 2E-07 3E-13 3E-14147 1E-04 4E-05 2E-05 8E-06 3E-06 1E-04 6E-07 2E-07 148 2E-04 9E-05 4E-05 2E-05 6E-06 2E-04 1E-06 5E-07150 0.058 0.046 0.044 0.044 0.044 0.058 0.044 0.044 151 0.057 0.026 0.023 0.022 0.022 0.057 0.022 0.022152 2E-04 9E-05 4E-05 2E-05 6E-06 2E-04 1E-06 5E-07 160 4E-04 4E-04 4E-04 4E-04 4E-04 4E-04 4E-04 4E-04161 2E-07 2E-08 2E-09 2E-10 2E-11 2E-07 3E-13 3E-14 154 1E-04 6E-05 2E-05 1E-05 4E-06 1E-04 7E-07 3E-07156 0.062 0.059 0.058 0.058 0.058 0.062 0.058 0.058 158 2E-07 2E-08 2E-09 2E-10 2E-11 2E-07 3E-13 3E-14159 2E-04 9E-05 4E-05 2E-05 6E-06 2E-04 1E-06 5E-07 163 1E-04 5E-05 2E-05 8E-06 3E-06 1E-04 6E-07 2E-07164 0.097 0.092 0.091 0.091 0.091 0.097 0.091 0.091 165 0.089 0.084 0.083 0.083 0.083 0.089 0.083 0.083167 2E-04 9E-05 4E-05 2E-05 6E-06 2E-04 1E-06 5E-07 168 0.193 0.183 0.181 0.181 0.181 0.193 0.181 0.181169 0.079 0.075 0.074 0.074 0.074 0.079 0.074 0.074 170 0.193 0.183 0.181 0.181 0.181 0.193 0.181 0.181171 9E-05 4E-05 2E-05 7E-06 3E-06 9E-05 5E-07 2E-07 172 8E-05 4E-05 1E-05 6E-06 3E-06 8E-05 4E-07 2E-07173 0.161 0.108 0.096 0.093 0.093 0.161 0.093 0.093 174 3E-04 3E-04 3E-04 3E-04 3E-04 3E-04 3E-04 3E-04175 1E-04 4E-05 2E-05 8E-06 3E-06 1E-04 6E-07 2E-07 176 0.094 0.065 0.064 0.063 0.063 0.094 0.063 0.063177 0.081 0.076 0.075 0.075 0.075 0.081 0.075 0.075 178 2E-07 2E-08 2E-09 2E-10 2E-11 2E-07 3E-13 3E-14179 1E-04 5E-05 2E-05 9E-06 4E-06 1E-04 7E-07 3E-07 180 0.129 0.068 0.053 0.05 0.049 0.129 0.049 0.049182 1E-04 4E-05 2E-05 8E-06 3E-06 1E-04 6E-07 2E-07 183 0.041 0.034 0.033 0.033 0.033 0.041 0.033 0.033184 1E-04 5E-05 2E-05 1E-05 4E-06 1E-04 7E-07 3E-07 185 2E-04 9E-05 4E-05 2E-05 6E-06 2E-04 1E-06 5E-07186 0.1 0.088 0.086 0.086 0.086 0.1 0.086 0.086 187 0.101 0.073 0.071 0.071 0.071 0.101 0.071 0.071188 2E-04 9E-05 4E-05 2E-05 6E-06 2E-04 1E-06 5E-07 190 1E-04 5E-05 2E-05 8E-06 3E-06 1E-04 6E-07 2E-07191 1E-04 4E-05 2E-05 7E-06 3E-06 1E-04 5E-07 2E-07 194 1E-04 4E-05 2E-05 7E-06 3E-06 1E-04 5E-07 2E-07195 0.158 0.083 0.065 0.061 0.06 0.158 0.06 0.06 196 2E-07 2E-08 2E-09 2E-10 2E-11 2E-07 3E-13 3E-14197 0.149 0.076 0.062 0.059 0.059 0.149 0.059 0.059 199 1E-04 5E-05 2E-05 9E-06 4E-06 1E-04 6E-07 3E-07200 2E-04 9E-05 4E-05 2E-05 6E-06 2E-04 1E-06 5E-07 201 0.081 0.077 0.076 0.076 0.076 0.081 0.076 0.076204 0.101 0.073 0.071 0.071 0.071 0.101 0.071 0.071 205 2E-07 2E-08 2E-09 2E-10 2E-11 2E-07 3E-13 3E-14206 2E-07 2E-08 2E-09 2E-10 2E-11 2E-07 3E-13 3E-14 207 0.062 0.062 0.062 0.062 0.062 0.062 0.062 0.062208 2E-04 9E-05 4E-05 2E-05 6E-06 2E-04 1E-06 5E-07 209 2E-04 9E-05 4E-05 2E-05 6E-06 2E-04 1E-06 5E-07211 2E-04 9E-05 4E-05 2E-05 6E-06 2E-04 1E-06 5E-07 212 0.081 0.062 0.059 0.059 0.059 0.081 0.059 0.059214 0.122 0.116 0.114 0.114 0.114 0.122 0.114 0.114 215 2E-04 9E-05 4E-05 2E-05 6E-06 2E-04 1E-06 5E-07216 0.106 0.1 0.099 0.099 0.099 0.106 0.099 0.099 217 1E-04 5E-05 2E-05 8E-06 3E-06 1E-04 6E-07 2E-07

87
Table A4. Estimated Soil Permeabilities (cm/hr) for 2 to 4.8 pF Suction Values (continued).
Suction (pF) Suction (pF) C
ount
y
2.0 2.4 2.8 3.2 3.6 4.0 4.4 4.8 Cou
nty
2.0 2.4 2.8 3.2 3.6 4.0 4.4 4.8
218 0.059 0.059 0.059 0.059 0.059 0.059 0.059 0.059 219 2E-04 9E-05 4E-05 2E-05 6E-06 2E-04 1E-06 5E-07220 0.048 0.046 0.045 0.045 0.045 0.048 0.045 0.045 221 2E-04 9E-05 4E-05 2E-05 6E-06 2E-04 1E-06 5E-07222 0.156 0.151 0.15 0.15 0.15 0.156 0.15 0.15 223 0.118 0.107 0.105 0.105 0.105 0.118 0.105 0.105225 8E-05 4E-05 1E-05 6E-06 3E-06 8E-05 4E-07 2E-07 226 5E-04 5E-04 5E-04 5E-04 5E-04 5E-04 5E-04 5E-04227 0.193 0.183 0.181 0.181 0.181 0.193 0.181 0.181 230 0.097 0.092 0.091 0.091 0.091 0.097 0.091 0.091232 1E-04 6E-05 2E-05 1E-05 4E-06 1E-04 7E-07 3E-07 233 0.103 0.1 0.099 0.099 0.099 0.103 0.099 0.099234 1E-04 5E-05 2E-05 8E-06 3E-06 1E-04 6E-07 2E-07 235 2E-07 2E-08 2E-09 2E-10 2E-11 2E-07 3E-13 3E-14236 9E-05 4E-05 2E-05 7E-06 3E-06 9E-05 5E-07 2E-07 238 0.008 3E-04 1E-05 5E-07 2E-08 0.008 3E-11 1E-12239 2E-07 2E-08 2E-09 2E-10 2E-11 2E-07 3E-13 3E-14 240 2E-07 2E-08 2E-09 2E-10 2E-11 2E-07 3E-13 3E-14242 0.041 0.002 8E-05 4E-06 2E-07 0.041 3E-10 1E-11 243 1E-04 5E-05 2E-05 9E-06 4E-06 1E-04 6E-07 3E-07245 1E-04 5E-05 2E-05 8E-06 3E-06 1E-04 6E-07 2E-07 246 2E-07 2E-08 2E-09 2E-10 2E-11 2E-07 3E-13 3E-14247 0.085 0.081 0.08 0.08 0.08 0.085 0.08 0.08 249 0.097 0.069 0.067 0.067 0.067 0.097 0.067 0.067250 0.081 0.077 0.076 0.076 0.076 0.081 0.076 0.076 254 2E-04 9E-05 4E-05 2E-05 6E-06 2E-04 1E-06 5E-07

Related Documents


