Conservation Improvement Program 1 Conservation Improvement Program Energy Savings, CO 2 Reductions and Economic Benefits Achieved 2016-2017 December 2019 Pursuant to Minnesota Statutes 216B.241, Subd. 1c(g) This document is made available electronically by the Minnesota Legislative Reference Library as part of an ongoing digital archiving project. http://www.leg.state.mn.us/lrl/lrl.asp

Welcome message from author
This document is posted to help you gain knowledge. Please leave a comment to let me know what you think about it! Share it to your friends and learn new things together.
Transcript
Conservation Improvement Program 1
Conservation Improvement Program
Energy Savings, CO2 Reductions and Economic Benefits Achieved 2016-2017
December 2019
Pursuant to Minnesota Statutes 216B.241, Subd. 1c(g)
This document is made available electronically by the Minnesota Legislative Reference Library as part of an ongoing digital archiving project. http://www.leg.state.mn.us/lrl/lrl.asp
December 2019 MN CIP Report – CO2 Reduction and Results 2
Table of Contents Executive Summary ........................................................................................................................................3
Overview of the Conservation Improvement Program ..........................................................................................4
2016 and 2017 CIP Performance ............................................................................................................................6
Avoided CO2 Emissions ...........................................................................................................................................8
CIP as an Energy Resource ......................................................................................................................................8
Consumer and Business Benefits ......................................................................................................................... 10
CIP and Minnesota’s Economy............................................................................................................................. 10
CIP Savings and Expenditures ............................................................................................................................. 11
Electric CIP Performance 2016 - 2017 ................................................................................................................. 11
Gas CIP Performance 2016 - 2017 ....................................................................................................................... 16
APPENDIX A. Electric Aggregator Membership ................................................................................................... 18
APPENDIX B. Gas Aggregator Membership ......................................................................................................... 19
APPENDIX C. 2017 Exempt and Voluntary Utilities .............................................................................................. 20
APPENDIX D. CIP Regulatory Process Information .............................................................................................. 21
December 2019 MN CIP Report – CO2 Reduction and Results 3
Executive Summary
The Minnesota Department of Commerce, Division of Energy Resources (Commerce), submits this report in fulfillment of Minnesota Statute §216B.241, subd. 1c(g). The statute requires the Commissioner of Commerce to produce and make publicly available a report on the annual energy savings and estimated carbon dioxide (CO2) reductions achieved through the Conservation Improvement Program (CIP) for the two most recent years for which data is available. This report includes utility-reported CIP performance data for program years 2016 and 2017.
CIP helps Minnesota households and businesses use electricity and natural gas more efficiently – conserving energy, reducing carbon dioxide emissions and lessening the need for new utility infrastructure. CIP is funded by ratepayers and administered by electricity and natural gas utilities.
Commerce oversees CIP to ensure that ratepayer dollars are used effectively to achieve the 1.5% energy savings goal and that energy savings are reported as accurately as possible. Minnesota utilities operate a wide array of residential, commercial and industrial CIP programs. These programs target both retrofits and new construction projects.
During both 2016 and 2017, electric utilities as a whole exceeded the CIP goal of 1.5% and natural gas utilities exceeded the statutory minimum of 1.0% energy savings. In total, from 2016 to 2017, CIP programs benefited Minnesota’s environment and economy by:
Saving around 14.7 trillion-Btus of energy, which is enough energy to heat, cool and power more than 160,000 Minnesota homes for a year.1
Reducing CO2 emissions by over 1.7 million tons, equivalent to removing 332,000 vehicles from the road for one year. 2,3
Saving over $260 million in energy costs.4
Supporting over 46,000 energy efficiency jobs, representing the largest sector of Minnesota’s clean energy employment.5
1 Based on average total annual energy consumption per home of 88.3 MMBtu for West North Central Census Region (IA/KS/MN/MO/ND/NE/SD) from Table CE3.3 of the 2015 Residential Energy Consumption Survey by the US Energy Information Administration. (https://www.eia.gov/consumption/residential/data/2015/c&e/pdf/ce3.3.pdf). 2 The electric CO2 emissions rate of 1,220 pounds of CO2 per MWh was applied to years 2016-2017 and is provided by the Minnesota Pollution Control Agency in Docket No. E,G999/CI-00-1343, updated in April 18, 2018. The gas CO2 emissions rate of 117 pounds of CO2 per Dth was applied to years 2014-2017 and is provided by the U.S. Energy Information Administration, last updated June 4, 2019 (https://www.eia.gov/tools/faqs/faq.php?id=73&t=11). Previous years utilize a rate of 1,823 pounds of CO2 per MWh (2009-2012), 1,437/MWh (2013-2014), 1,419/MWh (2015) of electricity saved; and 121 pounds of CO2 per Dth of natural gas saved (2009-2013). 3 Calculated using the U.S. Environmental Protection Agency’s Greenhouse Gas Equivalencies Calculator (https://www.epa.gov/energy/greenhouse-gas-equivalencies-calculator), accessed January 06, 2020. 4 Based on a 10.27-cent average for the price of electricity (kWh) in Minnesota in 2017. (https://www.eia.gov/electricity/state/minnesota/index.php). In addition, a $6.35 price of natural gas (Dth) in Minnesota was derived by calculating a weighted average price of natural gas in the residential, commercial, and industrial sectors. (https://www.eia.gov/dnav/ng/ng_pri_sum_dcu_SMN_a.htm) (https://www.eia.gov/dnav/ng/ng_cons_sum_dcu_SMN_a.htm). 5 Based on Clean Jobs Midwest 2019 Minnesota report – showing 46,191 energy efficiency jobs in Minnesota and 61,047 total clean energy jobs. (https://www.e2.org/reports/clean-jobs-midwest-2019/)
December 2019 MN CIP Report – CO2 Reduction and Results 4
Table 1. Total 2016-2017 CIP Electric and Gas Impacts
CO2 Savings (tons)
Energy Savings (1000s
MMBtu) Energy Cost Savings
Electric 1,286,874 7,198 $ 216,658,986
Gas 438,718 7,493 $ 47,620,338
Total 1,725,592 14,691 $ 264,279,324
Overview of the Conservation Improvement Program
CIP is a utility-administered program with regulatory oversight provided by Commerce. Utility CIP portfolios promote energy-efficient technologies and practices by providing rebates, marketing, and technical assistance to utility customers. CIP programs help Minnesota households and businesses lower their energy costs by using electricity and natural gas more efficiently. Commerce reviews and approves utility CIP regulatory filings to ensure that energy savings are calculated accurately, statutory requirements are met, and programs meet cost-effectiveness standards.
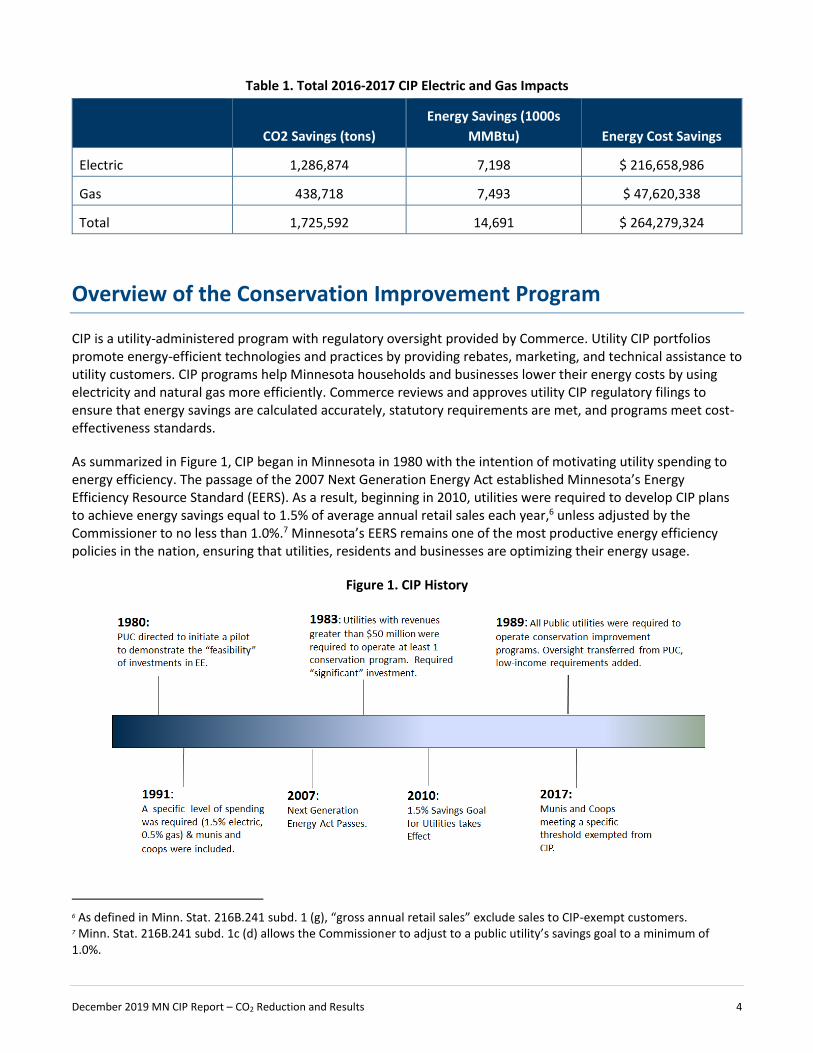
As summarized in Figure 1, CIP began in Minnesota in 1980 with the intention of motivating utility spending to energy efficiency. The passage of the 2007 Next Generation Energy Act established Minnesota’s Energy Efficiency Resource Standard (EERS). As a result, beginning in 2010, utilities were required to develop CIP plans to achieve energy savings equal to 1.5% of average annual retail sales each year,6 unless adjusted by the Commissioner to no less than 1.0%.7 Minnesota’s EERS remains one of the most productive energy efficiency policies in the nation, ensuring that utilities, residents and businesses are optimizing their energy usage.
Figure 1. CIP History
6 As defined in Minn. Stat. 216B.241 subd. 1 (g), “gross annual retail sales” exclude sales to CIP-exempt customers. 7 Minn. Stat. 216B.241 subd. 1c (d) allows the Commissioner to adjust to a public utility’s savings goal to a minimum of 1.0%.
December 2019 MN CIP Report – CO2 Reduction and Results 5
Minnesota utilities operate a wide array of residential, commercial and industrial CIPs that target retrofits as well as new construction projects. Each utility may tailor its portfolio of programs to meet the unique needs of its service territory. Traditionally, programs have offered prescriptive equipment-based incentives (e.g. replacing an incandescent light bulb with an LED lamp). More advanced programs are using building-centric or systems approaches to incentivize customers to implement bundles of efficiency measures or achieve a certain energy performance level beyond code (e.g. recommissioning an office building or school). Many utilities also offer robust industrial efficiency programs that strive to help manufacturers increase the energy efficiency of their operations and compete in markets.
Typical utility programs for residential customers include:
Energy audits, in which a trained energy consultant examines a home and offers specific advice on energy improvements.
Rebates on high-efficiency heating, cooling and water-heating appliances; efficient lighting; and low-flow showerheads and faucet aerators.
Air-conditioner cycling programs, which allow the utility to manage its peak energy demand in return for discounted electric bills for participating customers.
Typical utility programs for commercial or industrial customers include:
Rebates for high-efficiency boilers, chillers and rooftop units; high-efficiency motors and drives; high-efficiency lighting and lighting control systems.
Building recommissioning studies.
Manufacturing process improvements that reduce energy intensity and improve productivity.
This report highlights the CO2 reductions and energy savings that utilities achieved in 2016 and 2017. Commerce also recognizes the positive economic impacts that utility-run CIP portfolios bring to Minnesota in terms of energy bill savings, job creation and utility scale benefits.

December 2019 MN CIP Report – CO2 Reduction and Results 6
2016 and 2017 CIP Performance
Minnesota’s commitment to energy efficiency is nationally recognized. In 2019, the American Council for an Energy Efficient Economy (ACEEE) ranked Minnesota eighth on its State Scorecard Ranking.8 In terms of total energy saved, 2017 was Minnesota’s most successful CIP program year to date: Minnesota’s natural gas savings percentage was highest in the nation, and electric utilities achieved the eleventh highest energy savings percentage nationally.9
As shown in Figure 2 and Figure 3, electric and natural gas savings for 2016 and 2017 totaled 2,110 gigawatt-hours (GWh) and 7.5 billion cubic feet (bcf), respectively. Combined, these energy savings are equivalent to around 14.7 trillion-BTUs of energy. This is enough energy to heat, cool and power more than 160,000 homes for a year,10 or approximately the combined number of homes in Saint Paul and Duluth.11
Figure 2. CIP Electric Results 2010-2017
8 ACEEE 2019 State Energy Efficiency Scorecard, Table 34. (https://aceee.org/research-report/u1908). 9Based on ACEEE’s analysis, Table 8 & 10, from the 2018 State Energy Efficiency Scorecard. (https://aceee.org/research-report/u1808). 10 Based on average total annual energy consumption per home of 88.3 MMBtu for West North Central Census Region (IA/KS/MN/MO/ND/NE/SD) from Table CE3.3 of the 2015 Residential Energy Consumption Survey by the US Energy Information Administration. (https://www.eia.gov/consumption/residential/data/2015/c&e/pdf/ce3.3.pdf). 11 According to the most recent Census American Survey Data, Saint Paul has 120,795 housing units and Duluth has 38,208 housing units. (https://factfinder.census.gov/faces/nav/jsf/pages/community_facts.xhtml).
1.4% 1.6%1.7% 1.7% 1.5% 1.6%
1.7%
2.0%
0
200
400
600
800
1,000
1,200
$0
$20
$40
$60
$80
$100
$120
$140
$160
$180
2010 2011 2012 2013 2014 2015 2016 2017
Incr
em
en
tal E
ne
rgy
Savi
ngs
(G
Wh
)
Exp
en
dit
ure
s ($
1M
)
Expenditures Savings

December 2019 MN CIP Report – CO2 Reduction and Results 7
Figure 3. CIP Natural Gas Results 2010-2017
Figure 4. Aggregate CIP Performance 2010-2017
0.9%1.0% 0.9%
1.1%1.2%
1.2%1.3%
1.4%
0.0
0.5
1.0
1.5
2.0
2.5
3.0
3.5
4.0
4.5
$0
$10
$20
$30
$40
$50
$60
$70
2010 2011 2012 2013 2014 2015 2016 2017
Incr
em
en
tal E
ne
rgy
Savi
ngs
(b
cf)
Exp
en
dit
ure
s ($
1M
)
Expenditures Savings
0
1,000
2,000
3,000
4,000
5,000
6,000
7,000
8,000
9,000
$0
$50
$100
$150
$200
$250
2010 2011 2012 2013 2014 2015 2016 2017
Incr
em
en
tal E
ne
rgy
Savi
ngs
(1
00
0s
MM
Btu
)
Exp
en
dit
ure
s ($
1M
)
Expenditures Savings
December 2019 MN CIP Report – CO2 Reduction and Results 8
Avoided CO2 Emissions
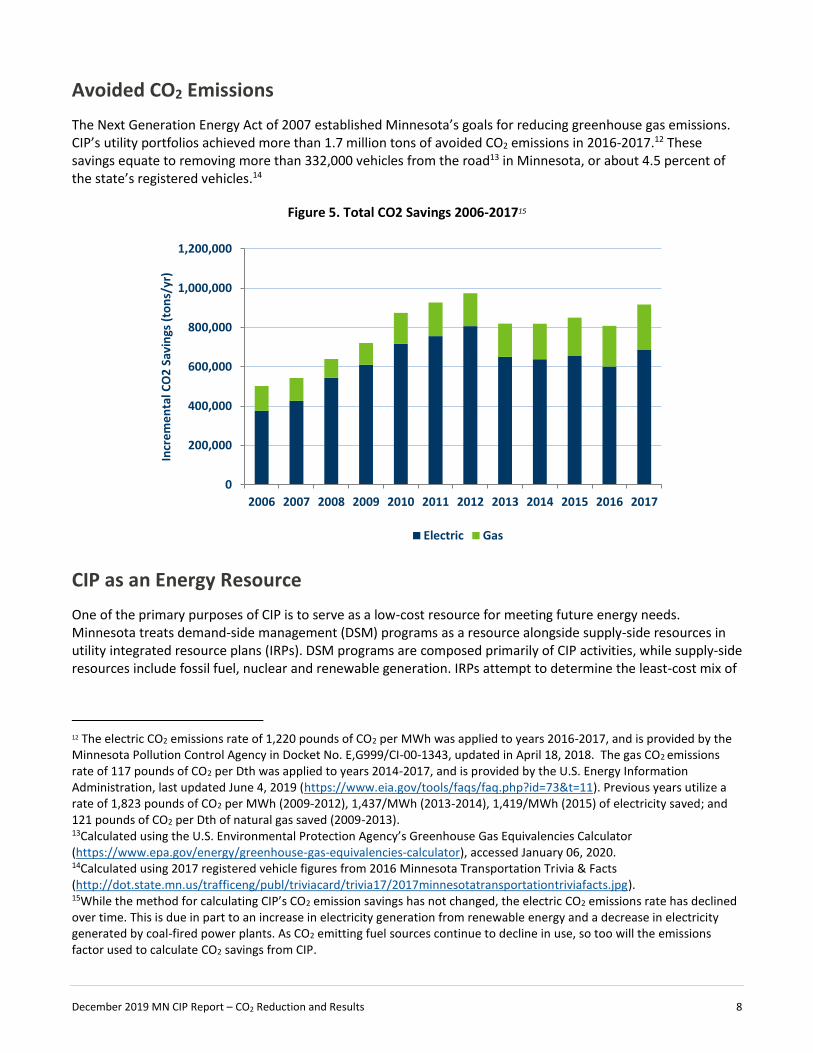
The Next Generation Energy Act of 2007 established Minnesota’s goals for reducing greenhouse gas emissions. CIP’s utility portfolios achieved more than 1.7 million tons of avoided CO2 emissions in 2016-2017.12 These savings equate to removing more than 332,000 vehicles from the road13 in Minnesota, or about 4.5 percent of the state’s registered vehicles.14
Figure 5. Total CO2 Savings 2006-201715
CIP as an Energy Resource
One of the primary purposes of CIP is to serve as a low-cost resource for meeting future energy needs. Minnesota treats demand-side management (DSM) programs as a resource alongside supply-side resources in utility integrated resource plans (IRPs). DSM programs are composed primarily of CIP activities, while supply-side resources include fossil fuel, nuclear and renewable generation. IRPs attempt to determine the least-cost mix of
12 The electric CO2 emissions rate of 1,220 pounds of CO2 per MWh was applied to years 2016-2017, and is provided by the Minnesota Pollution Control Agency in Docket No. E,G999/CI-00-1343, updated in April 18, 2018. The gas CO2 emissions rate of 117 pounds of CO2 per Dth was applied to years 2014-2017, and is provided by the U.S. Energy Information Administration, last updated June 4, 2019 (https://www.eia.gov/tools/faqs/faq.php?id=73&t=11). Previous years utilize a rate of 1,823 pounds of CO2 per MWh (2009-2012), 1,437/MWh (2013-2014), 1,419/MWh (2015) of electricity saved; and 121 pounds of CO2 per Dth of natural gas saved (2009-2013). 13Calculated using the U.S. Environmental Protection Agency’s Greenhouse Gas Equivalencies Calculator (https://www.epa.gov/energy/greenhouse-gas-equivalencies-calculator), accessed January 06, 2020. 14Calculated using 2017 registered vehicle figures from 2016 Minnesota Transportation Trivia & Facts (http://dot.state.mn.us/trafficeng/publ/triviacard/trivia17/2017minnesotatransportationtriviafacts.jpg). 15While the method for calculating CIP’s CO2 emission savings has not changed, the electric CO2 emissions rate has declined over time. This is due in part to an increase in electricity generation from renewable energy and a decrease in electricity generated by coal-fired power plants. As CO2 emitting fuel sources continue to decline in use, so too will the emissions factor used to calculate CO2 savings from CIP.
0
200,000
400,000
600,000
800,000
1,000,000
1,200,000
2006 2007 2008 2009 2010 2011 2012 2013 2014 2015 2016 2017
Incr
em
en
tal C
O2
Sav
ings
(to
ns/
yr)
Electric Gas

December 2019 MN CIP Report – CO2 Reduction and Results 9
supply resources for meeting the needs of an electric utility’s customers over the next 15 years. Utilities often select high levels of DSM to meet their needs because they are a lower-cost resource than supply-side options.
CIP is competitive with supply-side resources for many reasons. It requires a lower upfront investment than new power generation facilities, reduces total energy demand and delays the need for new power generation in Minnesota. It also increases utilities’ reliability by lowering the need to import fossil fuels from outside the state, which is important because Minnesota does not have any in-state fossil fuel resources.
Figure 6 compares the average levelized costs of CIP and other supply-side energy resources, highlighting CIP’s cost-effectiveness compared to other generation options.
Figure 6. Levelized Average Cost Comparison of CIP to Various Electricity Generation Options16
Figure Key
CIP = Levelized Average Cost of CIP in 2015-2017 Wind = Utility-scale wind energy plant CC = Natural gas-fired combined-cycle plant
Solar = Utility-scale solar energy plant CT =Natural gas-fired combustion turbine Coal = Conventional baseload coal plant
16 Source: Minnesota Department of Commerce (CIP data) and US Energy Information Administration’s Annual Energy Outlook 2018. (https://www.eia.gov/outlooks/archive/aeo18/pdf/electricity_generation.pdf).
$15.75 $48.00 $48.30 $59.10
$98.70
$119.10
$-
$50
$100
$150
$200
$250
$300
$350
$400
CIP Wind CC Solar CT Coal
20
17
$/M
Wh
Minimum Average Maximum

December 2019 MN CIP Report – CO2 Reduction and Results 10
Consumer and Business Benefits
CIP brings positive economic and societal benefits to Minnesota. An independent review examining the economic impact of CIP found that every one dollar that is spent on CIP returns four dollars to the state’s economy. This return on investment is created through job growth, economic surplus, lower utility costs and environmental benefits.17
CIP saved Minnesota’s businesses and residents more than $260 million in energy costs in 2016-2017.18 These savings are a major benefit that CIP provides to households and businesses all across the state. Consumers are able to use these savings to both improve their financial stability and support businesses in Minnesota. Businesses can use the savings to bolster their budgets and continue investing in improvements to the products and services they offer customers.
CIP and Minnesota’s Economy
Every county in Minnesota benefits from the jobs both created and retained in the energy efficiency sector. An analysis from 2019 shows that Minnesota has more than 46,000 jobs in the energy efficiency field, which represents the largest sector for Minnesota’s clean energy employment.19 CIP projects employ different trades throughout this sector, including HVAC, engineering, lighting, design and construction. CIP spending and investments help expand and protect these Minnesota energy efficiency jobs.
Figure 7. Clean Energy Employment Sector Breakdown by Sector
17 Minnesota Department of Commerce. The Aggregate Economic Impact of the Conservation Improvement Program 2008-2013. October 2015. Page 5 (http://mn.gov/commerce-stat/pdfs/card-report-aggregate-eco-impact-cip-2008-2013.pdf). 18 Based on a 10.27-cent average for the price of electricity (kWh) in Minnesota in 2017. (https://www.eia.gov/electricity/state/minnesota/index.php). In addition, a $6.35 price of natural gas (Dth) in Minnesota was derived by calculating a weighted average price of natural gas in the residential, commercial, and industrial sectors. (https://www.eia.gov/dnav/ng/ng_pri_sum_dcu_SMN_a.htm) (https://www.eia.gov/dnav/ng/ng_cons_sum_dcu_SMN_a.htm) 19 Based on Clean Jobs Midwest 2019 Minnesota report – showing 46,191 energy efficiency jobs in Minnesota and 61,046 total clean energy jobs. (https://www.e2.org/reports/clean-jobs-midwest-2019/).
46,191
8,098
6,757
Energy Efficiency Renewable Energy Other

December 2019 MN CIP Report – CO2 Reduction and Results 11
CIP Savings and Expenditures 20
Electric CIP Performance 2016 - 2017
Table 2. 2016 Electric CIP Performance
Organization
Incremental Energy Savings
(kWh/yr) Energy
Savings %
Incremental CO2 Savings
(tons/yr) Expenditures Expenditures %
Investor-Owned Utilities
Minnesota Power 64,117,319 2.13% 39,112 $ 7,451,958 3.2%
Otter Tail Power 57,586,050 2.75% 35,127 $ 7,770,781 5.0%
Xcel Energy 554,020,484 1.91% 337,952 $ 101,144,237 3.8%
Total - Investor-Owned Utilities 675,723,853 1.98% 412,192 $ 116,366,976 3.8%
Cooperative CIP Aggregators
Dairyland Power Coop 15,978,592 1.67% 9,746.94 $ 2,701,263 2.2%
East River Electric Power Coop 5,427,221 1.59% 3,310.60 $ 410,141 1.3%
Great River Energy (All-Rqmts Members) 97,003,793 1.06% 59,172.31 $ 17,803,450 1.7%
Great River Energy (Fixed Members) 29,912,019 0.88% 18,246.33 $ 4,455,256 1.4%
Minnkota Power Coop/NMPA - 17 of 18 members 31,584,595 1.76% 19,266.60 $ 2,787,417 1.4%
Total - Coop CIP Aggregators 179,906,220 1.15% 109,742.79 $28,157,527 1.6%
Municipal CIP Aggregators
CMMPA - 10 of 12 members 4,957,269 1.38% 3,024 $611,809 1.9%
MMPA - 7 of 11 members 4,889,312 0.86% 2,982 $537,421 1.5%
MRES - 23 of 24 members 24,992,691 1.05% 15,246 $4,681,850 2.3%
SMMPA - 15 of 18 members 7,720,381 0.83% 4,709 $2,604,547 2.9%
The Triad (SMMPA members) 35,596,157 1.86% 21,714 $5,079,667 2.6%
Total - Municipal CIP Aggregators 78,155,810 1.43% 47,675 $13,515,294 2.4%
20 For the tables in this section the following definitions apply: “Incremental energy savings” means first-year, annualized energy savings from newly installed measures, including avoided line losses for electric utilities. Includes savings from conservation improvements and electric utility infrastructure projects. “Energy Savings %” means energy savings from conservation improvements and electric utility infrastructure projects as a percent of annual retail sales, excluding sales to CIP-exempt customers. “Incremental CO2 Savings” means first-year, annualized carbon dioxide savings resulting from newly installed conservation improvements and electric utility infrastructure projects. “Expenditures” includes expenditures on conservation improvements only (excludes electric utility infrastructure projects.) “Expenditures %” means conservation improvement expenditures as a percent of gross operating revenues from service provided in the state, excluding sales to CIP-exempt customers. (Excludes spending on electric utility infrastructure projects.) All 2016 data was derived from ReportingESP as of August 2018. All 2017 data was derived from ReportingESP as of December 2019.
December 2019 MN CIP Report – CO2 Reduction and Results 12
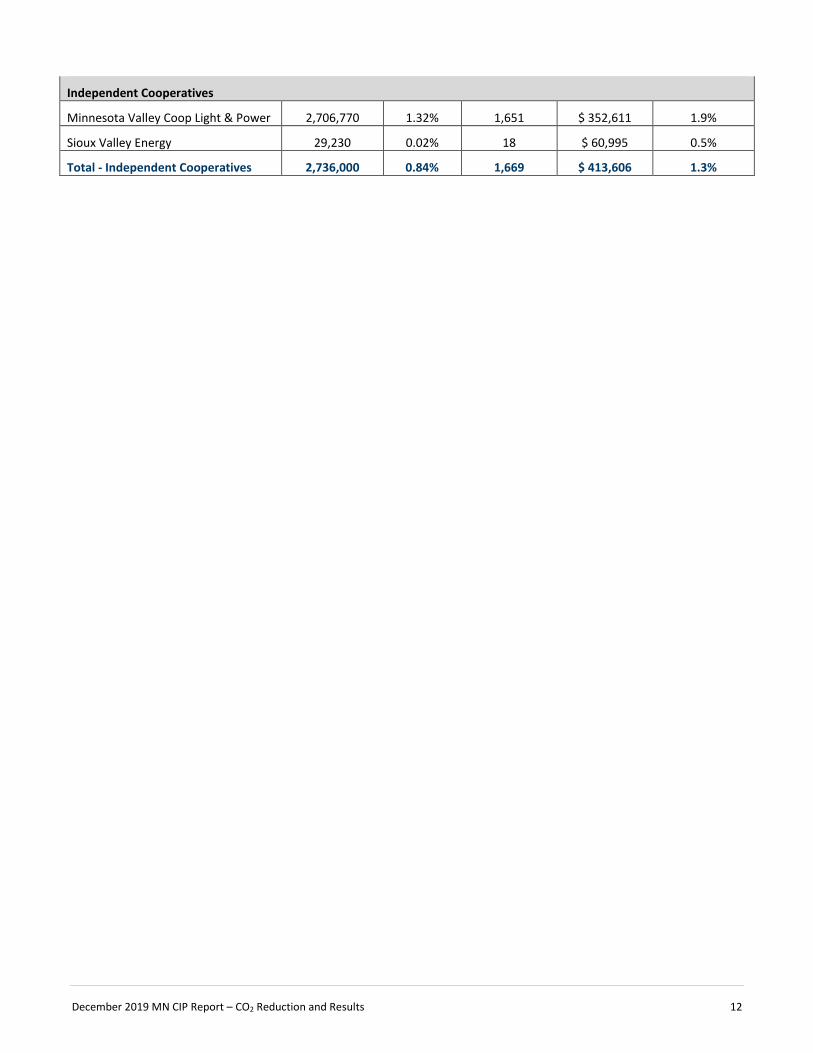
Independent Cooperatives
Minnesota Valley Coop Light & Power 2,706,770 1.32% 1,651 $ 352,611 1.9%
Sioux Valley Energy 29,230 0.02% 18 $ 60,995 0.5%
Total - Independent Cooperatives 2,736,000 0.84% 1,669 $ 413,606 1.3%

December 2019 MN CIP Report – CO2 Reduction and Results 13
Table 3. 2016 Electric CIP Performance (continued)
Organization
Incremental Energy Savings
(kWh/yr) Energy
Savings %
Incremental CO2 Savings
(tons/yr) Expenditures Expenditures
%
Independent Municipals
Aitkin Public Utilities 564,329 1.6% 344 $ 49,771 1.4%
Alvarado, City of 1,614 0.0% 1 $ 2,583 0.6%
Anoka, City of (MMPA member) 4,591,837 1.7% 2,801 $ 604,863 2.3%
Biwabik Public Utilities 130,959 2.0% 80 $ 11,948 1.8%
Brainerd Public Utilities 3,044,181 1.5% 1,857 $ 217,365 1.2%
Chaska, City of (MMPA Member) 5,469,697 1.6% 3,337 $ 562,462 1.6%
Delano Municipal Utilities 890,253 1.6% 543 $ 89,817 1.9%
East Grand Forks Water & Light Dept. (MMPA member) 2,903,825 1.8% 1,771 $ 275,849 2.0%
Ely, City of 599,617 1.6% 366 $ 55,167 1.6%
Gilbert Water & Light 167,950 1.6% 102 $ 11,416 1.0%
Glencoe Light & Power Commission 1,329,632 1.9% 811 $ 124,382 1.7%
Grand Rapids Public Utilities Commission 3,544,694 2.1% 2,162 $ 168,597 1.2%
Hibbing Public Utilities Commission 1,787,532 1.4% 1,090 $ 108,814 0.8%
Hutchinson Utilities Commission (MRES Member) 3,272,132 1.2% 1,996 $ 271,701 1.1%
Kandiyohi, City of 1,765 0.0% 1 $ 3,250 0.7%
Lake Crystal Municipal Utilities 393,456 2.4% 240 $ 40,510 1.3%
Madelia Municipal Light & Power 358,984 1.3% 219 $ 66,662 1.9%
Mountain Iron Water & Light Dept 335,698 1.5% 205 $ 18,122 0.7%
Nashwauk Public Utilities 179,115 1.7% 109 $ 20,202 3.2%
New Ulm Public Utilities 3,909,081 2.1% 2,385 $ 265,665 1.2%
Pierz Utilities 300,668 3.1% 183 $ 10,492 1.1%
Proctor Public Utilities 366,843 1.5% 224 $ 30,329 1.4%
Randall Electric, City of 8,009 0.2% 5 $ 2,157 0.5%
Round Lake, City of 1,694 0.0% 1 $ 400 0.1%
Shakopee Public Utilities (MMPA member) 9,504,448 2.4% 5,798 $ 989,500 2.3%
St. Charles Light & Water 379,568 1.8% 232 $93,106 3.5%
Truman Public Utilities 106,698 0.9% 65 $ 25,455 1.4%
Two Harbors, City of 481,198 1.7% 294 $ 59,814 1.8%
Virginia Dept. of Public Utilities 2,253,266 1.9% 1,374 $ 360,676 2.6%
Warroad Municipal Light & Power (NMPA member) 30,461 0.1% 19 $ 67,014 1.4%
Willmar Municipal Utilities 2,753,716 1.0% 1,680 $ 381,689 1.5%
Total - Independent Municipals 49,662,920 1.7% 30,294 $ 4,989,778 1.7%
TOTAL - COOPS & MUNICIPALS 310,460,950 1.27% 189,381 $ 47,076,205 1.81%
TOTAL - ELECTRIC UTILITIES 986,184,803 1.69% 601,573 $ 163,443,181 2.9%

December 2019 MN CIP Report – CO2 Reduction and Results 14
Table 4. 2017 Electric CIP Performance21
Organization
Incremental Energy Savings
(kWh/yr)
Energy Savings
%
Incremental CO2 Savings
(tons/yr) Expenditures Expenditures
%
Investor-Owned Utilities
Minnesota Power 72,467,019 2.64% 44,205 $8,129,337 5.0%
Otter Tail Power 52,497,167 3.01% 32,023 $6,491,039 4.2%
Xcel Energy 660,435,156 2.30% 402,865 $109,109,805 3.8%
Totals - Investor-Owned Utilities 785,399,342 2.36% 479,094 $123,730,181 3.9%
Cooperative CIP Aggregators - CIP Statute
Dairyland Power Coop 19,378,633 1.69% 11,821 $2,296,014 1.8%
Great River Energy (All-Rqmts Members) 129,126,435 1.41% 78,767 $18,818,000 1.9%
Great River Energy (Fixed Members) 26,303,903 0.85% 16,045 $3,464,675 1.1%
Minnkota Power Coop/NMPA 21,920,274 1.78% 13,371 $1,577,448 1.2%
Totals - Coop CIP Aggregators - CIP Statute 196,729,245 1.34% 120,005 $26,156,138 1.7%
Cooperative CIP Aggregators - Voluntary
Great River Energy (All-Rqmts Members) 3,426,364 1.06% 2,090 $600,876 1.7%
Great River Energy (Fixed Members) 10,626,568 1.56% 6,482 $1,304,184 2.1%
Minnkota Power Coop/NMPA 5,681,042 2.37% 3,465 $362,076 1.4%
Totals - Coop CIP Aggregators - Voluntary 19,733,975 1.59% 12,038 $2,267,137 1.8%
Municipal CIP Aggregators - CIP Statute
CMMPA 8,754,524 3.07% 5,340 $610,038 2.1%
MMPA 4,169,577 1.31% 2,543 $522,406 1.5%
MRES 27,483,145 1.19% 16,765 $4,276,296 2.2%
SMMPA 13,939,675 1.51% 8,503 $2,771,909 3.1%
The Triad 43,250,827 2.27% 26,383 $5,113,402 2.6%
Totals - Municipal CIP Aggregators - CIP Statute 97,597,748 1.70% 59,535 $13,294,050 2.4%
Municipal CIP Aggregators - Voluntary
CMMPA 100,528 0.81% 61 $12,083 1.1%
MMPA 325,261 1.62% 198 $30,985 1.5%
SMMPA 310,227 2.36% 189 $121,712 8.7%
Totals - Municipal CIP Aggregators - Voluntary 736,015 1.61% 449 $164,779 3.6%
21 Note: Minnesota Session Law Chapter 94, Article 10, Section 10-12 amending § 216B.241 was signed into law May 30, 2017. Contained in this law was a provision modifying § 216B.241 to establish exempt status to municipalities that provide electric service to 1,000 retail customers or less and to cooperative electric associations that provide retail service to 5,000 members or less. These modifications took effect May 31, 2017. As a result of these modifications, a number of munis and coops are now exempt from § 216B.241 (see Appendix C for list of exempt utilities), but some voluntarily continued to offer conservation programs and report their results and plans through the CIP reporting process (these are distinguished in the tables as “Voluntary”).

December 2019 MN CIP Report – CO2 Reduction and Results 15
Table 5. 2017 Electric CIP Performance (continued)
Organization
Incremental Energy Savings
(kWh/yr)
Energy Savings
%
Incremental CO2 Savings
(tons/yr) Expenditures Expenditures
%
Independent Municipals - CIP Statute
Ada, City of NA NA NA NA NA
Aitkin Public Utilities 514,451 1.47% 314 $52,875 1.46%
Anoka, City of 4,384,377 1.59% 2,674 $572,265 2.06%
Brainerd Public Utilities 2,932,668 1.56% 1,789 $194,345 1.07%
Caledonia Electric Dept., City of NA NA NA NA NA
Chaska, City of 5,920,492 1.71% 3,612 $533,544 1.51%
Delano Municipal Utilities 928,892 1.66% 567 $49,776 0.95%
East Grand Forks Water & Light Dept. 5,487,113 3.45% 3,347 $335,807 2.41%
Ely, City of 594,322 1.57% 363 $71,480 2.04%
Glencoe Light & Power Commission 1,224,982 1.68% 747 $127,385 1.59%
Grand Rapids Public Utilities Commission 2,509,945 1.51% 1,531 $224,411 1.52%
Hibbing Public Utilities Commission 1,074,312 0.86% 655 $87,882 0.66%
Hutchinson Utilities Commission 3,496,383 1.23% 2,133 $208,941 0.83%
Madelia Municipal Light & Power 431,687 1.60% 263 $85,014 2.24%
Mountain Iron Water & Light Dept 496,230 2.16% 303 $72,709 2.96%
New Ulm Public Utilities 1,641,404 0.87% 1,001 $251,907 1.15%
Proctor Public Utilities 376,208 1.51% 229 $28,852 1.45%
Shakopee Public Utilities 7,500,016 1.88% 4,575 $607,425 1.46%
St. Charles Light & Water 314,025 1.46% 192 $104,263 3.74%
Two Harbors, City of 606,218 2.19% 370 $54,601 1.55%
Virginia Dept. of Public Utilities 1,501,816 1.29% 916 $162,051 1.22%
Willmar Municipal Utilities 1,783,174 0.64% 1,088 $382,484 1.32%
Totals - Independent Municipals - CIP Statute 43,718,716 1.53% 26,668 $4,208,016 1.46%
Independent Municipals - Voluntary
Gilbert Water & Light 19,179 0.18% 12 $5,716 0.5%
Lake Crystal Municipal Utilities 342,061 2.1% 209 $34,293 1.4%
Nashwauk Public Utilities 215,089 1.5% 131 $23,410 1.7%
Warroad Municipal Light & Power 59,709 0.1% 36 $62,086 1.6%
Totals - Independent Municipals - Voluntary 636,038 0.7% 388 $125,505 1.4%
TOTALS - COOPS & MUNICIPALS - CIP STATUTE 338,045,709 1.45% 206,208 43,658,204 1.82%
TOTALS - ELECTRIC UTILITIES - CIP STATUTE 1,123,445,051 1.99% 685,301 $167,388,38
4.89 3.0%

December 2019 MN CIP Report – CO2 Reduction and Results 16
Gas CIP Performance 2016 - 2017
Table 6. 2016 Natural Gas CIP Performance
Organization
Incremental Energy Savings
(Dth/yr) Energy
Savings %
Incremental CO2 Savings
(tons/yr) Expenditures Expenditures %
Investor-Owned Utilities
CenterPoint Energy 2,006,014 1.47% 117,452 $ 29,228,533 3.3%
Great Plains Natural Gas 56,669 1.02% 3,318 $ 642,143 2.1%
Greater Minnesota Gas 9,426 2.09% 552 $ 116,816 2.5%
Minnesota Energy Resources 472,000 1.09% 27,636 $ 9,198,728 3.5%
Xcel Energy 908,472 1.31% 53,191 $ 13,802,080 2.6%
Total - Investor-Owned Utilities 3,452,581 1.35% 202,149 $ 52,988,300 3.1%
Municipal Aggregator
The Triad 45,335 1.04% 2,654 $ 555,367 1.2%
Independent Municipals
Duluth Public Works & Utilities 21,507 0.4% 1,259 $ 636,862 1.1%
Hutchinson Utilities Commission (MRES Member) 5,503 0.3% 322 $ 87,000 0.6%
New Ulm Public Utilities 3,814 0.4% 223 $ 67,286 0.6%
Perham Natural Gas 826 0.1% 48 $ 35,000 0.4%
Total - Independent Municipals 31,650 0.4% 1,853 $ 826,148 0.9%
TOTAL - MUNICIPALS 76,985 0.6% 4,507 $ 1,381,515 1.0%
TOTAL - GAS UTILITIES 3,529,566 1.31% 206,656 $ 54,369,815 2.9%
December 2019 MN CIP Report – CO2 Reduction and Results 17
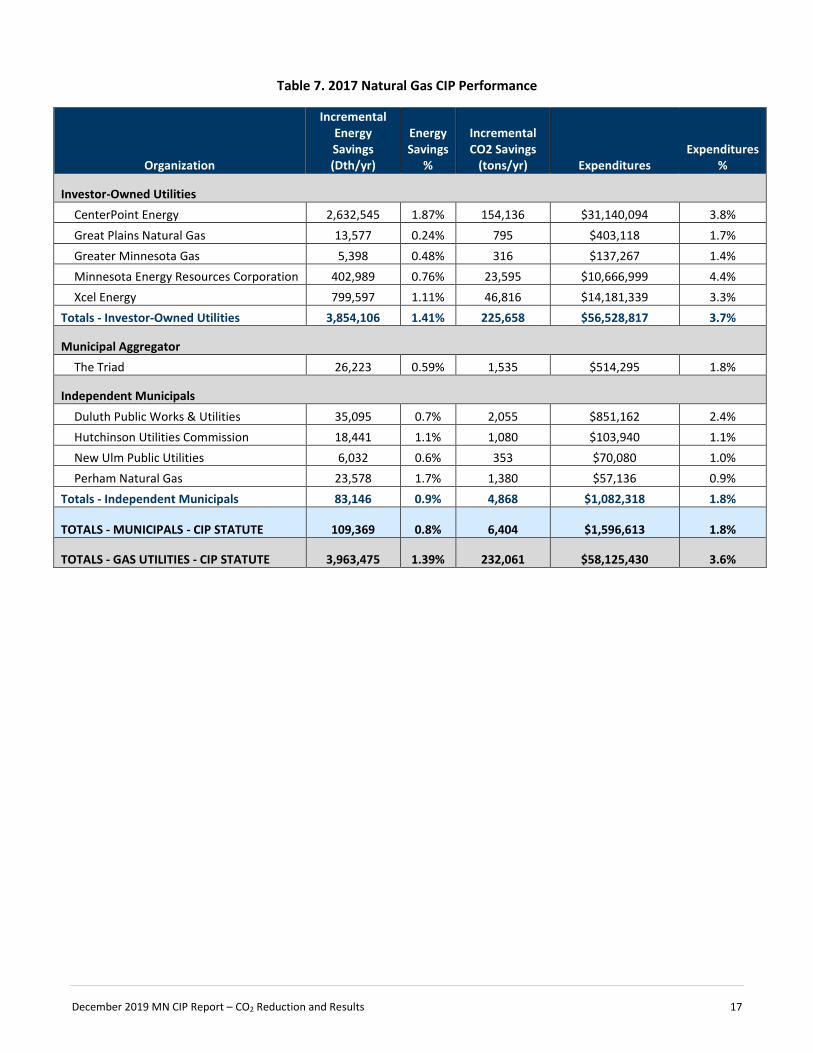
Table 7. 2017 Natural Gas CIP Performance
Organization
Incremental Energy Savings (Dth/yr)
Energy Savings
%
Incremental CO2 Savings
(tons/yr) Expenditures Expenditures
%
Investor-Owned Utilities
CenterPoint Energy 2,632,545 1.87% 154,136 $31,140,094 3.8%
Great Plains Natural Gas 13,577 0.24% 795 $403,118 1.7%
Greater Minnesota Gas 5,398 0.48% 316 $137,267 1.4%
Minnesota Energy Resources Corporation 402,989 0.76% 23,595 $10,666,999 4.4%
Xcel Energy 799,597 1.11% 46,816 $14,181,339 3.3%
Totals - Investor-Owned Utilities 3,854,106 1.41% 225,658 $56,528,817 3.7%
Municipal Aggregator
The Triad 26,223 0.59% 1,535 $514,295 1.8%
Independent Municipals
Duluth Public Works & Utilities 35,095 0.7% 2,055 $851,162 2.4%
Hutchinson Utilities Commission 18,441 1.1% 1,080 $103,940 1.1%
New Ulm Public Utilities 6,032 0.6% 353 $70,080 1.0%
Perham Natural Gas 23,578 1.7% 1,380 $57,136 0.9%
Totals - Independent Municipals 83,146 0.9% 4,868 $1,082,318 1.8%
TOTALS - MUNICIPALS - CIP STATUTE 109,369 0.8% 6,404 $1,596,613 1.8%
TOTALS - GAS UTILITIES - CIP STATUTE 3,963,475 1.39% 232,061 $58,125,430 3.6%
December 2019 MN CIP Report – CO2 Reduction and Results 18
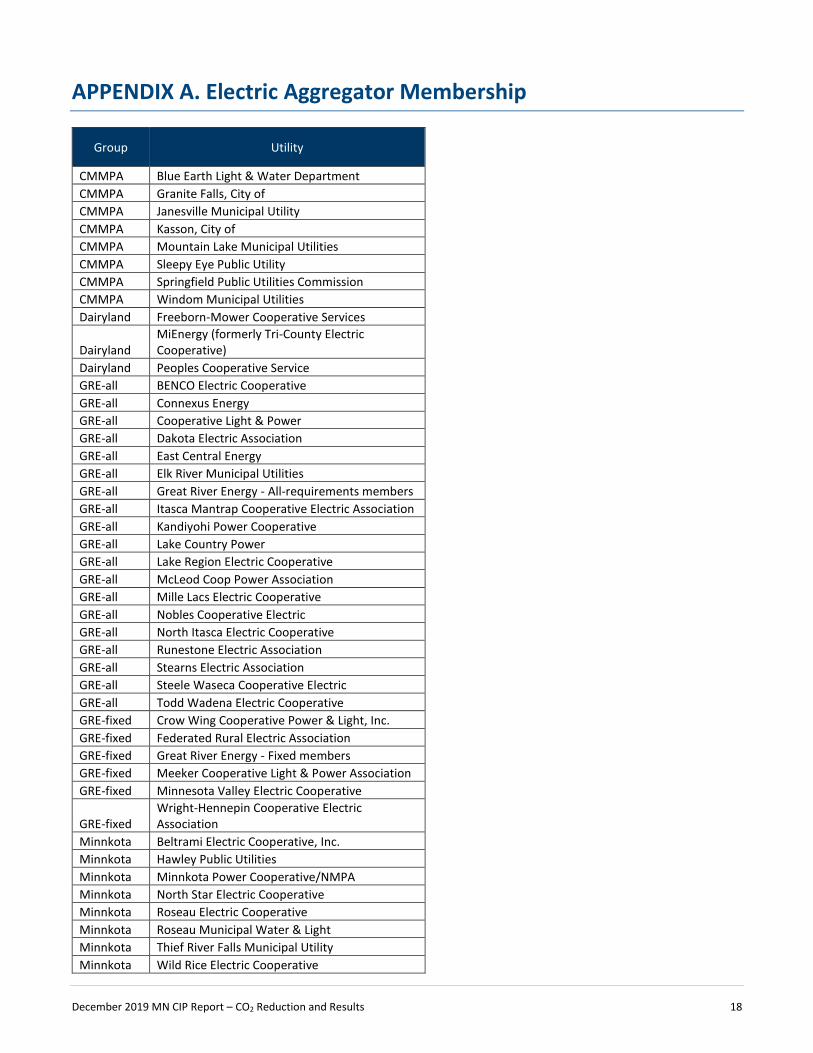
APPENDIX A. Electric Aggregator Membership
Group Utility
CMMPA Blue Earth Light & Water Department
CMMPA Granite Falls, City of
CMMPA Janesville Municipal Utility
CMMPA Kasson, City of
CMMPA Mountain Lake Municipal Utilities
CMMPA Sleepy Eye Public Utility
CMMPA Springfield Public Utilities Commission
CMMPA Windom Municipal Utilities
Dairyland Freeborn-Mower Cooperative Services
Dairyland MiEnergy (formerly Tri-County Electric Cooperative)
Dairyland Peoples Cooperative Service
GRE-all BENCO Electric Cooperative
GRE-all Connexus Energy
GRE-all Cooperative Light & Power
GRE-all Dakota Electric Association
GRE-all East Central Energy
GRE-all Elk River Municipal Utilities
GRE-all Great River Energy - All-requirements members
GRE-all Itasca Mantrap Cooperative Electric Association
GRE-all Kandiyohi Power Cooperative
GRE-all Lake Country Power
GRE-all Lake Region Electric Cooperative
GRE-all McLeod Coop Power Association
GRE-all Mille Lacs Electric Cooperative
GRE-all Nobles Cooperative Electric
GRE-all North Itasca Electric Cooperative
GRE-all Runestone Electric Association
GRE-all Stearns Electric Association
GRE-all Steele Waseca Cooperative Electric
GRE-all Todd Wadena Electric Cooperative
GRE-fixed Crow Wing Cooperative Power & Light, Inc.
GRE-fixed Federated Rural Electric Association
GRE-fixed Great River Energy - Fixed members
GRE-fixed Meeker Cooperative Light & Power Association
GRE-fixed Minnesota Valley Electric Cooperative
GRE-fixed Wright-Hennepin Cooperative Electric Association
Minnkota Beltrami Electric Cooperative, Inc.
Minnkota Hawley Public Utilities
Minnkota Minnkota Power Cooperative/NMPA
Minnkota North Star Electric Cooperative
Minnkota Roseau Electric Cooperative
Minnkota Roseau Municipal Water & Light
Minnkota Thief River Falls Municipal Utility
Minnkota Wild Rice Electric Cooperative

December 2019 MN CIP Report – CO2 Reduction and Results 19
Group Utility
MMPA Arlington, City of
MMPA Buffalo, City of
MMPA Le Sueur Municipal Utilities
MMPA Minnesota Municipal Power Agency
MMPA North St Paul, City of
MMPA Olivia, City of
MRES Alexandria Light & Power
MRES Barnesville Municipal Power
MRES Benson Municipal Utilities
MRES Breckenridge Public Utilities
MRES Detroit Lakes Public Utility
MRES Jackson, City of
MRES Luverne, City of
MRES Marshall Municipal Utilities
MRES Melrose Public Utilities
MRES Moorhead Public Service
MRES Ortonville Light Department
MRES Sauk Centre Public Utilities
MRES St. James Municipal Light & Power
MRES Staples, City of
MRES Wadena Light & Water
MRES Worthington Public Utilities
SMMPA Blooming Prairie Public Utilities
SMMPA Fairmont Public Utilities
SMMPA Grand Marais Public Utilities
SMMPA Lake City Utility Board
SMMPA Litchfield Public Utilities
SMMPA Mora Municipal Utilities
SMMPA New Prague Utilities Commission
SMMPA North Branch Municipal Water & Light
SMMPA Princeton Public Utilities
SMMPA Redwood Falls Public Utilities
SMMPA Spring Valley Public Utilities Commission
SMMPA St. Peter Municipal Utilities
SMMPA Waseca Utility
SMMPA Wells Public Utilities
Triad Austin Utilities
Triad Owatonna Public Utilities
Triad Rochester Public Utilities
APPENDIX B. Gas Aggregator Membership
Group Utility
Triad Austin Utilities
Triad Owatonna Public Utilities

December 2019 MN CIP Report – CO2 Reduction and Results 20
APPENDIX C. 2017 Exempt and Voluntary Utilities
Group Utility
Exe
mp
t
Vo
lun
tary
CMMPA Fairfax Municipal x x
GRE-all Arrowhead Electric Cooperative, Inc x x
GRE-all Brown County Rural Electrical Association x x
GRE-all Goodhue County Cooperative Electric Association x x
GRE-fixed Agralite Cooperative x x
GRE-fixed Redwood Electric Cooperative x x
GRE-fixed South Central Electric Association x x
Minnkota Alvarado, City of x x
Minnkota Bagley Public Utilities Commission x x
Minnkota Baudette, City of x x
Minnkota Fosston Municipal Utilities x x
Minnkota Red River Valley Cooperative Power Association x x
Minnkota Stephen Electric Department x x
Minnkota Warren, City of x x
MMPA Brownton Municipal Light & Power x x
MMPA Winthrop, City of x x
SMMPA Preston Public Utilities x x
Gilbert Water & Light x x
Lake Crystal Municipal Utilities x x
Nashwauk Public Utilities x x
Warroad Municipal Light & Power x x
Adrian Public Utilities x
Alpha, City of x
Bigelow, City of x
Biwabik Public Utilities x
Brewster Light & Power, City of x
Buhl Public Utilities x
Ceylon Public Utilities x
Clearwater Polk Electric Cooperative x
Dundee, City of x
Dunnell, City of x
Eitzen Light and Power x
Elbow Lake Municipal Power x
Grove City Electric Department x
Halstad Municipal Utilities x
Harmony, City of x
H-D Electric Cooperative, Inc x
Heartland Power Cooperative x
Henning Electric Dept, City of x
Iowa Lakes Electric Cooperative x
Kandiyohi, City of x
Kasota, City of x

December 2019 MN CIP Report – CO2 Reduction and Results 21
Group Utility
Exe
mp
t
Vo
lun
tary
Keewatin Public Utilities x
Kenyon Municipal Utilities x
Lake Park Public Utilities x
Lakefield Municipal Utilities x
Lanesboro Public Utility x
Lyon-Lincoln Electric Cooperative, Inc. x
Mabel, City of x
Madison Municipal Utilities x
Minnesota Valley Coop Light & Power Association x
Moose Lake Water & Light Commission x
NewFolden, City of x
Nielsville, City of x
Northwestern Wisconsin Electric Company x
Peterson Electric System, City of x
Pierz Utilities x
PKM Electric Cooperative, Inc x
Randall Electric, City of x
Red Lake Electric Cooperative x
Renville-Sibley Cooperative Power Association x
Round Lake, City of x
Rushford, City of x
Rushmore, City of x
Shelly Municipal Light Department x
Sioux Valley Energy x
Spring Grove, City of x
Traverse Electric Cooperative, Inc x
Truman Public Utilities x
Tyler, City of x
Westbrook Public Utilities x
Whalan, City of x
APPENDIX D. CIP Regulatory Process Information
CIP regulatory process
Commerce is responsible for reviewing and approving utility CIP plans and annual status reports. All Minnesota utilities report their annual budget and actual program data in ReportingESP™, a cloud-based energy efficiency data management system developed by Energy Platforms, LLC. Investor-owned utilities (IOUs) are required to

December 2019 MN CIP Report – CO2 Reduction and Results 22
file three-year (triennial) plans and annual status reports through eDockets. Consumer-owned utilities (municipal utilities or electric cooperatives) file annual plans on Commerce’s Energy Savings Platform.22
As part of the CIP plan review process, Commerce staff evaluate the cost-effectiveness of the measures and programs proposed by each utility. Under CIP administrative rules23, Minnesota uses four of the five standard benefit-cost tests included in the California Standard Practice Manual for Economic Analysis of Demand-side Programs and Projects.24 The Societal test, which compares some of the benefits to society of a program or measure to its total costs, is used to screen programs for cost-effectiveness. After Commerce staff complete their review, the Commissioner of Commerce or his/her delegated authority (currently, the Deputy Commissioner of the Division of Energy Resources) approves each utility’s plan as filed or with modifications.
On an annual basis, both investor-owned and consumer-owned utilities submit status reports summarizing the CIP expenditures, participation and savings achieved the previous year. Commerce reviews these reports to ensure the reasonableness of reported savings, that portfolios are cost-effective, and that relevant statutory requirements were met.
Minnesota statutes include mechanisms for IOUs to recover the costs of implementing CIP programs and earn a performance incentive based on the level of savings and amount of net benefits achieved.25 Most IOUs file their status reports as part of larger consolidated filings that include proposed adjustments to CIP cost-recovery riders based on the previous year’s expenditures and performance incentive earned. Concurrent with the status report review process, Commerce staff review the proposed cost-recovery adjustments and file recommendations concerning the proposed adjustments to the Commission. After considering Commerce’s recommendations and any public comments filed, the Commission then approves the proposed adjustments as is or with modifications.
For cooperative and municipal utilities, local utility commissions, boards or city councils determine their own cost-recovery mechanisms.
22 The Energy Savings Platform® (ESP) was developed through a public-private partnership with Energy Platforms, LLC, and is a tool for ensuring that utility EE programs are cost-effective, achieving their approved energy savings goals, and meeting the requirements of Minnesota State law. ReportingESP is Minnesota’s designated tool for energy efficiency program reporting by utilities, and serves as a central database of energy efficiency data. 23 Minnesota Rules chapter 7690.0500. 24 http://www.calmac.org/events/spm_9_20_02.pdf 25 Minn. Stat. §216B.16, subd. 6b and 6c.
Related Documents