Conservation and Current Production Margins: Is Water Quality Compatible With My Cost Structure?

Welcome message from author
This document is posted to help you gain knowledge. Please leave a comment to let me know what you think about it! Share it to your friends and learn new things together.
Transcript
Conservation and Current Production Margins:
Is Water Quality Compatible With My Cost Structure?

No
Questions?

3
Jason Gomes• CCA• Northeast and East Central
Iowa• Independent Agronomy
Services, NRCS Technical Service Provider
North Iowa Agronomy Partners, LLC• Agronomy, Nutrient
Management, Soil Sampling, Crop Planning, Product Recs, etc.
• Conservation Planning, Technical Assistance and Outreach in Upper/Middle Cedar Watersheds
•

Current Projects:
Middle Cedar Partnership ProjectCity of Cedar Rapids, Miller Creek & Benton-Tama WQI Projects
Middle Cedar Watershed Management Authority
Midwest Ag RCPPIowa Department of Ag and Land Stewardship
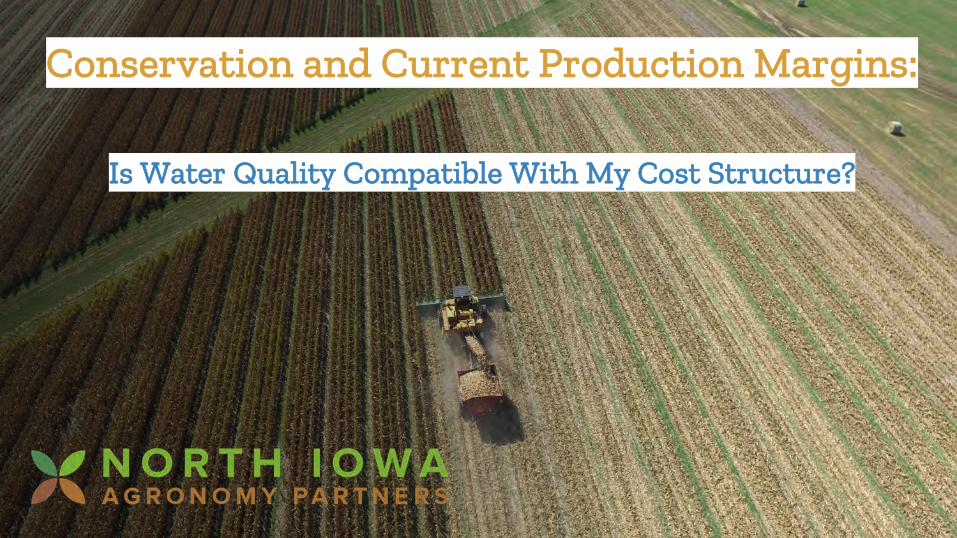
Our Role
• Technical Assistance• Conservation Planning• Outreach
• Facilitate access to financial assistance

6
T-Charts & Partial Budgets
Compares total benefits/total costs
Quantifiable economic outcomes only – excludes social, environmental costs/benefits
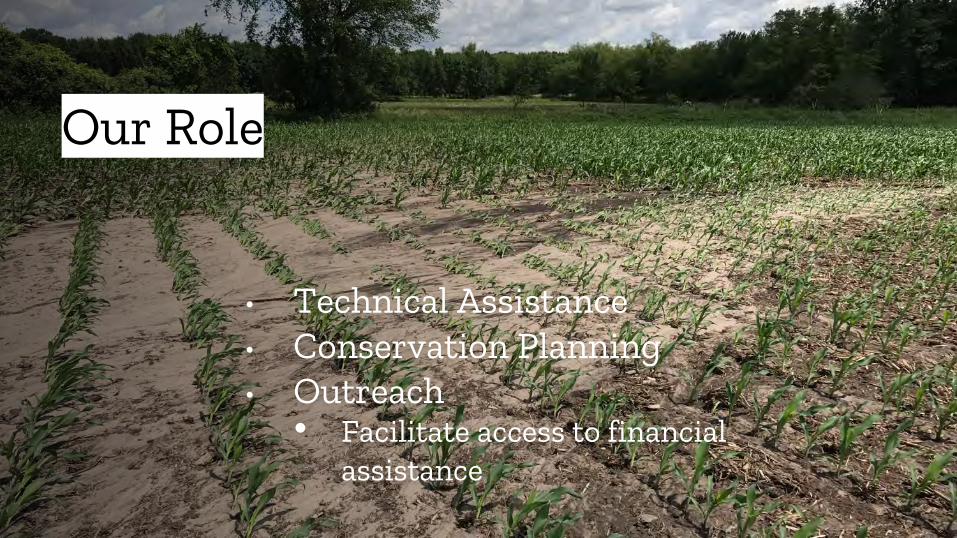
Net Returns:N-Rate: $5-7/ac
5-10% N Load Reduction
VRT Phos w/ Zero Rate: $6/ac17% Phos. Load Reduction
Cover Crop following Corn: $15-35/ac Cost Shareminus $14-24/ac variable costs31% N Load Reduction29% Phos Load Reduction
8
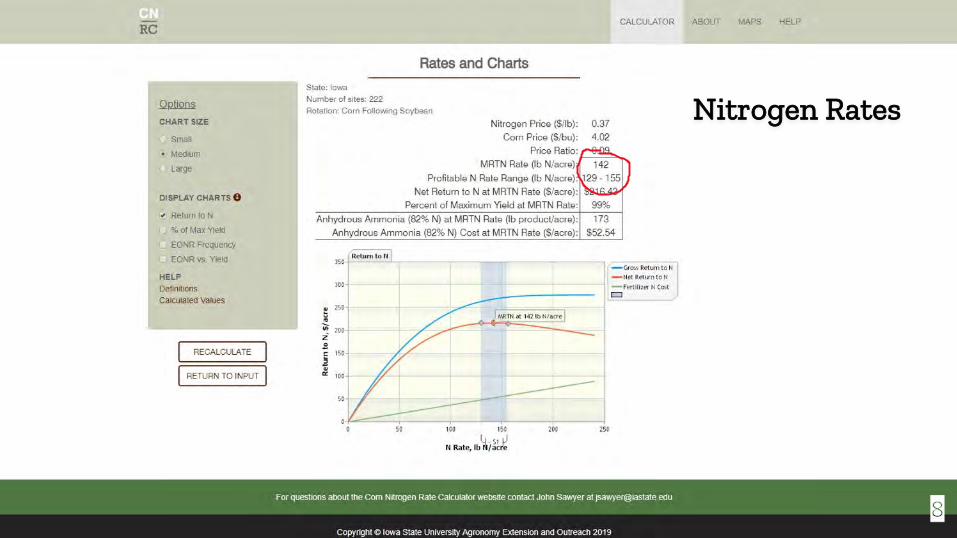
Nitrogen Rates

• Total N Rates• Measure total
applied nitrogen
• Eliminate “wasted” N (DAP, MAP)
• Use a nitrification inhibitor for Fall N
• Net Savings: $5-7/ac
• % Nitrate-N Reduction: 5-10%

Historic Rainfall:
10

Phosphorus Rates
• Optimum = 25% Chance of Profitable Yield Response• High = Less than 5% Chance of a Profitable Yield Response

Phosphorus Rates
• Optimum = 25% Chance of Yield Response
• High = Less than 5% Chance of Yield Response
• NE Iowa: Fall P2O5 - $0.47/lb Spring P2O5 - $0.514

2008-2017 Mehlich3 P Test Values (Ag Source Labs, Ellsworth)
All of Iowa
N East Iowa NIAP
2017 Average AverageAverage
Spring Avg 44.0 43.7 47.8Fall Avg 40.3 42.8 41.8Annual Avg 41.5 43.2 43.0
3633 32 33
37 3943 42
3842
20
25
30
35
40
45
2008 2009 2010 2011 2012 2013 2014 2015 2016 2017P,
ppm
Iowa Soil Phosphorus Averages

Nutrient Management:How do tighter margins drive decisions?
Nitrogen
Higher N rates, fall application, and additional drainage tile as a response to climate uncertainty.
Full rate of N-Serve = $10-11/ac, Fall NH3 = $0.28/unit N.
Phosphorus
Soil as a “bank” for excess fertility. If I can eliminate chemical fertility as a yield limiting factor, why wouldn’t I?
Tax liability management.
How accurate are soil tests anyway?

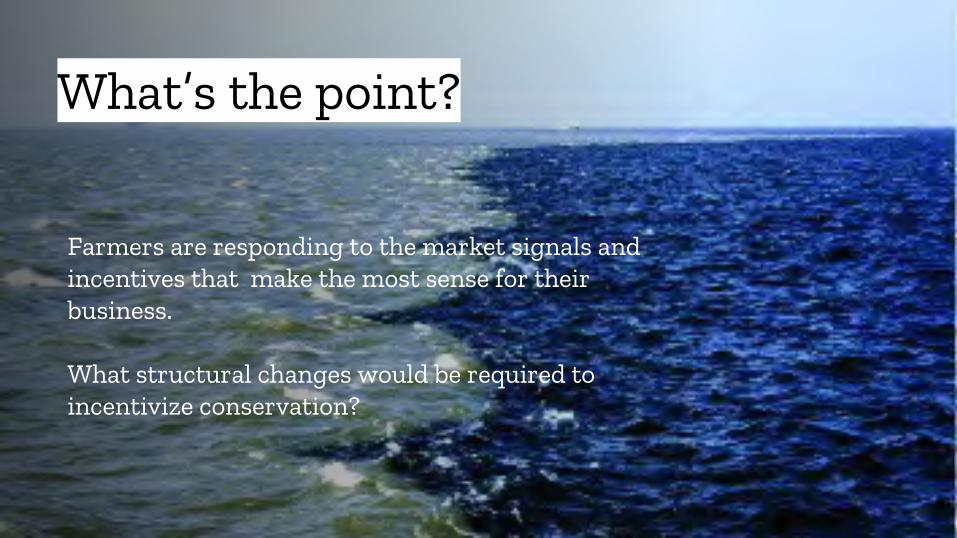
What’s the point?
Farmers are responding to the market signals and incentives that make the most sense for their business.
What structural changes would be required to incentivize conservation?
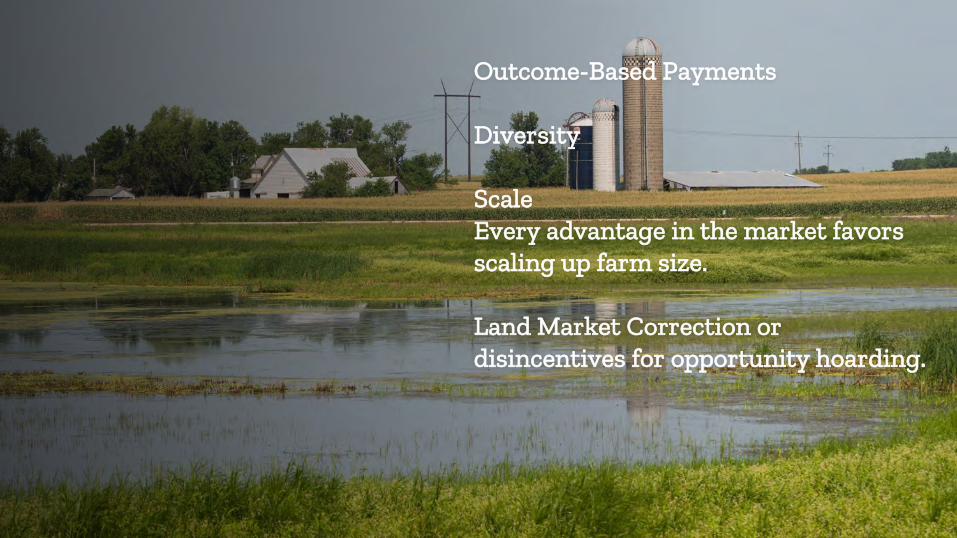
Outcome-Based Payments
Diversity
ScaleEvery advantage in the market favors scaling up farm size.
Land Market Correction or disincentives for opportunity hoarding.

Related Documents