Hindawi Publishing Corporation PPAR Research Volume 2011, Article ID 256186, 10 pages doi:10.1155/2011/256186 Research Article Consequences of PPARα Invalidation on Glutathione Synthesis: Interactions with Dietary Fatty Acids Najoua Guelzim, 1, 2 Jean-Franc ¸ois Huneau, 1, 2 V´ eronique Math´ e, 1, 2 Annie Quignard-Boulang´ e, 1, 2 Pascal G. Martin, 3 Daniel Tom´ e, 1, 2 and Dominique Hermier 1, 2 1 INRA, UMR914 Nutrition Physiology and Ingestive Behavior, F-75005 Paris, France 2 AgroParisTech, UMR914 Nutrition Physiology and Ingestive Behavior, F-75005 Paris, France 3 INRA, UR66 ToxAlim, Laboratoire de Pharmacologie et Toxicologie, Toulouse, France Correspondence should be addressed to Dominique Hermier, [email protected] Received 26 April 2011; Revised 26 June 2011; Accepted 11 July 2011 Academic Editor: Stephane Mandard Copyright © 2011 Najoua Guelzim et al. This is an open access article distributed under the Creative Commons Attribution License, which permits unrestricted use, distribution, and reproduction in any medium, provided the original work is properly cited. Glutathione (GSH) derives from cysteine and plays a key role in redox status. GSH synthesis is determined mainly by cysteine availability and γ-glutamate cysteine ligase (γGCL) activity. Because PPARα activation is known to control the metabolism of certain amino acids, GSH synthesis from cysteine and related metabolisms were explored in wild-type (WT) and PPARα-null (KO) mice, fed diets containing either saturated (COCO diet) or 18 : 3 n-3, LIN diet. In mice fed the COCO diet, but not in those fed the LIN diet, PPARα deficiency enhanced hepatic GSH content and γGCL activity, superoxide dismutase 2 mRNA levels, and plasma uric acid concentration, suggesting an oxidative stress. In addition, in WT mice, the LIN diet increased the hepatic GSH pool, without effect on γGCL activity, or change in target gene expression, which rules out a direct effect of PPARα. This suggests that dietary 18 : 3 n-3 may regulate GSH metabolism and thus mitigate the deleterious effects of PPARα deficiency on redox status, without direct PPARα activation. 1. Introduction PPARα is a major regulator of the macronutrient metab- olism, especially during the fed-to-fasting transition [1]. Formerly, PPARα has been involved in the regulation of lipid metabolism, including cellular uptake of fatty acids, intra- cellular fatty acid binding and activation, microsomal ω- oxidation, β-oxidation and ketogenesis, and synthesis of li- poproteins [2, 3]. Later on, PPARα effects have been shown to extend to a number of target genes involved in the metab- olism of glucose, glycerol and glycogen, and bile acids, as well as in inflammation, detoxification, and hepatocarcinogenesis [4, 5]. More recently, PPARα has also been shown to play a role in amino acid metabolism, through the regulation of a number of hepatic target genes involved in transamination, deamination, and urea synthesis [6–8]. Beyond nutritional situations, interest in PPARα effects on amino acids metabolism can also be considered in light of the involvement of specific amino acids in physiopatholog- ical processes associated with the metabolic syndrome. We have recently shown that PPARα deficiency decreases whole body nitric oxide (NO) synthesis from arginine, suggesting a beneficial effect of PPARα on vascular function [9]. Cysteine is a second amino acid of which metabolism might be of importance in the context of metabolic syndrome. Indeed, cysteine is the rate-limiting substrate for the synthesis of glutathione (GSH) [10], a major endogenous antioxidant, protecting cells from reactive oxygen species (ROS). Most of the GSH is utilized in antioxidant defence via the glutathione peroxidase (GPX) enzyme family to neutralize ROS and pro- tect the body from their noxious effect [11]. GSH synthesis is a two-step process. The first rate-limiting step is the conden- sation of cysteine and glutamate to γ-glutamylcysteine and is catalyzed by γ-glutamate cysteine ligase (γGCL). While GSH synthesis occurs in every tissue, the liver plays a prominent role in whole body GSH flux [12]. A growing number of studies support a link between glutathione synthesis and utilization and the metabolic syndrome. Alterations in glutathione status and utilisation are long-recognized hallmarks of metabolic syndrome-associated oxidative stress

Welcome message from author
This document is posted to help you gain knowledge. Please leave a comment to let me know what you think about it! Share it to your friends and learn new things together.
Transcript
Hindawi Publishing CorporationPPAR ResearchVolume 2011, Article ID 256186, 10 pagesdoi:10.1155/2011/256186
Research Article
Consequences of PPARα Invalidation on Glutathione Synthesis:Interactions with Dietary Fatty Acids
Najoua Guelzim,1, 2 Jean-Francois Huneau,1, 2 Veronique Mathe,1, 2
Annie Quignard-Boulange,1, 2 Pascal G. Martin,3 Daniel Tome,1, 2 and Dominique Hermier1, 2
1 INRA, UMR914 Nutrition Physiology and Ingestive Behavior, F-75005 Paris, France2 AgroParisTech, UMR914 Nutrition Physiology and Ingestive Behavior, F-75005 Paris, France3 INRA, UR66 ToxAlim, Laboratoire de Pharmacologie et Toxicologie, Toulouse, France
Correspondence should be addressed to Dominique Hermier, [email protected]
Received 26 April 2011; Revised 26 June 2011; Accepted 11 July 2011
Academic Editor: Stephane Mandard
Copyright © 2011 Najoua Guelzim et al. This is an open access article distributed under the Creative Commons AttributionLicense, which permits unrestricted use, distribution, and reproduction in any medium, provided the original work is properlycited.
Glutathione (GSH) derives from cysteine and plays a key role in redox status. GSH synthesis is determined mainly by cysteineavailability and γ-glutamate cysteine ligase (γGCL) activity. Because PPARα activation is known to control the metabolism ofcertain amino acids, GSH synthesis from cysteine and related metabolisms were explored in wild-type (WT) and PPARα-null(KO) mice, fed diets containing either saturated (COCO diet) or 18 : 3 n-3, LIN diet. In mice fed the COCO diet, but not in thosefed the LIN diet, PPARα deficiency enhanced hepatic GSH content and γGCL activity, superoxide dismutase 2 mRNA levels, andplasma uric acid concentration, suggesting an oxidative stress. In addition, in WT mice, the LIN diet increased the hepatic GSHpool, without effect on γGCL activity, or change in target gene expression, which rules out a direct effect of PPARα. This suggeststhat dietary 18 : 3 n-3 may regulate GSH metabolism and thus mitigate the deleterious effects of PPARα deficiency on redox status,without direct PPARα activation.
1. Introduction
PPARα is a major regulator of the macronutrient metab-olism, especially during the fed-to-fasting transition [1].Formerly, PPARα has been involved in the regulation of lipidmetabolism, including cellular uptake of fatty acids, intra-cellular fatty acid binding and activation, microsomal ω-oxidation, β-oxidation and ketogenesis, and synthesis of li-poproteins [2, 3]. Later on, PPARα effects have been shownto extend to a number of target genes involved in the metab-olism of glucose, glycerol and glycogen, and bile acids, as wellas in inflammation, detoxification, and hepatocarcinogenesis[4, 5]. More recently, PPARα has also been shown to play arole in amino acid metabolism, through the regulation of anumber of hepatic target genes involved in transamination,deamination, and urea synthesis [6–8].
Beyond nutritional situations, interest in PPARα effectson amino acids metabolism can also be considered in light ofthe involvement of specific amino acids in physiopatholog-ical processes associated with the metabolic syndrome. We
have recently shown that PPARα deficiency decreases wholebody nitric oxide (NO) synthesis from arginine, suggesting abeneficial effect of PPARα on vascular function [9]. Cysteineis a second amino acid of which metabolism might be ofimportance in the context of metabolic syndrome. Indeed,cysteine is the rate-limiting substrate for the synthesis ofglutathione (GSH) [10], a major endogenous antioxidant,protecting cells from reactive oxygen species (ROS). Most ofthe GSH is utilized in antioxidant defence via the glutathioneperoxidase (GPX) enzyme family to neutralize ROS and pro-tect the body from their noxious effect [11]. GSH synthesis isa two-step process. The first rate-limiting step is the conden-sation of cysteine and glutamate to γ-glutamylcysteine and iscatalyzed by γ-glutamate cysteine ligase (γGCL). While GSHsynthesis occurs in every tissue, the liver plays a prominentrole in whole body GSH flux [12]. A growing numberof studies support a link between glutathione synthesisand utilization and the metabolic syndrome. Alterationsin glutathione status and utilisation are long-recognizedhallmarks of metabolic syndrome-associated oxidative stress

2 PPAR Research
[13–17]. In parallel, fuelling glutathione synthesis throughan extra cysteine supply has been shown to alleviate insulinresistance and oxidative stress in animal models of themetabolic syndrome [18, 19].
Despite that PPARα activation enhances ROS generationby activating fatty acid and β- and ω-oxidation, it can alsopromote ROS clearance through increased expression and/oractivity of antioxidant enzymes, such as catalase (CAT) andsuperoxide dismutase (SOD) [20–23]. Accordingly, PPARαdeficiency decreases the activity of the same enzymes [23].However, little is known regarding the role of PPARαin hepatic metabolism of GSH. In fasted mice, PPARαdeficiency reduced hepatic GSH level and GPX activity [23].Consistently, fibrate treatment increased erythrocyte GPXactivity in human [24] and hepatic GSH content in themouse [25]. A few studies have also addressed the effectof n-3 polyunsaturated fatty acids (PUFA), natural PPARαligands, on GSH metabolism. In a rat model of chronicheart failure, n-3 fatty acid treatment increased cardiac γGCLcontent and activity, increased total and reduced glutathione,and decreased oxidized glutathione [26]. As concerns thedestruction of ROS, the effects of n-3 PUFA supplementationin the rat are inconsistent, with GPX activity being decreased[27] or not changed [28]. In cultured human fibroblasts,DHA (22 : 6 n-3) induced expression and activity of γGCL,as well as intracellular GSH content [29]. However, none ofthese studies provided a direct evidence for a role of PPARαin the modulation of GSH metabolism by n-3 fatty acids.
The first and main objective of the present study was toinvestigate the effects of PPARα invalidation in the regulationof GSH metabolism by using wild-type (WT) and PPARα-deficient mice (KO). We have shown previously in the mousethat a number of hepatic genes known to be regulatedessentially via PPARα were upregulated by α-linolenic acid(ALA, 18 : 3 n-3) as they are by its long-chain derivatives.This was observed in WT mice fed rather high-fat diets [30]but also in WT mice fed low-fat diets, albeit to a lesserextent [31]. For these reasons, as a secondary objective,we aimed to assess the contribution of dietary n-3 PUFAto PPARα activation, by exposing mice to contrasted diets,containing mostly either saturated FA or ALA. We exploredGSH synthesis from cysteine, as well as hepatic thiol contentand mRNA levels of enzymes involved in the protectionagainst oxidative damages.
2. Materials and Methods
2.1. Animals and Diets. Male PPARα-deficient mice [32]were supplied by the ToxAlim laboratory (UR66, INRA,Toulouse), in which several additional rounds of backcross-ing have been performed initially to increase the C57BL/6Jgenetic background and to generate the animals used [33].Wild type male C57BL/6J mice were obtained from CharlesRiver (L’Arbresle, France). In vivo studies were conductedunder European Union guidelines for the use and care oflaboratory animals.
Twenty-eight 6-7-week-old mice were bred in INRA’sfacility in Paris and housed collectively on wood litter, at
22 ± 2◦C under 12-h light/dark cycles (light on at 06:00 am).They were fed ad libitum a standard pelleted diet (Teklad20-18S, Harlan, Gannat, France) and acclimated to localconditions for 4 weeks. At 10-11 weeks of age, mice were fedduring 8 weeks one of the two experimental diets differingin their fatty acid profile (LIN or COCO diet, as describedbelow). They had free access to food and tap water. Foodconsumption (as assessed per collective cage and expressedrelatively to the mean body weight of mice in each cage) andindividual body weight were recorded weekly.
Diets were provided as pellets by UPAE-INRA (Jouy-en-Josas, France) as described previously [31]. The calculatedcomposition (in weight) of the two diets was 21.0% protein,69.2% carbohydrate, 4.8% lipid, 4.0% vitamins, and 4.0%minerals. The experimental diets were isoenergetic, withlipids providing 11.3% of total energy intake. The choiceof a low fat diet was based on the results of a previousnutrigenomic study of some of the present authors, showingsignificant effects of PPARα deficiency on lipid and xeno-biotic metabolism in mice fed the same diets as in thepresent study [31]. Besides, in our previous studies, Cyp4a14gene, exhibiting a PPRE sequence and being specificallyactivated by PPARα pure agonists [34], was significantlymore expressed in WT mice than in KO mice fed a low fatdiet rich in 18 : 3 n-3 [9, 31]. This indicated that even a lowdietary amount of n-3 PUFA was able to activate PPARα,which justified the choice of the dietary conditions. Oilsused for experimental diet preparation were hydrogenatedcoconut oil for a saturated FA-rich diet (SFA, COCO diet)and linseed oil for a ALA-rich oil (LIN diet). Their fattyacid composition was (in weight %): 99.6% SFA, 0.3%monounsaturated FA (MUFA), and 0.1% PUFA for theCOCO diet; 9.0% SFA, 18.0% MUFA, and 72.9% PUFA(58% ALA) for the LIN diet [31].
2.2. Experimental Design. At the end of the experimentalperiod, mice were fasted for 5 h, then weighed and anes-thetized with combined xylazine/ketamine solution. Bloodwas taken by cardiac puncture, and mice were then killedby exsanguination. Plasma was separated by centrifugation(1,700∗g, 20 min, 4◦C) and aliquots were stored at −80◦C.The abdominal cavity was then opened, and the liver wasremoved and weighed. Several liver samples were snap frozenin liquid nitrogen and stored at −80◦C. Epididymal adiposetissue (EpAT, visceral localization) and inguinal adiposetissue (IngAT, subcutaneous localization) were removed andweighed.
2.3. Biochemical Analyses. Blood glucose concentration wasdetermined with an Accu-Chek glucometer (Roche Diag-nostics, Meylan, France). Plasma cholesterol, triglycerides,and uric acid were determined by colorimetric enzymaticmethods using commercial kits (Bio-Merieux, Craponne,France), adapted for use in a 96-well microplate reader(Molecular Devices, Saint-Gregoire, France). Plasma aminoacids were determined by ion-exchange chromatographywith postcolumn ninhydrine derivatisation on an Amino-tac JLC-500/V (Jeol, Tokyo, Japan). Plasma concentrations

PPAR Research 3
Table 1: Primer sequences used in quantitative RT-PCR analysis.
Gene name Abbreviation Ref Seq Forward primer Reverse primer
Glutathione peroxidase 1(GPX1)
Gpx1 NM 008160 GACACCAGGAGAATGGCAAGA ACCATTCACTTCGCACTTCTCA
Cysteine dioxygenase(CDO)
Cdo NM 033037 GATACATGCCACGCCTTTGA CCTGAAGTTGTAAATGGAGTCCTGAT
Catalase (CAT) Cat NM 009804 GCCAGAAGAGAAACCCACAGACT CACTGAACAAGAAAGAAACCTGATG
Glutamate cysteine ligase(γGCL), catalytic subunit
Gclc NM 010295 GGAGGCGATGTTCTTGAGACTCT CCTTCGATCATGTAACTCCCATACT
Glutamate-cysteine ligase(γGCL), modifier subunit
Gclm NM 008129 GGCCTCCTGCTGTGTGATG GCCTCAGAGAGCAGTTCTTTCG
Superoxide dismutase 1(SOD1)
Sod1 NM 011434.1 GTGCAGGGAACCATCCACTT GTCCTGACAACACAACTGGTTCA
Superoxide dismutase 2(SOD2)
Sod2 NM 013671 GCTCTGGCCAAGGGAGATG TGATTAATATGTCCCCCACCATT
CD68 antigen (CD68) Cd68 NM 009853.1 CATCAGAGCCCGAGTACAGTCTACC AATTCTGCGCCATGAATGTCC
Chemokine (C-C motif)ligand 2 (MCP1)
Ccl2 NM 011333.3 GGCTCAGCCAGATGCAGTTAA CCAGCCTACTCATTGGGATCA
Serum amyloid A (SAA) Saa NM 009117.3 GCGAGCCTACACTGACATGA TTTTCTCAGCAGCCCAGACT
All primer sequences were designed using Primer Express (Applied Biosystems) software and were from Eurogentec (Eurogentec, Seraing, Belgium).
of adiponectin, plasminogen activator inhibitor-1 (PAI-1), monocyte chemotactic protein-1 (MCP-1), leptin, andinsulin were determined using multiplexed immunoassays(Millipore-Linco Research, St. Charles, USA) on a Bioplex-200 analyzer (Bio-Rad Laboratories, Marnes-la-Coquette,France).
2.4. Gene Expression. Total RNA was extracted from a liversample using Trizol reagent (Invitrogen, Carlsbad, USA),and synthesis of cDNA was performed on 400 ng of totalRNA using a high capacity cDNA reverse transcription kit,based on the use of both oligodT and hexamers (AppliedBiosystems, Foster City, USA). The primers listed in Table 1were used for quantitative PCR on a 7300 real-time PCRsystem (Applied Biosystems), as described previously [35].Gene expression was determined using the 2−ΔCt formulawhere ΔCt = (Ct target gene− Ct 18S).
2.5. Hepatic Thiol Concentrations. Total low-molecular wei-ght thiols (cysteine, GSH, and cysteinylglycine (CysGly))were analyzed using high-performance liquid chromatog-raphy (HPLC) as described previously, with slight modifi-cations [36]. Briefly, 50 mg of liver samples were homoge-nized in 950 μL of 0.1 M phosphate buffer and centrifuged(3,000∗g, 5 min). A small volume of supernatant wasremoved for subsequent protein assay with the Pierce bici-nchoninic acid (BCA) Assay Kit (Pierce, Rockford, USA).Sixty μL of the supernatant were reduced with 0.66 vol oftriphenylphosphine (10% in dimethylformamide) depro-teinized by 2 vol of 10% TCA and derivatized by 3% 4-(aminosulfonyl)-7-fluoro-2,1,3-benzoxadiazole at pH 9.0.After 1 hour incubation at 4◦C, derivatization was stoppedby adding 25 μL of 4 mM HCL. N-acetylcysteine was addedin every sample as an internal standard. Thiol separation was
achieved at 45◦C on a Kromasil c18 column (15 cm× 4.6 mmid., 3.5 μm) with a mobile phase consisting in 90% 100 mMcitrate buffer pH 4.0 and 10% methanol. External standardsof GSH, cysteine, and CysGly were used for the identificationand quantification of thiols in liver homogenates. Resultswere normalized for liver weight or protein content.
2.6. Hepatic γGCL Activity. Liver γGCL activity was assessedin liver homogenate using a fluorescence-based methodas described previously [37]. Briefly, a cytosolic fractionwas prepared from a 50 mg liver homogenate by successivecentrifugation (10,000∗g, 10 min, 4◦C and 15,000∗g, 5 min,4◦C). Fifty μL of this cytosolic fraction were preincu-bated for 5 min at 37◦C with 1 vol of reaction mediumconsisting in (final concentration): 133 mM Tris, 13.3 mMATP, 6.66 mM glutamic acid, 0.66 mM serine, 0.66 mMEDTA, 6.66 mM sodium borate and 13.3 mM MgCl2. Thereaction was started by the addition of 50 μL of cysteine(0.66 mM, final concentration) and stopped after 20 minutesat 37◦C with 50 μL of 200 mM sulfosalicylic acid followedby centrifugation at 2,000×g. For derivatization, 20 μL ofthe resulting supernatant were incubated with 180 μL of10 mM 2,3-naphthalenedicarboxaldehyde (NDA) solution,to form NDA-γ-glutamylcysteine. Fluorescence intensity (εex
472 nm −εem 528 nm) was measured on a fluorescence platereader (CytoFluor 4000, Applied Biosystems) and quantifiedusing standard curves of NDA-GSH. Results were correctedfor initial GSH content and normalized for liver weight orprotein concentration of the cytosolic fraction.
2.7. Statistical Analyses. Data are presented as means± SEM.They were analysed using the SAS program (SAS Institute,Cary, USA). Differences between treatments and interactionswere tested with a two-way ANOVA with genotype and diet

4 PPAR Research
Table 2: Markers of PPARα deficiency in WT and PPARα-null (KO) mice fed diets containing either saturated FA (COCO diet) or ALA (LINdiet) for 8 weeks.
WT KO P values
COCO LIN COCO LIN ANOVAGenotype
(G)Diet(D)
InteractionG∗D
Body weight (g) 29.5 ± 0.5b 29.6 ± 0.5b 36.7 ± 1.0a 32.7 ± 1.5b 0.0001 0.0001 0.0379 0.0261
Liver weight (g) 1.07 ± 0.04b 1.07 ± 0.06b 1.55 ± 0.08a 1.04 ± 0.04b <0.0001 0.0004 0.0001 0.0001
Liver weight (%) 3.88 ± 0.10b 3.88 ± 0.25b 4.50 ± 0.12a 3.71 ± 0.12b 0.0007 0.1403 0.0112 0.0123
EpAT weight (%) 2.31 ± 0.16b 2.58 ± 0.19ab 3.47 ± 0.28a 2.91 ± 0.40ab 0.0013 0.0038 0.5062 0.0720
IngAT weight (%) 1.46 ± 0.19b 1.78 ± 0.12ab 2.50 ± 0.23a 1.79 ± 0.22ab 0.0063 0.0090 0.3293 0.0102
Blood glucose(g/L)
1.94 ± 0.18b 1.83 ± 0.21b 1.48 ± 0.17ab 1.17 ± 0.12a 0.0001 0.0001 0.1892 0.4690
Plasma TG(mg/dL)
0.25 ± 0.02a 0.30 ± 0.03ab 0.39 ± 0.01b 0.36 ± 0.05ab 0.0231 0.0039 0.7881 0.3064
Plasma CT(mgd/L)
0.75 ± 0.02b 0.62 ± 0.05b 1.20 ± 0.07a 0.84 ± 0.11b 0.0001 0.0001 0.0015 0.0823
Values are means ± standard errors for 7 mice per group. Mean values within a row sharing a same superscript letter, or without superscript letter, were notsignificantly different at P < 0.05.
as factors, using the GLM procedure. When the genotypeand/or diet factor was significant, differences between meanswere tested for significance using the post hoc Tukey-Kramerprocedure. Significance level was set at P < 0.05.
3. Results
3.1. Markers of PPARα Deficiency in Relation to DietaryTreatment (Table 2). Body weight was higher in the KO mice.Throughout the 8 weeks of the experiment, individual dailyfood intake (in g, and as estimated from total food consumedper cage) was higher in KO mice, but was similar to the WTmice when corrected for the body weight (130 ± 14 mg/gbody weight per day, whatever the genotype or the diet).This indicated that the higher body weight of the KO groupsdid not differ primarily from a higher food intake. In WTmice, the fatty acid composition of the diets did not affectthe markers of the metabolic syndrome. PPARα deficiencyresulted in higher body and liver weights, as well as inadipose tissue proportion than in WT mice. Post-hoc analysisshowed that this genotype effect was significant only in theCOCO-fed mice, and not in the LIN-fed ones. In contrast,there was no overall effect of PPARα deficiency on liverproportion but a significant genotype ∗ diet interaction, sothat post-hoc analyses revealed that the liver proportion wassignificantly increased by PPARα deficiency the COCO-fedgroup, and not in the LIN-fed one. Similarly, the higherplasma concentrations of triglyceride and cholesterol foundin the KO mice were more pronounced in the COCO-fed group than in the LIN-fed one. In contrast, whencompared to their WT counterparts, KO mice exhibited alower glycemia, this effect being more pronounced in micefed the LIN diet.
3.2. GSH Metabolism Related Parameters
3.2.1. Hepatic Thiols Status (Table 3). Hepatic GSH con-centration and pool varied according to the experimental
conditions, with a strong interaction between the genotypeand the diet (P < 0.001). In WT mice, GSH concentrationand pool were 40% higher in those fed the LIN diet thanin those fed the COCO diet. PPARα deficiency resulted inincreased concentration and pool of GSH in the COCO-fedmice, while it did not affect the LIN-fed diet ones. Hepaticconcentration and pool of cysteine and CysGly were muchlower than those of GSH and were neither affected by PPARαdeficiency nor by the diet.
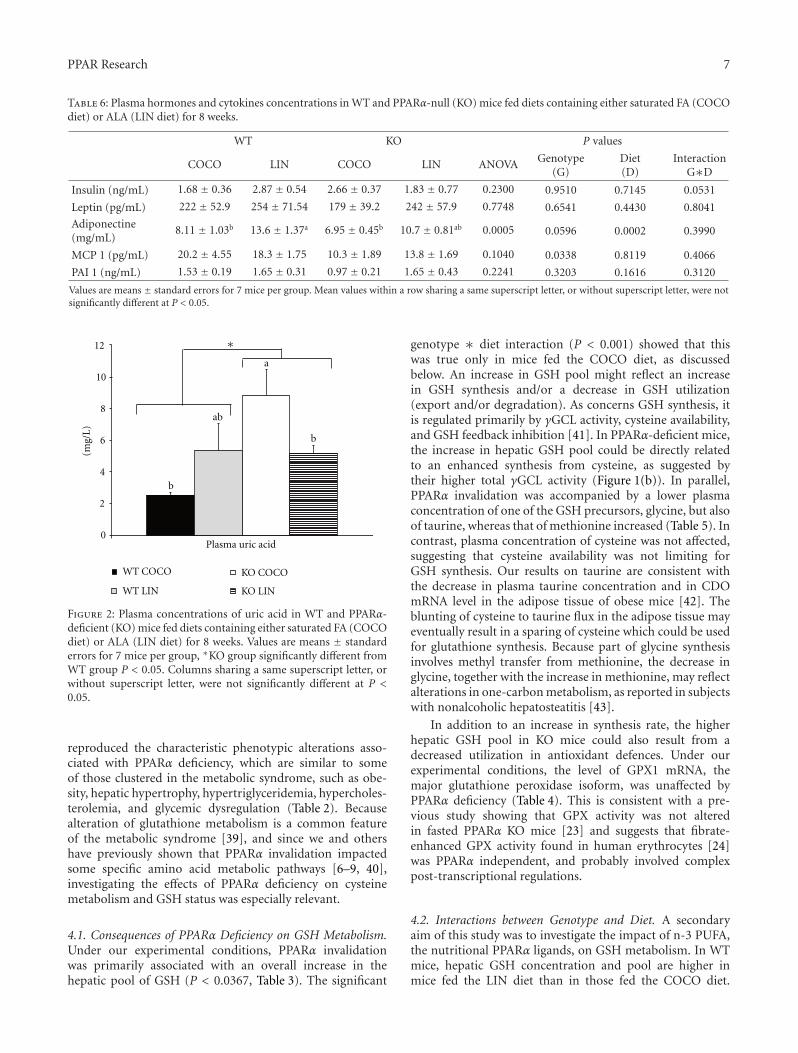
3.2.2. Hepatic γGCL Activity (Figure 1) and mRNA Levelsof γGCL and CDO (Table 4). In WT mice, the fatty acidcomposition of the diets did not influence either spe-cific or total γGCL activity. PPARα deficiency significantlyincreased γGCL specific activity (Figure 1(a)) and totalactivity (Figure 1(b)). The post-hoc analysis showed that theeffect of PPARα deficiency on γGCL was significant only inthe LIN-fed mice for the specific activity and in the COCO-fed mice for the total activity. Hepatic mRNA level of γGCLand CDO was not affected by either PPARα deficiency or thediet (Table 4).
3.2.3. Plasma Amino Acid Concentrations (Table 5). Amongamino acids related to cysteine metabolism, PPARα defi-ciency was associated with a significantly higher plasmaconcentration of methionine and lower concentration ofglycine and taurine. Plasma concentration of glutamic acidand cysteine was not affected by the genotype. None of theplasma concentrations was influenced by the diet.
3.3. Oxidative Stress and Inflammatory Status
3.3.1. Hepatic mRNA Levels of Antioxidant Enzymes and ofInflammatory Markers (Table 4). Hepatic mRNA levels of thegenes coding for GPx (Gpx1), CAT (Cat), and Cu/ZnSOD(Sod1) were not affected by PPARα deficiency, while PPARαdeficiency significantly increased the mRNA level coding for

PPAR Research 5
Table 3: Hepatic thiols concentrations and pools in WT and PPARα-null (KO) mice fed diets containing either saturated FA (COCO diet)or ALA (LIN diet) for 8 weeks.
WT KO P values
COCO LIN COCO LIN ANOVAGenotype
(G)Diet(D)
InteractionG∗D
GSH (μmol/gof protein)
3 112 ± 180b 5 138 ± 412a 5 201 ± 509a 3 892 ± 382ab 0.0013 0.2815 0.3569 0.0003
Cysteine(μmol/g ofprotein)
274 ± 91.8 190 ± 66.0 211 ± 55.8 243 ± 55.8 0.8377 0.9432 0.7061 0.4144
CysGly(μmol/g ofprotein)
97.5 ± 5.80 83.6 ± 12.7 102 ± 20.5 93.5 ± 8.14 0.8012 0.6243 0.4461 0.8514
GSH (μmol/liver)
439 ± 31.3b 774 ± 77.2ac 1031 ± 118a 544 ± 80.7bc 0.0002 0.0367 0.3590 <.0001
Cysteine(μmol/ liver)
40.2 ± 16.0 29.3 ± 10.6 41.3 ± 10.1 33.2 ± 7.62 0.8614 0.8304 0.4181 0.9034
CysGly (μmol/liver)
14.2 ± 1.24 13.1 ± 2.03 20.0 ± 3.49 12.9 ± 1.19 0.1456 0.2600 0.1099 0.2383
Values are means ± standard errors for 7 mice per group. Mean values within a row sharing a same superscript letter, or without superscript letter, were notsignificantly different at P < 0.05.
0
10
20
30
40
50
60
b bb
a
(nm
ol/m
gof
prot
ein
/h)
∗∗
WT COCO
WT LIN
KO COCO
KO LIN
Hepatic γGCL total activity
(a)
bb
a
∗∗
(mm
ol/l
iver
/h)
6
5
4
3
2
1
0
ab
WT COCO
WT LIN
KO COCO
KO LIN
Hepatic γGCL specific activity
(b)
Figure 1: Hepatic GCL activity in WT and PPARα-deficient (KO) mice fed diets containing either saturated FA (COCO diet) or ALA (LINdiet) for 8 weeks. Values are expressed as nmol/mg of protein/h for specific activity (a) and as mmol/liver/h for total activity (b). Theyare means ± standard errors for 7 mice per group, ∗∗KO group significantly different from WT group P < 0.01. Columns sharing a samesuperscript letter, or without superscript letter, were not significantly different at P < 0.05.
MnSOD (Sod2). None of these mRNA levels was influencedby the diet, whatever the genotype.
CD68 mRNA level was significantly higher in KO micethan in WT ones. Post-hoc analysis showed that this genotypeeffect was borne by the mice fed the LIN diet essentially. SAAand MCP1 mRNA levels were also numerically higher in KO
mice, but the difference was not statistically significant (P =0.0684 for SAA and 0.0829 for MCP1).
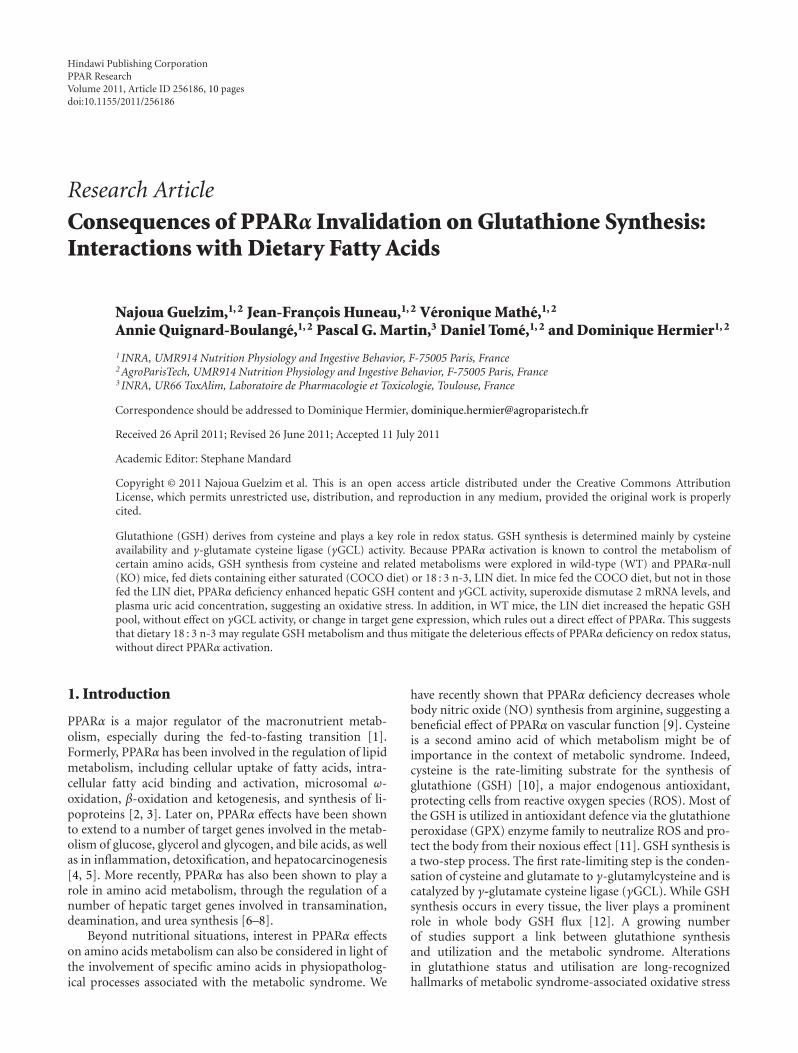
3.3.2. Plasma Concentration of Uric Acid (Figure 2). In WTmice, the fatty acid composition of the diets did not influence

6 PPAR Research
Table 4: Hepatic mRNA levels of cysteine and glutathione metabolism key genes, and of inflammatory markers, in WT and PPARα-null(KO) mice fed diets containing either saturated FA (COCO diet) or ALA (LIN diet) for 8 weeks (arbitrary units).
WT KO P values
COCO LIN COCO LIN ANOVA Genotype(G)
Diet(D)
InteractionG∗D
Glutamate cysteineligase (γGCLc),catalytic subunit
0.22 ± 0.04 0.30 ± 0.07 0.22 ± 0.05 0.13 ± 0.02 0.1583 0.0941 0.9836 0.1183
Glutamate cysteineligase (γGCLm),modifier subunit
0.68 ± 0.11 0.65 ± 0.07 0.55 ± 0.07 0.63 ± 0.17 0.8840 0.5255 0.8070 0.6317
Cysteinedioxygenase (CDO)
3.84 ± 0.61 2.24 ± 0.16 2.22 ± 0.38 3.92 ± 1.02 0.1193 0.8885 0.9780 0.0181
Glutathioneperoxidase 1 (GPX1)
8.65 ± 1.58 9.32 ± 1.15 8.79 ± 1.55 9.54 ± 2.71 0.9857 0.9272 0.7211 0.9844
Catalase (CAT) 1.05 ± 0.28 0.97 ± 0.12 0.92 ± 0.22 0.71 ± 0.13 0.6463 0.3327 0.4750 0.7445
Superoxidedismutase 1 (SOD1)
64.9 ± 3.36 61.2 ± 3.68 63.1 ± 3.95 69.8 ± 3.96 0.4529 0.3941 0.7101 0.2006
Superoxidedismutase 2 (SOD2)
5.09 ± 1.06b 5.66 ± 0.77bc 10.1 ± 0.63a 8.49 ± 0.7ac 0.0005 <0.001 0.517 0.1873
CD68 antigen(CD68)
20.0 ± 10.4ab 8.75 ± 8.28b 30.9 ± 11.9a 29.1 ± 14.8a 0.0121 0.0027 0.1717 0.3142
Chemokine (C-Cmotif) ligand 2(MCP1)
0.94 ± 0.45 0.77 ± 0.25 1.45 ± 0.28 1.55 ± 1.77 0.3467 0.0898 0.7011 0.9267
Serum amyloid A(SAA)
0.47 ± 0.29 0.51 ± 0.36 2.13 ± 3.83 2.70 ± 2.69 0.2919 0.0684 0.7926 0.7615
Gene expression was determined using the 2−ΔCt formula where ΔCt = (Ct target gene−Ct 18S). Values are means± standard errors for 4–7 mice per group.Mean values within a row sharing a same superscript letter, or without superscript letter, were not significantly different at P < 0.05.
Table 5: Plasma concentrations of amino acid involved in cysteine metabolism in WT and PPARα-null (KO) mice fed diets containing eithersaturated FA (COCO diet) or ALA (LIN diet) for 8 weeks.
WT KO P values
COCO LIN COCO LIN ANOVA Genotype(G)
Diet(D)
InteractionG∗D
Cysteine 16.3 ± 3.64 15.0 ± 2.12 17.2 ± 2.71 17.6 ± 3.87 0.9574 0.6144 0.8946 0.7949
Glycine 231 ± 17.3a 219 ± 14.26ab 170 ± 5.85b 214 ± 16.3ab 0.0236 0.0250 0.2603 0.0600
L-glutamicacid
23.6 ± 1.20 23.9 ± 3.09 21.5 ± 1.38 19.4 ± 1.20 0.3186 0.0800 0.6746 0.5300
Methionine 39.8 ± 1.89 38.9 ± 2.07 47.1 ± 3.83 49.8 ± 5.32 0.0980 0.0150 0.8094 0.6253
Taurine 436 ± 59.8 511 ± 38.0 389 ± 43.0 366 ± 22.4 0.1290 0.0403 0.5624 0.2797
Values are expressed in μM. Values are means ± standard errors for 7 mice per group. Mean values within a row sharing a same superscript letter, or withoutsuperscript letter, were not significantly different at P < 0.05.
uric acid concentration. When compared to their WT coun-terparts, PPARα KO mice exhibited a higher plasma uric acidconcentration. However, due to a significant genotype∗dietinteraction, this concentration was affected only in mice fedthe COCO diet.
3.3.3. Plasma Cytokines and Hormones (Table 6). Concentra-tions of leptin, insulin, and PAI1 were neither affected by thediet nor by the genotype. Independently of the genotype,adiponectine concentration was significantly higher in theLIN-fed mice diet than in the COCO-fed mice and tended
to decrease (P = 0.0596) in response to PPARα deficiency.In contrast, MCP1 concentration was not affected by thediet, but significantly decreased in PPARα-deficient micecompared to WT mice.
4. Discussion
PPARα KO has been previously shown to affect fattyacid metabolism [33] and glucose homeostasis [1, 38]. Inline with these observations, our experimental conditions
PPAR Research 7
Table 6: Plasma hormones and cytokines concentrations in WT and PPARα-null (KO) mice fed diets containing either saturated FA (COCOdiet) or ALA (LIN diet) for 8 weeks.
WT KO P values
COCO LIN COCO LIN ANOVA Genotype(G)
Diet(D)
InteractionG∗D
Insulin (ng/mL) 1.68 ± 0.36 2.87 ± 0.54 2.66 ± 0.37 1.83 ± 0.77 0.2300 0.9510 0.7145 0.0531
Leptin (pg/mL) 222 ± 52.9 254 ± 71.54 179 ± 39.2 242 ± 57.9 0.7748 0.6541 0.4430 0.8041
Adiponectine(mg/mL)
8.11 ± 1.03b 13.6 ± 1.37a 6.95 ± 0.45b 10.7 ± 0.81ab 0.0005 0.0596 0.0002 0.3990
MCP 1 (pg/mL) 20.2 ± 4.55 18.3 ± 1.75 10.3 ± 1.89 13.8 ± 1.69 0.1040 0.0338 0.8119 0.4066
PAI 1 (ng/mL) 1.53 ± 0.19 1.65 ± 0.31 0.97 ± 0.21 1.65 ± 0.43 0.2241 0.3203 0.1616 0.3120
Values are means ± standard errors for 7 mice per group. Mean values within a row sharing a same superscript letter, or without superscript letter, were notsignificantly different at P < 0.05.
12
10
8
6
4
2
0
ab
a
b
b
Plasma uric acid
∗
WT COCO
WT LIN
KO COCO
KO LIN
(mg/
L)
Figure 2: Plasma concentrations of uric acid in WT and PPARα-deficient (KO) mice fed diets containing either saturated FA (COCOdiet) or ALA (LIN diet) for 8 weeks. Values are means ± standarderrors for 7 mice per group, ∗KO group significantly different fromWT group P < 0.05. Columns sharing a same superscript letter, orwithout superscript letter, were not significantly different at P <0.05.
reproduced the characteristic phenotypic alterations asso-ciated with PPARα deficiency, which are similar to someof those clustered in the metabolic syndrome, such as obe-sity, hepatic hypertrophy, hypertriglyceridemia, hypercholes-terolemia, and glycemic dysregulation (Table 2). Becausealteration of glutathione metabolism is a common featureof the metabolic syndrome [39], and since we and othershave previously shown that PPARα invalidation impactedsome specific amino acid metabolic pathways [6–9, 40],investigating the effects of PPARα deficiency on cysteinemetabolism and GSH status was especially relevant.
4.1. Consequences of PPARα Deficiency on GSH Metabolism.Under our experimental conditions, PPARα invalidationwas primarily associated with an overall increase in thehepatic pool of GSH (P < 0.0367, Table 3). The significant
genotype ∗ diet interaction (P < 0.001) showed that thiswas true only in mice fed the COCO diet, as discussedbelow. An increase in GSH pool might reflect an increasein GSH synthesis and/or a decrease in GSH utilization(export and/or degradation). As concerns GSH synthesis, itis regulated primarily by γGCL activity, cysteine availability,and GSH feedback inhibition [41]. In PPARα-deficient mice,the increase in hepatic GSH pool could be directly relatedto an enhanced synthesis from cysteine, as suggested bytheir higher total γGCL activity (Figure 1(b)). In parallel,PPARα invalidation was accompanied by a lower plasmaconcentration of one of the GSH precursors, glycine, but alsoof taurine, whereas that of methionine increased (Table 5). Incontrast, plasma concentration of cysteine was not affected,suggesting that cysteine availability was not limiting forGSH synthesis. Our results on taurine are consistent withthe decrease in plasma taurine concentration and in CDOmRNA level in the adipose tissue of obese mice [42]. Theblunting of cysteine to taurine flux in the adipose tissue mayeventually result in a sparing of cysteine which could be usedfor glutathione synthesis. Because part of glycine synthesisinvolves methyl transfer from methionine, the decrease inglycine, together with the increase in methionine, may reflectalterations in one-carbon metabolism, as reported in subjectswith nonalcoholic hepatosteatitis [43].
In addition to an increase in synthesis rate, the higherhepatic GSH pool in KO mice could also result from adecreased utilization in antioxidant defences. Under ourexperimental conditions, the level of GPX1 mRNA, themajor glutathione peroxidase isoform, was unaffected byPPARα deficiency (Table 4). This is consistent with a pre-vious study showing that GPX activity was not alteredin fasted PPARα KO mice [23] and suggests that fibrate-enhanced GPX activity found in human erythrocytes [24]was PPARα independent, and probably involved complexpost-transcriptional regulations.
4.2. Interactions between Genotype and Diet. A secondaryaim of this study was to investigate the impact of n-3 PUFA,the nutritional PPARα ligands, on GSH metabolism. In WTmice, hepatic GSH concentration and pool are higher inmice fed the LIN diet than in those fed the COCO diet.

8 PPAR Research
This is consistent with previous studies suggesting that long-chain n-3 PUFA may exert a beneficial action on oxidativestress by increasing total glutathione in a rat model ofchronic heart failure [26] and in cultured human fibroblasts[29]. However, to our knowledge, the present study isthe first evidence that, in comparison with saturated fattyacids, even a very low amount of ALA may exert the sameeffects on GSH metabolism as its long-chain derivatives.We have shown previously that even a very low intakeof dietary ALA (identical to the present study) activatestypical targets of PPARα, such as Cyp4a14 [9, 31]. However,the mechanisms by which ALA regulates GSH metabolismin WT mice remains speculative, since none of the genesstudied, and in particular γGCL, exhibited a difference inmRNA level between the COCO and the LIN diet. Thus,even if typical target genes of PPARα are activated by theLIN diet, rich in 18 : 3 n-3, it is not possible to conclude ona direct involvement of PPARα into the regulation of GSHlevel by fatty acids. Other pleiotropic effects of fatty acidshave to be investigated, such as modifications of membranemicrodomain composition (thus modulating receptors andion channels functioning) or regulation of downstream cellsignalling pathways.
Unexpectedly, the impact of the dietary fatty acid profileon GSH metabolism was even more pronounced in KO mice.Indeed, post-hoc analysis showed that PPARα deficiencyincreased total GSH content only in COCO-fed mice, andnot in the LIN-fed mice. Specific activity and mRNA levelof γGCL were not affected by PPARα deficiency in micefed the COCO diet (Figure 1(a) and Table 4). Thus, theirhigher GSH content results not only from a difference inliver weight, which was 50% higher in this group than inthe three other ones (Table 2), but also from their increasedGSH concentration (Table 3), suggesting that the increasedGSH pool in KO mice fed the COCO diet is diet specific. Themechanistic reasons why GSH concentration increased in KOmice when fed the COCO diet remain unclear, since γGCLspecific activity was the same as in their WT counterparts,whereas GPx activity was not affected by PPARα deficiency. Itmay be hypothesised that, secondary to PPARα invalidation,exportation of GSH into plasma towards extrahepatic tissuesis impaired in KO mice, which would functionally affectthe antioxidative defences of the whole body. In contrast,GSH concentration and pool were not significantly affectedby PPARα deficiency in mice fed the LIN diet (Table 3).To our knowledge, the only other study having investigatedthe consequence of PPARα deficiency on GSH metabolismreported a significant depletion (20–25%) in total hepaticGSH content in fasted KO mice fed a standard rodent chow[23]. The fatty acid composition of the diet did not figurein this study, but was probably, as usual in standard rodentchows, soy oil rich in n-6 PUFA. Taken together, our dataand the previous ones suggest that a diet in which the lipidmoiety is rich in saturated FA and poor in PUFA, such as theCOCO diet, makes the liver GSH pool sensitive to PPARαinvalidation, whereas PUFA would protect the mice againstthe effects of PPARα deficiency.
In addition to the changes in cysteine metabolism andGSH status, PPARα deficiency seemed to alter some markers
of the oxidative and inflammatory status, in interaction withdietary fatty acids. Indeed, Sod2 (but not Sod1) mRNAlevel increased in KO mice, especially when fed the COCOdiet (Table 4), which indicates an activation of antioxidantdefences [44]. This is apparently inconsistent with theenhanced Sod2 expression by fenofibrate in mouse brainmicrovessels [45] and with the decrease in SOD activity infasted PPARα KO mice compared to the WT ones [23].As discussed above for GSH content, these discrepanciesmay reflect an effect of the dietary fatty acid profile onthe response to oxidative stress of PPARα KO mice. In linewith the higher Sod2 expression in PPARα KO mice, wealso observed an increase in the plasma concentration ofuric acid, a widely recognized marker of oxidative stress[46], with the same diet ∗ genotype interaction: thisconcentration was 4-fold increased in KO mice fed theCOCO diet, but not in those fed the LIN diet (Figure 2).To our knowledge, this is the first evidence of the impactof PPARα deficiency of plasma uric acid concentration, ininteraction with the dietary fatty acid profile. Altogether,these two markers (hepatic Sod2 mRNA level and plasmauric acid concentration) support the existence of a mildoxidative stress in PPAR KO mice, which is mitigated bythe LIN diet. This is consistent with the previously reportedprevention of hepatic steatosis in PPAR KO mice by ALA[30, 31]. Triglyceride accumulation in the liver is knownto trigger oxidative stress, which in turn contributes to thepathogenesis of nonalcoholic steatohepatitis [47]. Therefore,a decrease in fatty acid accumulation in response to ALAfeeding is expected to mitigate the oxidative stress resultingfrom PPARα invalidation.
While PPAR deficiency induced a mild oxidative stress,evidences for inflammation were less conclusive, since theplasma concentration of both the proinflammatory cytokineMCP1 and the anti-inflammatory adipokine, adiponectine,was decreased, whereas PAI1 concentration did not change(Table 6). In the liver, mRNA levels of CD68, SAA, andMCP1 increased in KO mice, but the difference with WTmice was significant for CD68 only. Taken together, theseresults suggest a mild inflammatory status in response toPPARα invalidation. This is consistent with previous resultsreporting that obesity-induced inflammation is aggravatedin PPAR-deficient mice [48]. Finally, whatever the geno-type, the plasma concentration of adiponectine, an anti-inflammatory adipokine, was higher in mice fed the LIN diet,suggesting an influence of the fatty acid profile of the diet,which is PPARα independent.
5. Conclusion
Under our experimental conditions, and in accordancewith a previous study [23], PPARα deficiency seemed toinduce an oxidative and inflammatory stress in the liver, asevidenced by the higher values of hepatic GSH pool andconcentration, total γGCL activity, Sod2 mRNA level, andplasma uric acid concentration. However, the phenotypicconsequences of PPARα deficiency depended, as last partly,on the dietary fatty acid profile. Indeed, most increases

PPAR Research 9
observed in KO mice fed the COCO diet (hepatic GSH pooland concentration, total γGCL activity, Sod2 mRNA level,and plasma uric acid concentration) were alleviated, or evenabsent, in mice fed the LIN diet, suggesting that ALA wouldbe protective against these effects of PPARα invalidation. Thereasons of this diet-based sensitivity remains unclear, but itis likely that it is not directly related to the PPARα deficiency.More probably, it is secondary to the previously describedeffects of dietary fatty acids on hepatic steatosis in PPARαKO mice [30, 31]. Indeed, this hepatic steatosis occurred inKO mice fed a SFA-containing diet, but was alleviated, andeven absent, in those fed a PUFA-containing diet. It may thusbe hypothesized that the beneficial effects of dietary PUFAon liver metabolism in KO mice, even in low amounts, maybe accounted for by a protection against lipid accumulation,resulting in lower lipotoxicity and oxidative stress than withSFA.
Conflict of Interests
The authors declare that they have no conflict of interests.
Acknowledgments
The authors thank Dr. Thierry Pineau for the PPARα-deficient mice, which are a kind gift from Dr. FranckJ. Gonzalez and are carefully bred by Colette Betoulieres(Toulouse). They gratefully acknowledge the contributionof Angelique Foucault-Simonin (Paris) for animal care andhelp with dissection and sampling. They also thank sincerelyPierre Weill and Guillaume Chesneau (Valorex company, LaMessayais, Combourtille, France) for providing linseed oil.G. Najoua is supported by a doctoral fellowship.
References
[1] S. Kersten, J. Seydoux, J. M. Peters, F. J. Gonzalez, B.Desvergne, and W. Wahli, “Peroxisome proliferator-activatedreceptor α mediates the adaptive response to fasting,” Journalof Clinical Investigation, vol. 103, no. 11, pp. 1489–1498, 1999.
[2] H. Keller, F. Givel, M. Perroud, and W. Wahli, “Signalingcross-talk between peroxisome proliferator-activated recep-tor/retinoid X receptor and estrogen receptor through estro-gen response elements,” Molecular Endocrinology, vol. 9, no. 7,pp. 794–804, 1995.
[3] P. Lefebvre, G. Chinetti, J.-C. Fruchart, and B. Staels, “Sortingout the roles of PPARα in energy metabolism and vascularhomeostasis,” Journal of Clinical Investigation, vol. 116, no. 3,pp. 571–580, 2006.
[4] S. Mandard, M. Muller, and S. Kersten, “Peroxisomeproliferator-activated receptor α target genes,” Cellular andMolecular Life Sciences, vol. 61, no. 4, pp. 393–416, 2004.
[5] S. Mandard, R. Stienstra, P. Escher et al., “Glycogen synthase2 is a novel target gene of peroxisome proliferator-activatedreceptors,” Cellular and Molecular Life Sciences, vol. 64, no. 9,pp. 1145–1157, 2007.
[6] S. Kersten, S. Mandard, P. Escher et al., “The peroxi-some proliferator-activated receptor α regulates amino acidmetabolism,” FASEB Journal, vol. 15, no. 11, pp. 1971–1978,2001.
[7] D. Patsouris, S. Mandard, P. J. Voshol et al., “PPARα governsglycerol metabolism,” Journal of Clinical Investigation, vol. 114,no. 1, pp. 94–103, 2004.
[8] K. Sheikh, G. Camejo, B. Lanne, T. Halvarsson, M. R.Landergren, and N. D. Oakes, “Beyond lipids, pharmaco-logical PPARα activation has important effects on aminoacid metabolism as studied in the rat,” American Journal ofPhysiology—Endocrinology and Metabolism, vol. 292, no. 4, pp.E1157–E1165, 2007.
[9] N. Guelzim, F. Mariotti, P. G. Martin, F. Lasserre, T. Pineau,and D. Hermier, “A role for PPARα in the regulation ofarginine metabolismand nitric oxide synthesis,” Amino Acids.In press.
[10] D. L. Bella, L. L. Hirschberger, Y. Hosokawa, and M. H.Stipanuk, “Mechanisms involved in the regulation of keyenzymes of cysteine metabolism in rat liver in vivo,” AmericanJournal of Physiology—Endocrinology and Metabolism, vol.276, no. 2, part 1, pp. E326–E335, 1999.
[11] H. J. Forman, H. Zhang, and A. Rinna, “Glutathione: overviewof its protective roles, measurement, and biosynthesis,” Molec-ular Aspects of Medicine, vol. 30, no. 1-2, pp. 1–12, 2009.
[12] M. H. Stipanuk, “Role of the liver in regulation of bodycysteine and taurine levels: a brief review,” NeurochemicalResearch, vol. 29, no. 1, pp. 105–110, 2004.
[13] A. C. Maritim, R. A. Sanders, and J. B. Watkins III, “Diabetes,oxidative stress, and antioxidants: a review,” Journal of Bio-chemical and Molecular Toxicology, vol. 17, no. 1, pp. 24–38,2003.
[14] A. Galinier, A. Carriere, Y. Fernandez et al., “Site specificchanges of redox metabolism in adipose tissue of obese Zuckerrats,” FEBS Letters, vol. 580, no. 27, pp. 6391–6398, 2006.
[15] C. K. Roberts, R. J. Barnard, R. K. Sindhu, M. Jurczak, A.Ehdaie, and N. D. Vaziri, “Oxidative stress and dysregulationof NAD(P)H oxidase and antioxidant enzymes in diet-inducedmetabolic syndrome,” Metabolism, vol. 55, no. 7, pp. 928–934,2006.
[16] F. Song, W. Jia, Y. Yao et al., “Oxidative stress, antioxidantstatus and DNA damage in patients with impaired glucoseregulation and newly diagnosed type 2 diabetes,” ClinicalScience, vol. 112, no. 12, pp. 599–606, 2007.
[17] P. Giral, N. Jacob, C. Dourmap et al., “Elevated γ-glutamyl-transferase activity and perturbed thiol profile are associatedwith features of metabolic syndrome,” Arteriosclerosis, Throm-bosis, and Vascular Biology, vol. 28, no. 3, pp. 587–593, 2008.
[18] C. Blouet, F. Mariotti, D. Azzout-Marniche et al., “Dietarycysteine alleviates sucrose-induced oxidative stress and insulinresistance,” Free Radical Biology and Medicine, vol. 42, no. 7,pp. 1089–1097, 2007.
[19] S. K. Jain, T. Velusamy, J. L. Croad, J. L. Rains, and R. Bull,“L-Cysteine supplementation lowers blood glucose, glycatedhemoglobin, CRP, MCP-1, and oxidative stress and inhibitsNF-κB activation in the livers of Zucker diabetic rats,” FreeRadical Biology and Medicine, vol. 46, no. 12, pp. 1633–1638,2009.
[20] T. Toyama, H. Nakamura, Y. Harano et al., “PPARα ligandsactivate antioxidant enzymes and suppress hepatic fibrosis inrats,” Biochemical and Biophysical Research Communications,vol. 324, no. 2, pp. 697–704, 2004.
[21] I. Inoue, S. Noji, T. Awata et al., “Bezafibrate has anantioxidant effect: peroxisome proliferator-activated receptorα is associated with Cu2+, Zn2+-superoxide dismutase in theliver,” Life Sciences, vol. 63, no. 2, pp. 135–144, 1998.
[22] I. Inoue, S. Goto, T. Matsunaga et al., “The ligands/activatorsfor peroxisome proliferator-activated receptor α (PPARα)

10 PPAR Research
and PPARγ increase Cu2+, Zn2+-superoxide dismutase anddecrease p22phox message expressions in primary endothelialcells,” Metabolism, vol. 50, no. 1, pp. 3–11, 2001.
[23] M. A. Abdelmegeed, K. H. Moon, J. P. Hardwick, F. J.Gonzalez, and B. J. Song, “Role of peroxisome proliferator-activated receptor-α in fasting-mediated oxidative stress,” FreeRadical Biology and Medicine, vol. 47, no. 6, pp. 767–778, 2009.
[24] I. Tkac, A. Molcanyiova, M. Javorsky, and M. Kozarova,“Fenofibrate treatment reduces circulating conjugated dienelevel and increases glutathione peroxidase activity,” Pharma-cological Research, vol. 53, no. 3, pp. 261–264, 2006.
[25] S. L. Arnaiz, M. Travacio, A. J. Monserrat, J. C. Cutrin,S. Llesuy, and A. Boveris, “Chemiluminescence and antiox-idant levels during peroxisome proliferation by fenofibrate,”Biochimica et Biophysica Acta, vol. 1360, no. 3, pp. 222–228,1997.
[26] Y. Fang, J. Favre, M. Vercauteren et al., “Reduced cardiacremodelling and prevention of glutathione deficiency after ω-3 supplementation in chronic heart failure,” Fundamental andClinical Pharmacology, vol. 25, no. 3, pp. 323–332, 2011.
[27] T. R. Ramaprasad, V. Baskaran, T. P. Krishnakantha, andB. R. Lokesh, “Modulation of antioxidant enzyme activities,platelet aggregation and serum prostaglandins in rats fedspray-dried milk containing n-3 fatty acid,” Molecular andCellular Biochemistry, vol. 280, no. 1-2, pp. 9–16, 2005.
[28] H. Erdogan, E. Fadillioglu, S. Ozgocmen et al., “Effect of fishoil supplementation on plasma oxidant/antioxidant status inrats,” Prostaglandins Leukotrienes and Essential Fatty Acids, vol.71, no. 3, pp. 149–152, 2004.
[29] K. Arab, A. Rossary, F. Flourie, Y. Tourneur, and J. P. Steghens,“Docosahexaenoic acid enhances the antioxidant response ofhuman fibroblasts by upregulating γ-glutamyl-cysteinyl ligaseand glutathione reductase,” British Journal of Nutrition, vol.95, no. 1, pp. 18–26, 2006.
[30] A. Morise, C. Thomas, J. F. Landrier, P. Besnard, and D.Hermier, “Hepatic lipid metabolism response to dietary fattyacids is differently modulated by PPARα in male and femalemice,” European Journal of Nutrition, vol. 48, no. 8, pp. 465–473, 2009.
[31] P. G. Martin, H. Guillou, F. Lasserre et al., “Novel aspectsof PPARα-mediated regulation of lipid and xenobioticmetabolism revealed through a nutrigenomic study,” Hepatol-ogy, vol. 45, no. 3, pp. 767–777, 2007.
[32] S. S. Lee, T. Pineau, J. Drago et al., “Targeted disruption of theα isoform of the peroxisome proliferator-activated receptorgene in mice results in abolishment of the pleiotropic effectsof peroxisome proliferators,” Molecular and Cellular Biology,vol. 15, no. 6, pp. 3012–3022, 1995.
[33] P. Costet, C. Legendre, J. More, A. Edgar, P. Galtier, andT. Pineau, “Peroxisome proliferator-activated receptor α -isoform deficiency leads to progressive dyslipidemia withsexually dimorphic obesity and steatosis,” Journal of BiologicalChemistry, vol. 273, no. 45, pp. 29577–29585, 1998.
[34] M. Rakhshandehroo, L. M. Sanderson, M. Matilainen etal., “Comprehensive analysis of PPARα-dependent regulationof hepatic lipid metabolism by expression profiling,” PPARResearch, vol. 2007, Article ID 26839, 13 pages, 2007.
[35] N. Chotechuang, D. Azzout-Marniche, C. Bos et al., “mTOR,AMPK, and GCN2 coordinate the adaptation of hepaticenergy metabolic pathways in response to protein intake inthe rat,” American Journal of Physiology—Endocrinology andMetabolism, vol. 297, no. 6, pp. E1313–E1323, 2009.
[36] T. Santa, C. Aoyama, T. Fukushima, K. Imai, and T. Funatsu,“Suppression of thiol exchange reaction in the determi-nation of reduced-form thiols by high-performance liquidchromatography with fluorescence detection after derivatiza-tion with fluorogenic benzofurazan reagent, 7-fluoro-2,1,3-benzoxadiazole-4-sulfonate and 4-aminosulfonyl-7-fluoro-2,1,3-benzoxadiazole,” Biomedical Chromatography, vol. 20,no. 6-7, pp. 656–661, 2006.
[37] C. C. White, H. Viernes, C. M. Krejsa, D. Botta, and T.J. Kavanagh, “Fluorescence-based microtiter plate assay forglutamate-cysteine ligase activity,” Analytical Biochemistry,vol. 318, no. 2, pp. 175–180, 2003.
[38] S. Neschen, K. Morino, J. Dong et al., “n-3 fatty acids preserveinsulin sensitivity in vivo in a peroxisome proliferator-activated receptor-α-dependent manner,” Diabetes, vol. 56, no.4, pp. 1034–1041, 2007.
[39] E. Hopps, D. Noto, G. Caimi, and M. R. Averna, “A novelcomponent of the metabolic syndrome: the oxidative stress,”Nutrition, Metabolism and Cardiovascular Diseases, vol. 20, no.1, pp. 72–77, 2010.
[40] M. Bunger, G. J. Hooiveld, S. Kersten, and M. Muller,“Exploration of PPAR functions by microarray technology—a paradigm for nutrigenomics,” Biochimica et Biophysica Acta,vol. 1771, no. 8, pp. 1046–1064, 2007.
[41] A. Pastore, G. Federici, E. Bertini, and F. Piemonte, “Analysis ofglutathione: implication in redox and detoxification,” ClinicaChimica Acta, vol. 333, no. 1-2, pp. 19–39, 2003.
[42] N. Tsuboyama-Kasaoka, C. Shozawa, K. Sano et al., “Taurine(2-aminoethanesulfonic acid) deficiency creates a viciouscircle promoting obesity,” Endocrinology, vol. 147, no. 7, pp.3276–3284, 2006.
[43] S. Kalhan, J. Edmison, S. Marczewski et al., “Methionine andprotein metabolism in non-alcoholic steatohepatitis: evidencefor lower rate of transmethylation of methionine,” ClinicalScience, vol. 121, no. 4, pp. 179–189, 2011.
[44] L. Miao and D. K. S. Clair, “Regulation of superoxidedismutase genes: implications in disease,” Free Radical Biologyand Medicine, vol. 47, no. 4, pp. 344–356, 2009.
[45] G. Wang, X. Liu, Q. Guo, and S. Namura, “Chronic treatmentwith fibrates elevates superoxide dismutase in adult mousebrain microvessels,” Brain Research, vol. 1359, pp. 247–255,2010.
[46] P. Strazzullo and J. G. Puig, “Uric acid and oxidative stress:relative impact on cardiovascular risk?” Nutrition, Metabolismand Cardiovascular Diseases, vol. 17, no. 6, pp. 409–414, 2007.
[47] B. A. Neuschwander-Tetri, “Hepatic lipotoxicity and thepathogenesis of nonalcoholic steatohepatitis: the central roleof nontriglyceride fatty acid metabolites,” Hepatology, vol. 52,no. 2, pp. 774–788, 2010.
[48] W. V. Berghe, L. Vermeulen, P. Delerive, K. de Bosscher, B.Staels, and G. Haegeman, “A paradigm for gene regulation:inflammation, NF-κB and PPAR,” Advances in ExperimentalMedicine and Biology, vol. 544, pp. 181–196, 2003.
Related Documents