Article (refereed) Norton, Lisa; Johnson, Paul; Joys, Andrew; Stuart, Rick; Chamberlain, Dan; Feber, Ruth; Firbank, Les; Manley, Will; Wolfe, Martin; Hart, Barbara; Mathews, Fiona; Macdonald, David; Fuller, Robert J.. 2009 Consequences of organic and non-organic farming practices for field, farm and landscape complexity. Agriculture, Ecosystems and Environment, 129 (1-3). 221-227. doi:10.1016/j.agee.2008.09.002 Copyright © 2008 Elsevier B.V. All rights reserved. This version available at http://nora.nerc.ac.uk/5572/ NERC has developed NORA to enable users to access research outputs wholly or partially funded by NERC. Copyright and other rights for material on this site are retained by the authors and/or other rights owners. Users should read the terms and conditions of use of this material at http://nora.nerc.ac.uk/policies.html#access This document is the author’s final manuscript version of the journal article, incorporating any revisions agreed during the peer review process. Some differences between this and the publisher’s version remain. You are advised to consult the publisher’s version if you wish to cite from this article. http://www.elsevier.com/ Contact CEH NORA team at [email protected]

Welcome message from author
This document is posted to help you gain knowledge. Please leave a comment to let me know what you think about it! Share it to your friends and learn new things together.
Transcript

Article (refereed)
Norton, Lisa; Johnson, Paul; Joys, Andrew; Stuart, Rick; Chamberlain, Dan; Feber, Ruth; Firbank, Les; Manley, Will; Wolfe, Martin; Hart, Barbara; Mathews, Fiona; Macdonald, David; Fuller, Robert J.. 2009 Consequences of organic and non-organic farming practices for field, farm and landscape complexity. Agriculture, Ecosystems and Environment, 129 (1-3). 221-227. doi:10.1016/j.agee.2008.09.002
Copyright © 2008 Elsevier B.V. All rights reserved. This version available at http://nora.nerc.ac.uk/5572/ NERC has developed NORA to enable users to access research outputs wholly or partially funded by NERC. Copyright and other rights for material on this site are retained by the authors and/or other rights owners. Users should read the terms and conditions of use of this material at http://nora.nerc.ac.uk/policies.html#access This document is the author’s final manuscript version of the journal article, incorporating any revisions agreed during the peer review process. Some differences between this and the publisher’s version remain. You are advised to consult the publisher’s version if you wish to cite from this article. http://www.elsevier.com/
Contact CEH NORA team at [email protected]

1
Consequences of organic and non-organic farming practices for field,
farm and landscape complexity.
Lisa Norton1, Paul Johnson2, Andrew Joys3, Rick Stuart1, Dan Chamberlain3,
Ruth Feber2, Les Firbank4, Will Manley5, Martin Wolfe6 and Robert J. Fuller3
1CEH Lancaster, Lancaster Environment Centre, Library Avenue, Bailrigg, Lancs, LA1 4AP,
UK 2 Wildlife Conservation Research Unit, University of Oxford, Department of Zoology,
Tubney House, Abingdon Road, Tubney, Abingdon, OX13 5QL, UK 3 British Trust for
Ornithology, The Nunnery, Thetford, Norfolk, IP24 2PU, UK 4 North Wyke Research Station
Institute of Grassland and Environmental Research, Okehampton, Devon, EX20 2SB
5Royal Agricultural College, Cirencester, Gloucestershire, GL7 6JS, UK, 6 Organic Farm
Research Centre, Elm Farm, Hamstead Marshall, Newbury, Berkshire, RG20 0HR, UK.
Correspondence: Lisa Norton, CEH Lancaster, Lancaster Environment Centre, Library
Avenue, Bailrigg, Lancs, LA1 4AP, UK (phone +44 1524 595825, fax +44 1524 61536; e-mail

2
Abstract
This paper provides a detailed description and analysis of habitat and
management differences between 89 pairs of organic and non-organic fields
on 161 farms containing arable crops distributed throughout England. Data
were derived at different scales ranging from field to landscape scale using a
range of methods including: land manager questionnaires, habitat surveys
and the use of large scale landscape datasets. Organic farms were situated in
inherently more diverse landscape types, had smaller field sizes, higher, wider
and less gappy hedgerows subject to less frequent management, used
rotational practices including grass, were more likely to be mixed farms and
did not use artificial fertilisers and pesticides.
Organic farms were associated with heterogeneous landscape types.
However, even in such landscape types the organic farming system produced
greater field and farm complexity than farms employing a non-organic system.
The findings of the study point to the importance of organic farming systems
for maintaining landscape and local complexity with consequent benefits for
biodiversity in arable farming landscapes.
Key-words: Landscape complexity; habitat management; biodiversity
restoration; farming system

3
1. Introduction
A number of studies have shown that organic systems may enhance species
biodiversity over non-organic counterparts as a result of increased complexity
or quality of landscape features from the field to the landscape scale e.g. for
birds; (Chamberlain and Wilson 2000; Freemark and Kirk 2001), for plants;
(Aude et al., 2003; Roschewitz et al., 2005a; Gibson et al., 2007; Boutin et al.,
2008) and for invertebrates; (Schmidt et al., 2005; Rundlof & Smith 2006;
Holzschuh et al., 2007). Other studies looking at biodiversity differences
between organic and conventional systems have shown that complexity at the
farm and landscape scale, independent of farming system, explained
biodiversity differences between farms (Weibull et al., 2003; Clough et al.,
2005; Purtauf et al., 2005). Recent work strongly suggests that for certain
taxa, organic farming delivers fewer benefits when located within
heterogeneous landscapes, with relatively large amounts of semi-natural
vegetation, rather than simpler landscapes dominated by intensive farming
(Roschewitz et al.,2005b; Schmidt et al., 2005; Tscharntke et al., 2005;
Rundlof and Smith 2006; Holzschuh et al., 2007) although differences may
still exist (Gibson et al., 2007).
The reviews on the impacts of organic farming on biodiversity (Shepherd et
al., 2003; Hole et al., 2005) draw attention to the need for system-level studies
that incorporate components of management practice (as
required/encouraged by organic certification bodies) which may differ between
organic and non-organic farming systems. The elements of management
practice which may have important implications for biodiversity include both

4
regulations defining organic practice, such as the prohibition of many chemical
pesticides and inorganic fertilisers for organic farmers (Anon 2007) and
indirect effects of those regulations, e.g. the use of grass-clover-leys for
nutrient enrichment and weed suppression. Shepherd et al. (2003) indicated
that, in addition to these management options, organic farmers also tend to
have greater diversity of crop structure (Unwin and Smith 1995), under-sown
crops (Altieri and Letourneau 1982) and lower stocking densities
In contrast to previous studies this study attempts to understand the nature of
any relationships which may exist between farming system and field, farm and
landscape complexity by investigating a large sample of paired organic and
non-organic fields and farms with arable land. As the sample of organic farms
included farms which had converted to organic farming at different times it
was also possible to explore the impacts of longevity of organic practice on
some of the measured variables. In this study no attempt was made to control
for differences between organic and non-organic farming systems in any of
the variables above, with farms being paired purely on location and covering
the whole of England, thus allowing any differences in the above variables to
be explored. The implications of the observed differences in field, farm and
landscape complexity for the substantial differences in richness and
abundance found for a range of taxa on these study farms, (almost all of
which reached higher levels on the organic farms) (Fuller et al., 2005) are
considered.

5
2. Methods
The study was based on a total of 88 non-organic and 73 organic farms over
three cropping seasons between 2000 and 2004. Within these farms,
landscape context and farm management practices centred on 30 pairs of
target spring cereal fields (in 2000) and 59 pairs of target winter wheat fields
(over two seasons 2002-2004). In order to cover as many farms as possible,
on the majority of farms only one cereal field was studied, although due to the
limited numbers of farms with organic cereals available during the period of
the study both a spring and a winter field were examined on 16 organic and 1
non-organic farm. Each organic target field was paired with a target field on a
different non-organic farm. Target fields were almost always surrounded by
similarly managed fields managed by the same farmer. The vast majority of
registered English organic farms growing cereal crops on holdings of more
than 30 ha during the period of the study were included. Organic farmers
were recruited through the two major UK registration bodies, The Soil
Association and Organic Farmers and Growers on the basis of their listed
crops including spring and winter cereals. Non-organic farms were recruited
with the assistance of a UK cereal growers organisation (the Home Grown
Cereals Authority). Non-organic paired fields contained comparable crop
types growing in the same season and located as close as possible (min =
1km, max = 15km, mean = 7.4km and SD= 4.9km) but not adjacent to the
organic target field. This was to prevent any overlap in study area impacting
on the results.

6
Landscape complexity
Potential differences in the landscape context of organic and non-organic
cereal growing areas in England at the 1km2 scale were assessed using data
from Land Cover Map 2000 integrated with CS2000 field survey data 2000
(Fuller et al., 2002; Firbank et al., 2003a; Howard and Bunce 1996). For each
of the ‘cereal growing’ 1km2 in England, data on the estimated percent
coverage of the Improved Grassland, Arable and Horticultural and other
grassland (Neutral, Calcareous and Acid) Broad Habitats (see Jackson 2000)
were extracted.
The landscape context for each of the 89 organic fields used in the study
(based on the 1km2 in which each target field was located) was compared
against the typical context for land within the cereal-growing region of
England. This was done by contrasting the proportions of different Broad
Habitats, (both individually and grouped by grassland types) and the Northing
and Easting of each 1km2 in which there was an organic target field with a
bootstrapped estimated mean for a random sample of 1,000 cereal growing
1km2 in England. A SAS program (SAS 1990) was designed to produce an
output giving two P values indicating whether the bootstrapped estimated
mean for 1000 random sample km2 was significantly greater than or less than
(at the 0.001 level) the estimated mean for the squares containing organic
target fields.
The land cover dataset (see above) was also used to investigate differences
between landscape level variables for paired organic and non-organic farms

7
on a local scale (1-25km2). Data on the %cover of individual and combined
Broad Habitats in: a) the 1 km2 containing the target field (target square), b)
the 3x3 km2 with the target square at its centre – the 9km2 scale - and c) the
5x5 km2 with the target square at its centre – the 25km2 scale, were compared
between organic and non-organic farms in each pair using Wilcoxon’s paired
tests.
Farm and field complexity
Habitat survey areas were defined which covered a target field and up to five
surrounding fields (dependant on number of adjacent fields). This aspect of
the study provided a measure of farm-scale complexity. Within this area all
habitat patches were mapped at the 1:25,000 scale. Habitat patches included
individual cropped fields, game strips, woods, ponds, grass margins, hedges
etc. A hedge was defined as a single habitat patch unless its composition or
structure changed significantly or the adjacent habitats changed. Habitat
survey areas were visited on five occasions during one winter and any
changes in the habitat patches e.g. crops grown across the winter were
recorded. Data were compared using Wilcoxon’s paired tests.
Field boundary surveys recorded base width and height and species
composition of hedgerows surrounding target cereal fields on 80 of the 89
paired fields (sample size was dependent on availability of local habitat
surveyors).
8
Farmer questionnaires developed in conjunction with colleagues at the Royal
Agricultural College and Elm Farm Research Centre relating to each target
field and farm involved in the study were completed by personal interview.
Farmers were asked to provide information from both target fields and the
whole farm including: sowing dates, crop management (including rotation),
farm and field size, boundary management, extents of non-crop habitats,
arable and non-arable land, duration of management, agri-environment (AE)
agreements held (Defra 2001), duration of organic management and whether
or not they actively managed for wildlife. Data from the questionnaires was
interpreted with advice from an agronomist, e.g. the grouping of marginally
differing rotations into agriculturally meaningful ‘types’ of rotation such as
‘cereals with a break crop or set-aside’, ‘cereals with a ley’ and ‘continuous
cereals’. A range of analyses were carried out to test for differences between
organic and non-organic farms (these included Wilcoxon matched pair test,
paired T-Test, Mann Whitney test and Chi square as detailed in the results
section). Simple regression was used to investigate the impact of the period of
time for which a field had been under organic management on field size and
the proportions of arable and permanent pasture present on the farm.
3. Results
Landscape complexity
The 1km2 in which target organic fields were located contained significantly
greater proportions of improved grass (managed leys and permanent pasture)
and significantly smaller proportions of other grass (non-improved, including

9
set-aside) than the mean for the random sample of 1km2 in English cereal
growing areas (Table 1). The mean Northing of organic farm squares was
significantly less than the mean of the random sample of 1km2 in English
cereal growing areas indicating that the target squares were to the south of
the range of cereal growing areas in England (Table 1).
Both the 1 and 9km2 in which the organic target fields were located contained
higher ratios of grassland to arable land and more non-crop habitat than their
non-organic counterparts. There were no significant differences between the
farm types for the Broad Habitat types and groupings at the 25km2 scale
(Table 2).
Farm and field complexity
There were marked differences between the areas of particular habitats types
on organic and non-organic farm pairs (either in terms of total area or as a
proportion of the area surveyed) (Table 3). The density of linear features
(hedges and boundaries) was higher on organic farms. Organic farms
contained more grass habitats and non-organic farms contained more cereal
and cropped habitat in the sampled area (Table 3).
Hedgerow height, width and base width were significantly higher on organic
farms than on non-organic farms and numbers of trees and woody shrubs
were also higher though not significantly (Table 4). There were significantly
higher numbers of breaks and gaps in hedgerows surrounding non-organic
fields (Table 4).

10
Data collected from the questionnaire confirmed that the sample of fields used
in the study were representative of the farm types under study (i.e. managed
according to normal farm practice and surrounded by fields managed
similarly).
More organic than non-organic farms had land in agri-environment (AE)
schemes (Table 5), but the target fields around which habitat surveys took
place were equally likely to be in an AE scheme whether they were on an
organic (n=28) or a non-organic (n=26) field. Fields were smaller on organic
farms (mean organic 7.36ha, mean non-organic 10.65ha, paired T- test,
p<0.001) but farm size (Table 5) and contiguity of farmland (70% organic,
77%% non-organic) did not differ between farm types. There were large
differences between farm types in terms of spring cropping on target fields (on
the 30 farm pairs growing spring cereals) with organic systems using a wider
variety of crop type (Fig. 1). Non-organic farmers did not under-sow spring
crops with a ley, but 40% of organic farmers did (Fig. 1).
Differences in cropping practices reflected differences in anticipated crop use
with the majority of organic farmers growing spring crops for animal feed
(73%) and the majority of non-organic farmers (55%) growing for malting. Use
of winter cereals was more similar between farm types with the majority of
organic and non-organic farmers growing winter wheat, 15% of organic
growers chose triticale (as a better low/no input crop) in preference to winter
wheat (Fig.1).

11
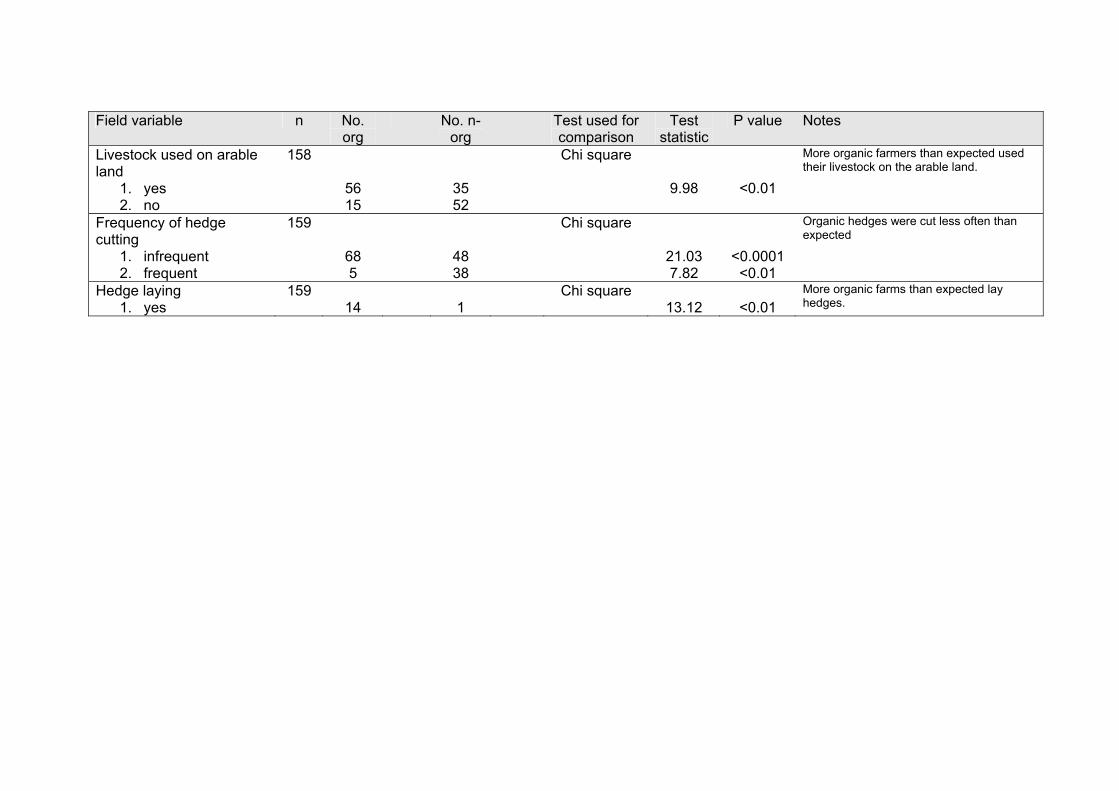
The results indicated that a range of significant differences in management
practices existed between organic and non organic systems including, for
example; 1) rotations – with organic systems including grass leys (92%), non-
organic systems using rape/vegetables or set-aside as a break crop (87.5%) ,
2) hedge management practices – with organic farmers less likely to manage
annually (only 49% managed hedges round the target fields in the study year
compared to 74% of non-organic farmers, see also Table 5), 3) sowing times
– organic farmers sowed later for both winter and spring crops (Wilcoxon’s
matched pair test, p<0.01), 4) more frequent use of animals within the
organic farming system (predominantly to graze off either leys or crops, see
Table 5), 5) use of synthetic fertilisers on all but one non-organic field but not
at all on organic fields, 6) use of synthetic pesticides (particularly herbicides at
95%) on all non-organic target fields and not at all on organic fields.
There were, however, no significant differences between farm types in terms
of: 1) the proportions of permanent pasture and its’ management, 2) area of
woodland, 3) number of ponds, 4) number of non-crop habitats listed, 5) type
of farm ownership (e.g. tenant, shared farm, owner), 6) changes in hedge
numbers on the farm historically (40 years) and 7) whether farmers positively
managed for wildlife.
The surveyed organic farms had been registered as organic for up to 20 years
with 49% registered organic for less than 5 years and approximately half of
these converted for one year or less. The majority of organic farms were fully
organic (66%), but 14% contained non-organic land which was unlikely to be

12
converted. There were significant relationships between the length of time a
farm had been registered as organic and a number of variables including; field
size - very variable on new organic farms but generally smaller on older
organic farms (r2=0.04, f 1,84 =4.36, p<0.05), % arable - lower on older organic
farms (r2=0.109, f 1,63 =8.80, p<0.01) and % permanent pasture – higher on older
organic farms (r2=0.123, f 1,64=10.09, p<0.01). All of these were influenced
strongly by the small percentage of farms which had always been organically
managed (6%).
4. Discussion
The study suggests that farm management practices result in greater
complexity on organic farms at the scales investigated which may be
associated with positive impacts of organic farming on biodiversity (Bengtsson
et al., 2005) including those found for the farms in this study (see Fuller et al.,
2005).
This study also revealed that organic cereal growing farms in England tend to
be located in more heterogeneous landscapes towards the south of England
characterised by extensive mixed farming compared to more northerly
intensive arable areas where non-organic cereal growing is concentrated.
Rundlof and Smith (2006) found similar differences between locations of
organic and non-organic cereals-growing farms in Sweden.
The pairing of organic and non-organic farms on the basis of their proximity to
one another ensured that the fact that organic farms tend to be located in

13
heterogeneous landscapes did not account for the differences between
systems shown here, i.e. the organic and non-organic farms within a pair were
located within broadly the same landscape types as supported by
comparisons at the 25km2 scale. Results for the one and 9km2 surrounding
target fields and for habitat surveys indicated that even within similar relatively
heterogeneous landscape types organic farms were characterised by higher
landscape complexity than was found in their non-organic more arable
dominated counterparts (see Gibson et al., 2007).
Supporting management data provided evidence that differences at the farm
scale may result from the fact that organic farms incorporating cereals were
more likely than their non-organic pair to be mixed farms with ‘older’ organic
farms containing the lowest ratios of arable to permanent pasture. Additionally
organic farmers incorporated grass-clover leys into their rotations and planted
a wider variety of cereal types which were frequently under-sown with a ley.
Greater complexity of both crop structure and field use at the landscape scale
is likely to attract a broader range of potentially beneficial species because of
the availability of a larger number of different habitat types as opposed to
more uniform landscapes (Benton et al., 2003; Weibull et al., 2003; Rundlof
and Smith 2006; Clough et al., 2007; Oberg et al., 2007). The presence of
long-established permanent pasture may be particularly important as a
permanent habitat for insects (Purtauf et al., 2005).
In addition to the complexity resulting from field use, non-crop habitats
covered a greater extent in the locality of organic farms and on the farms

14
themselves than on their non-organic counterparts in both the 1 and 9km2
surrounding the target fields. Habitat surveys revealed that densities (length
per unit area) of linear features, both hedges and boundaries, were higher on
organic farms which correlated with the questionnaire finding that fields were
smaller on organic farms. The presence of stock on organic farms encourages
the maintenance of stock-proof hedges and this is reflected in the hedge
information collected by habitat surveyors indicating that hedges on organic
farms were higher, wider and less gappy than those on their non-organic
counterparts.
The greater extent of non-crop habitat in the vicinity of organic farms is likely
to be beneficial for biodiversity, e.g. Holzschuh et al. (2007) found that
landscape heterogeneity and the availability of semi-natural nesting habitats
resulted in higher bee diversity on farmland. Smaller field sizes and higher
densities of hedges provide a high perimeter to area ratio which is correlated
with small scale landscape complexity and higher species richness as found
for plants, butterflies and carabids by Weibull et al. (2003). For organic
farmers, the high perimeter to area ratio means that the benefits of the hedges
extend over a greater area of the farmed land than would be the case if fields
were larger. The condition of non-crop features is also important with well
maintained continuous hedges providing important corridors for movement of
species including small mammals (Gelling et al., 2007), nesting and feeding
sites for birds (Chamberlain et al., 2001) as well refuges for plant and
invertebrate species. Whilst organic certification bodies do not enforce rules
on the creation or retention of non-crop features as an essential part of the

15
farming system those practising organic agriculture in accordance with
management guidelines such as those outlined in Lampkin (1990) recognise
the importance of providing non-crop habitats for beneficial insects and other
wildlife which help to control crop pests
The relationship between organic farming and agri-environment scheme
participation was complex at the time of the study as the extent and
management of farm habitats on organic farms may have made it easier for
organic farms to enter into agri-environment agreements. The proportion of
farms in the wider countryside with an agri-environment scheme at the time of
the study was 14% (Defra census and agri-environment scheme data)
contrasting with 45% of the non-organic study farms. This indicates that the
non-organic farmers in this study were more ‘wildlife friendly’ than average
which was possibly due to the recruitment process, i.e. farmers being asked to
be a part of a biodiversity study may be more likely to agree if they are
interested in biodiversity. The similarity of responses to the question of
whether they managed for wildlife on their farms between organic and non-
organic farmers also supported this. This tendency towards a more’ wildlife
friendly’ farming style (see Schmitzberger et al., 2005), coupled to the fact that
farms were located close to their pairs (i.e. in a similar landscape context at
the coarse scale), makes the observed differences between the farm types
more notable.
The most obvious difference between organic and non-organic farming is that
organic farmers do not apply synthetic fertilisers or use non-organic pesticides

16
(Anon 2007; Romero et al., 2008). This results in secondary differences
between the systems including timing of sowing and types of crop sown, for
example, the use of triticale over wheat as a result of its lower nutrient
demand. For most studies looking at organic farming effects on biodiversity
these are the overriding factors differentiating organic farming from non-
organic farming practices, see Gabriel et al. (2005) and Hole et al. (2005).
Organic farmers always sowed crops later than their conventional
counterparts in order to avoid weed flushes. The difference was particularly
marked for winter wheat where non-organic farmers were able to sow earlier
through the use of pesticides in the early stages of crop growth. This ability to
allow weeds to establish and yet restrict their impacts on crops through
pesticide use enables non-organic farmers to allow natural regeneration on
cereal stubbles which are a particularly attractive environment for birds
(Gillings et al., 2005). Organic farmers choose to use fertility building crops on
their set-aside land rather than leave it unmanaged (set-aside on non-organic
farms is likely to have been recorded as ‘other grass’ for landscape context
comparisons). Whilst both stubbles and set-aside have been shown to be
beneficial to wildlife (Firbank et al., 2003b) it is open to debate as to whether
the presence of naturally regenerating stubble or set-aside fields isolated
within a relatively homogenous landscape at the small scale are better for
biodiversity than a system which results in an inherently more heterogeneous
and weedy landscape at that scale.

17
Acknowledgements
Many thanks to all the farmers who provided access to their land and the
volunteers and fieldworkers who collected data at those sites. Thanks to Su
Gough at the BTO and to Gaetanne Deunette for her invaluable help. The
study was funded by the Department for the Environment Food and Rural
Affairs.
References
Altieri, M. A., Letourneau, D.K., 1982. Vegetation management and biological control in agroecosystems. Crop Protection 1, 405-430.
Anon. 2007. Council Regulation (EC) No 834/2007 of 28 June 2007 on organic production and labelling of organic products and repealing Regulation (EEC) No 2092/9. http://eur-lex.europa.eu/LexUriServ/site/en/oj/2007/l_189/l_18920070720en00010023.pdf
Aude, E., Tybirk, K., Pedersen, M. B., 2003. Vegetation diversity of conventional and organic hedgerows in Denmark. Agric. Ecosyst. Environ. 99, 135-147.
Bengtsson, J., Ahnstrom, J., Weibull, A.C., 2005. The effects of organic agriculture on biodiversity and abundance: a meta-analysis. J. Appl. Ecol. 42, 261-269.
Benton, T. G., Vickery, J.A.,Wilson, J.D., 2003. Farmland biodiversity: is habitat heterogeneity the key? Trends Ecol. Evolut. 18, 182-188.
Boutin, C., Baril, A., Martin, P.A., 2008. Plant diversity in crop fields and woody hedgerows of prganic and conventional farms in contrasting landscapes. Agric. Ecosyst. Environ. 123, 185-193.
Chamberlain, D. E., Wilson, J.D., 2000. Ecology and Conservation of Lowland Farmland Birds. British Ornithologists Union, Tring.
Chamberlain, D.E., Vickery, J.A., Marshall, E.J.P., Tucker, G.M., 2001. The effect of hedgerow characteristics on the winter hedgerow bird community, in: Barr, C.J., Petit, S. (Ed.), Hedgerows of the World, IALE (UK), University of Birmingham, pp. 197-207.
Clough, Y., Kruess, A., Kleijn, D., Tscharntke, T., 2005. Spider diversity in cereal fields: comparing factors at local, landscape and regional scales. J. Biogeog. 32, 2007-2014.
Clough, Y., Kruess, A., Tscharntke, T., 2007. Local and landscape factors in differently managed arable fields affect the herbivore community of a non-crop plant species. J. Appl. Ecol. 44, 22-28.
Defra. 2001. The Countryside Stewardship Scheme - Traditional Farming in the Modern Environment. http://www.defra.gov.uk/erdp/schemes/css/default.htm.
Firbank, L. G., Barr, C.J., Bunce, R. G. H., Furse, M. T., Haines-Young, R. Hornung, M., Howard, D.C., Sheail, J., Sier A., Smart, S.M., 2003a. Assessing stock and change in land cover and biodiversity in GB: an introduction to Countryside Survey 2000. J. Environ. Man. 67, 207-218.
Firbank, L. G., Smart, S.M., Crabb, J., Critchley, C.N.R., Fowbert, J.W., Fuller, R.J., Gladders, P., Green, D. B., Henderson, I., M. O. Hill., 2003b. Agronomic and

18
ecological costs and benefits of set-aside in England. Agric. Ecosyst. Environ. 95, 73-85.
Freemark, K. E., Kirk, D.A., 2001. Birds on organic and conventional farms in Ontario: partitioning effects of habitat and practices on species composition and abundance. Biol. Cons. 101, 337-350.
Fuller, R. J., Norton, L.R., Feber, R.E., Johnson, P.J., Chamberlain, D.E., Joys, A.C., Mathews, F., Stuart, R.C.,Townsend, M.C., Manley, W.J Wolfe, M.S., Macdonald, D.W., Firbank, L.G., 2005. Benefits of organic farming to biodiversity vary among taxa. Biol. Lett. 1, 431-434.
Fuller, R. M. S., Smith, G.M,, Sanderson, J.M., Thomson, A.G., 2002. The UK Land Cover Map 2000: construction of a parcel-based vector map from satellite images Cartogr. J. 39, 15-25.
Gabriel, D., Thies, C., Tscharntke, T., 2005. Local diversity of arable weeds increases with landscape complexity. Perspect. Plant Ecol. 7, 85-93.
Gelling, M., Macdonald, D.W., Mathews, F., 2007. Are hedgerows the route to increased farmland small mammal density? Use of hedgerows in British pastoral habitats. Landscape Ecol. 22, 1019-1032.
Gibson, R. H., Pearce, S., Morris, R.J., Symondson, W.O.C., Memmot, J., 2007. Plant diversity and land use under organic and conventional agriculture: a whole farm approach. J. Appl. Ecol. 44, 792-803.
Gillings, S., Newson, S.E.,Noble, D.G., Vickery, J.A., 2005. Winter availability of cereal stubbles attracts declining farmland birds and positively influences breeding population trends. Proc. of Roy. Soc.B-Biol. Sci. 272, 733-739.
Hole, D.G., Perkins, A.J., Wilson, J.D., Alexander, I.H., Grice, P.V., Evans, A.D., 2005. Does organic farming benefit biodiversity? Biol. Cons. 122, 113-130.
Holzschuh, A., Steffan-Derwenter, I., Kleijn, D., Tscharntke, T., 2007. Diversity of flower-visiting bees in cereal fields:effects of farming system, landscape composition and regional context. J. Appl. Ecol. 44, 41-49.
Howard, D.C., Bunce, R.G.H., 1996. The Countryside Information System: A strategic level decision support system. Environ. Mon. Assess. 39, 373-384.
Jackson, D.L., 2000. Guidance on the interpretation of the Biodiversity Broad Habitat Classification (terrestrial and freshwater types): Definitions and the relationship with other habitat classifications. JNCC Report, No.307, Peterborough.
Kleijn, D., Sutherland, W.J., 2003. How effective are European agri-environment schemes in conserving and promoting biodiversity? J. Appl. Ecol. 40, 947-969.
Lampkin, N., 1990. Organic Farming. Farming Press Limited, Ipswich. Oberg, S., Ekborn, B., Bommarc, R., 2007. Influence of habitat type and surrounding
landscape on spider diversity in Swedish agroecosystems. Agric. Ecosyst. Environ. 112, 211-219.
Purtauf, T., Roschewitz, I., Dauber, J., Thies, C., Tscharntke, T., Wolters, V., 2005. Landscape context of organic and conventional farms: Influences on carabid beetle diversity. Agric.Ecosyst. Environ. 108, 165-174.
Romero, A., Chamorro, L., Sans, F.X., 2008. Weed diversity in crop edges and inner fields of organic and conventional dryland winter cereal crops in NE Spain. Agric. Ecosyst. Environ. 124, 97-104.
Roschewitz, I., Gabriel, D., Tscharntke, T., Thies, C., 2005a. The effects of landscape complexity on arable weed species diversity in organic and conventional farming. J. Appl. Ecol. 42, 873-882.
Roschewitz, I., Thies, C., Tscharntke, T., 2005b. Are landscape complexity and farm specialisation related to land-use intensity of annual crop fields? Agric. Ecosyst. Environ. 105, 87-99.
Rundlof, M., Smith, H.G., 2006. The effect of organic farming on butterfly diversity depends on landscape context. J. Appl. Ecol. 43, 1121-1127.

19
SAS 1990 SAS.STAT User’s Guide. Version 6, 4th edition, SAS Institute, Cary NC. Schmidt, M. H., Roschewitz, I., Thies, C., Tscharntke, T., 2005. Differential effects of
landscape and management on diversity and density of ground-dwelling farmland spiders. J. Appl. Ecol. 42, 281-287.
Schmitzberger, I., Wrbka, Th., Steurer, B., Aschenbrenner, G., Peterseil, J., Zechmeister, H.G., 2005. How farming styles influence biodiversity maintenance in Austrian agricultural landscapes. Agric. Ecosyst. Environ. 108, 274-290.
Schweiger, O., Maelfait, J. P., Van Wingerden, W., Hendrickx, F.,Billeter, R., Speelmans, M., Augenstein, I., Aukema, B., Aviron, S., Bailey, D., Bukacek, R., Burel, F., Diekotter, T., Dirksen, J., Frenzel, M., Herzog, F., Liira, J., Roubalova, M. & Bugter, R., 2005. Quantifying the impact of environmental factors on arthropod communities in agricultural landscapes across organizational levels and spatial scales. J. Appl. Ecology 42, 1129-1139.
Shepherd, M., Pearce, B., Cormack, B., Philipps, L., Cuttle, S., Bhogal, A., Costigan, P., Unwin, R., 2003. An assessment of the environmental impacts of organic farming. (http://www.defra.gov.uk/farm/organic/policy/research/pdf/env-impacts2.pdf).
Swift, M. J., Izac, A.-M.N., van Noordwijk, M., 2004. Biodiversity and ecosystem services in agicultural landscapes - are we asking the right questions? Agric. Ecosyst. Environ. 104(1), 113-134.
Tilman, D., Cassman, K. G., Matson, P.A., Naylor, R., Polasky, S., 2002. Agricultural sustainability and intensive production practices. Nature 418, 671-677.
Tscharntke, T., Klein, A.M.,Kruess, A., Steffan-Dewenter, I., Thies, C., 2005. Landscape perspectives on agricultural intensification and biodiversity - ecosystem service management. Ecol. Lett. 8, 857-874.
Unwin, R. J., Smith, K.A., 1995. Nitrate Leaching from Livestock Manures in England and the Implications for Organic Farming of Nitrate Control Policy. Biol. Agric. Hort. 11, 319-327.
Weibull, A. C., Ostman, O., Granqvist, A., 2003. Species richness in agroecosystems: the effect of landscape, habitat and farm management. Biodivers. Conserv. 12, 1335-1355.
Woodhouse, S. P., Good, J. E. G., Lovett, A. A., Fuller, R. J., Dolman, P.M., 2005. Effects of land-use and agricultural management on birds of marginal farmland: a case study in the Llyn peninsula, Wales. Agric. Ecosyst. & Environ. 107, 331-340.

20
Table legend Table 1. Results of analysis comparing distributions of individual and grouped Broad
Habitats in the 89 1km2 in which organic farms were located and 1000 random
samples of 89 1km2 in the cereal producing areas of England. Significant results are
indicated in bold type.
Table 2. Descriptive statistics and results of Wilcoxon’s matched pair tests for
comparison between landscape composition (using %cover of individual and
combined Broad Habitats) of the 1, 9 and 25km2 in which the organic and non-
organic target fields (n=89) were centred. Significant results are indicated in bold
type, n.s. = non significant. N.B. other habitat types comprise a very small % cover in
some squares; hence % cover does not equal 100%.
Table 3. Results of the comparison between habitats on organic and non-organic
farms in the habitat survey areas. S.D. = standard deviation, n = no. of farm pairs,
Variables showing significant differences between farm types (Wilcoxon tests) are
shown in bold with level of significance indicated against the organic result thus:*
p<0.05, **p<0.01, ***p<0.001.
Table 4. Descriptive statistics and Wilcoxon’s matched pair tests for comparison
between organic and non-organic farm types for the target field (n=80). Significant
results are indicated in bold type, n.s. = non significant. The sign next to the
Wilcoxon score indicates which farm type has the highest score; ‘+’ = organic, ‘-’ =
non-organic.
Table 5. Summarised results from the farm management questionnaire. Information
on variables where testing was inappropriate is included (org = organic farms, n-org
= non organic farms).

Table 1. Results of analysis comparing distributions of individual and grouped Broad
Habitats in the 89 1km2 in which organic farms were located and 1000 random
samples of 89 1km2 in the cereal producing areas of England. Significant results are
indicated in bold type.
Variable Mean
Organic
squares
Mean
Random sample
squares
P
greater
P less
Arable (%) 40.5 42.3 0.731 0.269
Improved grass (%) 35.1 24.4 0.001 0.999
Other grass (%) 4.3 11.0 0.999 0.001 Easting 437.2 441.0 0.648 0.352
Northing 232.6 278.01) 0.999 0.001

Table 2. Descriptive statistics and results of Wilcoxon’s matched pair tests for comparison between landscape composition (using %cover of
individual and combined Broad Habitats) of the 1, 9 and 25km2 in which the organic and non-organic target fields (n=89) were centred. Significant
results are indicated in bold type, n.s. = non significant. N.B. other habitat types comprise a very small % cover in some squares; hence % cover
does not equal 100%.
1km2 9km2 25km2
Broad Habitat Type or grouping Fa
rm ty
pe
Mea
n
dev
iatio
n S
tand
ard
Wilc
oxon
P v
alue
Mea
n
Sta
ndar
d
dev
iatio
n
Wilc
oxon
P v
alue
Mea
n
Sta
ndar
d
dev
iatio
n
Wilc
oxon
P v
alue
O 40.5 17.5 3.2 <0.01 42.0 15.7 2.7 <0.01 42.6 15.1 1.5 n.s. Arable and Horticultural (a)
C 47.0 20.6 44.8 16.7 43.4 16.0
O 19.9 8.2 3.0 <0.05 20.5 6.7 2.8 <0.01 20.9 7.2 -1.7 n.s. All non-crop Broad Habitats
C 17.1 9.3 19.2 8.0 20.2 8.7
O 39.4 15.6 2.6 <0.01 36.7 12.7 1.3 n.s. 35.6 11.5 -1.3 n.s. All grassland Broad Habitats (g)
C 35.6 17.4 34.8 13.5 34.6 13.1
O 1.6 1.8 3.6 <0.001 1.6 1.6 2.8 <0.01 1.58 1.44 1.8 n.s. Ratio arable: grass
C 2.4 2.8 1.8 1.8 1.69 1.60

Table 3. Results of the comparison between habitats on organic and non-organic
farms in the habitat survey areas. S.D. = standard deviation, n = no. of farm pairs, 1
Variables showing significant differences between farm types (Wilcoxon tests) are
shown in bold with level of significance indicated against the organic result thus:*
p<0.05, **p<0.01, ***p<0.001.
Total length/area habitat % contribution to total length/area habitat
Organic Non-organic Organic Non-organic
Mean S.D. Mean S.D. Mean S.D. Mean S.D. Linear features (km) n=48
- Hedge 2.4 1.2 2.2 1.3 75.8 24.5 67.8 30.0 - Ditch 0.1 0.3 0.2 0.4 3.4 10.0 4.2 9.7 - Boundary 1 0.6* 0.8 1.2 1.5 20.8 23.1 28.0 29.4 Field habitats (ha) n=56
- Bare ground 7.9 8.7 10.5 12.3 18.1 16.8 17.1 15.0 - Crop 9.1*** 9.2 21.1 17.0 22.5*** 19.8 37.1 22.6 - Grass 12.9*** 10.1 7.7 8.7 37.7*** 26.3 17.2 18.9 - Stubble 6.7** 10.1 11.3 10.8 16.8 17.7 23.1 19.5 - Grassy margins 1.9 3.2 2.4 3.2 5.0 6.2 5.5 8.6 All habitats (ha) n=48
- Bare ground 7.8 8.8 9.8 12.3 14.9 15.6 13.8 13.1 - Boundary 1 0.1 0.1 0.1 0.2 0.2 0.4 0.2 0.2 - Crop 4.0*** 6.1 10.4 13.1 9.8* 17.5 13.6 14.7 - Ditch 0.0 0.0 0.0 0.0 0.0 0.1 0.0 0.1 - Grass 9.2* 8.6 6.4 7.8 20.3*** 15.4 10.1 11.5 - Hedge 0.8 0.5 0.7 0.5 2.4 3.2 1.5* 1.3 - Grassy margin 2.2 3.4 2.6 3.1 4.7 5.6 5.1 7.5 - Pond 0.0 0.1 0.0 0.1 0.1 0.2 0.1 0.2 - Stubble 4.6 9.7 5.2 9.4 7.7 11.5 7.1 11.3 - Wood 0.5 0.9 0.5 1.2 1.0 1.8 0.7 1.3 - Cereal crop 6.1*** 7.7 16.7 15.3 11.7*** 12.3 23.4 17.7 - Cereal stubble 5.6 8.8 9.0 9.9 10.8 12.8 14.7 14.4 - Grazed grass 6.8 7.6 5.4 7.8 15.9 15.5 7.7*** 10.0 - Root crop 0.0** 0.2 2.3 6.0 0.1** 0.5 2.0 4.9 Density linear features (km per ha)
- Hedge 0.1** 0.2 0.1 0.1 - Boundary 1 0.2* 0.2 0.1 0.1
1 Boundary includes all boundary types (hedge, ditch & fences/walls). Results for variables which changed between visits (e.g. crop type) are presented as a mean figure for all farm visits. Numbers of farm pairs included in each analysis are given (these vary according to data collected by surveyors).

Table 4. Descriptive statistics and Wilcoxon’s matched pair tests for comparison
between organic and non-organic farm types for the target field (n=80). Significant
results are indicated in bold type, n.s. = non significant. The sign next to the
Wilcoxon score indicates which farm type has the highest score; ‘+' = organic, ‘-‘ =
non-organic.
Organic farm type Non-organic farm
type
Habitat
hedge
features Mean Standard
deviation
Mean Standard
deviation
Wilcoxon
score
P
value
Base
height
0.2 0.2 0.3 0.2 32 n.s.
Base width 1.7 1.2 1.4 1.1 +511 0.05
Height 2.0 1.1 1.6 1.2 +482 0.05
Width 2.2 1.3 1.6 1.4 +619 0.01
No. breaks 3.0 3.6 4.3 4.7 -270 0.05
No. gaps 1.4 1.9 2.8 4.8 -257 0.05
No. of trees 25.1 30.4 23.0 30.1 255 n.s.
- No. live 22.3 26.5 18.2 19.1 249 n.s.
- No. dead 3.7 12.3 4.0 11.4 26 n.s.
No. woody
tree/shrub
species
5.7 2.7 5.3 3.0 196 n.s.

Table 5. Summarised results from the farm management questionnaire. Information on variables where testing was inappropriate is included
(org = organic farms, n-org = non organic farms). Field variable n Mean
org SD org
Mean n-org
SD n-org
Test used for comparison
Test statistic
P value Notes
Farm size 89 pairs
246Ha 250 271Ha 280 Paired t-test 0.048 Non sig. Farm size ranged between 30 and 1457Ha.
% arable land 158 58
28 70 24 Mann Whitney U
-2.4
<0.01
There was significantly less arable land on organic farms.
Agri-environment schemes on farms
1. In schemes 2. Not in schemes
158
46 26
37 49
Chi square
3.95 3.44
<0.05 Non sig.
The proportion of organic farms in agri-environment schemes was higher than expected.
Use of set-aside options 1. permanent 2. rotational 3. both
4. none
159 11 41 8
14
10 49 21 5
Chi square 0.7 0
3.48 5.27
Non sig. Non sig. Non sig.
<0.05
The number of organic farms with no set-aside is higher than expected.
Use of natural regeneration as a set-aside option
1. yes 2. no
134
23 37
55 19
Chi square
73.5 10.4
<0.0001 <0.001
Natural regeneration is significantly less likely to be used as an option by organic farmers.
Leys in system 1. yes
2. no
158
70 3
25 60
Chi square 15.28 61.40
<0.0001 <0.0001
Leys within both systems were managed similarly, but were more common on organic farms.
Livestock on farm 1. yes 2. no 3. beef 4. sheep 5. dairy
158
66 5
43 40 23
60 27 35 17 23
Chi square 3.94
0.11 7.04 0.08
<0.05
Non sig.
<0.01 Non sig.
Numbers of organic farms with livestock were higher than expected. A wider variety of livestock was found on organic farms including poultry, pigs, goats and deer. A few non-organic farms had pigs and horses.
Field variable n No.
org No. n-
org Test used for
comparison Test
statistic P value Notes
Livestock used on arable land
1. yes 2. no
158
56 15
35 52
Chi square
9.98
<0.01
More organic farmers than expected used their livestock on the arable land.
Frequency of hedge cutting
1. infrequent 2. frequent
159
68 5
48 38
Chi square
21.03 7.82
<0.0001 <0.01
Organic hedges were cut less often than expected
Hedge laying 1. yes
159 14
1
Chi square 13.12
<0.01
More organic farms than expected lay hedges.

21
Figure legend
Fig.1. Cropping regimes on organic and non-organic farms. a) Spring cereals
b) Winter cereals.

a) Spring cereals
0
20
40
60
80
100
Org Non-org
Farm type
Pro
porti
on o
f tot
al s
ampl
e (%
)
S.wheat + leyS.wheatS.oats + leyS.oatsS.barley + leyS.barley
b) Winter cereals
0
20
40
60
80
100
Org Non-org
Farm type
Pro
porti
on o
f tot
al s
ampl
e (%
)
W.wheatW.barleyTriticale
Fig.1. Cropping regimes on organic and non-organic farms.
Related Documents