Consciousness Level Assessment in Completely Locked-in Syndrome Patients using Soft Clustering Von der Fakultät für Mathematik und Informatik der Universität Leipzig angenommene DISSERTATION zur Erlangung des akademisches Grades DOKTOR-INGENIEUR im Fachgebiet Informatik vorgelegt von Dipl.-Ing. Volafidy Sophie ADAMA von Diégo-Suarez, Madagaskar Die Annahme der Dissertation wurde empfohlen von: 1. Prof. Dr. Martin Bogdan (Universität Leipzig) 2. Dr. Ander Ramos-Murguialday (Universität Tübingen) Die Verleihung des akademischen Grades erfolgt mit Bestehen der Verteidigung am 18.03.2022 mit dem Gesamtprädikat magna cum laude.

Welcome message from author
This document is posted to help you gain knowledge. Please leave a comment to let me know what you think about it! Share it to your friends and learn new things together.
Transcript

Consciousness Level Assessment in CompletelyLocked-in Syndrome Patients using Soft Clustering
Von der Fakultät für Mathematik und Informatik der Universität Leipzig
angenommene
D I S S E R T A T I O N
zur Erlangung des akademisches Grades
DOKTOR-INGENIEUR
im Fachgebiet Informatik
vorgelegt
von Dipl.-Ing. Volafidy Sophie ADAMAvon Diégo-Suarez, Madagaskar
Die Annahme der Dissertation wurde empfohlen von:
1. Prof. Dr. Martin Bogdan (Universität Leipzig)2. Dr. Ander Ramos-Murguialday (Universität Tübingen)
Die Verleihung des akademischen Grades erfolgt mit Bestehen der Verteidigung am 18.03.2022 mitdem Gesamtprädikat magna cum laude.


À mes parents.
“Ny hazo no vanon-ko lakana, ny tany naniriany no tsara. ”
-– Ohabolana malagasy


Abstract
Consciousness Level Assessment in Completely Locked-inSyndrome Patients using Soft Clustering
Brain-computer interfaces (BCIs) are very convenient tools to assess locked-in (LIS) and com-pletely locked-in state (CLIS) patients’ hidden states of consciousness. For the time being, thereis no ground-truth data in respect to these states for above-mentioned patients. This lack of goldstandard makes this problem particularly challenging. In addition to consciousness assessment,BCIs also provide them with a communication device that does not require the presence ofmotor responses, which they are lacking. Communication plays an important role in the pa-tients’ quality of life and prognosis. Significant progress have been made to provide them withEEG-based BCIs in particular. Nonetheless, the majority of existing studies directly dive intothe communication part without assessing if the patient is even conscious. Additionally, thefew studies that do essentially use evoked brain potentials, mostly the P300, that necessitatesthe patient’s voluntary and active participation to be elicited. Patients are easily fatigued, andwould consequently be less successful during the main communication task. Furthermore,when the consciousness states are determined using resting state data, only one or two featureswere used.
In this thesis, different sets of EEG features are used to assess the consciousness level ofCLIS patients using resting-state data. This is done as a preliminary step that needed to besucceeded in order to engage to the next step, communication with the patient. In other words,the "conversation" is initiated only if the patient is sufficiently conscious. This variety of EEGfeatures is utilised to increase the probability of correctly estimating the patients’ consciousnessstates. Indeed, each of them captures a particular signal attribute, and combining them wouldallow the collection of different hidden characteristics that could have not been obtained from asingle feature. Furthermore, the proposed method should allow to determine if communicationshall be initiated at a specific time with the patient.
The EEG features used are frequency-based, complexity related and connectivity metrics.Besides, instead of analysing results from individual channels or specific brain regions, theglobal activity of the brain is assessed. The estimated consciousness levels are then obtainedby applying two different soft-clustering analysis methods, namely Fuzzy c-means (FCM) andGaussian Mixture Models (GMM), to the individual features and ensembling their results usingtheir average or their product. The proposed approach is first applied to EEG data recordedfrom patients with unresponsive wakefulness syndrome (UWS) and minimally conscious state(MCS) (patients with disorders of consciousness (DoC)) to evaluate its performance. It issubsequently applied to data from one CLIS patient that is unique in its kind because itcontains a time frame during which the experimenters affirmed that he was conscious. Finally,it is used to estimate the levels of consciousness of nine other CLIS patients. The obtainedresults revealed that the presented approach was able to take into account the variations ofthe different features and deduce a unique output taking into consideration the individualfeatures contributions. Some of them performed better than others, which is not surprising
i

since each person is different. It was also able to draw very accurate estimations of the level ofconsciousness under specific conditions.
The approach presented in this thesis provides an additional tool for diagnosis to the medicalstaff. Furthermore, when implemented online, it would enable to determine the optimal timeto engage in communication with CLIS patients. Moreover, it could possibly be used to predictpatients’ cognitive decline and/or death.
ii

Acknowledgement
Avant tout, je tiens particulièrement à remercier mes parents, mes sœurs et mon oncle Charlespour leurs continuels et intarissables supports et leurs fois en mes capacités. Je n’oublie pasnon plus mes ami.e.s pour leurs encouragements incessants durant l’accomplissement de cettethèse.
I am grateful to Prof. Dr. Martin Bogdan for giving me the opportunity and for all his guid-ance during the accomplishment of this thesis, and for also leading such a friendly workplace.
This thesis would have not been possible without the data of CLIS patients graciouslyprovided by Prof. Dr. Dr. hc. mult. Niels Bierbaumer and Dr. Ujwal Chaudhary from theInstitute for Medical Psychology and Behavioural Neurobiology, University of Tübingen; andthe EEG recordings of patients with disorders of consciousness kindly provided by Dr ManuelSchabus and Malgorzata Wilowska from the Laboratory of Sleep, Cognition and Consciousness& Centre for Cognitive Neuroscience (CCNS), University of Salzburg, Austria.
Last but not least, I thank God for giving me the strength and courage to accomplish thisthesis.
Leipzig, 18 March 2022
iii


Contents
Abstract i
Acknowledgement iii
Acronyms ix
List of figures xiii
List of tables xvii
1 Introduction 11.1 Motivation and problem statement . . . . . . . . . . . . . . . . . . . . . . . . . . . 2
1.2 Goal of the research . . . . . . . . . . . . . . . . . . . . . . . . . . . . . . . . . . . . 3
1.3 Dissertation organisation . . . . . . . . . . . . . . . . . . . . . . . . . . . . . . . . . 4
2 Basics 52.1 What is consciousness? . . . . . . . . . . . . . . . . . . . . . . . . . . . . . . . . . . 5
2.1.1 Disorders of consciousness . . . . . . . . . . . . . . . . . . . . . . . . . . . 6
2.1.1.1 Coma . . . . . . . . . . . . . . . . . . . . . . . . . . . . . . . . . . 7
2.1.1.2 Vegetative state (VS) . . . . . . . . . . . . . . . . . . . . . . . . . . 8
2.1.1.3 Minimally Conscious State (MCS) . . . . . . . . . . . . . . . . . . 8
2.1.2 Covert states of consciousness: Locked-in syndrome . . . . . . . . . . . . 10
2.2 Brain signals . . . . . . . . . . . . . . . . . . . . . . . . . . . . . . . . . . . . . . . . 12
2.2.1 Brain signal acquisition . . . . . . . . . . . . . . . . . . . . . . . . . . . . . 13
2.2.1.1 Types of brain recordings . . . . . . . . . . . . . . . . . . . . . . . 13
2.2.1.2 Modalities of recordings . . . . . . . . . . . . . . . . . . . . . . . 17
2.2.2 EEG signal pre-processing . . . . . . . . . . . . . . . . . . . . . . . . . . . . 21
2.2.3 Brain-computer interfaces . . . . . . . . . . . . . . . . . . . . . . . . . . . . 21
2.3 Machine learning . . . . . . . . . . . . . . . . . . . . . . . . . . . . . . . . . . . . . 23
2.3.1 Clusters analysis . . . . . . . . . . . . . . . . . . . . . . . . . . . . . . . . . 24
2.3.2 Soft-clustering . . . . . . . . . . . . . . . . . . . . . . . . . . . . . . . . . . . 26
2.3.2.1 FCM clustering . . . . . . . . . . . . . . . . . . . . . . . . . . . . . 26
2.3.2.2 Gaussian Mixture Model . . . . . . . . . . . . . . . . . . . . . . . 29
2.4 Summary . . . . . . . . . . . . . . . . . . . . . . . . . . . . . . . . . . . . . . . . . . 30
3 State-of-the-art 313.1 BCI-based communication for CLIS patients . . . . . . . . . . . . . . . . . . . . . 32
v

Contents
3.2 Patients’ consciousness assessment . . . . . . . . . . . . . . . . . . . . . . . . . . . 35
3.2.1 Assessment using brain sensory responses . . . . . . . . . . . . . . . . . . 35
3.2.2 Assessment using resting state data . . . . . . . . . . . . . . . . . . . . . . 37
3.3 Summary . . . . . . . . . . . . . . . . . . . . . . . . . . . . . . . . . . . . . . . . . . 38
4 Modus operandi 414.1 Aims and scope of the work . . . . . . . . . . . . . . . . . . . . . . . . . . . . . . . 41
4.2 Design of the approach . . . . . . . . . . . . . . . . . . . . . . . . . . . . . . . . . . 41
4.3 Thesis contributions and significance of the study . . . . . . . . . . . . . . . . . . 44
5 Data analysis 475.1 Data description . . . . . . . . . . . . . . . . . . . . . . . . . . . . . . . . . . . . . . 47
5.1.1 Disorders of consciousness data . . . . . . . . . . . . . . . . . . . . . . . . 47
5.1.2 CLIS data . . . . . . . . . . . . . . . . . . . . . . . . . . . . . . . . . . . . . 48
5.1.2.1 ECoG data . . . . . . . . . . . . . . . . . . . . . . . . . . . . . . . 49
5.1.2.2 EEG data . . . . . . . . . . . . . . . . . . . . . . . . . . . . . . . . 50
5.2 Methods description . . . . . . . . . . . . . . . . . . . . . . . . . . . . . . . . . . . 53
5.2.1 Spectral analysis . . . . . . . . . . . . . . . . . . . . . . . . . . . . . . . . . 53
5.2.1.1 Relative power . . . . . . . . . . . . . . . . . . . . . . . . . . . . . 54
5.2.1.2 Spectral edge frequency . . . . . . . . . . . . . . . . . . . . . . . 54
5.2.2 Complexity analysis . . . . . . . . . . . . . . . . . . . . . . . . . . . . . . . 55
5.2.2.1 Poincaré plots . . . . . . . . . . . . . . . . . . . . . . . . . . . . . 55
5.2.2.2 Lempel-Ziv complexity . . . . . . . . . . . . . . . . . . . . . . . . 56
5.2.3 Connectivity analysis . . . . . . . . . . . . . . . . . . . . . . . . . . . . . . 57
5.2.3.1 Coherency . . . . . . . . . . . . . . . . . . . . . . . . . . . . . . . 58
5.2.3.2 Weighted Symbolic Mutual Information (wSMI) . . . . . . . . . 59
5.2.4 Consciousness level assessment . . . . . . . . . . . . . . . . . . . . . . . . 61
5.2.5 Statistical analysis . . . . . . . . . . . . . . . . . . . . . . . . . . . . . . . . 62
5.3 Summary . . . . . . . . . . . . . . . . . . . . . . . . . . . . . . . . . . . . . . . . . . 62
6 Results and discussions 656.1 Patients with disorders of consciousness . . . . . . . . . . . . . . . . . . . . . . . 65
6.1.1 Results of individual measures . . . . . . . . . . . . . . . . . . . . . . . . . 66
6.1.1.1 Spectral features . . . . . . . . . . . . . . . . . . . . . . . . . . . . 66
6.1.1.2 Complexity features . . . . . . . . . . . . . . . . . . . . . . . . . . 69
6.1.1.3 Connectivity measures . . . . . . . . . . . . . . . . . . . . . . . . 73
6.1.1.4 Inferences from individual features . . . . . . . . . . . . . . . . . 76
6.1.2 Consciousness level assessment . . . . . . . . . . . . . . . . . . . . . . . . 77
6.1.2.1 Patient L1 . . . . . . . . . . . . . . . . . . . . . . . . . . . . . . . . 77
6.1.2.2 Patient S7 . . . . . . . . . . . . . . . . . . . . . . . . . . . . . . . . 81
6.1.2.3 Overview of the results for the remaining of the DoC patients . 85
6.1.3 Performance of the approaches . . . . . . . . . . . . . . . . . . . . . . . . . 86
6.1.4 Discussion I . . . . . . . . . . . . . . . . . . . . . . . . . . . . . . . . . . . . 88
6.2 CLIS patients . . . . . . . . . . . . . . . . . . . . . . . . . . . . . . . . . . . . . . . 88
6.2.1 ECoG data . . . . . . . . . . . . . . . . . . . . . . . . . . . . . . . . . . . . . 88
vi

Contents
6.2.2 EEG data . . . . . . . . . . . . . . . . . . . . . . . . . . . . . . . . . . . . . . 93
6.2.2.1 Patient P1 . . . . . . . . . . . . . . . . . . . . . . . . . . . . . . . . 94
6.2.2.2 Patient P2 . . . . . . . . . . . . . . . . . . . . . . . . . . . . . . . . 96
6.2.2.3 Patient P3 . . . . . . . . . . . . . . . . . . . . . . . . . . . . . . . . 96
6.2.2.4 Patient P4 . . . . . . . . . . . . . . . . . . . . . . . . . . . . . . . . 98
6.2.2.5 Patient P6 . . . . . . . . . . . . . . . . . . . . . . . . . . . . . . . . 100
6.2.2.6 Patient P10 . . . . . . . . . . . . . . . . . . . . . . . . . . . . . . . 100
6.2.3 Discussion II . . . . . . . . . . . . . . . . . . . . . . . . . . . . . . . . . . . 101
6.3 Summary . . . . . . . . . . . . . . . . . . . . . . . . . . . . . . . . . . . . . . . . . . 102
7 Conclusions 1037.1 Summary . . . . . . . . . . . . . . . . . . . . . . . . . . . . . . . . . . . . . . . . . . 103
7.2 Outlook . . . . . . . . . . . . . . . . . . . . . . . . . . . . . . . . . . . . . . . . . . . 105
References 106
A Appendix: K-means++ algorithm 123
B Appendix: Additional information about DoC patients 125
C Appendix: Additional information about CLIS patient GR 143C.1 Recording channels . . . . . . . . . . . . . . . . . . . . . . . . . . . . . . . . . . . . 143
C.2 Experimental setup . . . . . . . . . . . . . . . . . . . . . . . . . . . . . . . . . . . . 143
D Appendix: Additional information about the CLIS patients 147D.1 Detailed description of the CLIS patients (except GR) . . . . . . . . . . . . . . . . 147
D.2 Estimated consciousness levels for CLIS patients . . . . . . . . . . . . . . . . . . . 150
Bibliographic details 151
Selbständigkeitserklärung 153
vii


Acronyms
ACRM American Congress of Rehabilitation Medicine.
AEP Auditory Evoked Potential.
AI Artificial Intelligence.
ALS Amyotrophic Lateral Sclerosis.
ALSFRS-R ALS Functional Rating Scale–Revised.
ANN Artificial Neural Networks.
BCI Brain-Computer Interfaces.
CCNS Centre for Cognitive Neuroscience.
CLIS Completely Locked-in Syndrome.
CNS Central Nervous System.
CRS-R Coma Recovery Scale - Revised.
CVA Cerebrovascular accident.
DoC Disorders of Consciousness.
ECoG Electrocorticogram.
EEG Electroencephalogram.
EKG Electroccardiogram.
EM Expectation-Maximization algorithm.
eMCS Emergence from Minimally Conscious State.
EMG Electromyogram.
ix

Acronyms
EOG Electrooculogram.
EP Evoked Potential.
ERP Event-Related Potential.
ERR Ellipsoid Radius Ratio.
FCM Fuzzy c-means clustering.
fMRI functional Magnetic Resonance Imaging.
fNRIS functional Near Infra-Red Spectroscopy.
FUS Fused in Sarcoma.
GCS Glasgow Coma Scale.
GMM Gaussian Mixture Model.
iCOH Imaginary part of Coherency.
IFSECN International Federation of Societies for Electroencephalography and Clinical Neuro-physiology.
LDA Latent Discriminant Analysis.
LIS Locked-in Syndrome.
LZC Lempel-Ziv Complexity.
MATLAB MATrix LABoratory.
MCS Minimally Conscious State.
MEG Magnetoencephalography.
MI Motor Imagery.
MMN Mismatched Negativity.
MND Motor Neuron Disease.
Nessi Neural signal surfing interface.
NIRS Near Infra-Red Spectroscopy.
x

Acronyms
PCI Perturbational Complexity Index.
PET Positron Emission Tomography.
PSD Power Spectral Density.
PSG Polysomnography.
QoL Quality of Life.
REM Rapid Eye Movement.
RG Riemannian geometry.
RSVP Rapid Serial Visual Presentation.
SCP Slow Cortical Potentials.
SD Standard Deviation.
sdn Subject’s Derived Name.
SEF Spectral Edge Frequency.
SMA Supplementary Motor Area.
SMR Sensorimotor rhythms.
SOF Subject’s Own Face.
SON Subject’s Own Name.
SPECT Single Photon Emission Computed Tomography.
SSPE Subacute Sclerosing Panencephalitis.
SSVEP Steady-State Visual Evoked Potentials.
SVM Support Vector Machines.
SWS Slow Wave Sleep.
TBI Traumatic Brain Injury.
TMS Transcranial Magnetic Stimulation.
TTD Thought Translation Device.
xi

Acronyms
UNP Utrecht NeuroProsthesis.
UWS Unresponsive Wakefulness Syndrome.
VEP Visual Evoked Potential.
VS Vegetative State.
WHO World Health Organisation.
wSMI weighted Symbolic Mutual Information.
xii
List of Figures
2.1 Brain anatomy of consciousness . . . . . . . . . . . . . . . . . . . . . . . . . . . . 6
2.2 Components of consciousness . . . . . . . . . . . . . . . . . . . . . . . . . . . . . . 7
2.3 Aftermath of coma . . . . . . . . . . . . . . . . . . . . . . . . . . . . . . . . . . . . 10
2.4 Causes of paralysis in ALS and stroke . . . . . . . . . . . . . . . . . . . . . . . . . 12
2.5 Human brain lobes . . . . . . . . . . . . . . . . . . . . . . . . . . . . . . . . . . . . 14
2.6 Spatial and temporal resolutions of different brain imaging techniques . . . . . . 15
2.7 Most common brain recording techniques . . . . . . . . . . . . . . . . . . . . . . . 16
2.8 EEG signal generation . . . . . . . . . . . . . . . . . . . . . . . . . . . . . . . . . . 17
2.9 10-20 system for EEG signal recordings . . . . . . . . . . . . . . . . . . . . . . . . 18
2.10 Electrocorticography . . . . . . . . . . . . . . . . . . . . . . . . . . . . . . . . . . . 19
2.11 Normal EEG brain waves . . . . . . . . . . . . . . . . . . . . . . . . . . . . . . . . 20
2.12 EEG-based Brain-Computer Interface . . . . . . . . . . . . . . . . . . . . . . . . . 22
2.13 Types of machine learning . . . . . . . . . . . . . . . . . . . . . . . . . . . . . . . . 23
2.14 Dendrogram of Fisher’s Iris dataset . . . . . . . . . . . . . . . . . . . . . . . . . . 25
2.15 Partitive clustering of Fisher’s Iris data . . . . . . . . . . . . . . . . . . . . . . . . 26
2.16 Hard and Soft-clustering membership functions . . . . . . . . . . . . . . . . . . . 27
2.17 Clustering of Fisher’s Iris data using Fuzzy c-means . . . . . . . . . . . . . . . . 28
2.18 Clustering of Fisher’s Iris data using Gaussian Mixtures Model . . . . . . . . . . 30
3.1 LIS patient’s awareness discovery rate . . . . . . . . . . . . . . . . . . . . . . . . . 31
4.1 Modus operandi: Signal processing and analysis pipeline . . . . . . . . . . . . . 44
5.1 Recording channels for DoC patients . . . . . . . . . . . . . . . . . . . . . . . . . . 49
5.2 Recording channels for CLIS patient GR . . . . . . . . . . . . . . . . . . . . . . . . 50
5.3 Recording channels for the other CLIS patients . . . . . . . . . . . . . . . . . . . . 51
5.4 Experimental setup of BCI-based communication with CLIS patients . . . . . . . 53
5.5 Poincaré plots . . . . . . . . . . . . . . . . . . . . . . . . . . . . . . . . . . . . . . . 56
5.6 Lempel-Ziv complexity: signal binarisation . . . . . . . . . . . . . . . . . . . . . . 57
5.7 weighted Symbolic Mutual Information . . . . . . . . . . . . . . . . . . . . . . . . 59
6.1 Relative power for UWS patient L1 . . . . . . . . . . . . . . . . . . . . . . . . . . . 66
6.2 Spectral Edge Frequency at 95% for UWS patient L1 . . . . . . . . . . . . . . . . 67
6.3 Relative power for MCS patient S7 . . . . . . . . . . . . . . . . . . . . . . . . . . . 68
6.4 Spectral Edge Frequency at 95% for MCS patient S7 . . . . . . . . . . . . . . . . . 69
6.5 Poincaré ERR for UWS patient L1 . . . . . . . . . . . . . . . . . . . . . . . . . . . 70
6.6 Lempel-Ziv complexity for UWS patient L1 . . . . . . . . . . . . . . . . . . . . . . 71
xiii

List of Figures
6.7 Poincaré ERR for MCS patient S7 . . . . . . . . . . . . . . . . . . . . . . . . . . . . 72
6.8 Lempel-Ziv complexity for MCS patient S7 . . . . . . . . . . . . . . . . . . . . . . 72
6.9 Imaginary theta coherence for UWS patient L1 . . . . . . . . . . . . . . . . . . . . 73
6.10 weighted Symbolic Information for UWS patient L1 . . . . . . . . . . . . . . . . . 74
6.11 Imaginary theta coherence for MCS patient S7 . . . . . . . . . . . . . . . . . . . . 75
6.12 weighted Symbolic Mutual Information for MCS patient S7 . . . . . . . . . . . . 75
6.13 FCM clusters plots for UWS patient L1 . . . . . . . . . . . . . . . . . . . . . . . . 78
6.14 GMM clusters plots for UWS patient L1 . . . . . . . . . . . . . . . . . . . . . . . . 79
6.15 Estimated consciousness level for UWS patient L1 . . . . . . . . . . . . . . . . . . 80
6.16 FCM clusters plots for MCS patient S7 . . . . . . . . . . . . . . . . . . . . . . . . . 82
6.17 GMM clusters plots for UWS patient S7 . . . . . . . . . . . . . . . . . . . . . . . . 83
6.18 Estimated consciousness level for MCS patient S7 . . . . . . . . . . . . . . . . . . 84
6.19 Performance of the ensemble clustering methods . . . . . . . . . . . . . . . . . . 87
6.20 Estimated consciousness level for CLIS patient GR . . . . . . . . . . . . . . . . . 89
6.21 FCM clusters for CLIS patient GR . . . . . . . . . . . . . . . . . . . . . . . . . . . 91
6.22 Estimated consciousness level for patient GR using the pre-defined cluster centresobtained in Section 6.1.3 (average ensemble). The estimated level of consciousnessis constantly high. The experiment was performed between 14:50 and 17:00 (redvertical lines). The red area from 15:34 to 16:14 represent the time during whichthe experimenter reported that the patient was correctly answering the questionshe was asked. . . . . . . . . . . . . . . . . . . . . . . . . . . . . . . . . . . . . . . . 92
6.23 Average and standard deviation values of the estimated consciousness level forall CLIS patients . . . . . . . . . . . . . . . . . . . . . . . . . . . . . . . . . . . . . . 93
6.24 Sessions averages of the estimated consciousness level for CLIS patient P1 . . . 94
6.25 Estimated consciousness level for CLIS patient P1 for two days . . . . . . . . . . 95
6.26 Sessions averages of the estimated consciousness level for CLIS patient P2 . . . 96
6.27 Sessions averages of the estimated consciousness level for CLIS patient P3 . . . 97
6.28 Estimated consciousness level for CLIS patient P3 for two days . . . . . . . . . . 98
6.29 Sessions averages of the estimated consciousness level for CLIS patient P4 . . . 99
6.30 Sessions averages of the estimated consciousness level for CLIS patient P6 . . . 100
6.31 Sessions averages of the estimated consciousness level for CLIS patient P10 . . . 101
B.1 Estimated consciousness level for UWS patient L3 . . . . . . . . . . . . . . . . . . 126
B.2 Estimated consciousness level for UWS patient L13 . . . . . . . . . . . . . . . . . 127
B.3 Estimated consciousness level for UWS patient S12 . . . . . . . . . . . . . . . . . 128
B.4 Estimated consciousness level for UWS patient S13 . . . . . . . . . . . . . . . . . 129
B.5 Estimated consciousness level for MCS patient S14. . . . . . . . . . . . . . . . . . 130
B.6 Estimated consciousness level for UWS patient S16 . . . . . . . . . . . . . . . . . 131
B.7 Estimated consciousness level for UWS patient S17 . . . . . . . . . . . . . . . . . 132
B.8 Estimated consciousness level for MCS patient L4 . . . . . . . . . . . . . . . . . . 133
B.9 Estimated consciousness level for MCS patient L7 . . . . . . . . . . . . . . . . . . 134
B.10 Estimated consciousness level for MCS patient L8 . . . . . . . . . . . . . . . . . . 135
B.11 Estimated consciousness level for MCS patient L9 . . . . . . . . . . . . . . . . . . 136
B.12 Estimated consciousness level for MCS patient L16 . . . . . . . . . . . . . . . . . 137
B.13 Estimated consciousness level for MCS patient S2 . . . . . . . . . . . . . . . . . . 138
xiv

List of Figures
B.14 Estimated consciousness level for MCS patient S5 . . . . . . . . . . . . . . . . . . 139
B.15 Estimated consciousness level for MCS patient S6 . . . . . . . . . . . . . . . . . . 140
D.1 Sessions averages of the estimated consciousness level for CLIS patient P5 . . . 150
D.2 Sessions averages of the estimated consciousness level for CLIS patient P7 . . . 150
D.3 Sessions averages of the estimated consciousness level for CLIS patient P9 . . . 150
xv

List of Tables
2.1 Characteristics in patients with disorders of consciousness and locked-in syndrome 8
2.2 JFK Coma Recovery Scale . . . . . . . . . . . . . . . . . . . . . . . . . . . . . . . . 9
2.3 Books written by LIS patients . . . . . . . . . . . . . . . . . . . . . . . . . . . . . . 13
4.1 List of features extracted from the patients’ EEG/ECoG signals . . . . . . . . . . 42
5.1 Demographic information of DoC patients . . . . . . . . . . . . . . . . . . . . . . 48
5.2 Information about the CLIS patients . . . . . . . . . . . . . . . . . . . . . . . . . . 52
6.1 Clusters centroids for UWS patient L1 . . . . . . . . . . . . . . . . . . . . . . . . . 77
6.2 Spearman correlation coefficients between features and estimated levels of con-sciousness for UWS patient L1 . . . . . . . . . . . . . . . . . . . . . . . . . . . . . 81
6.3 Clusters centroids for MCS patient S7 . . . . . . . . . . . . . . . . . . . . . . . . . 82
6.4 Spearman correlation coefficients between features and estimated levels of con-sciousness for MCS patient S7 . . . . . . . . . . . . . . . . . . . . . . . . . . . . . . 85
6.5 Average estimated consciousness level for patient GR during different time frames 90
6.6 Clusters centroids for CLIS patient GR . . . . . . . . . . . . . . . . . . . . . . . . . 90
6.7 Average estimated consciousness level for patient GR during different timeframes using pre-defined clustering parameters . . . . . . . . . . . . . . . . . . . 92
6.8 Sessions averages of the estimated consciousness level for CLIS patient P3 (twodays) . . . . . . . . . . . . . . . . . . . . . . . . . . . . . . . . . . . . . . . . . . . . 99
B.1 Data and eyes scoring length for the DoC patients . . . . . . . . . . . . . . . . . . 125
B.2 Statistical analysis results: MCS vs UWS . . . . . . . . . . . . . . . . . . . . . . . 125
B.3 Clusters centroids and correlation coefficients for UWS patient L3 . . . . . . . . 126
B.4 Clusters centroids and correlation coefficients for UWS patient L13 . . . . . . . . 127
B.5 Clusters centroids and correlation coefficients for UWS patient S12 . . . . . . . . 128
B.6 Clusters centroids and correlation coefficients for UWS patient S13 . . . . . . . . 129
B.7 Clusters centroids and correlation coefficients for UWS patient S14 . . . . . . . . 130
B.8 Clusters centroids and correlation coefficients for UWS patient S16 . . . . . . . . 131
B.9 Clusters centroids and correlation coefficients for UWS patient S17 . . . . . . . . 132
B.10 Clusters centroids and correlation coefficients for MCS patient L4 . . . . . . . . . 133
B.11 Clusters centroids and correlation coefficients for MCS patient L7 . . . . . . . . . 134
B.12 Clusters centroids and correlation coefficients for MCS patient L8 . . . . . . . . . 135
B.13 Clusters centroids and correlation coefficients for MCS patient L9 . . . . . . . . . 136
B.14 Clusters centroids and correlation coefficients for MCS patient L16 . . . . . . . . 137
B.15 Clusters centroids and correlation coefficients for MCS patient S2 . . . . . . . . . 138
xvii

List of Tables
B.16 Clusters centroids and correlation coefficients for MCS patient S5 . . . . . . . . . 139
B.17 Clusters centroids and correlation coefficients for MCS patient S6 . . . . . . . . . 140
B.18 Night vs day statistical analysis results for the DoC patients . . . . . . . . . . . . 141
B.19 Performance of the cluster analysis for different threshold values . . . . . . . . . 142
C.1 ECoG channels list and labels for CLIS patient GR . . . . . . . . . . . . . . . . . . 143
C.2 Experimental setup for patient GR . . . . . . . . . . . . . . . . . . . . . . . . . . . 144
xviii

1 Introduction
The beginning is the most important partof the work.
Plato
We wake up every morning and go to sleep every night. During the time we are up, weexperience things: we can see, hear, smell, taste or sense things that are around us, we can feelhungry or thirsty. We can also be actively engaging in a task such as reading a book, or passivelylistening to some music. Consciousness comprises all these experiences and also the awarenessthat we are doing something (reading the book, for example). A relatively simple definitionof what consciousness means is given by Posner and Plum in [Pos+07]: “Consciousness isthe state of full awareness of the self and one’s relationship to the environment”. In normalcircumstances, it begins in the morning when we wake up and lasts until we fall asleep again,in which case we become unconscious [Koc04].
According to [Gos+11], consciousness is characterised by two components: arousal, which isthe level of consciousness, and awareness representing the content of the conscious experience.It originates from the brain and is usually demonstrated by motor activity [Koc04; GIM18].The ancient Greeks already recognised that an intact brain is indispensable for a normal con-sciousness [Pos+07]. Therefore, a traumatic brain injury1 (TBI) generates altered states ofconsciousness on one hand, but on the other hand it can also induce covert conscious statesin which no purposeful movement from a subject can be observed although consciousness ispresent [LCERDM02; GIM18; Lau+05]. Typically, arousal and awareness are positively corre-lated with one another. When this relationship is disrupted, an altered state of consciousnessalso known as disorder of consciousness (DoC) occurs [Gos+11]. There are different types ofdisorders of consciousness: coma, Unresponsive Wakefulness Syndrome (UWS), and MinimallyConscious State (MCS). No arousal nor awareness indicate that a person is in a coma [Bau05].It cannot then be awakened and does not respond even to intense stimulation [Pos+07]. UWSare described by non-existent signs of awareness in response to sensory stimuli, but the pres-ence of signs of arousal recovery demonstrated by periods of eyes opening [GM08; Pos+07].MCS patients on the other hand have preserved arousal level, but alternating signs of aware-ness [Gos+11; Pos+07]. The characteristics of the disorders of consciousness are described inmore details in Section 2.1.1.
A TBI can also lead to a state called Locked-In Syndrome (LIS). Nevertheless, LIS can alsoarise as a transition from Amyotrophic Lateral Sclerosis (ALS). This condition, also known
1TBI is generally caused by a violent blow to the head or body, causing damages to the brain.
1

1 Introduction
as Lou Gehrig’s disease, is a neurodegenerative disease that progressively causes the loss ofmotor neurons that handle voluntary muscle movements. It is the most common motor neurondisease [BCP16]. LIS patients are fully conscious, with unaltered cognitive functions, but areunable to produce speech or perform any muscle movements [KN05; Pos+07]. Patients inthis state are generally able to move their eyes and are, thus, able to communicate using eyemovements and blinking [Gos+09; Bau05; Gos+11]. This limited communication mechanismbecomes impossible when patients enter a total or complete locked-in state (CLIS) and losecontrol of voluntary muscle movements altogether. It is nonetheless thought that cognitivefunctions and consciousness are still maintained during this state that develops some monthsor years after LIS [Gos+09; Roh+17]. This covert state of consciousness is further discussed inSection 2.1.2.
1.1 Motivation and problem statement
Although the LIS is not a disorder of consciousness, it is frequently misdiagnosed as one. Onesuch case was a patient who was considered in an UWS for 20 years [Van+18]. A comple-mentary assessment of the patient’s state was requested by the family after they were underthe impression that he was conscious. This was done by evaluating the patient’s behaviouralresponses using neuroimaging techniques. After a series of tests, it was established that thepatient was not in UWS anymore, and has emerged to MCS instead. Furthermore, the patientwas able to communicate by giving yes or no answers to questions asked to him. Consequently,his diagnosis was revised to incomplete LIS. Another case involved a patient with a braintumour that lost consciousness in 1991, and spent the following 14 years without any kind ofrehabilitation because he was thought to be at a terminal stage [LMT10]. The patient’s statestarted improving after introducing exercises in 2005, so that in 2007 he was quadriplegic butconscious.
The difficulty to establish a diagnosis for such patients is probably due to the apparentsimilarity of the condition with VS, which exhibit motor immobility and eyes opening, butwithout signs of awareness [Sch+09]. Such diagnosis error denies the patients appropriatemedical care and a chance at rehabilitation and a better quality of life [Bru+11]. It can also havedreadful consequences especially regarding end-of-life decisions. It is without a doubt awfulhearing others deciding their fate but not being able to agree nor object. In any case, this typeof conversation should include the patients, not be about them [Pos+07], especially since themajority of LIS patients have no desire to end their life [KN05].
As communication is an important part of being human, it is particularly crucial for thesepatients. Several studies revealed that the ability to communicate with their relatives increasesCLIS patients’ quality of life [Bir+00; K+01]. Since they are unfortunately unable to overtlycommunicate their states of consciousness [G+21], and that a brain-computer interface (BCIs)can provide a direct pathway between the brain and an external device [SM10], this latter hasbeen employed to attempt to establish communication with such patients. Electroencephalog-raphy (EEG)- or electrocorticography (ECoG)-based BCIs in particular have been successfully
2

1.2 Goal of the research
used by LIS patients to communicate [K+01; Bir+99; Van+16]. Despite initial doubts, it has beenlater demonstrated that it was also possible for CLIS patients to communicate using their brainsignals, in particular their EEGs [KB08; Gug+17; Han+19]. Likewise, it has also been establishedthat being able to communicate with their relatives improved LIS patients’ mood, reducing anydesire to end their life [Bir+00; K+01; KN05; Rou+15].
For such communication to be successful, it is important to determine the appropriatetime to initiate it. Otherwise, all attempts would fail. This may be the case for patient GRdescribed in Section 5.1.2 for instance, for which there was only one successful communicationout of 170 attempts. However, most studies do not consider this step and directly begin theexperiment without determining if the patient is in a state to do so. It is after all difficultto determine the patients’ state, if they are conscious or not at any given time consideringtheir condition. Moreover, there are no existing ground-truth distinguishing these states at themoment. Consequently, it is not possible to determine with absolute certainty the "true" level ofconsciousness as CLIS patients are unable to express their will or answer in any manner [K20].
1.2 Goal of the research
One of the factors leading to misdiagnosis of LIS patients is the use of behavioural tests suchas the Coma Recovery Scale - Revised (CRS-R) or the Glasgow Coma Scale (GCS) [Sat+15;Pos+07]. CRS-R in particular consists of auditory, visual, motor, oromotor and verbal functions,as well as arousal. Basically, these methods assess the extent of the brain injury by ratingeach function. The higher the score, the lesser the extent of the injury. In the case of GCSfor example, a total score of 13 or higher is considered a mild brain injury, a value between 9
and 12 is considered a moderate brain injury, while a value of 8 or less is regarded as a severebrain injury [Pos+07]. In the case of CRS-R, the scores range is from 0 to 23 [Sat+15]. Thistype of evaluation is not sufficient since it only accounts for the patients’ behavioural response.Therefore, a direct recording of the brain activity without the intervention of behaviouralresponses makes more sense since it does not rely on external motor responses [Van+18]).In addition, the use of neuroimaging techniques has the potential to show hidden cognitivestates. BCIs, in particular, can provide an alternate way to detect consciousness in paralysedpatients by circumventing the motor pathway. Furthermore, misdiagnosis heavily impairspatients’ treatment by giving them inadequate medicine. Also, when they are believed to beunconscious, no attempt at communicating with them will ever be done, which will deterioratetheir condition faster [Sec+21].
The goal of this thesis is not to differentiate LIS/CLIS patients from those with DoC asit is the case in most of the existing literature. The aim is rather to assess if the patient isconscious or not. More specifically, a consciousness level assessment method is proposed asa step prior to any communication attempt with the patients. This is because the hypothesisin this work is that communication with LIS or CLIS patients fail because the experiment wascarried out at times when they were not fit to do it (in a sleep state, for example) or simplydid not want to. On that account, the patient’s consciousness level is first determined and
3

1 Introduction
communication is only established once indications that he/she is conscious enough to do soare observed. Each subject being different, distinctive features comprising spectral, complexityand connectivity characteristics are extracted from the EEG signals and assessed in order todo so. A soft-clustering analysis is thus employed using the computed features as input toproduce a value between 0 (unconscious) and 1 (conscious) characterising the patient’s level ofconsciousness. An overview of how the proposed approach operates is given in Chapter 4. Theset of features used in this context are reported in Section 5.2, and the data analysis as well asthe details of the consciousness level assessment are developed in Section 5.2.4.
1.3 Dissertation organisation
The present work is organised in 7 chapters. After establishing the topic and motivating thework in this chapter, some basics and foundations regarding consciousness, brain signals andmachine learning as well as brain-computer interfaces are introduced in Chapter 2. Chapter 3
deals with the current state-of-the-art of consciousness assessments and attempts made toestablish communication with LIS and CLIS patients using BCIs. It is subsequently followed byChapter 4, which outlines the adopted modus operandi after introducing the problem and the aimof the thesis. The presented method is first applied to data from patients with DoC to validateit. Afterwards, it is applied to data from CLIS patients to evaluate their levels of consciousness.The different groups of patients are recounted in Chapter 5. The results and discussion partare presented in Chapter 6 afterwards before concluding this thesis with Chapter 7 by giving asummary of the work and presenting potential future works.
4

2 Basics
Je pense, donc je suis.
René Descartes
This chapter presents basic information associated to consciousness and the brain. It startsby introducing the concept of consciousness and how it relates to the brain. This is followedby some foundations on brain signals sources, acquisition, processing and applications. Itconcludes with an overview of pattern recognition and machine learning methods that arecommonly used with biomedical signals. These notions are important to understand thefundamental parts of this thesis.
2.1 What is consciousness?
It is difficult to define the term consciousness. Along the years, a lot of philosophers, neurol-ogists, and neuroscientists have tried to define it, but so far no concise definition have beenagreed upon. The term comes from the Latin conscientia, which is composed of cum, meaning"with" or "together" and scire that means "to know" [Koc04]. It is related to visual and sensoryperception and is also closely related to attention i.e. our ability to concentrate on one thingand ignore other things [BCP16]. In [Koc04], the following definition of the term is given:“Consciousness consists of those states of sentience, or feeling, or awareness, which begin in themorning when we are awake from a dreamless sleep and continue throughout the day until wefall into a coma or die or fall asleep again or otherwise become unconscious.” In Neural modelsof consciousness, John G. Taylor asserts that: “Consciousness is synonymous with awareness orconscious awareness [...]. The content of consciousness encompass all that we are conscious of,aware of, or experience.” [Tay02]
However, the psychologist Stuart Sutherland explains the term as “The having of perceptions,thoughts, and feelings; awareness. The term is impossible to define except in terms that areunintelligible without a grasp of what consciousness means. Many fall into the trap of equatingconsciousness with self-consciousness2 - to be conscious it is only necessary to be aware ofthe external world. Consciousness is a fascinating but elusive phenomenon: it is impossible tospecify what it is, what it does, or why it evolved. Nothing worth reading has been written onit.” [GIM18].
2Self-consciousness is the ability to think about ourselves as individuals [Gaz99; Gos+11].
5

2 Basics
Figure 2.1: Brain anatomy of consciousness. The cerebral cortex, thalamus, brain stem, and hypothalamusplay important roles in consciousness generation. From [GIM18]. Copyright © 2014, 2009, 2002, 1998 byMichael S. Gazzaniga, Richard B. Ivry, and George R. Mangun. Used with permission of W.W. Norton& Company, Inc.
According to [Gos+11], two components characterises consciousness: awareness and arousal.Awareness represents conscious perception or the content of consciousness. It encompassescognition, past and present experiences, and intentions. Clinically, it is assessed by commandfollowing such as "close/open your eyes". It is supported by the cerebral cortex. Arousal alsoknown as level of consciousness or wakefulness, on the other hand, is reinforced by the brainstemand the thalamus. More precisely, it is the degree to which a person is conscious [Ton+16]. Itis synonymous to vigilance or alertness, and is evaluated by the presence of eye opening. Forany substantial response to occur, a basic wakefulness is essential. Consciousness is subjectedto the interaction between the activity of the cerebral cortex, the brainstem and the thalamus(cf. Fig. 2.1). It is composed by the correlation between awareness and arousal, in other words,by the relationship between the cerebral cortex and the brainstem and thalamus. These twocomponents as well as their levels for each state of consciousness are illustrated in Fig. 2.2.
2.1.1 Disorders of consciousness
As stated in Section 2.1, consciousness depends on the interaction between the activity of thethalamus, the brainstem and the cerebral cortex. Damages in one of these systems will resultin an impairment of consciousness. In other words, a disruption of the relationship between
6

2.1 What is consciousness?
Figure 2.2: Major components of consciousness: Arousal: level of consciousness or wakefulness andAwareness: content of consciousness. The level and content of consciousness are positively correlatedin normal states and in coma. Consciousness occurs when both arousal and awareness levels are high,and vice versa. Adapted from [Gos+11].
arousal and awareness will lead to a condition called disorder of consciousness [Gos+11].Table 2.1 summarises the characteristics behaviours of patients in different conditions.
After a brain injury, behavioural assessments are administered to the patients to determinetheir consciousness levels and establish a diagnosis. The CRS-R is usually the most usedmeasure to do so. It is a standardised evaluation used to establish prognosis in addition tothe diagnosis. Moreover, this assessment also allows to monitor patients’ recovery rate and todetermine adequate treatment [Sat+15]. Table 2.2 shows the different elements of the assessment.The numbers on the left are scores attributed to each item, and general score vary from 0 to 23.High scores reflect cognitive behaviour, while low scores represent reflexive activity [Sat+15].
2.1.1.1 Coma
In [Bau05], a coma state is described as an "unarousable unconsciousness". It is definedby the absence of spontaneous eyes opening as well as reflexive or voluntary muscle move-ments [Les+15]. This state can last from two to four weeks [Les+15; Pos+07]. It can be provokedby an acute brain injury and is characterised by an absence of arousal and awareness [Gos+11](see Fig. 2.2). This unarousability distinguished it from sleep, which is a physiological loss ofconsciousness. Coma may result in different outcomes, namely, LIS described in Section 2.1.2,VS, chronic coma in some rare cases, and eventually in brain death3 as illustrated in Fig. 2.3.
3irreversible loss of all function of the entire brain [Pos+07].
7

2 Basics
Table 2.1: Consciousness and motor behaviour characteristics in patients with disorders of consciousnessand locked-in syndrome [MLO10].
Condition Sleep-wakecycles
Awareness Motor behaviour characteristics
Coma no no No purposeful behaviourUWSa/ VSb yes no No purposeful behaviourMCSc yes Partial, fluctuating Inconsistent but reproducible purposeful
behaviourLISd yes yes Yes, limited to eye movements (depending
on lesion)
a Unresponsive Wakefulness Syndromeb Vegetative Statec Minimally Conscious Stated Locked-In Syndrome
2.1.1.2 Vegetative state (VS)
Patients in the VS,4 currently known as UWS patients, present no sign of awareness in responseto visual, auditory, or tactile stimuli, indicating an absence of signs of cortical function [GM08].Patients develop alternating periods of sleep and wakefulness that manifest by periodic eyeopening, which suggest a recovery of arousal [Bau05; Gos+11], and show no purposeful motorbehaviour (cf. Table 2.1 and Fig. 2.2). A reduction of head, limbs and eyes movements are alsoobserved [GM08]. The condition may develop suddenly, for example after a brain injury, orgradually as a result of a neurodegenerative disorder, such as Alzheimer’s disease [MLO10].A patient is diagnosed as in a VS when the CRS-R is between 0 and 9; more precisely, whenthe scores for the individual items in Table 2.2 are: Auditory ≤ 2, Visual ≤ 1, Motor ≤ 2,Oromotor/Verbal ≤ 2, Communication = 0, and Arousal ≤ 2 [Sat+15]. After some time, VScan turn into MCS or permanent VS, and eventually to death (cf. Fig. 2.3). VS is consideredpermanent or persistent when it lasts longer than a month [Pos+07].
2.1.1.3 Minimally Conscious State (MCS)
The MCS is portrayed by a preserved arousal level and fluctuating signs of awareness [Gos+11]as illustrated in Fig. 2.2. Indeed, sleep-wake cycles could be observed as well as inconsistent butreproducible motor behaviours. Patients with MCS can follow simple command and produceintelligible speech (high-level behavioural response), and some are able to show behavioursthat are not attributable to reflexive activity like visual pursuit or appropriate smiling or cryingto emotional stimuli (low-level behavioural response) [GM08]. Those who are displayinghigh-level responses are categorised as MCS+, while those who exhibit low-level behaviouralresponses are classified as MCS- [Bru+11]. A patient is usually diagnosed as in a MCS when the
4also called coma vigil or apallic state [Pos+07]
8

2.1 What is consciousness?
Table 2.2: Coma Recovery Scale-Revised. Adapted from http://www.tbims.org/combi/crs/CRS_Syllabus.pdf
4 Consistent movement to commanda
3 Reproducible movement to commanda
2 Localisation to sound1 Auditory startle0 None
5 Object recognitiona
4 Object localisation: Reachingb
3 Visual pursuitb
2 Fixationb
1 Visual startle0 None
6 Function object usec
5 Automatic motor responseb
4 Object manipulationb
3 Localisation to noxious stimulationb
2 Flexion withdrawal1 Abnormal posturing0 None
3 Intelligible verbalisationa
2 Vocalisation / Oral movement1 Oral reflexive movement0 None
2 Functional: Accuratec
1 Non-functional: Intentionala
0 None
3 Attention2 Eye opening without stimulation1 Eye opening with stimulation0 Unarousable
a Denotes Minimally Conscious State Plus (MCS+)b Denotes Minimally Conscious State Minus (MCS-)c Denotes emergence from Minimally Conscious State (eMCS)
Auditory function scale
Visual function scale
Oromotor/Verbal function scale
Motor function scale
Communication scale
Arousal scale
9

2 Basics
Figure 2.3: Different states of consciousness that may arise after a coma. If the state of the patientimproves, they transition to a vegetative state, and in some rare cases in locked-in syndrome after ashort period [Les+15]. The worse cases result in chronic coma and eventually in brain death. Vegetativestate in turn evolves to a minimally conscious state (best case scenario) or into a permanent vegetativestate that can result in death (worst case scenario). Normally, the minimally conscious state ameliorateand in time, the patient becomes progressively independent. Figure adapted from [MLO10].
CRS-R is from 9 to 21. The detailed score for each item is: Auditory = 3 to 4, Visual = 2 to 5,Motor = 3 to 5, Oromotor/Verbal = 3, Communication = 1. Nevertheless, when the scoresare between 7 to 9 included, the patient can be either VS or MCS [Sat+15]. Moreover, a motorscore equal to 6 and a communication score equal to 2 denote an emergence from MCS (eMCS)(cf. Table 2.2). eMCS develops when the patient is able to communicate accurately and/orpractically use objects and is therefore not considered a DoC [Gos+14a]. MCS can develop froma vegetative state, and may also transition to a confusional state,5 which in turn can eventuallylead to an increasing independence (see Fig. 2.3).
2.1.2 Covert states of consciousness: Locked-in syndrome
A level of wakefulness is fundamental for consciousness, which can also manifest by ac-tion [GIM18]. This latter is however not necessary for consciousness [Koc04]. One suchstate is the LIS, which is described below.
Locked-in syndrome (LIS) is a neurodegenerative disorder, in particular a motor neurondisease (MND) that causes a patient to be completely paralysed, thus leaving her/him unableto perform any voluntary movement except for the muscles that control vertical eye movements
5condition wherein consciousness is maintained but with no intellectual understandability and orientation to time,area, and sometimes the self.
10

2.1 What is consciousness?
[Pos+07; Les+15]. According to the American Congress of Rehabilitation Medicine (ACRM),LIS is characterised by the presence of sustained eye opening, aphonia6 or severe hypophonia,7
quadriplegia8 or quadriparesis,9 preserved cognitive functioning, and a primary and elementarycode of communication using vertical eye movements or blinking [Sch+09]. LIS patients alsohave normal sleep-wake cycles [GIM18], but as their condition evolves, increasing signs ofinsomnia are observed [Soe+13; Pos+07]. The condition is very rare and affects approximately1 out of 20, 000 persons. There is no cure nor standard course of treatment at the moment, butmedication like riluzole10 can slow the disease down by a few months [BCP16; PP04].
On one hand, the LIS (also known as de-efferented state or pseudo-coma) may arise after atraumatic brain injury (TBI) as illustrated in Fig. 2.3, a disease of the circulatory system, oreven from medication overdose. Brain lesions can be located in the ventral part of the pons inthe brainstem or in rare cases, in the midbrain and bilateral internal capsules [GIM18; PP04;Lau+05]. TBI constitutes the most common cause of the condition [K20]. On the other hand, itmay also result as an evolution of neurological diseases such as ALS or Guillain-Barré syndrome.ALS, which is the most frequent neurodegenerative cause of LIS [K+01], was first describedin 1869 by the French neurologist Jean-Martin Charcot. The initial signs of the condition aremuscle weakness and atrophy, probably resulting from a motor neuron disease among othercauses, most of them unknown. Excitotoxicity11 constitutes another cause of ALS. The patientloses all voluntary movement such as walking, speaking, swallowing and breathing over thecourse of one to five years. This will eventually lead to death due to failure of the respiratorymuscles [Mur+11]. Fig. 2.4 illustrates the different causes of paralysis in ALS and stroke.
Depending on the extent of motor impairment, the state can be separated into differentcategories: classical LIS consists of total immobility except for vertical eye movements or blinking;incomplete LIS during which some remnants of voluntary motion still remains; and total LISduring which no voluntary muscle movement are possible [Lau+05]. Total LIS develop after atransition from ALS-LIS, but it can also arise following a coma or disorders of consciousnesssuch as VS in which case, the inability to move is due to extensive brain damage [KB08]. Astudy of this transition in one CLIS patient showed that eye movements were the very lastmuscle group that becomes uncontrolled. It is preceded by facial muscle activity and externalanal sphincter [Mur+11].
Locked-in syndrome is not a disorder of consciousness but is more than often diagnosedas one [Lau+05; BPL08]. It is characterised by high levels of both arousal and awareness (seeFig. 2.2). Therefore, the patient presents no alteration of consciousness and can think and reason.Communication is generally possible via blinking [Gos+11; Bau05; Gos+09]. One inspiring storyof a patient in the locked-in state after a severe stroke is that of Jean-Dominique Bauby, editor
6inability to produce voiced sound7soft speech8also known as tetraplegia: partial or total loss of use of all the limbs and torso due to illness9temporary or permanent weakness in all four limbs
10an oral medication that is presumed to lessen damages to motor neurons by reducing levels of glutamate, whichcarries messages between nerve cells and motor neurons [NIN13].
11deterioration or death of nerve cells due to an unhealthy increase of the levels of some neurotransmitters, resultingin too much stimulation for the receptors.
11

2 Basics
Figure 2.4: Causes of paralysis in ALS and stroke. ALS can be caused by either the degeneration ofneurons in the motor cortex, or the degeneration of the first and second motoneurons in the spinal cord.Stroke, on the other hand, is caused by an haemorrhage in the ventral parts of the pons. From [K+01].Copyright © 2001 by American Psychological Association. Reproduced with permission of the copyrightowner.
of ELLE magazine,12 who wrote a book titled "Le scaphandre et le papillon" in 1997 using only eyemovements [Koc04]. Table 2.3 showcases some books written by other LIS patients.
2.2 Brain signals
Consciousness is subjected to the interaction between the activity of several brain areas [Gos+11;Koc04]. Consequently, using brain signals can provide an objective assessment of a subject’sconsciousness level. This section gives a brief overview of human brain signal acquisition andprocessing, and introduces brain-computer interfaces.
The brain is the most complex organ in the human body. It is responsible for different pro-cesses such as perception, reasoning, self-awareness, language or imagination. It is composed ofthe cerebrum, the cerebellum and the brain stem. The cerebrum is composed of several lobes: the12https://www.elle.com
12

2.2 Brain signals
Table 2.3: Some books written by LIS patients [BPL08]
Author Year Title Publisher
Jean-DominiqueBauby
1998 The Diving Bell and the Butterfly:A Memoir of Life and Death
Vintage
Julia Tavaro 1997 Look Up for Yes Kodansa (NY)Karl-Heinz Pankte 1999 Locked-in. Gefangen im eigenen
Körper (Taschenbuch)Mabuse-Verlag
Philippe andStéphane Vigand
2000 Only the Eyes say Yes (original ti-tle: Putain de silence)
LGF - Livre de Poche
Philippe Vigand 2002 Promenade immobiles Le Livre de PocheRoland Boulengier 2002 Solitaire, dans le silence Imprimerie - Editions De-
molVincent Humbert 2003 Je vous demande le droit de
mourirMichel Lafon
Laetitia Bohn-Derrien 2005 Je parle: l’extraordinaire retour àla vie d’un Locked-In Syndrome
J.-C- Lattès
frontal lobe, the parietal lobe, the temporal lobe and the occipital lobe as can be seen in Fig. 2.5.The Sylvian fissure divides the frontal lobe from the temporal lobe, and the central sulcusseparates the frontal lobe from the parietal lobe. Each of the brain areas have specific functions.For example, the frontal lobe is responsible for motor control, speech and problem solvingamong other things. Facial recognition and hearing functions are located in the temporal love.The cerebellum is responsible for coordination as the occipital lobe is in charge of vision. Touch,taste and body awareness are functions of the parietal lobe [BCP16].
Cognitive neuroscience enables the analysis of brain signals in order to attempt to understandthese different mechanisms. The term comes from cognition, which is the process of know-ing and neuroscience, which is the study of the functions and organisations of the nervoussystem [GIM18; BCP16].
2.2.1 Brain signal acquisition
2.2.1.1 Types of brain recordings
Several methods have been developed to measure brain activity, depending on the temporal andspatial resolution needed, and the type of signals to be recorded (electrical activity, magneticfields, etc.) [GIM18; Sub19]. Fig. 2.7 illustrates the most common brain recording techniques,and Fig. 2.6 shows different brain imaging techniques relative to their temporal and spatialresolutions.
• Electroencephalography (EEG): measures the electrical activity of the brain, be it sponta-neous or evoked (cf. Fig. 2.7a).
13

2 Basics
Figure 2.5: Different lobes of the cerebral cortex. Important landmarks separate them: the frontal and theparietal lobes by the central sulcus, the temporal lobe from the other lobes by the lateral sulcus or Sylvianfissure. From Wikipedia (CC BY 3.0).
• Functional Near Infrared Spectroscopy (fNRIS): measures the cortical haemodynamic activitythat occurs in response to neural activity by the means of near-infrared. A typical setupfor measuring fNRIS is shown in Fig. 2.7b.
• Magnetoencephalography (MEG): allows the localisation of the sources of the brain’s neuralactivity, especially those deep below the surface. It measures magnetic fields producedby the brain’s electrical activity (cf. Fig. 2.7c).
• Functional Magnetic Resonance Imaging (fMRI): determines the metabolic changes in bloodflow correlated with neural activity in the brain. Fig. 2.7d illustrates an fMRI machine.
• Positron Emission Tomography (PET): measures local variations in the cerebral blood flowthat correlate with mental activity using radioactive-labelled compounds.
• Single Photon Emission Computed Tomography (SPECT): scan used to identify altered bloodflow in the brain.
This research is limited only to EEG and ECoG recording techniques, consequently only thosewill be further described.
Electroencephalography EEG is a non-invasive measurement of the electrical activity of thebrain from the surface of the scalp by means of electrodes. This activity is generated by the exci-tation of the dendrites of several groups of pyramidal neurons in the cerebral cortex [SC13]. Thefirst human EEG recording was performed by German psychiatrist Hans Berger in 1929 [BCP16].EEG allow an overview of the generalised activity of the underlying brain region. It is possibleto record the brain’s electrical potential at the scalp because tissues of the brain, skull, and scalp
14

2.2 Brain signals
1 10 102 103 104 105
temporal resolution (ms)
5
10
15
20
spat
ial r
esol
utio
n (m
m)
MEG
EEG
NIRS
fMRI
PET
SPECT
ECoG/sEEG
Figure 2.6: Spatial and temporal resolutions of different brain imaging techniques. Adapted from [Hit15].In red: strong invasiveness, in yellow: medium invasiveness, in green: non invasive.
passively conduct the electrical currents produced by the synaptic activity. In general, EEGscalp amplitude range varies between 10 and 100 µV [Nie05; SM10]. EEG provides an excellenttime resolution, but a limited spatial resolution (cf. Fig. 2.6) [KSD09]. The maximal number ofelectrodes in any EEG recording is currently limited to 256 [GIM18].
To generate an EEG signal big enough to be seen, it necessitates the activation of manythousands of underlying neurons. The number and synchronicity of these neurons contributeto the amplitude of the obtained EEG signal. Fig. 2.8 illustrates the generation of an EEG signal.Synchronous activity of neurons underneath an electrode generate large EEG signals, whileasynchronous cell responses produce small EEG amplitudes [BCP16].
To allow reproducibility and comparison between different experiments, a standardised EEGlocation system called the 10-20 system has been developed. It uses anatomic landmarks of thebrain such as F (frontal), C (central), P (parietal), and O (occipital). In addition, EEG channelslocated in the left side of the brain are identified by odd numbers while those located on theright side are represented by even numbers, and channels located in the midline are representedby z (midline sagittal). For example, Fz is located in the midline of the frontal area. Along withchannel Cz commonly used as reference, it is often used as ground [Rei05; Jas58; BCP16; Sub19].Referencing can also be performed using contralateral channels located in the left and rightmastoids A1 and A2 (A as in auricle (ear)), since their potentials are close to zero [NS06]. The10 and 20 in 10-20 system represent the distance as the percentage of the total distance betweenthe nasion and the inion (cf. Fig. 2.9). The later developed 10/10 system is an extension of the10/20 system that includes more channels [Nuw+98].
15

2 Basics
(a) EEG (self-recorded).
(b) fNIRS. From Wikipedia (CC BY-SA 4.0)
(c) MEG. From Wikipedia (Public domain)
(d) fMRI. From Source
Figure 2.7: Most common brain recording techniques used to regulate a BCI.
Electrocorticography (ECoG) ECoG or intraoperative cortical electroencephalogram is an invasivemethod of brain recording. Hans Berger introduced it in the 1940s to map the location andextent of epileptogenic brain tissue before surgically removing it to treat partial epilepsy [QN05].ECoG electrodes measure electrical signals before they pass through the scalp and skull. Theonly difference between EEG and ECoG recordings is that, for the latter, the electrodes areplaced directly on the surface of the brain, either outside the dura or beneath it (cf. Fig 2.8).There is consequently far less signal distortion compared with EEG [GIM18]. ECoG also has amuch higher spatial resolution than EEG (millimetres vs. centimetres), a higher characteristicamplitude (50-100 µV vs 10-20 µV), and is less vulnerable to artefacts [SM10]. The recordings areusually performed using strip and grid electrodes. One disadvantage of this type of recordingis that these strips and grids tend to curve and pull slightly away from the cortex, resulting
16

2.2 Brain signals
Figure 2.8: EEG signal generation. The EEG electrodes measures the averaged activity of a large populationof neurons through different tissue layers. The signal will only be detected if the pyramidal neuronsare firing synchronously. From [BCP16]. Copyright © 2016 by Wolters Kluwer. Used with permissionfrom the copyright owner.
in weak contact connection to some contacts [QN05]. Fig. 2.10 shows the implanted ECoGelectrodes of one of the CLIS patients in this work.
2.2.1.2 Modalities of recordings
Brain electrical activity can be categorised into two groups: spontaneous EEG and Evoked Poten-tials (EPs) or Event-Related Potentials (ERPs).
Spontaneous brain recordings Spontaneous EEG is obtained when there are no specific sensorystimulus [NS06]. Brain recordings oscillate at different frequencies that are named after differentGreek letters and indicate the state of the brain [GIM18]. Typically, high frequencies manifestthemselves during alertness, waking states, but also during dreaming state of sleep (RapidEye Movement (REM) sleep). On the other hand, low frequencies are dominant during non-dreaming stages of sleep and the pathological state of coma [BCP16]. Fig. 2.11 displays fourcanonical frequency bands of a healthy subject extracted from an EEG signal x(t). No taskswere performed during the recording.
17

2 Basics
Figure 2.9: 10-20 system for EEG signal recording. The figure shows the spacing between the differentrecording channels. If d represents the distance from the nasion to the inion, channel Fpz at the forefrontis located at 10%d. Fz, in turn is located at 20%d of Fpz, and so on (transversal channels). The samegoes for the lateral electrodes (right figure). From [SC13]. Copyright © 2013. Reprint with permissionfrom John Wiley & Sons.
Alpha rhythm α rhythms were first introduced by Hans Berger in 1929. They are associ-ated with quiet but waking states, i.e. when the subject is awake but do not perform anytask [SC13]. They were best obtained with eyes closed and attenuates with high degree ofalertness. Fig. 2.11b illustrates such a frequency band. The International Federation of Societiesfor Electroencephalography and Clinical Neurophysiology (IFSECN) defines it as a:
“Rhythm at 8-13 Hz occurring during wakefulness over the posterior regions of the head,generally with higher voltage over the occipital areas. Amplitude is variable but is mostlybelow 50 µV in adults. Best seen with eyes closed and under conditions of physical relaxationand relative mental inactivity. Blocked by attenuated attention, especially visual, and mentaleffort.” [aut74].
µ rhythms are similar in frequency to the α rhythms, except that they are larger over themotor and sensorimotor areas. Mu rhythms are greatly related to functions of the motorcortex, involving mostly the channels C3 and C4. It is reduced with movement or imaginationof movement of the opposite upper limb, also referred as de-synchronisation [Nie05; BCP16;GIM18].
Beta rhythm β rhythms (Fig. 2.11e) were also introduced by Hans Berger and indicate anactivated cortex. Its frequencies lie between 13 and 30 Hz [BCP16]. When the brain is engagedin information processing, the cortical neurons are highly activated and relatively asynchronous.This low synchrony in turn produces EEG with low amplitudes [GIM18; Nie05]. Beta activityis usually observed in the frontal and central areas, with an amplitude of 30 µV at most [SC13].
18

2.2 Brain signals
Figure 2.10: ECoG electrodes surgically implanted in a CLIS patient. The grid contains 128 channels intotal, but only 64 of them were effectively usable. Image courtesy of the Universitätsklinikum of theUniversity of Tübingen, Germany.
Theta rhythm θ rhythms (Fig. 2.11c) were introduced by Walter and Dovey in 1944 anddenote frequency ranges between 4 and 8 Hz [BCP16]. The name comes from the belief thatthese waves originate in the thalamic region. They appear during deep sleep, during whichcortical neurons are not involved in any information processing. Many of them are phasicallyexcited by a common, slow, rhythmic input leading to a high synchrony. This will then resultin high EEG amplitude. θ waves can also occur during waking states, for example duringmental activity such as problem solving, and are larger over the frontal midline region in thiscase [GIM18; Nie05].
Delta rhythm δ rhythms (Fig. 2.11b) are slow rhythms with frequencies below 4 Hz [BCP16].They occur mostly during deep sleep states and are characterised by large amplitudes. Thetawaves are related to the level of arousal and represent the boundary between consciousnessand drowsiness [SC13]. They were introduced by Walter in 1936, and designated at first allfrequency below the α frequencies. Later however, Walter also introduced the previouslydescribed θ rhythms [GIM18; Nie05].
Other brain rhythms Gamma rhythms (γ) are high frequencies oscillating between 30 and70 Hz. Other EEG frequency components also exist but are rarely used. For example, ω waveswith frequency between 60 and 120 Hz that have retinal origin, or ρ waves that are around 250
Hz [Dro06].
Evoked and Event-related potentials As opposed to spontaneous potentials, an evoked poten-tial is a brain potential obtained as a direct response to some external stimulus. This can bean auditory tone or a flashing light for example. Evoked-potentials have very low amplitudesthat are difficult to detect from a single trial. They are embedded in the ongoing EEG signal.Thus, a large number of single trials needs to be averaged to extract the signal related to the
19

2 Basics
(a) Raw EEG
(b) δ waves
(c) θ waves
(d) α waves
0 1 2 3 4 5Time (s)
(e) β waves
Figure 2.11: Normal EEG brain waves at location FP2 recorded from one healthy person (myself). (a) rawdata, (b) δ : 0.5− 4 Hz, (c) θ : 4− 8 Hz, (d) α : 8− 12 Hz, and (e) β : 12− 30 Hz. Waveform withtime on the x-axis and voltage expressed in µV on the y-axis. It oscillates between a positive and anegative voltage. Usually an increase in the θ band indicates that the subject is engaged in a cognitivelydemanding task. On the other hand, an increase of α marks a reduced state of attention.
event that evoked it. Evoked potentials that occur after an auditory stimulus are called AuditoryEvoked Potentials (AEPs), while those who appear after a visual stimulus are called Visual EvokedPotentials (VEPs). They are mostly studied to detect abnormalities in the auditory and visualsystems [GIM18; NS06]. In particular, in a Steady-State Visual Evoked Potential (SSVEP) experi-ment, the stimulus consists of a continuous sinusoidal modulated signal delivered through acomputer screen. Its effects in the brain are measured by analysing the signals in the stimulusfrequency. ERPs have been used as a diagnosis tool in neurology and psychiatry, and have beenalso widely employed in BCIs [SC13].
Event-related potentials (ERPs) are also evoked by external stimulus, but additionally theyare also linked to endogenous brain states. Furthermore, they occur at a relatively much longerlatency. The ERP components are named after the combination of the polarity (Positive (P) orNegative (N)) of the waveform and the time of appearance of the waveform after the stimulusonset. For example, P300 is a positive wave that appears around 300 ms after a stimulus. ManyERPs are linked to specific psychological processes. Sensory processing usually occurs 50 to100 ms after the stimulus onset. Attentional states normally produce potentials after 100 ms ofthe stimulus onset. N100 and P100 are examples of potentials related to selective attention. A
20

2.2 Brain signals
typical latency of 150-250 ms is observed after the onset of an unexpected auditory stimulus inthe N200 or Mismatched Negativity (MMN) [GIM18].
2.2.2 EEG signal pre-processing
During an EEG recording, the signal is exposed to other noises or artefacts coming fromphysiologic or non-physiologic sources. Physiologic sources can be electrooculagraphic (EOG),electromyographic (EMG), electrocardigraphic (EKG) or movement executed by the patient forexample. As non-physiologic sources, noises caused by the environment, the instruments orthe electrodes can be named [DHI05; SC13]. Some pre-processing steps are then necessary inorder to remove or reduce them before analysing the signal.
Artefacts caused by muscle movement can be reduced or rejected by using a band-pass filterwith cut-off frequencies between 1 and 20 Hz, since muscle movements cover the spectral rangeof around 20 to 300 Hz [DHI05; Mut13]. Another method would be to simultaneously recordthe signals potentially inducing these noises, such as EKG or EOG, and then subtraction themfrom the EEG signal [DHI05]. Low frequency noise such as breathing can be reduced by usinga high-pass filter with a cut-off frequency of 0.5 Hz or less. Noises generated by the powersupply can be attenuated using a Notch filter with a null frequency of 50 Hz [SC13].
It is also common to perform a baseline correction, i.e. demeaning the signal, before furtheranalysis to remove linear trends [Dro06]. Depending on the application, the EEG signal couldalso be filtered into frequency bands of interest (cf. Fig. 2.11). Some analysis methods requirethat the data is stationary, which is not the case of EEG signals. To ensure this stationarity, thesignal is divided into smaller segments of a few seconds.
To analyse ERP, an averaging of several trials is necessary to remove the background EEGand only retain the signal of interest [Dro06].
2.2.3 Brain-computer interfaces
A Brain-Computer Interface (BCI) is a system that uses brain activity to operate a computer-controlled device [PN05; SM10]. It has the potential to particularly improve the lives ofpeople with conditions that affect their ability to move voluntarily [GIM18]. BCI has also beenimplemented to assist LIS patients in communicating with their relatives, offering them a betterquality of life with greater autonomy [Sub19].
There are several types of BCIs. A BCI that uses brain activity that is directly and consciouslycontrolled by the user is called active BCI. When the brain activity arises as a result of anexternal stimulation, it is called reactive BCI. Passive BCI on the other hand does not necessitateany voluntary control from the user and make use only of the spontaneous brain signal [ZK11].
21

2 Basics
Figure 2.12: EEG-based Brain-Computer Interface designed for motor rehabilitation in stroke and Parkin-son disease patients. Slow Cortical Potentials (SCPs: electrical brain activity usually oscillating at lessthan 1 Hz [HMB03]) are extracted from the recorded EEG signal to detect the subject’s intention tomove. Once a movement intention is detected or a tremor predicted, the targeted muscle is electricallystimulated to help the subject produce the movement, or to counter the effect of the tremor [AB18].
A BCI system is composed of four components: a signal acquisition unit, a signal processingunit, an output device and an operating protocol [PN05; SM10]. The acquired brain signalsor features extracted from it are processed and translated into device commands [ZK11]. Theoutput devices can be a spelling device, a robotic arm or other systems that need to be controlled,which makes BCI a very convenient tool for patients who have highly compromised motorfunctions. The operating protocol guides all operations by regulating their onsets, offsets andtiming [SM10]. Fig. 2.12 illustrates a BCI system designed for motor rehabilitation of strokeand Parkinson’s disease patients. The EEG signals were acquired when stimuli were presentedon the computer screen using a g.tec gUSBamp amplifier13 and BCI2000.14 The stimuli directedthe subjects to perform imaginary left or right hand movements. The features extracted fromthe data would then be used to trigger a VisionBody suit15 to deliver an electrical stimulationin the chosen hand and help the production of hand movement [AB18]. In this particularinstance, motor imagery was used. However, the control of the BCI can also be done usingself-regulated SCPs [Bir+99; Bir+00]. Furthermore, the command signal can be obtained afterthe features of interest are elicited by a mental task (e.g. motor imagery, mental arithmetic, etc.)
13https://www.gtec.at/product/gusbamp-research/14The BCI2000 project aims at providing researchers with a software that facilitates the development of BCI applications
that necessitate real-time data acquisition, processing and feedback [SM10]. It can be downloaded at https://www.bci2000.org/mediawiki/index.php/Main_Page
15https://www.vision-body.com/en/start
22

2.3 Machine learning
or after presentation of a visual or auditory stimulus [KN05]. Different brain responses suchas event-related potentials and sensorimotor rhythms (SMR) also known as µ rhythms are alsofrequently used [K+01].
Apart from enabling patients with spinal cord injury to control a neuroprosthesis, one of themost important applications of BCI is certainly the establishment of communication with LISpatients [PN05]. In this context, BCI has been successfully employed to communicate with thepatients. They were able for example to control a cursor or use a speller to communicate usingEEG or ECoG signals [KN05; Fre+19]. Later on, it has also been proven that BCI could alsobe used to communicate with some CLIS patients [Sch+09; Gug+17]. Applications of BCI forcommunication with LIS and CLIS patients are more thoroughly discussed in Section 3.1.
2.3 Machine learning
Machine learning is a branch of Artificial Intelligence (AI), which is “the science and engineer-ing of making intelligent machines, especially intelligent computer programs” [McC04]. Asillustrated in Fig. 2.13, machine learning can be classified into three categories: supervised,unsupervised and reinforcement learning.
Machine learning
Supervisedlearning
Unsupervisedlearning
Reinforcementlearning
ClusteringClassification Regression
Figure 2.13: Types of Machine Learning. Machine learning can be partitioned into three categories:supervised learning, unsupervised learning and reinforcement learning. Supervised learning in turncan be broken down into two sub-categories: classification and regression, while unsupervised learningdeals with clustering. In a classification task, the classes are predefined, while during clustering, theclusters are determined according to the similarities of the data points. Reinforcement learning is aboutlearning the optimal behaviour of a system that maximises a reward signal.
Supervised learning Given a data set X with p features X1, X2, ..., Xp measured on n observa-tions, there is an associated response vector Y for each of the n observations. The goal is to trainan algorithm that provides the best predictions of Y using X. In other words, the intention is to
23

2 Basics
fit a model that relates Y to X in order to correctly predict the response for future data in caseof a prediction, or to understand the relationship between the predictors and the response vectorin case of an inference [NS05; Jam+13]. There are two types of supervised learning algorithms.Typically, when the response vector Y is quantitative, i.e. has numerical values, it is referred toas a regression problem while if Y is qualitative or categorical, it is designated as a classificationproblem [Jam+13; Bis06].
Unsupervised learning No response vector associated with the data set X is available to thelearning algorithm. In this case, the purpose is to discover hidden patterns in the data. Thedata points are grouped into clusters depending on how similar they are in what is calledcluster analysis [Bis06; Jam+13]. As opposed to a classification problem, in which the number ofclusters are known a priori and is used to predict new data, clusters represent the partition ofthe data into natural groups [Wit+17]. Their numbers can either be fixed or determined.
Reinforcement learning In this case, the goal is to determine what actions should be takenin a given situation so that a reward signal is maximised [SB18]. Similar to unsupervisedlearning, no response vector is provided to the learning algorithm that must determine it bya process of trials and errors instead [Bis06]. Consequently, the output of such system is asequence of actions that yields the most reward [Alp09; SB18]. The learning algorithm gathersinformation by interacting with its environment, and for each action, receives an immediatereward. Nonetheless, the environment does not provide long term feedback. Thus, the learningalgorithm faces an exploration (gain more information to see how effective each action is) versusexploitation (use already gathered information to obtain a high reward) dilemma [Bis06].
The work in this thesis makes use of clusters analysis, which is the focus of the next section,to evaluate the levels of consciousness of several patients with DoC and CLIS.
2.3.1 Clusters analysis
Clustering is a method that consists of discovering unknown subgroups in a data. Thesesubgroups can be determined using either a hierarchical or a partitive cluster analysis [SS12].
A hierarchical clustering can be executed using one of two approaches: an agglomerative ora divisive one. The agglomerative method is the most used of the two. It starts with n clusters,each cluster containing one point. The clusters are combined, one at a time, based on distinctsimilarities, until all points are contained within a single cluster [SS12]. Fig. 2.14 illustrates adendrogram representing the results of a hierarchical analysis performed on the Iris dataset.16
The most popular partitive clustering method, especially in biomedical signal analysis, isK-means clustering [NS05]. The algorithm attempts to establish a set of rules to group the data
16Fisher’s Iris data set, data set containing 3 classes of Iris plants, introduced by the British statistician, eugenicist, andbiologist Ronald Fisher in 1936 [Fis36].
24

2.3 Machine learning
0.5
1
1.5
2
2.5
3
3.5
Figure 2.14: Dendrogram representing clustering of Fisher’s Iris dataset. A much higher root nodecompared to the remaining nodes is observed. The figure also shows that there are two distinct groupsof observations. When smaller distances are considered, different levels of groups emerge.
without the help of examples, by partitioning it into K distinct and non-overlapping clusters(hard clustering, see Fig. 2.16a). It is therefore imperative to provide the number of clusters.The general algorithmic structure of a partitive clustering is summarised in Algorithm 2.1.The details of the needed parameters and the computation of new clusters centres for eachclustering method used in this work will be developed in Section 2.3.2.
Algorithm 2.1: Partitive clustering.
Initialisation:;Set number of clusters K and further parameters where applicable;Assign the objects to the K clusters;Iteration:;1. Compute new cluster centres;2. Assign the objects to the new clusters.;3. Converged? Yes: stop / No: goto 1;
In order to assign a specific cluster to the observations, K-means clustering algorithm ran-domly assign a number, from 1 to K, to each of them first. These act as initial cluster assignmentsfor the observations. The objective is to minimise the distance between the observations andthe centres of these clusters (objective function). New cluster centres are computed using that ob-jective function, and each object is assigned to the cluster whose centroid is the closest (definedusing Euclidean distance). This is repeated until its convergence [Pet+13].
Fig. 2.15b illustrates the results of a K-means clustering applied to Fisher’s Iris datasetrepresented in Fig. 2.15a. When comparing these results to the actual classes, it can be concludedthat the algorithm clearly separates the Setosa (characterised by smaller petal lengths and
25

2 Basics
widths) from the other two groups. There are some overlapping in terms of petal lengths andwidths between Versicolor and Virginica, leading to a few incorrect grouping by the algorithm(circled points in Fig 2.15b). Hence, the algorithm correctly identified all Setosa types, 96% ofthe Versicolor and 88% of the Virginica.
1 2 3 4 5 6 7
Petal Lengths (cm)
0
0.5
1
1.5
2
2.5
Pet
al W
idth
s (c
m)
Fisher's Iris Data
(a)
1 2 3 4 5 6 7
Petal lengths (cm)
0
0.5
1
1.5
2
2.5
Pet
al w
idth
s (c
m)
K-means clustering
VersicolorVirginicaSetosaCluster Centroid
(b)
Figure 2.15: Grouping objects in clusters using K-means. Given the Fisher’s Iris data in (a), the algorithmpartitions the data into K=3 clusters relative to their position and distance from each other. The clustersare mutually exclusive and are characterised by their respective centre point or centroids, representedby black crosses in (b). Data points belonging to each cluster are shown in different colours. There isan overlapping between Versicolor and Virginica from the K-means clustering. The circled points in (b)are the ones misclassified by the clustering analysis.
It can also happen that the membership degrees are not bivalent, in which case the clusteranalysis is known as soft clustering [Pet+13]. This approach is elaborated in the followingsection.
2.3.2 So�-clustering
Two soft clustering approaches are used in this work, namely fuzzy c-means (FCM) andGaussian Mixture Models (GMM).
2.3.2.1 FCM clustering
FCM is a soft-clustering approach that allows each data point to belong to multiple clusterswith varying degrees of membership. In other words, as opposed to hard-clustering approachsuch as K-means in which the membership degrees are bivalent, a data point is assigned amembership grade ranging from 0 to 1 for each cluster as can be observed in Fig. 2.16b. Onone hand, a data point which membership degree to a cluster equals 1 represents that clusterperfectly; on the other hand, a membership degree of 0 means that it is not "representative" of
26

2.3 Machine learning
(a) Hard clustering (b) Soft clustering
Figure 2.16: Cluster membership for hard and soft clustering. (a) Hard membership, obtained usingK-means. Each data point belongs to only one cluster. (b) Soft clustering, using fuzzy c-means. Eachdata point belongs to a cluster to a certain degree. The sum of cluster membership equals 1.
the cluster at all [Chi94; Pet+13]. This technique was first introduced in [Bez81] with the goalto improve earlier clustering methods, and has been well established since.
Similarly to hard-clustering, the goal in soft-clustering is also to minimise an objectivefunction:
Jm =D
∑i=1
N
∑j=1
µmij ||xi − cj||2 (2.1)
where D represents the number of data points and N the number of clusters. m, (m > 1),is a fuzzy partition matrix that defines the cluster’s fuzziness. In other words, it determinesthe number of data points that have significant membership in more than one cluster. Largervalues indicate a higher degree of overlap. m = 1 corresponds to a hard-clustering analysis. cjdesignates the centre of the j-th cluster and is obtained by applying Eq. 2.2:
cij =∑D
i=1 µmij xi
∑Di=1 µm
ij(2.2)
where xi is the i-th data point. The degree of membership of xi in the j-th cluster is given byµij in Eq. 2.3, and the sum of the membership values for all clusters is 1 [Pet+13]. To measurethe dissimilarity between data points and the cluster centre, the algorithm uses the squaredEuclidean distance [Bis06].
µij =1
∑Nk=1
( ||xi−cj ||||xi−ck ||
) 2m−1
(2.3)
27

2 Basics
For any given data point, the objective function expresses the distance to a cluster centreweighted by that data point’s membership grade. The fuzzy c-means algorithm is implementedas follows [Bez81; Chi94; Pet+13]:
1. First, the number of clusters is specified and the cluster membership values µij is ran-domly initialised.
2. Then, the cluster centres are computed using Eq. 2.2.
3. The cluster membership values µij are subsequently updated according to Eq. 2.3.
4. Finally, the objective function Jm is calculated using Eq. 2.1.
5. The steps 2-4 are repeated until the objective function improves by less than a specifiedminimum threshold or until a given maximum number of iterations is achieved.
Fig. 2.17 illustrates the results of a FCM clustering applied to the Fisher’s Iris dataset intro-duced in Fig. 2.15a. The colorbar on the right of the figure represents the degree of membershipof the objects to the Versicolor group. The previously reported K-means clustering resultsshowed that it was able to perfectly cluster the Setosa group. So, unsurprisingly, the degreeof membership of this group is quasi null. As the boundary between Versicolor and Virginicais unclear, the degree of membership of the latter to the former decreases as the values of thepetal lengths and width increases.
1 2 3 4 5 6 7
Petal lengths (cm)
0
0.5
1
1.5
2
2.5
Pet
al w
idth
s (c
m)
FCM clustering
0
0.1
0.2
0.3
0.4
0.5
0.6
0.7
0.8
0.9
1
Deg
ree
of m
embe
rshi
p to
the
Ver
sico
lor
grou
p
Figure 2.17: Soft-clustering of the Iris dataset using FCM. The colorbar represents the degree of member-ship of each data point to the Versicolor group (in red). Data points belonging to the Virginica grouphave great degree of membership to the Versicolor group, illustrating the overlapping mentioned earlier,as opposed to those from the Setosa group that are clearly separated (degree of membership ≈ 0). Thecircled points have degrees of membership between 0.4 and 0.6 (have relatively strong affinity to bothgroups).
28

2.3 Machine learning
2.3.2.2 Gaussian Mixture Model
A GMM is a model-based cluster analysis approach that uses a Gaussian mixture distributionf(xi|zig = 1, θg
)∼ N
(µg, Σg
)as a model. The assumption is that the data is generated by a
random statistical model that the clustering method attempts to recover [FG20]. Simply put,a Gaussian mixture model is a simple linear superposition of several Gaussian components(Eq. 2.4) that gives a richer class of density models than a single component [Bis06]. Givenx = (x1, x2, ..., xn) ∈ Rp, the random vector xi is assumed to arise from a finite mixture ofprobability density functions:
f (xi, Θ) =K
∑g=1
πgΦ(xi|µg, Σg
)(2.4)
where:
• K: number of components (clusters);
• πg > 0, (g = 1, ..., K) and ∑ g = 1Kπg = 1: mixing proportions;
• Φ = (π1, ...πg−1, µ1, ...µg, Σ1, ..., Σg): parameter vector;
• Φ(xi|µg, Σg
): underlying component-specific density function with parameters µg, σg, g =
1, ..., K.
Each mixture component density is associated to a specific parametric class and representsa cluster. The parameters in Φ are estimated by the maximum likelihood optimisation, moreprecisely by using the iterative Expectation-Maximization (EM) algorithm [FG20]. K-means is aparticular non-probabilistic limit of EM applied to mixtures of Gaussian [Bis06]. The model inEq. 2.4 generates ellipsoidal clusters centred at the mean vector µg, and σg controls the othergeometrical properties of each cluster. Difference of means in the different component modelssuggest that the model distinguishes among the K classes [MP00].
The EM algorithm consists of two steps:
1. The E-step, during which the algorithm calculates posterior probabilities17 of clustermemberships. The result can be thought as an n-by-k matrix, where element (i, j) containsthe posterior probability that observation i is from cluster j.
2. The M-step, during which it estimates the cluster parameters by applying maximumlikelihood and using the cluster-membership posterior probabilities as weights.
The EM algorithm iterates over these steps until convergence to a local optimum. Once itreaches it, the soft partition is obtained by assigning each data point to the cluster with thehighest posterior probability. This local optimum depends on the initial conditions which canbe chosen randomly or selected using the k-means++ algorithm (see Appendix A).17conditional probability that is assigned after the relevant evidence is taken into account
29

2 Basics
Fig. 2.18 represents the results of GMM clustering applied to the Fisher’s Iris dataset intro-duced in Fig. 2.15a. The colobar on the right of the figure illustrates the degree of membershipof the objects to the Versicolor group. Same as for FCM clustering, the degree of membership ofall Setosa to Versicolor is very close to zero, and for Virginica the value decrease as the values ofthe petal lengths and width increases. In addition, the results obtained in this case differ fromthose from FCM in that there are less intermediate values of the membership degree (circledpoints in the figure).
1 2 3 4 5 6 7
Petal lengths (cm)
0
0.5
1
1.5
2
2.5
Pet
al w
idth
s (c
m)
GMM Posterior Probabilities
0
0.1
0.2
0.3
0.4
0.5
0.6
0.7
0.8
0.9
1
Deg
ree
of m
embe
rshi
p to
the
Ver
sico
lor
grou
p
Figure 2.18: Soft-clustering of the Iris dataset using GMM. The colorbar on the right side of the figurerepresents the degree of membership of each data point to the Versicolor group (in red). Data pointsbelonging to the Virginica group have high degree of membership to the Versicolor group, but decreasesas one move away from its centroid. The Setosa group is clearly separated from the other two groups.The circled points have degrees of membership between 0.4 and 0.6 (have relatively strong affinity toboth groups).
2.4 Summary
This chapter introduced a few principles necessary for the understanding of the contents of thefollowing chapters. It started by defining what consciousness is, at least in the context of thisthesis. In particular, it dived into states known as disorders of consciousness. The main groupof interest of this thesis is however completely locked-in syndrome patients. It then providedthe foundations of brain signals and the recording process as well as brain-computer interfaces.The chapter ends with some notions of machine learning, especially of clustering analysis thatwill be specifically used to infer the patients’ consciousness levels. The details of how it goesabout is presented in Chapter 5.
30

3 State-of-the-art
After a brain injury, the state of the patient is usually evaluated using standardised neurobe-havioural assessment measures such as the Coma Recovery Scale - Revised (CRS-R) presented inthe previous chapter in Table 2.2. These assessments evaluate the patient’s eye, motor and verbalresponses [Pos+07]. The behavioural assessments are however not appropriate for LIS and CLISpatients since they cannot move and that the tests mostly rely on motor response [Hei+18]. Thisoften causes misdiagnosing them as DoC patients. Generally, the first diagnosis is made severalmonths after the injury, normally around 2.5 months after onset. But for a lot of them, it wasonly detected after several years [LCERDM02; KN05]. An extreme case being a patient that wasbelieved to be in an UWS/VS for 20 years. It was later discovered, after a series of behaviouraland neuroimaging assessments, that the patient was in an incomplete LIS state instead [Van+18].The misdiagnosis of LIS as a DoC may be due to the fact that outwardly, LIS patients looklike patients in VS or in MCS [KN05; Pos+07]. In addition, in the way to recovery, patients gothrough a functional LIS state which combines motor dysfunction and preserved higher corticalfunctions that can only be detected using functional imaging techniques [FDC13]. Anyhow, thepatient’s conscious state is usually discovered by family members [Pos+07]. Fig. 3.1 illustratesthe rate of discovery of the patients’ conscious states in [LCERDM02], where more than halfthe time a family member notices that the patient is conscious. This state is discovered by thephysician in only 22.7% of the cases.
54.4%
22.7%
18.2%
4.5%
Family memberPhysicianNurseOther
Figure 3.1: LIS patient’s awareness discovery. Most of the time, family member are the first to observesigns of awareness from the patient [LCERDM02].
31

3 State-of-the-art
Living in a state of LIS appears to be a very challenging situation. Patients that experiencedpharmacologically induced LIS during anaesthesia reported an anxious desire to move andspeak while being unable to do so [Gos+09]. Moreover, a glimpse at the life of LIS patientscan be imagined by reading some books written by such patients. A few examples of thesebooks can be found in Table 2.3. Surprisingly, most patients report a rather fulfilling life,especially when they have the ability to communicate with their family or somewhat interactwith their surroundings. The survey in [LCERDM02] also reported that 73.2% of the patientsenjoyed going out, and 81% of them actually meet their friends at least two times monthly.Most of the time, communication are performed using lateral or vertical eye movements, orblinking [Lau+05]. In addition to that, a 6-year longitudinal study of the quality of life18 ofpatients with LIS also revealed that the majority of them were relatively satisfied with theirquality of life and still enjoyed social interaction [Rou+15]. For this reason, patients’ desire toend their life is relatively rare [KN05]. It is therefore crucial that the patients have someone tocommunicate with since their quality of life heavily depends on that [Bir+00; K+01]. Besides,it also appears that the ability for CLIS patients to communicate and interact with othersare highly correlated with a positive state of mind [Rou+15]. Misdiagnosis of such patientscould therefore lead to wrongful termination of their life, which is tragic given that most LISpatients lead meaningful life despite their state. Furthermore, it delays every opportunity forthe patients and their family to communicate and accordingly decreases their mood and qualityof life.
On one hand, BCIs offer the potential to reveal hidden brain signal patterns that indicateconscious states, independently of external motor functions responses. On the other hand, theyprovide a direct connection between the brain and a computer, allowing the control of otherdevices. This in turn permit people, especially those with no motor control, to communicateusing only their brain signals. This chapter gives an overview of the state of current researchesin communication in the completely locked-in state using EEG or ECoG signals before reportingon those involving consciousness detection in such patients.
3.1 BCI-based communication for CLIS patients
The first speller for LIS patients with ALS was developed by Birbaumer et al. in the late 90s,and uses self-regulated SCPs to command a speller device. Comparable to healthy subjects,two patients were able to learn to regulate their brain responses in order to operate the device,allowing them to select letters of the alphabet using a cursor on a video screen [Bir+99; HMB03].The speller has been expanded into a Thought Translation Device (TTD), providing the patientswith a system in which they can also select words and pictograms in addition to letters [HMB03].The system was tested with five LIS patients and demonstrated the usefulness of such systemto communicate with completely paralysed patients [Bir+00]. These communication systemswere further improved granting the patients with an adapted web browser and an e-mail
18World Health organisation (WHO) defines quality of life (QoL) as “an individual’s perception of their position inlife in the context of the culture and value systems in which they live and in relation to their goals, expectations,standards and concerns” [WHO12].
32

3.1 BCI-based communication for CLIS patients
interface [Ben+07]. The system was called Nessi (Neural signal surfing interface) and allowedpatients to chose any selectable item on the web page using their brain signals, SCPs inparticular, and to read and write e-mails using a virtual German keyboard.
This represents an encouraging development in the quest of developing communicationsystems for such patients. Nonetheless, BCIs using SCPs (and also SMR) are relatively slowgiven that the brain responses can take around 5 seconds [Ben+07]. In addition, trainingcan be rather time-consuming since the patients need to go through a sophisticated learningprocedure to be able to regulate their SCPs [K+01], inducing patients’ fatigue. This promptedthe investigation of other faster brain responses such as the ERPs, in particular the P300.
Relatively fast BCIs are based on VEPs, which are less demanding for patients than SCPs.In [Oke+14], a rapid serial visual presentation (RSVP) paradigm was implemented to control akeyboard part of a system that incorporates a statistical language model for letter predictionusing machine learning. The system was tested with nine LIS patients along with nine healthycontrols and the experiment consisted of five levels of difficulty of different spelling tasks. Theexperiment resulted in all of the patients being able to use the spelling at level 1, but only oneof them was able to complete level 5 compared to six participants from the healthy controlgroup. Another study used SSVEP-based BCI to provide a binary communication device to sixpatients in locked-in state after a stroke or a TBI. To answer yes, the patients were instructed tofocus on yellow flashes (at frequency 10 Hz), and to answer no, they were asked to concentratein red flashes (with frequency 14 Hz) [Les+14]. Latent Discriminant Analysis (LDA) was usedafterwards to classify yes and no answers using spectral features extracted from the brain signal.A comparison of spellers using visual P300 and those employing SSVEPs to communicate withseven patients showed that SSVEP induced less mental workload compared to P300, thus ismore advantageous in terms of patients’ fatigue. It is also faster, exhibiting a transfer rate of25 bits/min as opposed to 9 bits/min for the P300 ERP [Com+13]. A major drawback of suchsystems is that it is not practical for subjects that have no gaze control. Moreover, patientsreported fatigue after a prolonged use.
Due to the progressive visual impairment of LIS patients as the condition develops, auditoryP300-based BCI were developed to continue communication with them. The achievability ofsuch enterprise was investigated in [K+09] with four LIS/CLIS patients. A 5x5 spelling matrixwith all letters of the alphabet except Z were presented on a monitor to the patients, whichcould select a letter by attending to number words presented in an audible manner. Eachcharacter’s position in the matrix was coded by two numbers representing the row (1 to 5)and the column (6 to 10). The patients were able to achieve accuracy above 70% and even 90%using a visual P300-based speller, but reliable communication could not be achieved using anauditory speller for the same task. Healthy control also performed slightly better in the visualERP BCI compared to the auditory one.
Most of the time, non-invasive BCIs are used, but in certain cases, the patients can also beimplanted with ECoG. The LIS patient with ALS in [Van+16] was implanted with electrodestrips in the left motor cortex and left prefrontal region to investigate the usability of anindependent communication system for home use. The system uses motor imagery of the righthand to allow the patient to control a pointer. She completed two training sessions weekly,
33
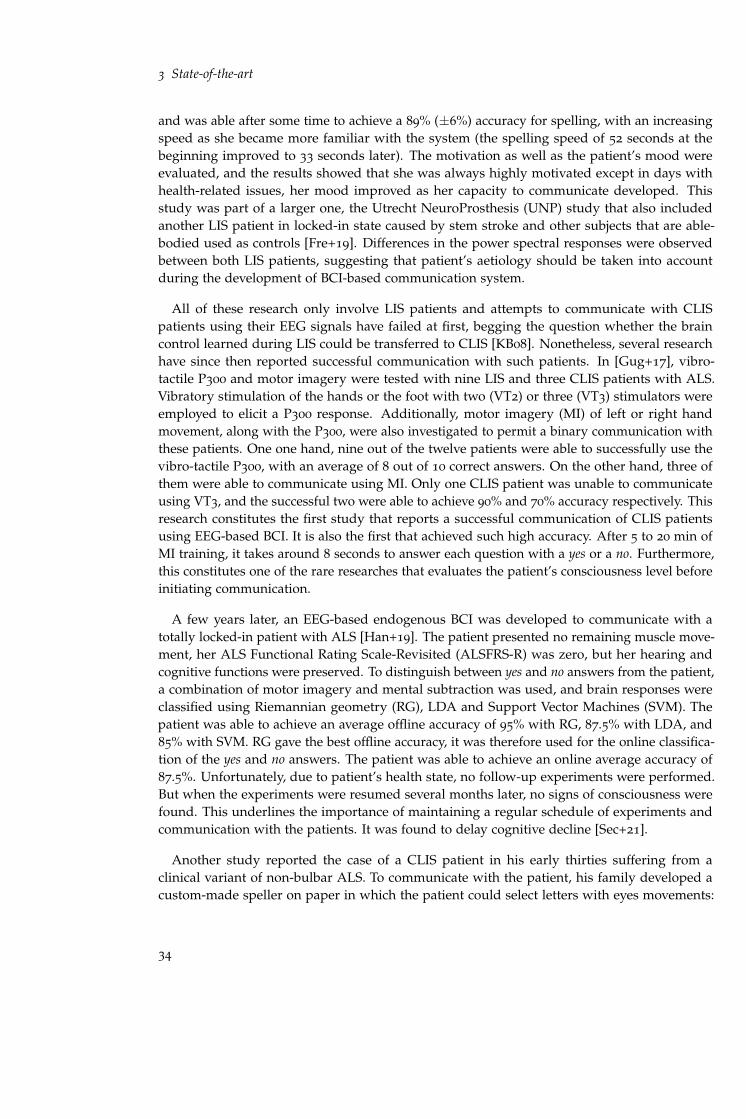
3 State-of-the-art
and was able after some time to achieve a 89% (±6%) accuracy for spelling, with an increasingspeed as she became more familiar with the system (the spelling speed of 52 seconds at thebeginning improved to 33 seconds later). The motivation as well as the patient’s mood wereevaluated, and the results showed that she was always highly motivated except in days withhealth-related issues, her mood improved as her capacity to communicate developed. Thisstudy was part of a larger one, the Utrecht NeuroProsthesis (UNP) study that also includedanother LIS patient in locked-in state caused by stem stroke and other subjects that are able-bodied used as controls [Fre+19]. Differences in the power spectral responses were observedbetween both LIS patients, suggesting that patient’s aetiology should be taken into accountduring the development of BCI-based communication system.
All of these research only involve LIS patients and attempts to communicate with CLISpatients using their EEG signals have failed at first, begging the question whether the braincontrol learned during LIS could be transferred to CLIS [KB08]. Nonetheless, several researchhave since then reported successful communication with such patients. In [Gug+17], vibro-tactile P300 and motor imagery were tested with nine LIS and three CLIS patients with ALS.Vibratory stimulation of the hands or the foot with two (VT2) or three (VT3) stimulators wereemployed to elicit a P300 response. Additionally, motor imagery (MI) of left or right handmovement, along with the P300, were also investigated to permit a binary communication withthese patients. One one hand, nine out of the twelve patients were able to successfully use thevibro-tactile P300, with an average of 8 out of 10 correct answers. On the other hand, three ofthem were able to communicate using MI. Only one CLIS patient was unable to communicateusing VT3, and the successful two were able to achieve 90% and 70% accuracy respectively. Thisresearch constitutes the first study that reports a successful communication of CLIS patientsusing EEG-based BCI. It is also the first that achieved such high accuracy. After 5 to 20 min ofMI training, it takes around 8 seconds to answer each question with a yes or a no. Furthermore,this constitutes one of the rare researches that evaluates the patient’s consciousness level beforeinitiating communication.
A few years later, an EEG-based endogenous BCI was developed to communicate with atotally locked-in patient with ALS [Han+19]. The patient presented no remaining muscle move-ment, her ALS Functional Rating Scale-Revisited (ALSFRS-R) was zero, but her hearing andcognitive functions were preserved. To distinguish between yes and no answers from the patient,a combination of motor imagery and mental subtraction was used, and brain responses wereclassified using Riemannian geometry (RG), LDA and Support Vector Machines (SVM). Thepatient was able to achieve an average offline accuracy of 95% with RG, 87.5% with LDA, and85% with SVM. RG gave the best offline accuracy, it was therefore used for the online classifica-tion of the yes and no answers. The patient was able to achieve an online average accuracy of87.5%. Unfortunately, due to patient’s health state, no follow-up experiments were performed.But when the experiments were resumed several months later, no signs of consciousness werefound. This underlines the importance of maintaining a regular schedule of experiments andcommunication with the patients. It was found to delay cognitive decline [Sec+21].
Another study reported the case of a CLIS patient in his early thirties suffering from aclinical variant of non-bulbar ALS. To communicate with the patient, his family developed acustom-made speller on paper in which the patient could select letters with eyes movements:
34

3.2 Patients’ consciousness assessment
any visible eye movement represents a yes while none means no [Cha+20]. As it became moredifficult for the patient to move his eyes, his ability to communicate decreased. He and hisfamily were then looking for other means of communication. Two intra-cortical microelectrodearrays were implanted into his primary motor cortex areas and in the supplementary motorarea (SMA), 8x8 electrodes each. The same custom-made spelling system as before was used,and the patient was able to form sentences by modulating his neural firing rates by the meansof an auditory-guided neurofeedback-based strategy to select the letters.
Almost none of these studies performs a preliminary assessment of the patients’ conscious-ness before performing the tasks. Agreed that the capability of following commands in itselfcan be considered as proof of consciousness [Les+15], however it seems more logical to firstdetermine if the patient is in fact apt to complete the tasks. Studies assessing LIS/CLIS patients’consciousness levels are reported in the following section.
3.2 Patients’ consciousness assessment
The previous sections demonstrate the importance of a correct diagnosis to allow an optimalmedical care for the patients, especially to offer them the opportunity to communicate withtheir relatives despite the state they are in. This section gather some important research dealingwith the assessment of patients’ conscious states. Most of the literature assessing consciousnessafter a TBI involve MCS and UWS/VS patients. Only a handful of them include LIS patients,and still, in a very limited number (usually only one per study). This low number of researchesis certainly due to the rarity of the disease. According to OrphaNet,19 the prevalence of LISis below 1/1000000. Furthermore, the goal of these studies was not to evaluate if the patientis conscious per se, rather to differentiate between MCS, VS and/or healthy subjects. Onlythe studies comprising at least one LIS or CLIS patient will be addressed in this section. Themethods normally used to assess patients’ consciousness can be categorised into two groups:event-related potentials in response to some sensory stimulation, and features extracted fromresting state data [JR20].
3.2.1 Assessment using brain sensory responses
Sensory-based stimuli include auditory, tactile, visual and olfactory stimulations. This type ofexperiment generally necessitate the patient’s engagement to the task to evaluate his abilityto follow commands as such capacity is seen as proof of consciousness [Les+15]. P300 isundoubtedly the most used brain potential to assess patients’ consciousness, used in conjunctionwith auditory-based stimuli. Other than audio tones, the subject’s own name (SON) is alsooften used in this case [Ser+17; Ann+20; Gao+19; Pan+18].
In [Per+06], a P300 auditory paradigm is used to attempt to discriminate between 5 VS,6 MCS and 4 LIS patients. For the analysis, they were instructed to passively listen to the19OrphaNet is a database for rare disease and orphan drugs. https://www.orpha.net/
35

3 State-of-the-art
stimuli with their eyes closed. Their results determined that P300 were elicited for all of themafter SON, except for 2 VS patients. Moreover, no difference were observed by the authorsbetween the different groups, leading them to conclude that P300 responses could be used todifferentiate between them. A similar paradigm was applied to 18 DoC patients consistingof 2 coma, 9 VS and 7 MCS patients along with 2 LIS patients [Zha+17]. The SON said by afamiliar voice was used as the deviant stimulus, and a 1000 Hz tone and the subject’s derivedname (sdn) as the standard stimulus. In both cases, intact P300 responses were observed forall LIS patients. It was also the case for all MCS and 4 of the 9 VS patients, but only with oneor the other paradigm. Follow-ups were carried out 2, 6 and 12 months after recording, andit determined that patients that displayed P300 response in both paradigms woke up after 12
months. Consequently justifying the usability of P300 as a recovery predictor for DoC patients.
P300 can also be combined with SSVEP in a visual hybrid BCI. In [Pan+14], four healthycontrols, four VS patients, three MCS patients, as well as one LIS patient participated in theexperiment. The task consisted on focusing on one photo containing the Subject’s Own Face(SOF) or another unfamiliar photo. They were flashed at 6 and 7.5 Hz respectively. The BCIshould detect which photo the patient was focusing on. The goal is evidently to ascertain if thesubjects are able to follow instructions, suggesting an underlying consciousness. The resultsshowed that all controls and the LIS patient, in addition to one MCS and one UWS patients,were able to attend to the photo they were instructed to concentrate on. Moreover, the obtainedaccuracy for both groups of DoC patients were comparable, although the CRS-R of the UWSpatients were lower (4 to 7) than those of the MCS patients (10 to 12).
Other methods not relying on eye movement control have also been investigated. Thefeasibility of using vibro-tactile stimulation to evoke P300 responses was examined in [Lug+14],with the participation of 6 chronic LIS patients. The experiment consisted of two tasks: a vibro-tactile oddball paradigm during which the patients are asked to count a target stimulus, and abinary communication in which patients answer yes by counting vibrations on their right wrist,and no by counting those on their left wrist. The results showed that 5 out of the 6 patientswere able to elicit P300 responses, with an accuracy of 100% for 4 of them. In addition, 1 outthe 6 patients obtained an accuracy of 100% during questions answering while the accuraciesachieved by the other patients vary from 20 to 60%. In the end, the study proved that it waspossible to evoke P300 responses in LIS patients using somatosensory stimulation. The samemethod was used in [Gug+17] to assess LIS and CLIS patients’ consciousness before completingthe binary communication (see previous section).
On the other hand, the use of motor imagery (MI) in evaluating consciousness states havealso been explored. One study implicating a LIS patient and two MCS patients concludedthat EEG power spectral analysis could be used as a tool to detect patients’ awareness at thebedside [Gol+11]. During the experiment, the patient was instructed to imagine "swimming"(motor imagery) or imagine "walking through their house" (spatial imagery). The LIS patient andone of the MCS patients displayed consistent patterns of spectral changes depending on thetask. However, these variations differ from the expected results from healthy subjects. LISpatients usually show levels of consciousness comparable to that of healthy subjects [JR20].However this depends on what has caused the condition. In [Hei+18] for instance, two groupsof LIS patients (one group as a result of stroke, and another as a transition from ALS) were
36

3.2 Patients’ consciousness assessment
instructed to count some rare stimuli delivered to one wrist. Two stimulators called VT2 wereplace on their left and right wrists. Results show that higher difference in the P300 amplitudewere observed with ALS patients compared to the stroke patients, reflecting the pathologicalmechanisms difference in each group of patients and pinpointing the reduced tactile sensitivityin patients with LIS following a stroke.
All of those researches involve LIS patients. One of the few studies involving a CLIS patientwas performed with patient GR (introduced in Section 5.1.2.1) who is in late stage ALS. He wasimplanted with ECoG and a longitudinal analysis of his attention and cognitive processing wascarried out 1, 2, 3 and 6 months after the grid electrodes were implanted [Ben+14]. Auditorystimuli consisting of standard and deviant tones were used to evoke brain responses. Inaddition, frequency powers of δ, θ, α, β and γ were also analysed. The patient was 40 years oldat the time of the study [Soe+13]. The goal of the study was to investigate the progression ofthe disease and eventually find an alternative communication pathway that could be used forBCI. The results revealed that during the course of the study, N1 and P2 potentials were alwaysdetectable, implying moderately intact attention and cognitive functions. On the other hand,the P3 responses decreased until they were no longer discernable three months after the lastcommunication with the patient. Moreover, a gradual session to session increase of the δ poweralong with a clear drop in γ between the penultimate and last sessions were observed, possiblyindicating transition to CLIS [Ben+14].
In general, LIS patients display significant P300 brain responses to sensorimotor stimuli.However, the response of this potential decreased for the CLIS patient as his condition evolved.Nonetheless, the presence of attention-related brain responses (N1 and P2) are still noted. Thisindicates the usefulness of evoked brain potentials to assess LIS and CLIS patients’ conscious-ness level. The type of tasks that elicits them usually requires the patients to engage to them.Nevertheless, in the previous section detailing researches in communication with these patients,it was pointed out that they tend to be easily fatigued. This is why resting state data is usedin this thesis to assess the levels of consciousness of principally CLIS patients instead of theevoked potentials. This way, less energy is spent during the consciousness detection part ofthe experiment, hopefully allowing for a more efficient communication afterwards, providedthe patient is conscious enough to initiate it. The following section presents studies evaluatingpatients’ consciousness using resting state data.
3.2.2 Assessment using resting state data
Consciousness level following a brain injury can also be assessed using resting state data. Thistype of recording provides useful information about the patients’ spontaneous neural activity,without requiring them to perform any specific task. Accordingly, features such as the powerspectral analysis of δ, θ, α, and β frequency bands or complexity measures such as the Lempel-Ziv complexity or derivate metrics are employed [Mal+13; G+21; Gos+14b]. Additionally,entropy-based approaches and functional connectivity are also used [JR20].
37

3 State-of-the-art
An investigation of the presence or absence of consciousness in LIS and DoC patients alongwith healthy controls using Perturbational Complexity Index (PCI) is performed in [Gos+14b].PCI is a measure derived from LZC. Higher complexity values are usually associated withconscious states. Their method combined high density EEG with Transcranial Magnetic Stim-ulation20 (TMS) to discriminate MCS from VS patients. The brain activation generated by theTMS was preserved in the long-range and high values of PCI were observed during conscious-ness, and the opposite is detected during unconsciousness. Besides, the method was able todiscriminate between MCS and VS patients. In addition, the PCI values obtained by the LISpatients were comparable to those of the healthy controls.
Another study involving 89 DoC, 11 eMCS, 4 LIS patients and 26 healthy subjects utilisedspectral connectivity to determine their consciousness [Che+17]. The data consisted of acombination of high density EEG and PET. Moreover, the mean relative power over all channels,the median connectivity as well as different graph theory characteristics computed in the δ,θ and α bands. Strong brain networks connectivity were observed for patients misdiagnosedas unresponsive but later revised as being in a MCS. This finding may be used to reducemisdiagnosis rates since it was able to detect consciousness in incorrectly diagnosed patients.
Preliminary studies to detect consciousness in the same patient as in [Ben+14] were performedin [Ada+19b; Ada+21] using the imaginary part of the coherency, multi-scale entropy andGranger causality separately. Sample entropy was also applied to the same data in [WNB20].Each method produce one possible consciousness state of the patient and sometimes the resultsare overlapping. Similarly, these methods were also applied to assess consciousness in the CLISpatients presented in Section 5.1.2.2 [AB21b; WB21].
There are considerably less researches that assess LIS/CLIS patients using resting state data.Different EEG signal characteristics were examined: connectivity and complexity measures aswell as spectral features, each of them showing effectiveness at discriminating conscious andunconscious states to some extent. Nevertheless, in each study, only one or two features areused. Using a unique measure only brings a single facet of the signal to light. Several featuresare thus used in this thesis to collect as much signal characteristics related to conscious statesas possible and maximise the chances of determining the correct state of the patients.
3.3 Summary
In this chapter, the relevant sources regarding consciousness assessment in patients in thelocked-in state were presented. There exists a relatively extensive literature on communicationwith LIS/CLIS patients, considering the rarity of the condition. P300 ERP appears to be themost popular brain response used to regulate a BCI in this context and seems quite efficient.However, most of the studies get straight to the point without assessing if the patient is evenconscious. On the other hand, the number of studies actually probing for consciousness are20type of non-invasive brain stimulation that uses a changing magnetic field to generate electric current in a particular
area of the brain through electromagnetic induction. Source: https://en.wikipedia.org/wiki/Transcranial_magnetic_stimulation
38

3.3 Summary
somewhat limited, especially those using resting state data. The usage of evoked potentialsoften requires some participation of the patients’ part. Furthermore, each of the methodsto detect consciousness in the current literature only uses a few features. On that account,this thesis aims at estimating the levels of consciousness of CLIS patients before engaging incommunication with them. More precisely, this latter is to be initiated only when the patient ispredisposed to do so. Moreover, a set of different EEG features is used to increase the chancesof accurately determining their states of consciousness. No such research direction has everbeen carried out as of yet. An overview of how the proposed approach operates is presented inthe next chapter.
39


4 Modus operandi
4.1 Aims and scope of the work
In one of the CLIS dataset studied in this work and described in Section 5.1.2.1, only one ofthe 170 attempts to communicate with the patient was successful. This patient was trained inusing BCI since he was in the early stages of ALS. One hypothesis would be that during theunsuccessful attempts, the patient was either unconscious or not in the mood, and that theone successful experiment occurred at a time when he was actually conscious and willing toperform the tasks. It is therefore critical to determine the periods of time during which thepatient’s level of consciousness is high enough to allow communication. Given the importanceof being able to communicate for these patients, it is vital to offer them the opportunity todo so. The goal of the present research is to introduce a system that evaluates CLIS patients’consciousness levels in order to identify the optimal time for a communication using severalsets of features including frequency, complexity and connectivity characteristics. Previousresearches suggest that the brain waves of locked-in syndrome patients are nearly similar tothose of healthy subjects [Van+18], and that their cognitive functions are mostly intact [KB08].For that reason, we hypothesise that CLIS patients’ brain rhythms would to some extent likenthat of healthy subjects’.
4.2 Design of the approach
The proposed method makes use of a set of features to assess CLIS patients’ level of conscious-ness (defined in Section 2.1) as a preceding step before an eventual communication attempt.The features were chosen so that they comprise different characteristics extracted from thepre-processed EEG or ECoG signal. The first set of features consists of spectral features, namelythe relative powers of θ and β bands, and the spectral edge frequency at 95% (SEF95). In nor-mal circumstances, the values of the different frequency powers provide information about thebrain states [GIM18]. The second set of features comprises complexity measures that evaluatethe randomness of a signal. The more random the signal is, the higher its complexity. Thishigh value symbolises an activated cortex and consequently, a higher level of consciousness.For example, Poincaré plots are a geometry-based approach frequently used to assess levelsof consciousness in anaesthesia research [HMS14]. LZC is a complexity measure that usessymbolic representation of the signal, and is mostly used for data compression [LZ76]. But ithas also been employed recently to analyse biomedical data such as EKG and EEG [Abo+06].
41

4 Modus operandi
The last set of features employed involves brain functional connectivity. One fundamentalcharacteristic of the brain is its inter-connectivity that provides information on how one brainregion is connected to another. Two different measures were used in this case: the imaginarypart of the coherency (iCOH), which is a linear approach and a non-linear method termedweighted Symbolic Mutual Information (wSMI). The imaginary part of the coherency has beenused in conjunction with artificial neural networks (ANNs) to evaluate consciousness level ofCLIS patients [Ada+19a; Ada+19b; AB21b], and both methods have also been employed withthe same goal with DoC patients [KSF13; Imp+19]. As the frequency-based and the complexitymeasures are calculated in single electrodes, the connectivity metrics are computed betweenpairs of channels. Table 4.1 details all the features extracted from the EEG or ECoG signals.
Table 4.1: List of features extracted from the EEG/ECoG signals.
Feature Type Additional infos Reference
Relative power (RP) Spectral In θ and β bands Section 5.2.1.1Spectral Edge Frequency(SEF)
Spectral 95% Section 5.2.1.2
Poincaré ERR ComplexityTime delay τ = 2 sam-ples.
Section 5.2.2.1
Lempel-Ziv Complexity(LZC)
Complexity Section 5.2.2.2
imaginary Coherence(iCOH)
ConnectivityAbsolute value in θ
bandSection 5.2.3.1
weighted Symbolic MutualInformation (wSMI)
Connectivity τ = 16 ms Section 5.2.3.2
Fig. 4.1 illustrates the signal processing and analysis pipeline of the approach proposed inthis thesis. We theoretically introduced the modus operandi implemented here in [Ada+21].Three different features were initially used to introduce the system: the imaginary part of thecoherency, multi-scale entropy and Granger causality. More features are however used in thisthesis. The idea is to maximise the chances to identifying the actual patient’s consciousnesslevel by combining them, since each of the methods extracts particular signal characteristics.Assuming that the CLIS patients’ cognitive functions in this study are still intact, a consciousstate is determined using the following hypothesis:
• An increase of θ power combined with an increase of β power. Relative power as apotential marker for consciousness for patients with disorders of consciousness has beeninvestigated and results showed that θ and α in particular are among the best featuresthat could distinguish MCS from UWS patients. Moreover, verbal and spatial memorytasks induce an increase of θ power [Bor+13] and the recovery of consciousness afteranaesthesia is indicated by a global increase of the θ power and also the γ power andcoherence [Pal+15].
• A higher value of Spectral Edge Frequency at 95% (SEF95). SEF95 is frequently usedin anaesthesia research to assess the depth of anaesthesia in healthy subjects. Its value
42

4.2 Design of the approach
represents the frequency below which 95% of the EEG signal power is contained. Researchshow that the deeper the anaesthesia level, the lower the frequency value [Ram+80]. Lightanaesthesia is characterised by SEF95 higher than 15 Hz (in the β band). For moderateanaesthesia, the values lie between 8 and 13 Hz (α band). Frequencies lower than 7 Hz(in the δ and θ bands) indicate deep anaesthesia [Tou+19]. Accordingly, a larger SEF95
value indicates a higher level of consciousness.
• A higher Ellipsoid Radius Ratio (ERR) of the Poincaré plots. ERR is the ratio SD1/SD2
of the standard deviation of the points of the ellipse along the line of identity by thatof those perpendicular to the line of identity. An increased depth of anaesthesia issymbolised by a reduced randomness of the EEG signal and the short-term variabilitySD1, and by extension ERR [HMS14]. A rounder shape of the ellipsoid (ERR ≈ 1)corresponds to randomness, thus more complex signals. Consequently, the closer to 1
the value is, the higher the consciousness level is.
• A higher LZC value. A normalised version of LZC, on the other hand, has only beenused recently to assess consciousness levels of different types of patients compared tohealthy control [LBMM15]. In principle, a higher level of consciousness is portrayed by aincrease of signal complexity, and inversely [G+21; Gos+14b].
• A higher iCOH in the θ band. During periods of unresponsiveness in healthy subjectsunder anaesthesia, a decrease of δ coherence, especially across hemispheres in frontaland central electrodes, are observed [Pul+20]. In addition, global coherence is reducedfor example during ketamine-induced unconsciousness, and power and coherence inhigh frequencies increases during recovery of consciousness [Pal+15]. Given the typeof task presented to the patient and that θ band plays an important part in workingmemory [Bor+13], only the coherence in this frequency band will be used.
• A higher wSMI in the θ band. Consciousness is normally detected by the characteristicsof the brain signal in the higher frequencies. Research suggest that the long-range con-nectivity patterns theoretically related to consciousness are most robustly and accuratelyassessed by the wSMI in the θ band [Eng+18]. It has been determined that higher values ofthis metric in that frequency band correspond to higher levels of consciousness [Bou+20].This is why only its values in the θ band will be used.
At first, the raw EEG signal is pre-processed. This is done by filtering it into specific frequencybands. Each of the features were computed on short overlapping segments of the filtered signal.Afterwards, the results are averaged over all recording channels, leading to one value for eachfeature and for each segment. This is done to obtain a global estimate of each measure. Forthe connectivity metrics in particular, the average is computed as the mean of the lower partof the connectivity matrix representing the couplings between the pairs of channels, excludingthe diagonal.
The global value of each metric is considered instead of the distinctive channels to highlightcharacteristics shared by the whole brain, instead of localised peculiarities. The averaged resultsare gathered into an n-dimensional matrix, where n denotes the number of features used, and
43

4 Modus operandi
EEG/ECoG data Features extractionSignal pre-
processing Clustering Decision rules
Level of consciousness
Filtering and
Segmentation
Fuzzy c-means+
GMM
Relative power
SEF
Poincaré index
wSMI
iCOH
Lempel-Ziv complexity
Chan
nels
aver
age
Figure 4.1: Signal processing and analysis pipeline. The recorded signal is filtered and segmented, beforeextracting the different features. Each feature is then averaged across all channels before performingthe clustering analysis. The patient’s consciousness level is subsequently determined by applying adecision rule presented in Section 4.2.
cluster analysis is performed to partition the data into two clusters: conscious and unconscious.Rather than using a hard-clustering approach, a soft-clustering analysis is preferred in that anoutput that expresses a degree of how likely a patient is conscious is desired. In this case, datapoints can belong to multiple clusters and the sum of membership to all clusters equals one[Pet+13]. The method provides a very convenient way to reach a final decision by analysing thedifferent available variables. Two well established methods are used in this case: fuzzy c-means(FCM) [Bez81] and Gaussian mixture models (GMM) [SS12]. The cluster membership value ([0, 1])corresponding to the conscious-cluster is then used as the estimated level of consciousness andis determined by combining the results of these two soft-clustering methods. The closer to 1
the value is, the higher the probability that the patient is conscious.
The proposed approach is initially applied to a DoC data-set containing EEG recordings ofVS and MCS patients. Different scoring associated with the DoC patients’ eyes states (open orclosed) are available and are thus used to evaluate the approach. In the end, the approach isapplied to ECoG and EEG data recorded from CLIS patients to assess their consciousness levels.The details of the computation of each measure and the parameters used to do so are reportedin Chapter 5.
4.3 Thesis contributions and significance of the study
In this thesis, a new set of features is used to analyse EEG/ECoG signals recorded from CLISpatients in order to assess their levels of consciousness. The usage of different features allows
44

4.3 Thesis contributions and significance of the study
the extraction of distinctive meaningful information from the data. This in turn can reduce mis-diagnosis rate and possibly allows an early diagnosis in that a consciousness signature detectedby one method could be missed or ignored by another. In other words, each measure capturea different phenomena. Consequently, combining several measures maximise the chances ofgetting the correct state of the patient. This can subsequently be used as a supplementarydiagnosis tool for the physicians. By using cluster analysis to associate all those features, anindex that estimates the patient’s consciousness is derived and will be used to identify theoptimal time to communicate with the patient. Such information would reduce the time wastedon unsuccessful communication attempts and would be beneficial for all parties.
45


5 Data analysis
The previous chapters defined the problem at hand, discussed the state-of-the-art of studies inconsciousness detection and communication with LIS patients and introduced the proposedapproach to solve the problem. This chapter starts with introducing the different datasets thatwill be used, and proceeds by describing in more details the different methods employed toobtain the features that will serve as input to the clusters analysis systems. This is followedby the description of how the patients’ levels of consciousness is deduced from the clusteringresults.
5.1 Data description
5.1.1 Disorders of consciousness data
The dataset is composed of polysomnograms21 (PSG) obtained from the Laboratory for Sleep,Cognition and Consciousness, and Centre for Cognitive Neuroscience (CCNS) of the Universityof Salzburg in Austria. In addition to EEG, other physiological signals were also recorded alongwith scores representing the patients’ eyes states: eyes open (O) or eyes closed (C). When the eyesrepeatedly switched between opening and closure, the state was scored "O/C". Furthermore, thedata was divided into night (period of darkness) and day (period of lightsomeness) [Wis+17].
The original dataset contains data from 11 MCS and 12 UWS patients [Wie+18]. However,six patients were excluded from the analysis performed in this thesis since the time stamps fortheir eyes scoring were unavailable. The demographic information of the remaining patientsare presented in Table 5.1 and more information about the complete dataset can be foundin [Wis+17]. For 58.82% of the patients, the condition was caused by TBI. For the rest of them, itwas caused either by a cerebrovascular accident (CVA) or by anoxia22 (17.67% each). A uniquepatient’s state was induced by subactute sclerosing panencephalitis23 (SSPE). The period sinceinjury varies between 1 and 120 months, and the CRS-R between 3 and 14.
21Polysomnography: technique to assess sleep and its disorders by recording several physiologic attributes such asEEG, EMG, EOG and EKG.
22Condition characterised by an absence of oxygen supply to an organ or a tissue23SSPE: progressive neurological disorder of children and young adults that affects the central nervous system (CNS).
It is a slow, but persistent, viral infection caused by defective measles virus. Source: https://www.ninds.nih.gov/Disorders/All-Disorders/Subacute-Sclerosing-Panencephalitis-Information-Page
47

5 Data analysis
Table 5.1: Demographic information of patients with disorders of consciousness.
Patient Age GenderClinical As-sessment
AetiologyPeriod since in-jury (months)
CRS-Rtotal
L1 21 M UWS TBIa7 6
L3 16 F UWS TBI 1 7
L13 74 F UWS TBI 1 3
S12 52 M UWS TBI 13 4
S13 58 F UWS CVAb28 4
S14 61 M UWS anoxiac32 4
S16 50 F UWS CVA 45 4
S17 19 M MCS/VS SSPEd24 3
L4 48 M MCS TBI 8 11
L7 66 M MCS CVA 3 10
L8 62 M MCS TBI 2 8
L9 61 M MCS anoxia 2 10
L16 43 F MCS TBI 6 21
S2 45 M MCS TBI 12 8
S5 21 M MCS anoxia 28 13
S6 50 F MCS TBI 113 14
S7 30 M MCS TBI 120 13
a TBI: Traumatic Brain Injuryb CVA: Cerebrovascular Accidentc anoxia: Condition characterised by an absence of oxygen supply to an organ or a tissued SSPE: Subacute Sclerosing Panencephalitis
The number of recording channels depends on where the patient was located: Salzburg(Austria) or Liege (Belgium). Patients from Salzburg were identified with an ’S’ and those fromLiege, with an ’L’. The EEG data was recorded from 18 channels (resp. 12 channels) placedaccording to the 10-20 system [Jas58] for the Austrian (resp. Belgian) group. Only the commonchannels illustrated in Fig. 5.1 are used for further analysis.
5.1.2 CLIS data
Although a locked-in state could result from a coma following a brain injury (cf. Fig. 2.3), allCLIS states in the dataset used in this work resulted from ALS. The data consists of ECoGand EEG recordings obtained from the Universtitätsklinikum of the University of Tübingen inGermany.
48

5.1 Data description
Figure 5.1: Illustration of the common recording channels for all DoC patients. The sampling rate is 500
Hz. Patients were based in Austria (Austrian group) and in Belgium (Belgian group) [Wie+18]. The 12
channels highlighted in the figure represent the common channels for both groups.
5.1.2.1 ECoG data
The 24-hour long data was obtained from a 40-year-old male in a totally locked-in state, whichwas first diagnosed with ALS in 1997 at age 29 and entered CLIS 11 years later [Mur+11;Soe+13]. The data was acquired with a BrainAmp amplifier from Brainproducts GmbH (Munich,Germany) at a sampling rate of 500 Hz. For this patient, an ECoG grid of 128 platinumelectrodes from Ad-Tech Medical Instruments Corporation (Wisconsin, USA) was surgicallyplaced and covered the left frontal, temporal and parietal lobes [Ben+14; Soe+13]. The specificlocations of the recording channels, as well as the locations of the ground and referenceelectrodes, are shown in Fig. 5.2. Due to recurrent signal failures, the electrodes in the middlewere not used, leaving a total of 64 usable channels [Ben+14]. These channels are shown ingreen in Fig. 5.2. This data recorded from 16/03/2008 00:34 to 17/03/2008 00:34 consists of thelast successful communication session with this patient denoted as GR [Mur+11].
An experiment during which the patient was performing an auditory paradigm task wasperformed from 14:50 to 17:00. He was asked questions requiring yes or no answers. Thequestions are of general knowledge, or are personal questions which answers are known by thefamily members and/or the caregiver. The question can be for example: "Is Paris the capital ofGermany?" or "Are you German?". The questions are also paired, meaning that for each questionwith a positive answer, there is a matching question that answers negatively. The equivalentpaired questions for the previous examples would be: "Is Berlin the capital of Germany?" or "Areyou Dutch?". At first, during training sessions, these paired questions with known answersare used to train a classifier. Motor imagery, specifically µ rhythms were used to distinguishbetween both answers. To answer yes, the patient has to imagine movement of his right hand,and to answer no, he has to imagine movement of his foot. Afterwards, the trained classifier is
49

5 Data analysis
Figure 5.2: Implanted ECoG electrodes in a CLIS patient, showing the 128 channels and emphasising the64 recording channels (in green). S032: ground, and G102: reference (in yellow). Image courtesy of theUniversitätsklinikum, University of Tübingen in Germany.
used in a feedback session during which the patient is also asked paired questions with knownanswer, but after each question, the patient is given an assessment of his answer. An exampleof such feedback is illustrated in Fig. 5.4. When the classifier’s accuracy is satisfying (above70% [K+09]), it is subsequently used to classify answers to open questions. Open questionscovered topics such as the patient’s mood and feelings, and also his physiological status, forexample: "You feel good today?"/"You feel bad today?". The questions asked during the experiment,as well as the experimenter’s notes and comments are reported in Table C.2 in Appendix C.
The data from this patient is exceptional in the sense that first, the patient has been trained touse BCI since the time he was diagnosed with ALS. And secondly, to the best of our knowledge,this is the only dataset in which the experimenter confirmed that during a specific time frame,the patient was undoubtedly conscious: he was able to correctly answer all the questions thatwere asked to him. This was also the first successful communication out of 170 attempts forthis patient.
5.1.2.2 EEG data
The EEG data were recorded from 2015 to 2019 from nine CLIS patients (mean age (±SD) = 48.1(±21.26) years) during rest and while accomplishing the same auditory paradigm describedin the previous subsection. The states of the patients reported here are as of 2019 and moreinformation about them can be found in Table 5.2. A detailed description of each patient isalso provided in Appendix D. All of them are ALS patients and no brain disease unrelated tothat were discovered. In addition, all of them present almost normal sleep patterns [Mal+19].All patients’ information as well as the dates of recordings and the recording channels aresummarised in Table 5.2. More information can also be found in [Mar+21; Mal+19]. It isimportant to note that this dataset was involved in a controversy after the legitimacy of the
50

5.1 Data description
results obtained by Chaudhary et al., in their now retracted publication [Cha+17] asserting asuccessful communication with several CLIS patients using fNRIS and EEG, were questionedin [Spu19]. The researchers were accused of scientific misconduct related to the manipulationof the data [Rij19; Fin19], which in turn were denied by the accused [Cha+18]. The validity ofthe raw data itself and the circumstances of its recordings were never questioned and this studymake use only of the raw data of the patients.
Figure 5.3: Overall list of electrodes from which the EEG signals were recorded for the CLIS patients.Electrodes were placed over the frontal lobe, the motor and sensorimotor cortices, and over the centralsulcus.
The experimental setup is similar to the one reported in the previous subsection. Particularly,a binary communication is attempted using an EEG-based BCI. Fig. 5.4 illustrates the structureof the BCI system developed to communicate with the CLIS patients. They were asked a seriesof questions with known answers, a classifier was trained, and used afterwards to classify theiranswers during a feedback session. In this case, the classification results are provided to thepatients.
The sampling rates and electrodes sites were different for each patient and/or session. Overall,the sampling rates used were 200, 250 and 500 Hz and the number of EEG channels variesfrom 4 to 8, except for patient P6 (22 channels). This inconsistency across patients, even acrosssessions for the same patient, is due to the difficulty to record data from CLIS patients andother external factors. Fig. 5.3 shows the overall channels positions for all patients. Each sessionlasted about 10 minutes, during which the patient was asked 10 pairs of questions. This meansthat 10 of them requires a positive answer and 10, a negative one.
51

5 Data analysis
Table 5.2: CLIS patients information.
Patient Age Gender ALSd Recording dates Fsa Labels
P1 75b F 10
18/05/15
200
FC5, FC1, FC6, CP5, CP1, CP6
20/05/15 FC5, FC1, FC6, CP5
24/01/17 FCC5, FCC3, FCC4, FCC6, Cz11/04/19 500 FFC3h, FCC3H, CCP3H, Cz, FFC4h,
FCC4h, CCp4h
P2 65c M 4 22-26/06/15 200 FC5, FC1, FC6, CP5, CP1, CP6, AF3,
AF4
P3 80 F 7 13-16/07/17 500 FC4, FC5, FC3, FC6, Cz
P4 29 F 4
18-22/01/16 200 FC5, FC1, FC2, FC6, CP5, CP1, CP2,CP6
27-28/03/19
500
FFC3h, FCC3H, CCP3H, Cz, FFC4h,FCC4h, CCp4h
08(-11)/07/19 AF3, F3, Cz, F4, AF4
P5 58 M 7
27-31/07/15
200 FC5, FC1, FC2, FC6, CP5, CP1, CP2, CP6
27-28/01/16
P6 37c M 8
29/05-01/06/17
500
FC5, FC6, C5, C6, Cz, T9, T10
02-03/06/17 FC5, FC6, C5, C6, Cz15-17/04/18
Cz, C1, C2
21-25/05/18
26-29/05/18 C2, Cz, C1, Fz, P4, Pz, P3
17-18/01/19 AF3, F3, F5, FC3, FC5, C5, C3, T7, CP5,CP3, CP1, C1, Fz, FCz, F4, Cz, FC4, C4,C2, CP2, CP4, CPz
11-13/02/19 FP1, Fz, F3, F7, FT9, FC5, FC1, C3, T7,TP9, CP5, CP1, Pz, P3, P7, O1, Oz, O2,P4, P8, TP10, CP6, CP2, Cz, C4, T8,FT10, FC6, FC2, F4, F8, Fp2
P7 56b F 7
14-17/11/16 250 FC3, FC4, FC5, FC6, Cz18,20-21/04/17 500 T9, T10, FC5, FC6, C5, C4, Cz
P9 33 F 6
12/06/17
500
F3, F4, C3, C4, Cz13/03/19 Cz, C3, C4, Fz, F3, F4, AF3, AF4
14/03/19 FFC3h, FCC3H, CCP3H, Cz, FFC4h,FCC4h, CCp4h
P10 25 M 5 29-30/06/17
500
C5, C6, FC5, FC6
09-10/07/18 Cz, C1, C2
a Sampling frequency in Hz.b Deceased in 2019.c Deceased in 2018.d Years since ALS.
52

5.2 Methods description
Figure 5.4: Experimental setup of the BCI-based communication with the CLIS patients. The EEG, EOG,as well as NIRS signals were acquired and pre-processed before extracting the features to classify theyes and no answers. The questions were provided in an audible manner. From [CMKB21] (CC BY 4.0).
5.2 Methods description
The following sections describe in more details the approach illustrated in Fig. 4.1. All analysisexcept stated otherwise were performed using MATLAB R2018b (Massachusetts, Texas, USA),the Fieldtrip toolbox [Oos+01] and custom written codes. Prior to any other processingand analysis, the data was re-referenced to the mean and band pass filtered at frequencies 0.5to 45 Hz using a third order Butterworth filter using the MATLAB commands butter andfiltfilt [Coh14]. The signal was subsequently partitioned into segments of 3-seconds lengthsliding 1-second at a time. Given the states of the patients, no artefacts removal were performedon the data.
5.2.1 Spectral analysis
A transformation of the signal from time into frequency domain can be done using Fouriertransformation [Dro06]. This does not change the signal, only its representation. For a timeseries x(t), the frequency representation is obtained by:
53

5 Data analysis
X( f ) =1T
T
∑t=1
x(t)ei2π f (t−1)/T (5.1)
where f is the set of discrete frequencies [− T2 , T
2 ] and T is the window length [BZ11]. TheFast Fourier algorithm is usually used to analyse a signal in the frequency domain. It outputscomplex values and to interpret them, it is common to employ the power spectrum of thesignal [Nie05]. Spectral analysis is commonly used to evaluate the different frequency bands (δ,θ, α, and β) of the EEG signal [Dro06]. High-frequency contents of a signal are often interpretedas a measure of rapid variation in the signal [NS05].
5.2.1.1 Relative power
For a signal x(t), the relative power of the δ (0.5-4 Hz), θ (4-8 Hz), α (8-12 Hz) and β (12-30 Hz)were calculated using Eq. 5.2 [BCP16; Wan+15].
RP =∑
f2f= f1
Sx( f )
∑fhf= fl
Sx( f )(5.2)
where: f1 and f2 specify respectively the lower and upper limits of the frequency band ofinterest. fl = 0 Hz and fh = 45 Hz (upper limit of the cut-off frequency during filtering) inthis particular case, and Sx( f ) is the power spectral density of the signal x(t) at the frequencyf [SM05]. A commonly used method to estimate Sx( f ) is based on the Fourier transform of thesignal x(t) [BZ11]:
Sx( f ) = limN→∞
X( f )X∗( f ) (5.3)
where X( f ) is the Fourier transform of the signal x(t) obtained from Eq. 5.1. Practically, thePSD was estimated using the MATLAB function pwelch with a Hamming window of 1/8 sizeof the data segment and a 50% overlap, using the Welch method [Wel67].
5.2.1.2 Spectral edge frequency
Spectral Edge Frequency (SEF) is a commonly used feature for sleep analysis and classification.It consists of computing the r-th percentile of the total power that was obtained from the powerspectral density [Nak+17]. In other words, it is the frequency below which a certain fractionof the signal power is contained. It is expressed as SEFr where r represents the fraction of thesignal power for which the edge frequency is calculated [IRV14; AMK09].
54
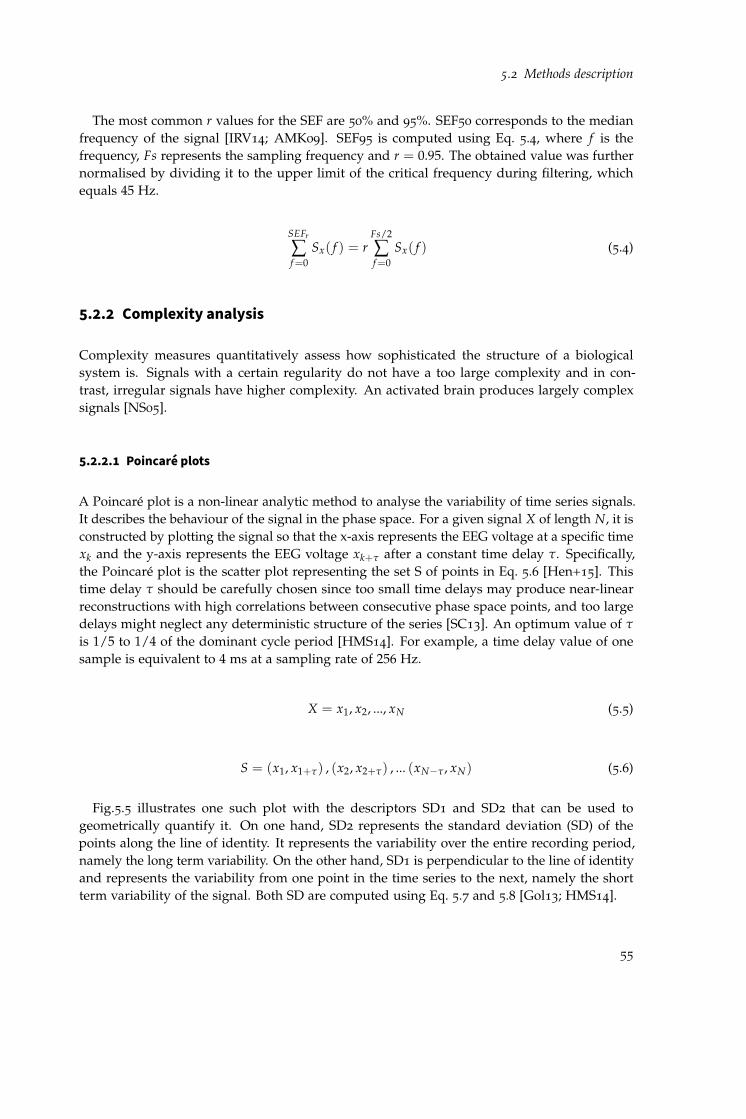
5.2 Methods description
The most common r values for the SEF are 50% and 95%. SEF50 corresponds to the medianfrequency of the signal [IRV14; AMK09]. SEF95 is computed using Eq. 5.4, where f is thefrequency, Fs represents the sampling frequency and r = 0.95. The obtained value was furthernormalised by dividing it to the upper limit of the critical frequency during filtering, whichequals 45 Hz.
SEFr
∑f=0
Sx( f ) = rFs/2
∑f=0
Sx( f ) (5.4)
5.2.2 Complexity analysis
Complexity measures quantitatively assess how sophisticated the structure of a biologicalsystem is. Signals with a certain regularity do not have a too large complexity and in con-trast, irregular signals have higher complexity. An activated brain produces largely complexsignals [NS05].
5.2.2.1 Poincaré plots
A Poincaré plot is a non-linear analytic method to analyse the variability of time series signals.It describes the behaviour of the signal in the phase space. For a given signal X of length N, it isconstructed by plotting the signal so that the x-axis represents the EEG voltage at a specific timexk and the y-axis represents the EEG voltage xk+τ after a constant time delay τ. Specifically,the Poincaré plot is the scatter plot representing the set S of points in Eq. 5.6 [Hen+15]. Thistime delay τ should be carefully chosen since too small time delays may produce near-linearreconstructions with high correlations between consecutive phase space points, and too largedelays might neglect any deterministic structure of the series [SC13]. An optimum value of τ
is 1/5 to 1/4 of the dominant cycle period [HMS14]. For example, a time delay value of onesample is equivalent to 4 ms at a sampling rate of 256 Hz.
X = x1, x2, ..., xN (5.5)
S = (x1, x1+τ) , (x2, x2+τ) , ... (xN−τ , xN) (5.6)
Fig.5.5 illustrates one such plot with the descriptors SD1 and SD2 that can be used togeometrically quantify it. On one hand, SD2 represents the standard deviation (SD) of thepoints along the line of identity. It represents the variability over the entire recording period,namely the long term variability. On the other hand, SD1 is perpendicular to the line of identityand represents the variability from one point in the time series to the next, namely the shortterm variability of the signal. Both SD are computed using Eq. 5.7 and 5.8 [Gol13; HMS14].
55

5 Data analysis
Figure 5.5: Poincaré plot showing the descriptors SD1 and SD2 with τ = 1. Statistically, SD2 and SD1
represent the standard deviation of the points from the long axis (line of identity) and the short axis(perpendicular to the line of identity) respectively. A round oval pattern of the plot represents a randomsignal, while an elongated shape represents signals with linear features.
SD1 =
√2
2SD(xn − xn+τ) (5.7)
SD2 =
√2SD(xn)2 − 1
2(xn − xn+τ)2 (5.8)
The SD1/SD2 ratio also known as Ellipsoid Radius Ratio (ERR) [Eag+18] can also be usedto evaluate signal randomness. A round oval pattern corresponds to a random signal, whilea more elongated shape represents signal with linear features [HMS14]. The values of SD1
and SD2 for all datasets were computed using the extended Poincaré plot algorithm developedin [Sat+19].
5.2.2.2 Lempel-Ziv complexity
This complexity measure developed by Abraham Lempel and Jacob Ziv [LZ76] evaluatesrepetitiveness in binary sequences. Before computing the LZC, the data should be transformedinto a binary sequence (see Fig. 5.6). An analytic signal is related to a real signal x(t) by:
xa(t) = x(t) + ixh(t) (5.9)
where xh(t) is the Hilbert transform of x(t) [BZ11].
56

5.2 Methods description
ai(t) = |xh(t)| (5.10)
bi(t) =
{0, if ai(t) ≤ mean(ai)
1, otherwise(5.11)
A binary vector bi : ...01010010001... is then obtained. For a given binary sequence S =
s1s2...sn of length n, LZC counts the number of distinct patterns in the data. Let c(n) be thecomplexity counter, which value increased by one unit every time a new sequence of charactersis encountered. In addition, let P and Q be two sub-sequences of S. At the beginning, P = S(1)and c(n) = 1. Q is then set to extract all sub-strings starting from position 1 (Q = S(2)) untilthe further possible to the right. Q can be thought as a delimiter. Every encountered newword is added to a dictionary if it did not occur before (c(n) = c(n) + 1). During the next step,P = S(2) and the same process as before is repeated. LZC is the number of different sub-stringsencountered as the binary sequence is streamed from the left to the right. The greater thedegree of randomness, the greater the number of different sub-sequences that will be present,thus the higher the Lempel-Ziv complexity [Sch+15; Abo+06].
(a) Raw EEG signal x(t) (b) abs(hilbert(x(t))) (c) Obtained binary signal
Figure 5.6: Signal binarisation for the computation of the Lempel-Ziv complexity. (a) Raw EEG signal. (b)Hilbert transformation of the signal. The binary values in (c) are obtained by using the mean of theabsolute value of the transformation as a threshold, and assigning 1 to values higher than the threshold,and 0 to lower values.
In practice, xh(t) is extracted from the analytic signal using the MATLAB function hilbert.The binary sequence is obtained by taking the mean of the absolute value of the Hilberttransform of the signal as a threshold, as expressed in Eq. 5.11 [Sch+15]. LZC is then computedon each binarised EEG data segment using the MATLAB toolbox calc_lz_complexity [TR15;BR15].
5.2.3 Connectivity analysis
Brain connectivity assesses the interaction between two brain regions or between signalsrecorded from two channels. The different brain regions communicate with one another duringmental tasks. Investigating this may shade some lights on the underlying brain processes.Generally, high connectivity values indicate high cooperation and more information sharing
57

5 Data analysis
between the two underlying brain regions or channels. The temporal coherence between theactivities of different brain areas is known as functional connectivity [SC13]. It represents thestatistical relationship between measures from both regions. Two connectivity measures wereutilised in this thesis: the iCOH and the wSMI.
5.2.3.1 Coherency
Coherency is a linear method that was designed to identify the relative timing of brain activitybetween two regions as well as their phase consistency [KSD09; Sak+16; Nol+04; BZ11]. Itis based on the Fourier analysis of the time series signal. The signal is transformed fromthe time domain to the frequency domain, allowing the separation of the amplitude from thephase information. The latter allows the computation of the phase delay, which can be usedto determine the temporal offset between the time series. An increased functional interactionbetween the underlying neuronal networks leads to a higher value of coherency [Sil05]. Atfrequency f , the coherency Cxy of two signals x and y is defined as the ratio:
Cxy( f ) =Sxy ( f )√
Sxx ( f ) · Syy ( f )(5.12)
where Sxy( f ) is the cross power spectral density of the signals obtained using Eq. 5.13 [BZ11],and Sxx( f ) and Syy( f ) are the auto power spectral density of x and y respectively [Pri81].
Sxy( f ) = limT→∞
1T
X( f , T)Y∗( f , T) (5.13)
where Y∗( f ) is the complex conjugate of Y( f ). Sxy( f ) is a complex value with a distinctmagnitude and a distinct phase, which represents the relative phase i.e. the average phasedifference between x and y [NS06]. Consequently, the coherency Cxy is a complex quantity:
Cxy( f ) = |Cxy( f )|eiφ (5.14)
|Cxy( f )| =√<(Cxy( f ))2 +=(Cxy( f ))2 (5.15)
φ = arg(Cxy) (5.16)
|Cxy( f )|2 is known as the magnitude-squared coherence or simply coherence. φ representsthe phase angle between x and y. A possible determination of the direction of informationflow can be inferred from the sign of the phase. Two independent EEG channels have arandom phase difference, in which case, the coherency is zero [Sak+16]. A deterministic signalyields a coherence value of one, since the amplitude and phase are fixed on every signalobservation [NS06].
58

5.2 Methods description
The electrical brain activity generated by one source spreads across the cortex. Hence, it canbe measured in many channels. This is called volume conduction. Volume conduction cancause false brain interaction to be detected. It is accepted that "an observed scalp potentialhave no time lag to the underlying source activity". Since the imaginary part of coherency isonly sensitive to two processes that are time-lagged to each other, it is not affected by volumeconduction. Consequently, using only the imaginary part of coherency =(Cxy( f )) solve thisvolume conduction problem [Nol+04]. In general, a positive value of the imaginary part ofthe coherence between x and y implies that they are interacting and that x precedes y. Thissuggests that information is flowing from x to y [Sak+16; Nol+04].
Since this study is concerned with the degree of relationship between two channels and notits direction, the absolute value |=(Cxy( f ))| of the imaginary coherence is employed. It is thencalculated between all pairs of recording channels using custom written MATLAB scripts. Thus,for each data segment, a connectivity matrix representing the coupling between all pairs ofchannels is obtained.
5.2.3.2 Weighted Symbolic Mutual Information (wSMI)
The wSMI is another method that evaluates the functional connectivity between signals fromtwo channels or brain regions. It can estimate both linear and non-linear relationships byevaluating the extent to which the two signals present non-random joint fluctuations thatsuggest sharing of information.
(a) Symbolic Transform (b) Non-linear coupling (c) Weights
Figure 5.7: weighted Symbolic Mutual Information. (a) The signal is transformed into a series of symbols.Symbol length k is equals to 3 in this case, which gives 3! = 6 possible symbols. (b) Non-linear couplingidentification by checking of increase or decrease in the signal. (c) The weights are assigned such thatit is 0 for symbols that are identical or of the opposite sign. Otherwise, its value is set to 1. Adaptedfrom [KSF13]. Copyright © 2013. Reproduced with permission from Elsevier.
First, the time series x and y are converted into sequences of discrete symbols (x, y) dependingon amplitudes trends of a specific predefined number k of consecutive time points separatedby a temporal separation of elements τ [LBMM15]. Using symbolisation of the data reducesthe sensitivity to measurement noise and increases the efficiency of numerical computations[KSF13]. In general, the symbols are constituted of k = 3 elements, leading to a total of 3! = 6different potential symbols (a, b, c, d, e, f ) [LBMM15] (cf. Fig. 5.7a). The value of τ is chosen ina way to sensitise wSMI to specific frequency ranges: wSMI is sensitive to higher frequency
59

5 Data analysis
bands when smaller values of τ are used [KSF13]. For instance, with τ = 4 ms, the analysiscaptures patterns of relatively high frequency. Although, with that value, it is impossible toestimate wSMI when the sampling frequency is 250 Hz or 125 Hz. The value of τ is determineddepending on the frequency of interest according to:
fmax =fs
k.τ(5.17)
where fmax is the maximum resolved frequency and fs is the sampling frequency [Imp+19;KSF13]. The wSMI value between two signals x and y is determined by computing the jointprobability of each pair of symbols co-occurring in the two time series using Eq. 5.18.
wSMI(x, y) =1
log(k!) ∑x∈X
∑y∈Y
w(x, y)p(x, y) log(
p(x, y)p(x)p(y)
)(5.18)
where p(x, y) is the joint probability of co-occurrence of symbol x and symbol y, p(x) and p(y)are the probabilities of those symbols in each respective signal.
The method checks symbolic patterns of increase or decrease in the signal in order to rapidlyand robustly evaluates the signal entropy, which in turn estimates non-linear couplings (cf.Fig. 5.7b). Moreover, on one hand, wSMI neglects co-occurrences of identical or opposite-signsymbols, which could likely come from common-source artefacts, by setting the weights w(x, y)in Eq. 5.18 to zero [KSF13]. This will eliminate volume conduction artefacts (cf. Fig. 5.7c).Furthermore, wSMI quickly decreased to zero as the distance between channels decreases giventhat the measure was designed to eliminate common source artefacts. On the other hand, itfavours non-trivial pairs of symbols. As a result, wSMI is less susceptible to traditional EEGartefacts [KSF13].
This approach was introduced in [KSF13] as a potential consciousness signature by measuringthe global information sharing across brain areas, under the hypothesis that “conscious contentthat we experience is defined by the global communication between distant cortical areas”.Essentially used in disorders of consciousness research, it successfully distinguished betweenpatients in UWS, MCS, and conscious healthy subjects. In the meanwhile, results from sleepresearch showed that significant levels of connectivity were observed in all electrodes duringwakefulness and that the highest values were detected in the posterior brain areas. In addition,the connectivity values were reduced during N3-sleep [Imp+19]. In [Roh+17], wSMI was furtherused to correctly diagnose a trauma patient that was initially diagnosed with UWS, to be in atotal locked-in state instead.
To reduce the computational cost during the analysis, the patients’ data were down-sampledfrom 500 Hz to 200 Hz when necessary. Subsequently, wSMI was computed using customwritten MATLAB scripts. Similarly to iCOHθ , a connectivity matrix is obtained for each datasegment.
60

5.2 Methods description
5.2.4 Consciousness level assessment
Based on the hypothesis presented in Section 4.2, the following features were extracted toevaluate the patient’s level of consciousness: relative powers in the θ and β bands, SEF95, ERR,LZC, iCOHθ , and wSMI in the θ band. The recordings were performed from different channelsfor the CLIS patients, but in general the channels were located in the central and frontal areas.Thereupon, the results obtained for each session were averaged over all channels or pairs ofchannels, leading to a feature vector of size n− by− p, where n represents the data samplesand p is the dimension of the feature vector. The average for iCOHθ and wSMI were obtainedby computing the mean of the lower part of the respective connectivity matrices without thediagonal. So that each feature has equal weight during the clustering analysis, the featurevector was normalised so that the values in each dimension range from 0 to 1.
The feature vector is in turn analysed using two soft-clustering approaches, namely the fuzzyc-mean clustering (FCM) and Gaussian Mixture Model (GMM) already introduced in Section 2.3.1.Soft-clustering gives a membership degree to each cluster. In this case, the goal is to separatethe features into two clusters corresponding to conscious and unconscious respectively. Theconsciousness level is determined as the value of the degree of membership of each datapoint to the cluster corresponding to a conscious state. The characteristics of this cluster aredetermined according to the hypothesis mentioned in Section 4.2.
On one hand, to implement the FCM clustering approach, the MATLAB function fcm wasapplied to the data with the specified parameters: N = 2 clusters, the fuzzifier parameter m wasset to 2 as recommended by previous research [Pet+13], the maximum number of iterations wasfixed at 1000 and the minimum improvement in objective function between two consecutiveiterations ε at 1e−5. The algorithm then returns N = 2 clusters centres for each dimension ofthe feature vector. On the other hand, the MATLAB function fitgmdist was used to fit GMMsto the data using the EM algorithm presented in Section 2.3.2.2 and the same parameters aswith the FCM clustering analysis. In addition, MATLAB posterior function of the Statisticsand Machine Learning Toolbox was used to estimate the component-membership posteriorprobabilities [SS12].
From an algorithmic point of view, FCM uses Euclidean distance to evaluate the distancebetween the objects and the cluster centres, which is more susceptible to outliers, while GMMrelies on Mahalanobis distance. Moreover, FCM assumes that the shape of the clusters aremore or less spherical with approximately the same size. This corresponds to a Gaussianmixture distribution with a single covariance matrix that is shared across all components, andis a multiple of the identity matrix. Furthermore, GMM is more flexible by allowing unequalvariance for the variables [Mat21].
Results obtained from both clustering methods are subsequently combined to get a consensusprobability. Several methods exist to undertake such task. However, most of them are onlyapplicable to hard clustering, and thus only produce binary results [Wan+13]. Soft-votingallows the use of different soft clustering results (also called based clustering results) obtainedfrom different clustering methods or from the same method using different parameters. In
61
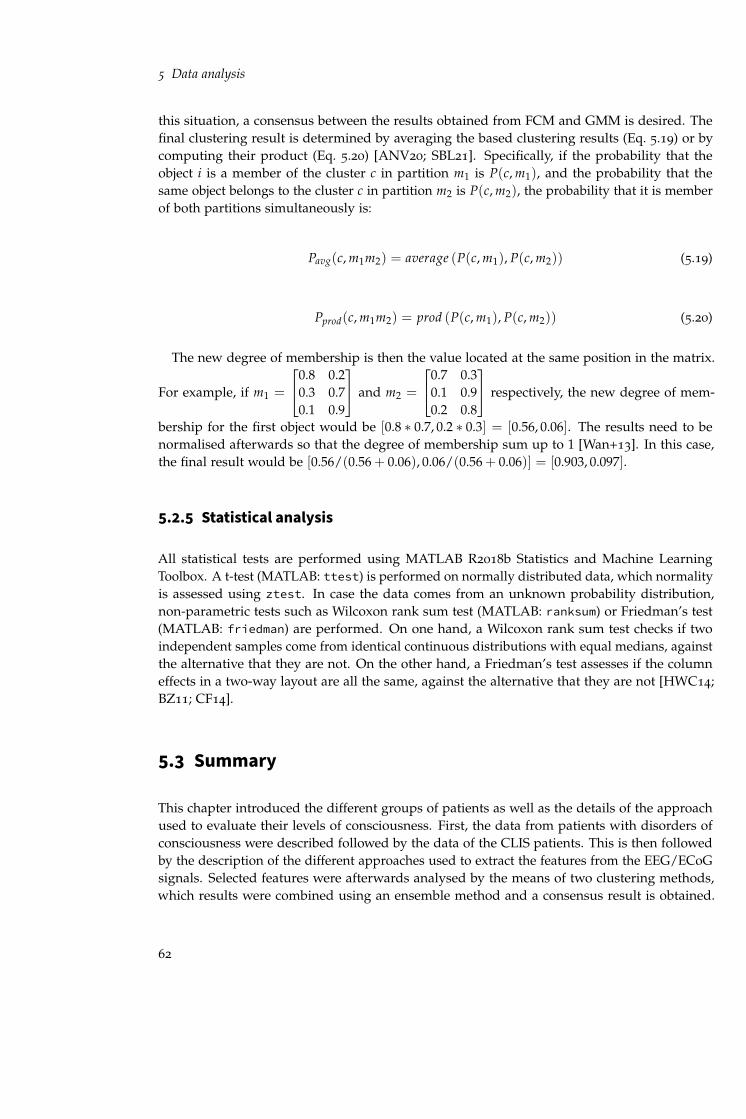
5 Data analysis
this situation, a consensus between the results obtained from FCM and GMM is desired. Thefinal clustering result is determined by averaging the based clustering results (Eq. 5.19) or bycomputing their product (Eq. 5.20) [ANV20; SBL21]. Specifically, if the probability that theobject i is a member of the cluster c in partition m1 is P(c, m1), and the probability that thesame object belongs to the cluster c in partition m2 is P(c, m2), the probability that it is memberof both partitions simultaneously is:
Pavg(c, m1m2) = average (P(c, m1), P(c, m2)) (5.19)
Pprod(c, m1m2) = prod (P(c, m1), P(c, m2)) (5.20)
The new degree of membership is then the value located at the same position in the matrix.
For example, if m1 =
0.8 0.20.3 0.70.1 0.9
and m2 =
0.7 0.30.1 0.90.2 0.8
respectively, the new degree of mem-
bership for the first object would be [0.8 ∗ 0.7, 0.2 ∗ 0.3] = [0.56, 0.06]. The results need to benormalised afterwards so that the degree of membership sum up to 1 [Wan+13]. In this case,the final result would be [0.56/(0.56 + 0.06), 0.06/(0.56 + 0.06)] = [0.903, 0.097].
5.2.5 Statistical analysis
All statistical tests are performed using MATLAB R2018b Statistics and Machine LearningToolbox. A t-test (MATLAB: ttest) is performed on normally distributed data, which normalityis assessed using ztest. In case the data comes from an unknown probability distribution,non-parametric tests such as Wilcoxon rank sum test (MATLAB: ranksum) or Friedman’s test(MATLAB: friedman) are performed. On one hand, a Wilcoxon rank sum test checks if twoindependent samples come from identical continuous distributions with equal medians, againstthe alternative that they are not. On the other hand, a Friedman’s test assesses if the columneffects in a two-way layout are all the same, against the alternative that they are not [HWC14;BZ11; CF14].
5.3 Summary
This chapter introduced the different groups of patients as well as the details of the approachused to evaluate their levels of consciousness. First, the data from patients with disorders ofconsciousness were described followed by the data of the CLIS patients. This is then followedby the description of the different approaches used to extract the features from the EEG/ECoGsignals. Selected features were afterwards analysed by the means of two clustering methods,which results were combined using an ensemble method and a consensus result is obtained.
62

5.3 Summary
The chapter ends with a comprehensive description of the clustering analysis as well as theparameters used to determine the clusters. The results of all analysis are presented in thefollowing chapter.
63

6 Results and discussions
The goal of this thesis is to evaluate the levels of consciousness of CLIS patients using EEG.To do so, several measures based on the signal frequency power, complexity and connectivitywere computed. Then the group of selected features were analysed using two cluster analysisalgorithms, and an estimation of consciousness level is output. The patients and methodsused to assess their levels of consciousness were introduced in Chapter 5. In this chapter,the corresponding results are presented and discussed. First, the results for the DoC patientsare presented, followed by those of CLIS patient GR. After evaluating the performance of thepresented approach on both datasets to show that it is working, it is finally applied to the EEGdata of the remaining CLIS patients.
6.1 Patients with disorders of consciousness
The approach is initially applied and evaluated with data recorded from patients with disordersof consciousness, which results will be presented first. The hypothesis being that since theirlevels of consciousness are relatively lower than that of CLIS patients, and that CLIS patientsbrain signals are comparable to that of healthy subjects.
Results from UWS patient L1 and MCS patient S7 in particular will be showcased in thefollowing subsection. As presented in Table 5.1, patient L1 is 21 years old and in a VS followinga TBI, with a CRS-R score of 6. The injury occurred 7 months prior the data recording. This isthe only patient which EEG features produced practically concurring results as will be shownin Section 6.1.1. In addition, patient L1 also possesses the most eyes scoring information (seeTable B.1 in Appendix B). Patient S7, on the other hand, is a 30 years old MCS patient, whichcondition also results from a TBI and with a CRS-R score of 13. At the time of the recording, 120
months have passed since the injury. This is the longest time since injury across all patients inthis group. Apart from that, patient S7 also exhibited the lowest centroid linkage distance24 inthe clustering results. The results for the rest of the DoC patients are presented in Appendix B.
24distance between two objects belonging to two different clusters, computed as the Euclidean distance.
65

6 Results and discussions
6.1.1 Results of individual measures
6.1.1.1 Spectral features
The spectral features consisted of the relative powers of θ and β bands, as well as the SEF95. Anincrease of θ power can be observed during drowsiness, but also during mental task, especiallywhen associated with an increase of β power [Nie05; BCP16; GIM18]. Consequently, conjoinedincreases of both frequency power suggest an increase of the consciousness level. On the otherhand, a value of SEF95 above 13 Hz is considered as definitely conscious [Ram+80; Tou+19].
Patient L1 Fig. 6.1 illustrates the relative powers of the β and θ bands averaged across allchannels for this patient. The shaded area between 21:26 and 07:10 represents the night time.
15:44 19:11 22:37 02:04 05:30 08:57 12:23 15:50
Time (HH:MM)
0
0.05
0.1
0.15
0.2
0.25
0.3
Rel
ativ
e po
wer
Patient L1 (25/06/2009)Average Relative power
21:2
6
07:1
0
3
-
Figure 6.1: Average relative power for UWS patient L1. Only the frequency bands of interest are presented:θ in blue and β in red. A simultaneous increase of power on both frequencies indicates an increasedconsciousness level, and vice versa. The shaded area between 21:26 and 07:10 represents the night time.
Some variations are observed during the course of the recording. For instance, there is aparticularly noticeable decrease of the powers of both θ and β between 20:15 and 21:11 (withan average value of 0.0797 and 0.0211 for θ and β respectively). This drop is more pronouncedbetween 21:50 and 22:50 with an average value of 0.0470 and 0.0126 respectively. Besides, theaverage values of the relative powers in both frequency bands are slightly higher before nighttime, with 0.1128 and 0.0479 respectively, versus 0.092 and 0.035 after night time. These valuessuggest that on one hand, the patient’s level of consciousness was higher before night time anddecreased during the night throughout the following day. On the other hand, they also implythat it was markedly reduces particularly between 20:15 and 22:50.
66

6.1 Patients with disorders of consciousness
Fig. 6.2 shows the average SEF95 for UWS patient L1. Similar to the relative powers, fluctua-tions are also observed throughout the recording. For example, SEF95 drops to less than 5 Hzbetween the same time frames as before: from 20:15 to 21:11 and from 21:50 to 22:50. This smallvalue means that 95% of the total power was attained in the δ band, which is mostly the caseduring deep sleep states. SEF95 values are also essentially below the θ band. Since that bandrepresents the frontier between consciousness and unconsciousness [SC13], this indicates thatthe patient was most likely unconscious during that time. Outside these time frames, the valuesare oscillating between 8 and 30 Hz, with a mean value of 18 Hz. This indicates that patientL1 was conscious most of the time but that his consciousness level was oscillating between lowand high. In other words, he was most likely slipping in and out of consciousness.
15:44 19:11 22:37 02:04 05:30 08:57 12:23 15:50
Time (HH:MM)
0
5
10
15
20
25
30
35
40
SE
F95
(H
z)
Patient L1 (25/06/2009)Average SEF95
21:2
6
07:1
0
Figure 6.2: Average SEF95 for UWS patient L1. SEF95 represents the frequency below which 95% of thesignal power is contained. Night time is represented by the shaded area between 21:26 and 07:10.
Generally speaking, the average values of the θ and β relative powers are higher during theday (0.0391 and 0.0977, respectively) compared to the night (0.0376 and 0.0942, respectively).A Wilcoxon rank sum test performed on the data revealed that the differences between nightand day are significant at a 5% significance level for both frequency bands. Hence, the levelof consciousness of the patient was significantly lower during the night. The correspondingp-values for all features can be found in Table B.18 of Appendix B. In the same manner as withthe relative power, night and day values of the SEF95 also differ between night and day witha mean value of 12.42 Hz versus 19.31 Hz respectively. A Wilcoxon rank sum test indicatesthat these differences are also significant with a p < 0.05. These values imply, equally aswith the relative power, that the patient was definitely conscious during daytime and that hisconsciousness level was lower at night.
67

6 Results and discussions
Patient S7 The relative powers of θ and β bands for patient S7 are illustrated in Fig. 6.3. Nighttime started at 23:00 and ended at 05:00 (shaded area in the figure). Relative β power increasesbetween 22:25 and 00:30 with a mean value of 0.2035 and is higher than θ (mean = 0.1592). Thesame trend is also observed right before 08:00, after 10:16, and around 17:23. This surge of β
power indicates an increased brain activity, signifying an heightened consciousness level duringthose times. Contrarily, a simultaneous decrease of both relative powers is observed from 02:48
to 02:59 with a mean value of 0.1210 for θ and of 0.0719 for the β band. This is also the casefrom 03:59 until 04:15 with mean values of 0.1120 for θ and 0.0915 for β.
19:48 22:30 01:12 03:54 06:36 09:18 11:59 14:41 17:23 20:05
Time (HH:MM)
0
0.05
0.1
0.15
0.2
0.25
0.3
0.35
0.4
Rel
ativ
e po
wer
Patient S7 (21/07/2010)Average Relative power
23:0
0
05:0
0
21-J
ul-2
010
19:4
8:07
22-J
ul-2
010
08:0
3:46
22-J
ul-2
010
10:1
6:42
22-J
ul-2
010
18:1
9:39
22-J
ul-2
010
19:2
4:01
22-J
ul-2
010
20:0
5:55
3
-
Figure 6.3: Average relative power for MCS patient S7. Only the frequencies of interest are presented:θ in blue and β in red. A simultaneous increase of power on both frequencies indicate an increasedconsciousness level, and vice versa. Night time is represented by the shaded area between 23:00 and05:00. The blank areas represent times when no data were recorded.
Likewise, the overall SEF95 for patient S7 is above the β band as illustrated in Fig. 6.4. At thebeginning of the recording, more precisely from 19:48 to 22:30, the value of the edge frequencyis 25.15 Hz. This value further increases to an average of 30.04 Hz between 22:30 and 00:30.Thus, 95% of the EEG power was attained in the β bands. Consequently, the patient wascertainly conscious during these moments. On the other hand, in some short time segments nolonger than 10 minutes, the SEF95 lies in the α or θ bands. This occurs for instance between02:52 and 02:58 with a mean value of 9.94 Hz, and between 04:03 and 04:11 with 5.92 Hz. Theselow values imply that the patient was surely unconscious during these time frames. Theseobservations are analogous to the results obtained from the relative power. All of this suggeststhat, on one hand the patient was mostly conscious given that 95% of the signal power wereonly achievable above 20 Hz. On the other hand, he was definitely unconscious on short timeframes, specifically between 02:52 and 02:58 as well as from 04:03 to 04:11.
68
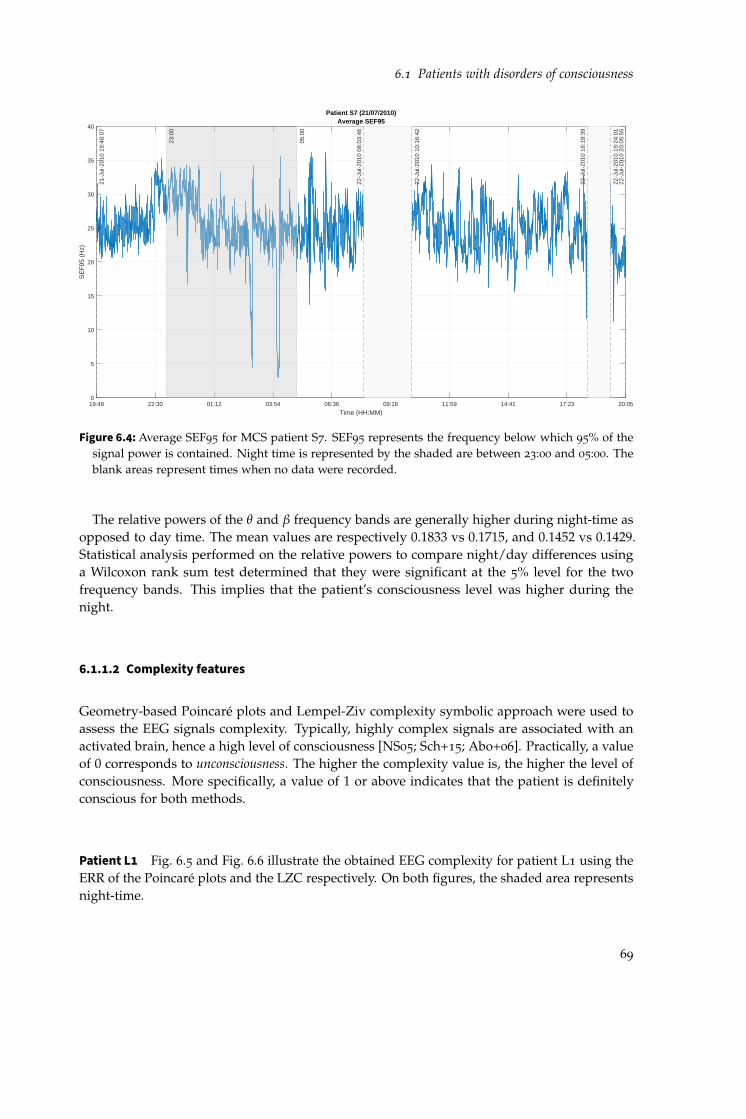
6.1 Patients with disorders of consciousness
19:48 22:30 01:12 03:54 06:36 09:18 11:59 14:41 17:23 20:05
Time (HH:MM)
0
5
10
15
20
25
30
35
40
SE
F95
(H
z)
Patient S7 (21/07/2010)Average SEF95
23:0
0
05:0
0
21-J
ul-2
010
19:4
8:07
22-J
ul-2
010
08:0
3:46
22-J
ul-2
010
10:1
6:42
22-J
ul-2
010
18:1
9:39
22-J
ul-2
010
19:2
4:01
22-J
ul-2
010
20:0
5:55
Figure 6.4: Average SEF95 for MCS patient S7. SEF95 represents the frequency below which 95% of thesignal power is contained. Night time is represented by the shaded are between 23:00 and 05:00. Theblank areas represent times when no data were recorded.
The relative powers of the θ and β frequency bands are generally higher during night-time asopposed to day time. The mean values are respectively 0.1833 vs 0.1715, and 0.1452 vs 0.1429.Statistical analysis performed on the relative powers to compare night/day differences usinga Wilcoxon rank sum test determined that they were significant at the 5% level for the twofrequency bands. This implies that the patient’s consciousness level was higher during thenight.
6.1.1.2 Complexity features
Geometry-based Poincaré plots and Lempel-Ziv complexity symbolic approach were used toassess the EEG signals complexity. Typically, highly complex signals are associated with anactivated brain, hence a high level of consciousness [NS05; Sch+15; Abo+06]. Practically, a valueof 0 corresponds to unconsciousness. The higher the complexity value is, the higher the level ofconsciousness. More specifically, a value of 1 or above indicates that the patient is definitelyconscious for both methods.
Patient L1 Fig. 6.5 and Fig. 6.6 illustrate the obtained EEG complexity for patient L1 using theERR of the Poincaré plots and the LZC respectively. On both figures, the shaded area representsnight-time.
69

6 Results and discussions
15:44 19:11 22:37 02:04 05:30 08:57 12:23 15:50
Time (HH:MM)
0
0.2
0.4
0.6
0.8
1
1.2
1.4
Poi
ncar
é E
RR
Patient L1 (25/06/2009)Average Poincaré ERR
21:2
6
07:1
0
Figure 6.5: Average ERR of the Poincaré plots with τ = 2 data points for UWS patient L1. A value of 0means definitely unconscious. The larger the value, the higher the level of consciousness. Night time isrepresented by the shaded area between 21:26 and at 07:10.
On one hand, the values of the ERR are low, especially before 05:55, and increase afterwardswith an average value of 0.7877. In addition, the persistent low values (mean = 0.45) between20:20 and 21:21 as well as from 21:44 to 23:00 (mean = 0.42) suggest a reduced consciousnesslevel, and fit the observations in Figs. 6.1 and 6.2 of the relative powers and the SEF95 respec-tively. The mean values of ERR before, during and after night time are respectively 0.5613,0.5368 and 0.7936. The first two values are approximately equivalent but comparatively lessthan the mean value after night time. One may conclude then that the level of consciousness ismuch higher the second day of recording.
On the other hand, the highest values of the averaged Lempel-Ziv complexity were detectedprior night time. Moreover, a decreasing trend is noted from the start to the end of therecording, except between 20:00 and 23:00 (mean = 0.62). These distinguishable drops in valuesare consistent with previously presented results. The mean values of LZC before, during andafter night time (from 21:26 to 07:10) are respectively 1.024, 0.8699, and 0.8669. This latter isindeed low compared to the value before night time, but it is high enough to still indicate amoderate level of consciousness.
In both cases, the average EEG signal complexity of the patient during the day was higher(0.7014 for ERR and 0.9291 for LZC) than during the night (0.5368 for ERR and 0.8699 for LZC).Wilcoxon rank sum tests applied to the values of ERR and LZC during both times showed asignificant difference at the 5% level for both complexity measures.
70

6.1 Patients with disorders of consciousness
15:44 19:11 22:37 02:04 05:30 08:57 12:23 15:50
Time (HH:MM)
0
0.2
0.4
0.6
0.8
1
1.2
1.4
1.6
Lem
pel-Z
iv c
ompl
exity
Patient L1 (25/06/2009)Average LZC
21:2
6
07:1
0Figure 6.6: Average LZC for UWS patient L1. A value of 0 means definitely unconscious. The larger the
value, the higher the level of consciousness. Night time is represented by the shaded area between21:26 and 07:10.
Patient S7 The average ERR of the Poincaré plots for this patient is illustrated in Fig. 6.7.Three notable intervals featuring surge of the ERR values were observed, namely from 22:30
and 00:40 (mean = 0.4752), between 05:30 and 07:55 (mean = 0.5638), and from 15:08 to 16:50
(mean = 0.6385). Those values are considerably higher than the ERR value before 22:30, whichamounts to 0.4390. From these values, it can be concluded that the patient was at least in amoderate level of consciousness during the night, but also between 10:16 and 15:08. Apart fromthis time frame and during the day, the values of the ERR suggest a higher consciousness level,meaning that the patient was plausibly conscious.
Fig. 6.8 illustrates the LZC during the course of the recording. The lowest values are observedat the beginning of the recording, from 19:48 to 22:30 with a mean value of 1.0183. An increasingtrend is afterwards detected throughout the night until day time at around 06:12. The LZCslightly decreases starting at 10:16, but ultimately its value increases starting at 15:08. Finally,its value drops in the last part of the recording beginning at 19:24.
It was determined that in average, the values of ERR were lower during the night comparedto daytime (0.6291 vs 0.6483) for patient S7. However, a Wilcoxon rank sum test indicated thatthese differences were not statistically significant with p = 0.88793. Contrarily, the values ofLZC during day and night-time differ significantly, with an average value of 1.4438 and 1.264respectively (p < 0.05).
71

6 Results and discussions
19:48 22:30 01:12 03:54 06:36 09:18 11:59 14:41 17:23 20:05
Time (HH:MM)
0
0.2
0.4
0.6
0.8
1
1.2
1.4
Poi
ncar
é E
RR
Patient S7 (21/07/2010)Average Poincaré ERR
23:0
0
05:0
0
21-J
ul-2
010
19:4
8:07
22-J
ul-2
010
08:0
3:46
22-J
ul-2
010
10:1
6:42
22-J
ul-2
010
18:1
9:39
22-J
ul-2
010
19:2
4:01
22-J
ul-2
010
20:0
5:55
Figure 6.7: Average ERR of the Poincaré plots with τ = 2 data points for MCS patient S7. A value of 0means definitely unconscious. The larger the value, the higher the level of consciousness. The shadedare between 23:00 and 05:00 represents the night time. The blank areas represent times when no datawere recorded.
19:48 22:30 01:12 03:54 06:36 09:18 11:59 14:41 17:23 20:05
Time (HH:MM)
0
0.5
1
1.5
2
2.5
3
Lem
pel-Z
iv c
ompl
exity
Patient S7 (21/07/2010)Average LZC
23:0
0
05:0
0
21-J
ul-2
010
19:4
8:07
22-J
ul-2
010
08:0
3:46
22-J
ul-2
010
10:1
6:42
22-J
ul-2
010
18:1
9:39
22-J
ul-2
010
19:2
4:01
22-J
ul-2
010
20:0
5:55
Figure 6.8: Average LZC for MCS patient S7. A value of 0 means definitely unconscious. The larger thevalue, the higher the level of consciousness. Night time is represented by the shaded areas between23:00 and 05:00. The blank areas represent times when no data were recorded.
72

6.1 Patients with disorders of consciousness
6.1.1.3 Connectivity measures
Connectivity measures determine the association between brain regions or channels [KSD09;Sak+16]. On one hand, linear connections between two entities can be determined using theiCOH. On the other hand, both linear and non-linear relationships can be identified withthe wSMI measure. Both methods neglect the effects of the volume conduction in the brain,allowing the avoidance of false connectivity in the results [Nol+04]. The connectivity wascomputed between all pairs of channels and then averaged across all of them. Connectivity inthe θ band was specifically computed with both methods given the role of this frequency bandin working memory and mental task [Bor+13].
Patient L1 Looking into Fig. 6.9 that illustrates the variation of the averaged imaginary partof θ coherence for patient L1, no distinguishable variations like in the case of the previousfeatures are observed. There is however a slight increase between 19:00 and the start of nighttime at 21:26 (mean = 0.058). The average wSMI with τ = 16 ms for this patient is shownin Fig. 6.10. This temporal lag corresponds to the θ frequency band. An apparent decreasebetween 20:10 and 23:45 is observed, with a mean value of 0.0488. This indicates that patientL1 was probably unconscious during that time frame, comparable to the results obtained fromthe frequency-based features.
15:44 19:11 22:37 02:04 05:30 08:57 12:23 15:50
Time (HH:MM)
0
0.05
0.1
0.15
0.2
0.25
0.3
0.35
Imag
inar
y 3 c
oher
ence
Patient L1 (25/06/2009)Average iCOH
3
21:2
6
07:1
0
Figure 6.9: Average iCOH in the θ band for UWS patient L1. An increased iCOH value in the θ bandimplies a higher consciousness level, and vice versa. The shaded area between 21:26 and 07:10 representsthe night time.
The two connectivity measures give conflicting results regarding the average value duringthe day compared to the night. On one hand, iCOHθ values are larger during night-time with
73

6 Results and discussions
15:44 19:11 22:37 02:04 05:30 08:57 12:23 15:50
Time (HH:MM)
0
0.01
0.02
0.03
0.04
0.05
0.06
0.07
0.08
0.09
wS
MI
Patient L1 (25/06/2009)Average wSMI16
21:2
6
07:1
0
Figure 6.10: weighted Symbolic Mutual Information with τ = 16ms for patient L1 (UWS). An increasedwSMI with this value of τ imply a higher consciousness level, and vice versa. The shaded are between21:26 and 07:10 represents the night time.
a mean of 0.0577 as opposed to 0.0483 during daytime. In contrast, wSMI values are lowerat night with a mean of 0.0557; its mean value during the day is 0.0682. Wilcoxon rank sumtests applied to each case determined that: first, the differences of iCOHθ were not significant(p = 0.5496) and second, they were statistically significant in the case of wSMI at 5% significancelevel. A decrease in overall brain connectivity is considered a reduced consciousness level andvice versa.
Patient S7 Fig. 6.12 displays the wSMI averaged across all channels for MCS patient S7.Between the start of the recording and 22:20, the mean wSMI connectivity value attains 0.0395.It decreases to 0.0363 between 22:20 and 00:05, and also after 06:00 up until 08:03 droping to0.0329. This indicates a decrease of the level of consciousness, relative to the time outside thistime interval. On the other hand, the last part of the recording starting at 19:34 exhibits alarger connectivity than during 10:16-18:19, with a mean value of 0.0380, suggesting a higherconsciousness level in the last part of the recording. These results are in contradiction to thosefound previously and illustrated in Figs. 6.3, 6.4, 6.7 and 6.8.
Night versus day connectivity values are different for this patient. No changes can be visuallyobserved from Fig. 6.11, which shows the averaged iCOHθ for said patient. Its mean value is0.0614 during the night as opposed to 0.0621 during the day. An additional Wilcoxon rank sumtest performed to assess the night versus day differences indicate that they were no significantvariation (p = 0.6064) although the consciousness level of the patient was higher during theday. Mean wSMI values, on the other hand, are higher during the night with a mean value
74

6.1 Patients with disorders of consciousness
19:48 22:30 01:12 03:54 06:36 09:18 11:59 14:41 17:23 20:05
Time (HH:MM)
0
0.05
0.1
0.15
0.2
0.25
Imag
inar
y 3 c
oher
ence
Patient S7 (21/07/2010)Average iCOH
3
23:0
0
05:0
0
21-J
ul-2
010
19:4
8:07
22-J
ul-2
010
08:0
3:46
22-J
ul-2
010
10:1
6:42
22-J
ul-2
010
18:1
9:39
22-J
ul-2
010
19:2
4:01
22-J
ul-2
010
20:0
5:55
Figure 6.11: Average iCOHθ for MCS patient S7. An increased iCOH value in the theta band implies ahigher consciousness level, and vice versa. The shaded area between 23:00 and 05:00 represents thenight time. The blank areas represent times when no data were recorded.
19:48 22:30 01:12 03:54 06:36 09:18 11:59 14:41 17:23 20:05
Time (HH:MM)
0.025
0.03
0.035
0.04
0.045
0.05
wS
MI
Patient S7 (21/07/2010)Average wSMI16
23:0
0
05:0
0
21-J
ul-2
010
19:4
8:07
22-J
ul-2
010
08:0
3:46
22-J
ul-2
010
10:1
6:42
22-J
ul-2
010
18:1
9:39
22-J
ul-2
010
19:2
4:01
22-J
ul-2
010
20:0
5:55
Figure 6.12: weighted Symbolic Mutual Information with τ = 16ms for MCS patient S7. An increasedwSMI with this value of τ implies a higher consciousness level, and vice versa. The shaded area between23:00 and 05:00 represents the night time. The blank areas represent times when no data were recorded.
75

6 Results and discussions
of 0.0387. The mean value during the day amounts to 0.0368. The night/day differences arestatistically significant at p < 0.05 according to a Wilcoxon rank sum test.
6.1.1.4 Inferences from individual features
This part recapitulates the results obtained in the previous section of the individual features forpatients L1 (UWS) and S7 (MCS). Patient L1’s results were among the best in terms of clusteringanalysis outcomes, while those of patient S7 were not so good.
Patient L1 All features gave comparable results, i.e. their values increased or decreased duringroughly the same time frames. As outlined in Section 4.2, higher values of each specific featurecorresponds to conscious state, and vice versa. Therefore, it can be deduced that the patientwas certainly unconscious between 20:15 and 21:11 up to 23:00 given the drop observed inall features during that time interval. On the other hand, the values of the features before20:15 and also during daytime the next day were higher than the remaining of the recording,except for ERR. Therefore, patient L1 was certainly conscious especially from 19:48 until 20:15,and after 07:10. The values of the different features during night time are varying greatly, butoverall they are lower during night-time. Wilcoxon ranksum tests revealed that, except foriCOH, the difference between these two time periods are significant at the 5% significance level.This suggests that the patient’s consciousness level is significantly lower during the night. Thisinstance exemplifies the perfect case in which all results are mostly consistent with one another.
Patient S7 In most cases, the outcomes of the distinctive signal characteristics may diverge.For example, for this patient, results obtained from the spectral features and the complexitymeasures are similar, but are differing from those of the connectivity measures. When anincrease is observed on the former group, a decrease is detected in the latter, and inversely.For example, while an increase of the θ and β relative powers, SEF95, and ERR was observedbetween 22:25 and 00:40, LZC and wSMI values were dropping. Applying a simple majorityvote, it can be deduced that, on one hand, the consciousness levels of patient S7 heightenedparticularly between 22:25 and 00:30, 05:00 and 08:00, and between 15:00 and 16:00. On theother hand, values of all features except iCOHθ and wSMI decreased between 02:48 and 03:00
as well as between 03:59 and 04:15. The low values suggest a reduction of the consciousnesslevel to the point of unconsciousness. Overall and except for these short time intervals, thevalues of the features were high, implying that the patient was certainly conscious the wholetime. Furthermore, daytime mean complexity values (ERR and LZC) along with iCOHθ valueswere higher than during night time. However, the differences were significant only for LZC.The values were significantly smaller during the day for the other features.
76

6.1 Patients with disorders of consciousness
6.1.2 Consciousness level assessment
Now that the results of the different features are obtained, they are analysed by the means oftwo different clustering approaches: fuzzy c-means (FCM) and Gaussian mixture models (GMM)that were introduced in Section 2.3.2. These soft-clustering methods are used in particularsince the goal in the present work is to infer patients’ states using the selected features atany given time with the maximum certainty, and these methods allow that. The membershipvalue to the cluster corresponding to consciousness is considered as an assessment of the levelof consciousness of the patient and is determined according to the hypothesis mentioned inSection 4.2. Afterwards, an ensemble approach is used to deduce the level of consciousness bycombining results from the two clustering methods.
6.1.2.1 Patient L1
The two clusters obtained from the clustering analysis are labelled Cluster 1 and Cluster 2. Thevalues of their centres are summarised in Table 6.1. The cells in blue represent the value thatidentifies with the higher level of consciousness for each feature. The cluster corresponding tothe conscious state is the one containing the most features that verifies the conditions reported inSection 4.2. Essentially, higher values correspond to higher levels of consciousness. Therefore,Cluster 1 contains the data points corresponding to conscious states. Table 6.1 also reveals thatresults from all features correspond, i.e. all "high" values are in the same cluster (Cluster 1).
Table 6.1: Clusters centroids for UWS patient L1. Values displayed here are the real values reconvertedfrom the normalised values. Cluster 1 represents the first cluster and Cluster 2 represents the secondone. For each feature, the higher centroid value is highlighted in blue. The cluster corresponding to aconscious state is the one with the most cells in blue. So, for both cases, it is Cluster 1.
Real values
L1
Cluster 1 Cluster 2 Cluster 1 Cluster 2Ptheta 0,1107 0,0820 0,1111 0,0764Pbeta 0,0531 0,0236 0,0507 0,0200SEF95 24,64 10,63 23,69 8,82ERR 0,7331 0,5328 0,7237 0,5079LZC 1,0226 0,7878 1,0113 0,7536iCOHtheta 0,0504 0,0500 0,0516 0,0498wSMI 0,0676 0,0623 0,0674 0,0616
L3
Cluster 1 Cluster 2 Cluster 1 Cluster 2Ptheta 0,1234 0,2418 0,2243 0,1132Pbeta 0,0112 0,0409 0,0382 0,0071SEF95 6,1560 11,6325 11,4705 5,1300ERR 0,5345 0,9378 0,8764 0,5032LZC 1,0259 1,1774 1,1847 0,9907iCOHtheta 0,0631 0,0634 0,0639 0,0646wSMI 0,0377 0,0370 0,0646 0,0373
L13
Cluster 1 Cluster 2 Cluster 1 Cluster 2Ptheta 0,1016 0,1022 0,1486 0,0708Pbeta 0,0085 0,0085 0,0136 0,0051SEF95 5,4990 5,517 7,3305 4,2930ERR 0,3639 0,3637 0,3838 0,3504LZC 0,7742 0,7729 0,8229 0,7408iCOHtheta 0,0649 0.0655 0,0676 0,0636wSMI 0,0473 0,0473 0,0489 0,0462
S12
Cluster 1 Cluster 2 Cluster 1 Cluster 2Ptheta 0,4075 0,2682 0,4163 0,2790Pbeta 0,0611 0,1367 0,0591 0,1159SEF95 14,1705 32,2515 13,5405 28,0125ERR 0,5845 1,8422 0,4762 1,792
Real values
Real values
Real values
Real values
FeaturesFCM GMM
FeaturesFCM GMM
FeaturesFCM GMM
FeaturesFCM GMM
The assessment of the centroids values indicates a high level of consciousness for Cluster 1compared to Cluster 2 in both clustering cases. For instance, for FCM, the SEF95 values arecentred at 24.64 Hz that is in the β band. Signal complexity were also high: the ERR is 0.7331,and LZC is above 1. The connectivity values are also significant. In Cluster 2, SEF95 values arecentred around 10.63 Hz, right in the middle of the α band. The complexity values are low,amounting to 0.5328 and 0.7878 respectively for ERR and LZC.
77

6 Results and discussions
Furthermore, the overall inter-clusters differences, computed on the normalised values of thefeatures, are significant, 0.4809 for FCM and 0.5177 for GMM. Large values of inter-clustersdifference suggest that the clusters are well separated, i.e. as far away from each other aspossible [KC16; MP00]. Figs. 6.13 and 6.14 illustrate the inter-clusters distance between LZCand SEF95, as well as between wSMI and iCOHθ for patient L1. In an ideal case, the lowerleft corner of the plot would gather the data points corresponding to unconscious states, whilethe upper right corner will contain those identifying conscious states. Additionally, the pointsin-between will have increasing values of consciousness levels.
0 0.2 0.4 0.6 0.8 1
SEF95
0.2
0.4
0.6
0.8
1
1.2
1.4
1.6
LZC
Patient L1
0
0.1
0.2
0.3
0.4
0.5
0.6
0.7
0.8
0.9
1
Est
imat
ed c
onsc
ious
ness
leve
l
(a)
0 0.05 0.1 0.15 0.2 0.25 0.3 0.35
iCOH3
0.03
0.04
0.05
0.06
0.07
0.08
0.09
wS
MI1
6
Patient L1
0
0.1
0.2
0.3
0.4
0.5
0.6
0.7
0.8
0.9
1
Est
imat
ed c
onsc
ious
ness
leve
l
(b)
Figure 6.13: FCM clusters plots for UWS patient L1 for the pair of features displaying (a) the highest and(b) the lowest centroid linkage distance. The barplot on the right side of each figure represents thedegree of membership to the conscious cluster. 0: unconscious, 1: conscious.
On one hand, SEF95 exhibits the largest inter-clusters distance with the other features,especially with LZC for both clustering approaches with dFCM(SEF95, LZC) = 0.4024, anddGMM(SEF95, LZC) = 0.4302. Figs. 6.13a and 6.14a respectively illustrate these cases. Asmooth transition between unconscious and conscious states is observed, i.e. the degree ofmembership of the objects progresses evenly from low (in blue) to high (in red) as one movesfrom the bottom left to the top right of the figure. This validates the hypothesis presented inSection 2.2 regarding the values of these features relative to the level of consciousness. On theother hand, both connectivity measures show the smallest centroid linkage distance, exceptwith SEF95 as previously stated. Figs. 6.13b and 6.14b illustrate the clustering results of wSMIand iCOHθ that displayed the lowest inter-cluster differences: dFCM(wSMI, iCOH) = 0.095 anddGMM(wSMI, iCOH) = 0.1060. As opposed to the previous case, data points with differentdegree of membership values to the conscious cluster are intermingled. The lower part of thefigures mostly contain objects with low degree of membership, as it should be. However, theupper part contain objects with different degrees of membership values.
From these results, it can be concluded that LZC and SEF95 constitute the best features forpatient L1, while both connectivity measures, wSMI and iCOHθ , yield non-distinguishableclusters for both clustering analysis methods.
78

6.1 Patients with disorders of consciousness
0 0.2 0.4 0.6 0.8 1
SEF95
0.2
0.4
0.6
0.8
1
1.2
1.4
1.6
LZC
Patient L1
0
0.1
0.2
0.3
0.4
0.5
0.6
0.7
0.8
0.9
1
Est
imat
ed c
onsc
ious
ness
leve
l(a)
0 0.05 0.1 0.15 0.2 0.25 0.3 0.35
iCOH3
0.03
0.04
0.05
0.06
0.07
0.08
0.09
wS
MI1
6
Patient L1
0
0.1
0.2
0.3
0.4
0.5
0.6
0.7
0.8
0.9
1
Est
imat
ed c
onsc
ious
ness
leve
l
(b)
Figure 6.14: GMM clusters plots for UWS patient L1 for the pair of features displaying (a) the highestand (b) the lowest centroid linkage distance. The barplot on the right side of each figure represents thedegree of membership to the conscious cluster. 0: unconscious, 1: conscious.
Fig. 6.15 illustrates the estimated consciousness level (alias the degree of membership to theconscious cluster) obtained from both clustering methods for patient L1. The values range from0 (unconscious) to 1 (conscious). Figs. 6.15a and 6.15b display the results of FCM and GMMclustering analysis respectively. As opposed to the estimated consciousness levels obtained withGMM that covers the entire [0, 1] interval, its values for FCM rarely attain the lower or the upperlimit. Distinctive low values of the degree of membership are observed between 20:15 and 23:00,indicating extremely low levels of consciousness. The patient was undoubtedly unconscious inmost of that time, except during the sharp increase around 21:26. In addition, the degree ofmembership is predominantly high before 20:15 and after 07:10, with values close to or equalto 1. This implies that the patient was certainly conscious. Additionally, intermittent phases oflow consciousness level are detected after 23:00 until 07:10. These estimations are confirmedby the inferences made from the values of the individual features based on frequency, signalcomplexity and connectivity in Section 6.1.1.4. Definite low values are also observed between06:00 and 06:25, and from 11:25 to 12:23. This reflects the trend observed in the same time frameof the relative powers, the SEF95, the ERR, the LZC, and more clearly with the wSMI. Resultsobtained from GMM appear notably drastic as opposed to that of FCM, as already mentionedpreviously.
Fig. 6.15e shows the eyes scoring of the patient. O represents open eyes and C denotes closedeyes. When the patient’s eyes are intermittently open and closed, it was scored O/C. Someof the scoring were not available due to some technical or visibility problems and were thuslabelled as NA/nv [Wie+18]. Moreover, blank areas in the figure represent times when it wasunavailable. At first glance, high levels of consciousness obtained with the presented approachseem to coincide with open eyes, while eyes closed correspond to low levels of consciousness.
Table 6.2 recapitulates the results of the Spearman correlation analysis between all the featuresand the obtained levels of consciousness using FCM and GMM. The values of the coefficients
79

6 Results and discussions
15:44 19:11 22:37 02:04 05:30 08:57 12:23 15:50
0
0.2
0.4
0.6
0.8
1
Est
imat
ed c
onsc
ious
ness
leve
l
Patient L1
21:2
6
07:1
0
(a) Fuzzy c-means
15:44 19:11 22:37 02:04 05:30 08:57 12:23 15:50
0
0.2
0.4
0.6
0.8
1
Est
imat
ed c
onsc
ious
ness
leve
l
21:2
6
07:1
0
(b) Gaussian Mixture Model
15:44 19:11 22:37 02:04 05:30 08:57 12:23 15:50
0
0.2
0.4
0.6
0.8
1
Est
imat
ed c
onsc
ious
ness
leve
l 21:2
6
07:1
0
(c) Product ensemble
15:44 19:11 22:37 02:04 05:30 08:57 12:23 15:50
0
0.2
0.4
0.6
0.8
1
Est
imat
ed c
onsc
ious
ness
leve
l 21:2
6
07:1
0
(d) Average ensemble
15:44 17:14 18:44 21:26 22:56 00:26 01:56 03:26 07:10 08:40 10:10 11:40 13:10 14:40Time (HH:MM)
NA/nv
C
O/C
O
Eye
s sc
orin
g
(e) Eyes scoring
Figure 6.15: Estimated consciousness level for UWS patient L1 using (a) FCM, (b) GMM, (c) productensemble, and (d) average ensemble of FCM and GMM. The closer to 1 the curve is, the higher theprobability that the patient is conscious, and inversely. The blank areas in (e) represent the time framesduring which no eyes scoring were recorded. O: eyes open, C: eyes closed, Na/nv: scoring unavailabledue to some technical problems. Shaded areas between 21:26 and 07:10 delimit the night time.
80

6.1 Patients with disorders of consciousness
range from −1 to +1, with 0 meaning that no association exists [SBS18]. For this specificpatient, all features are highly and positively correlated with the obtained estimations of theconsciousness level, except for the iCOHθ . Consequently, its values only slightly influencethe final result. The largest centroid linkage distance was obtained for the pair SEF95,andLZC, while the lowest was for wSMI and iCOHθ . The table shows that the estimated level ofconsciousness is more heavily determined by the former than the latter. For example, the valuesof the correlation coefficients for SEF95 are CorrFCM(SEF95) = 0.8928 and CorrGMM(SEF95) =0.9579, compared to CorrFCM(iCOHθ) = 0.7254 and CorrGMM(iCOHθ) = 0.8003 for iCOHθ .
Table 6.2: Spearman correlation coefficients for UWS patient L1 between all features and estimated levelsof consciousness. The cells in green represent the correlation coefficients with p > 0.05.
FCM GMM Product ens. Average ens.Ptheta 0,5016 0,6331 0,6321 0,5159Pbeta 0,8407 0,9449 0,9438 0,8571SEF95 0,8928 0,9579 0,9588 0,9039ERR 0,5391 0,5433 0,5485 0,5350LZC 0,7254 0,8003 0,8012 0,7385iCOHtheta 0,0062 0,0197 0,0191 0,0058wSMI 0,2963 0,2782 0,2851 0,2888
FCM GMM Product ens. Average ens.Ptheta 0,8615 -0,8036 0,8266 0,8627Pbeta 0,8299 -0,9717 0,9412 0,8439SEF95 0,7900 -0,9555 0,9290 0,8059ERR 0,7780 -0,7568 0,7547 0,7752LZC 0,3736 -0,4113 0,4386 0,3803iCOHtheta 0,0144 0,0064 -0,0043 0,0082wSMI -0,0978 -0,0773 0,0334 -0,0866
FCM GMM Product ens. Average ens.Ptheta 0,4933 -0,5122 0,5123 0,5354Pbeta 0,4556 -0,8997 0,8978 0,8270SEF95 0,5011 -0,9091 0,9081 0,8481ERR 0,0481 -0,3973 0,3951 0,3046LZC -0,2004 -0,2662 0,2630 0,1242iCOHtheta 0,5246 -0,0680 0,0718 0,2032wSMI 0,2718 -0,3499 0,3495 0,3227
FCM GMM Product ens. Average ens.Ptheta -0,6193 0,5232 -0,6566 0,4908Pbeta 0,4830 0,7516 0,5118 0,6979SEF95 0,6922 0,8228 0,7371 0,7358ERR 0,7307 0,4314 0,8068 0,5019
FeaturesSpearman correlation
FeaturesSpearman correlation
FeaturesSpearman correlation
FeaturesSpearman correlation
Overall, the estimated level of consciousness of patient L1 retrieved from the clustering anal-ysis of the different EEG features concur the outcomes of the individual features summarisedin Section 6.1.1.4. In addition to correctly "translating" the increases and decreases of this level,it accurately evaluate its extent (conscious versus unconscious). Moreover, the obtained resultsare also consistent with the eyes scoring when it is available. This means that the estimatedlevels of consciousness correlate with the patient’s eyes states, namely eyes open correspondingto conscious state, and vice versa. Unfortunately, the scoring was mostly unavailable duringnight time (designated by NA/nv). Figs. 6.15c and 6.15d represent the results of the product andaverage ensembles respectively. The average ensemble seem to produce a reasonable consensusbetween FCM and GMM, while the product ensemble tend to favour the outcomes of GMM.
These observations demonstrate that the proposed approach is working perfectly in this case,proving its potential. It is therefore the reason of choosing the clustering parameters of thispatient for later use.
6.1.2.2 Patient S7
As mentioned previously, the clusters obtained from the clustering analysis are labelled Cluster1 and Cluster 2. Table 6.3 displays the clusters centroids for patient S7. The cells in colourrepresent the larger centroid centre. The column with the most blue cells corresponds to theconscious cluster, in this case Cluster 1 for FCM and Cluster 2 for GMM. As opposed to theresults obtained from patient L1, the results of the different features for this patient diverge and
81

6 Results and discussions
the highest centroid value for Ptheta and wSMI are in Cluster 2 for the FCM clustering method,and in Cluster 1 for GMM. These divergence are marked by the cells in orange in the table.
Table 6.3: Clusters centroids for UWS patient S7. Values displayed here are the real values reconvertedfrom the normalised values. Cluster 1 represents the first cluster and Cluster 2, the second one. Foreach feature, the higher centroid centre value is highlighted. The cluster corresponding to a consciousstate is the one with the most cells in blue. In this case, it is Cluster 1 for FCM and Cluster 2 for GMM.The cells in orange signify that for that feature, the values contradict that of the other features (in blue).
S6
Cluster 1 Cluster 2 Cluster 1 Cluster 2Ptheta 0,1357 0,0921 0,0890 0,1299Pbeta 0,1079 0,0482 0,0392 0,1044SEF95 22,06 12,66 11,12 21,70ERR 0,3384 0,1629 0,1435 0,3208LZC 0,3984 0,3851 0,3375 0,4462iCOHtheta 0,0594 0,0614 0,0627 0,0595wSMI 0,0301 0,0306 0,0309 0,0300
S7
Cluster 1 Cluster 2 Cluster 1 Cluster 2Ptheta 0,1745 0,1753 0,1906 0,1435Pbeta 0,1439 0,1433 0,1357 0,1594SEF95 25,11 25,02 24,07 27,06ERR 0,6441 0,6415 0.6405 0,6474LZC 1,3947 1,3903 1,3820 1,4136iCOHtheta 0,0620 0,0618 0,0591 0,0674wSMI 0,0373 0,0374 0,0386 0,0347
Real values
Real values
FeaturesFCM GMM
FeaturesFCM GMM
The values of the cluster centres obtained from FCM are very close to each other, with aglobal inter-cluster difference of 0.0067. GMM on the other hand exhibits a much larger valueof 0.2908. The dissimilarities were computed on the normalised features. Figs. 6.16a and 6.16brepresent the FCM clustering results for the features displaying the largest and lowest centroidlinkage distances respectively. The clustering analysis results show that wSMI and Ptheta havethe highest inter-clusters difference with dFCM(wSMI, Ptheta) = 0.0052. Furthermore, iCOHθ
and LZC display the lowest inter-clusters difference with dFCM(iCOH, LZC) = 0.0019. Bothof these values are extremely low. So, as can be seen in the figures, the centroids of the twoclusters are quasi overlapping. In addition, the degree of membership value to the consciouscluster appear to be around 0.5 for all data points, with a mean value of 0.4979.
0 0.05 0.1 0.15 0.2 0.25 0.3
Ptheta
0.025
0.03
0.035
0.04
0.045
0.05
wS
MI1
6
Patient S7
0
0.1
0.2
0.3
0.4
0.5
0.6
0.7
0.8
0.9
1
Est
imat
ed c
onsc
ious
ness
leve
l
(a)
0 0.5 1 1.5 2 2.5 3
LZC
0
0.05
0.1
0.15
0.2
0.25
iCO
H3
Patient S7
0
0.1
0.2
0.3
0.4
0.5
0.6
0.7
0.8
0.9
1
Est
imat
ed c
onsc
ious
ness
leve
l
(b)
Figure 6.16: FCM clusters plots for patient S7 for the pair of features displaying (a) the highest and (b) thelowest centroid linkage distance. The barplot on the right side of each figure represents the degree ofmembership to the conscious cluster.
82

6.1 Patients with disorders of consciousness
0 0.05 0.1 0.15 0.2 0.25 0.3
Ptheta
0.025
0.03
0.035
0.04
0.045
0.05
wS
MI1
6
Patient S7
0
0.1
0.2
0.3
0.4
0.5
0.6
0.7
0.8
0.9
1
Est
imat
ed c
onsc
ious
ness
leve
l(a)
0 0.2 0.4 0.6 0.8 1 1.2 1.4
ERR
0
0.5
1
1.5
2
2.5
3
LZC
Patient S7
0
0.1
0.2
0.3
0.4
0.5
0.6
0.7
0.8
0.9
1
Est
imat
ed c
onsc
ious
ness
leve
l
(b)
Figure 6.17: GMM clusters plots for patient S7 for the pair of features displaying (a) the highest and (b) thelowest centroid linkage distance. The barplot on the right side of each figure represents the degree ofmembership to the conscious cluster.
The degrees of membership obtained from the GMM clustering analysis cover more rangeof values. As previously stated and can be seen in Table 6.3, clustering results of Ptheta andwSMI contradict those of the other features. It is also illustrated in Fig. 6.17a. Particularly, lowvalues of wSMI and Ptheta belong to the conscious cluster, and inversely. These observationsare also contradicting the hypothesis in Section 4.2. wSMI and Ptheta also display the largestinter-clusters distance with dGMM(wSMI, Ptheta) = 0.2662 for the GMM clustering approach.The lowest distance is observed between LZC and ERR with dGMM(LZC, ERR) = 0.0125 (seeFig. 6.17b). The cluster centres are practically overlapping and objects with different degreesof memberships to the conscious cluster are all mixed. There is no smooth transition fromunconscious to conscious states as in Fig. 6.14a.
Fig. 6.18a shows the results of FCM cluster analysis for patient S7. The estimated level ofconsciousness is essentially constant, with a mean value of 0.49. All data points are centred toroughly the same point. Indeed, the values of the clusters centres for both Cluster 1 and Cluster2 in Table 6.3 correspond to conscious states. The output of the GMM clustering analysis ispresented in Fig. 6.18b. The results suggest that patient S7 was unconscious from 19:48 to 22:30,as well as during night-time from 00:40 to 05:00 in particular. In terms of signal behaviour, theestimated levels of consciousness are conform to the inferences made in Section 6.1.1.4. Thevalues are however inaccurate.
Table 6.4 recapitulates the results of the correlation analysis between all the features and theobtained levels of consciousness using FCM and GMM for MCS patient S7. Consistent to theobservations made in Section 6.1.2, Ptheta and wSMI are highly but negatively correlated withthe obtained estimations of the consciousness level. It also revealed that the other features arepositively but only moderately correlated with the estimated consciousness levels. This alsoconfirms the inferences made in Section 6.1.1.4. Moreover, LZC and iCOHθ for FCM, and ERRand LZC are the features that contribute the less to the final estimated consciousness levels.
83

6 Results and discussions
19:48 22:30 01:12 03:54 06:36 09:18 11:59 14:41 17:23 20:05
0
0.2
0.4
0.6
0.8
1
Est
imat
ed c
onsc
ious
ness
leve
l
Patient S7
21-J
ul-2
010
19:4
8:07
22-J
ul-2
010
08:0
3:46
22-J
ul-2
010
10:1
6:42
22-J
ul-2
010
18:1
9:39
22-J
ul-2
010
19:2
4:01
22-J
ul-2
010
20:0
5:55
23:0
0
05:0
0
(a) Fuzzy c-means
19:48 22:30 01:12 03:54 06:36 09:18 11:59 14:41 17:23 20:05
0
0.2
0.4
0.6
0.8
1
Est
imat
ed c
onsc
ious
ness
leve
l
21-J
ul-2
010
19:4
8:07
22-J
ul-2
010
08:0
3:46
22-J
ul-2
010
10:1
6:42
22-J
ul-2
010
18:1
9:39
22-J
ul-2
010
19:2
4:01
22-J
ul-2
010
20:0
5:55
23:0
0
05:0
0
(b) Gaussian Mixture Model
19:48 22:30 01:12 03:54 06:36 09:18 11:59 14:41 17:23 20:05
0
0.2
0.4
0.6
0.8
1
Est
imat
ed c
onsc
ious
ness
leve
l
21-J
ul-2
010
19:4
8:07
22-J
ul-2
010
08:0
3:46
22-J
ul-2
010
10:1
6:42
22-J
ul-2
010
18:1
9:39
22-J
ul-2
010
19:2
4:01
22-J
ul-2
010
20:0
5:55
23:0
0
05:0
0
(c) Product ensemble
19:48 22:30 01:12 03:54 06:36 09:18 11:59 14:41 17:23 20:05
0
0.2
0.4
0.6
0.8
1
Est
imat
ed c
onsc
ious
ness
leve
l
21-J
ul-2
010
19:4
8:07
22-J
ul-2
010
08:0
3:46
22-J
ul-2
010
10:1
6:42
22-J
ul-2
010
18:1
9:39
22-J
ul-2
010
19:2
4:01
22-J
ul-2
010
20:0
5:55
23:0
0
05:0
0
(d) Average ensemble
23:00 00:30 02:00 03:30 05:00Time (HH:MM)
NA/nv
C
O/C
O
Eye
s sc
orin
g
(e) Eyes scoring
Figure 6.18: Estimated consciousness level for MCS patient S7 using (a) FCM, and (b) GMM, (c) productensemble, and (d) average ensemble of FCM and GMM. The closer to 1 the curve is, the higher theprobability that the patient is conscious, and inversely.The blank areas represent the times during whichno EEG data were recorded ((a), (b), (c) and (d)) or no eyes scoring were made (e). Shaded areasbetween 23:00 and 05:00 delimit the night time.
84

6.1 Patients with disorders of consciousness
Those were respectively the pairs of features with the lowest inter-clusters distances for bothclustering analysis.
Table 6.4: Spearman correlation coefficients for MCS patient S7 between all features and estimated levelsof consciousness. The p-value < 0.05 in all cases.
FCM GMM Product ens. Average ens.Ptheta -0,5660 -0,7500 -0,7496 -0,7181Pbeta 0,3920 0,3223 0,3228 0,3550SEF95 0,5771 0,4907 0,4915 0,5294ERR 0,3611 0,1181 0,1195 0,1655LZC 0,3113 0,0547 0,0558 0,0910iCOHtheta 0,1535 0,1283 0,1286 0,1330wSMI -0,7443 -0,7511 -0,7515 -0,7432
FeaturesSpearman correlation
6.1.2.3 Overview of the results for the remaining of the DoC patients
The median values of the individual features used in this work are generally lower for MCSpatients compared to the UWS patients, except for LZC and wSMI. The differences wereassessed by the means of a Wilcoxon ranksum test performed on each EEG measure betweenboth group of patients. It revealed that the difference were significant. The p-values arerecapped in Table B.2 of Appendix B. These results are a bit surprising since first, the CRS-Rof the UWS are mostly lower than those of the MCS patients (cf. Table 5.1). And second, ahandful of researches indicated that the levels of consciousness of UWS patients are lower thanthose with MCS. On the other hand, this is probably due to the fact that average results areused here instead of individual electrodes.
The estimated levels of consciousness of the DoC patients except L1 and S7 (Figs. B.1 toB.15) as well as the clusters centres obtained from the clustering analysis (Tables B.3 to B.17)are reported in Appendix B. In general, analogous to a majority vote, the estimations ofconsciousness levels from both FCM and GMM are positively correlated with the majority ofthe individual features. In other words, the approach was able to convey the increases anddecreases of the patients’ levels of consciousness from them. On the other hand, the accuracyof these estimations depends on the overall inter-clusters differences. First of all, the levelsof consciousness values are highly influenced by the features with the largest inter-clustersdistance and vice versa. The correlation coefficients between the features and the estimatedlevels of consciousness for all patients are reported in Appendix B. The results showed thatthere is no common best or worst feature shared by all patients. Each individual is different,and so are the most and less performant features for each of them. In addition, when thedissimilarities are large enough, the estimated levels of consciousness are remarkably accuratewhen matched with the outcomes of each individual measure (as is the case of patient L1).However, when it is not the case i.e. the inter-clusters distances are small, the estimations arenot correctly conveyed. This latter case was observed for patients L13 and S13 in addition topatient S7 which case was presented in the following section.
85

6 Results and discussions
Furthermore, the evaluation of night and day differences of the individual features deter-mined that the values at night are lower, except for UWS patient S14 and MCS patients L4,L7 and L16. For all of them, a Wilcoxon rank sum test performed to assess the differencesdetermined that they are significant. The implications of this observation are further discussedin Section 6.1.3.
6.1.3 Performance of the approaches
The primary purpose of recording the DoC patients’ EEG signal was to study their sleeppatterns and investigate the night and day variations [Wie+18; Wis+17]. Researches show thatfor DoC patients, eyes opening and closing are manifestation of periods of circadian sleep-wake [Wan+18]. A circadian rhythm can be defined as the innate internal process that regulatesthe sleep–wake cycle and repeats approximately every 24 hours [BCP16]. For this particulardataset, high-to-low frequency power ratio of the EEG as well as permutation entropy were used,and results showed that their values were significantly higher during the day for MCS patients,but no changes were observed for UWS patients [Wis+17]. In addition, a hierarchical clusteringanalysis using permutation entropy computed on the EEG signals revealed that MCS patients’sleep behaviour are analogous to that of healthy subjects. Particularly, patterns resemblinghealthy REM were detected during night-time. However, this complexity difference betweennight and day value were negligible for UWS patients. This suggests that day-night variationsare impaired for these patients. In addition, as opposed to MCS, only small inter-clustersdifferences were observed for them [Wie+18].
Now in this work, as already mentioned in Section 6.1.2.3, a Wilcoxon ranksum test wasperformed on the results obtained from the clustering ensemble approaches to assess thenight versus day differences. Except for four patients, the dissimilarities are significant atthe 5% level with higher values during the day. The p-values for all patients are gathered inTable B.18 in Appendix B. Eyes closed do not necessarily mean unconscious, and vice versa.Nonetheless, taking all of the above into consideration, it is most likely the case during thenight. Furthermore, since most eyes scoring were recorded at night, it could be assumed thateyes closed correspond to unconscious state, while open eyes indicate conscious state.
Consequently, the performance of the clustering methods are now evaluated by computingthe accuracy between the clustering results using the patients eyes scoring as "ground-truth".Since, it is unlikely that 0.5 represent the bound between conscious and unconscious states, thecluster membership values were defuzzified by converting them into binary numbers usingseveral threshold ranging from 0.3 to 0.7 with a 0.1 increment. Accordingly, the values belowthe threshold were appointed to 0 (low level of consciousness), and those above threshold wereset to 1 (high level of consciousness). Likewise, the eyes scoring "O" corresponds to 1, while "C"corresponds to 0. Only the scoring indicating eyes open and eyes closed, and the correspondingdata were use for the evaluation [Wie+18]. The performance of the approach is then determinedby computing the accuracy as:
86

6.1 Patients with disorders of consciousness
Accuracy =TP + TN
TP + TN + FP + FN(6.1)
where TP: True Positive, TN: True Negative, FP: False Positive, and FN: False Negative.
The accuracy was computed for all threshold values. The obtained values for the 17 DoCpatients (8 UWS and 9 MCS) are reported in Table B.19 in Appendix B. The accuracy obtainedfor both ensemble methods are slightly distinct for the different threshold values, except whenits value is 0.5, in which case both ensemble method have the same accuracy.
The best results for the MCS patients are illustrated in Fig. 6.19a. Patient S17 achieved thelowest accuracy with 22.22% (threshold = 0.6) and was the only patient with an accuracy below50%. The highest accuracy for the whole group was achieved by patient S14, with up to 85.2%(threshold = 0.3) on the average ensemble. Similarly, the best performance results for UWS/VSpatients are presented in Fig. 6.19b. The highest accuracy for this group was achieved by patientL8 with 70.11% for both ensemble methods (threshold = 0.6 for the product ensemble and 0.7for the average ensemble). 5 out of the 8 UWS patients also attained an above 50% accuracy. Theperformances of almost all MCS patients appear better compared to that of UWS/VS patients.
(a) MCS patients (b) UWS/VS patients
Figure 6.19: Performance of the ensemble clustering methods for (a) MCS patients and (b) UWS patients.For two MCS patients, accuracy was above 70%. Only one of the UWS patient achieved a 70% accuracy.
Considering the patients’ sleep patterns as well as the performance of the clustering analysisusing different values of threshold, it can be assumed that the boundary delimiting consciousand unconscious states depends on the patient. The idea behind this work is to determinepatients’ consciousness states in order to initiate communication. It is therefore crucial to detectthis minimum value at which the level of consciousness is enough for that to happen. An inputfrom the family members or caregiver is therefore necessary.
87

6 Results and discussions
6.1.4 Discussion I
The different features used in this work were weighted equally and their values were normalisedso to not favour any of them for the clustering analysis. Each of the features extracts a particularcharacteristic of the EEG signal. The hypothesis in Section 4.2 stipulate that conscious statesare defined by an increase of each of these signal attributes. However, the features may alsocontradict each other to some extent. In this group of DoC patients, the results of one or moremeasures contradict the others, except for patient L1 (UWS).
When the results of the features or somewhat conflicting, a consensus appear to be found bythe cluster analysis methods. Moreover, the proposed approach in this work (using FCM andGMM) was able to convey the variations of the levels of consciousness that match the outcomesof the different features. At least, this is the case when the inter-cluster distances between theclusters are important enough as it is the case for patient L1 (cf. Section 6.1.2.1). Otherwise,FCM is monotonous with a value around 0.5, meaning that all the data points belong moreor less equally to both clusters (cf. Fig. 6.18a). This can be interpreted as the two clustersrepresenting the same thing as in Fig. 6.16b. GMM on the other hand still reflects the variationsobserved on the individual features in terms of increase and decrease, but the values of thelevels of consciousness are actually invalid. Looking back to the observations made for patientS7 in Section 6.1.2.2, for example, the two resulting clusters both represent a conscious state.Nevertheless, the results of GMM, and consequently those of the ensemble methods, definedthe lower values as an unconscious and the higher values as a conscious states (cf. Fig. 6.18b).
Given these observations, this clustering approach works best when the data is diversified.In other words, the analysed data should cover all the possible states of consciousness ofthe patient. For a number of reasons, one being the difficulty to record patients data, thisis mostly impractical. Consequently, another solution would be to use pre-defined centroids.Since patient L1 displayed high inter-cluster difference, and that all features and cluster centresvalues verified the conditions defined in Section 4.2, his clustering parameters will be used forthe CLIS patients.
6.2 CLIS patients
This part reports the results for the CLIS patients. Those of patient GR are first introduced. Thesame procedure as for the DoC patients is first followed to determine the consciousness level ofthe patient. Afterwards, the results of the remaining of the CLIS are presented and discussed.
6.2.1 ECoG data
The data of patient GR consists of a 24-hour ECoG brain recordings from 64 channels. Channels,which signal amplitudes were larger than ±200µV were excluded. Consequently, channels
88

6.2 CLIS patients
G008, G012, G028, G034, and G080 were removed (cf. Fig. 5.2), leaving 59 channels for furtheranalysis.
This patient’s data is singular since, to the best of our knowledge, it is the only one in whichthe experimenters were able to pinpoint one time frame when the CLIS patient was indeedconscious. Besides, he was trained to use BCI since his being diagnosed with ALS. Hence, theexperimenter is familiar with his demeanour. The experiment described in Section 5.1.2 wasconducted from 14:50 to 17:00. It is delimited by the red lines in Fig. 6.20, which illustratesthe results of the ensemble methods regarding the estimated consciousness level. These resultswere obtained by applying the proposed clustering approach to the features extracted fromGR’s data without any prerequisite.
00:34 01:34 02:34 03:34 04:34 05:34 06:34 07:34 08:34 09:34 10:34 11:34 12:34 13:34 14:34 15:34 16:34 17:34 18:34 19:34 20:34 21:34 22:34 23:34 00:340
0.2
0.4
0.6
0.8
1
Est
imat
ed c
onsc
ious
ness
leve
l
Product ensemble
14:5
0
17:0
0
15:3
4
16:1
4
(a)
00:34 01:34 02:34 03:34 04:34 05:34 06:34 07:34 08:34 09:34 10:34 11:34 12:34 13:34 14:34 15:34 16:34 17:34 18:34 19:34 20:34 21:34 22:34 23:34 00:340
0.2
0.4
0.6
0.8
1
Est
imat
ed c
onsc
ious
ness
leve
l
Average ensemble
14:5
0
17:0
0
15:3
4
16:1
4
(b)
Figure 6.20: Estimated consciousness level for patient GR (a) product ensemble, (b) average ensemble. Theexperiment was performed between 14:50 and 17:00 (red vertical lines). The red area from 15:34 to 16:14
represent the time during which the experimenter reported that the patient was correctly answering thequestions he was asked. The values of the estimated consciousness level at these times were definitelydifferent than the values the rest of the time.
The experimenter asserts that patient GR was correctly answering the questions in the timeframe 15:34 to 16:14. During the experiment, the patient was asked 18 questions. To makesure that the classifier correctly identified his answer, each question was asked in pairs. Thismeans that for each question requiring a positive answer, the same question was reformulatedso that the same answer is expressed by a negative answer. The entire course of the interactionbetween the patient and the experimenter is reported in Table C.2 in Appendix C. Out of the18 questions, answers for two questions were unclear, but 16 of them were clearly answered bythe patient thus correctly determined by the classifier, resulting in a 88.89% correct answer rate.
89

6 Results and discussions
Table 6.5: Average estimated consciousness level for patient GR during different time frames. The esti-mated consciousness level were definitely slightly higher during the experiment.
Time Interval FCM GMM Product ensemble
Average ensemble
all (24h) 00:34 - 00:34+1 0,4978 0,2679 0,2601 0,3829day time 08:00 - 20:00 0,4756 0,3355 0,3205 0,4055night time 20:00 - 08:00 0,5200 0,2005 0,1998 0,3603before experiment 00:34 - 14:50 0,5244 0,2514 0,2481 0,3879during experiment 14:50 - 17:00 0,4558 0,3598 0,3408 0,4078after experiment 17:00 - 00:34+1 0,4598 0,2784 0,2598 0,3663
"conscious" time 15:34 - 16:14 0,4574 0,3594 0,3400 0,4084
The degrees of membership obtained from FCM are relatively steady throughout the entirerecording, with a average of 0.4978, analogous to the results obtained for DoC patient S7. Somevariations are however observed in the results of GMM, notably an increase in the afternoon,and the average score during the entire recording is 0.2679. This then resulted in what canbe seen in Fig. 6.20. Table 6.5 summarises the average values of the estimated consciousnesslevel during different time intervals using FCM, GMM and the two ensemble methods. Themean FCM and GMM degrees of membership during the experiment are 0.4574 and 0.3594respectively. While the values are significantly higher than the average value for the entirerecording for GMM, it is the opposite for FCM. Differences were also observed between theaverage values during day and night times. Times between 08:00 to 20:00 are labelled as dayand 20:00 to 08:00 as night [Soe+13]. FCM membership degrees are higher during the night andoutside the experiment time. Contrariwise, low values are observed during the night and thehighest values occur during the experiment. In case of GMM clustering in particular, other timeintervals also depict a higher value of the membership degree, namely between 07:21 and 08:06,and intermittently between 11:51 and 13:16. Additionally, it remains high after the experimentup until 19:42, with an average of 0.49.
Table 6.6: Clusters centroids for CLIS patient GR. Cluster 1 and Cluster 2 represent the two clusters. Thecluster corresponding to conscious is the one containing the most blue cells. In this case, Cluster 1 forboth FCM and GMM. Values are the real values reconverted from the normalised ones. Cells in orangecontain high value corresponding to higher consciousness level, but is not in the same cluster as themajority (blue cells).
Cluster 1 Cluster 2 Cluster 1 Cluster 2Ptheta 0,1344 0,1263 0,1243 0,135Pbeta 0,3211 0,3105 0,333 0,3188SEF95 26,199 25,6050 25,803 26,2035ERR 0,6441 0,6415 0,6405 0,6474LZC 0,6767 0,6833 0,6913 0,6754iCOH_theta 0,0613 0,0614 0,0616 0,0612wSMI16 0,0311 0,0314 0,0338 0,0308
Features FCM GMM
90

6.2 CLIS patients
Table 6.6 presents the values of the clusters centres obtained using FCM and GMM. Theinter-clusters distances for FCM is dFCM = 0.1284 and equals dGMM = 0.0797 for GMM. Thevalues are somewhat low compared to those of patient L1, but are comparable to those ofpatient S7. For example, akin to patient S7’s results, less than 2 Hz separates the SEF95 in bothclusters for both clustering approaches. In addition, the complexity values are essentially in thesame value range. This is illustrated in Fig. 6.21 that displays the FCM degree of membership tothe conscious cluster of each data point from SEF95 and LZC. The two centroids are practicallyoverlapping. Most objects are located in the upper right part of the figure corresponding tohigh LZC and high SEF95, which in turn denote high levels of consciousness [G+21; Tou+19].No clear clusters are visible although the data points have different degrees of membership.Consequently, the lower limits of the degree of membership in Fig. 6.20 could not be interpretedas unconscious, akin to the results of Patient S7 in Section 6.1.1.2.
0 0.1 0.2 0.3 0.4 0.5 0.6 0.7 0.8
SEF95
0
0.1
0.2
0.3
0.4
0.5
0.6
0.7
0.8
0.9
LZC
Patient GR
0
0.1
0.2
0.3
0.4
0.5
0.6
0.7
0.8
0.9
1
Deg
ree
of m
embe
rshi
p
Figure 6.21: Illustration of the clusters using FCM clustering for patient GR with the SEF95 and LZCfeatures. The centroid linkage distance is very low, the centroids are close to each other. The barplot onthe right side of the figure represents the degree of membership to the conscious cluster. On one hand,the two clusters are basically overlapping; on the other hand, the majority of the data points are locatedat the upper right of the plot, which means high complexity and high SEF95. This indicates a high levelof consciousness.
The data of GR is furthermore partitioned using pre-defined FCM cluster centres and thesame Gaussian mixture model as patient L1, as declared in Section 6.1.4. The outcomes of theaverage ensemble are presented in Fig. 6.22 and Table 6.7 summarises the average values ofthe estimated consciousness levels during different time intervals using FCM, GMM and theaverage ensemble methods. The estimated values are high, with an overall mean of 0.9998 and0.7638 for the product and average ensemble respectively. The values were also slightly higherduring and after the experiment. To summarise all of the above, the clustering analysis ofGR’s ECoG data allowed to determine that the resulting centroids for both clusters are almostundistinguishable and represent high consciousness level. In addition, an undeniable increaseof the consciousness level is observed especially in the time of and following the experiment.Moreover, the use of predefined cluster centres determined that patient GR was conscious
91

6 Results and discussions
during the entire 24-hour recording. Consequently, the patient was assuredly conscious duringthe whole recording, but also that his level of consciousness increased during the experiment.
00:34 01:34 02:34 03:34 04:34 05:34 06:34 07:34 08:34 09:34 10:34 11:34 12:34 13:34 14:34 15:34 16:34 17:34 18:34 19:34 20:34 21:34 22:34 23:34 00:34Time (HH:MM)
0.725
0.73
0.735
0.74
0.745
0.75
0.755
0.76
0.765
0.77
Est
imat
ed c
onsc
ious
ness
leve
lAverage ensemble
14:5
0
17:0
0
15:3
4
16:1
4
Figure 6.22: Estimated consciousness level for patient GR using the pre-defined cluster centres obtainedin Section 6.1.3 (average ensemble). The estimated level of consciousness is constantly high. Theexperiment was performed between 14:50 and 17:00 (red vertical lines). The red area from 15:34 to 16:14
represent the time during which the experimenter reported that the patient was correctly answeringthe questions he was asked.
These observations not only confirm the observations of the experimenter regarding the stateof consciousness of the patient during part of the experiment, but are also corroborated, atleast partly, by the separately obtained results using the imaginary part of coherency, Grangercausality and sample entropy in [Ada+19b]. Namely, patterns suggesting a conscious statewere observed in the imaginary coherence from 15:15 to 15:30 and from 16:00 to 16:10, in themulti-scale sample entropy between 15:24 and 16:14, and with Granger causality between thefrontal and posterior channels from 15:34 until 16:14. A multi-scale approach analysis of patientGR’s data involving sample entropy, permutation entropy and Poincaré plots also revealed thatthe patient was conscious between 16:04 and 16:10 [WNB20].
Table 6.7: Average estimated consciousness level for patient GR during different time frames using pre-defined clustering parameters.
Time Interval FCM GMM Product ensemble
Average ensemble
all (24h) 00:34 - 00:34+1 0.5277 0.9998 0.9998 0.7638day time 08:00 - 20:00 0.52689 0.99975 0.99975 0.76332night time 20:00 - 08:00 0.52858 0.99988 0.99988 0.76423before experiment 00:34 - 14:50 0.5272 0.99984 0.99984 0.76352during experiment 14:50 - 17:00 0.52797 1,0000 1,0000 0.76399after experiment 17:00 - 00:34+1 0.52867 0.99971 0.99971 0.76506
"conscious" time 15:34 - 16:14 0.52772 1,0000 1,0000 0.76386
The clustering analysis employing pre-determined cluster centres argues that there is ahigh probability that the patient was conscious during these 24 hours, but to a lesser extentthan during the experiment. This argument is not inconceivable, since as mentioned in Sec-tion 2.1.2, ALS-LIS patients suffer from an increased manifestation of insomnia as the conditionevolves [Pos+07]. An investigation of this patient sleep/wake characteristics revealed the pres-
92

6.2 CLIS patients
ence of increase SWS fragmentation [Soe+13]. It is therefore highly probable that this day wasan instance of such case.
6.2.2 EEG data
The same procedure using pre-defined cluster centres is now applied to the EEG data of theremaining CLIS patients introduced in Section 5.1.2.2. This section reports the results of theproduct and average ensembles. The mean level of consciousness of all patients is illustratedin Fig. 6.23. The figure shows that as opposed to patients P6, P7 and P10 in particular, whodisplayed extremely low consciousness levels, patients P1, P2 and P5 exhibited the highestestimated levels of consciousness, with 0.627, 0.764 and 0.587 respectively (product ensemble).The values for patient P6, P7 and P10 were always low during all available recordings.
P1 P2 P3 P4 P5 P6 P7 P9 P10
Patients
0
0.1
0.2
0.3
0.4
0.5
0.6
0.7
0.8
0.9
1
Est
imat
ed c
onsc
ious
ness
leve
l
ProductAverage
Figure 6.23: Average and standard deviation values of the estimated consciousness level for all sessionsand all CLIS patients obtained from the ensemble methods. The obtained estimations of the levels ofconsciousness were always low for patients P6, P7 and P10.
The patients can therefore be categorised into three groups, depending on the results obtainedfrom the clustering analysis during all recording sessions. First, the estimated consciousnesslevel for patient P1 was consistently high, except for the very last recording. Patient P2 alsoshowed high levels of consciousness, except for one day. The experimenters affirmed thatthose two patients achieved the highest performance among all the CLIS patients during theexperiments. This implies that they were conscious in almost all sessions. Then, there arepatients whose estimated consciousness level were highly variable from one session to the other.Patients P3, P4 and P5 belong to this category. Finally, patients P6, P7, P9 and P10 alwaysshowed low consciousness levels. The experimenters reported patient P10 as being brain dead,and they observed only a few irregular good sessions with patient P9. Only results with notable
93
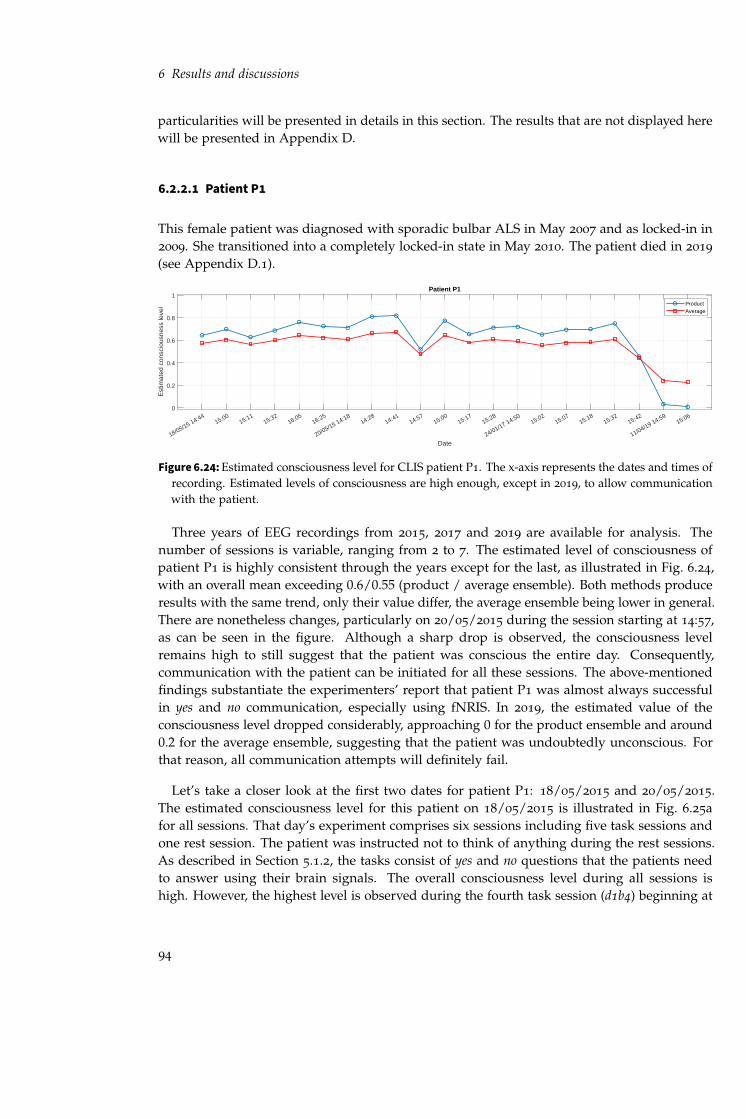
6 Results and discussions
particularities will be presented in details in this section. The results that are not displayed herewill be presented in Appendix D.
6.2.2.1 Patient P1
This female patient was diagnosed with sporadic bulbar ALS in May 2007 and as locked-in in2009. She transitioned into a completely locked-in state in May 2010. The patient died in 2019
(see Appendix D.1).
18/05/15 14:4415:00
15:1115:32
16:0516:25
20/05/15 14:1814:28
14:4114:57
15:0015:17
15:28
24/01/17 14:5015:02
15:0715:18
15:3215:42
11/04/19 14:5915:06
Date
0
0.2
0.4
0.6
0.8
1
Est
imat
ed c
onsc
ious
ness
leve
l
Patient P1
ProductAverage
Figure 6.24: Estimated consciousness level for CLIS patient P1. The x-axis represents the dates and times ofrecording. Estimated levels of consciousness are high enough, except in 2019, to allow communicationwith the patient.
Three years of EEG recordings from 2015, 2017 and 2019 are available for analysis. Thenumber of sessions is variable, ranging from 2 to 7. The estimated level of consciousness ofpatient P1 is highly consistent through the years except for the last, as illustrated in Fig. 6.24,with an overall mean exceeding 0.6/0.55 (product / average ensemble). Both methods produceresults with the same trend, only their value differ, the average ensemble being lower in general.There are nonetheless changes, particularly on 20/05/2015 during the session starting at 14:57,as can be seen in the figure. Although a sharp drop is observed, the consciousness levelremains high to still suggest that the patient was conscious the entire day. Consequently,communication with the patient can be initiated for all these sessions. The above-mentionedfindings substantiate the experimenters’ report that patient P1 was almost always successfulin yes and no communication, especially using fNRIS. In 2019, the estimated value of theconsciousness level dropped considerably, approaching 0 for the product ensemble and around0.2 for the average ensemble, suggesting that the patient was undoubtedly unconscious. Forthat reason, all communication attempts will definitely fail.
Let’s take a closer look at the first two dates for patient P1: 18/05/2015 and 20/05/2015.The estimated consciousness level for this patient on 18/05/2015 is illustrated in Fig. 6.25afor all sessions. That day’s experiment comprises six sessions including five task sessions andone rest session. The patient was instructed not to think of anything during the rest sessions.As described in Section 5.1.2, the tasks consist of yes and no questions that the patients needto answer using their brain signals. The overall consciousness level during all sessions ishigh. However, the highest level is observed during the fourth task session (d1b4) beginning at
94

6.2 CLIS patients
14:4
414
:5815
:00
15:1
015
:11
15:2
515
:32
16:0
216
:05
16:1
416
:25
16:3
60
0.2
0.4
0.6
0.8
1
Est
imat
ed c
onsc
ious
ness
leve
l
P1 (18/05/2015)
d1b1
d1b2
d1b3
rest
ing1
d1b4
d1b5
(a)
14:1
814
:28
14:2
814
:40
14:4
114
:54
14:5
715
:00
15:0
015
:14
15:1
715
:27
15:2
815
:38
Time (HH:MM)
0
0.2
0.4
0.6
0.8
1
Est
imat
ed c
onsc
ious
ness
leve
l
P1 (20/05/2015)
rest
ing2
d3b1
d3b2
rest
ing3
d3b3
d3b4
rest
ing4
(b)
Figure 6.25: Estimated consciousness level for patient P1 (product ensemble) on (a) 18/05/2015 (day 1)and (b) 20/05/2015 (day 2). Shaded areas represent period during which no data were recorded. Thedotted lines delimit the start and end of the experiment. Plain vertical lines mark the start of eachsession. The name of each of them is marked on the top left of each experiment part.
16:05 with a mean value of 0.7628/0.647 (product/average ensemble). The high values suggestthat the patient was conscious overall, but with an increased level during session d1b4. Theexperiments on 20/05/2015 are composed of seven sessions: rest sessions at the beginning andthe end, and four task sessions separated by another brief rest session as shown in Fig. 6.25b.The level of consciousness of the patient increased during the first and the second session(d3b1 and d3b2, with an average consciousness level estimate at 0.8112 and 0.8192, respectively).A slight decrease is observed for the remaining sessions, but mostly during the rest sessionresting3 with an average of 0.5196. These results are in accordance to those obtained in [AB21b]in which it was established that the levels of consciousness of this patient were highly variableand that it can also happen that during a specific experiment, it consistently decreased. Suchdecline is probably due to patient’s fatigue.
No critical differences across the sessions were observed. Consequently, as already statedpreviously, the patient’s performance in answering the questions should be high. In the studyreported in [AB21a], patient P1 achieved the highest accuracy among a group of 4 CLIS patientsto classify yes/no answers. An analysis of her EEG data during these experiments revealed thatshe was able to achieve an accuracy of 67.94% using Random Forest with the SEF95 feature. Thisis probably due to the fact that she spent the most time in ALS condition (see Appendix D.1).During the experiment, the patients were asked to "think" yes or no to answer the questions. It
95

6 Results and discussions
is hypothesised that given these instructions, each patient possibly finds a way to convey theiranswer. It is then likely that she has the most experience in accurately expressing her answers.
6.2.2.2 Patient P2
This male patient was diagnosed with non-bulbar ALS in May 2011. He first used a speechdevice in his throat to communicate beginning of December 2011. When this failed, it wasreplaced by MyTobii eye tracking device from April 2012 until December 2013. The responseusing this system was variable and communication was no more possible from August 2014
(see Appendix D.1).
22/06/15 16:3316:49
17:0117:12
17:3317:35
23/06/15 12:0912:27
12:4312:55
13:1013:23
24/06/15 17:0117:32
17:4618:28
25/06/15 12:2212:35
12:4813:00
13:3514:01
14:14
26/06/15 10:5911:12
11:2211:33
11:5212:08
12:20
Date
0
0.2
0.4
0.6
0.8
1
Est
imat
ed c
onsc
ious
ness
leve
l
Patient P2
ProductAverage
Figure 6.26: Average estimated consciousness level for CLIS patient P2 during the different recording days.The x-axis represents the dates and times of recording.
Fig. 6.26 illustrates the estimated consciousness level obtained from the approach proposedin this thesis. The EEG data consists of 5 days of recordings from 2015 with from 4 to 7
sessions each. Similar to patient P1’s results, both ensemble methods follow the same trend.The estimated consciousness levels are also high for patient P2 except on 23/06/2015 (averageensemble: 0.3361, product ensemble: 0.1503). No information about what may have causedsuch decrease was obtained from the experimenters. In [Van+16] for instance, the decrease ofperformance and motivation on the patient’s part during some days was due to health issues.Since nothing specific was reported that day for this patient, it can be speculated that he wassimply not conscious, possibly asleep. This result constitutes an example of unfavourable timeto start communication with the patient.
6.2.2.3 Patient P3
This female patient was diagnosed with bulbar ALS in 2010. She lost speech and capabilityto walk by 2011. Starting February 2013, she started using assistive communication devicesusing one finger to communicate, until it failed. Afterwards, in early 2014, an attempt has beenmade to use eye tracking for communication, which was stopped in August 2014. After that,the patient was tried to communicate using subtle twitch of eyelid. Unfortunately, this was not
96
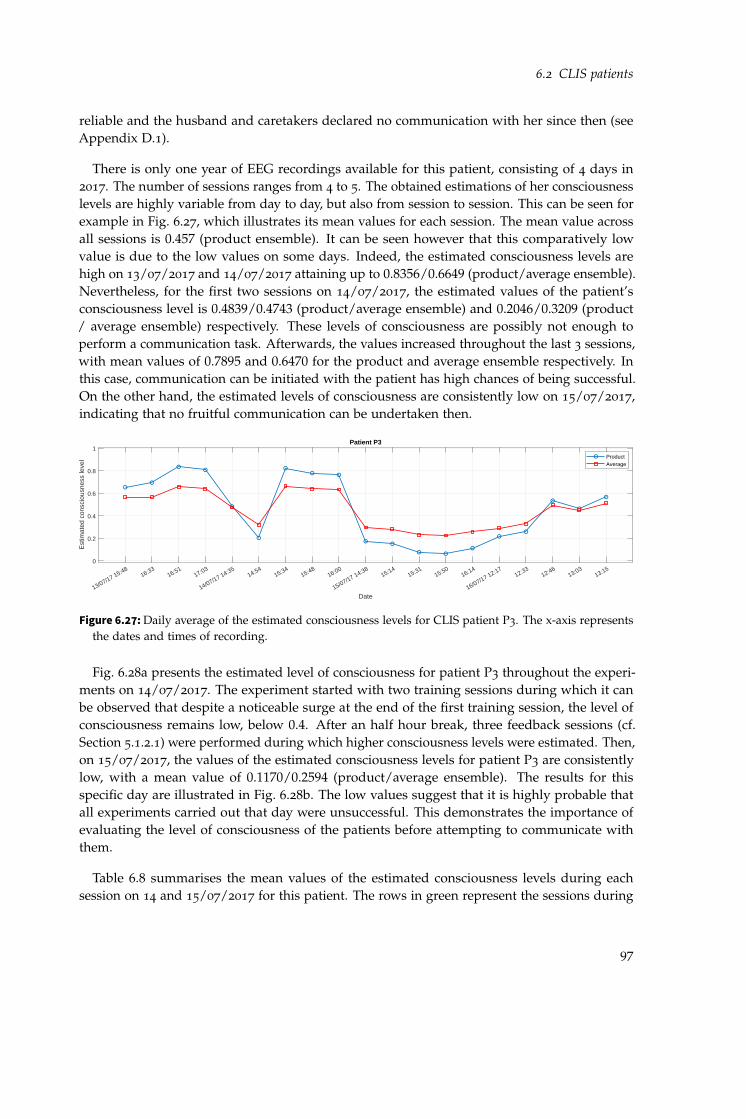
6.2 CLIS patients
reliable and the husband and caretakers declared no communication with her since then (seeAppendix D.1).
There is only one year of EEG recordings available for this patient, consisting of 4 days in2017. The number of sessions ranges from 4 to 5. The obtained estimations of her consciousnesslevels are highly variable from day to day, but also from session to session. This can be seen forexample in Fig. 6.27, which illustrates its mean values for each session. The mean value acrossall sessions is 0.457 (product ensemble). It can be seen however that this comparatively lowvalue is due to the low values on some days. Indeed, the estimated consciousness levels arehigh on 13/07/2017 and 14/07/2017 attaining up to 0.8356/0.6649 (product/average ensemble).Nevertheless, for the first two sessions on 14/07/2017, the estimated values of the patient’sconsciousness level is 0.4839/0.4743 (product/average ensemble) and 0.2046/0.3209 (product/ average ensemble) respectively. These levels of consciousness are possibly not enough toperform a communication task. Afterwards, the values increased throughout the last 3 sessions,with mean values of 0.7895 and 0.6470 for the product and average ensemble respectively. Inthis case, communication can be initiated with the patient has high chances of being successful.On the other hand, the estimated levels of consciousness are consistently low on 15/07/2017,indicating that no fruitful communication can be undertaken then.
13/07/17 15:4816:33
16:5117:03
14/07/17 14:3514:54
15:3415:48
16:00
15/07/17 14:3815:14
15:3115:50
16:14
16/07/17 12:1712:33
12:4613:03
13:15
Date
0
0.2
0.4
0.6
0.8
1
Est
imat
ed c
onsc
ious
ness
leve
l
Patient P3
ProductAverage
Figure 6.27: Daily average of the estimated consciousness levels for CLIS patient P3. The x-axis representsthe dates and times of recording.
Fig. 6.28a presents the estimated level of consciousness for patient P3 throughout the experi-ments on 14/07/2017. The experiment started with two training sessions during which it canbe observed that despite a noticeable surge at the end of the first training session, the level ofconsciousness remains low, below 0.4. After an half hour break, three feedback sessions (cf.Section 5.1.2.1) were performed during which higher consciousness levels were estimated. Then,on 15/07/2017, the values of the estimated consciousness levels for patient P3 are consistentlylow, with a mean value of 0.1170/0.2594 (product/average ensemble). The results for thisspecific day are illustrated in Fig. 6.28b. The low values suggest that it is highly probable thatall experiments carried out that day were unsuccessful. This demonstrates the importance ofevaluating the level of consciousness of the patients before attempting to communicate withthem.
Table 6.8 summarises the mean values of the estimated consciousness levels during eachsession on 14 and 15/07/2017 for this patient. The rows in green represent the sessions during
97

6 Results and discussions
14:3
514
:45
14:5
415
:03
15:3
415
:46
15:4
815
:5816
:00
16:1
00
0.2
0.4
0.6
0.8
1
Est
imat
ed c
onsc
ious
ness
leve
l
P3 (14/07/2017)
bci1
.day
2
bci2
.day
2
feed
back
1.da
y2
feed
back
2.da
y2
Res
t1.d
ay2
(a)
14:3
814
:49
15:1
415
:30
15:3
115
:49
15:5
016
:07
16:1
416
:24
Time (HH:MM)
0
0.2
0.4
0.6
0.8
1
Est
imat
ed c
onsc
ious
ness
leve
l
P3 (15/07/2017)
rest
1.da
y3
feed
back
2.da
y3
feed
back
3.da
y3
feed
back
4.da
y3
rest
2.da
y3
(b)
Figure 6.28: Estimated consciousness level for patient P3 (product ensemble) on (a) 14/07/2017 (day 2)and (b) 15/07/2017 (day 3). Blank areas represent period during which no data were recorded. Thedotted lines delimit the start and end of the experiment. Plain vertical lines delimit each session.
which the patient is assessed as being conscious according to the outcomes of the proposedensemble approach. The values are significantly lower compared to 15 July.
The experimenters declared that this patient was only successful in yes and no communicationusing fNRIS from 2014 to 2015, which data were not available, thus not analysed in this research.From the results obtained using the approach presented in this work, it can be concluded thaton one hand, patient P3 was mostly conscious on the first two days of experiments (13/07/2017
and 14/07/2017). On the other hand, it can also be inferred that he was possibly unconsciousthe rest of the time, especially on 15/07/2017.
6.2.2.4 Patient P4
This female patient represents a particular case given the rapid evolution of the conditionin addition to her young age. She is 29 years old and was diagnosed with juvenile ALS inDecember 2012. She was completely paralysed within half a year after diagnosis. She wasable to communicate with the eye-tracking device from early 2013 but was unable to use itafter she lost some control of her eyes in August 2014. She was also trained to communicatewith her family members using eye movements: moving to the right to answer yes and to theleft to answer no. This method was used until the complete loss of eye control in December
98

6.2 CLIS patients
Table 6.8: Mean values of the estimated consciousness level per session on 14 and 15 July 2017 for patientP3. The highlighted rows represent the sessions with a high level of consciousness, during which thepatient was undoubtedly conscious. The values obtained on 15 July suggest that he was unconsciousthat day during the experiment.
2017-07-14 Product ensemble
Average ensemble 2017-07-15 Product
ensembleAverage
ensemblebci1.day2 0,4839 0,4743 rest1.day3 0,1753 0,2970bci2.day2 0,2046 0,3209 feedback2.day3 0,1529 0,2816feedback1.day2 0,8240 0,6649 feedback3.day3 0,0776 0,2328feedback2.day2 0,7800 0,6419 feedback4.day3 0,0651 0,2267Rest1.day2 0,7644 0,6342 rest2.day3 0,1139 0,2587
2014. Subsequently, she attempted to twitch the right corner of her mouth to answer yes, butthis was not reliable, leaving no other alternative for her parents to communicate with her (seeAppendix D.1).
18/0
1/16
14:
4114
:5215
:0415
:15
19/0
1/16
12:
5913
:21
20/0
1/16
17:
4918
:0418
:1618
:26
21/0
1/16
12:
5413
:46
22/0
1/16
12:
0612
:1912
:3112
:4012
:5012
:57
27/0
3/19
13:
3213
:4113
:5314
:05
28/0
3/19
13:
2213
:3213
:43
08/0
7/19
16:
0416
:1616
:3216
:48
09/0
7/19
12:
5413
:0813
:2713
:4714
:06
10/0
7/19
12:
1812
:3712
:5613
:1816
:0616
:2416
:40
11/0
7/19
12:
4413
:0713
:2913
:4516
:2416
:4817
:04
Date
0
0.2
0.4
0.6
0.8
1
Est
imat
ed c
onsc
ious
ness
leve
l
Patient P4
ProductAverage
Figure 6.29: Average estimate of the consciousness level of CLIS patient P4. The x-axis represents the datesand times of recording.
The EEG data from patient P4 were recorded in 2016 and 2019. Each day of recordingcomprises 2 to 7 sessions. Fig. 6.29 illustrates the estimates of her levels of consciousness.At first sight, high values of the consciousness levels are observed on 2016. However, thevalues decreased in 2019, especially for the product ensemble. Accordingly, it can be deducedthat patient P4 was mostly conscious in 2016, but the probability that she was also consciousin 2019 is very low. Communication attempts when the estimated consciousness levels arehigh would undoubtedly be successful. In point of fact, the experimenters declared that shewas only able to communicate using fNRIS from 2014 to 2016. Nonetheless, variations in theestimated consciousness level in 2016, imply that the patient was undoubtedly unconsciousduring some sessions. For example, on 19/01/2016 and 20/01/2016 both during the firstsession. Coincidentally, these two sessions are rest sessions. This means that this patient wasactually "resting" during these periods.
99

6 Results and discussions
6.2.2.5 Patient P6
CLIS patient P6 was diagnosed with bulbar ALS in 2009. He lost speech and was unable tomove from 2010. He is in home care. No communication with whatever means was possiblesince 2012. This patient died in 2019 [Mal+19; Sec+21] (also see Appendix D.1).
29/0
5/17
14:
1814
:33
14:4
715
:00
15:1
430
/05/
17 1
5:38
15:4
916
:00
16:1
716
:48
17:0
231
/05/
17 1
8:06
18:2
018
:36
19:0
501
/06/
17 1
8:56
19:0
519
:20
19:3
719
:53
20:0
920
:20
20:2
602
/06/
17 1
5:06
15:2
115
:41
15:5
916
:32
03/0
6/17
09:
5710
:13
10:2
710
:41
10:5
511
:21
11:3
715
/04/
18 1
3:25
13:3
713
:51
14:0
614
:26
16/0
4/18
14:
4214
:57
15:1
715
:44
17/0
4/18
10:
3310
:48
21/0
5/18
12:
5413
:01
13:2
313
:38
13:5
114
:07
14:1
722
/05/
18 1
2:20
12:2
612
:48
13:0
013
:17
14:0
414
:19
23/0
5/18
12:
4712
:54
13:1
813
:34
13:5
014
:06
14:2
524
/05/
18 1
2:29
12:3
913
:01
13:1
313
:16
13:3
013
:45
14:0
225
/05/
18 1
0:57
11:1
011
:26
11:4
112
:03
26/0
9/18
12:
5413
:07
13:2
713
:41
13:5
814
:15
27/0
9/18
12:
1612
:28
12:5
013
:07
13:2
013
:53
13:5
414
:20
28/0
9/18
12:
0612
:22
12:4
613
:03
13:1
913
:36
14:0
229
/09/
18 1
3:35
13:5
014
:16
14:2
914
:44
14:5
715
:11
17/0
1/19
13:
2713
:38
13:4
914
:15
14:3
518
/01/
19 1
3:22
13:3
813
:53
14:1
914
:47
11/0
2/19
13:
1813
:33
13:3
913
:49
14:0
414
:19
14:2
512
/02/
19 1
2:53
13:0
313
:12
13:4
813
:52
13:5
313
:54
13:5
513
:56
14:0
714
:22
14:3
014
:40
14:5
715
:05
15:1
013
/02/
19 1
2:55
13:1
313
:25
13:3
513
:52
14:0
814
:16
14:3
214
:49
Date
0
0.2
0.4
0.6
0.8
1
Est
imat
ed c
onsc
ious
ness
leve
l
Patient P6
ProductAverage
Figure 6.30: Daily average of the estimated consciousness level for CLIS patient P6. The x-axis representsthe dates and times of recording.
Three years of recordings were available for this patient, from 2017 to 2019. Fig. 6.30 showsthe patient’s consciousness level determined as a result of the clustering analysis presented inthis thesis. The values are very small for both ensemble methods. Additionally, a substantialdrop is observed starting in 2018 with the product ensemble but the changes do not appearso drastic for the average ensemble. Nonetheless, these low values imply that there is a highprobability that patient P6 was actually never conscious during these recordings. However, theexperimenters reported a successful yes/no communication using fNRIS in 2017. The clusteringanalysis determined mean values of 0.1313 for the product ensemble and 0.2188 for the averageensemble that year. Nevertheless, these seemingly low values may probably be enough for thepatient to perform the tasks.
6.2.2.6 Patient P10
This patient is in locked-in state and on the verge of CLIS. He is also the youngest patientin this group (25 years old). Patient P10 was diagnosed with familial juvenile ALS withALS 6-FUS gene mutation25 in December 2012. He was completely paralysed within a yearafter the diagnosis. He used an eye-tracking device to communicate starting at the beginningof 2014 until he lost eye control in August 2016. The patient was unable to communicateafterwards [Mal+19] (also see Appendix D.1).
The daily average of the estimated level of consciousness for patient P10 is illustrated inFig. 6.31. The analysed data were from 2017 and 2018, with 2 days of recordings comprising5 to 6 sessions each. Among all the CLIS patients, patient P10 displayed the lowest level of
25In 10% of the cases, ALS neurodegenerative disease that is familial. This is caused by a missense mutation in theFUS (Fused in Sarcoma) gene encoding. This mutation causes familial ALS type 6 [Van+09].
100

6.2 CLIS patients
consciousness according the method presented in this thesis. These values are extremely lowundoubtedly indicating that patient P10 was unconscious during the course of all recordings.It is hypothesised that the patient’s performance in answering the questions increases with ahigher level of consciousness. Consequently, the results suggest that no successful commu-nication could ever established with this patients. Indeed, the experimenters reported thatthis patient was brain dead. Unsurprisingly, he was also never successful with the yes and nocommunication using fNRIS.
29/06/17 15:1015:24
15:3715:54
16:1316:24
30/06/17 14:2014:48
15:0115:12
09/07/18 18:2618:46
18:5719:13
19:2419:38
10/07/18 18:1718:31
18:4318:56
19:12
Date
0
0.2
0.4
0.6
0.8
1
Est
imat
ed c
onsc
ious
ness
leve
l
Patient P10
ProductAverage
Figure 6.31: Estimated consciousness levels for CLIS patient P10. The x-axis represents the dates and timesof recording.
6.2.3 Discussion II
The results obtained by the soft-clustering approach proposed in this thesis were comparedto the performances of the patients using fNRIS (reported by the experimenters) when avail-able. While EEG measures the electrical activity of the brain, fNRIS determines the corticalhaemodynamic response of the brain to a neural activity [GIM18; Sub19]. An investigationusing TMS in the cortex of cats revealed that the fluctuations in oxygen concentration in thebrain are correlated with brain electrical activity [Mil07; All+07]. It can be assumed then thatthis also applied to human brain, justifying the legitimacy of the comparison. Overall, theobtained results are validated by the report of the experimenters regarding the patient’s per-formance with the fNRIS-based BCI. For patient P6 in particular, although the experimentersreported that he was able to communicate using fNRIS until 2017, the obtained estimationsof his consciousness levels were less than 0.3. Considering the evaluation of the performanceof the clustering approach on data from the DoC patients in Section 6.1.3, either the patientwas unconscious or the minimum threshold for him to be able to perform the task was alreadyachieved. This, combined with the previously obtained results from patient GR, consequentlyprove the effectiveness of the proposed approach and validate the hypothesis introduced inSection 4.2.
Sadly, patients P1 and P7 passed away in 2019, and patients P2 and P6 in 2018. The resultsof the clustering analysis determined that the consciousness levels of P1, P6 and P7 patientsdecreased shortly prior their death (cf. Figs. 6.24 and 6.30, and Fig. D.2 in Appendix D).Unfortunately, only data from 2015 was available for the patient P2, so no such finding could be
101

6 Results and discussions
substantiated. Nonetheless, the quasi similar behaviour of the estimated levels of consciousnessof the three patients begs the question whether this decrease could be an indicator of patients’decline and/or predict their death. To get a definite answer, a study in that direction should beextended to a larger number of patients.
On one hand, an increase of consciousness level was detected when feedback are provided tothe patients. This was for instance the case for patients P3, P6, P7 and P9. This tendency maybe explained by the fact that feedback is among the key factors of a successful experience sinceit boosts the patient’s motivation and engagement [vWL15]. Nevertheless, as the patients tran-sition from locked-in to completely locked-in states, a decrease of the EEG power is observed,shifting it toward the δ and θ bands [Sec+21]. This decrease also apply to other characteristicssuch as the brain signal complexity [Ada+20]. The more time the patient spends in CLIS, themore important this decline is, although it can be delayed by providing them with means ofcommunication, especially using BCIs [Sec+21]. Subsequently, this stresses the importance ofcontinuously communicating and interacting with the patients.
6.3 Summary
This chapter reported the results of the soft-clustering approaches used to estimate differentpatients’ consciousness level. When applied to the data of DoC patients, the proposed approachwas able to convey the characteristics of most of the features, although some of them arecontradictory. Some limitations of the method were found, but were overcome using pre-defined centroids on the CLIS patients’ data. The results obtained this time were corroboratedby the experimenters’ observations and/or the patients’ performance using another brainimaging technique (fNRIS). What’s more, it also estimated low values indicating the absence ofconsciousness for one of the patient that was brain dead. In the end, keeping these differentresults in mind, the proposed approach was able to achieve the aim that was established at thebeginning of this thesis. Its limitations, implications as well as possible future works will bebriefly introduced in the next chapter before concluding this thesis.
102

7 Conclusions
There is no real ending. It’s just the placewhere you stop the story.
Frank Herbert
7.1 Summary
In the present work, the task of assessing the levels of consciousness of completely locked-inpatients was undertaken. Patients with this condition are entirely paralysed but retain theircognitive abilities. A major problem with this state is that there is no ground-truth relatingto the patients’ actual states of consciousness. This means that there is no definite way to besure if they are conscious or not at a given time since on one hand, no behavioural responsescan be detected and on the other hand, the patients themselves cannot overtly voice theirstates. CLIS patients are often misdiagnosed as in a vegetative state, which subsequentlyleads to inappropriate care. A proper care not only improves their quality of life by allowingthem to express themselves, but also enhances their prognosis. The ability to communicateconstitutes a crucial factor of this improvement, and is made possible by the use of brain-computer interfaces. Nonetheless, the majority of existing studies attempted communicatingwith the patients without taking into account if they are conscious and/or willing to do so.
In this thesis, the determination of the consciousness levels comes into play to determine theoptimal time to communicate with the patients instead of randomly starting the experiments.In order to maximise the probability of detecting the patients’ actual state, a group of diversesignal characteristics including spectral and complexity measures as well as connectivity metricswere used. The idea behind the combined use of these different features was because each ofthem may extract additional information that can not be obtained from the others. The featureswere computed for each channel or pair of channels and subsequently averaged across all ofthem. The obtained results were then input to two soft-clustering methods, Fuzzy c-meansand Gaussian mixture models, which outputs were later combined using their product and/oraverage to obtain a unique outcome. The use of soft-clustering was preferred to hard-clusteringsince instead of a binary decision regarding the patient’s consciousness state, a probability ofthe patient being conscious was desired.
The proposed approach was first applied to data from DoC patients since according toprevious studies, their levels of consciousness are lower than that of LIS and CLIS patients,
103

7 Conclusions
which levels are assumed to be comparable to those of healthy subjects. The approach wassubsequently evaluated using eyes scoring recorded along the EEG signal of the same DoCpatients. It was also applied to data from one CLIS patient which is unique since it is theonly one where the experimenter could identify one time frame during which said patient wasactually conscious. Consequently, if the method manages to correctly estimate the patients’level of consciousness in these two cases, it is highly probable that it can correctly estimate thatof the remaining CLIS patients in this work.
The obtained results revealed that the method proposed in this thesis was able to emulatethe collective increases and decreases of the different EEG measures reflecting the patients’consciousness levels. However, this level was accurately determined under the condition thatthe clusters centroids are distant from each other. This means that there should be enoughdata so that all possible states (from unconscious to conscious) are represented. Given the rarityof EEG data acquired from CLIS patients, this condition is certainly difficult to fulfil. So, toremedy to this situation, pre-determined parameters were subsequently employed to cluster thedata from the remaining CLIS patients. By comparing these results to informations provided bythe experimenters, the proposed approach was again capable of determining the possible levelsof consciousness of the patients. Furthermore, the results appear to presage patient’s death, inwhich case a decrease of their levels of consciousness was observed in the months precedingtheir death. These observations were detected in all except one patient that passed away due todata unavailability. Nonetheless, more data are needed to corroborate these observations.
One major limitation of the presented work is evidently the lack of data from CLIS patients,leading to the use of these pre-defined centroids for the clustering analysis. In addition, nofeatures selection were performed, i.e. all the EEG measures were used regardless if theypositively or negatively influence the results. Despite these restrictions however, the proposedapproach was able to accurately determine the patients’ levels of consciousness for the majorityof the DoC patients and all the CLIS patients. This approach can be used as an additional tool tothe traditional behavioural tests to help clinicians reduce the misdiagnosis rate of (completely)locked-in patients. Furthermore, given the importance of communication to such patientsand to avoid unnecessary fatigue, it can also be used as a preliminary step before initiatecommunication with the patient. That way, it can be established only when the patient isconscious enough.
The method proposed in this thesis was able to correctly evaluate the levels of conscious-ness of different group of patients in vegetative and minimally conscious states, but moreimportantly in completely locked-in patients, using a combination of different EEG signal char-acteristics. This thesis constitutes a step toward improving the lives of CLIS patients. To theauthor’s knowledge, no such investigation to detect CLIS patients’ consciousness levels usingthe different features used in this work, as well as the soft-clustering analysis exist at this time.
104

7.2 Outlook
7.2 Outlook
In the approach proposed in this thesis, all features are weighted equally and no selection wereperformed. However, every patient is different and some features may be more relevant thanothers for each individual. Future work will primarily focus on tailoring the features to eachCLIS patient. The list of features employed in this research are not exhaustive. Additional EEGcharacteristics can be added in view of gathering more hidden patterns and ameliorate thesystem. Furthermore, since levels of consciousness are provided as output of the clusteringanalysis and that in Section 6.1.3, it was reported that the performance of the cluster analysisdepended on the value of the threshold chosen to separate unconscious and conscious states,an automatic and personalised detection of this threshold will be developed. As mentionedin Section 3.1, family members are primarily the ones that first discover that the patient wasconscious. They are familiar with them and are consequently more likely to know how theyappear when they are conscious. Therefore, all future works will involve and require theircontributions. Their input will be used to adaptively select useful features for each patient inthe first case, and to determine the optimal threshold in the second case.
Since the principal goal was to assess consciousness of the patients before any attempt tocommunicate with them, the next step will be an online implementation of the system. Thisrequires of course a continuous recording of the patient’s EEG. Since the computation of LZCand wSMI are time consuming, an output of the patient’s state can be provided by the systemevery few minutes to allow time for calculation. A duration of five to ten minutes alike thelength of the sessions during the experiments with CLIS patients seems appropriate.
105

Bibliography
[AB18] V. S. Adama and M. Bogdan. “Stroke Rehabilitation and Parkinson’s DiseaseTremor Reduction Using BCIs Combined With FES”. In: International Journalof Privacy and Health Information Management (IJPHIM) 6.1 (2018), pages 20–36.doi: 10.4018/IJPHIM.2018010102.
[AB21a] S. Adama and M. Bogdan. “Yes/No Classification of EEG data from CLISpatients”. In: 43rd Annual International Conference of the IEEE Engineering inMedicine and Biology Society (EMBC). 2021, pages 1–6.
[AB21b] V. S. Adama and M. Bogdan. “Consciousness Detection in Complete Locked-inState Patients using Electroencephalogram Coherency and Artificial NeuralNetworks”. In: Sensor Networks and Signal Processing. Volume 176. Smart Innova-tion, Systems and Technologies. Singapore: Springer, 2021, pages 397–409. doi:10.1007/978-981-15-4917-5_29.
[Abo+06] M. Aboy, R. Hornero, D. Abasolo, and D. Alvarez. “Interpretation of theLempel-Ziv Complexity Measure in the Context of Biomedical Signal Anal-ysis”. In: IEEE Transactions on Biomedical Engineering 53.11 (2006), pages 2282–2288. doi: 10.1109/TBME.2006.883696.
[Ada+19a] V. S. Adama, A. Blankenburg, C. Ernst, R. Kummer, S. Murugaboopathy, and M.Bogdan. “Motion Detection in Videos of Coherence Matrices in order to detectConsciousness States in CLIS-patients - an Approach”. In: Abstracts of the 10thEUROSIM Congress on Modelling and Simulation. 2019. isbn: 978-3-901608-92-6.doi: 10.11128/arep.58.
[Ada+19b] V. S. Adama, S.-J. Wu, N. Nicolaou, and M. Bogdan. “Extendable Hybrid ap-proach to detect conscious states in a CLIS patient using machine learning”. In:Abstracts of the 10th EUROSIM Congress on Modelling and Simulation. 2019. isbn:978-3-901608-92-6. doi: 10.11128/arep.58.
[Ada+20] S. Adama, U. Chaudhary, N. Birbaumer, and M. Bogdan. “Longitudinal Anal-ysis of the Connectivity and Complexity of Complete Locked-in SyndromePatients Electroencephalographic signal”. In: IEEE International Conference onBioinformatics and Biomedicine, BIBM 2020, Virtual Event, South Korea, December16-19, 2020. Edited by Taesung Park, Young-Rae Cho, Xiaohua Hu, Illhoi Yoo,Hyun Goo Woo, Jianxin Wang, Julio C. Facelli, Seungyoon Nam, and MingonKang. IEEE, 2020, pages 958–962. doi: 10.1109/BIBM49941.2020.9313391.
[Ada+21] V. S. Adama, S.-J. Wu, N. Nicolaou, and M. Bogdan. “Extendable Hybrid ap-proach to detect conscious states in a CLIS patient using machine learning”. In:Simulation Notes Europe SNE 31.4 (2021). In print.
107

Bibliography
[All+07] E. A. Allen, B. N. Pasley, T. Duong, and R. D. Freeman. “Transcranial Mag-netic Stimulation Elicits Coupled Neural and Hemodynamic Consequences”.In: Science 317.5846 (2007), pages 1918–1921. doi: 10.1126/science.1146426.
[Alp09] E. Alpaydin. Introduction to Machine Learning, Second Edition. Adaptive Computa-tion and Machine Learning series. The MIT Press, 2009. isbn: 978-0262303262.
[AMK09] V. Abootalebi, M. H. Moradi, and M. A. Khalilzadeh. “A new approach forEEG feature extraction in P300-based lie detection”. In: Computer Methods andPrograms in Biomedicine 94.1 (2009), pages 48–57. doi: 10.1016/j.cmpb.2008.10.001.
[Ann+20] J. Annen, I. Mertel, R. Xu, C. Chatelle, D. Lesenfants, R. Ortner, E. A. C. Bonin,C. Guger, S. Laureys, and F. Müller. “Auditory and Somatosensory P3 Are Com-plementary for the Assessment of Patients with Disorders of Consciousness”. In:Brain Sciences 10.10 (2020). issn: 2076-3425. doi: 10.3390/brainsci10100748.url: https://www.mdpi.com/2076-3425/10/10/748.
[ANV20] A. S. Assiri, S. Nazir, and S. A. Velastin. “Breast Tumor Classification Using anEnsemble Machine Learning Method”. In: Journal of Imaging 6.6 (2020). issn:2313-433X. doi: 10.3390/jimaging6060039.
[aut74] Unknown author(s). “A glossary of terms most commonly used by clinicalelectroencephalographers”. In: Electroencephalography and clinical neurophysiology37.5 (1974), 538—548. issn: 0013-4694. doi: 10.1016/0013-4694(74)90099-6.
[Bau05] G. Bauer. “Coma and Brain Death”. In: Electroencephalography: Basic principles,Clinical applications, and related Fields. Edited by E. Niedermeyer and F. L. daSilva. Fifth edition. Philadelphia, USA: Lippincott Williams & Wilkins (LWW),2005, pages 167–192. doi: 978-0-78-178942-4.
[BCP16] M. F. Bear, B. W. Connors, and M. A. Paradiso. Neuroscience: Exploring the Brain.4th edition. Wolters Kluwer, 2016. isbn: 978-0-7817-7817-6.
[Ben+07] M. Bensch, A. A. Karim, J. Mellinger, T. Hinterberger, M. Tangermann, M. Bog-dan, W. Rosenstiel, and N. Birbaumer. “Nessi: an EEG-controlled web browserfor severely paralyzed patients”. In: Computational intelligence and neuroscience71863 (2007). doi: 10.1155/2007/71863.
[Ben+14] M. Bensch, S. Martens, S. Halder, J. Hill, F. Nijboer, A. Ramos, N. Birbaumer,M. Bogdan, B. Kotchoubey, W. Rosenstiel, B. Schölkopf, and A. Gharabaghi.“Assessing attention and cognitive function in completely locked-in state withevent-related brain potentials and epidural electrocorticography”. In: Journal ofNeural Engineering 11.2 (Feb. 2014), page 026006. doi: 10.1088/1741-2560/11/2/026006.
[Bez81] J. C. Bezdek. Pattern Recognition with Fuzzy Objective Function Algorithms. 1stedition. Springer, Boston, MA, 1981. isbn: 978-0-306-40671-3. doi: 10.1007/978-1-4757-0450-1.
108

Bibliography
[Bir+00] N. Birbaumer, A. Kubler, N. Ghanayim, T. Hinterberger, J. Perelmouter, J. Kaiser,I. Iversen, B. Kotchoubey, N. Neumann, and H. Flor. “The thought translationdevice (TTD) for completely paralyzed patients”. In: IEEE Transactions on Reha-bilitation Engineering 8.2 (2000), pages 190–193. doi: 10.1109/86.847812.
[Bir+99] N. Birbaumer, N. Ghanayim, T. Hinterberger, I. Iversen, B. Kotchoubey, A.Kübler, J. Perelmouter, E. Taub, and H. Flor. “A spelling device for the paral-ysed”. In: Nature 398 (1999), 297–298. doi: 10.1038/18581.
[Bis06] C. Bishop. Pattern Recognition and Machine Learning. Springer, Jan. 2006. url:https://www.microsoft.com/en-us/research/publication/pattern-recognition-machine-learning/.
[Bor+13] J. Borjigin, U. Lee, T. Liu, D. Pal, S. Huff, D. Klarr, J. Sloboda, J. Hernandez,M. M. Wang, and G. A. Mashour. “Surge of neurophysiological coherenceand connectivity in the dying brain”. In: Proc Natl Acad Sci USA 110.35 (2013),pages 14432–7. doi: 10.1073/pnas.1308285110.
[Bou+20] P. Bourdillon, B. Hermann, M. Guénot, H. Bastuji, J. Isnard, J.-R. King, J. Sitt,and L. Naccache. “Brain-scale cortico-cortical functional connectivity in thedelta-theta band is a robust signature of conscious states: an intracranial andscalp EEG study”. In: Scientific Reports 10.14037 (2020).
[BPL08] M.-A. Bruno, F. Pellas, and S. Laureys. “Quality of Life in Locked-in SyndromeSurvivors”. In: Yearbook of Intensive Care and Emergency Medicine. Edited by J-L. (Ed.) Vincent. Springer-Verlag Berlin Heidelberg, 2008, pages 881–890. doi:10.1007/978-3-540-77290-3.
[BR15] T. Burns and R. Ramesh. Combining complexity measures of EEG data: multiplyingmeasures reveal previously hidden information - Script. June 2015. doi: 10.12688/f1000research . 6590 . 1. url: https : / / github . com / tfburns / MATLAB -functions- for- complexity- measures- of- one- dimensional- signals.Accessed: 03/12/2020.
[Bru+11] M.-A. Bruno, A. Vanhaudenhuyse, A. Thibaut, G. Moonen, and S. Laureys.“From unresponsive wakefulness to minimally conscious PLUS and functionallocked-in syndromes: recent advances in our understanding of disorders ofconsciousness”. In: Journal of Neurology 258.7 (2011), pages 1373–84. doi: 10.1007/s00415-011-6114-x.
[BZ11] K. J. Blinowska and J. Zygierewicz. Practical Biomedical Signal Analysis UsingMATLAB. 1st edition. CRC Press, Inc., 2011. isbn: 978-1439812020.
[CF14] G. W. Corder and D. I. Foreman. “Comparing More Than Two Related Samples:The Friedman Test”. In: Nonparametric Statistics: A Step-by-Step Approach, 2ndEdition. John Wiley & Sons, Inc., 2014. isbn: 978-1-118-84031-3.
[Cha+17] U. Chaudhary, B. Xia, S. Silvoni, L. G. Cohen, and N. Birbaumer. “Brain–ComputerInterface–Based Communication in the Completely Locked-In State”. In: PLOSBiology 15.1 (Jan. 2017), pages 1–25. doi: 10.1371/journal.pbio.1002593.
109

Bibliography
[Cha+18] U. Chaudhary, B. Xia, S. Silvoni, L. G. Cohen, and N. Birbaumer. “Correction:Brain-Computer Interface-Based Communication in the Completely Locked-InState”. In: PLOS Biology 16.12 (Dec. 2018), pages 1–4. doi: 10.1371/journal.pbio.3000089.
[Cha+20] U. Chaudhary, I. Vlachos, J. B. Zimmermann, A. Espinosa, A. Tonin, A.Jaramillo-Gonzalez, M. Khalili-Ardali, H. Topka, J. Lehmberg, G. M. Friehs,A. Woodtli, J. P. Donoghue, and N. Birbaumer. “Verbal Communication usingIntracortical Signals in a Completely Locked In-Patient”. In: medRxiv (2020).doi: 10.1101/2020.06.10.20122408. eprint: https://www.medrxiv.org/content/early/2020/06/25/2020.06.10.20122408.full.pdf.
[Che+17] S. Chennu, J. Annen, S. Wannez, A. Thibaut, C. Chatelle, H. Cassol, G. Martens,C. Schnakers, O. Gosseries, D. Menon, and S. Laureys. “Brain networks pre-dict metabolism, diagnosis and prognosis at the bedside in disorders of con-sciousness”. In: Brain 140.8 (June 2017), pages 2120–2132. issn: 0006-8950. doi:10.1093/brain/awx163.
[Chi94] S. L. Chiu. “Fuzzy Model Identification Based on Cluster Estimation”. In: J.Intell. Fuzzy Syst. 2.3 (May 1994), 267–278.
[CMKB21] U. Chaudhary, N. Mrachacz-Kersting, and N. Birbaumer. “Neuropsychologicaland neurophysiological aspects of brain-computer-interface (BCI) control inparalysis”. In: The Journal of Physiology 599.9 (2021), pages 2351–2359. doi:10.1113/JP278775.
[Coh14] M. X. Cohen. Analyzing neural time series data. Theory and practice. The MIT Press,2014. isbn: 9780262319553. doi: 10.7551/mitpress/9609.001.0001.
[Com+13] A. Combaz, C. Chatelle, A. Robben, G. Vanhoof, A. Goeleven, V. Thijs, M. M.Van Hulle, and S. Laureys. “A comparison of two spelling Brain-ComputerInterfaces based on visual P3 and SSVEP in Locked-In Syndrome”. In: PloS one8.9 (2013), e73691. issn: 1932-6203. doi: 10.1371/journal.pone.0073691.
[DHI05] B. Dworetzky, S. Herman, and W. O. Tatum IV. “Artifacts of Recordings”.In: Electroencephalography: Basic principles, Clinical applications, and related Fields.Edited by E. Niedermeyer and F. L. da Silva. Fifth edition. Philadelphia, USA:Lippincott Williams & Wilkins (LWW), 2005, pages 167–192. doi: 978-0-78-178942-4.
[Dro06] W. van Drongelen. Signal Processing for Neuroscientists. An Introduction tothe Analysis of Physiological Signals. 1st edition. Academic Press, 2006. isbn:9780080467757.
[Eag+18] S. L. Eagleman, D. A. Vaughn, D. R. Drover, C. M. Drover, M. S. Cohen, N.T. Ouellette, and M. B. MacIver. “Do Complexity Measures of Frontal EEGDistinguish Loss of Consciousness in Geriatric Patients Under Anesthesia?” In:Frontiers in Neuroscience 12 (2018), page 645. issn: 1662-453X. doi: 10.3389/fnins.2018.00645.
110

Bibliography
[Eng+18] D. A. Engemann, F. Raimondo, J.-R. King, B. Rohaut, G. Louppe, F. Faugeras, J.Annen, H. Cassol, O. Gosseries, D. Fernandez-Slezak, S. Laureys, L. Naccache,S. Dehaene, and J. D. Sitt. “Robust EEG-based cross-site and cross-protocolclassification of states of consciousness”. In: Brain 141.11 (Oct. 2018), pages 3179–3192. issn: 0006-8950. doi: 10.1093/brain/awy251.
[FDC13] R. Formisano, M. D’Ippolito, and S. Catani. “Functional locked-in syndromeas recovery phase of vegetative state”. In: Brain Injury 27.11 (2013), pages 1332–1332. doi: 10.3109/02699052.2013.809555.
[FG20] M. B. Ferraro and P. Giordani. “Soft clustering”. In: WIREs Computational Statis-tics 12.1 (2020), e1480. doi: 10.1002/wics.1480.
[Fin19] M. Finetti. Scientific Misconduct: DFG Imposes Sanctions Against Brain ResearcherNiels Birbaumer and Research Associate. Sept. 2019. url: https://www.dfg.de/en/service/press/press_releases/2019/press_release_no_46/index.html. Accessed: 20/05/2021.
[Fis36] R. A. Fisher. “The use of multiple measurements in taxonomic problems”. In:Annals of Eugenics 7.2 (1936), 179–188. doi: 10.1111/j.1469- 1809.1936.tb02137.x.
[Fre+19] Z. V. Freudenburg, M. P. Branco, S. Leinders, B. H. van der Vijgh, E. G. M. Pels,T. Denison, L. H. van den Berg, K. J. Miller, E. J. Aarnoutse, N. F. Ramsey,and M. J. Vansteensel. “Sensorimotor ECoG Signal Features for BCI Control:A Comparison Between People With Locked-In Syndrome and Able-BodiedControls”. In: Frontiers in Neuroscience 13 (2019), page 1058. issn: 1662-453X.doi: 10.3389/fnins.2019.01058.
[G+21] U. Górska, A. Rupp, T. Celikel, and B. Englitz. “Assessing the state of conscious-ness for individual patients using complex, statistical stimuli”. In: NeuroImage:Clinical 29 (2021), page 102471. issn: 2213-1582. doi: 10.1016/j.nicl.2020.102471.
[Gao+19] J. Gao, M. Wu, Y. Wu, and P. Liu. “Emotional consciousness preserved inpatients with disorders of consciousness?” In: Neurol Sci 40.7 (2019), pages 1409–1418. doi: 10.1007/s10072-019-03848-w.
[Gaz99] M. S. Gazzaniga. The new Cognitive Neurosciences. Second Edition. The MITPress, 1999. isbn: 978-0262071956.
[GIM18] M. S. Gazzaniga, R. B. Ivry, and G. R. Mangun. Cognitive Neuroscience: TheBiology of the Mind. 5th Edition. W. W. Norton & Company, 2018. isbn: 978-0393603170.
[GM08] J. T. Giacino and R. Malone. “The Vegetative and Minimally Conscious States”.In: Disorders of Consciousness. Edited by Young and Wijdicks. Volume 90. Hand-book of Clinical Neurology. Elsevier, 2008, pages 99–111. doi: https://doi.org/10.1016/S0072-9752(07)01706-X.
111

Bibliography
[Gol+11] A. M. Goldfine, J. D. Victor, M. M. Conte, J. C. Bardin, and N. D. Schiff. “Deter-mination of awareness in patients with severe brain injury using EEG powerspectral analysis”. In: Clinical Neurophysiology 122.11 (2011), pages 2157–2168.issn: 1388-2457. doi: 10.1016/j.clinph.2011.03.022.
[Gol13] A. K. Golinska. “Poincaré Plots in Analysis of Selected Biomedical Signals”. In:Studies in Logic, Grammar and Rethoric 35.48 (2013). doi: 10.2478/slgr-2013-0031.
[Gos+09] O. Gosseries, M.-A. Bruno, A. Vanhaudenhuyse, S. Laureys, and C. Schnakers.“Consciousness in the Locked-in Syndrome”. In: The Neurology of Conscious-ness. Edited by S. Laureys and G. Tononi. San Diego: Academic Press, 2009,pages 191–203. isbn: 978-0-12-374168-4. doi: 10.1016/B978-0-12-374168-4.00015-0.
[Gos+11] O. Gosseries, A. Vanhaudenhuyse, M.-A. Bruno, A. Demertzi, C. Schnakers, M.M. Boly, A. Maudoux, G. Moonen, and S. Laureys. “Disorders of Consciousness:Coma, Vegetative and Minimally Conscious States”. In: States of Consciousness.Edited by D. Cvetkovic and I. Cosic. The Frontiers Collection. Berlin, Heidelberg:Springer, 2011, pages 29–55. doi: 10.1007/978-3-642-18047-7_2.
[Gos+14a] O. Gosseries, H. Di, S. Laureys, and M. Boly. “Measuring consciousness inseverely damaged brains.” In: Annu Rev Neurosci. 37.4 (2014), pages 457–78.doi: 10.1146/annurev-neuro-062012-170339.
[Gos+14b] O. Gosseries, A. Thibaut, M. Boly, M. Rosanova, M. Massimini, and S. Laureys.“Assessing consciousness in coma and related states using transcranial magneticstimulation combined with electroencephalography”. In: Annales Françaisesd’Anesthésie et de Réanimation 33.2 (2014), pages 65–71. issn: 0750-7658. doi:10.1016/j.annfar.2013.11.002.
[Gug+17] C. Guger, R. Spataro, B. Z. Allison, A. Heilinger, R. Ortner, W. Cho, and V.La Bella. “Complete Locked-in and Locked-in Patients: Command FollowingAssessment and Communication with Vibro-Tactile P300 and Motor ImageryBrain-Computer Interface Tools”. In: Frontiers in Neurology 251.11 (2017). doi:10.3389/fnins.2017.00251.
[Han+19] C.-H. Han, Y.-W. Kim, D. Y. Kim, S. H. Kim, Z. Nenadic, and C.-H. Im.“Electroencephalography-based endogenous brain–computer interface for on-line communication with a completely locked-in patient”. In: J NeuroEngineeringRehabil 16.18 (2019). doi: 10.1186/s12984-019-0493-0.
[Hei+18] A. Heilinger, R. Ortner, V. La Bella, Z. R. Lugo, C. Chatelle, S. Laureys, R.Spataro, and C. Guger. “Performance Differences Using a Vibro-Tactile P300 BCIin LIS-Patients Diagnosed With Stroke and ALS”. In: Frontiers in Neuroscience12 (2018), page 514. doi: 10.3389/fnins.2018.00514.
[Hen+15] T. S. Henriques, S. Mariani, A. Burykin, F. Rodrigues, T. F. Silva, and A. L.Goldberger. “Multiscale Poincaré plots for visualizing the structure of heartbeattime series”. In: BMC Med Inform Decis Mak 16.17 (2015). doi: 10.1186/s12911-016-0252-0.
112

Bibliography
[Hit15] S. Hitziger. “Modeling the variability of electrical activity in the brain”. PhDthesis. 2015. url: https://tel.archives-ouvertes.fr/tel-01175851.
[HMB03] T. Hinterberger, J. Mellinger, and N. Birbaumer. “The Thought TranslationDevice: structure of a multimodal brain-computer communication system”. In:First International IEEE EMBS Conference on Neural Engineering, 2003. ConferenceProceedings. 2003, pages 603–606. doi: 10.1109/CNE.2003.1196900.
[HMS14] K. Hayashi, N. Mukai, and T. Sawa. “Poincaré analysis of the electroencephalo-gram during sevoflurane anesthesia”. In: Clinical Neurophysiology 126 (2014).doi: 10.1016/j.clinph.2014.04.019.
[HWC14] M. Hollander, D. A. Wolfe, and E. Chicken. Nonparametric Statistical Methods.2nd edition. John Wiley & Sons, Inc., 2014. isbn: 978-1-118-55329-9.
[Imp+19] L. S. Imperatori, M. Betta, L. Cecchetti, A. Canales-Johnson, E. Ricciardi, F.Siclari, P. Pietrini, S. Chennu, and G. Bernardi. “EEG functional connectivitymetrics wPLI and wSMI account for distinct types of brain functional interac-tions”. In: Sci Rep 8894 (9 2019). doi: 10.1038/s41598-019-45289-7.
[IRV14] S. A. Imtiaz and E. Rodriguez-Villegas. “A Low Computational Cost Algorithmfor REM Sleep Detection Using Single Channel EEG”. In: Ann Biomed Eng 42
(2014), 2344–2359. doi: 10.1007/s10439-014-1085-6.
[Jam+13] G. James, D. Witten, T. Hastie, and R. Tibshirani. “Unsupervised Learning”. In:An Introduction to Statistical Learning. Volume 103. Springer Texts in Statistics.New York, NY: Springer, 2013. isbn: 978-1-4614-7137-0. doi: 10.1007/978-1-4614-7138-7_10.
[Jas58] H. H. Jasper. “The ten-twenty electrode system of the International Federation”.In: Electroenceph. clin. Neurophysiol. 10 (1958), pages 371–375. doi: 10.1371/journal.pone.0190458.
[JR20] R. Jain and A. G. Ramakrishnan. “Electrophysiological and NeuroimagingStudies – During Resting State and Sensory Stimulation in Disorders of Con-sciousness: A Review”. In: Frontiers in Neuroscience 14 (2020), page 987. issn:1662-453X. doi: 10.3389/fnins.2020.555093.
[K+01] A. Kübler, B. Kotchoubey, J. Kaiser, J. R. Wolpaw, and N. Birbaumer. “Brain-computer communication: Unlocking the locked in”. In: Psychological Bulletin127.3 (2001), pages 358–375. doi: 10.1037/0033-2909.127.3.358.
[K+09] A. Kübler, A. Furdea, S. Halder, E. M. Hammer, F. Nijboer, and B. Kotchoubey.“A brain-computer interface controlled auditory event-related potential (p300)spelling system for locked-in patients”. In: Ann N Y Acad Sci. 1157 (2009),pages 90–100. doi: 10.1111/j.1749-6632.2008.04122.x.
[K20] A. Kübler. “The history of BCI: From a vision for the future to real supportfor personhood in people with locked-in syndrome”. In: Neuroethics 13 (2020),163–180. doi: 10.1007/s12152-019-09409-4.
113

Bibliography
[KB08] A. Kübler and N. Birbaumer. “Brain–computer interfaces and communicationin paralysis: Extinction of goal directed thinking in completely paralysed pa-tients?” In: Clinical Neurophysiology 119.11 (2008), pages 2658–2666. issn: 1388-2457. doi: 10.1016/j.clinph.2008.06.019.
[KC16] S. Kapil and M. Chawla. “Performance evaluation of K-means clustering algo-rithm with various distance metrics”. In: 2016 IEEE 1st International Conferenceon Power Electronics, Intelligent Control and Energy Systems (ICPEICES). 2016,pages 1–4. doi: 10.1109/ICPEICES.2016.7853264.
[KN05] A. Kübler and N. Neumann. “Brain-computer interfaces–the key for the con-scious brain locked into a paralyzed body”. In: Prog Brain Res. 150 (2005),pages 513–25. doi: 10.1016/S0079-6123(05)50035-9.
[Koc04] C. Koch. The Quest for Consciousness: A Neurobiological Approach. Roberts andCompany, 2004. isbn: 9780974707709.
[KSD09] A. S. Kayser, F. T. Sun, and M. D’Esposito. “A comparison of Granger causalityand coherency in fMRI-based analysis of the motor system”. In: Human BrainMapping 30.11 (2009), pages 3475–3494. doi: 10.1002/hbm.20771.
[KSF13] J.-R. King, J. D. Sitt, and S. Faugeras. “Information Sharing in the Brain IndexesConsciousness in Non-communicative Patients”. In: Current Biology 23.19 (2013),pages 1914–1919. doi: 10.1016/j.cub.2013.07.075.
[Lau+05] S. Laureys, F. Pellas, P. Van Eeckhout, S. Ghorbel, C. Schnakers, F. Perrin, J.Berré, M.-E. Faymonville, K.-H. Pantke, F. Damas, M. Lamy, G. Moonen, andS. Goldman. “The locked-in syndrome : what is it like to be conscious butparalyzed and voiceless?” In: Prog Brain Res. 150 (2005), pages 495–511. doi:10.1016/S0079-6123(05)50034-7.
[LBMM15] U. Lee, S. Blain-Moraes, and G. A. Mashour. “Assessing levels of consciousnesswith symbolic analysis”. In: Phil. Trans. R. Soc. A. 373.20140117 (2015). doi:10.1098/rsta.2014.0117.
[LCERDM02] J. Leon-Carrión, P. van Eeckhout, and M. del Rosario Domínguez-Morales.“Review of subject: The locked-in syndrome: a syndrome looking for a therapy”.In: Brain Injury 16.7 (2002), pages 555–569. doi: 10.1080/02699050110119466.
[Les+14] D. Lesenfants, D. Habbal, Z. Lugo, M. Lebeau, P. Horki, E. Amico, C. Pokorny,F. Gómez, A. Soddu, G. Müller-Putz, S. Laureys, and Q. Noirhomme. “Anindependent SSVEP-based brain–computer interface in locked-in syndrome”. In:Journal of Neural Engineering 11.3 (May 2014), page 035002. doi: 10.1088/1741-2560/11/3/035002.
[Les+15] D. Lesenfants, C. Chatelle, S. Laureys, and Q. Noirhomme. “Interfaces cerveau-ordinateur, locked-in syndrome et troubles de la conscience”. In: Med Sci (Paris)31.10 (2015), pages 904–911. doi: 10.1051/medsci/20153110017. url: https://doi.org/10.1051/medsci/20153110017.
[LMT10] M. Lukowicz, K. Matuszak, and A. D. Talar. “A misdiagnosed patient: 16 yearsof locked-in syndrome, the influence of rehabilitation”. In: Med Sci Monit 16.2(2010), pages 18–23.
114

Bibliography
[Lug+14] Z. R. Lugo, J. Rodriguez, A. Lechner, R. Ortner, I. S. Gantner, S. Laureys, Q.Noirhomme, and C. Guger. “A vibrotactile p300-based brain-computer interfacefor consciousness detection and communication.” In: Clin EEG Neurosci. 45.1(2014), pages 14–21. doi: 10.1177/1550059413505533.
[LZ76] A. Lempel and J. Ziv. “On the Complexity of Finite Sequences”. In: IEEETransactions on Information Theory 22.1 (1976), pages 75–81. doi: 10.1109/TIT.1976.1055501.
[Mal+13] U. Malinowska, C. Chatelle, M. A. Bruno, Q. Noirhomme, S. Laureys, andDurka P. J. “Electroencephalographic profiles for differentiation of disorders ofconsciousness”. In: Biomed Eng Online 12.109 (2013). doi: 10.1186/1475-925X-12-109.
[Mal+19] A. Malekshahi, U. Chaudhary, A. Jaramillo-Gonzalez, A. Lucas Luna, A. Rana,A. Tonin, N. Birbaumer, and S. Gais. “Sleep in the completely locked-in state(CLIS) in amyotrophic lateral sclerosis”. In: Sleep 42.12 (2019), pages 1–8. doi:10.1093/sleep/zsz185.
[Mar+21] Y. Maruyama, N. Yoshimura, A. Rana, A. Malekshahi, A. Tonin, A. Jaramillo-Gonzalez, N. Birbaumer, and U. Chaudhary. “Electroencephalography of com-pletely locked-in state patients with amyotrophic lateral sclerosis”. In: Neuro-science Research 162 (2021), pages 45–51. doi: 10.1016/j.neures.2020.01.013.
[Mat21] Mathworks. Cluster Gaussian Mixture Data Using Soft Clustering. Statistics andMachine Learning Toolbox™User’s Guide. The MathWorks, Inc., 2021. url:https://de.mathworks.com/help/stats/cluster-gaussian-mixture-data-using-soft-clustering.html.
[McC04] J. McCarthy. What is Artificial Intelligence? Nov. 2004. url: https://homes.di.unimi.it/borghese/Teaching/AdvancedIntelligentSystems/Old/IntelligentSystems_2008_2009/Old/IntelligentSystems_2005_2006/Documents/Symbolic/04_McCarthy_whatisai.pdf. Accessed: 17/08/2021.
[Mil07] G. Miller. “Uncovering the Magic in Magnetic Brain Stimulation”. In: Science317.5846 (2007), pages 1846–1846. doi: 10.1126/science.317.5846.1846a.
[MLO10] M. M. Monti, S. Laureys, and A. M. Owen. “The vegetative state”. In: BMJ 341
(2010). issn: 0959-8138. doi: 10.1136/bmj.c3765.
[MP00] G. McLachlan and D. Peel. Finite Mixture Models. John Wiley & Sons, Inc., 2000.isbn: 9780471006268. doi: 10.1002/0471721182.
[Mur+11] A. R. Murguialday, J. Hill, M. Bensch, S. Martens, S. Halder, and F. Nijboer.“Transition from the locked in to the completely locked-in state: A physiologicalanalysis”. In: Clinical Neurophysiology 122.5 (2011), pages 925–933. doi: 10.1016/j.clinph.2010.08.019.
[Mut13] S. Muthukumaraswamy. “High-frequency brain activity and muscle artifactsin MEG/EEG: A review and recommendations”. In: Frontiers in Human Neuro-science 7 (2013), page 138. issn: 1662-5161. doi: 10.3389/fnhum.2013.00138.
115

Bibliography
[Nak+17] T. Nakamura, V. Goverdovsky, M. J. Morrell, and D. P. Mandic. “AutomaticSleep Monitoring Using Ear-EEG”. In: IEEE Journal of Translational Engineeringin Health and Medicine 5 (2017), pages 1–8.
[Nie05] E. Niedermeyer. “The normal EEG of the waking adult”. In: Electroencephalogra-phy: Basic principles, Clinical applications, and related Fields. Edited by E. Nieder-meyer and F. L. da Silva. Fifth edition. Philadelphia, USA: Lippincott Williams& Wilkins (LWW), 2005, pages 167–192. doi: 978-0-78-178942-4.
[NIN13] NINDS. Amyotrophic Lateral Sclerosis (ALS) Fact Sheet. June 2013. url: https://www.ninds.nih.gov/Disorders/Patient-Caregiver-Education/Fact-Sheets / Amyotrophic - Lateral - Sclerosis - ALS - Fact - Sheet. Accessed:26/06/2021.
[Nol+04] G. Nolte, O. Bai, L. Wheaton, Z. Mari, S. Vorbach, and M. Hallett. “Identifyingtrue brain interaction from EEG data using the imaginary part of coherency”.In: Clinical Neurophysiology 115.10 (2004), pages 2292–2307. doi: 10.1016/j.clinph.2004.04.029.
[NS05] K. Najarian and R. Splinter. Biomedical Signal and Image Processing. 1st Edition.CRC Press, 2005. isbn: 978-0849320996.
[NS06] P. L. Nunez and R. Srinivasan. Electrical Fields of the Brain. The Neurophysics ofEEG. Second Edition. Oxford University Press, 2006. isbn: 978-0-19-505038-7.
[Nuw+98] M. R. Nuwer, G. Comi, R. Emerson, A. Fuglsang-Frederiksen, J.-M. Guérit,H. Hinrichs, A. Ikeda, F. J. C. Luccas, and P. Rappelsburger. “IFCN standardsfor digital recording of clinical EEG”. In: Electroencephalography and ClinicalNeurophysiology 106 (3 1998), pages 259–261. doi: 10.1016/S0013-4694(97)00106-5.
[Oke+14] B S. Oken, U. Orhan, B. Roark, D. Erdogmus, A. Fowler, A. Mooney, B. Peters,M. Miller, and M. B. Fried-Oken. “Brain-computer interface with languagemodel-electroencephalography fusion for locked-in syndrome”. English (US).In: Neurorehabilitation and Neural Repair 28.4 (May 2014), pages 387–394. issn:1545-9683. doi: 10.1177/1545968313516867.
[Oos+01] R. Oostenveld, P. Fries, E. Maris, and J.-M. Schoffelen. “FieldTrip: Open SourceSoftware for Advanced Analysis of MEG, EEG and Invasive Electrophysiologi-cal Data”. In: Computational Intelligence and Neuroscience (2001). doi: 10.1155/2011/156869.
[Pal+15] D. Pal, V. S. Hambrecht-Wiedbusch, B. H. Silverstein, and G. A. Mashour.“Electroencephalographic coherence and cortical acetylcholine during ketamine-induced unconsciousness”. In: British Journal of Anaesthesia 114.6 (2015),pages 979–989. issn: 0007-0912. doi: 10.1093/bja/aev095.
[Pan+14] J. Pan, Q. Xie, Y. He, F. Wang, H. Di, S. Laureys, R. Yu, and Y. Li. “Detectingawareness in patients with disorders of consciousness using a hybrid brain-computer interface”. In: Journal of Neural Engineering 11.5 (2014). doi: 10.1088/1741-2560/11/5/056007.
116

Bibliography
[Pan+18] J. Pan, Q. Xie, H. Huang, Y. He, Y. Sun, R. Yu, and Y. Li. “Emotion-Related Con-sciousness Detection in Patients With Disorders of Consciousness Through anEEG-Based BCI System”. In: Frontiers in Human Neuroscience 12 (2018), page 198.doi: 10.3389/fnhum.2018.00198.
[Per+06] F. Perrin, C. Schnakers, M. Schabus, C. Degueldre, S. Goldman, S. Brédart, M.-E.Faymonville, M. Lamy, G. Moonen, A. Luxen, P. Maquet, and S. Laureys. “BrainResponse to One’s Own Name in Vegetative State, Minimally Conscious State,and Locked-in Syndrome”. In: Archives of Neurology 63.4 (Apr. 2006), pages 562–569. issn: 0003-9942. doi: 10.1001/archneur.63.4.562.
[Pet+13] G. Peters, F. Crespo, P. Lingras, and R. Weber. “Soft clustering – Fuzzy andrough approaches and their extensions and derivatives”. In: International Journalof Approximate Reasoning 54.2 (2013), pages 307–322. issn: 0888-613X. doi:10.1016/j.ijar.2012.10.003.
[PN05] G. Pfurtscheller and C. Neuper. “EEG-based Brain-Computer Interfaces”. In:Electroencephalography: Basic principles, Clinical applications, and related Fields.Edited by E. Niedermeyer and F. L. da Silva. Fifth edition. Philadelphia, USA:Lippincott Williams & Wilkins (LWW), 2005, pages 167–192. doi: 978-0-78-178942-4.
[Pos+07] J. B. Posner, C. B. Saper, N. Schiff, and F. Plum. Plum and Posner’s Diagnosis ofStupor and Coma. 4th edition. Oxford University Press, 2007. isbn: 0195321316.
[PP04] J. N. Parker and P. M. Parker. The Official Patient’s Sourcebook on Locked-In Syn-drome: A Revised and Updated Directory for the Internet Age. Revised, UpdatedEdition. ICON Health Publications, 2004. isbn: 978-0597841941.
[Pri81] M. B. Priestley. Spectral Analysis and Time Series, Two-Volume Set: Volumes I andII. Both volumes bound together. Elsevier Science, 1981. isbn: 9780125649223.
[Pul+20] R. M. Pullon, L. Yan, J. W. Sleigh, and C. E. Warnaby. “Granger Causality of theElectroencephalogram Reveals Abrupt Global Loss of Cortical Information Flowduring Propofol-induced Loss of Responsiveness”. In: Anesthesiology 133.4 (Oct.2020), pages 774–786. issn: 0003-3022. doi: 10.1097/ALN.0000000000003398.
[QN05] L. F. Quesney and E. Niedermeyer. “Electrocorticography”. In: Electroencephalog-raphy: Basic principles, Clinical applications, and related Fields. Edited by E. Nieder-meyer and F L. da Silva. Fifth edition. Philadelphia, USA: Lippincott Williams& Wilkins (LWW), 2005, pages 167–192. doi: 978-0-78-178942-4.
[Ram+80] I. J. Rampil, F. J. Sasse, N. T. Smith, B. H. Hoff, and D. C. Flemming. “SPECTRALEDGE FREQUENCY - A NEW CORRELATE OF ANESTHETIC DEPTH”. In:Anesthesiology 53.3 Suppl (Sept. 1980), S12–S12. issn: 0003-3022. doi: 10.1097/00000542-198009001-00012.
[Rei05] E L. Reilly. “EEG recording and operation of the apparatus”. In: Electroen-cephalography: Basic principles, Clinical applications, and related Fields. Edited byE. Niedermeyer and F. L. da Silva. Fifth edition. Philadelphia, USA: LippincottWilliams & Wilkins (LWW), 2005, pages 139–160. doi: 978-0-78-178942-4.
117

Bibliography
[Rij19] Dr. K. G. Rijkhoek. Untersuchungskommission stellt wissenschaftliches Fehlverhaltendurch Tübinger Hirnforscher fest. June 2019. url: https://uni- tuebingen.de/en/university/news- and- publications/press- releases/press-releases/article/untersuchungskommission-stellt-wissenschaftliches- fehlverhalten- durch- tuebinger- hirnforscher- fest/. Accessed:20/05/2021.
[Roh+17] B. Rohaut, F. Raimondo, D. Galanaud, M. Valente, J. D. Sitt, and L. Naccache.“Probing consciousness in a sensory-disconnected paralyzed patient”. In: BrainInjury 31.10 (2017), pages 1398–1403. doi: 10.1080/02699052.2017.1327673.
[Rou+15] M.-C. Rousseau, K. Baumstarck, M. Alessandrini, V. Blandin, T. B. de Villemeur,and P. Auquier. “Quality of life in patients with locked-in syndrome: Evolutionover a 6-year period”. In: Orphanet J Rare Dis 10.88 (2015). doi: 10.1186/s13023-015-0304-z.
[Sak+16] D. Sakellariou, A. M. Koupparis, V. Kokkinos, M. Koutroumanidis, and G. K.Kostopoulos. “Connectivity Measures in EEG Microstructural Sleep Elements”.In: Frontiers in Neuroinformatics 10 (Feb. 2016). doi: 10.3389/fninf.2016.00005.
[Sat+15] D. Sattin, L. Minati, D. Rossi, V. Covelli, A. M. Giovannetti, C. Rosazza, A.Bersano, A. Nigri, and M. Leonardi. “The Coma Recovery Scale Modified Score”.In: International Journal of Rehabilitation Research 38.4 (2015), pages 350–356. doi:10.1097/MRR.0000000000000135.
[Sat+19] R. Satti, N.-U.-H. Abid, M. Bottaro, M. De Rui, M. Garrido, M. R. Raoufy, S.Montagnese, and A. R. Mani. “The Application of the Extended Poincaré Plotin the Analysis of Physiological Variabilities”. In: Frontiers in Physiology 116.10
(2019). doi: 10.3389/fphys.2019.00116.
[SB18] R. S. Sutton and A. G. Barto. Reinforcement Learning: An Introduction, Secondedition. Adaptive Computation and Machine Learning series. Bradford Books,2018. isbn: 978-0262039246.
[SBL21] S. W. A. Sherazi, J.-W. Bae, and J. Y. Lee. “A soft voting ensemble classifier forearly prediction and diagnosis of occurrences of major adverse cardiovascularevents for STEMI and NSTEMI during 2-year follow-up in patients with acutecoronary syndrome”. In: PLOS ONE 16.6 (June 2021), pages 1–20. doi: 10.1371/journal.pone.0249338.
[SBS18] P. Schober, C. Boer, and L. A. Schwarte. “Correlation Coefficients: AppropriateUse and Interpretation.” In: Anesth Analg. 126.5 (2018), pages 1763–1768. doi:10.1213/ANE.0000000000002864.
[SC13] S. Sanei and J. A. Chambers. EEG Signal Processing. Wiley, 2013. isbn:9781118691236.
118

Bibliography
[Sch+09] C. Schnakers, F. Perrin, M. Schabus, R. Hustinx, S. Majerus, G. Moonen, M. Boly,A. Vanhaudenhuyse, M. A. Bruno, and S. Laureys. “Detecting consciousnessin a total locked-in syndrome: An active event-related paradigm”. English. In:Neurocase 15.4 (July 2009), pages 271–277. issn: 1355-4794. doi: 10.1080/13554790902724904.
[Sch+15] M. Schartner, A. Seth, Q. Noirhomme, M. Boly, M.-A. Bruno, S. Laureys, andA. Barrett. “Complexity of Multi-Dimensional Spontaneous EEG Decreasesduring Propofol Induced General Anaesthesia”. In: PLOS ONE 10.8 (Aug. 2015),pages 1–21. doi: 10.1371/journal.pone.0133532.
[Sec+21] A. Secco, A. Tonin, A. Rana, A. Jaramillo-Gonzalez, M. Khalili-Ardali, N. Bir-baumer, and U. Chaudhary. “EEG power spectral density in locked-in andcompletely locked-in state patients: a longitudinal study”. In: Cogn Neurodyn 15
(2021), pages 473–480. issn: 1388-2457. doi: 10.1007/s11571-020-09639-w.
[Ser+17] C. Sergent, F. Faugeras, B. Rohaut, F. Perrin, M. Valente, C. Tallon-Baudry, L.Cohen, and L. Naccache. “Multidimensional cognitive evaluation of patientswith disorders of consciousness using EEG: A proof of concept study”. In:NeuroImage. Clinical 13 (2017), 455—469. issn: 2213-1582. doi: 10.1016/j.nicl.2016.12.004.
[Sil05] F. L. da Silva. “EEG Analysis: Theory and Practice”. In: Electroencephalography:Basic principles, Clinical applications, and related Fields. Edited by E. Niedermeyerand F. L. da Silva. Fifth edition. Philadelphia, USA: Lippincott Williams &Wilkins (LWW), 2005, pages 167–192. doi: 978-0-78-178942-4.
[SM05] P. Stoica and R. L. Moses. Spectral Analysis of Signals. Prentice Hall, 2005. isbn:0-13-113956-8.
[SM10] G. Schalk and J. Mellinger. A Practical Guide to Brain-Computer Interfacing withBCI2000. Springer, 2010. isbn: 978-1-84996-091-5. doi: 10.1007/978-1-84996-092-2.
[Soe+13] S. R. Soekadar, J. Born, N. Birbaumer, M. Bensch, S. Halder, and A. R. Mur-guialday. “Fragmentation of slow wave sleep after onset of complete locked-in state”. In: Journal of clinical sleep medicine 9.9 (2013), pages 951–953. doi:10.5664/jcsm.3002.
[Spu19] M. Spueler. “Questioning the evidence for BCI-based communication in thecomplete locked-in state”. In: PLOS Biology 17.4 (Apr. 2019), pages 1–5. doi:10.1371/journal.pbio.2004750.
[SS12] D. Stahl and H. Sallis. “Model-based cluster analysis”. In: WIREs ComputationalStatistics 4.4 (2012), pages 341–358. doi: 10.1002/wics.1204.
[Sub19] A. Subasi. “Chapter 2 - Biomedical Signals”. In: Practical Guide for BiomedicalSignals Analysis Using Machine Learning Techniques. Edited by A. Subasi. Aca-demic Press, 2019, pages 27–87. isbn: 978-0-12-817444-9. doi: 10.1016/B978-0-12-817444-9.00002-7.
119

Bibliography
[Tay02] J. G. Taylor. “Neural models of consciousness”. In: The Handbook of brain theoryand neural networks. Edited by M. A. Arbib. Second Edition. The MIT Press,2002. isbn: 978-0262011976.
[Ton+16] G. Tononi, M. Boly, O. Gosseries, and S. Laureys. “Chapter 25 - The Neurologyof Consciousness: An Overview”. In: The Neurology of Conciousness (SecondEdition). Edited by S. Laureys, O. Gosseries, and G. Tononi. Second Edition.San Diego: Academic Press, 2016, pages 407–461. isbn: 978-0-12-800948-2. doi:10.1016/B978-0-12-800948-2.00025-X.
[Tou+19] C. Touchard, J. Cartailler, C. Levé, P. Parutto, C. Buxin, L. Garnot, J. Matéo,N. Kubis, A. Mebazaa, E. Gayat, and F. Vallée. “EEG power spectral densityunder Propofol and its association with burst suppression, a marker of cere-bral fragility”. In: Clinical Neurophysiology 130.8 (2019), pages 1311–1319. issn:18728952. doi: 10.1016/j.clinph.2019.05.014.
[TR15] B. Thomas and R. Rajan. “Combining complexity measures of EEG data: multi-plying measures reveal previously hidden information”. In: F1000Research 137.4(June 2015). doi: 10.12688/f1000research.6590.1.
[Van+09] C. Vance et al. “Mutations in FUS, an RNA processing protein, cause famil-ial amyotrophic lateral sclerosis type 6”. English. In: Science (New York, N.Y.)323.5918 (Feb. 2009), pages 1208–1211. issn: 0036-8075. doi: 10.1126/science.1165942.
[Van+16] M. J. Vansteensel, E. G. M. Pels, M. G. Bleichner, M. P. Branco, T. Denison, Z. V.Freudenburg, P. Gosselaar, S. Leinders, T. H. Ottens, M. A. Van Den Boom, P. C.Van Rijen, E. J. Aarnoutse, and N. F. Ramsey. “Fully Implanted Brain–ComputerInterface in a Locked-In Patient with ALS”. In: New England Journal of Medicine375.21 (2016), pages 2060–2066. doi: 10.1056/NEJMoa1608085.
[Van+18] A. Vanhaudenhuyse, V. Charland-Verville, A. Thibaut, C. Chatelle, J.-F. L.Tshibanda, and A. Maudoux. “Conscious While Being Considered in an Un-responsive Wakefulness Syndrome for 20 Years”. In: Frontiers in Neurology 9
(2018), page 671. doi: 10.3389/fneur.2018.00671.
[vWL15] L. E. H. van Dokkum, T. Ward, and I. Laffont. “Brain computer interfaces forneurorehabilitation – its current status as a rehabilitation strategy post-stroke”.In: Annals of Physical and Rehabilitation Medicine 58.1 (2015). Brain ComputerInterfaces (BCIs) / Coordinated by Jacques Luauté and Isabelle Laffont, pages 3–8. issn: 1877-0657. doi: 10.1016/j.rehab.2014.09.016.
[Wan+13] H. Wang, Y. Yang, H. Wang, and D. Chen. “Soft-Voting Clustering Ensemble”.In: Multiple Classifier Systems. MCS 2013. Edited by Kittler J. (eds) Zhou Z. H.Roli F. Volume 7872. Lecture Notes in Computer Science. Berlin, Heidelberg:Springer, 2013. doi: 10.1007/978-3-642-38067-9_27.
[Wan+15] R. Wang, J. Wang, H. Yu, X. Wei, C. Yang, and B. Deng. “Power spectral den-sity and coherence analysis of Alzheimer’s EEG”. In: Cogn Neurodyn 9 (2015),291–304. doi: 10.1007/s11571-014-9325-x.
120

Bibliography
[Wan+18] J. Wang, H. Di, N. Hu, and S. Laureys. “Circadian Rhythm of Patients withDisorders of Consciousness”. In: Open Access J Neurol Neurosurg 9.3 (2018). doi:10.19080/OAJNN.2018.09.555763.
[WB21] S.-J. Wu and M. Bogdan. “Application of Sample Entropy to Analyze Con-sciousness in CLIS Patients”. In: Sensor Networks and Signal Processing. Vol-ume 176. Smart Innovation, Systems and Technologies. Singapore: Springer,2021, pages 521–531. doi: 10.1007/978-981-15-4917-5_37.
[Wel67] P. Welch. “The use of fast Fourier transform for the estimation of power spectra:A method based on time averaging over short, modified periodograms”. In:IEEE Transactions on Audio and Electroacoustics 15.2 (1967), pages 70–73. doi:10.1109/TAU.1967.1161901.
[WHO12] WHO. WHOQOL: Measuring Quality of Life. 2012. url: https://www.who.int/tools/whoqol. Accessed: 15/05/2021.
[Wie+18] T. Wielek, J. Lechinger, M. Wislowska, C. Blume, P. Ott, S. Wegenkittl, R. delGiudice, D. P. J. Heib, H. A. Mayer, S. Laureys, G. Pichler, and M. Schabus.“Sleep in patients with disorders of consciousness characterized by means ofmachine learning”. In: PLOS ONE 13.1 (2018), pages 1–14. doi: 10.1371/journal.pone.0190458.
[Wis+17] M. Wislowska, R. del Giudice, J. Lechinger, T. Wielek, D. P. J. Heib, A. Pitiot,G. Pichler, G. Michitsch, J. Donis, and M. Schabus. “Night and day variationsof sleep in patients with disorders of consciousness”. In: Scientific Reports 7.266
(2017). doi: 10.1038/s41598-017-00323-4.
[Wit+17] I. H. Witten, E. Frank, M. A. Hall, and C. J. Pal. Data Mining: Practical MachineLearning Tools and Techniques. Fourth edition. Elsevier, 2017. isbn: 978-0-12-804291-5.
[WNB20] S.-J. Wu, N. Nicolaou, and M. Bogdan. “Consciousness Detection in a Com-plete Locked-in Syndrome Patient through Multiscale Approach Analysis”. In:Entropy 22.12 (2020). issn: 1099-4300. doi: 10.3390/e22121411.
[Zha+17] Y. Zhang, R. Li, J. Du, S. Huo, J. Hao, and W. Song. “Coherence in P300 as apredictor for the recovery from disorders of consciousness”. In: NeuroscienceLetters 653 (2017), pages 332–336. issn: 0304-3940. doi: 10.1016/j.neulet.2017.06.013.
[ZK11] T. O. Zander and C. Kothe. “Towards passive brain–computer interfaces: ap-plying brain–computer interface technology to human–machine systems ingeneral”. In: Journal of Neural Engineering 8.2 (2011), page 025005. doi: 10.1088/1741-2560/8/2/025005.
121


A Appendix: K-means++ algorithm
GMM uses the k-means++ algorithm to determine the initial parameters of the clusteringanalysis [Mat21]. Given a number k of clusters, they are chosen like so:
1. First, the component mixture probability is chosen as the uniform probability pi =1k ,
where i = 1, ..., k.
2. Then, the covariance matrices are set to be diagonal and identical, where σi =
diag(a1, a2, . . . , ak) and aj = var(Xj).
3. Afterwards, the first initial component centre µ1 is uniformly determined from all datapoints in X.
4. To obtain centre j:
a) The Mahalanobis distances from each observation to each centroid is calculated,and each observation is assigned to its closest centroid.
b) For m = 1, ..., n and p = 1, ..., j− 1, a centroid j is randomly selected from X withprobability
d2 (xm, µp)
∑h;xh∈Mpd2(xh, µp
) (A.1)
where d(xh, µp) is the distance between observation m and µp, and Mp is the set ofall observations closest to centroid µp and xm belongs to Mp. i.e., each subsequentcentre is selected with a probability proportional to the distance from itself to theclosest centre already selected.
5. Step 4 is repeated until the k centroids are chosen.
123


B Appendix: Additional information aboutDoC patients
Table B.1: Data and eyes scoring length.
Patient EEG data length
Eyes scoring length
L1 2891 2170L3 2881 1920L13 2881 2150S12 2691 1229S13 2665 1620S14 2536 1559S16 2622 1700S17 1865 960L4 2883 2150L7 2881 2150L8 2968 2160L9 2910 2160L16 2881 2150S2 2180 1170S5 2894 720S6 2593 1430S7 2522 720
Table B.2: Results of the Wilcoxon ranskum statistical analysis comparing the values of each featurebetween MCS and UWS patients.
Features p-value zval
Ptheta 0 -56,46Pbeta 0 -42,96SEF95 1,80E-206 -30,66ERR 3,11E-73 -18,1LZC 1,61E-206 30,67iCOH 3,48E-06 4,64wSMI 1,75E-99 21,17
125
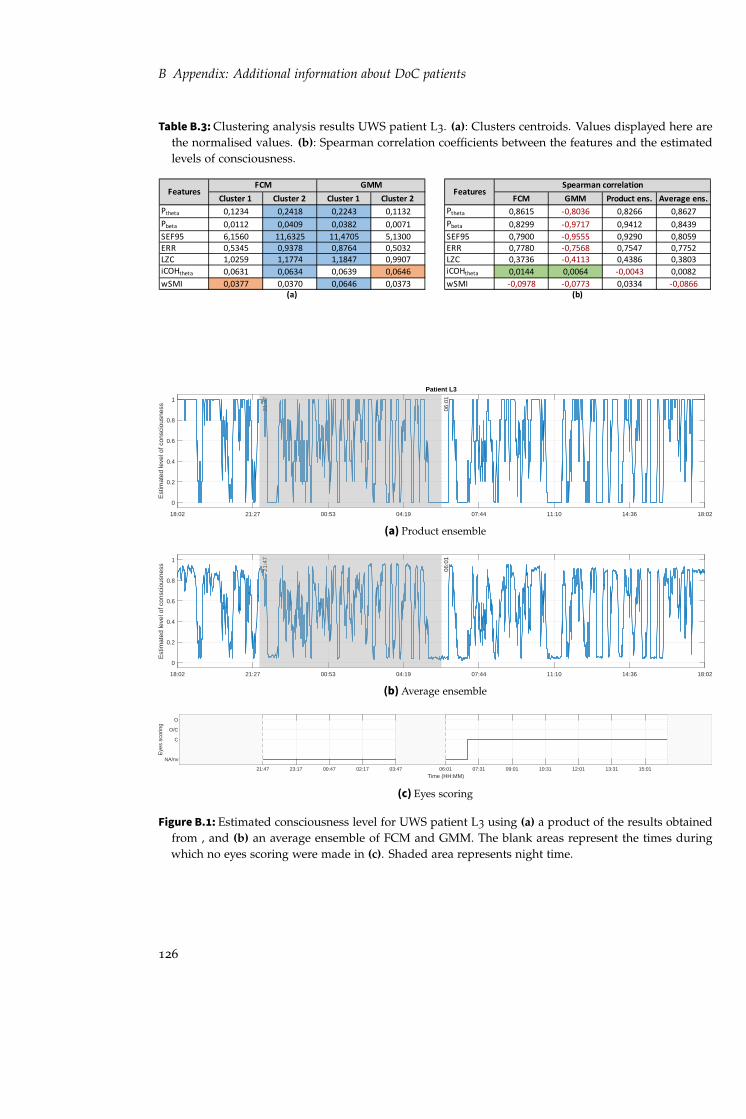
B Appendix: Additional information about DoC patients
Table B.3: Clustering analysis results UWS patient L3. (a): Clusters centroids. Values displayed here arethe normalised values. (b): Spearman correlation coefficients between the features and the estimatedlevels of consciousness.
Cluster 1 Cluster 2 Cluster 1 Cluster 2 FCM GMM Product ens. Average ens.Ptheta 0,1234 0,2418 0,2243 0,1132 Ptheta 0,8615 -0,8036 0,8266 0,8627Pbeta 0,0112 0,0409 0,0382 0,0071 Pbeta 0,8299 -0,9717 0,9412 0,8439SEF95 6,1560 11,6325 11,4705 5,1300 SEF95 0,7900 -0,9555 0,9290 0,8059ERR 0,5345 0,9378 0,8764 0,5032 ERR 0,7780 -0,7568 0,7547 0,7752LZC 1,0259 1,1774 1,1847 0,9907 LZC 0,3736 -0,4113 0,4386 0,3803iCOHtheta 0,0631 0,0634 0,0639 0,0646 iCOHtheta 0,0144 0,0064 -0,0043 0,0082wSMI 0,0377 0,0370 0,0646 0,0373 wSMI -0,0978 -0,0773 0,0334 -0,0866
(a) (b)
FeaturesSpearman correlation
FeaturesFCM GMM
18:02 21:27 00:53 04:19 07:44 11:10 14:36 18:02
0
0.2
0.4
0.6
0.8
1
Est
imat
ed le
vel o
f con
scio
usne
ss
Patient L3
21:4
7
06:0
1
(a) Product ensemble
18:02 21:27 00:53 04:19 07:44 11:10 14:36 18:02
0
0.2
0.4
0.6
0.8
1
Est
imat
ed le
vel o
f con
scio
usne
ss 21:4
7
06:0
1
(b) Average ensemble
21:47 23:17 00:47 02:17 03:47 06:01 07:31 09:01 10:31 12:01 13:31 15:01Time (HH:MM)
NA/nv
C
O/C
O
Eye
s sc
orin
g
(c) Eyes scoring
Figure B.1: Estimated consciousness level for UWS patient L3 using (a) a product of the results obtainedfrom , and (b) an average ensemble of FCM and GMM. The blank areas represent the times duringwhich no eyes scoring were made in (c). Shaded area represents night time.
126

B Appendix: Additional information about DoC patients
Table B.4: Clustering analysis results UWS patient L13. (a): Clusters centroids. Values displayed here arethe normalised values. (b): Spearman correlation coefficients between the features and the estimatedlevels of consciousness.
Cluster 1 Cluster 2 Cluster 1 Cluster 2 FCM GMM Product ens. Average ens.Ptheta 0,1016 0,1022 0,1486 0,0708 Ptheta 0,4933 -0,5122 0,5123 0,5354Pbeta 0,0085 0,0085 0,0136 0,0051 Pbeta 0,4556 -0,8997 0,8978 0,8270SEF95 5,4990 5,517 7,3305 4,2930 SEF95 0,5011 -0,9091 0,9081 0,8481ERR 0,3639 0,3637 0,3838 0,3504 ERR 0,0481 -0,3973 0,3951 0,3046LZC 0,7742 0,7729 0,8229 0,7408 LZC -0,2004 -0,2662 0,2630 0,1242iCOHtheta 0,0649 0.0655 0,0676 0,0636 iCOHtheta 0,5246 -0,0680 0,0718 0,2032wSMI 0,0473 0,0473 0,0489 0,0462 wSMI 0,2718 -0,3499 0,3495 0,3227
(a) (b)
FeaturesSpearman correlation
FeaturesFCM GMM
17:39 21:05 00:31 03:57 07:22 10:48 14:14 17:39
0
0.2
0.4
0.6
0.8
1
Est
imat
ed le
vel o
f con
scio
usne
ss
Patient L13
21:2
0
05:3
9
(a) Product ensemble
17:39 21:05 00:31 03:57 07:22 10:48 14:14 17:39
0
0.2
0.4
0.6
0.8
1
Est
imat
ed le
vel o
f con
scio
usne
ss 21:2
0
05:3
9
(b) Average ensemble
17:39 19:09 21:20 22:50 00:20 01:50 03:20 05:39 07:09 08:39 10:09 11:39 13:09 14:39Time (HH:MM)
NA/nv
C
O/C
O
Eye
s sc
orin
g
(c) Eyes scoring
Figure B.2: Estimated consciousness level for UWS patient L13 using using (a) a product of the resultsobtained from , and (b) an average ensemble of FCM and GMM. The blank areas represent the timesduring which no eyes scoring were made in (c). Shaded area represents night time.
127

B Appendix: Additional information about DoC patients
Table B.5: Clustering analysis results UWS patient S12. (a): Clusters centroids. Values displayed here arethe normalised values. (b): Spearman correlation coefficients between the features and the estimatedlevels of consciousness.
Cluster 1 Cluster 2 Cluster 1 Cluster 2 FCM GMM Product ens. Average ens.Ptheta 0,4075 0,2682 0,4163 0,2790 Ptheta -0,6193 0,5232 -0,6566 0,4908Pbeta 0,0611 0,1367 0,0591 0,1159 Pbeta 0,4830 0,7516 0,5118 0,6979SEF95 14,1705 32,2515 13,5405 28,0125 SEF95 0,6922 0,8228 0,7371 0,7358ERR 0,5845 1,8422 0,4762 1,792 ERR 0,7307 0,4314 0,8068 0,5019LZC 0,2395 1,1007 0,2182 0,8519 LZC 0,5034 -0,0451 0,4330 -0,0058iCOHtheta 0,0625 0,0608 0,0634 0,0610 iCOHtheta -0,0026 0,3858 -0,0309 0,4479wSMI 0,0307 0,0547 0,0299 0,0485 wSMI 0,4503 0,2183 0,3932 0,3042
(a) (b)
FeaturesSpearman correlation
FeaturesFCM GMM
16:52 19:22 21:52 00:22 02:52 05:22 07:52 10:22 12:52 15:22
0
0.2
0.4
0.6
0.8
1
Est
imat
ed le
vel o
f con
scio
usne
ss
Patient S12
00:1
5
05:0
0
10-J
un-2
010
16:5
2:38
11-J
un-2
010
13:2
4:05
11-J
un-2
010
13:2
9:13
11-J
un-2
010
15:2
2:59
(a) Product ensemble
16:52 19:22 21:52 00:22 02:52 05:22 07:52 10:22 12:52 15:22
0
0.2
0.4
0.6
0.8
1
Est
imat
ed le
vel o
f con
scio
usne
ss 00:1
5
05:0
0
10-J
un-2
010
16:5
2:38
11-J
un-2
010
13:2
4:05
11-J
un-2
010
13:2
9:13
11-J
un-2
010
15:2
2:59
(b) Average ensemble
17:00 18:30 00:15 01:45 03:15 04:45 08:00 09:30 11:00Time (HH:MM)
NA/nv
C
O/C
O
Eye
s sc
orin
g
(c) Eyes scoring
Figure B.3: Estimated consciousness level for UWS patient S12 using using (a) a product of the resultsobtained from , and (b) an average ensemble of FCM and GMM. The blank areas represent the timesduring which no eyes scoring were made in (c). Shaded area represents night time.
128

B Appendix: Additional information about DoC patients
Table B.6: Clustering analysis results UWS patient S13. (a): Clusters centroids. Values displayed here arethe normalised values. (b): Spearman correlation coefficients between the features and the estimatedlevels of consciousness.
Cluster 1 Cluster 2 Cluster 1 Cluster 2 FCM GMM Product ens. Average ens.Ptheta 0,1280 0,1283 0,1229 0,1401 Ptheta 0,4820 0,2183 0,2189 0,3042Pbeta 0,0276 0,0277 0,0200 0,0452 Pbeta 0,5345 0,8942 0,8944 0,8551SEF95 10,2330 10,26 7,4070 16,7085 SEF95 0,4645 0,9380 0,9381 0,8732ERR 0,1722 0,1724 0,1395 0,2468 ERR 0,3159 0,8638 0,8637 0,7653LZC 1,0285 1,0273 0,8300 1,4783 LZC -0,0988 0,7039 0,7033 0,4809iCOHtheta 0,0590 0,0591 0,0594 0,0583 iCOHtheta 0,1504 -0,0375 -0,0375 0,0237wSMI 0,0330 0,033 0,0329 0,0333 wSMI 0,6432 0,0865 0,0877 0,2793
(a) (b)
FeaturesSpearman correlation
FeaturesFCM GMM
09:41 12:24 15:06 17:49 20:31 23:14 01:56 04:39 07:21 10:04
0
0.2
0.4
0.6
0.8
1
Est
imat
ed le
vel o
f con
scio
usne
ss
Patient S1323
:00
05:0
0
18-A
ug-2
009
09:4
1:55
18-A
ug-2
009
11:2
1:46
18-A
ug-2
009
11:4
6:48
18-A
ug-2
009
12:2
3:42
18-A
ug-2
009
12:4
2:01
18-A
ug-2
009
13:2
1:24
18-A
ug-2
009
13:5
2:54
18-A
ug-2
009
15:4
7:51
18-A
ug-2
009
16:3
9:00
18-A
ug-2
009
21:4
3:36
18-A
ug-2
009
21:4
8:47
19-A
ug-2
009
10:0
4:22
(a) Product ensemble
09:41 12:24 15:06 17:49 20:31 23:14 01:56 04:39 07:21 10:04
0
0.2
0.4
0.6
0.8
1
Est
imat
ed le
vel o
f con
scio
usne
ss 23:0
0
05:0
0
18-A
ug-2
009
09:4
1:55
18-A
ug-2
009
11:2
1:46
18-A
ug-2
009
11:4
6:48
18-A
ug-2
009
12:2
3:42
18-A
ug-2
009
12:4
2:01
18-A
ug-2
009
13:2
1:24
18-A
ug-2
009
13:5
2:54
18-A
ug-2
009
15:4
7:51
18-A
ug-2
009
16:3
9:00
18-A
ug-2
009
21:4
3:36
18-A
ug-2
009
21:4
8:47
19-A
ug-2
009
10:0
4:22
(b) Average ensemble
10:00 11:50 13:55 15:25 16:40 18:10 23:00 00:30 02:00 03:30 05:00 08:00 09:30Time (HH:MM)
NA/nv
C
O/C
O
Eye
s sc
orin
g
(c) Eyes scoring
Figure B.4: Estimated consciousness level for UWS patient S13 using using (a) a product of the resultsobtained from , and (b) an average ensemble of FCM and GMM. The blank areas represent the timesduring which no data were recorded in (a) and (b), or no eyes scoring were made in (c). Shaded arearepresents night time.
129

B Appendix: Additional information about DoC patients
Table B.7: Clustering analysis results UWS patient S14. (a): Clusters centroids. Values displayed here arethe normalised values. (b): Spearman correlation coefficients between the features and the estimatedlevels of consciousness.
Cluster 1 Cluster 2 Cluster 1 Cluster 2 FCM GMM Product ens. Average ens.Ptheta 0,0608 0,0696 0,0706 0,0628 Ptheta -0,0744 -0,0742 0,0609 -0,0307Pbeta 0,2017 0,1248 0,1091 0,204 Pbeta 0,8034 -0,9272 0,9253 0,8274SEF95 36,35 27,01 24,72 36,81 SEF95 0,8454 -0,9667 0,9659 0,8713ERR 0,4643 0,2672 0,2278 0,4665 ERR 0,7785 -0,9244 0,9215 0,8046LZC 1,2839 0,7793 0,7776 1,2303 LZC 0,4942 -0,3605 0,3809 0,4553iCOHtheta 0,0623 0,0600 0,0580 0,0639 iCOHtheta 0,0416 -0,0924 0,0901 0,0483wSMI 0,0441 0,0391 0,0384 0,0442 wSMI 0,4954 -0,5486 0,5491 0,4988
(a) (b)
FeaturesSpearman correlation
FeaturesFCM GMM
20:29 23:09 01:49 04:30 07:10 09:50 12:31 15:11 17:51 20:31
0
0.2
0.4
0.6
0.8
1
Est
imat
ed le
vel o
f con
scio
usne
ss
Patient S14
23:0
0
04:5
0
01-S
ep-2
009
20:2
9:14
02-S
ep-2
009
09:0
2:10
02-S
ep-2
009
10:3
0:39
02-S
ep-2
009
17:5
9:39
02-S
ep-2
009
19:2
6:12
02-S
ep-2
009
20:3
1:57
(a) Product ensemble
20:29 23:09 01:49 04:30 07:10 09:50 12:31 15:11 17:51 20:31
Time (HH:MM)
0
0.2
0.4
0.6
0.8
1
Est
imat
ed le
vel o
f con
scio
usne
ss 23:0
0
04:5
0
01-S
ep-2
009
20:2
9:14
02-S
ep-2
009
09:0
2:10
02-S
ep-2
009
10:3
0:39
02-S
ep-2
009
17:5
9:39
02-S
ep-2
009
19:2
6:12
02-S
ep-2
009
20:3
1:57
(b) Average ensemble
23:00 00:30 02:00 03:30 10:40 12:10 13:40 15:10 16:40Time (HH:MM)
NA/nv
C
O/C
O
(c) Eyes scoring
Figure B.5: Estimated consciousness level for MCS patient S14 using using (a) a product of the resultsobtained from , and (b) an average ensemble of FCM and GMM. The blank areas represent the timesduring which no eyes scoring were made (c). Shaded area represents night time.
130

B Appendix: Additional information about DoC patients
Table B.8: Clustering analysis results UWS patient S16. (a): Clusters centroids. Values displayed here arethe normalised values. (b): Spearman correlation coefficients between the features and the estimatedlevels of consciousness.
Cluster 1 Cluster 2 Cluster 1 Cluster 2 FCM GMM Product ens. Average ens.Ptheta 0,1105 0,1703 0,1137 0,1780 Ptheta -0,4848 -0,7251 -0,7236 -0,4893Pbeta 0,1044 0,0154 0,0853 0,0116 Pbeta 0,8016 0,8008 0,8074 0,8273SEF95 25,2495 6,4800 21,582 5,4990 SEF95 0,8004 0,7701 0,7747 0,8269ERR 0,6927 0,5659 0,6717 0,5639 ERR 0,3968 0,3170 0,3274 0,3861LZC 1,5211 0,8293 1,4122 0,7754 LZC 0,6407 0,7669 0,7555 0,6729iCOHtheta 0,0594 0,0575 0,06 0,0578 iCOHtheta 0,0738 0,0423 0,0483 0,0719wSMI 0,0267 0,0302 0,0267 0,0307 wSMI -0,4714 -0,7052 -0,6993 -0,4821
(a) (b)
FeaturesSpearman correlation
FeaturesFCM GMM
06:43 09:29 12:14 15:00 17:45 20:31 23:16 02:02 04:47 07:33
0
0.2
0.4
0.6
0.8
1
Est
imat
ed le
vel o
f con
scio
usne
ss
Patient S16
23:0
0
04:4
5
12-A
ug-2
009
06:4
3:46
12-A
ug-2
009
14:1
0:02
12-A
ug-2
009
15:0
6:48
12-A
ug-2
009
19:1
1:43
12-A
ug-2
009
21:1
3:49
13-A
ug-2
009
07:3
3:15
(a) Product ensemble
06:43 09:29 12:14 15:00 17:45 20:31 23:16 02:02 04:47 07:33
0
0.2
0.4
0.6
0.8
1
Est
imat
ed le
vel o
f con
scio
usne
ss 23:0
0
04:4
5
12-A
ug-2
009
06:4
3:46
12-A
ug-2
009
14:1
0:02
12-A
ug-2
009
15:0
6:48
12-A
ug-2
009
19:1
1:43
12-A
ug-2
009
21:1
3:49
13-A
ug-2
009
07:3
3:15
(b) Average ensemble
09:30 11:00 12:30 14:00 15:10 16:40 18:10 23:00 00:30 02:00 03:30Time (HH:MM)
NA/nv
C
O/C
O
Eye
s sc
orin
g
(c) Eyes scoring
Figure B.6: Estimated consciousness level for UWS patient S16 using using (a) a product of the resultsobtained from , and (b) an average ensemble of FCM and GMM. The blank areas represent the timesduring which no data were recorded in (a) and (b), or no eyes scoring were made in (c). Shaded arearepresents night time.
131

B Appendix: Additional information about DoC patients
Table B.9: Clustering analysis results UWS patient S17. (a): Clusters centroids. Values displayed here arethe normalised values. (b): Spearman correlation coefficients between the features and the estimatedlevels of consciousness.
Cluster 1 Cluster 2 Cluster 1 Cluster 2 FCM GMM Product ens. Average ens.Ptheta 0,1674 0,0672 0,0682 0,1571 Ptheta -0,6990 0,7421 -0,7495 -0,6779Pbeta 0,0687 0,1043 0,1116 0,0645 Pbeta 0,5480 -0,6529 0,6464 0,5850SEF95 13,9590 24,741 25,614 13,7250 SEF95 0,8449 -0,8931 0,8925 0,8583ERR 0,3036 0,4422 0,4517 0,2999 ERR 0,5551 -0,6222 0,6239 0,5681LZC 0,7619 1,8324 1,804 0,8143 LZC 0,7808 -0,7316 0,7390 0,7612iCOHtheta 0,0621 0,0603 0,0602 0,0632 iCOHtheta -0,0219 0,0338 -0,0336 -0,0205wSMI 0,0346 0,0271 0,0270 0,0343 wSMI -0,7970 0,7950 -0,7972 -0,7971
(a) (b)
FeaturesSpearman correlation
FeaturesFCM GMM
23:23 02:05 04:47 07:30 10:12 12:54 15:36 18:19 21:01 23:43
0
0.2
0.4
0.6
0.8
1
Est
imat
ed le
vel o
f con
scio
usne
ss
Patient S17
23:3
0
05:0
0
24-A
ug-2
009
23:2
3:23
25-A
ug-2
009
08:3
7:43
25-A
ug-2
009
17:2
5:53
25-A
ug-2
009
23:4
3:44
(a) Product ensemble
23:23 02:05 04:47 07:30 10:12 12:54 15:36 18:19 21:01 23:43
0
0.2
0.4
0.6
0.8
1
Est
imat
ed le
vel o
f con
scio
usne
ss 23:3
0
05:0
0
24-A
ug-2
009
23:2
3:23
25-A
ug-2
009
08:3
7:43
25-A
ug-2
009
17:2
5:53
25-A
ug-2
009
23:4
3:44
(b) Average ensemble
23:30 01:00 02:30 04:00Time (HH:MM)
NA/nv
C
O/C
O
Eye
s sc
orin
g
(c) Eyes scoring
Figure B.7: Estimated consciousness level for UWS patient S17 using using (a) a product of the resultsobtained from , and (b) an average ensemble of FCM and GMM. The blank areas represent the timesduring which no data were recorded in (a) and (b), or no eyes scoring were made in (c). Shaded arearepresents night time.
132

B Appendix: Additional information about DoC patients
Table B.10: Clustering analysis results MCS patient L4. (a): Clusters centroids. Values displayed here arethe normalised values. (b): Spearman correlation coefficients between the features and the estimatedlevels of consciousness.
Cluster 1 Cluster 2 Cluster 1 Cluster 2 FCM GMM Product ens. Average ens.Ptheta 0,1289 0,1821 0,1401 0,1789 Ptheta 0,6894 0,5700 0,5967 0,6204Pbeta 0,0230 0,0503 0,0237 0,0591 Pbeta 0,8503 0,9447 0,9470 0,8673SEF95 8,3880 15,93 8,4015 18,729 SEF95 0,8212 0,9506 0,9501 0,8519ERR 0,4063 0,4918 0,4273 0,4862 ERR 0,4857 0,4242 0,4510 0,4528LZC 1,1144 1,6139 1,1279 1,7756 LZC 0,7665 0,9396 0,9302 0,8038iCOHtheta 0,0603 0,0591 0,0614 0,0586 iCOHtheta -0,0261 -0,0589 -0,0512 -0,0282wSMI 0,0383 0,0414 0,0586 0,0448 wSMI 0,1958 0,3729 0,3620 0,2592
(a) (b)
FeaturesSpearman correlation
FeaturesFCM GMM
17:37 21:02 00:28 03:54 07:20 10:46 14:12 17:38
0
0.2
0.4
0.6
0.8
1
Est
imat
ed le
vel o
f con
scio
usne
ss
Patient L4
21:3
4
08:0
7
(a) Product ensemble
17:37 21:02 00:28 03:54 07:20 10:46 14:12 17:38
Time (HH:MM)
0
0.2
0.4
0.6
0.8
1
Est
imat
ed le
vel o
f con
scio
usne
ss 21:3
4
08:0
7
(b) Average ensemble
17:37 19:07 21:34 23:04 00:34 02:04 03:34 08:07 09:37 11:07 12:37 14:07 15:37 17:07Time (HH:MM)
NA/nv
C
O/C
O
Eye
s sc
orin
g
(c) Eyes scoring
Figure B.8: Estimated consciousness level for MCS patient L4 using using (a) a product of the resultsobtained from , and (b) an average ensemble of FCM and GMM. The blank areas represent the timesduring which no data were recorded in (a) and (b), or no eyes scoring were made in (c). Shaded arearepresents night time.
133

B Appendix: Additional information about DoC patients
Table B.11: Clustering analysis results MCS patient L7. (a): Clusters centroids. Values displayed here arethe normalised values. (b): Spearman correlation coefficients between the features and the estimatedlevels of consciousness.
Cluster 1 Cluster 2 Cluster 1 Cluster 2 FCM GMM Product ens. Average ens.Ptheta 0,1638 0,1323 0,1311 0,1645 Ptheta -0,2871 0,2455 -0,2466 -0,2858Pbeta 0,0387 0,0921 0,0951 0,0391 Pbeta 0,8024 -0,9249 0,9255 0,8042SEF95 15,4485 33,93 34,866 16,0020 SEF95 0,8626 -0,9847 0,9844 0,8638ERR 0,6047 0,5710 0,5639 0,6093 ERR 0,0587 0,0849 -0,0827 0,0585LZC 1,2622 1,97 1,9987 1,2648 LZC 0,7572 -0,9060 0,9054 0,7583iCOHtheta 0,0591 0,0571 0,0571 0,0603 iCOHtheta -0,0283 0,0630 -0,0615 -0,0282wSMI 0,0472 0,0659 0,667 0,0474 wSMI 0,7688 -0,8472 0,8490 0,7685
FeaturesSpearman correlation
FeaturesFCM GMM
15:39 19:04 22:30 01:56 05:22 08:47 12:13 15:39
0
0.2
0.4
0.6
0.8
1
Est
imat
ed le
vel o
f con
scio
usne
ss
Patient L7
21:4
1
07:2
2(a) Product ensemble
15:39 19:04 22:30 01:56 05:22 08:47 12:13 15:39
0
0.2
0.4
0.6
0.8
1
Est
imat
ed le
vel o
f con
scio
usne
ss 21:4
1
07:2
2
(b) Average ensemble
15:39 17:09 18:39 21:41 23:11 00:41 02:11 03:41 07:22 08:52 10:22 11:52 13:22 14:52Time (HH:MM)
NA/nv
C
O/C
O
Eye
s sc
orin
g
(c) Eyes scoring
Figure B.9: Estimated consciousness level for MCS patient L7 using using (a) a product of the resultsobtained from , and (b) an average ensemble of FCM and GMM. The blank areas represent the timesduring which no eyes scoring were made in (c). Shaded area represents night time.
134

B Appendix: Additional information about DoC patients
Table B.12: Clustering analysis results MCS patient L8. (a): Clusters centroids. Values displayed here arethe normalised values. (b): Spearman correlation coefficients between the features and the estimatedlevels of consciousness.
Cluster 1 Cluster 2 Cluster 1 Cluster 2 FCM GMM Product ens. Average ens.Ptheta 0,0753 0,0850 0,0887 0,0748 Ptheta -0,1053 0,2060 -0,2199 -0,1166Pbeta 0,0748 0,0189 0,0150 0,0646 Pbeta 0,8685 -0,9443 0,9275 0,8758SEF95 22,49 7,34 6,04 20,14 SEF95 0,8782 -0,9440 0,9291 0,8866ERR 0,3297 0,1150 0,0986 0,2906 ERR 0,8664 -0,9556 0,9417 0,8773LZC 1,5441 0,6743 0,6045 1,3941 LZC 0,8440 -0,9398 0,9252 0,8553iCOHtheta 0,0577 0,0568 0,0578 0,0587 iCOHtheta 0,0566 -0,0348 0,0446 0,0504wSMI 0,0437 0,0418 0,0417 0,0433 wSMI 0,1601 -0,2636 0,2469 0,1621
Spearman correlationFeatures
FCM GMMFeatures
14:26 17:58 21:30 01:02 04:34 08:06 11:37 15:09
0
0.2
0.4
0.6
0.8
1
Est
imat
ed le
vel o
f con
scio
usne
ss
Patient L8
20:3
4
08:0
7
(a) Product ensemble
14:26 17:58 21:30 01:02 04:34 08:06 11:37 15:09
0
0.2
0.4
0.6
0.8
1
Est
imat
ed le
vel o
f con
scio
usne
ss 20:3
4
08:0
7
(b) Average ensemble
14:26 15:56 17:26 18:56 20:34 22:04 23:34 01:04 02:34 08:07 09:37 11:07 12:37 14:07Time (HH:MM)
NA/nv
C
O/C
O
Eye
s sc
orin
g
(c) Eyes scoring
Figure B.10: Estimated consciousness level for MCS patient L8 using using (a) a product of the resultsobtained from , and (b) an average ensemble of FCM and GMM. The blank areas represent the timesduring which no eyes scoring were made in (c). Shaded area represents night time.
135

B Appendix: Additional information about DoC patients
Table B.13: Clustering analysis results MCS patient L9. (a): Clusters centroids. Values displayed here arethe normalised values. (b): Spearman correlation coefficients between the features and the estimatedlevels of consciousness.
Cluster 1 Cluster 2 Cluster 1 Cluster 2 FCM GMM Product ens. Average ens.Ptheta 0,0891 0,0769 0,0901 0,0748 Ptheta 0,3046 0,3232 0,3206 0,3032Pbeta 0,0461 0,0211 0,0476 0,0157 Pbeta 0,8251 0,9502 0,9439 0,8546SEF95 15,6825 7,7670 15,831 6,1830 SEF95 0,8565 0,9599 0,9544 0,8855ERR 0,3699 0,3322 0,372 0,3239 ERR 0,3153 0,3876 0,3790 0,3142LZC 1,3687 0,9533 1,3739 0,8724 LZC 0,7810 0,8463 0,8398 0,8053iCOHtheta 0,0557 0,0575 0,0561 0,0594 iCOHtheta -0,0385 -0,0733 -0,0663 -0,0447wSMI 0,0555 0,0494 0,055 0,0491 wSMI 0,4238 0,3470 0,3494 0,4008
FeaturesSpearman correlation
(b)
FeaturesFCM GMM
(a)
15:36 19:04 22:32 02:00 05:27 08:55 12:23 15:51
0
0.2
0.4
0.6
0.8
1
Est
imat
ed le
vel o
f con
scio
usne
ss
Patient L9
22:2
6
05:2
1
(a) Product ensemble
15:36 19:04 22:32 02:00 05:27 08:55 12:23 15:51
0
0.2
0.4
0.6
0.8
1
Est
imat
ed le
vel o
f con
scio
usne
ss 22:2
6
05:2
1
(b) Average ensemble
15:36 17:06 18:36 22:26 23:56 01:26 02:56 04:26 05:21 06:51 08:21 09:51 11:21 12:51Time (HH:MM)
NA/nv
C
O/C
O
Eye
s sc
orin
g
(c) Eyes scoring
Figure B.11: Estimated consciousness level for MCS patient L9 using using (a) a product of the resultsobtained from , and (b) an average ensemble of FCM and GMM. The blank areas represent the timesduring which no eyes scoring were made in (c). Shaded area represents night time.
136

B Appendix: Additional information about DoC patients
Table B.14: Clustering analysis results MCS patient L16. (a): Clusters centroids. Values displayed here arethe normalised values. (b): Spearman correlation coefficients between the features and the estimatedlevels of consciousness.
Cluster 1 Cluster 2 Cluster 1 Cluster 2 FCM GMM Product ens. Average ens.Ptheta 0,1834 0,1840 0,1829 0,1834 Ptheta -0,0147 0,0305 0,0305 -0,0143Pbeta 0,1283 0,0577 0,1257 0,0483 Pbeta 0,8654 0,9810 0,9800 0,8722SEF95 30,897 18,1800 30,7935 16,2855 SEF95 0,8661 0,9584 0,9589 0,8705ERR 0,6242 0,5798 0,62 0,5701 ERR 0,1263 0,2056 0,2052 0,1275LZC 1,8859 1,2149 1,8601 1,1312 LZC 0,8244 0,9042 0,9051 0,8294iCOHtheta 0,0665 0,0659 0,0677 0,0661 iCOHtheta 0,0120 0,0253 0,0246 0,0119wSMI 0,0505 0,0440 0,0501 0,0440 wSMI 0,5141 0,4868 0,4900 0,5077
FeaturesSpearman correlation
(b)(a)
FeaturesFCM GMM
(a) Product ensemble
16:15 19:41 23:07 02:32 05:58 09:24 12:50 16:15
0
0.2
0.4
0.6
0.8
1
Est
imat
ed le
vel o
f con
scio
usne
ss 22:4
1
07:4
1
(b) Average ensemble
16:15 17:45 19:15 22:41 00:11 01:41 03:11 04:41 07:41 09:11 10:41 12:11 13:41 15:11Time (HH:MM)
NA/nv
C
O/C
O
Eye
s sc
orin
g
(c) Eyes scoring
Figure B.12: Estimated consciousness level for MCS patient L16 using using (a) a product of the resultsobtained from , and (b) an average ensemble of FCM and GMM. The blank areas represent the timesduring which no eyes scoring were made in (c). Shaded area represents night time.
137

B Appendix: Additional information about DoC patients
Table B.15: Clustering analysis results MCS patient S2. (a): Clusters centroids. Values displayed here arethe normalised values. (b): Spearman correlation coefficients between the features and the estimatedlevels of consciousness.
Cluster 1 Cluster 2 Cluster 1 Cluster 2 FCM GMM Product ens. Average ens.Ptheta 0,1122 0,1254 0,0972 0,1518 Ptheta -0,0914 -0,4109 -0,4149 -0,1643Pbeta 0,0468 0,0220 0,0444 0,0168 Pbeta 0,6822 0,6946 0,6936 0,7423SEF95 18,522 9,2430 18,315 6,9975 SEF95 0,7918 0,8513 0,8505 0,8359ERR 0,4533 0,3456 0,4441 0,3267 ERR 0,4830 0,2671 0,2695 0,4760LZC 1,2811 0,9875 1,2479 0,9265 LZC 0,4236 0,3742 0,3807 0,4545iCOHtheta 0,0602 0,0597 0,0582 0,0628 iCOHtheta 0,0025 -0,0740 -0,0696 -0,0088wSMI 0,0340 0,0361 0,0329 0,0384 wSMI -0,3249 -0,5361 -0,5450 -0,4002
FeaturesSpearman correlation
(b)(a)
FeaturesFCM GMM
15:35 17:41 19:47 21:52 23:58 02:04 04:09 06:15 08:21 10:27
0
0.2
0.4
0.6
0.8
1
Est
imat
ed le
vel o
f con
scio
usne
ss
Patient S2
23:0
0
04:5
5
24-J
an-2
011
15:3
5:37
24-J
an-2
011
17:1
9:01
24-J
an-2
011
18:0
0:43
25-J
an-2
011
10:2
7:09
(a) Product ensemble
15:35 17:41 19:47 21:52 23:58 02:04 04:09 06:15 08:21 10:27
Time (HH:MM)
0
0.2
0.4
0.6
0.8
1
Est
imat
ed le
vel o
f con
scio
usne
ss 23:0
0
04:5
5
24-J
an-2
011
15:3
5:37
24-J
an-2
011
17:1
9:01
24-J
an-2
011
18:0
0:43
25-J
an-2
011
10:2
7:09
(b) Average ensemble
18:05 19:35 23:00 00:30 02:00 03:30 08:30 10:00Time (HH:MM)
NA/nv
C
O/C
O
Eye
s sc
orin
g
(c) Eyes scoring
Figure B.13: Estimated consciousness level for MCS patient S2 using using (a) a product of the resultsobtained from , and (b) an average ensemble of FCM and GMM. The blank areas represent the timesduring which no data were recorded in (a) and (b), or no eyes scoring were made in (c). Shaded arearepresents night time.
138

B Appendix: Additional information about DoC patients
Table B.16: Clustering analysis results MCS patient S5. (a): Clusters centroids. Values displayed here arethe normalised values. (b): Spearman correlation coefficients between the features and the estimatedlevels of consciousness.
Cluster 1 Cluster 2 Cluster 1 Cluster 2 FCM GMM Product ens. Average ens.Ptheta 0,2131 0,1927 0,0728 0,2221 Ptheta 0,1436 -0,5158 0,5587 0,2113Pbeta 0,1751 0,1323 0,0261 0,1733 Pbeta 0,4884 -0,9269 0,8335 0,5399SEF95 30,69 22,84 8,54 29,61 SEF95 0,8262 -0,6649 0,6630 0,8544ERR 0,64 0,6162 0,3050 0,6721 ERR 0,0440 -0,6656 0,5917 0,1264LZC 1,2261 0,6025 0,5785 0,9983 LZC 0,7650 -0,1689 0,2199 0,7277iCOHtheta 0,0644 0,0624 0,0587 0,0646 iCOHtheta 0,0573 -0,0629 0,0695 0,0631wSMI 0,0340 0,0368 0,0386 0,0347 wSMI -0,4952 0,3101 -0,2706 -0,4814
(b)
FeaturesSpearman correlation
(a)
FeaturesFCM GMM
17:40 20:21 23:02 01:43 04:23 07:04 09:45 12:26 15:06 17:47
0
0.2
0.4
0.6
0.8
1
Est
imat
ed le
vel o
f con
scio
usne
ss
Patient S5
23:0
0
05:0
0
21-F
eb-2
011
18:0
0:43
22-F
eb-2
011
10:2
7:09
(a) Product ensemble
17:40 20:21 23:02 01:43 04:23 07:04 09:45 12:26 15:06 17:47
0
0.2
0.4
0.6
0.8
1
Est
imat
ed le
vel o
f con
scio
usne
ss 23:0
0
05:0
0
21-F
eb-2
011
18:0
0:43
22-F
eb-2
011
10:2
7:09
(b) Average ensemble
23:00 00:30 02:00 03:30 05:00Time (HH:MM)
NA/nv
C
O/C
O
Eye
s sc
orin
g
(c) Eyes scoring
Figure B.14: Estimated consciousness level for MCS patient S5 using using (a) a product of the resultsobtained from , and (b) an average ensemble of FCM and GMM. The blank areas represent the timesduring which no eyes scoring were made in (c). Shaded area represents night time.
139

B Appendix: Additional information about DoC patients
Table B.17: Clustering analysis results MCS patient S6. (a): Clusters centroids. Values displayed here arethe normalised values. (b): Spearman correlation coefficients between the features and the estimatedlevels of consciousness.
Cluster 1 Cluster 2 Cluster 1 Cluster 2 FCM GMM Product ens. Average ens.Ptheta 0,1357 0,0921 0,0890 0,1299 Ptheta 0,4876 -0,4458 0,4546 0,4740Pbeta 0,1079 0,0482 0,0392 0,1044 Pbeta 0,8475 -0,9155 0,9174 0,8595SEF95 22,06 12,66 11,12 21,70 SEF95 0,8241 -0,8996 0,9011 0,8379ERR 0,3384 0,1629 0,1435 0,3208 ERR 0,7944 -0,8146 0,8195 0,7930LZC 0,3984 0,3851 0,3375 0,4462 LZC -0,1260 0,0128 -0,0214 -0,1033iCOHtheta 0,0594 0,0614 0,0627 0,0595 iCOHtheta -0,0385 0,0537 -0,0525 -0,0458wSMI 0,0301 0,0306 0,0309 0,0300 wSMI -0,1309 0,1367 -0,1360 -0,1457
(a) (b)
FeaturesSpearman correlation
FeaturesFCM GMM
14:31 17:01 19:32 22:02 00:33 03:03 05:34 08:04 10:35 13:06
0
0.2
0.4
0.6
0.8
1
Est
imat
ed le
vel o
f con
scio
usne
ss
Patient S6
23:0
0
05:0
0
22-S
ep-2
009
14:3
1:14
22-S
ep-2
009
17:0
8:28
22-S
ep-2
009
18:0
7:04
23-S
ep-2
009
13:0
6:02
(a) Product ensemble
14:31 17:01 19:32 22:02 00:33 03:03 05:34 08:04 10:35 13:06
0
0.2
0.4
0.6
0.8
1
Est
imat
ed le
vel o
f con
scio
usne
ss 23:0
0
05:0
0
22-S
ep-2
009
14:3
1:14
22-S
ep-2
009
17:0
8:28
22-S
ep-2
009
18:0
7:04
23-S
ep-2
009
13:0
6:02
(b) Average ensemble
14:35 16:05 18:10 23:00 00:30 02:00 03:30 05:00Time (HH:MM)
NA/nv
C
O/C
O
Eye
s sc
orin
g
(c) Eyes scoring
Figure B.15: Estimated consciousness level for MCS patient S6 using using (a) a product of the resultsobtained from , and (b) an average ensemble of FCM and GMM. The blank areas represent the timesduring which no data were recorded in (a) and (b), or no eyes scoring were made in (c). Shaded arearepresents night time.
140

B Appendix: Additional information about DoC patientsTa
ble
B.18
:p-v
alue
sof
the
Wilc
oxon
rank
sum
test
sco
mpa
ring
nigh
tan
dd
ayva
lues
ofth
ed
iffer
ent
feat
ures
asw
ella
sth
ees
tim
ated
cons
ciou
snes
sle
velf
oral
lDoC
pati
ents
.The
cells
inre
dre
pres
ent
the
case
sw
hen
the
diff
eren
ces
are
not
sign
ifica
ntat
the
5%
leve
l.
Patie
ntDi
agno
sisPt
heta
Pbet
aSE
F95
ERR
LZC
iCOH
wSM
IFC
MGM
MAv
erag
e en
s.Pr
oduc
t ens
.L1
UWS
8,37E-10
1,04E-20
4,22E-34
1,60E-94
1,47E-14
0,55
3,16E-48
1,40E-48
6,31E-37
4,08E-47
4,47E-38
L3UW
S3,33E-03
1,13E-07
2,35E-05
6,91E-43
7,01E-21
0,32
3,05E-05
3,07E-02
4,50E-07
3,63E-02
1,97E-07
L13
UWS
8,72E-03
0,0852
4,69E-02
1,79E-13
2,12E-05
0,25
2,31E-05
2,63E-09
1,57E-03
1,52E-06
1,46E-03
S12
UWS
0,0692
1,01E-24
2,59E-06
6,05E-13
9,53E-25
0,42
9,31E-168
4,52E-07
0,48
1,15E-06
0,92
S13
UWS
0,01
6,29E-22
6,79E-30
0,83
3,89E-16
0,26
6,49E-55
9,12E-13
4,41E-19
1,19E-09
4,30E-09
S14
UWS
0,0172
1,23E-106
1,91E-108
2,66E-91
1,32E-21
5,03E-06
6,09E-19
4,80E-82
9,79E-104
1,45E-83
7,51E-104
S16
UWS
7,83E-32
1,36E-51
3,18E-56
3,37E-26
3,93E-21
0,11
0,1
2,75E-54
1,01E-28
1,01E-54
2,20E-29
S17
MCS/VS
2,80E-77
0,74
8,47E-05
2,20E-03
1,49E-04
8,55E-03
7,54E-10
7,33E-13
2,78E-19
3,84E-12
1,28E-19
L4MCS
9,26E-80
1,65E-135
2,36E-129
2,63E-06
7,61E-143
0,19
0,29
8,04E-108
9,54E-129
1,93E-105
1,60E-127
L7MCS
5,04E-123
1,85E-30
7,84E-09
9,24E-06
2,42E-34
0,76
0,23
0,53
1,41E-10
0,58
3,57E-10
L8MCS
0,28
3,82E-177
1,06E-171
1,50E-171
1,30E-198
0,17
2,42E-04
2,58E-136
1,93E-174
3,14E-139
4,10E-172
L9MCS
6,50E-04
4,51E-24
5,75E-23
4,45E-07
6,37E-28
0,95
3,95E-17
7,82E-12
3,62E-16
1,16E-14
8,28E-15
L16
MCS
4,46E-07
0,16
0,83
4,71E-28
2,70E-02
0,68
0,29
1,13E-05
0,14
1,08E-05
0,1
S2MCS
2,51E-56
0,13
4,61E-02
1,42E-22
9,06E-03
3,18E-29
2,28E-29
3,21E-03
2,66E-18
0,66
8,12E-18
S5MCS
6,48E-24
7,92E-20
1,38E-33
3,33E-20
7,19E-52
2,70E-04
2,18E-05
2,76E-33
9,03E-30
1,04E-44
2,34E-32
S6MCS
3,84E-126
3,72E-47
5,97E-36
9,71E-08
0,73
3,20E-03
7,18E-128
3,15E-16
2,78E-16
8,52E-20
8,34E-16
S7MCS
4,20E-20
0,01
2,40E-03
0,89
3,01E-21
0,61
5,28E-55
1,03E-28
1,49E-15
6,33E-14
1,55E-15
141

B Appendix: Additional information about DoC patients
Table B.19: Performance of the cluster analysis for different threshold values for the binarisation of thedegrees of membership (cf. Section 6.1.3). The cells in green represent the values of the thresholdcorresponding to the highest accuracy.
Patient Threshold Average ensemble
Product ensemble Patient Threshold Average
ensembleProduct
ensemble0,3 63,89% 65,15% 0,3 54,52% 59,76%0,4 62,55% 63,89% 0,4 54,05% 54,52%0,5 61,88% 61,88% 0,5 53,33% 53,33%0,6 61,06% 59,72% 0,6 52,38% 51,90%0,7 60,09% 56,52% 0,7 51,90% 51,19%0,3 44,91% 44,26% 0,3 63,56% 62,05%0,4 45,46% 44,81% 0,4 64,03% 63,47%0,5 46,11% 46,11% 0,5 64,50% 64,50%0,6 46,39% 49,17% 0,6 65,16% 65,63%0,7 46,94% 55,37% 0,7 65,63% 66,95%0,3 55,66% 52,52% 0,3 69,77% 69,89%0,4 56,36% 55,66% 0,4 69,89% 69,89%0,5 57,20% 57,20% 0,5 69,77% 69,77%0,6 57,48% 58,53% 0,6 70,11% 69,66%0,7 58,53% 60,49% 0,7 69,89% 70,11%0,3 44,80% 44,34% 0,3 72,81% 73,60%0,4 44,80% 44,80% 0,4 72,44% 72,87%0,5 44,80% 44,80% 0,5 71,76% 71,76%0,6 44,80% 44,80% 0,6 71,70% 70,96%0,7 44,80% 44,80% 0,7 71,15% 68,32%0,3 56,23% 56,23% 0,3 34,57% 32,64%0,4 57,30% 56,23% 0,4 35,26% 34,57%0,5 57,65% 57,65% 0,5 36,64% 36,64%0,6 57,30% 58,01% 0,6 37,47% 39,12%0,7 58,01% 58,36% 0,7 38,98% 41,32%0,3 83,27% 85,20% 0,3 52,08% 50,94%0,4 82,63% 83,27% 0,4 53,12% 52,08%0,5 82,24% 82,24% 0,5 53,43% 53,43%0,6 81,66% 80,57% 0,6 53,85% 54,78%0,7 80,76% 78,64% 0,7 54,16% 57,59%0,3 53,38% 53,57% 0,3 54,63% 54,63%0,4 53,20% 53,29% 0,4 54,63% 54,63%0,5 53,20% 53,20% 0,5 54,63% 54,63%0,6 53,20% 53,20% 0,6 54,63% 52,78%0,7 53,10% 51,88% 0,7 54,63% 50,93%0,3 21,79% 21,57% 0,3 60,81% 59,62%0,4 22,00% 21,79% 0,4 61,64% 60,69%0,5 22,00% 22,00% 0,5 62,00% 62,00%0,6 22,22% 22,22% 0,6 62,23% 62,83%0,7 22,22% 22,00% 0,7 62,83% 63,90%
0,3 30,55% 37,14%0,4 29,67% 30,55%0,5 28,79% 28,79%0,6 27,69% 26,15%0,7 26,15% 23,30%
S7
S16
S17
L4
L7
L8
L9
L16
S2
S5
S6
L1
L3
L13
S12
S13
S14
142

C Appendix: Additional information aboutCLIS patient GR
C.1 Recording channels
Table C.1 lists all recording channels numbers corresponding to the labels of the ECoG gridillustrated in Fig. 5.2
Table C.1: ECoG channels list and labels for CLIS patient GR.
Channel # Label Channel # Label Channel # Label1 G034 17 G059 49 G0892 G035 18 G060 50 G0903 G036 19 G064 51 G0964 G037 20 G065 52 G0975 G038 21 G066 53 G0986 G042 22 G067 54 G0997 G043 23 G068 55 G1008 G044 24 G072 56 G1059 G045 25 G073 57 G10710 G049 26 G074 58 G10811 G050 27 G075 59 G10912 G051 28 G080 60 S00713 G052 29 G081 61 S00814 G053 30 G082 62 S01415 G057 31 G083 63 S01516 G058 32 G088 64 S016
C.2 Experimental setup
Table C.2 presents the questions that were asked during the experiment as well as the answers.It is reported as it was written by the experimenter. The experiment started at 14:50 and endedat 17:00. This is the first and only successful communication attempt out of 170. 18 questionswere asked. 16 of them were correctly answered. One question was not correctly answered
143

C Appendix: Additional information about CLIS patient GR
(Question ) and the answer for Question 13 is unclear. In the answer column, + means that thepatient’s answer was classified as "yes", and - means that it has been identified as a "no".
Table C.2: Experimental setup for patient GR.
No. Paired questions AnswerDate: 2008-03-16
Session:Present: FemkeArrive: 14.50
Leave:
Time:Heart rate: 98
Oxygen saturation: 97
Lying on side: back/leftRespiration BPM: 15
Ground: S032
Reference: G102
Initial eye movement looked much stronger than previous days. I asked him questions(without video).
0.1You feel good today? +You feel bad today? -
0.2Are you happy that I’m here? +Would you prefer to be alone and to watch TV? -
The responses were so strong that I though a conversations was possible. I turned onthe video. The following questions were asked. Someone should check the video tocheck me.
1
You feel good today? +You feel bad today? -
2
Are you German? +Are you Dutch? -
3
Do you feel pain? -Are you free of pain? +
4
Are you satisfied by the health care at BS (city in Ger-many)?
+
Are you unsatisfied by the health care at BS? -Are you unsatisfied by the health care at BS? -Are you satisfied by the health care at BS? +
5
Are you still happy to have decided for the operation? +Are you sorry for having decided to do the operation? -
6
Do you think, you have feedback control over sound? +Do you think the feedback is not controllable? -
7
Are the sounds loud enough for you? +Should we turn the speaker louder? -Should we turn down the speaker?Are the speakers o.k.? +
Continued on next page
144

C.2 Experimental setup
Table C.2 – continued from previous pageNo. Paired questions Answer
"We would like to know about your psychological status. We want to know how yourmood is."
8
Are you positive regarding the future? +Do you not know exactly what future will bring for you,so, are you neutral for your future?
-
Are you negative for the future? -"I will ask you now a question, that have to be asked to you somewhen."
9
Do you wish sometimes, you were dead? -You never wished to be dead? +##
10
Can you enjoy your life under these circumstances? +You don’t enjoy your life any more? -
11
Was it a good decision to bring you to BS? +Do you prefer to go back to Vohenstrauss (his hometown)?
+ & - (not clear)
Do you prefer to go back to Vohenstrauss? -
12
Do you want to stay at BS in the future? -Do you want to stay at BS in the future? -Do you prefer to go into another nursing home? +Do you prefer to go into another nursing home? +
13
You want to go back to Vohenstrauss in some later period?Do I understand you correctly?
+ (no clear answer)
You want in another nursing home than Vohenstrauss? + (no clear answer)"I have been informed, that our political contacts we have engaged to convince thehealth insurance regarding your care costs will publish a report about you in theSPEIGEL (very renown German journal). Unfortunately, I don’t know more than that,neither about the content of the article. I will inform myself to tell you."
14
Shouldn’t we go to public with the heath insurance? -Shouldn’t we fight we the health insurance? -Should we fight with the health insurance? -
15
For long term schedule: You want to go to Vohenstrauss? +For long term schedule: You want to stay at BS? +
"It’s not clear to me what you want to say, GR."16 You don’t care where you will be in future? -"I ask you a different way now."17 For long term schedule, are you Prefer Vohenstrauss be-
fore BS?-
I see a NO in your eyes, is this correct?+, including corner of the mouth, I tried letting him repeat the mouth twitch but itdidn’t always work. Instructed him to use whatever he could or both
17
Do you prefer, for long term, to stay at BS before Vohen-strauss?
-
You want another nursing home than those 2?You want to spell something?
GR then spelled the word "AMBERG".Continued on next page
145

C Appendix: Additional information about CLIS patient GR
Table C.2 – continued from previous pageNo. Paired questions Answer
This was a long process where I repeatedly double checked (verified "correct?" and"wrong?") if I got all letters correct. I also asked him for confirmation or declination ofthe final word "AMBERG". Someone should CHECK the video and check me.I, then suspected that he wanted to go to Amberg instead of staying in BS or goingback to Vehenstrauss.
18
You mean, you want to go to Amberg in the future?Did I understood you wrong, that you want to go toAmberg in the future?
-
VIDEO lost power. We take a break and I type up this conversation.Time: 17.00
Heart rate: 94
Oxygen saturation: 98
Lying on side: back/leftRespiration BPM: 15
Ground: ?Reference: ?
146

D Appendix: Additional information aboutthe CLIS patients
D.1 Detailed description of the CLIS patients (except GR)
The following descriptions of the patients were obtained directly from the experimenters. Noneof them showed any brain disease unrelated to ALS. Descriptions of patients P5, P6, P7, P9 andP10 can also be found in [Mar+21] and [Mal+19]. In addition to EEG, fNRIS were also recorded.All patients were in home care.
Patient P1 P1 is a female CLIS patient that was diagnosed with sporadic bulbar ALS in May2007 and as locked-in patient in 2009. She transitioned into a completely locked-in state in May2010 according to the diagnosis of experienced neurologists. The patient has been artificiallyventilated since September 2007 and fed through a percutaneous endoscopic gastrostomy tubesince October 2007. No communication with eye movements, other muscles, nor assistivedevices was possible with this patient. She was however successful in communicating usingfNRIS. She passed away in 2019 at the age of 75.
Patient P2 P2 is a male CLIS patient diagnosed with non-bulbar ALS in May 2011. He hasbeen artificially ventilated since August 2011 and fed through a percutaneous endoscopicgastrostomy tube since October 2011. He started communicating with a speech device in histhroat from December 2011 which ultimately failed. He then started using a MyTobii eye-tracking device in April 2012 and was successful until December 2013. Subsequently, the familymembers attempted to communicate by training him to use eyes movements: to the right foryes and to the left to answer no. The response was variable and no communication was possiblesince August 2014. Nonetheless, he was able to use a binary communication using fNRIS from2014 to 2016. The patient passed away in 2018 at the age of 65.
Patient P3 P3 is a 80 years old female CLIS patient diagnosed with bulbar ALS in 2010. Shelost speech and capability to walk by 2011. She has been fed through a percutaneous endoscopicgastrostomy tube since September 2011 and artificially ventilated since March 2012. She startedusing assistive communication devices using one finger to communicate in February 2013 untilit failed. Later, in September 2013, she was diagnosed with degeneration of vision due to corneadefects. Afterwards, an attempt was made to communicate with her using eye tracking from
147

D Appendix: Additional information about the CLIS patients
early 2014 until August 2014. No communication was possible with her since then according tothe husband and caretakers. She was then introduced to BCI and the experimenters reportedsuccessful Yes/No communication from 2014 to 2015 using fNRIS.
Patient P4 P4 is a 29 years old female CLIS patient diagnosed with juvenile ALS in December2012. She was completely paralysed within half a year after diagnosis. She has been artificiallyventilated since March 2013 and fed through a percutaneous endoscopic gastrostomy tube sinceApril 2013. She was able to communicate with the eye-tracking device from early 2013 untilAugust 2014 when she lost some eye control. Her family members also trained her to use eyemovements to communicate: to the right to answer yes to questions and to the left for no. Thiswas possible until December 2014. So when the patient completely lost the control of her eyes inJanuary 2015, she attempted to answer yes by twitching the right corner of her mouth. That toovaried considerably so the parents lost reliable communication contact since. She was howeverable to successfully communicate using fNRIS from 2014 to 2016.
Patient P5 P5 is a 58 years old male CLIS patient diagnosed with bulbar sporadic ALS in May2008 and as locked-in in 2009. According to the diagnosis of neurologists and to the recordingsof the experimenters, he transitioned into a completely locked-in state in May 2010. He hasbeen artificially ventilated since September 2009 and fed through a percutaneous endoscopicgastrostomy tube since October 2009. No communication with eye movements, other muscles,or assistive devices was possible since 2010. Moreover, the patient was also never successfulwith fNRIS.
Patient P6 P6 is a male CLIS patient diagnosed with bulbar ALS in 2009. He lost speechand capability to move by 2010 and has been artificially ventilated since September 2010. Nocommunication with eye movements, other muscles, or assistive devices was possible since2012. However, the patient was able to communicate successfully using fNRIS in 2017. He diedin 2019 at 38.
Patient P7 P7 is a female CLIS patient diagnosed with Mills’ syndrome26 of ALS with atypicalprogression at the beginning of 2010. She lost speech and capability to walk in 2011. She hasbeen fed through a percutaneous endoscopic gastrostomy tube since June 2010 and artificiallyventilated since June 2010. The patient started using assistive communication devices usingeye movement in 2011 which ultimately failed at the beginning of 2015. She then used thumb-movements to communicate with her family and caretakers since the middle of 2015, and thisbecame unreliable after a year. She was also never successful in using binary communicationwith the fNRIS and passed away in 2019 at the age of 56.
26an idiopathic, slowly progressive, spastic hemiparesis.
148
D.1 Detailed description of the CLIS patients (except GR)
Patient P9 P9 is a 23 years old male CLIS patient diagnosed with juvenile ALS with FUSmutation heterozygote on Exon 14: c.1504delG in 2013. He has been artificially ventilated sinceAugust 2014. He started communication using MyTobii eye-tracking device from January 2015
and was able to do so until December 2015. Afterwards, the family members attempted tocommunicate by training him to move his facial muscles near the nose to answer yes but theresponse was unreliable. No communication was possible since June 2016. Moreover, only fewirregular good sessions were observed using fNRIS.
Patient P10 P10 is a 25 years old male LIS patient on the verge of CLIS. He was diagnosed withfamilial juvenile ALS with ALS 6-FUS gene mutation in December 2012. He was completelyparalysed within a year of the diagnosis. The patient has been artificially ventilated sinceNovember 2013. He was able to communicate with eye-tracking from early 2014 to August2016 but was unable to use the eye-tracking device after he lost eye control in August 2016.No communication with eye movements, other muscles, or assistive devices was possible since2016. In addition, no successful communication using fNRIS was ever recorded.
149

D Appendix: Additional information about the CLIS patients
D.2 Estimated consciousness levels for CLIS patients
27/0
7/15
16:
0016
:16
16:2
816
:43
16:5
417
:05
28/0
7/15
13:
4513
:57
14:1
114
:23
14:3
614
:49
15:0
2
29/0
7/15
16:
0016
:12
16:2
416
:36
16:4
717
:01
17:1
3
30/0
7/15
12:
4113
:45
31/0
7/15
15:
1115
:28
15:3
915
:53
16:0
716
:19
27/0
1/16
15:
2315
:38
15:5
116
:02
16:1
416
:24
28/0
1/16
13:
4814
:03
14:1
514
:28
14:4
0
Date
0
0.2
0.4
0.6
0.8
1
Est
imat
ed c
onsc
ious
ness
leve
l
Patient P5
ProductAverage
Figure D.1: Average values of the estimated consciousness level for CLIS patient P5. The x-axis representsthe dates and times of recording.
14/11/16 13:0113:25
13:3913:52
14:05
15/11/16 12:5113:10
13:2713:46
13:58
16/11/16 12:5713:10
13:2813:40
14:0014:10
17/11/16 13:5414:06
14:2014:31
14:4614:57
18/04/17 14:2514:34
14:4515:00
15:09
20/04/17 13:3813:49
14:1714:41
21/04/17 13:2713:38
14:05
Date
0
0.2
0.4
0.6
0.8
1
Est
imat
ed c
onsc
ious
ness
leve
l
Patient P7
ProductAverage
Figure D.2: Average values of the estimated consciousness level for CLIS patient P7. The x-axis representsthe dates and times of recording.
09/06/17 17:5118:10
18:24
10/06/17 12:0112:13
12:2712:42
12:53
11/06/17 11:1911:31
11:4712:11
12:29
12/06/17 10:4911:02
11:1311:26
11:4411:55
13/03/19 10:5911:16
14/03/19 11:53
Date
0
0.2
0.4
0.6
0.8
1
Est
imat
ed c
onsc
ious
ness
leve
l
Patient P9
ProductAverage
Figure D.3: Average values of the estimated consciousness level for CLIS patient P9. The x-axis representsthe dates and times of recording.
150

Bibliographic details
Adama, VS. (2021). Consciousness level assessment of Completely Locked-in Syndrome patients usingSoft-Clustering. [Doctoral dissertation]. Department of Neuromorphe Information Processing,Leipzig University.
151


Selbständigkeitserklärung
Hiermit erkläre ich, die vorliegende Dissertation selbständig und ohne unzulässige fremdeHilfe angefertigt zu haben. Ich habe keine anderen als die angeführten Quellen und Hilfsmittelbenutzt und sämtliche Textstellen, die wörtlich oder sinngemäß aus veröffentlichten oder unver-öffentlichten Schriften entnommen wurden, und alle Angaben, die auf mündlichen Auskünftenberuhen, als solche kenntlich gemacht. Ebenfalls sind alle von anderen Personen bereitgestelltenMaterialen oder erbrachten Dienstleistungen als solche gekennzeichnet.
Leipzig, den 5. November 2021
Related Documents