Error Analysis of Ticket Vending Machines : Comparing Analytic and Empirical Data 1 Iain Connell UCL Interaction Centre (UCLIC) Remax House 31-32 Alfred Place London WC1E 7DP UK CITE CONTENTS AS: CONNELL, I.W. (1998). Error analysis of ticket vending machines: comparing analytic and empirical data. Ergonomics, 1998, 41(7), 927-961. Figures and tables appear at end of text 1 The first phase of observations for this study were carried out as part fulfilment of the requirements for an MSc awarded by London Guildhall University.

Welcome message from author
This document is posted to help you gain knowledge. Please leave a comment to let me know what you think about it! Share it to your friends and learn new things together.
Transcript
Error Analysis of Ticket Vending Machines : Comparing Analytic and Empirical Data1 Iain Connell UCL Interaction Centre (UCLIC) Remax House 31-32 Alfred Place London WC1E 7DP UK CITE CONTENTS AS: CONNELL, I.W. (1998). Error analysis of ticket vending machines: comparing
analytic and empirical data. Ergonomics, 1998, 41(7), 927-961. Figures and tables appear at end of text
1 The first phase of observations for this study were carried out as part fulfilment of
the requirements for an MSc awarded by London Guildhall University.

2
Keywords : Usability evaluation, usability inspection, error analysis.
An error analysis was performed on the three ticket vending machines installed at
London underground and overground train stations. A brief analytic inspection,
resulting in a set of predicted errors, was followed by lengthy empirical observations
of successes, failures and errors occurring during machine use. There were two
observational phases, five years apart. Comparisons were made between the patterns
of error-making on the three machines, using error categories derived from the initial
analysis. It was found that these comparisons were sufficient to account for most of
the between-machine and between-phase differences, though some unattributed
errors remained. It was also found that much of the observed pattern of error-
making had been predicted by the initial inspection, and it is suggested that, for
relatively simple interfaces such as these, the method (Dialogue Error Analysis) is
sufficient to identify and prioritise most problems which will occur in use. Attempt
was also made to relate the observed error categories to influential taxonomies of
human error.

3
1. Introduction
Usability evaluation methods can be classified into two broad groups, namely analytic and empirical
(Gray and Salzman 1998). Analytic methods are those which attempt to make predictions about user-
system interaction from intrinsic system features (including a model or partial representation), while
empirical methods measure some aspect or aspects of interaction while a (full or partial) system is in
use. Further classifications, such as that proposed by Whitefield et al. (1991), include inspections
(dubbed ‘specialist reports’ by Whitefield et al.) and surveys (or ‘user reports’). Inspections are
performed on a system or prototype by human factors or other personnel, who judge the system against
evaluative criteria (e.g. Mack and Nielsen 1994, Nielsen 1994b). Surveys include user interviews and
questionnaires. This paper presents one form of inspection method, namely Dialogue Error Analysis
(DEA), that can be used to make predictions about real or eventual use of a system, from a model,
prototype or early version. The claim will be made that such an analytic inspection method is capable
of predicting and prioritising most of the problems which will occur with the system in actual use. In
support of this claim, comparison will be made between the results of a brief initial error analysis and a
set of lengthy empirical observations.
The subject of this study was the three ticket vending machines currently installed at London
underground and overground train stations. During an initial inspection, performed on the two London
Underground machines, prediction was made of the errors, both user-related and system-related, which
would be likely to occur during machine use. Field observations later took place (in two phases, five
years apart) on these and a third, overground, machine. Observations focused on both failures and
successes, detailed note being taken of the errors which occurred. Observed errors were later grouped
into nine major categories. These categories were used in comparison of the analytic (initial
inspection) and empirical (observational) data. Attempt was also made to relate the categories to
influential taxonomies of human error. 1.1. Studies of Public Access Systems
Given the prevalence in our daily lives of public access (‘walk up and use’) systems such as Automatic
Teller Machines (ATMs) and information points (‘kiosks’), there have been few studies of such
installations. Only one other published study (Baber and Parker 1994 & Baber and Stanton 1996,
summarised below), is known of the London ticket vending machines. The discussion which follows
focuses on the methods employed by these other studies.
Most attention has been directed at the type of hypermedia information system commonly found in
museums and libraries. Examples are Hardman (1989), Yamada et al. (1995) and Sajaniemi and
Tossavainen (1996). The methods used by the first study included observations and video/audio
recording, while those of both the second and third were a combination of interviews, questionnaires
and automatic data logging. Apart from three attitudinal surveys (Burgoyne et al. 92, Rogers et al.
1994, Burford and Baber 1994) there are no known published field studies of ATMs. One laboratory
study of an ATM (Hatta and Iiyama 1991) employed both video monitoring and interviewing, data
4
collected including both success rates and error frequencies. Burford and Baber (1994) used their
survey and ‘incident diary’ results to devise a simulate adaptive ATM, test data including transaction
times and workload measures.
As for vending machines, most attention has been directed at ticketing systems. These range from
the Washington (USA) Metro (Zwaga 1988), a German railway station (Felix et al. 1991) and the
Netherlands Railways (Verhoef 1986 and 1988). All these studies used a combination of observations
and interviews; the first and second focused mainly on task time while the second included errors
during prototype use.
With regard to the two machines featured in the current study, London Underground Limited
(LUL) do not perform regular field studies other than in-house testing of new data or software.
However, their internal customer surveys include attitudes to the machines, the ‘satisfaction rating’
being reported at around 80%. During 1997 there has been camera surveillance of new prototype
touch-screen versions of the larger machine, intended for the Jubilee Line Extension (JLE). There
have also been other ergonomic and marketing studies in connection with the JLE. (Personal
communication from Paul Corfield of LUL).
The Verhoef (1986, 1988) studies concerned the same type of machine (the QuickFare) as is in
use in London overground stations. In the 1986 study, a combination of observations, interviews and
‘human error analysis’ was used, but no data presented. In the 1988 study video recording and
interviewing were used to analyse pre- and post-purchase errors made by users, but the data presented
was incomplete. In neither case was attempt made to relate errors to wider classifications.
The only other known published field study of the LUL ticket machines is reported in Baber and
Parker (1994) & Baber and Stanton (1996). In this study, focused on the larger of the two machines
(the MFM, or Multi Fare Machine), transaction times were recorded for successes and failures, both
with and without restarts (repeated attempts), under different machine modes (‘change given’, ‘exact
money only’, closed). Interviews were also conducted with a sample of users, and ticket window use
was recorded. It was found that most problems leading to restarts or failure were associated with the
‘exact money only’ mode, and that sequence errors (in selections or money insertion) were common.
Though no statistical analyses were included, much of what was reported concurs with the findings of
the current study. In particular, one piece of user behaviour - the use of the larger machine only to
determine ticket prices - was also observed in the current study, and will be discussed later.
Baber and Stanton (1996) went on to compare two types of analytic method, namely Task
Analysis for Error Identification (TAFEI) and Predictive Human Error Analysis (PHEA), for their
ability to predict the types of error which had been observed during MFM use. They reported that both
PHEA and TAFEI produced a figure for concurrent validity (the relationship between predicted and
observed errors) of around 80%, with inter-rater reliability (between two experienced analysts) of 90%
and 100% respectively. These results concur well with those to be reported in the current study, which
used a more straightforward analytic method (Dialogue Error Analysis) and a simpler form of validity
calculation (but does not offer any inter-rater reliability data). However, it will be pointed out that
such results rely on comparisons between classifications of errors, rather than the ‘raw’ (actual) errors

5
themselves; when this was taken into account, predictive validity dropped to around 50% for the
current study (and is not reported in Baber and Stanton 1996). The issue of error classification will be
taken up in the Discussion.
In the current study neither the initial inspection nor the later observations made use of measures
other than observation (of the machines themselves, and of errors made when in use). However,
detailed attention was given to successes and failures and to the nature of the errors made, enabling
comparisons to be drawn between the different machines and the two observational phases. It will be
claimed that this approach was sufficient to account for most of the error-making behaviour, though
additional methods (such as used in the above studies) were also attempted. 1.2. Theories of Human Error
The literature on human error is extensive and complex. Of most influence have been Norman’s
theory of action (1981, 1986) and descriptions of action slips (1981, 1983, 1988). His original (1981,
1983) distinction between a mistake, namely an error in the intention to act, and a slip, an error in
carrying out that intention, is central. It has been incorporated into Reason’s (1987a, 1987b, 1990)
taxonomy and error model, which themselves draw on Rasmussen’s (1982, 1986, 1987) causal model
and taxonomy. Thus have ensued not only more extensive descriptions of absent-minded slips and
lapses (Reason and Mycielska 1982, Reason 1984) but also Reason’s general model of human error
(GEMS).
In arriving at his three-level GEMS model (Reason 1987b, 1990) Reason has elaborated and
extended the slip-mistake dichotomy. In Reason’s model, slips remain at the skill-based level,
occurring due to a failure of monitoring; mistakes, however, can occur due to problem-solving failures
at either the rule-based or the knowledge-based levels. For Reason, it is our reluctance to look for
solutions at the knowledge-based level which is characteristic of rule-based error-making.
Rasmussen’s (1982, 1986, 1987) model also attempted to broaden the explanatory scope. His
‘multi-facet taxonomy’ of ‘man-task mismatches’ includes not only what he calls the mechanisms of
human malfunction, operating at the skill, rule and knowledge-based levels (Rasmussen 1982 p327),
but other factors ‘internal’ and ‘external’ both to the human and the task itself (Rasmussen 1982 p322).
Explanation for an error depends on how far back up the ‘causal chain’ we are prepared to go before
finding a man-system mismatch.
There are two main problem with these approaches. Firstly, in attempting to identify the cognitive
underpinnings of the whole range of human error, they have become imprecise and unwieldy,
especially at the higher levels of explanation. For example, It is difficult to distinguish between
mistakes of ‘imperfect’ and ‘reluctant’ rationality (Reason 1987a), or between ‘excessive task demand’
and ‘task characteristics’ (Rasmussen 1982 p322). Secondly, with the notable exception of lapses and
slips (Reason and Mycielska 1982, Reason 1984) both models are so far lacking in empirical support.
However, an example of a validated approach to such models is to be found in Zapf et al. (1992)
(and Prümper et al. 1992, Brodbeck et al. 1993). These authors claim to have integrated Norman’s,
Reason’s and Rasmussen’s three-level model into a single taxonomy based on action theory, adding a
6
fourth performance level, the ‘knowledge base for regulation’ (Zapf et al. 1992). In the first and last
of these three studies they have demonstrated inter-rater reliability for their error categories; between
them they have also confirmed hypotheses based on error-handling time, error frequencies and use of
external support, for novice and expert computer users. Another example of a validated classification
scheme is that claimed by Baber and Stanton (1996) for the MFM, in the comparison of two analytic
methods (PHEA and TAFEI) discussed in Section 1.1.
It is the author’s view that the latter results demonstrate that an explanatory classification scheme
can be validated, provided it is sufficiently descriptive of the range of observed behaviour which it
seeks to record. It is notable that explanation was not sought from users in the Zapf et al. studies, even
though observers sat next to or behind subjects; nor were attempts made to confirm the ‘goals the
subjects were trying to achieve’ (Zapf et al. 92 p323). And, in spite of controlling for the order of
performance of the two methods compared, the Baber and Stanton (1996) results appear to be based on
analyses carried out after the original observations and interviews. In spite of the descriptive power of
such taxonomies, the level of description appears to remain with the observers.
But the very same criticism can be levelled at the current study, which also makes use of an
explanatory classification scheme (a set of nine categories derived from the observed errors).
However, attempt will be made to relate the categories used to Reason’s and Norman’s models, in
order to test the ability of these models to account for the full range of observed errors. The validity of
this approach will be explored in the Discussion. 1.3. Other Error Analysis Studies
Other studies employing error analysis include Sutcliffe and Springett (1992), Wright et al. (1993),
and Salminen and Tallberg (1996). Sutcliffe and Springett used verbal protocols to categorise errors
during use of a graphics package into six (validated) types based on Norman’s (1986) theory of action
and a ‘model mismatch analysis’ derived from Kieras and Polson’s (1985) cognitive complexity
theory. Wright et al. used Reason’s (1987b) GEMS model to classify errors made on a similar
graphics package into skill-, rule- and knowledge-based. Finally, Salminen and Tallberg classified
fatal and serious occupational accidents according to Rasmussen’s original (1982, 1986) three-level
model, showing that the classification, derived from nuclear plant operation, worked well for less
complex circumstances. Considerable support exists, then, for the three-level model and for error
analysis in general; it remains to be seen whether it was borne out in the current study.
2. The Three machines
The ticket vending machines studied are the two London Underground Limited (LUL) machines,
namely the Few Fare Machine (FFM) and the Multi Fare Machine (MFM), and the overground
(originally Network South East) machine, the QuickFare (QF). See Figures 1 to 4. The machines were
first installed between 1987 and 1990. By 1996 the LUL machines had been installed in all central
7
zone underground stations and some zone 2 stations. Prior to 1996 the QF had been installed in all
Network South East stations.
Illustrations and ticket prices shown are based on the first phase (1990-91) of observations; only
substantive changes evident by the second phase (1996) are included. Attention is directed to the
differences between the user steps (labelled 1, 2 etc.) required by each machine. 2.1. The Underground Machines (FFM and MFM)
All LUL stations (except those run by overground train operators) have at least one of each type of
machine. Typically there are two FFMs to one MFM.
Figure 1 shows the smaller FFM as it appeared in 1991. (No substantive changes, other than new
“How to get assistance” and “Return tickets” labelling, had been made to this machine by 1996). The
FFM enables passengers who already know the price and type of their ticket to select from a small
range of ten prices (often including Travel Cards) typical of the station in question. No ticket type
selection is necessary. The FFM accepts only coins.
Figures 2 and 3 show the larger MFM as it appeared in 1991 and 1996 respectively. By 1996
improvements had been made to the “How to use” and “How to get assistance” labelling, plus the
addition of a “Late travel” label. The number of ticket type buttons had by then increased from six to
eight, and a new note tray, accepting notes of denominations up to £20, had been added. The most
salient change, however, had been the removal of the step number panels (with the numbered arrows)
in Figure 2, to be replaced by the large ‘Single Zone Ticket Extension’ panel (with instructions on
using that new button) shown in Figure 3.
The MFM offers the complete range of ticket types and destinations which are available from the
station in question. The former include Travel Cards and return tickets; the latter include all
underground and Docklands Light Railway (DLR) stations (by zone), Travel Card zones and a small
range of overground (formerly Network South East) stations. Figure 1. Few Fare Machine (FFM).
Details as of March 1996 (Highbury & Islington). Approximately to scale. Colours of text and button labels shown as (text on background). Substantive changes from 1991 shown in italics.
Figure 2. Multi Fare Machine (MFM) in 1991.
Details as of April ‘91 (Highbury & Islington, Arnos Grove). Not to scale. Colours of text and button labels shown as (text on background).
Figure 3. Multi Fare Machine (MFM) in 1996.
Details as of March ‘96 (Highbury & Islington). Not to scale. Colours of text and button labels shown as (text on background). Substantive changes from 1991 shown in italics.
There is an important difference between the FFM and the MFM, other than the ranges of prices
and destinations. On the FFM, the order of steps 1 and 2, namely Select price and Insert money, is
not enforced. On the MFM, however, not only is the order of steps 1 to 3, namely Select ticket type,
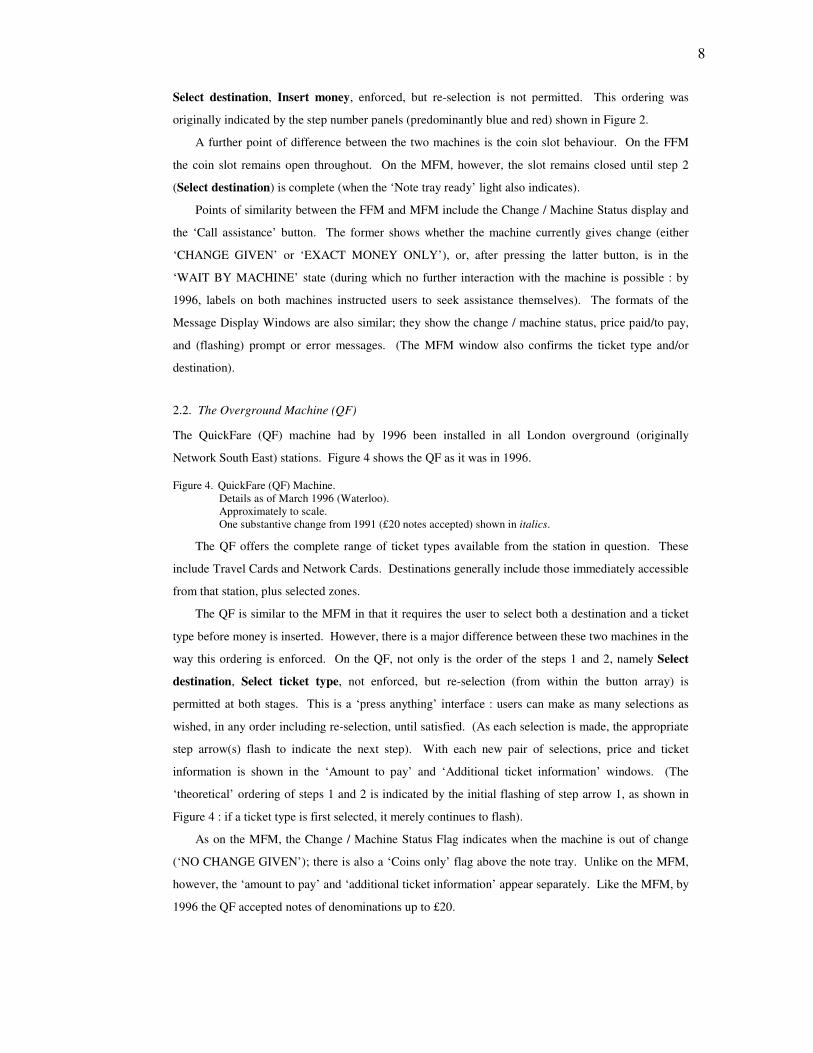
8
Select destination, Insert money, enforced, but re-selection is not permitted. This ordering was
originally indicated by the step number panels (predominantly blue and red) shown in Figure 2.
A further point of difference between the two machines is the coin slot behaviour. On the FFM
the coin slot remains open throughout. On the MFM, however, the slot remains closed until step 2
(Select destination) is complete (when the ‘Note tray ready’ light also indicates).
Points of similarity between the FFM and MFM include the Change / Machine Status display and
the ‘Call assistance’ button. The former shows whether the machine currently gives change (either
‘CHANGE GIVEN’ or ‘EXACT MONEY ONLY’), or, after pressing the latter button, is in the
‘WAIT BY MACHINE’ state (during which no further interaction with the machine is possible : by
1996, labels on both machines instructed users to seek assistance themselves). The formats of the
Message Display Windows are also similar; they show the change / machine status, price paid/to pay,
and (flashing) prompt or error messages. (The MFM window also confirms the ticket type and/or
destination). 2.2. The Overground Machine (QF)
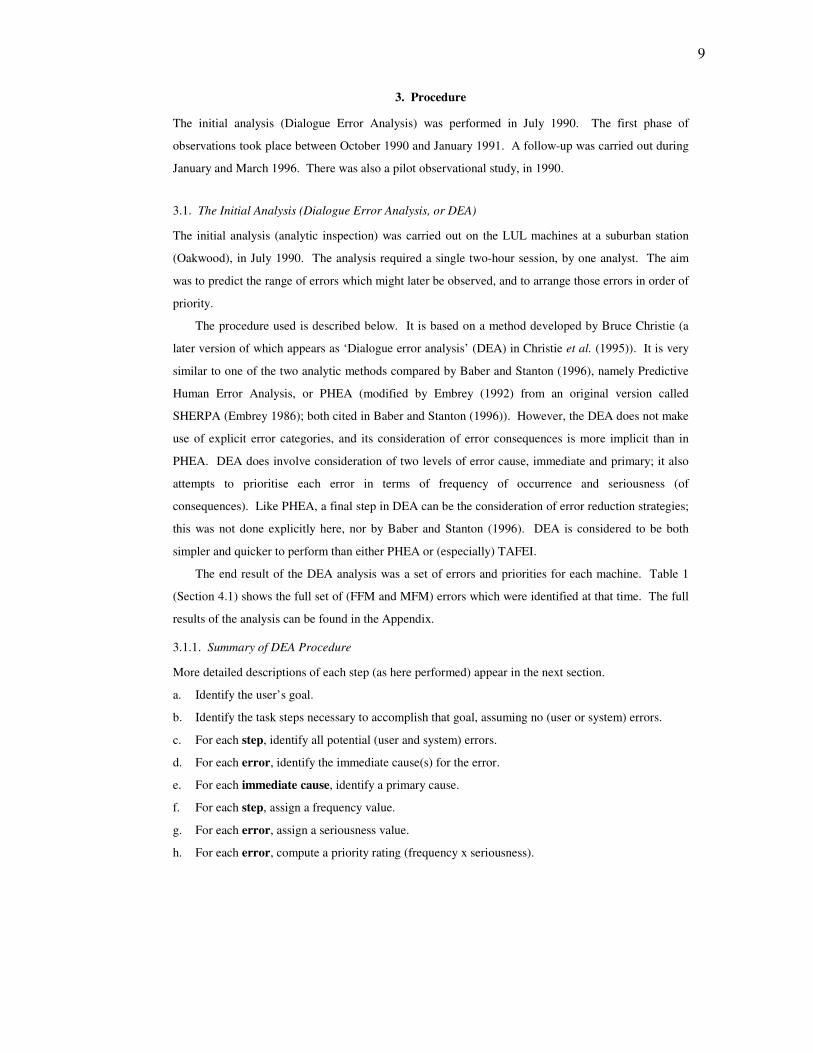
The QuickFare (QF) machine had by 1996 been installed in all London overground (originally
Network South East) stations. Figure 4 shows the QF as it was in 1996. Figure 4. QuickFare (QF) Machine.
Details as of March 1996 (Waterloo). Approximately to scale. One substantive change from 1991 (£20 notes accepted) shown in italics.
The QF offers the complete range of ticket types available from the station in question. These
include Travel Cards and Network Cards. Destinations generally include those immediately accessible
from that station, plus selected zones.
The QF is similar to the MFM in that it requires the user to select both a destination and a ticket
type before money is inserted. However, there is a major difference between these two machines in the
way this ordering is enforced. On the QF, not only is the order of the steps 1 and 2, namely Select
destination, Select ticket type, not enforced, but re-selection (from within the button array) is
permitted at both stages. This is a ‘press anything’ interface : users can make as many selections as
wished, in any order including re-selection, until satisfied. (As each selection is made, the appropriate
step arrow(s) flash to indicate the next step). With each new pair of selections, price and ticket
information is shown in the ‘Amount to pay’ and ‘Additional ticket information’ windows. (The
‘theoretical’ ordering of steps 1 and 2 is indicated by the initial flashing of step arrow 1, as shown in
Figure 4 : if a ticket type is first selected, it merely continues to flash).
As on the MFM, the Change / Machine Status Flag indicates when the machine is out of change
(‘NO CHANGE GIVEN’); there is also a ‘Coins only’ flag above the note tray. Unlike on the MFM,
however, the ‘amount to pay’ and ‘additional ticket information’ appear separately. Like the MFM, by
1996 the QF accepted notes of denominations up to £20.
9
3. Procedure
The initial analysis (Dialogue Error Analysis) was performed in July 1990. The first phase of
observations took place between October 1990 and January 1991. A follow-up was carried out during
January and March 1996. There was also a pilot observational study, in 1990. 3.1. The Initial Analysis (Dialogue Error Analysis, or DEA)
The initial analysis (analytic inspection) was carried out on the LUL machines at a suburban station
(Oakwood), in July 1990. The analysis required a single two-hour session, by one analyst. The aim
was to predict the range of errors which might later be observed, and to arrange those errors in order of
priority.
The procedure used is described below. It is based on a method developed by Bruce Christie (a
later version of which appears as ‘Dialogue error analysis’ (DEA) in Christie et al. (1995)). It is very
similar to one of the two analytic methods compared by Baber and Stanton (1996), namely Predictive
Human Error Analysis, or PHEA (modified by Embrey (1992) from an original version called
SHERPA (Embrey 1986); both cited in Baber and Stanton (1996)). However, the DEA does not make
use of explicit error categories, and its consideration of error consequences is more implicit than in
PHEA. DEA does involve consideration of two levels of error cause, immediate and primary; it also
attempts to prioritise each error in terms of frequency of occurrence and seriousness (of
consequences). Like PHEA, a final step in DEA can be the consideration of error reduction strategies;
this was not done explicitly here, nor by Baber and Stanton (1996). DEA is considered to be both
simpler and quicker to perform than either PHEA or (especially) TAFEI.
The end result of the DEA analysis was a set of errors and priorities for each machine. Table 1
(Section 4.1) shows the full set of (FFM and MFM) errors which were identified at that time. The full
results of the analysis can be found in the Appendix. 3.1.1. Summary of DEA Procedure
More detailed descriptions of each step (as here performed) appear in the next section.
a. Identify the user’s goal.
b. Identify the task steps necessary to accomplish that goal, assuming no (user or system) errors.
c. For each step, identify all potential (user and system) errors.
d. For each error, identify the immediate cause(s) for the error.
e. For each immediate cause, identify a primary cause.
f. For each step, assign a frequency value.
g. For each error, assign a seriousness value.
h. For each error, compute a priority rating (frequency x seriousness).

10
3.1.2. Description of Procedure
The procedure used for each machine (FFM and MFM) follows below.
a. Identify the user’s goal.
Firstly, the user goal which the machine would support, and hence a task leading to the
accomplishment of that goal, was identified.
For both machines, the attributed goal was the purchase of the required ticket from the machine.
(The assumptions underlying this attribution will explored in the Discussion).
b. Identify the task steps necessary to accomplish that goal, assuming no (user or system) errors.
Figures 1 to 4 show the task steps which were identified for each machine. Part b of the Appendix
shows how these were derived.
c. For each step, identify all potential (user and system) errors.
Prediction was made of all the potential errors, both user and system, which were likely to occur
at each step. ‘Likely’ errors were those which might occur under usual operating conditions.
‘Usual’ conditions could include machine not giving change, machine temporarily out of service,
etc. At this stage no explicit use was made of error taxonomies or classification schemes, the aim
being to identify as many likely errors as possible (the categories to which the errors were later
assigned are described in Section 3.4).
Table 1 shows the full set of FFM and MFM errors which were predicted at this time. Part c of
the Appendix shows the steps with which each error was associated. Note that in many cases the
same error was associated with both machines.
d. For each error, identify the immediate cause(s) for the error.
Immediate causes were those which could be directly associated with the error, without looking
too far at the machine interface (or other) features responsible. (In Rasmussen’s (1982, 1987)
terms, the causal ‘stopping point’ was at this stage located mainly in the user’s actions).
Part d of the Appendix shows how all immediate causes were assigned. For example, the MFM
error ‘Destination/zones button selected for type button’ (labelled E7 here and in Table 1) was
associated with the immediate causes ‘User (a) does not know the first step or (b) cannot find
ticket type button’.

11
e. For each immediate cause, identify a primary cause.
Primary causes were mainly those sufficient to explain the error at the level of the interface,
though some might have to remain with the user. (In Rasmussen’s (1982, 1987) terms, the causal
‘stopping point’ was now located mainly in the interface, rather than the user).
Part e of the Appendix shows all the assigned primary causes. For example, the immediate causes
I6(a,b), ‘User (a) does not know the first step or (b) cannot find ticket type button’, were
associated with the respective primary causes P6(a,b), namely (a) ‘Insufficient indication of what
first step is’ and (b) ‘Location of ticket type button insufficiently clear’.
f. For each step, assign a frequency value.
Frequency values for each step ranged from 1 (infrequent) to 4 (always necessary). This was
based on the number of times that step would occur in error-free operation.
In both cases (FFM and MFM), every step was deemed necessary to the task, so frequency values
were taken to be the same.
g. For each error, assign a seriousness value.
Seriousness values assigned to each error ranged from 1 (trivial or easily retrievable) to 4 (serious
or irretrievable). These were based on the consequences for the user of the error in question,
bearing in mind the amount of work which the user would have to do to redress the error.
Part g of the Appendix shows all the assigned seriousness values. For example, FFM error E3,
‘Wrong coin(s) used’, was assigned a seriousness value of 1, while FFM and MFM error E4,
‘More than price inserted when no change given’, was assigned value 4.
h. For each error, compute a priority rating (frequency x seriousness).
A priority rating for each error was computed from the product of the frequency and seriousness
values, hence ranging from 1 (very low) to 16 (very high). A trivial error with a high frequency
might thus be given a relatively low priority, while a serious error with a low frequency might be
given lower priority than one which occurred more often.
Part h of the Appendix shows the computed (and ranked) priority values for each machine. Here,
since frequency values were deemed to be the same for all steps, priority values could be based on
seriousness values alone. 3.2. Pilot Study
The pilot observational study took place on the LUL machines, at Arnos Grove station, during July and
August 1990. During the pilot the list of errors derived from the initial analysis was expanded into the

12
full error set used in the observational sessions. At this stage it was decided to include the overground
machine, the QF, in the observations.
The original intention was to combine experimenter observations with interviews and/or video
analysis, that is, to back up inspection data with users’ own contributions and to allow subsequent data
analysis. Video and interviews were both attempted in the pilot, but with disappointing results. Video
turned out to be impractical given station geography and the fact that the LUL machines are set into
walls (their front panels thus being obscured by users). Interviews (following both successful and
failed attempts) were found to generate versions of events which were at variance with what had just
been observed. In the event, the method used - inspection followed by observation - will be claimed to
have enabled successful categorisation of the observed errors, and most of those errors will be shown
to have been predicted in the initial analysis. This issue will be taken up in the Discussion. 3.3. Empirical Observations
Each observation session was in two parts : firstly, overall observations of machine and ticket window
use, plus successes and failures; secondly, detailed observations of the errors occurring on each
machine. (It was found to be impossible to record individual errors and overall machine use
simultaneously).
All observations took place at the same set of stations. The underground stations were Arnos
Grove (zone 5) and Highbury & Islington (zone 2). The overground station was Waterloo. In 1990-91
Arnos Grove had a single pair of (FFM and MFM) machines, while Highbury & Islington had two
FFMs and one MFM; by 1996 Arnos Grove had two FFMs and one MFM, while Highbury & Islington
had two of each type. In 1990-91 Waterloo had four QF machines; by 1996 it had eight.
All underground sessions were during off-peak times; overground sessions included both off-peak
and peak times. Ticket windows remained open throughout all sessions.
Subjects were passengers using the ticket machines at the stations in question. All observations
were carried out in the same way, by a single observer, from behind, and at sufficient distance from the
machines to avoid interaction with users. 3.3.1. Overall observations
In the first part of each session the following were recorded.
a. For all three machines (FFM, MFM and QF) : the number of users who succeeded in getting a
ticket or tickets out of the machine in question, both with and without errors, plus the number who
failed to do so.
b. For the LUL machines (FFM and MFM) only : the number of users who used a ticket window,
including those who had failed to get a ticket from a machine.
Note : Where attempts were made on more than one machine by the same user, each was recorded
separately. Where additional or separate tickets were bought by a single user, each attempt was
13
recorded separately. For the QF, the geography and scale of the Waterloo concourse meant that the
number of ‘sole’ ticket window users could not be observed, so only successes and failures on that
machine were recorded. For the same reason, not all QF machine attempts could be observed,
particularly during the second, 1996, phase (by when there were eight machines). 3.3.2. Error Observations
In the second part of each session attention was directed at only those attempts which involved errors,
whether successfully or not. Those whose attempts did not involve errors - the error-free successes -
were discarded. This strategy - of focusing on errors rather than successes - will be commented on in
the Discussion.
The aim here was to investigate the pattern of error-making on all three machines, including both
failures and successes. Where there was a failure, one error - the last or only - was deemed to be
responsible : this was called the critical (or fatal) error. Where there was a success which involved one
or more errors, all such errors were deemed to be non-critical. Thus exactly the same set of errors on a
particular machine might be associated with failure in one case but success in another.
On each machine sufficient user attempts were observed to account for a representative sample of
the range of errors which occurred. Any single error could occur alone, in multiples, or in combination
with other errors.
For each attempt involving error, the following were recorded :
a. The errors themselves. Errors could be either user-related or system-related. Occurrences were
logged against all known errors on all three machines, care being taken to note any which were
novel (Other) or whose causes could not be attributed at that time (Unknown). Errors were not at
that stage categorized or coded. b. Whether each error was critical or non-critical. c. The numbers of each error, if occurring more than once. d. For the second (1996) phase, the number of cycles through the machine’s step sequence which
were made. (Every cancelled and restarted attempt involved an additional cycle). e. The sex and apparent age (in one of eight intervals) of each user.
Note : It was not possible to record simultaneous attempts at more than one machine, so that (at
Waterloo in particular) not all error-making attempts were recorded. Where error-making attempts
were made on more than one machine by the same user, each was recorded separately. Where
additional or separate purchases were made by a single user, each error-making attempt was recorded
separately. 3.4. Error Categories
All observed errors were later assigned to one of the following nine categories (coded for analysis).
The pattern of error-making which thus emerged enabled assessment to be made of the overall
14
contribution of each error to the success and failure rates established above. Each category placement
represents the best attempt at an explanation for that error (in Rasmussen’s (1982, 1987) terms, the
causal ‘stopping point’) in terms of what is known about the machine in question. (Table 7, Section
4.3.2, shows the full set of observed MFM errors).
Timeout (T) : This occurred when a user failed to respond to within the time limit for a machine
to detect continuous user input. Forced return was made to rest state, requiring a restart. Examples
included failure to insert money in time, and not pressing a button (of the appropriate type) in time.
Change availability (C) : Either the user had no (or insufficient) change of the correct type for
that machine, or attempt had been made to insert money of the wrong type. If the right type and
quantity could not be found in time (or Cancel pressed), the user would be timed out.
Money returned (R) (‘More than ticket price inserted when no change is given’) : This occurred
when money had been inserted to more than the ticket price required. The consequence on all three
machines was that all money was returned, regardless of the margin between price and total inserted.
Step order wrong (OR) : These occurred when user actions were not in the order prescribed for
that machine. Typically they occurred at step 1 on both the MFM (‘Destination/zones button pressed
instead of ticket type’) and the QF (‘Ticket type button pressed instead of destination/zones button’);
attempts to insert money at the start were order errors on both the MFM and QF. The consequences
depended on the machine type : on the MFM the only solution was to press Cancel and start again, but
on the QF selection is accepted, this being a non-enforced error. (On the QF selection order is
theoretically enforced by the flashing step arrows. Such errors were still recorded, though their status
as an error is debatable).
Selection wrong (S) : This represents the variety of incorrect (but in the right order) selections
that could be made on the three machines. The consequences again depended on the machine : on the
MFM the only solution was to Cancel and start again, while on the QF the user could merely re-select
and continue. Examples : underground destination button on the MFM; ticket type button on the QF.
Mechanical (M) : This included the various mechanical faults which are familiar with vending
machines. The consequences were generally failure to get a ticket (at least). Examples : refusal of
money, particularly notes of the correct type (MFM, QF); coin slot jammed shut (MFM or QF).
Availability (A) : This meant that the required ticket type, destination/zone or price was not
currently available on that machine. Examples : FFM price button range; QF destination/zone buttons.
Other (OT) : This covers miscellaneous errors which were not deemed worthy of a category of
their own. Examples : “Call assistance” pressed for “Cancel” (FFM and MFM); machine not cancelled
from previous user (all machines). On the MFM, it also includes a wholly unexpected piece of user

15
behaviour (‘Used as price-finding machine when change given’) : users were seen to desert the MFM
for the FFM, having found the price of their ticket, even when the MFM was giving change.
Unknown (U) : This covers those cases where users were seen to give up on a machine (and go
straight to a ticket window), having made no other attributable error. Most examples occurred on the
MFM and QF : since the range of ticket type and price combinations which these machines offer is
large and complex, it is thought likely (but nevertheless recorded as Unknown) that users were
comparing prices before purchase.
The issue of unexpected or discrepant behaviour, such as price-finding and price-comparison, will
be taken up in the Discussion.
4. Results 4.1. Initial Analysis (Dialogue Error Analysis)
Table 1 shows the final result (step h) of the initial Dialogue Error Analysis on the LUL machines.
The results of the complete analysis can be found in the Appendix. Table 1. Result (step h) of the initial analysis on the LUL machines.
The detected errors (E1 to E11) have been prioritised. Priorities are based on assigned frequencies and seriousness ratings, where priority = frequency x seriousness. (Since here all steps were deemed to be essential, priority could be based on seriousness values alone).
It can be seen that at this stage a total of 11 errors were predicted, some being common to both
machines. (E1, E5 and E9 referred to the three varieties of ‘timeout’ error identified : see Appendix,
part c). Priority ratings (as computed in Section 3.1.2) show that the highest priority was assigned to
money rejection problems (including E4, ‘More than price inserted when no change given’), the lowest
to attempts to insert the wrong coins/notes for that machine (E3). Comparison will later be made
between these initial priority ratings and those derived from the empirical data. 4.2. Overall Observations
Tables 2 and 3 show the results of the overall observations (of ticket window use, machine attempts
and success/failures) for all three machines, in phases 1 (1990-91) and 2 (1996) respectively. Table 4
shows the failure rates on all three machines in both phases. Table 2. Phase 1 (1990-91).
Overall observations : ticket window use, machine attempts and failure rates. "Failure" means failure to get a ticket, for whatever reason (one of the errors - the last or only - being critical). "Success" means succeeding in getting a ticket out of a machine, both with and without errors (any errors made being non-critical) M/Cs = machines.

16
Table 3. Phase 2 (1996). Overall observations : ticket window use, machine attempts and failure rates. "Failure" means failure to get a ticket, for whatever reason (one of the errors - the last or only - being critical). "Success" means succeeding in getting a ticket out of a machine, both with and without errors (any errors made being non-critical) M/Cs = machines.
Table 4. Phases 1 (1990-91) and 2 (1996).
Overall failure rates (% failures : attempts). "Failure" means failure to get a ticket, for whatever reason (one of the errors - the last or only - being critical). M/Cs = machines.
Comparison of the first two tables shows two significant differences in overall performance
between the two phases.
Firstly, the ratio of the total number of LUL machine attempts to ticket window attempts was
significantly higher in phase 2 than in phase 1 (X2=23.0, p<0.001). (On the QF machines, no data are
available for ticket window attempts).
Secondly, there was a significant drop in the MFM failure rate (the percentage of failures to
attempts), relative to the both the other two machines, between the two phases. In phase 1, there were
significantly more failures on the MFM than on both the FFM (X2=22.14, p<0.001) and the QF
(X2=6.14, p<0.02), while in phase 2 neither comparison yielded significant results (MFM/FFM:
X2=3.77; MFM/QF: X2=0.37). We may conclude from these results that
a. At the two LUL stations and at the times involved, in 1990-91 there were no more attempts made
on the ticket machines than there was use made of the ticket window (a choice always being
available); but in 1996 there were significantly more machine attempts than ticket window use.
b. In 1990-91 the failure rate on the MFM (28.2%) was significantly worse than that for both the
FFM (1.2%) and the QF (15.3%); but in 1996 the MFM failure rate (14.6%) was not significantly
worse than those for either the FFM (4.1%) or the QF (18.4%). 4.3. Error Observations
4.3.1. Between-subject Comparisons
Tables 5 and 6 show the numbers of attempts involving errors, the number of errors made (plus the
number per attempt) and the number of attempts involving more than one error, for all three machines,
in phases 1 (1990-91) and 2 (1996) respectively. Table 6 also includes the number of 1996 attempts
involving restarts.
(Recorded data also included user age and sex. No significant between-subject effects were found
for phase 1; demographic data for phase 2 were not analysed). Table 5. Phase 1 (1990-91).
Error observations : number of attempts involving errors, number of errors, attempts involving more than one error. NB : No data is presented for attempts without errors.
17
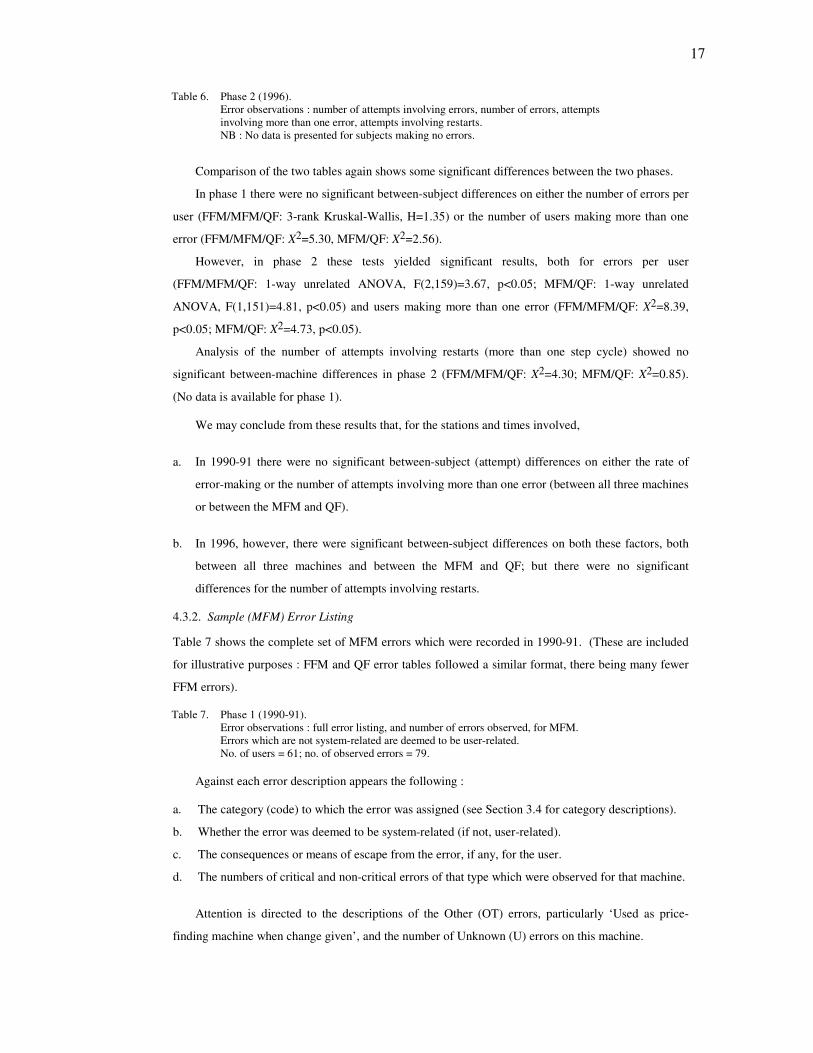
Table 6. Phase 2 (1996). Error observations : number of attempts involving errors, number of errors, attempts involving more than one error, attempts involving restarts. NB : No data is presented for subjects making no errors.
Comparison of the two tables again shows some significant differences between the two phases.
In phase 1 there were no significant between-subject differences on either the number of errors per
user (FFM/MFM/QF: 3-rank Kruskal-Wallis, H=1.35) or the number of users making more than one
error (FFM/MFM/QF: X2=5.30, MFM/QF: X2=2.56).
However, in phase 2 these tests yielded significant results, both for errors per user
(FFM/MFM/QF: 1-way unrelated ANOVA, F(2,159)=3.67, p<0.05; MFM/QF: 1-way unrelated
ANOVA, F(1,151)=4.81, p<0.05) and users making more than one error (FFM/MFM/QF: X2=8.39,
p<0.05; MFM/QF: X2=4.73, p<0.05).
Analysis of the number of attempts involving restarts (more than one step cycle) showed no
significant between-machine differences in phase 2 (FFM/MFM/QF: X2=4.30; MFM/QF: X2=0.85).
(No data is available for phase 1). We may conclude from these results that, for the stations and times involved,
a. In 1990-91 there were no significant between-subject (attempt) differences on either the rate of
error-making or the number of attempts involving more than one error (between all three machines
or between the MFM and QF).
b. In 1996, however, there were significant between-subject differences on both these factors, both
between all three machines and between the MFM and QF; but there were no significant
differences for the number of attempts involving restarts. 4.3.2. Sample (MFM) Error Listing
Table 7 shows the complete set of MFM errors which were recorded in 1990-91. (These are included
for illustrative purposes : FFM and QF error tables followed a similar format, there being many fewer
FFM errors). Table 7. Phase 1 (1990-91).
Error observations : full error listing, and number of errors observed, for MFM. Errors which are not system-related are deemed to be user-related. No. of users = 61; no. of observed errors = 79.
Against each error description appears the following : a. The category (code) to which the error was assigned (see Section 3.4 for category descriptions).
b. Whether the error was deemed to be system-related (if not, user-related).
c. The consequences or means of escape from the error, if any, for the user.
d. The numbers of critical and non-critical errors of that type which were observed for that machine.
Attention is directed to the descriptions of the Other (OT) errors, particularly ‘Used as price-
finding machine when change given’, and the number of Unknown (U) errors on this machine.

18
The total numbers of errors of each type appear in the following between-machine comparison. 4.3.3. Error Totals by Category
Tables 8 and 9 show the complete numbers of observed errors on each of the three machines, including
critical and non-critical errors, assigned to the nine categories described in Section 3.4, in phases 1
(1990-1) and 2 (1996) respectively. Table 8. Phase 1 (1990-91).
Error observations : numbers of observed errors (critical and non-critical) in nine error categories. Items marked * are system-related errors. ** QF step order errors are not enforced.
Table 9. Phase 2 (1996).
Error observations : numbers of observed errors (critical and non-critical) in nine error categories. Items marked * are system-related errors. ** QF step order errors are not enforced.
Comparison of the two tables shows that the major sources of MFM and QF errors were similar,
with some between-phase differences on both machines; FFM errors remained much the same between
phases.
FFM : Of the very few FFM errors observed, there were more mechanical errors than any other
single type. This was the case in both phases, but more of the phase 2 errors were critical.
MFM : In phase 1 the largest sources of MFM error were step order (24%) and change availability
(17%) problems, the latter being mainly critical; there were also high proportions of selection (15%)
and timeout (15%) errors, these being mainly non-critical. In phase 2, however, the largest sources of
error were selection (25%) and Other (18%) problems, the latter being mainly critical; there were also
high proportions of (non-critical) step order errors (16%), plus mechanical (16%) and money returned
(15%) problems; change availability problems had by then dropped to 7%.
QF : In phase 1 the largest sources of QF error were selection (24%) and step order (20%)
problems, both mainly non-critical; there were also high proportions of mechanical problems (15%)
and critical Unknown errors (12%). In phase 2, however, the largest sources of error were step order
(25%) and mechanical (22%) problems, the former being non-critical; there were also a high
proportion of (mainly non-critical) selection errors (19%), while Unknown errors had dropped to 3%. From these results we may conclude that, for the stations and times involved,
a. There were no measurable differences between FFM error patterns between 1990-91 and 1996,
the largest single source of error being mechanical problems.
b. Step order and selection problems continued to account for a large proportion of MFM errors in
1996, but mechanical and money returned problems (the latter being mainly critical) increased.
There were also an increased number of Other errors. The earlier change availability problem,
however, had diminished.
19
c. Step order, selection and mechanical problems continued on the QF in 1996, mechanical problems
showing the largest increase. The largest single source of critical errors in 1990-91, those
Unknown, could by 1996 be attributed (or had declined).
The issue of the numbers of Other and Unknown errors will be explored in the Discussion. 4.3.4. Predicted Versus Observed Errors
Table 10 shows, for the LUL machines only (the QF was not included in the initial analysis), the same
set of observed errors for phase 1 as appeared in Table 8, but this time including the observed
frequency, seriousness and priority ratings. (Data for phase 2 are not presented because of the six-year
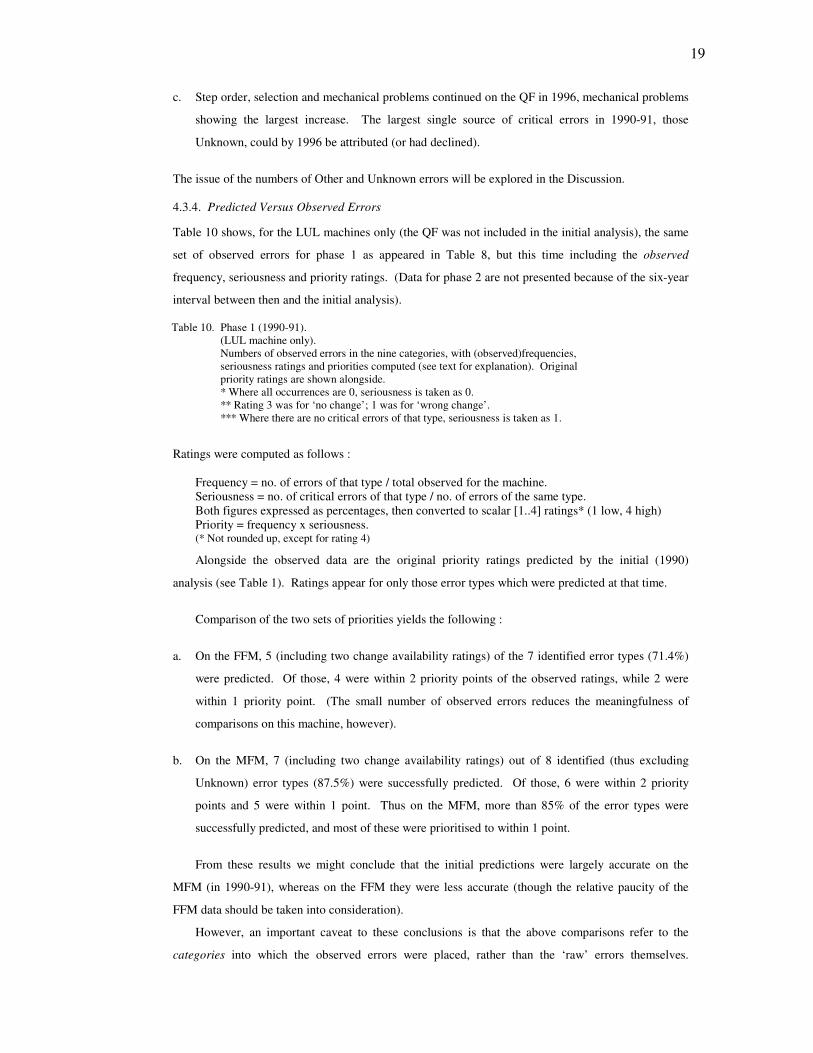
interval between then and the initial analysis). Table 10. Phase 1 (1990-91).
(LUL machine only). Numbers of observed errors in the nine categories, with (observed)frequencies, seriousness ratings and priorities computed (see text for explanation). Original priority ratings are shown alongside. * Where all occurrences are 0, seriousness is taken as 0. ** Rating 3 was for ‘no change’; 1 was for ‘wrong change’. *** Where there are no critical errors of that type, seriousness is taken as 1.
Ratings were computed as follows :
Frequency = no. of errors of that type / total observed for the machine. Seriousness = no. of critical errors of that type / no. of errors of the same type. Both figures expressed as percentages, then converted to scalar [1..4] ratings* (1 low, 4 high) Priority = frequency x seriousness. (* Not rounded up, except for rating 4)
Alongside the observed data are the original priority ratings predicted by the initial (1990)
analysis (see Table 1). Ratings appear for only those error types which were predicted at that time.
Comparison of the two sets of priorities yields the following :
a. On the FFM, 5 (including two change availability ratings) of the 7 identified error types (71.4%)
were predicted. Of those, 4 were within 2 priority points of the observed ratings, while 2 were
within 1 priority point. (The small number of observed errors reduces the meaningfulness of
comparisons on this machine, however).
b. On the MFM, 7 (including two change availability ratings) out of 8 identified (thus excluding
Unknown) error types (87.5%) were successfully predicted. Of those, 6 were within 2 priority
points and 5 were within 1 point. Thus on the MFM, more than 85% of the error types were
successfully predicted, and most of these were prioritised to within 1 point.
From these results we might conclude that the initial predictions were largely accurate on the
MFM (in 1990-91), whereas on the FFM they were less accurate (though the relative paucity of the
FFM data should be taken into consideration).
However, an important caveat to these conclusions is that the above comparisons refer to the
categories into which the observed errors were placed, rather than the ‘raw’ errors themselves.
20
Comparing the initial error predictions (see Appendix, part c) with the full error listings for the FFM
(not included) and the MFM (Table 7), we find that only 6 out of 12 FFM errors and 10 out of 18
(55%) MFM errors were predicted in the initial analysis. On this consideration, only just over half of
the actual observed errors, as opposed to error types, can be claimed to have been predicted by the
initial analysis.
On these figures, then, the concurrent validity of the Dialogue Error Analysis method was assessed
at a minimum of 50% (for the actual errors) and a maximum of 85% (for the error types).
5. Summary of Findings
The above results allow us to draw some conclusions concerning changes in the patterns of use and
error-making on the three machines, for the stations and times involved, between 1990-91 and 1996.
a. On the LUL machines at least, and given a choice, there was a significant increase in willingness
to use the ticket machines rather than the ticket window.
b. Failure rates on the MFM had improved by 1996 (from 28.7% in 1990-91 to 14.6% in 1996),
while those on both the FFM and the QF had worsened (from 1.2% to 4.1% and from 15.3% to
18.4%, respectively). On a criterion of less than 5% failure, FFM performance would thus still be
acceptable while that of both the MFM and QF would remain unacceptable.
c. Whereas in 1990-91 the differences between failure rates could not be accounted for in terms of
between-user (between-attempt) differences, by 1996 there were a significantly higher number of
errors per user, and users making more than one error, on the QF than on (in particular) the MFM.
d. Mechanical problems accounted for most of the (very few) FFM errors, there being no measurable
changes between the two phases. Both step order and selection problems continued to account for
most MFM and QF errors. (Both the Baber and Stanton (1996) and Verhoef (1988) studies
emphasised step order problems). However, mechanical problems increased on these two
machines, as did the number of ‘money returned’ errors on the MFM. The earlier change
availability problems on the MFM had declined, as had the number of unattributable errors on the
QF.
e. The originally predicted pattern of errors on the LUL machines appeared to match with the errors
observed during 1990-91, at least on the MFM. While only half of the actual observed problems
were predicted, and some high priority errors remained to be identified, the pattern of predicted
error types and priorities matched well (on the MFM, to more than 85%) with that later observed.
Overall, then, the pattern of observed errors was sufficient to account for the different failure rates
between the three machines. These were mainly to do with the enforced step order of the MFM, the
(unenforced but still complied with) ordering on the QF, and the wide range of possible MFM and QF
21
selections. For the LUL machines at least, this turned out to be largely as predicted in the initial
analysis : on a criterion for problem prediction of 50%, this analytic inspection method appears to be
acceptable; on one for error type prediction of 80%, the method appears to have succeeded.
It was also possible to identify changes in patterns of use and error-making between the two
phases. These mainly concerned the increased LUL machine use and the relative improvement in
MFM performance while that of the QF declined. The latter can be related to a general increase in the
rate and numbers of QF errors, some of which whose cause could still not be attributed.
The improvements in MFM use over the five to six years, while still failing a 5% criterion, might
be attributed to the addition of a “How to use” label such as shown in Figure 3 (plus the removal of the
original step number panels), and a general practice effect. (Only labelling and other ‘cosmetic’
improvements had been made to the MFM by 1996). The relative decline in FFM and QF
performance cannot be attributed to substantive changes in the machines themselves (there have been
none). It is believed that practice and familiarity had by then led users to expect more from these
machines than was being delivered, in terms of the full range of ticket types and price deals. This view
is supported by the relatively high number of critical change availability problems on the QF compared
with the MFM (for both phases); FFM data, however, remain inconclusive.
6. Discussion
It was possible, then, to confirm the results of a brief initial analysis of the LUL machines with
empirical observations. It is claimed that, for systems with relatively few interaction sequences, an
initial analytic method such as the one here described (Dialogue Error Analysis, or DEA) is sufficient
to account for most of the problems that will arise. Such systems include walk-up-and-use installations
like vending machines and ATMs, and, for these systems, the DEA method is recommended as a
relatively quick and inexpensive form of usability evaluation. It is not recommended for larger and
more complex systems, where the number and proliferation of possible interaction sequences makes
such a detailed analytical approach likely to be lengthy and cumbersome. The similarity to the
techniques employed by other methods such as PHEA (Baber and Stanton 1996) implies that the latter
is also true of these methods, as well as for more elaborate procedures such as TAFEI. (Techniques
borrowed from Human Reliability Analysis (HRA) or Probabilistic Risk Assessment (PRA) -
assessment of the probabilities and effects of human error at each stage of system function, based on a
task analysis or ‘event tree’ (Reason 1990, Kirwan 1995) - might be appropriate for larger systems).
As such, then, the DEA might constitute one component of a ‘discount usability engineering’ approach
(Nielsen 1989, 1990, 1993), which, it is claimed, will deliver most of the benefits of more ‘advanced’
or ‘perfect’ methods, but at a considerably reduced cost.
It was also possible to account for the overall between-machine differences in terms of the pattern
of observed errors on each machine. The observation method enabled a rich picture to emerge of the
type and quantities of errors, both user-related and system-related, which such relatively simple
systems might embody. In particular, the distinction between critical and non-critical errors enabled

22
task failures to be associated with particular combinations of errors. Such conclusions would enable
specific recommendations to be made for re-design (of the MFM in particular), and for any new
ticketing systems.
However, it remains to be seen whether this combination of analytic and empirical observation
was sufficient to account for the full range of user and system behaviour, and whether that behaviour
pattern, in particular the error categories themselves, can be used to draw conclusions about other
systems and other types of error. These two issues can be summed up under the headings of internal
and external validity. 6.1. Internal Validity
6.1.1. The Observation Method
There are reasons to doubt that the observation method - at a distance, from behind, and avoiding
interaction with users - was sufficient to detect and account for the whole range of behaviour, both user
and system, which occurred. The margin of Unknown errors, particularly on the QF, belies the
attempt to account for all possible varieties of error-making; the fact that this decreased in 1996
probably means that better homes were found for previously unattributed errors, not that the method
itself improved. And while it is believed that the Other errors on the MFM and QF can be attributed to
price-finding (followed, on the MFM, by FFM use : see Section 6.2.2), this requires confirmation by
other means.
As to those other means, possibilities include video analysis, interviewing and verbal protocol
analysis (Lea 1988). (All the other studies cited in Section 1.1 used a combination of empirical
methods). As mentioned, video was attempted in the pilot, but was found to be impractical; this does
not mean that it could not be used, but the kind of detail possible in the laboratory would be difficult to
replicate in public areas (and if it were, obtrusiveness might be a factor; if it were done surreptitiously,
ethical issues might arise). Interviewing (following machine use) was also attempted, but with variable
results. The question of ad hoc interviewing in public places, before or after task performance,
remains problematical. Though the use of laboratory user protocols has found support (from e.g.
Denning et al. 1990, Rhenius and Deffner 1990), the advantage of field studies is that it is possible to
catch a wider range of user behaviour (and other circumstances) than in the laboratory, and the need to
recruit volunteers may proscribe that very behaviour.
Considerations of the need for more expensive and elaborate methods such as video (which also
requires post-session analysis) may rest on the perceived trade-off between the costs and benefits of
these approaches and those of simpler methods. It has been claimed that the costs of introducing
usability practices rarely exceeds the expected benefits, even for more costly approaches (Mayhew and
Mantei 1994, Nielsen 1994a). 6.1.2. The observational data
The observational data collected (success/failure rates, numbers of errors, numbers of restarts, etc.), as
well as the errors themselves, are just some of a range of possible performance data. Others include

23
temporal measures such as task completion time, time spent on errors, etc. (Tyldesley 1988). Time
taking was attempted in the second (1996) phase, but was found to be impractical for simultaneous
observations; clearly, the use of multiple observers would enable it to be incorporated. Measures
might include total task time, times with and without errors, error rates, times involving restarts, etc.
(Baber and Parker 1994 compared times taken on successful and failed attempts).
The lack of multiple observers was also responsible for the two-part observational sessions, and
for the necessity to omit some machine attempts. However, there is no reason to believe that user
populations differed between samples, nor that every machine attempt had to be accounted for.
Other factors not accounted for include the numbers of incorrect, missing or spoilt tickets, and, in
the second part of each observation session, data relating to error-free successes (only error-making
attempts were recorded at that stage). Verhoef (1988) based his error analysis on incorrect machine-
purchased tickets, estimating their incidence at 1.6% (but from a very small sample). The number of
successes without errors could have been included in the between-subject comparisons in Section
4.3.1; this would have enabled assessment of their contribution to the overall pattern of successes and
failures.
Finally, the disparity between the number of FFM errors and those for the other two machines
needs addressing. Only 9 FFM errors were recorded in each phase, against means of 87.5 and 97.5 on
the MFM and QF respectively. This was due to the very slow rate and low occurrence of FFM errors :
9 errors represents several hours’ observations on that machine. The conclusions that can be drawn
from the FFM error breakdown are therefore limited in comparison with those from the MFM and QF.
However, the FFM is considered to be a successful ticketing system, whose low error rate can be
attributed to its very simplicity : there is little, apart from the mechanical problems found, that can go
wrong with this machine. 6.2. External Validity
6.2.1 The Stations, Machines, Times and Users : Criticism, notably Gray and Salzman (1998), has
rightly been made of HCI studies which use too narrowly-defined subject populations and attempt to
over-generalise from laboratory data. This study does not suffer from either major limitation, but
nevertheless the varieties of stations and users might have been wider. The two LUL stations were
both suburban, though Highbury & Islington caters to a younger and more diverse passenger group
than does Arnos Grove. (Permission was not originally given to use a larger, central zone, station).
Waterloo (overground terminus) was chosen in order to garner as much data as possible in a short
time; its passenger group is of course as diverse as could be, but again additional stations could have
been used.
Observation sessions, too, were mostly off-peak and in the afternoons. The Waterloo sessions
included some peak (early evening) use. Though this represents a fair variety, session times could
have been more varied and controlled.
Finally, although particular examples of the three machine types were substantially the same as all
others of their type, there are between-station differences in their siting relative to each other, the

24
numbers and combinations of each type, and even (on the LUL machines) the vintage of the ‘How to
use’ labelling. These are not thought to have contributed seriously to the differences in error patterns,
however. 6.2.2 The Error Categories
It is the author’s belief that the categories to which the observed errors were assigned are sufficient to
enable future designers of similar ticket vending machines (such as, it is hoped, the proposed improved
FFMs and touch-screen MFMs for the Jubilee Line Extension and Heathrow Airport) to avoid the
pitfalls to which the above results have testified. For instance, • not to enforce (or indicate when unenforced) a rigid step ordering, • not to prevent re-selection at any step, • not to cluster large numbers of selections together, • to include ‘how to use’ instructions and step order indicators.
However, the categories used remain, in Reason’s terms, at the contextual or even behavioural
level of classification, rather than at the conceptual level (Reason 1990 pp11-12). In that respect they
would fit easily into Meister’s (1977) taxonomy of omission, commission, sequence and temporal
errors. This means that it would be difficult for designers of other systems, vending machines or not,
to draw more general conclusions from the data about error avoidance and interface design features.
Thus attempt will now be made to relate some of the errors discovered to Reason’s three-level model
(discussed in Section 1.2).
For most errors, there are fits possible at both the skill-based (lapses of attention or action; faulty
monitoring) and rule-based (faulty intention) levels (Reason 1990). For example, selection errors on
all three machines could be examples of (skill-based) ‘habit inclusion’, or (rule-based) ‘informational
overload’ or ‘encoding deficiency’; order errors on the MFM or QF could be examples of (rule-based)
‘informational overload’ or ‘encoding deficiencies’, but they may also be applications of a ‘strong-but-
wrong’ rule (about destination before type or vice versa) derived from previous experience. In both
examples, failure of a rule may cause a dip into the knowledge-based level, where a correct rule (MFM
requires type selection first; QF doesn’t care; or perhaps ‘if it’s not one it’s always the other’) might be
applied.
Neither of these examples is very convincing, in the author’s view. There are too many
possibilities, too many overlaps, to be useful as an explanation of a single button press error. More
enlightening is Hutchins, Holland and Norman’s (1985, 1986) (also in Norman 1986) description of
the gulfs of execution and evaluation, where such errors might be explained more straightforwardly in
terms of user-system feedback. For example, a typical interaction sequence might proceed as follows :
25
1. We press (execute) the wrong button (e.g. on the MFM or QF destination sets). 2. We get an error message, or selection confirmation, or lit button. 3. We recognise (evaluate) the error;
or repeat, get the same response, then understand the error;
or press ‘Cancel’; or give up; or (on the MFM) press ‘Call assistance’,
note the lack of assistance, and then give up.
4. Then (if we get this far) we press the right button.
Better prompts and/or labelling and/or lack of order enforcement would help to bridge the gulf of
execution (what to do at step 1); better error messages and/or selection confirmation would help to
bridge the gulf of evaluation (how to interpret what happens at step 2).
More promising, in Reason’s terms, are the two examples uncovered of discrepant or unexpected
machine use (which, it is believed, only field observations such as these could have revealed). Firstly,
the use of the MFM for price-finding, followed by FFM use, when the MFM is giving change : this is
the ‘Used as price-finding machine when change given’ error in Table 7. (Price-finding was also noted
by Baber and Parker 1994). In terms of MFM use alone, this is clearly a critical error. At the rule-
based level (Reason 1990), it can be seen as the misapplication of a good rule, namely that the MFM
finds any price, while omitting the final part of that rule, that once a price is shown money can be
inserted (combined, perhaps, with the other good rule that the FFM is fast and simple once the price is
known). It is an example of Reason’s ‘rule strength’ and/or ‘rigidity’ of rule use : the FFM gives you a
ticket, the MFM merely tells you the price.
The other example of discrepant use, on the QF in particular, is what may be price-comparison,
that is, comparing prices for different ticket types, zones, etc. before purchase. In terms of the user’s
goal as originally attributed, these were critical errors, in that a ticket was not obtained from the
machine. However, with the benefit of experience (i.e. hindsight) they might be seen as evidence of
different, but equally valid, goals. In terms of Reason’s model, this might be an example of the correct
application of a good rule or rules (that the QF and MFM allow price finding but don’t need cash up
front, and that there are cheaper deals to be found if we spend time comparing prices ourselves rather
than queuing for information or harassing ticket clerks).
It is a central premise of Reason’s (1990) error model that the notion of error is inseparably bound
up with that of intentional actions in the service of known goals. The practice of error prediction (and
any subsequent analysis) therefore relies on our ability to correctly attribute intentions and goals to our
users. When user actions do not fit our model, for example in price-finding and price-comparison, that
model has to change. In the first case (price-finding) we might still see their actions as erroneous; in
the second case (price-comparison), however, it was our view of the users’ goals and intentions which
was in error.
Finally, it is possible that another observer or observers might have arrived at an entirely different
set of error categories, through which a match with their own (or another) set of predicted errors might

26
be demonstrated. Unlike the Baber and Stanton (1996) study, then, inter-rater reliability remains to be
shown for both the observed and predicted errors.
7. Final Conclusions
Polson and Lewis acknowledged in 1990 that ‘users are capable of restating goals’, admitting that ‘We
do not know how to predict or control these goal transformations’ (Polson and Lewis 1990 pp218-9).
Another (analytic) inspection method which attempts to address the issue of goal formation and
transformation, namely cognitive walkthrough (Lewis et al. 1990, Polson et al. 1992), has been
claimed to be no better at identifying usability problems than user testing or design guidelines (Karat et
al. 1992, Jeffries et al. 1991). While the goal identification stage of the DEA would clearly benefit
from such an approach (the ‘model mismatch analysis’ used by Sutcliffe and Springett (1992) also
appears promising in this regard), the DEA method does appear to be as least as good at problem
prediction, at least for relatively simple systems, than other more elaborate and lengthy alternatives
such as cognitive walkthrough and TAFEI.
8. Acknowledgements
Nick Hammond, for support, guidance and valuable comments.
Bruce Christie, for the DEA and for original support and encouragement.
Robert Scane, for original support and encouragement.
The reviewers of this paper, for comments and suggestions.
Paul Corfield of LUL, for access to underground stations and for ticketing system information.
9. References
BABER, C. and PARKER, A., (1994), Buying a ticket on the underground, in S.A. Robertson (ed),
Contemporary Ergonomics 1994 : Ergonomics for All, Proceedings of the Ergonomics Society
1994 Annual Conference (Taylor & Francis, London).
BABER, C. and STANTON, N.A. (1996), Human error identification techniques applied to public
technology : predictions compared with observed use, Applied Ergonomics, 1996, 27(2), 119-131.
BRODBECK, F.C., ZAPF, D., PRÜMPER, J. and FRESE, M. (1993), Error handling in office work
with computers : a field study, Journal of Occupational and Organizational Psychology, 1993, 66,
303-317.
BURFORD, B.C. and BABER, C. (1994), A user-centred evaluation of a simulated adaptive
autoteller, in S.A. Robertson (ed), Contemporary Ergonomics 1994: Ergonomics for All,
Proceedings of the Ergonomics Society 1994 Annual Conference (Taylor & Francis, London).

27
BURGOYNE, C.B, LEWIS, A., ROUTH, D.A. and WEBLEY, P. (1992), Customer reactions to
Automated Teller Machines (ATMs) : a field study in a UK building society, In S.E.G. Lea, P.
Webley and B.M. Young (eds), New Directions in Economic Psychology (Edward Elgar,
Aldershot).
CHRISTIE, B., SCANE, R. and COLLYER, J. (1995), Evaluation of human-computer interaction at
the user interface to advanced IT systems, in J.R. Wilson and E.N. Corlett (eds), Evaluation of
Human Work : A Practical Ergonomics Methodology, 2nd Edition (Taylor & Francis, London).
DENNING, S., HOIEM, D., SIMPSON, M. and SULLIVAN, K. (1990), The value of thinking-aloud
protocols in industry : a case study at Microsoft Corporation, Proceedings of the Human Factors
Society 34th Annual Meeting, 1990, 2, 1285-1289 (Human Factors Society).
EMBREY, D.E. (1986), SHERPA : a systematic human error reduction and prediction approach,
Proceedings of the ANS/ENS International Topical Meeting on Advances in Human Factors in
Nuclear Power Systems, April 1986 (Knoxville, Tennessee).
EMBREY, D.E. (1992), Quantitative and Qualitative Prediction of Human Error in Safety
Assessments, Institute of Chemical Engineers Symposium Series No. 130, (Institute of Chemical
Engineers, London).
FELIX, D., GRAF, W. and KRUEGER, H. (1991), User interfaces for public information systems, in
H.J. Bullinger (ed), Human Aspects in Computing : Design and Use of Interactive Systems and
Work With Terminals, Proceedings of the 4th International Conference on Human-computer
Interaction, Stuttgart, FRG, Sept 1991 (Vol. 1), (Series : Advances in Human Factors/Ergonomics,
No 18a) (Elsevier Science Publishers BV, Amsterdam).
GRAY, W.D. and SALZMAN, M.C. (1998), Damaged merchandise ? A review of experiments that
compare usability evaluation methods, Human-Computer Interaction, 1997, 13(3). In press.
HARDMAN, L. (1989), Evaluating the usability of the Glasgow online hypertext, Hypermedia, 1989,
1(1), 34-63.
HATTA, K. and IIYAMA, Y. (1991), Ergonomic study of automatic teller machine operability,
International Journal of Human-Computer Interaction, 1991, 3(3), 295-309.
HUTCHINS, E.L., HOLLAN, J.D. and NORMAN, D.A. (1985), Direct manipulation interfaces,
Human-Computer Interaction, 1985, 1, 311-338.
HUTCHINS, E.L., HOLLAN, J.D. and NORMAN, D.A. (1986), Direct manipulation interfaces, in
D.A. Norman and S.W. Draper (eds), User Centered System Design : New Perspectives on
Human-Computer Interaction (Lawrence Erlbaum, Hillside, NJ).
JEFFRIES, R., MILLER, J.R., WHARTON, C. and UYEDA, K.M. (1991), User interface evaluation
in the real world : a comparison of four techniques, in S.P. Robertson, G.M. Olson and J.S. Olson
(eds), Reaching Through Technology : CHI ‘91 Conference Proceedings, ACM Conference on
Human Factors in Computing Systems (New York : Addison-Wesley).
28
KARAT, C-M., CAMPBELL, R. and FIEGEL, T. (1992), Comparison of empirical testing and
walkthrough methods in user interface evaluation, in P. Bauersfeld, J. Bennett and G. Lynch (eds),
CHI ‘92 Conference Proceedings : Striking a Balance, ACM Conference on Human Factors in
Computing Systems (Reading, MA : Addison-Wesley).
KIERAS, D. and POLSON, P.G. (1985), An approach to the formal analysis of user complexity,
International Journal of Man-Machine Studies, 1985, 22(4), 365-394.
KIRWAN, B. (1995), Human reliability assessment, in J.R. Wilson and E.N. Corlett (eds), Evaluation
of Human Work : A Practical Ergonomics Methodology, 2nd Edition (Taylor & Francis, London).
LEA, M. (1988), Evaluating user interface designs, in T. Rubin (ed), User Interface Design for
Computer Systems (Ellis Horwood, Chichester ).
LEWIS, C., POLSON, P., WHARTON, C. and RIEMAN, J. (1990), Testing a walkthrough
methodology for theory-based design of walk-up-and-use interfaces, in J.C. Chew and J. Whiteside
(eds), Empowering People : CHI ‘90 Conference Proceedings, ACM Conference on Human
Factors in Computing Systems (special issue of the SIGCHI Bulletin) (Seattle : Addison-Wesley).
MACK, R.L. and NIELSEN, J. (1994), Executive summary, in J. Nielsen and R.L. Mack (eds),
Usability Inspection Methods (John Wiley & Sons, New York).
MAYHEW, D.J. and MANTEI, M. (1994), A basic framework for cost-justifying usability
engineering, in R.G. Bias and D.J. Mayhew (eds), Cost-justifying Usability (Academic Press,
Boston).
MEISTER, D. (1977), Human error in man-machine systems, in S.C. Brown and J.N.T. Martin (eds),
Human Aspects of Man-made Systems (Open University Press, Milton Keynes).
NIELSEN, J. (1989), Usability engineering at a discount, in G. Salvendy and M.J. Smith (eds),
Designing and Using Human-Computer Interfaces and Knowledge-based Systems (Elsevier
Science Publishers BV, Amsterdam).
NIELSEN, J. (1990), Big paybacks from ‘discount’ usability engineering, IEEE Software, May 1990,
7(3), 107-108.
NIELSEN, J. (1993), Usability Engineering (Academic Press, Boston).
NIELSEN, J. (1994a), Guerrilla HCI : using discount usability engineering to penetrate the
intimidation barrier, in R.G. Bias and D.J. Mayhew (eds), Cost-justifying Usability (Academic
Press, Boston).
NIELSEN, J. (1994b), Usability inspection methods, in C. Plaisant (ed), CHI ‘94 Conference
Proceedings (Conference Companion) : Celebrating Interdependence, Tutorials, ACM
Conference on Human Factors in Computing Systems (New York : ACM Press).
NORMAN, D.A. (1981), Categorisation of action slips, Psychological Review, 1981, 88(1), 1-15.
NORMAN, D.A. (1983), Design rules based on analyses of human error, Communications of the
ACM, April 1983, 26(4), 254-258.
NORMAN, D.A. (1986), Cognitive Engineering, in D.A. Norman and S.W. Draper (eds), User
Centred System Design (Lawrence Erlbaum Associates, New Jersey).
NORMAN, D.A. (1988), The Psychology of Everyday Things (Basic Books, New York).

29
POLSON, P.G. and LEWIS, C.H. (1990), Theory-based design for easily learned interfaces, Human-
Computer Interaction, 1990, 5, 191-220.
POLSON, P.G., LEWIS, C., RIEMAN, J. and WHARTON, C. (1992), Cognitive walkthroughs : a
method for theory-based evaluation of user interfaces, International Journal of Man-Machine
Studies, 1992, 36, 741-773.
PRÜMPER, J., ZAPF, D., BRODBECK, F.C. and FRESE, M. (1992), Some surprising differences
between novice and expert errors in computerized office work, Behaviour & Information
Technology, 1992, 11(6), 319-328.
RASMUSSEN, J. (1982), Human errors. A taxonomy for describing human malfunction in industrial
installations, Journal of Occupational Accidents, 1982, 4, 311-333.
RASMUSSEN, J. (1986), Information Processing and Human-machine Interaction : An Approach to
Cognitive Engineering, North-Holland Series in System Science and Engineering, (A.P. Sage, ed),
Vol. 12 (North-Holland, Amsterdam).
RASMUSSEN, J. (1987), The definition of human error and a taxonomy for technical system design,
in J. Rasmussen, K. Duncan and J. Leplat (eds), New Technology and Human Error (John Wiley
& Sons, New York).
REASON, J. and MYCIELSKA, K. (1982), Absent-Minded ? The Psychology of Mental Lapses and
Everyday Errors (Prentice-Hall, New Jersey).
REASON, J. (1984), Lapses of attention in everyday life, in R. Parasuraman and D.R. Davies (eds),
Varieties of Attention (Academic Press, Boston).
REASON, J. (1987a), A preliminary classification of mistakes, in J. Rasmussen, K. Duncan and J.
Leplat (eds), New Technology and Human Error (John Wiley & Sons, New York).
REASON, J. (1987b), Generic Error-Modelling System (GEMS) : a cognitive framework for locating
common human error forms, in J. Rasmussen, K. Duncan and J. Leplat (eds), New Technology and
Human Error (John Wiley & Sons, New York).
REASON, J. (1990), Human Error (Cambridge University Press, Cambridge).
RHENIUS, D and DEFFNER, G (1990), Evaluation of concurrent thinking aloud using eye-tracking
data, Proceedings of the Human Factors Society 34th Annual Meeting, 1990, 2, 1265-1269
(Human Factors Society).
ROGERS, W.A., GILBERT, D.K. and CABRERA, E.F. (1994), An in-depth analysis of automatic
teller machine usage by older adults, Proceedings of the Human Factors and Ergonomics Society
38th Annual Meeting, 1994, 1, 142-146 (Human Factors and Ergonomics Society).
SAJANIEMI, J. and TOSSAVAINEN, I. (1996), Session length and subject satisfaction in information
kiosk research, in M.A. Sasse, R.J. Cunningham and R.L. Winder (eds), People and Computers
XI, Proceedings of HCI ‘96 (Springer-Verlag, Berlin).
SALMINEN, S. and TALLBERG, T. (1996), Human errors in fatal and serious occupational accidents
in Finland, Ergonomics, 1996, 39(7), 980-988.

30
SUTCLIFFE, A.G. and SPRINGETT, M.V. (1992), From user’s problems to design errors : linking
evaluation to improving design practice, in A. Monk, D. Diaper and M.D. Harrison (eds), People
and Computers VII, Proceedings of HCI ‘92, September 1992, British Computer Society
Conference Series 5 (Cambridge University Press, Cambridge).
TYLDESLEY, D.A. (1988), Employing usability engineering in the development of office products,
The Computer Journal, 1988, 31(5), 431-436.
VERHOEF, L.W.M. (1986), Using a ticket vending machine : a perceptual model, in D.J. Oborne (ed),
Contemporary Ergonomics 1986, Proceedings of the Ergonomics Society 1986 Annual
Conference, April 1986 (Taylor & Francis, London).
VERHOEF, L.W.M. (1988), Decision making of vending machine users, Applied Ergonomics, 1988,
19(2), 103-109.
WHITEFIELD, A., WILSON, F. and DOWELL, J. (1991), A framework for human factors evaluation,
Behaviour & Information Technology, 1991, 10(1), 65-79.
WRIGHT, S.J., PACKEBUSH, S.J. and MITTA, D.A. (1993), Software interface evaluation :
modelling of human error, Proceedings of the Human Factors and Ergonomics Society 37th
Annual Meeting, 1993, 1, 453-455 (Human Factors and Ergonomics Society).
YAMADA, S., HONG, J-K. and SUGITA, S. (1995), Development and evaluation of hypermedia for
museum education : validation of metrics, ACM Transactions on Computer-Human Interaction,
December 1995, 2(4), 284-307.
ZAPF, D., BRODBECK, F.C., FRESE, M., PETERS, H. and PRÜMPER, H. (1992), Errors in
working with office computers : a first validation of a taxonomy for observed errors in a field
setting, International Journal of Human-Computer Interaction, 1992, 4(4), 311-339.
ZWAGA, H.J.C. (1988), Buying a ticket for the Washington Metro, in E. Megaw (ed), Contemporary
Ergonomics 1988, Proceedings of the Ergonomics Society 1988 Annual Conference, April 1988
(Taylor & Francis, London).
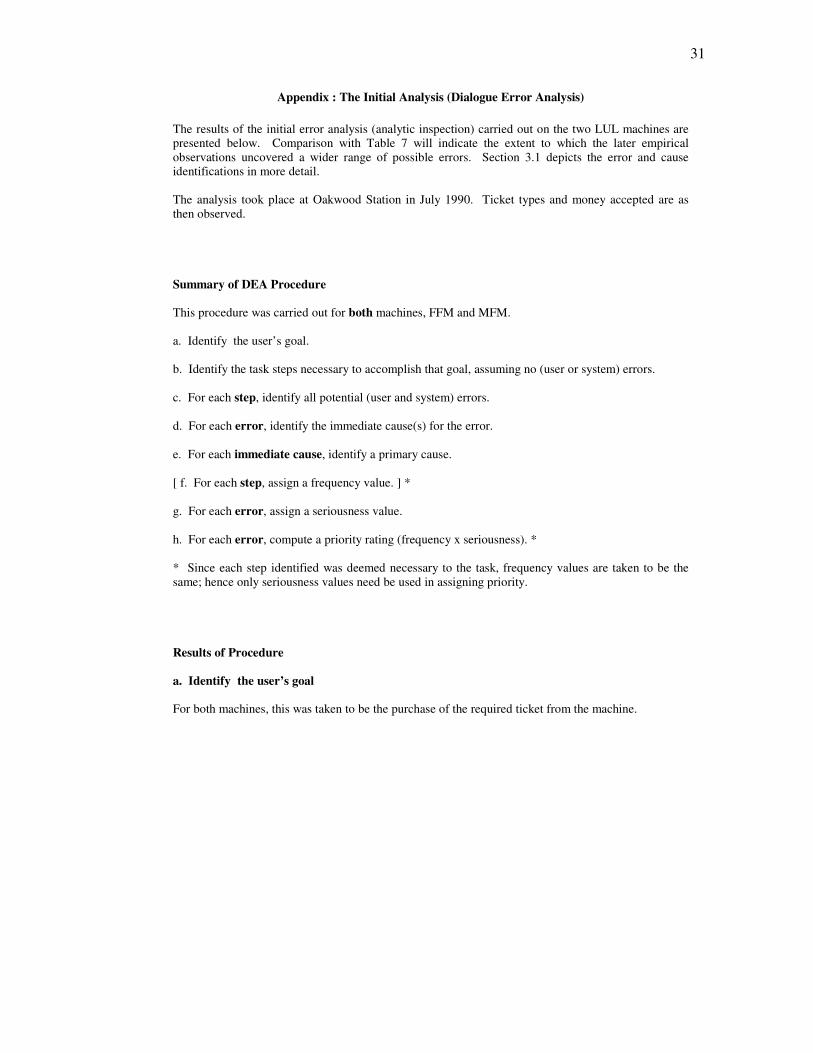
31
Appendix : The Initial Analysis (Dialogue Error Analysis) The results of the initial error analysis (analytic inspection) carried out on the two LUL machines are presented below. Comparison with Table 7 will indicate the extent to which the later empirical observations uncovered a wider range of possible errors. Section 3.1 depicts the error and cause identifications in more detail. The analysis took place at Oakwood Station in July 1990. Ticket types and money accepted are as then observed. Summary of DEA Procedure This procedure was carried out for both machines, FFM and MFM. a. Identify the user’s goal. b. Identify the task steps necessary to accomplish that goal, assuming no (user or system) errors. c. For each step, identify all potential (user and system) errors. d. For each error, identify the immediate cause(s) for the error. e. For each immediate cause, identify a primary cause. [ f. For each step, assign a frequency value. ] * g. For each error, assign a seriousness value. h. For each error, compute a priority rating (frequency x seriousness). * * Since each step identified was deemed necessary to the task, frequency values are taken to be the same; hence only seriousness values need be used in assigning priority. Results of Procedure a. Identify the user’s goal For both machines, this was taken to be the purchase of the required ticket from the machine.
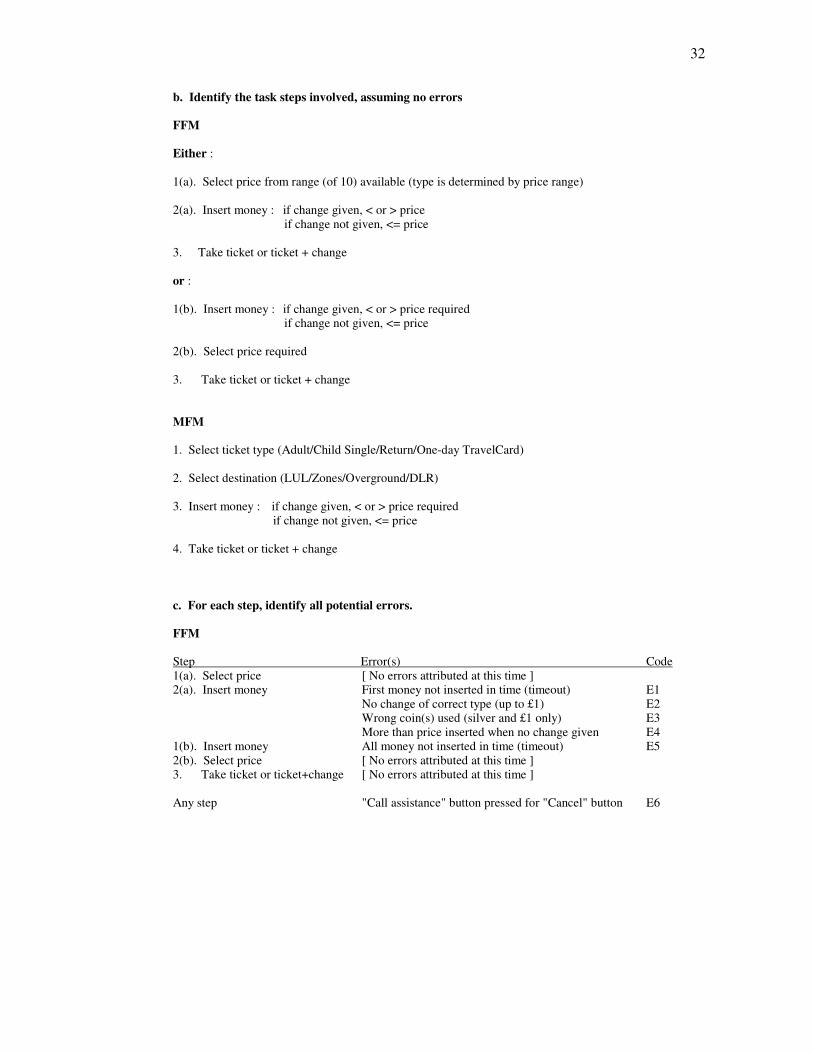
32
b. Identify the task steps involved, assuming no errors FFM Either : 1(a). Select price from range (of 10) available (type is determined by price range) 2(a). Insert money : if change given, < or > price
if change not given, <= price 3. Take ticket or ticket + change or : 1(b). Insert money : if change given, < or > price required
if change not given, <= price 2(b). Select price required 3. Take ticket or ticket + change MFM 1. Select ticket type (Adult/Child Single/Return/One-day TravelCard) 2. Select destination (LUL/Zones/Overground/DLR) 3. Insert money : if change given, < or > price required
if change not given, <= price 4. Take ticket or ticket + change c. For each step, identify all potential errors. FFM Step Error(s) Code 1(a). Select price [ No errors attributed at this time ] 2(a). Insert money First money not inserted in time (timeout) E1 No change of correct type (up to £1) E2 Wrong coin(s) used (silver and £1 only) E3 More than price inserted when no change given E4 1(b). Insert money All money not inserted in time (timeout) E5 2(b). Select price [ No errors attributed at this time ] 3. Take ticket or ticket+change [ No errors attributed at this time ] Any step "Call assistance" button pressed for "Cancel" button E6
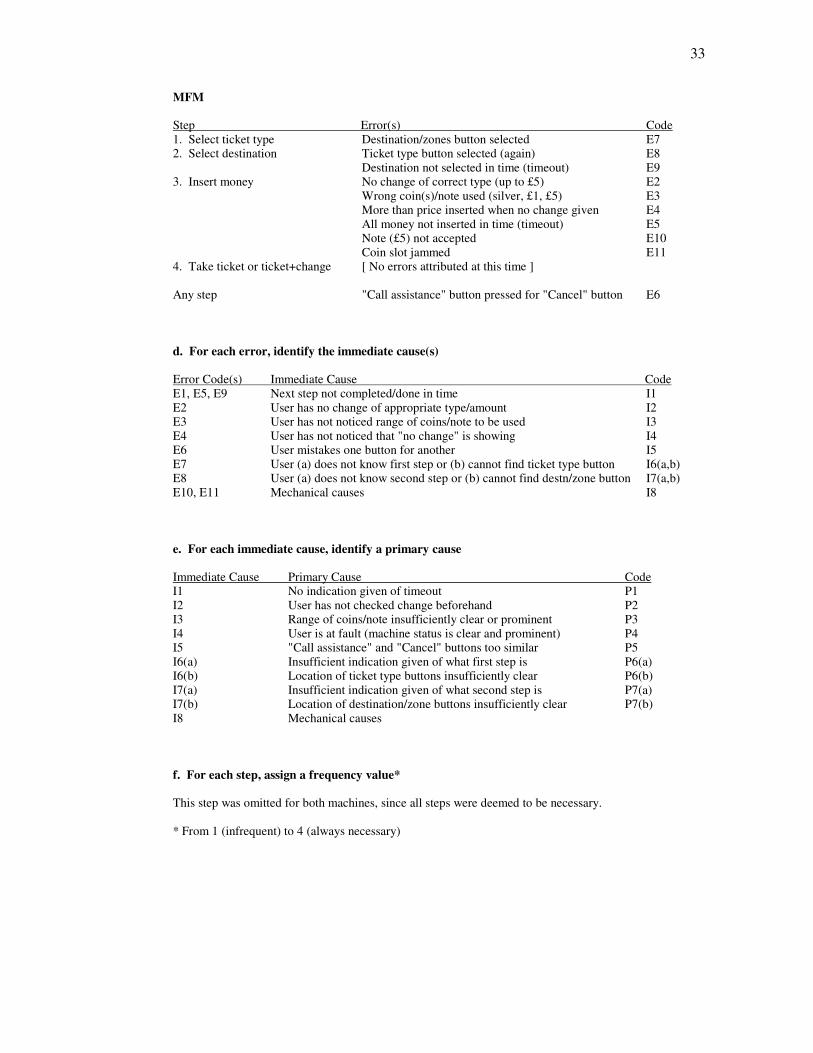
33
MFM Step Error(s) Code 1. Select ticket type Destination/zones button selected E7 2. Select destination Ticket type button selected (again) E8 Destination not selected in time (timeout) E9 3. Insert money No change of correct type (up to £5) E2 Wrong coin(s)/note used (silver, £1, £5) E3 More than price inserted when no change given E4 All money not inserted in time (timeout) E5 Note (£5) not accepted E10 Coin slot jammed E11 4. Take ticket or ticket+change [ No errors attributed at this time ] Any step "Call assistance" button pressed for "Cancel" button E6 d. For each error, identify the immediate cause(s) Error Code(s) Immediate Cause Code E1, E5, E9 Next step not completed/done in time I1 E2 User has no change of appropriate type/amount I2 E3 User has not noticed range of coins/note to be used I3 E4 User has not noticed that "no change" is showing I4 E6 User mistakes one button for another I5 E7 User (a) does not know first step or (b) cannot find ticket type button I6(a,b) E8 User (a) does not know second step or (b) cannot find destn/zone button I7(a,b) E10, E11 Mechanical causes I8 e. For each immediate cause, identify a primary cause Immediate Cause Primary Cause Code I1 No indication given of timeout P1 I2 User has not checked change beforehand P2 I3 Range of coins/note insufficiently clear or prominent P3 I4 User is at fault (machine status is clear and prominent) P4 I5 "Call assistance" and "Cancel" buttons too similar P5 I6(a) Insufficient indication given of what first step is P6(a) I6(b) Location of ticket type buttons insufficiently clear P6(b) I7(a) Insufficient indication given of what second step is P7(a) I7(b) Location of destination/zone buttons insufficiently clear P7(b) I8 Mechanical causes f. For each step, assign a frequency value* This step was omitted for both machines, since all steps were deemed to be necessary. * From 1 (infrequent) to 4 (always necessary)

34
g. For each error, assign a seriousness value* Error Description Seriousness value E1 First money not inserted in time (timeout) 2 E2 No change of correct type 3 E3 Wrong coin(s) used 1 E4 More than price inserted when no change given 4 E5 All money not inserted in time (timeout) 2 E6 "Call assistance" button pressed for "Cancel" button 2 E7 Destination/zones button selected for type button 2 E8 Ticket type button selected for destination/zones button 2 E9 Destination not selected in time (timeout) 2 E10 Note not accepted 4 E11 Coin slot jammed 4 * From 1 (trivial or easily retrievable) to 4 (serious or irretrievable). h. For each error, compute a priority rating (frequency x seriousness) [ Since all steps were deemed necessary, priority could be based on seriousness value alone ] FFM Error Description Priority E4 More than price inserted when no change given 4 E2 No change of correct type 3 E1, E5 Timeout 2 E6 "Call assistance" button pressed for "Cancel" button 2 E3 Wrong coin(s) used 1 MFM Error Description Priority E4 More than price inserted when no change given 4 E10 Note not accepted 4 E11 Coin slot jammed 4 E2 No change of correct type 3 E9, E5 Timeout 2 E6 "Call assistance" button pressed for "Cancel" button 2 E7 Destination/zones button selected for type button 2 E8 Ticket type button selected for destination/zones button 2 E3 Wrong coin(s)/note used 1

35
Figures
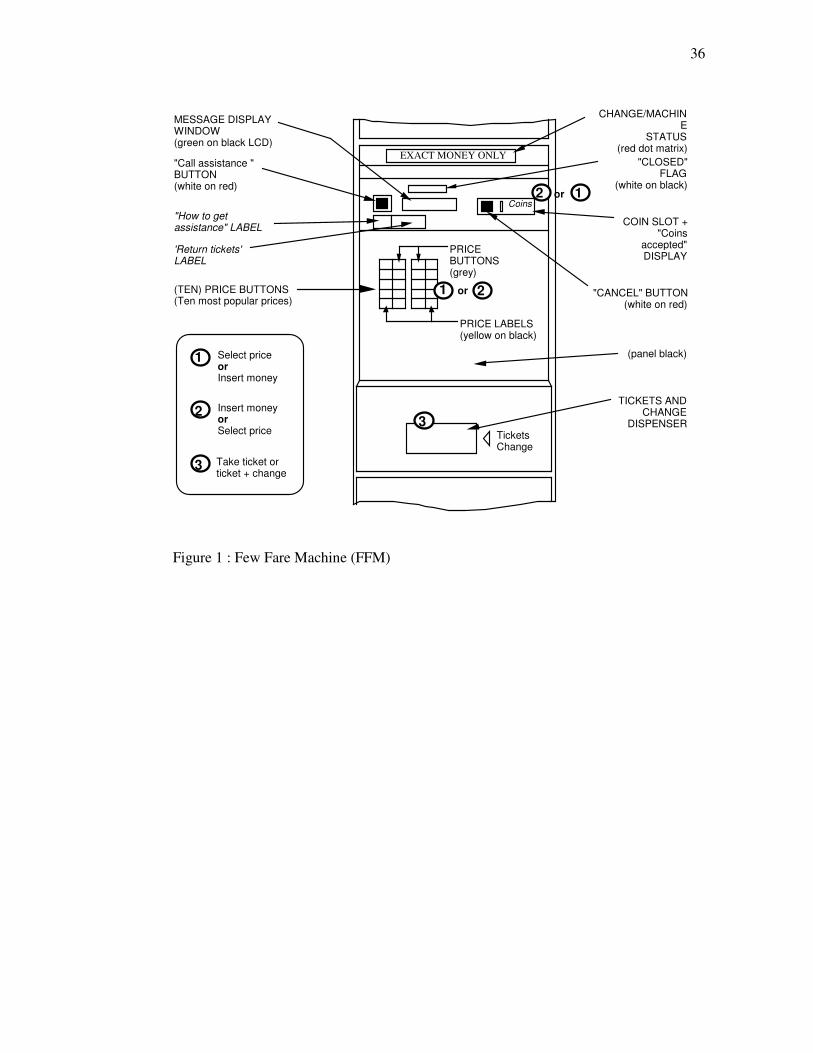
36
EXACT MONEY ONLY
Coins
Tickets Change
"Call assistance " BUTTON (white on red)
"How to get assistance" LABEL
"CLOSED" FLAG
(white on black)
CHANGE/MACHINE
STATUS (red dot matrix)
"CANCEL" BUTTON (white on red)
COIN SLOT + "Coins
accepted" DISPLAY
TICKETS AND CHANGE
DISPENSER
(panel black)
PRICE LABELS (yellow on black)
PRICE BUTTONS (grey)
(TEN) PRICE BUTTONS (Ten most popular prices)
1 Select price or Insert money
2 Insert money or Select price
3 Take ticket or ticket + change
MESSAGE DISPLAY WINDOW (green on black LCD)
or 12
or1 2
3
'Return tickets' LABEL
Figure 1 : Few Fare Machine (FFM)

37
CHANGE GIVEN
Coins
Tickets Change
"Call assistance" BUTTON (white on red)
"How to get assistance" LABEL
"CLOSED" FLAG
(white on black)
CHANGE/MACHINE STATUS (red dot matrix)
"CANCEL" BUTTON (white on
red)
MESSAGE DISPLAY WINDOW (green on black LCD)
£5 Notes
A
B
C
D
Y
ZE
1Select ticket type
2Select station or zone
TICKET TYPE BUTTONS (Six) (white on blue)
(Unused buttons black) STEP
NUMBER PANELS
(white on blue)
(white on red)
UNDERGROUND DESTINATION BUTTONS (app. 280), IN ALPHABETICAL ORDER (yellow on grey)
DOCKLANDS LIGHT RAILWAY (ZONES) DESTINATIONS (yellow on purple)
ZONES DESTINATIONS (yellow on green)
SELECTED OVERGROUND DESTINATIONS
(yellow on maroon)
OVERGRO
Z
ONES
DLR
Select destination21 Select
ticket type 3 Insert money
4 Take ticket or ticket + change
TICKETS AND CHANGE DISPENSER
COIN SLOT + "Coins
accepted" DISPLAY
NOTE TRAY (£5 only) + LABELS + DISPLAYS
1
2
4
3
3
UND
Figure 2 : Multi Fare Machine (MFM) in 1991
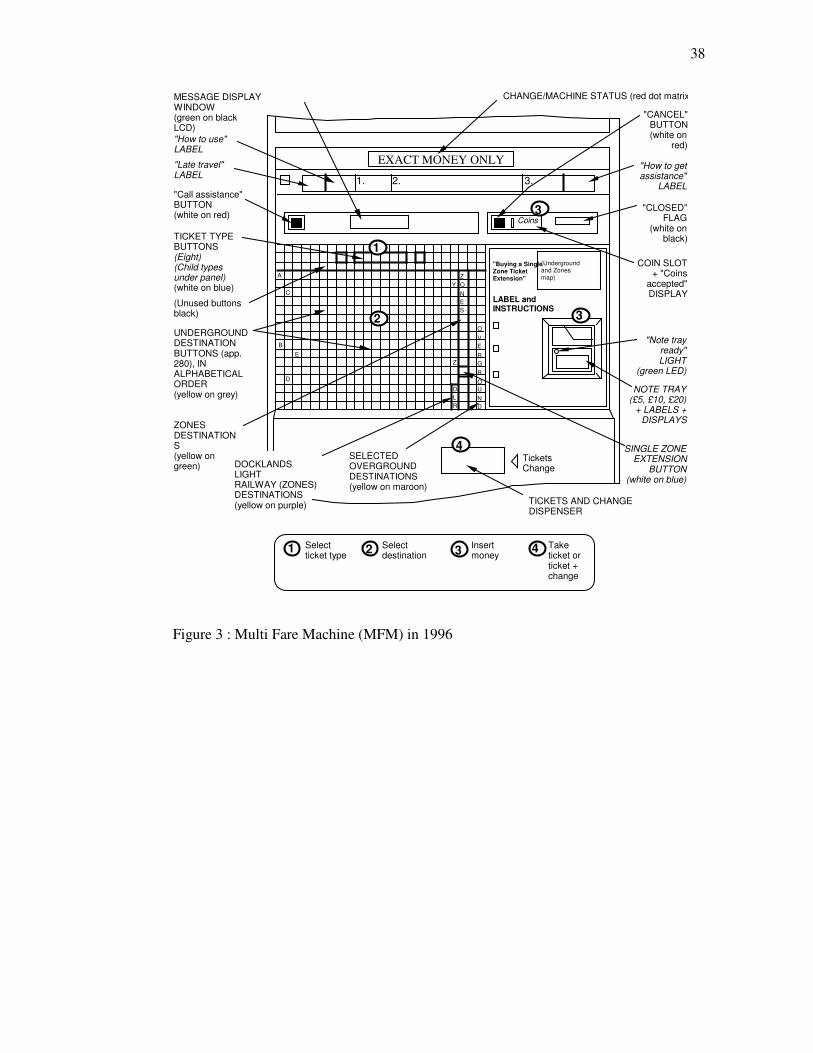
38
EXACT MONEY ONLY
Coins
Tickets Change
"Call assistance" BUTTON (white on red)
"CLOSED" FLAG
(white on black)
CHANGE/MACHINE STATUS (red dot matrix)
"CANCEL" BUTTON (white on
red)
MESSAGE DISPLAY WINDOW (green on black LCD)
A
B
C
D
Y
ZE
TICKET TYPE BUTTONS (Eight) (Child types under panel) (white on blue)
(Unused buttons black)
UNDERGROUND DESTINATION BUTTONS (app. 280), IN ALPHABETICAL ORDER (yellow on grey)
DOCKLANDS LIGHT RAILWAY (ZONES) DESTINATIONS (yellow on purple)
ZONES DESTINATIONS (yellow on green)
SELECTED OVERGROUND DESTINATIONS (yellow on maroon)
OVERGRO
ZONES
DLR
Select destination21 Select
ticket type 3 Insert money
4 Take ticket or ticket + change
TICKETS AND CHANGE DISPENSER
COIN SLOT + "Coins
accepted" DISPLAY
1
2
4
3
NOTE TRAY (£5, £10, £20)
+ LABELS + DISPLAYS
"How to get assistance"
LABEL
"How to use" LABEL
"Late travel" LABEL
(Underground and Zones map)
"Buying a Single Zone Ticket Extension"
LABEL and INSTRUCTIONS
"Note tray ready" LIGHT
(green LED)
SINGLE ZONE EXTENSION
BUTTON (white on blue)
3.2.1.
3
UND
Figure 3 : Multi Fare Machine (MFM) in 1996

39
Self-service tickets
To use QuickFare Important Info ..1. 2.3.
• Etc.• Etc.•
Select your destination
Tickets and change
Amount to pay
Insert coins here
QuickFare accepts£150p20105
Select ticket type
1
3
3
QuickFareAccepts ...
2
"How to use" + "Important information" LABEL (black on white)
FLASHING STEP ARROW "1" (black on green backlit)
DESTINATION BUTTONS + LABELS (buttons black on green backlit; labels black on white)
TICKET TYPE BUTTONS + LABELS (buttons black on yellow backlit; labels black on white)
TICKETS AND CHANGE DISPENSER (flashes white when ready)
ALARM (red flashing LED)
CHANGE/MACHINE STATUS FLAG
(black on orange/red)
AMOUNT TO PAY (black on yellow LCD)
ADDITIONAL TICKET INFORMATION
(black on green LCD)
£2.30
COIN SLOT + "Coins accepted" DISPLAY
FLASHING STEP ARROWS "2" AND "3"
(black on green backlit)
Cancel
"CANCEL" BUTTON (red backlit)
"Coins only" FLAG (black on white backlit)
NOTE TRAY (£5, £10, £20) +
LABEL (white on black) + DISPLAYS
(panel grey)
(casing red)
4
3
3
Select ticket type or Select destination
21 Select destination or Select ticket type
4 Take ticket(s) or ticket(s) + change
Insert money3
1 or 2
2 or 1
Figure 4 : QuickFare (QF) Machine

40
Tables
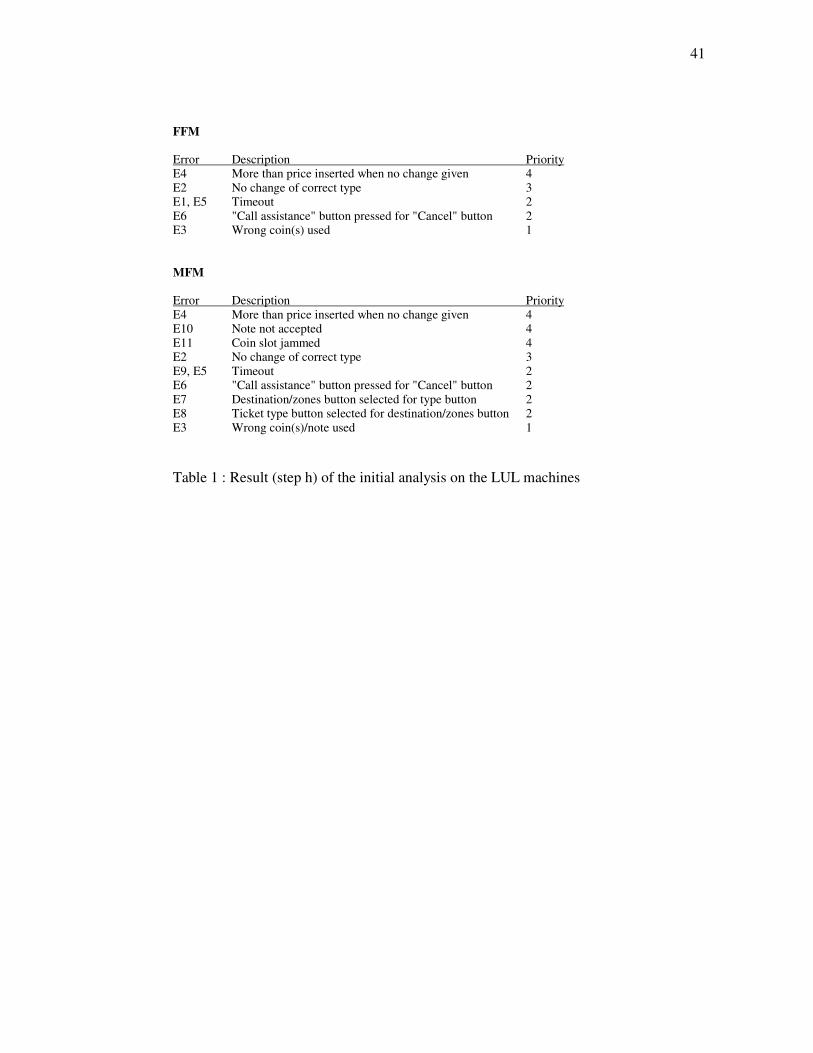
41
FFM Error Description Priority E4 More than price inserted when no change given 4 E2 No change of correct type 3 E1, E5 Timeout 2 E6 "Call assistance" button pressed for "Cancel" button 2 E3 Wrong coin(s) used 1 MFM Error Description Priority E4 More than price inserted when no change given 4 E10 Note not accepted 4 E11 Coin slot jammed 4 E2 No change of correct type 3 E9, E5 Timeout 2 E6 "Call assistance" button pressed for "Cancel" button 2 E7 Destination/zones button selected for type button 2 E8 Ticket type button selected for destination/zones button 2 E3 Wrong coin(s)/note used 1 Table 1 : Result (step h) of the initial analysis on the LUL machines
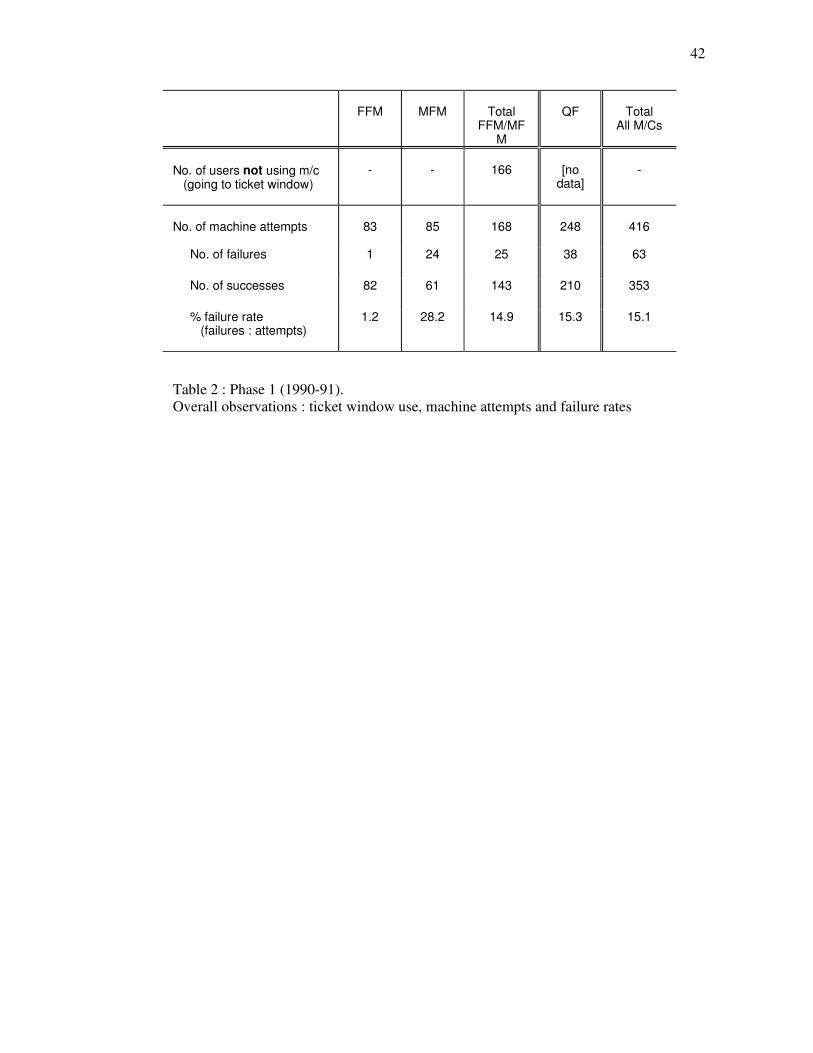
42
Table 2 : Phase 1 (1990-91). Overall observations : ticket window use, machine attempts and failure rates
FFM
MFM
Total
FFM/MFM
QF
Total
All M/Cs
No. of users not using m/c (going to ticket window)
-
-
166
[no
data]
-
No. of machine attempts
83
85
168
248
416
No. of failures 1 24 25 38 63
No. of successes 82 61 143 210 353
% failure rate (failures : attempts)
1.2 28.2 14.9 15.3 15.1
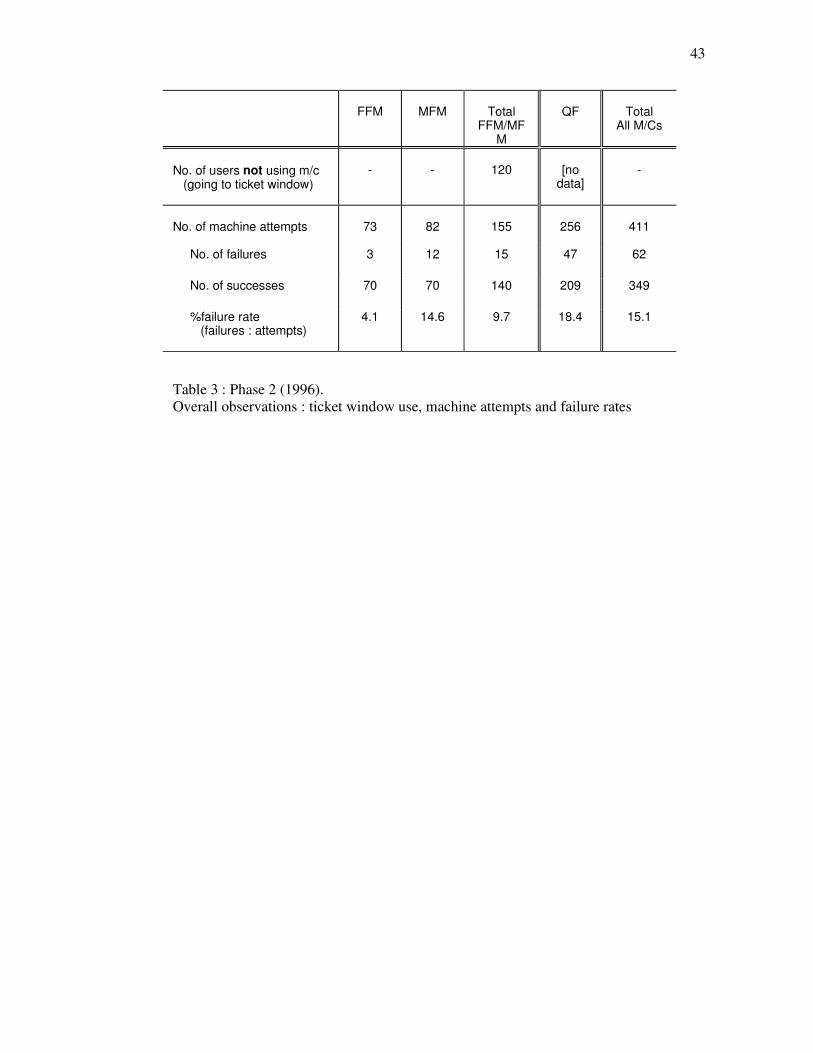
43
Table 3 : Phase 2 (1996). Overall observations : ticket window use, machine attempts and failure rates
FFM
MFM
Total
FFM/MFM
QF
Total
All M/Cs
No. of users not using m/c (going to ticket window)
-
-
120
[no
data]
-
No. of machine attempts
73
82
155
256
411
No. of failures 3 12 15 47 62
No. of successes 70 70 140 209 349
%failure rate (failures : attempts)
4.1 14.6 9.7 18.4 15.1

44
Table 4 : Phases 1 (1990-91) and 2 (1996). Overall failure rates (% failures : attempts).
FFM
MFM
QF
All M/Cs
Phase 1 (1990-91)
1.2
28.2
15.3
15.1
Phase 2 (1996)
4.1
14.6
18.4
15.1
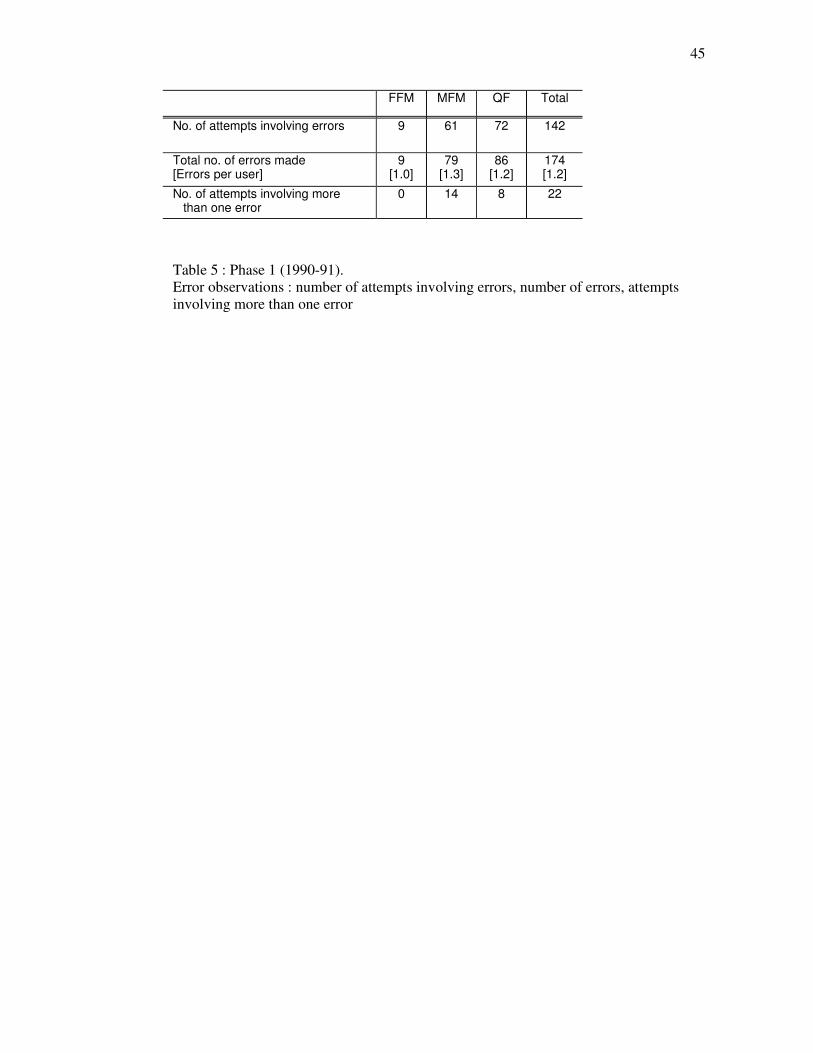
45
Table 5 : Phase 1 (1990-91). Error observations : number of attempts involving errors, number of errors, attempts involving more than one error
FFM MFM QF Total
No. of attempts involving errors 9 61 72 142
Total no. of errors made [Errors per user]
9 [1.0]
79 [1.3]
86 [1.2]
174 [1.2]
No. of attempts involving more than one error
0 14 8 22
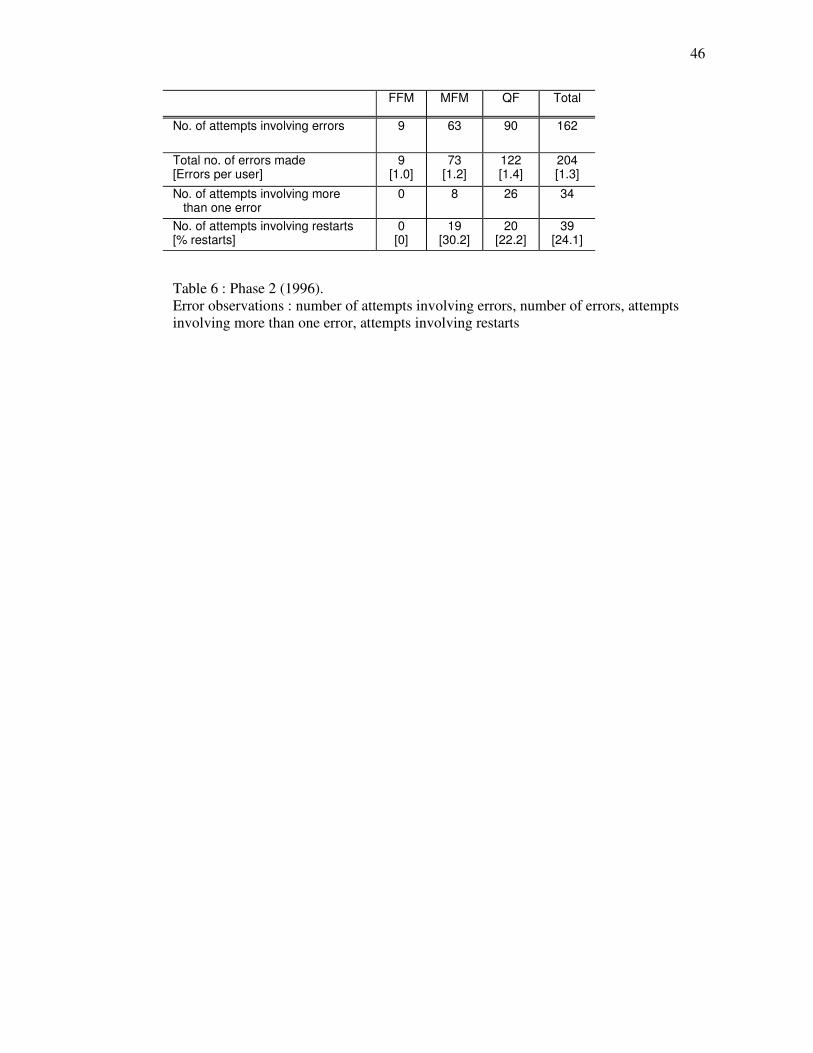
46
Table 6 : Phase 2 (1996). Error observations : number of attempts involving errors, number of errors, attempts involving more than one error, attempts involving restarts
FFM MFM QF Total
No. of attempts involving errors 9 63 90 162
Total no. of errors made [Errors per user]
9 [1.0]
73 [1.2]
122 [1.4]
204 [1.3]
No. of attempts involving more than one error
0 8 26 34
No. of attempts involving restarts [% restarts]
0 [0]
19 [30.2]
20 [22.2]
39 [24.1]

47
Table 7 : Phase 1 (1990-91). Error observations : full error listing, and number of errors observed, for MFM.

48
Table 8 : Phase 1 (1990-91). Error observations : numbers of observed errors (critical and non-critical) in nine error categories.

49
Table 8 : Phase 1 (1990-91) contd.
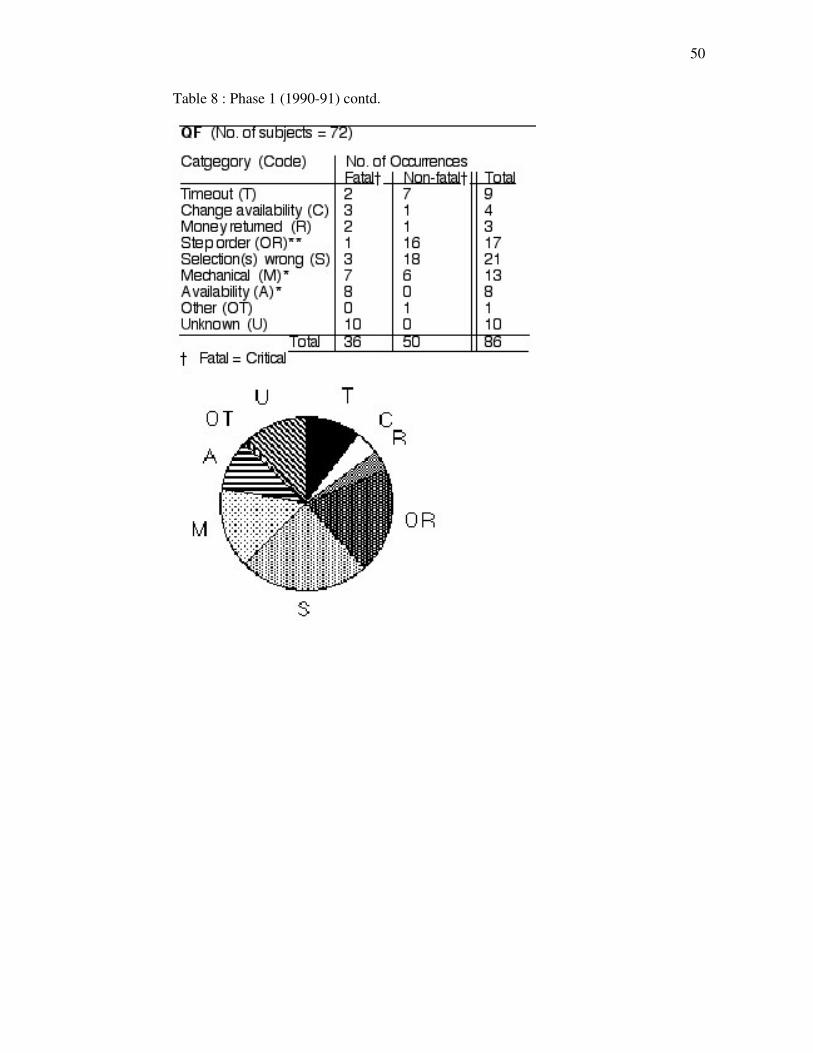
50
Table 8 : Phase 1 (1990-91) contd.
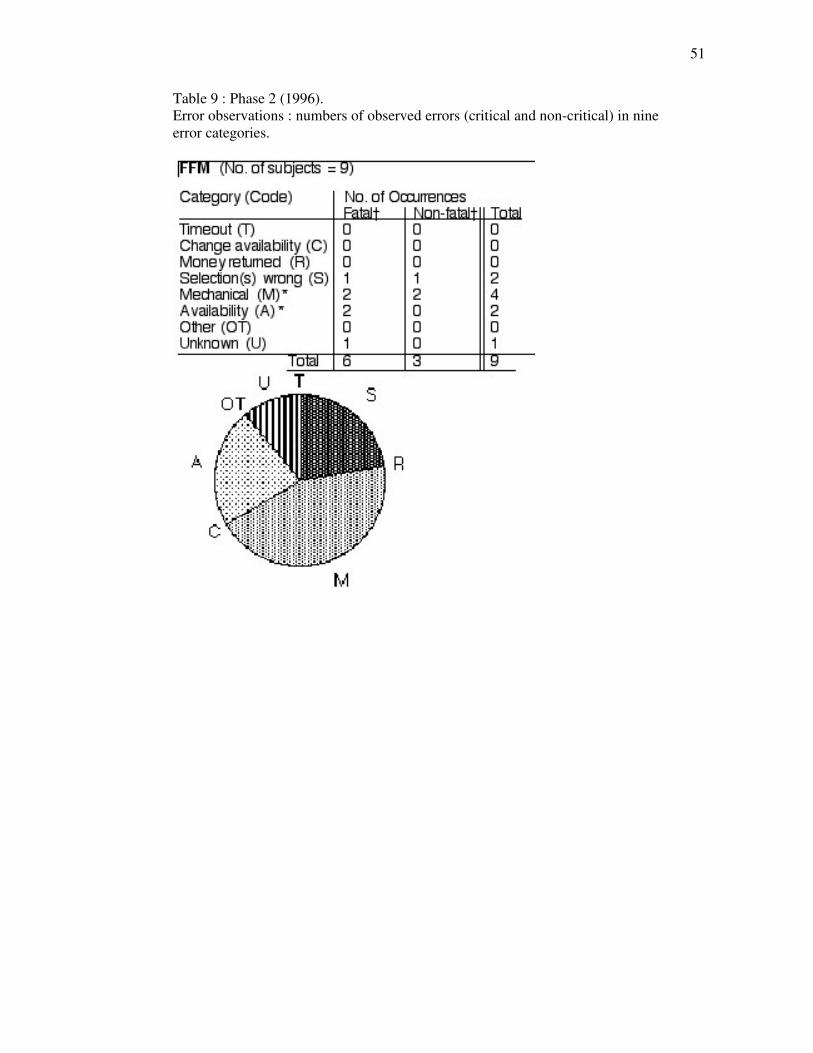
51
Table 9 : Phase 2 (1996). Error observations : numbers of observed errors (critical and non-critical) in nine error categories.

52
Table 9 : Phase 2 (1996) contd.
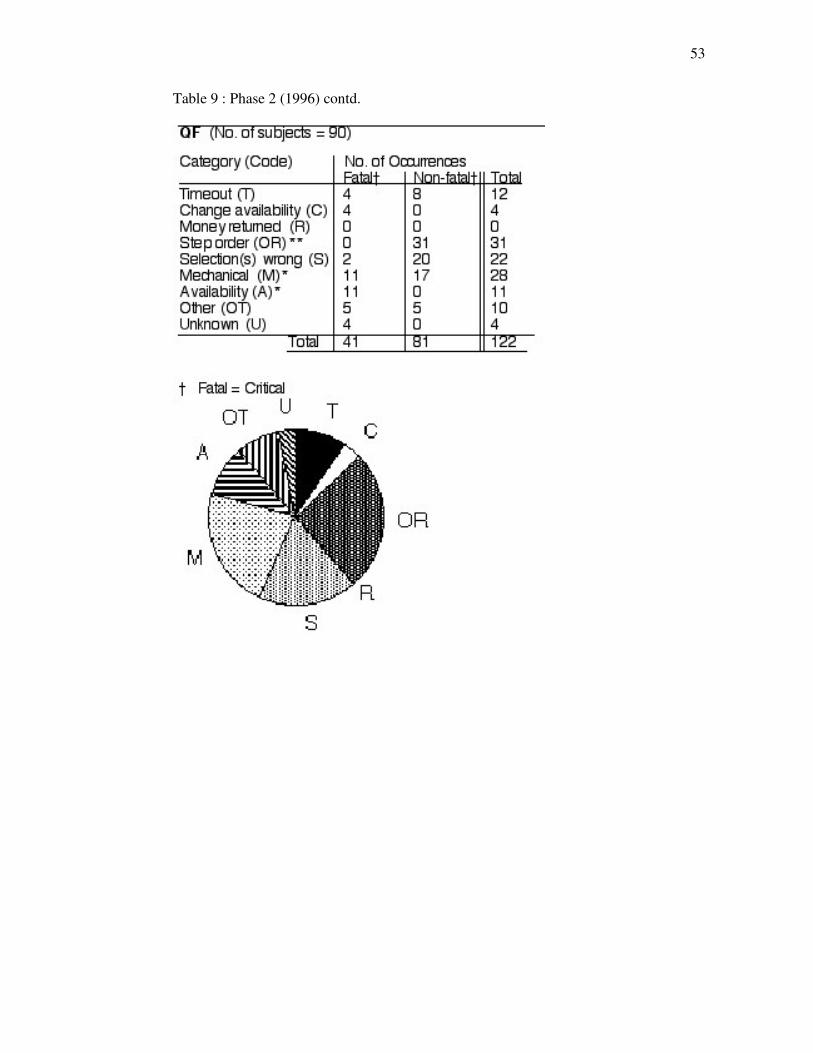
53
Table 9 : Phase 2 (1996) contd.

54
Table 10 : Phase 1 (1990-91). (LUL machines only). Numbers of observed errors in the nine categories, with (observed)frequencies, seriousness ratings and priorities computed (see text for explanation). Original priority ratings are shown alongside
Related Documents