UNIVERSITA’ DEGLI STUDI DI BERGAMO DIPARTIMENTO DI INGEGNERIA GESTIONALE QUADERNI DEL DIPARTIMENTO † Department of Economics and Technology Management Working Paper n. 10 – 2007 Connectivity of the European airport network: “self-help hubbing” and business implications by Paolo Malighetti, Stefano Paleari, Renato Redondi † Il Dipartimento ottempera agli obblighi previsti dall’art. 1 del D.L.L. 31.8.1945, n. 660 e successive modificazioni.

Welcome message from author
This document is posted to help you gain knowledge. Please leave a comment to let me know what you think about it! Share it to your friends and learn new things together.
Transcript

UNIVERSITA’ DEGLI STUDI DI BERGAMO DIPARTIMENTO DI INGEGNERIA GESTIONALE
QUADERNI DEL DIPARTIMENTO†
Department of Economics and Technology Management
Working Paper
n. 10 – 2007
Connectivity of the European airport network: “self-help hubbing” and
business implications
by
Paolo Malighetti, Stefano Paleari, Renato Redondi
† Il Dipartimento ottempera agli obblighi previsti dall’art. 1 del D.L.L. 31.8.1945, n. 660 e successive modificazioni.

COMITATO DI REDAZIONE§
Lucio Cassia, Gianmaria Martini, Stefano Paleari, Andrea Salanti § L’accesso alle Series è approvato dal Comitato di Redazione. I Working Papers ed i Technical Reports della Collana dei Quaderni del Dipartimento di Ingegneria Gestionale costituiscono un servizio atto a fornire la tempestiva divulgazione dei risultati dell’attività di ricerca, siano essi in forma provvisoria o definitiva.
Connectivity of the European airport network: “self-help hubbing” and business implications
Paolo Malighetti1*, Stefano Paleari*, Renato Redondi**
*University of Bergamo and ICCSAI **University of Brescia and ICCSAI
Abstract
This paper investigates the connectivity of the European air transportation network. A time-dependent minimum path approach is employed to calculate the minimum travel time between each pair of airports in the network, inclusive of flight times and waiting times. The connectivity offered by each alliance’s network is compared with that of the overall network. The results show that roughly two-thirds of the fastest indirect connections are not operated by the alliance system; this could be exploited to enable a new passenger strategy of “self-help hubbing”. Keywords: Indirect Connectivity, European Network, Minimum Travel Time
1 Corresponding author. Address: Università degli Studi di Bergamo, Dip. Ingegneria Gestionale, Viale G. Marconi, 5 ‐ 24044 Dalmine (BG). e‐mail: [email protected]
2
1. Introduction
The European air transport network has seen continuous evolution over the last 10 years. The connectivity of the network has undergone a transformation. This paper outlines the relationship between an airport’s potential for indirect connections and its attractiveness to passengers. With respect to the intra-European market, the overlapping effects of intensifying point-to-point routes and restructuring the hub-and-spoke organization obscure the overall picture. In a deregulated context, a network is the natural outcome of strategies adopted by individual airlines and airports. The resulting spatial and temporal distribution of flights could have a number of unanticipated optimal connections, viewed in terms of minimum travel time. Since this resource is not the result of a coordinated effort, however, it may be difficult to fully exploit. It is our aim to measure and assess this potential benefit. 2. The role of connectivity
2.1. Connectivity and the hub and spoke system
Indirect connectivity is often associated with the concept of hubs. By moving through a hub, passengers from secondary airports can be fed to primary or intercontinental destinations. Hubs therefore act as transfer points, and play a major role in amplifying the network’s potentiality. They offer passengers a wide variety of possible destinations, even when no direct connections are available. The hub-and-spoke structure first emerged in the US in the aftermath of deregulation (Reynolds-Feighan, 1998). Compared to the point-to-point model, a hub-and-spoke structure requires fewer direct flights to link any given set of cities. The hub-and-spoke structure is thought to increase the airlines’ efficiency (Caves et al., 1984) because it allows a higher density of flights. Furthermore, airlines dominating a hub may obtain a fare premium (Boreinstein, 1989) and employ it as an entry barrier (Oum et al., 1995). At the same time, the hub and spoke structure heavily affects the airport hierarchy. Its main drawback is that "spoke" cities risk being marginalized (Goetz and Sutton, 1997). While the characteristics of the hub-and-spoke system have been extensively studied, the issue of indirect connectivity for non-hub airports has rarely been treated in detail. A hub airport is a provider of projected indirect connectivity, which is further enhanced by the dominating airline through the organization of flights in multiple wave systems. Since the basic requirement of indirect connectivity is merely a sufficient geographic and temporal concentration of flights (Reynolds-Feighan, 2001), however, non-hub airports can also generate connectivity for transfer passengers. Indeed, transfers may occur between two flights run by different airlines and lacking coordination. These opportunities are not only possible, but may also be economically exploitable. The advantage ensuing from high traffic density at the route level

3
would be captured equally well if each route in the hub network were operated by a different carrier (Starkie, 2006).
2.2. Recent developments in Europe
In Europe, where average flight distances are shorter than in the US and most primary airports are congested (European Commission, 2001, Forsyth 2007), direct and indirect connectivity issues and the role of hub airports prove particularly interesting. On the one hand, Burghouwt and de Wit (2005) argue that reconfiguration of traditional airlines into a hub-and-spoke structure is pushing the European network towards a higher concentration. On the other hand, some studies suggest that the hub-and-spoke system is reaching the limits of its scalability (Holmes and Scott, 2004). The magnitude and speed of its recent changes have made the European air transport network an interesting target for network analysis.
First, flying within Europe is becoming more and more an affair for low-cost carriers. The official Eurocontrol statistics (2nd half 2006) state that 16.5% of all Instrument Flight Rules (IFR) flights in Europe were by low-cost carriers. Ryanair had 960,821 weekly scheduled seats in fall 2006, the biggest intra-European scheduled network offered by a single airline. Although low-cost carriers do not traditionally provide facilities for connecting flights, most still concentrate their flights at particular airports for logistic and economic motivations. For this reason, some so-called “secondary” airports have grown faster than expected. This is certainly true of London Stansted, which has rapidly grown to the size of a major European airport. If size and traffic no longer define hub airports (Dennis, 1994), then the sheer concentration of flights can provide room for indirect connectivity. See Burghouwt (2007) for a detailed discussion of the hub-and-spoke system and its evolution in the European network.
Secondly, ex-flag carriers have reconfigured their networks in Europe since the deregulation, restructuring and consolidating routes according to their alliance strategy. While network consolidation is widely recognized as a key issue for alliances (Alamdari and Iatrou, 2005), it is not yet clear what consequences may arise from an increase in transfer traffic for hub airports. Since consolidation affects both intercontinental and intra-European routes, it is interesting to analyse the advantages resulting from Europe’s coordinated alliance system.
Third, deregulation has wide implications for the air transport system. There has been privatization of airlines and airports allowing them to pursue profitable business opportunities. The former have started to act as independent players in the market, competing to attract low-cost carriers and passengers. The low-cost phenomenon itself originates from a desire to exploit latent demand. In terms of indirect connections, Skyeurope, a leading low-cost carrier in the eastern European market, has started to promote a Skylink service between Kosice and Bratislava. This addition makes the international route system of Bratislava airport available to passengers coming from other parts of the country. Unlike traditional carriers, Skyeurope does not coordinate its flights but does grants interconnection even if incoming flights from Kosice are delayed up to 30 minutes. Furthermore, it reimburses the ticket or provides a seat on the following flight in case of a missed
4
connection. To take another example, Stansted (the biggest low-cost airport in Europe) now offers2 a service on its webpage named “Create your own connection” which helps passengers take advantage of its potential for indirect connections. These cases exemplify the dynamism of the airline industry, and suggest that the time is ripe for an in-depth analysis of the European network and its connectivity. Much of the work on airport network connectivity is based on graph theory. This has been used to model a wide array of networks: social, communications, neural, transportation, etc. All networks can be described as an array of nodes connected by links. According to Milgran (1977), one of the most important features of any network is its mobility, defined as the ease of travelling from one node to another. In practice this is measured as the number of steps needed to link any pair of nodes. In the context of air transport, the nodes are airports and the connections are non-stop flights. The minimum number of flights connecting each pair of airports is known as the “shortest path length”. The degree distribution of the network has been widely analysed (Stoneham 1977, Albert and Barabasi 2002, Watts and Strogatz 1998). In general, three main network types are defined: scale-free networks, characterized by a power law decay; broad-scale networks, whose power law regime is followed by a sharp cut-off; and single-scale networks, which have a rapidly decaying tail. Complex air travel systems such as Europe’s appear to be scale-free small world networks (Guimerà et. al., 2005). The same may be said of other national airport systems such as the Chinese network (Li and Cai, 2004), the Indian network (Bagler, 2004) and the Italian network (Guida and Funaro, 2007). Guimerà et al. (2005, 2006) point out that the number of direct connections to an airport is not always a good proxy for its importance as a provider of indirect connections. Since the shortest path length measures how quickly and easily passengers can travel from one airport to another, the connectivity has been employed to evaluate the efficiency of airport networks (Li and Cai, 2004). A low-frequency route or a route with limited seat availability, however, cannot be said provide the same level of connectivity as a high-frequency route. While the geographical concentration of flights is certainly important, this approach fails to recognize the temporal dimension. This may be put right by rating each route according to its frequency (Bagler, 2004). Frequency rating is also useful when establishing the relative importance of each route in a gravity model (Doganis, 1966, 2001). The temporal concentration of flights should also be measured to assess the network’s effective potential for indirect connections. Veldhuis (1997) and Burghouwt (2005), for example, only consider the presence of connecting flights within a reasonable time window (from 45 minutes up to 3 hours). Both of these studies develop indexes of indirect connectivity, focusing on hub airports and worldwide destinations.
2http://www.stanstedairport.com/portal/controller/

5
Reynolds-Feighan and McLay (2006) analyzed the connectivity and attractiveness of European airports using accessibility indexes instead of temporal flight distributions. They point out that interconnections involving low-cost carriers or more than one alliance may be unattractive or unavailable due to the additional costs imposed by airline restrictions. On the other hand, Burghouwt (2007) argues that low fares increase a passenger’s tolerance for long waiting times. Indeed, “self-help hubbing” has become possible even without airline coordination. Franke (2004) says that the low-cost model could induce full-service airlines to “break free of the vicious cycle of connectivity and complexity”. Here, we quantify the difference between two sources of connectivity: that supplied by the usual alliance systems, and that which passengers can exploit in a “self-directed” trip with the goal of estimating how much network connectivity is not supplied by the alliance systems, and to discuss means of exploiting this opportunity in the future. 3. Methodology
Initially the minimum number of steps required to connect each pair of airports is estimated. For example, if there is a direct link between airport A and airport B, the shortest path length (SPL) between A and B is 1. On the other hand, if A and B are both connected to a third airport C but not directly linked, their shortest path length is 2. To describe a network of N airports, a N×N adjacency matrix A is used. An element aij is 1 if and only if there is a direct connection between the two airports; otherwise it is set to 0. A standard algorithm is deployed to calculate the minimum number of steps between each pair of airports (Bagler, 2004). Let SPLij be the shortest path length between airports i and j. Then SPL, the N×N matrix of shortest path lengths, is known as the connectivity matrix. For each airport a connectivity index CIi is defined as
CIi = ∑≠= −
N
jij
ij
NSPL
,1 1 (1)
The index is the average of the minimum path lengths between airport i and all other airports in the network. Estimation makes use of the Innovata database3, that contains published information on scheduled flights and includes the departure airport, departure time, arrival airport, arrival time, frequency, and operating airline. The analysis of shortest path lengths is carried out on two levels: first we compute connectivity indexes for the worldwide network, including all 3,556 airports with at least one scheduled passenger flight during the year 2006. Second, this analysis is repeated at the European level for all 478 airports with at least one scheduled passenger flight during the year 2006. Since the aim is to evaluate the potential for individual airports to enable connections between European destinations, some measures of centrality are needed. Following Freeman (1977), we define the “betweenness” of airport k as the number of minimal paths within the network as a whole that pass
3 Innovata is a provider of Scheduled Reference Services in partnership with IATA. The SRS airline schedules database contains data from over 892 airlines worldwide.
6
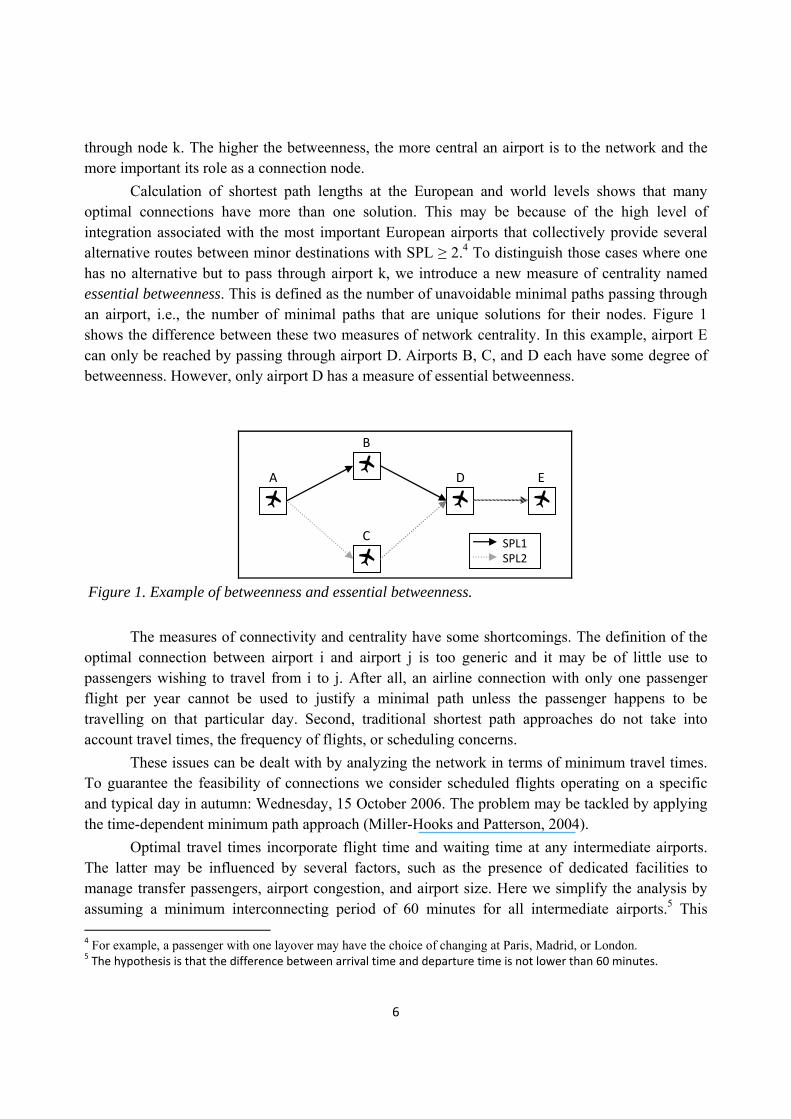
through node k. The higher the betweenness, the more central an airport is to the network and the more important its role as a connection node. Calculation of shortest path lengths at the European and world levels shows that many optimal connections have more than one solution. This may be because of the high level of integration associated with the most important European airports that collectively provide several alternative routes between minor destinations with SPL ≥ 2.4 To distinguish those cases where one has no alternative but to pass through airport k, we introduce a new measure of centrality named essential betweenness. This is defined as the number of unavoidable minimal paths passing through an airport, i.e., the number of minimal paths that are unique solutions for their nodes. Figure 1 shows the difference between these two measures of network centrality. In this example, airport E can only be reached by passing through airport D. Airports B, C, and D each have some degree of betweenness. However, only airport D has a measure of essential betweenness.
A
B
C
D E
SPL1SPL2
Figure 1. Example of betweenness and essential betweenness. The measures of connectivity and centrality have some shortcomings. The definition of the optimal connection between airport i and airport j is too generic and it may be of little use to passengers wishing to travel from i to j. After all, an airline connection with only one passenger flight per year cannot be used to justify a minimal path unless the passenger happens to be travelling on that particular day. Second, traditional shortest path approaches do not take into account travel times, the frequency of flights, or scheduling concerns. These issues can be dealt with by analyzing the network in terms of minimum travel times. To guarantee the feasibility of connections we consider scheduled flights operating on a specific and typical day in autumn: Wednesday, 15 October 2006. The problem may be tackled by applying the time-dependent minimum path approach (Miller-Hooks and Patterson, 2004). Optimal travel times incorporate flight time and waiting time at any intermediate airports. The latter may be influenced by several factors, such as the presence of dedicated facilities to manage transfer passengers, airport congestion, and airport size. Here we simplify the analysis by assuming a minimum interconnecting period of 60 minutes for all intermediate airports.5 This 4 For example, a passenger with one layover may have the choice of changing at Paris, Madrid, or London. 5 The hypothesis is that the difference between arrival time and departure time is not lower than 60 minutes.
7
period is acceptable for European connections, but should be lengthened if considering intercontinental flights. No maximum connecting time is assumed. If paths with connecting times over a given maximum are excluded, some of the airport pairs would no longer have a feasible connection. The analysis depends on the starting time of each flight. By taking an early flight from a generic airport, one can reach more destinations. On the other hand, one may experience an increase in waiting times in intermediate airports. A late flight, however, may result in missed connections and failure to reach the destination. For each pair of airports the shortest travel time STTijt from airport i to airport j is calculated, starting at a specified time t, with the day divided into 96 units of fifteen minutes, so that starting times range from 00:00 to 23:45 (Brussels time). Itineraries ending after midnight are not taken into account. Thus, for every possible combination of two airports the shortest travel time for all flights leaving as early as 00:00 and concluding before midnight of the next day is known. The minimum travel time for airports i and j is then; STTij=mint(STTijt). (2) Similarly, the best starting time for travel from i to j, STij, is defined as the starting time that minimizes travel time: STij={t: STTijt=STTij}. (3) To estimate the role of intermediate airports, the optimal path from airport i to airport j is defined as the path that lasts the minimum travel time STTijt. If there are two connections from A to B lasting the same minimum travel time, only the solution involving the fewest possible steps is defined as optimal. For example if there are two connections from A to B lasting for 5 hours, A-C-D-B and A-E-B, only the latter is optimal. Using these definitions, one can calculate the betweenness of each intermediate airport. Scheduling information provides the precise connection period at each intermediate airport. We also calculate the “essential betweenness” but since multiple optimal paths with the same travel time are rarer than multiple paths of the same length (number of steps), in most cases essential betweenness and betweenness are the same. The focus is therefore on simple betweenness. To estimate how much of this potentiality is already used the European network is compared to the networks of three major world alliances: One World, SkyTeam, and Star. The main alternative measure of indirect connectivity (Burghouwt and de Wit, 2005) is based on the temporal coordination of flight schedules at a given hub airport. These data can be used to count the number of connections that a passenger passing through the airport could exploit. However, many of these connections will not lie on shortest paths to the passenger’s final destination. The temporal co-ordination approach usually specifies some maximum routing factor, defined as the ratio between in-flight time and potential direct flight time and normally lying between 1.25 and 1.4 (Burghouwt and de Wit, 2005). The factor permits exclusion of some of the indirect connections offered by hub airports if the detour is excessive. For example, the indirect connection from Rome Fiumicino to Milan Linate via Heathrow is not considered because its
8
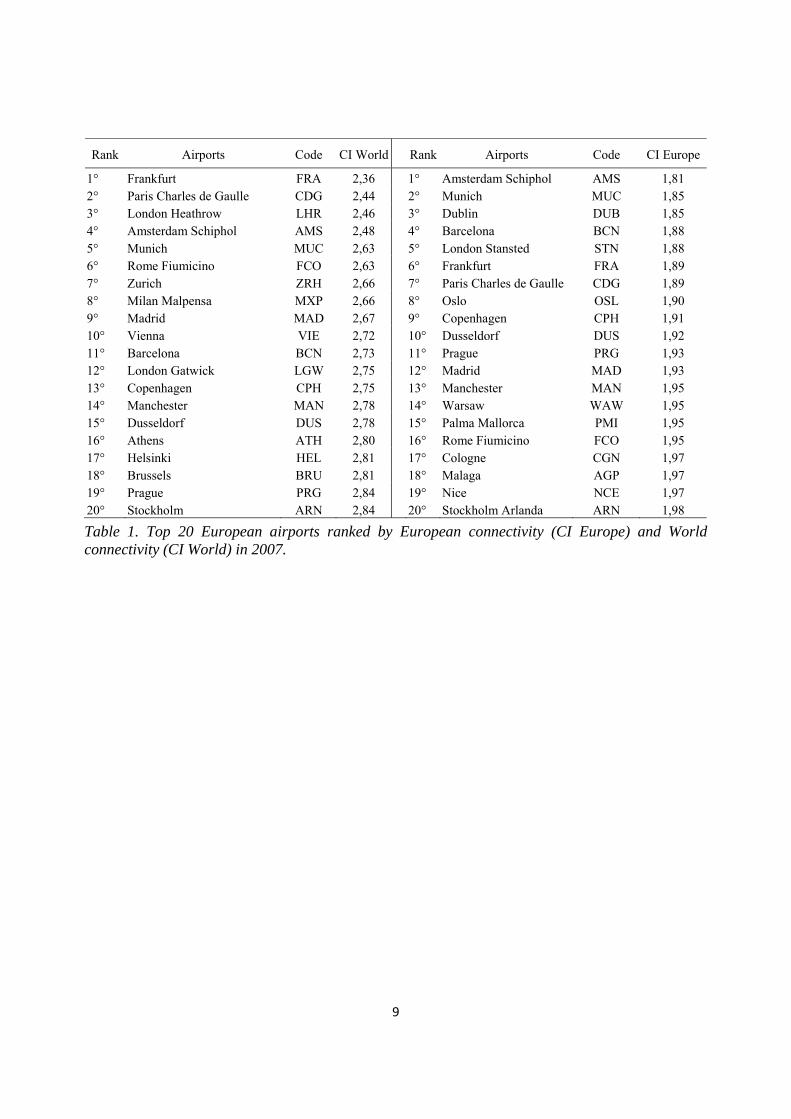
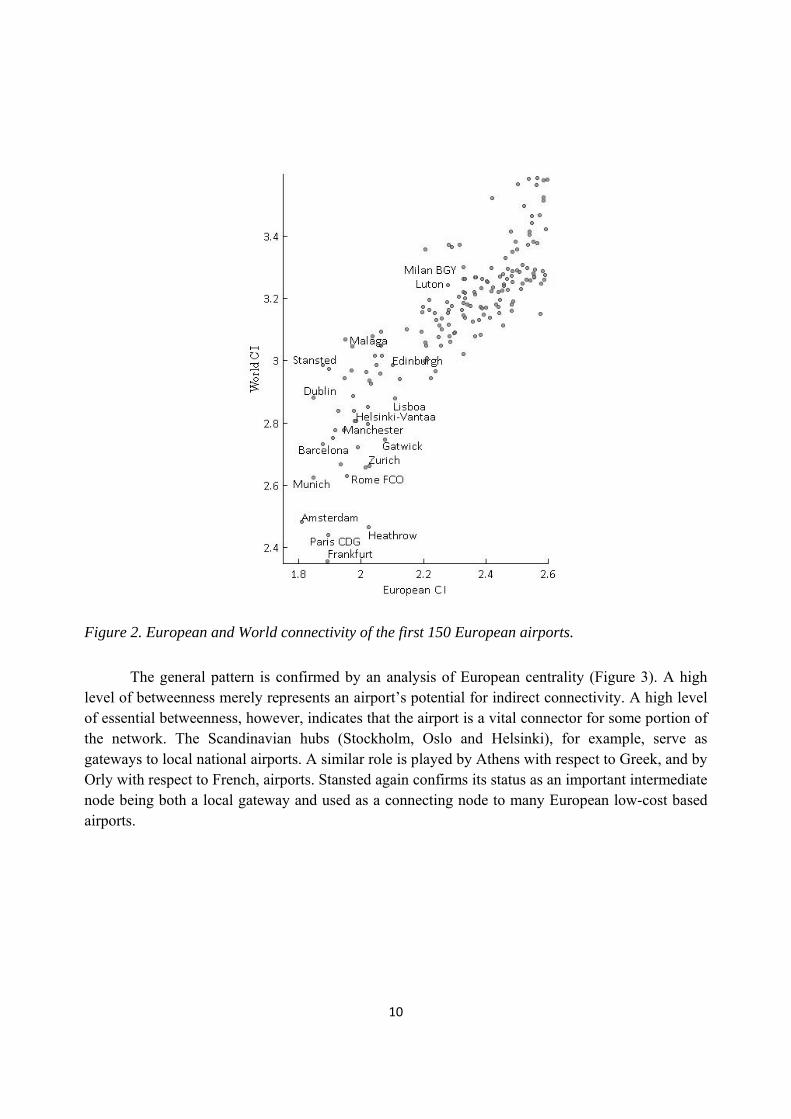
routing factor is well above 2.6 Few of the quickest connections have a routing factor higher than 1.4, but in these cases they are the only connections available. For this reason, a maximum routing factor is not considered. We only exclude some indirect connections between airports within 100 kilometers of each other to exclude pointless connections such as London Heathrow-Amsterdam-London Stansted. The analysis does not assess the travelers’ utility, nor does it model the passenger’s choice of route and airports. To do so would need consideration of a much more complex set of variables: prices, the number of steps involved, other services provided by carriers, the presence of loyalty programs, the aircraft type, the service provided in intermediate airports and the opportunity costs of different types of passengers. The analysis just looks at travel times. 4. Empirical analysis Table 1 shows the top 20 European airports in each category, ranked according to their 2007 world and European connectivity status. The four major European hubs top the world connectivity ranking, followed by several other traditional airports such as Munich, Rome Fiumicino, and Zurich. The ranking changes dramatically when looking at European connectivity. Although Amsterdam Schiphol ranks first, two low-cost airports (Dublin and Stansted) are among the top five. London Heathrow does not even appear in the top 20, largely because it concentrates on a limited number of high-density routes with world destinations. As seen in Figure 2, low-cost and leisure airports tend to be well connected at the European level but poorly at the world level. Traditional hub airports tend to specialize in world connectivity.
6 The Fiumicino-Heathrow-Linate connection is also not optimal here because the direct flight Fiumicino-Linate is quicker.
9
Rank Airports Code CI World Rank Airports Code CI Europe
1° Frankfurt FRA 2,36 1° Amsterdam Schiphol AMS 1,81 2° Paris Charles de Gaulle CDG 2,44 2° Munich MUC 1,85 3° London Heathrow LHR 2,46 3° Dublin DUB 1,85 4° Amsterdam Schiphol AMS 2,48 4° Barcelona BCN 1,88 5° Munich MUC 2,63 5° London Stansted STN 1,88 6° Rome Fiumicino FCO 2,63 6° Frankfurt FRA 1,89 7° Zurich ZRH 2,66 7° Paris Charles de Gaulle CDG 1,89 8° Milan Malpensa MXP 2,66 8° Oslo OSL 1,90 9° Madrid MAD 2,67 9° Copenhagen CPH 1,91 10° Vienna VIE 2,72 10° Dusseldorf DUS 1,92 11° Barcelona BCN 2,73 11° Prague PRG 1,93 12° London Gatwick LGW 2,75 12° Madrid MAD 1,93 13° Copenhagen CPH 2,75 13° Manchester MAN 1,95 14° Manchester MAN 2,78 14° Warsaw WAW 1,95 15° Dusseldorf DUS 2,78 15° Palma Mallorca PMI 1,95 16° Athens ATH 2,80 16° Rome Fiumicino FCO 1,95 17° Helsinki HEL 2,81 17° Cologne CGN 1,97 18° Brussels BRU 2,81 18° Malaga AGP 1,97 19° Prague PRG 2,84 19° Nice NCE 1,97 20° Stockholm ARN 2,84 20° Stockholm Arlanda ARN 1,98
Table 1. Top 20 European airports ranked by European connectivity (CI Europe) and World connectivity (CI World) in 2007.
10
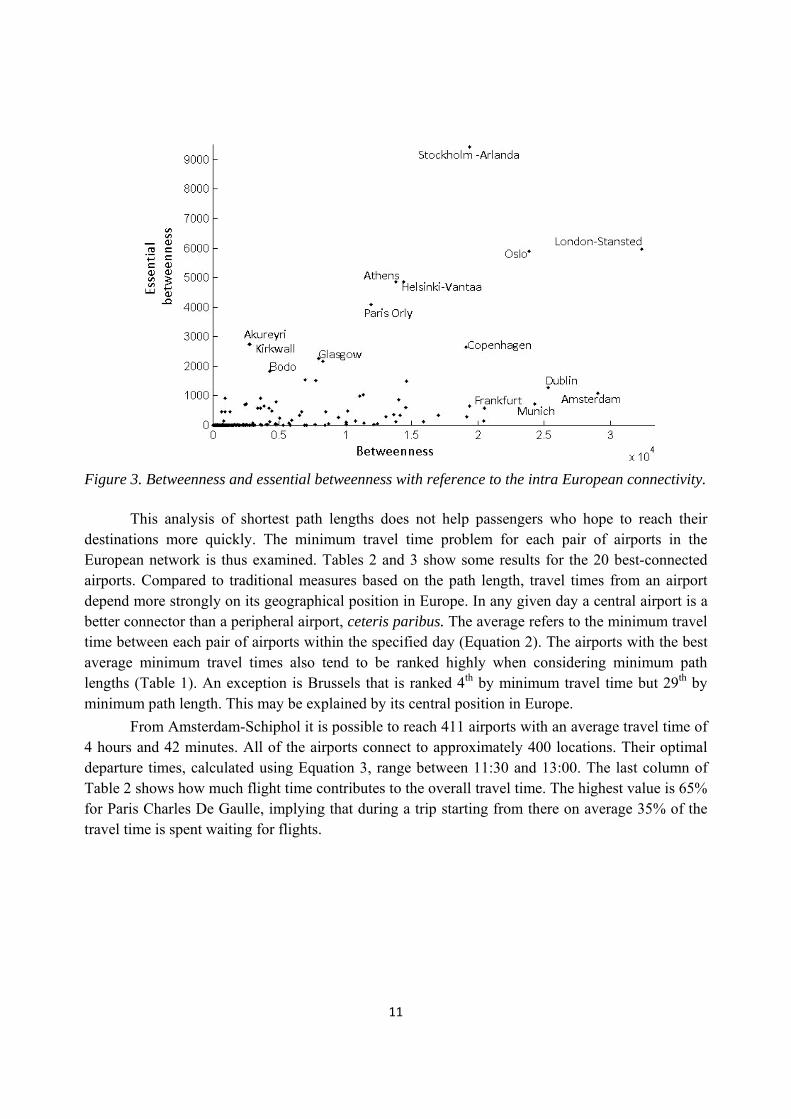
Figure 2. European and World connectivity of the first 150 European airports. The general pattern is confirmed by an analysis of European centrality (Figure 3). A high level of betweenness merely represents an airport’s potential for indirect connectivity. A high level of essential betweenness, however, indicates that the airport is a vital connector for some portion of the network. The Scandinavian hubs (Stockholm, Oslo and Helsinki), for example, serve as gateways to local national airports. A similar role is played by Athens with respect to Greek, and by Orly with respect to French, airports. Stansted again confirms its status as an important intermediate node being both a local gateway and used as a connecting node to many European low-cost based airports.
11
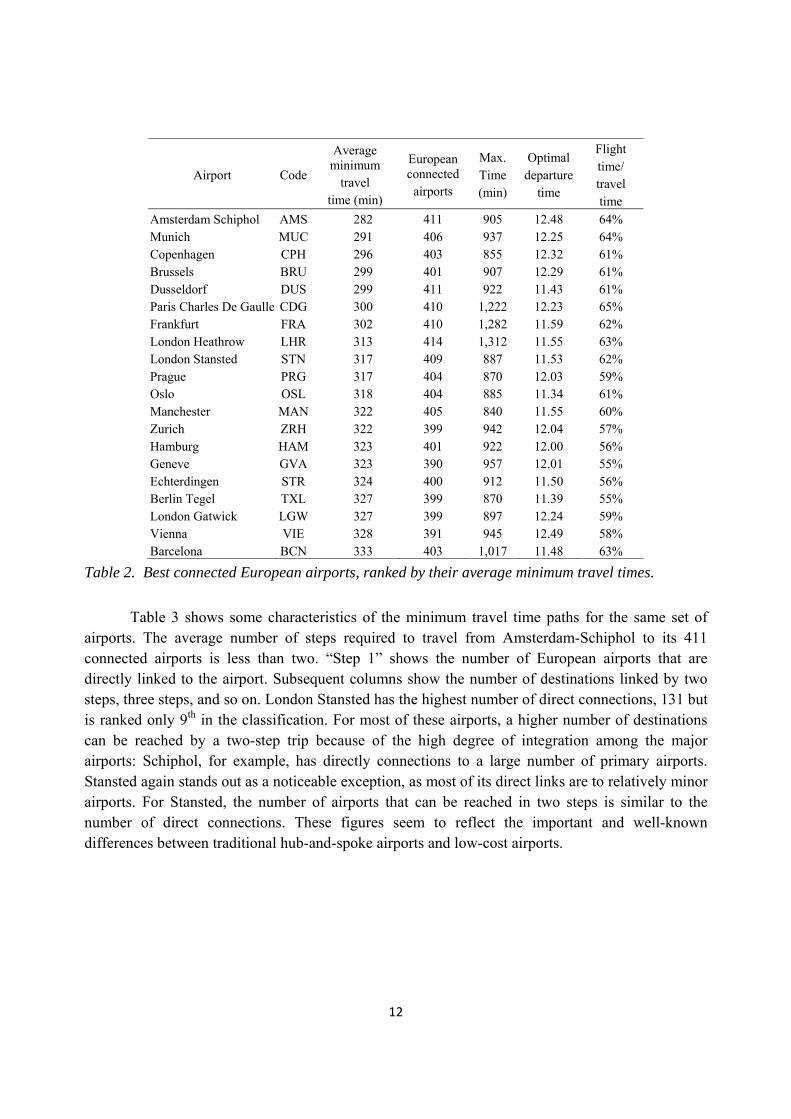
Figure 3. Betweenness and essential betweenness with reference to the intra European connectivity. This analysis of shortest path lengths does not help passengers who hope to reach their destinations more quickly. The minimum travel time problem for each pair of airports in the European network is thus examined. Tables 2 and 3 show some results for the 20 best-connected airports. Compared to traditional measures based on the path length, travel times from an airport depend more strongly on its geographical position in Europe. In any given day a central airport is a better connector than a peripheral airport, ceteris paribus. The average refers to the minimum travel time between each pair of airports within the specified day (Equation 2). The airports with the best average minimum travel times also tend to be ranked highly when considering minimum path lengths (Table 1). An exception is Brussels that is ranked 4th by minimum travel time but 29th by minimum path length. This may be explained by its central position in Europe. From Amsterdam-Schiphol it is possible to reach 411 airports with an average travel time of 4 hours and 42 minutes. All of the airports connect to approximately 400 locations. Their optimal departure times, calculated using Equation 3, range between 11:30 and 13:00. The last column of Table 2 shows how much flight time contributes to the overall travel time. The highest value is 65% for Paris Charles De Gaulle, implying that during a trip starting from there on average 35% of the travel time is spent waiting for flights.
12
Airport Code
Average minimum
travel time (min)
European connected
airports
Max. Time (min)
Optimal departure
time
Flight time/ travel time
Amsterdam Schiphol AMS 282 411 905 12.48 64% Munich MUC 291 406 937 12.25 64% Copenhagen CPH 296 403 855 12.32 61% Brussels BRU 299 401 907 12.29 61% Dusseldorf DUS 299 411 922 11.43 61% Paris Charles De Gaulle CDG 300 410 1,222 12.23 65% Frankfurt FRA 302 410 1,282 11.59 62% London Heathrow LHR 313 414 1,312 11.55 63% London Stansted STN 317 409 887 11.53 62% Prague PRG 317 404 870 12.03 59% Oslo OSL 318 404 885 11.34 61% Manchester MAN 322 405 840 11.55 60% Zurich ZRH 322 399 942 12.04 57% Hamburg HAM 323 401 922 12.00 56% Geneve GVA 323 390 957 12.01 55% Echterdingen STR 324 400 912 11.50 56% Berlin Tegel TXL 327 399 870 11.39 55% London Gatwick LGW 327 399 897 12.24 59% Vienna VIE 328 391 945 12.49 58% Barcelona BCN 333 403 1,017 11.48 63%
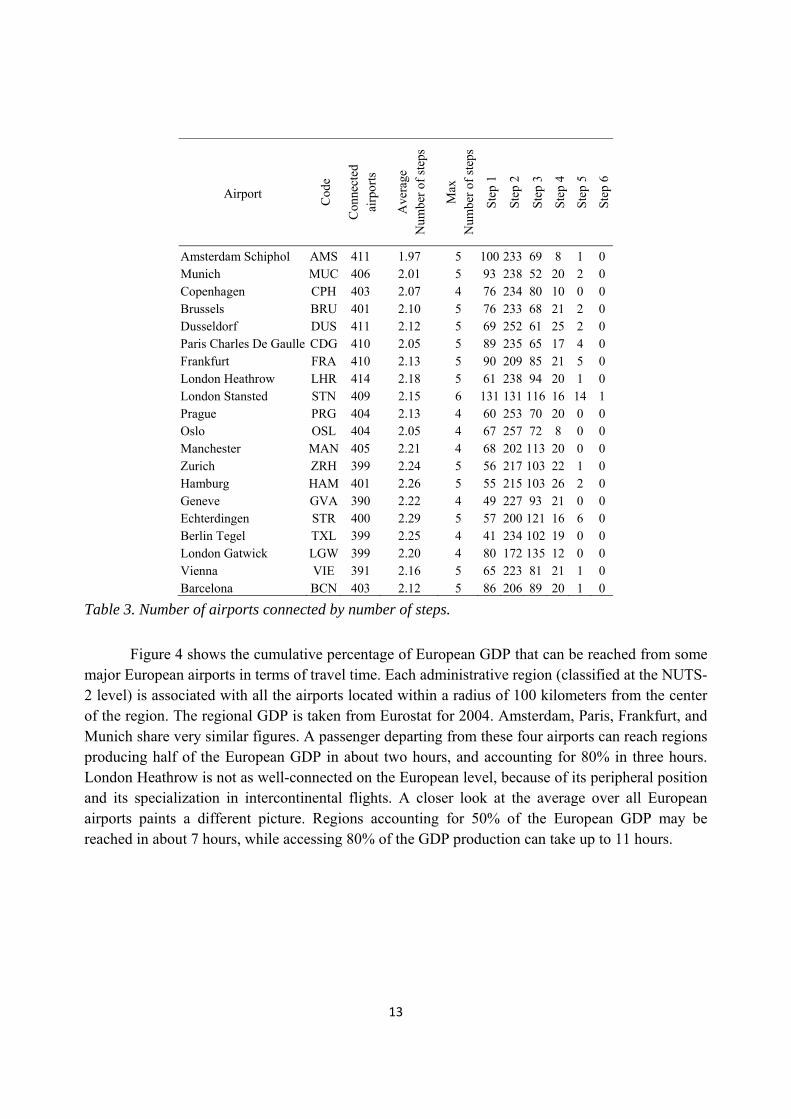
Table 2. Best connected European airports, ranked by their average minimum travel times. Table 3 shows some characteristics of the minimum travel time paths for the same set of airports. The average number of steps required to travel from Amsterdam-Schiphol to its 411 connected airports is less than two. “Step 1” shows the number of European airports that are directly linked to the airport. Subsequent columns show the number of destinations linked by two steps, three steps, and so on. London Stansted has the highest number of direct connections, 131 but is ranked only 9th in the classification. For most of these airports, a higher number of destinations can be reached by a two-step trip because of the high degree of integration among the major airports: Schiphol, for example, has directly connections to a large number of primary airports. Stansted again stands out as a noticeable exception, as most of its direct links are to relatively minor airports. For Stansted, the number of airports that can be reached in two steps is similar to the number of direct connections. These figures seem to reflect the important and well-known differences between traditional hub-and-spoke airports and low-cost airports.
13
Airport Cod
e
Con
nect
ed
airp
orts
Ave
rage
N
umbe
r of s
teps
Max
N
umbe
r of s
teps
Step
1
Step
2
Step
3
Step
4
Step
5
Step
6
Amsterdam Schiphol AMS 411 1.97 5 100 233 69 8 1 0 Munich MUC 406 2.01 5 93 238 52 20 2 0 Copenhagen CPH 403 2.07 4 76 234 80 10 0 0 Brussels BRU 401 2.10 5 76 233 68 21 2 0 Dusseldorf DUS 411 2.12 5 69 252 61 25 2 0 Paris Charles De Gaulle CDG 410 2.05 5 89 235 65 17 4 0 Frankfurt FRA 410 2.13 5 90 209 85 21 5 0 London Heathrow LHR 414 2.18 5 61 238 94 20 1 0 London Stansted STN 409 2.15 6 131 131 116 16 14 1 Prague PRG 404 2.13 4 60 253 70 20 0 0 Oslo OSL 404 2.05 4 67 257 72 8 0 0 Manchester MAN 405 2.21 4 68 202 113 20 0 0 Zurich ZRH 399 2.24 5 56 217 103 22 1 0 Hamburg HAM 401 2.26 5 55 215 103 26 2 0 Geneve GVA 390 2.22 4 49 227 93 21 0 0 Echterdingen STR 400 2.29 5 57 200 121 16 6 0 Berlin Tegel TXL 399 2.25 4 41 234 102 19 0 0 London Gatwick LGW 399 2.20 4 80 172 135 12 0 0 Vienna VIE 391 2.16 5 65 223 81 21 1 0 Barcelona BCN 403 2.12 5 86 206 89 20 1 0
Table 3. Number of airports connected by number of steps. Figure 4 shows the cumulative percentage of European GDP that can be reached from some major European airports in terms of travel time. Each administrative region (classified at the NUTS-2 level) is associated with all the airports located within a radius of 100 kilometers from the center of the region. The regional GDP is taken from Eurostat for 2004. Amsterdam, Paris, Frankfurt, and Munich share very similar figures. A passenger departing from these four airports can reach regions producing half of the European GDP in about two hours, and accounting for 80% in three hours. London Heathrow is not as well-connected on the European level, because of its peripheral position and its specialization in intercontinental flights. A closer look at the average over all European airports paints a different picture. Regions accounting for 50% of the European GDP may be reached in about 7 hours, while accessing 80% of the GDP production can take up to 11 hours.

14
0%
20%
40%
60%
80%
100%
0 2 4 6 8 10 12 14 16
Cumulated
% of Europe
an GDP
Travel time (hours)
Frankfurt International London Heathrow
Paris Charles De Gaulle Munich Franz Josef Strauss
Amsterdam‐Schiphol Madrid Barajas
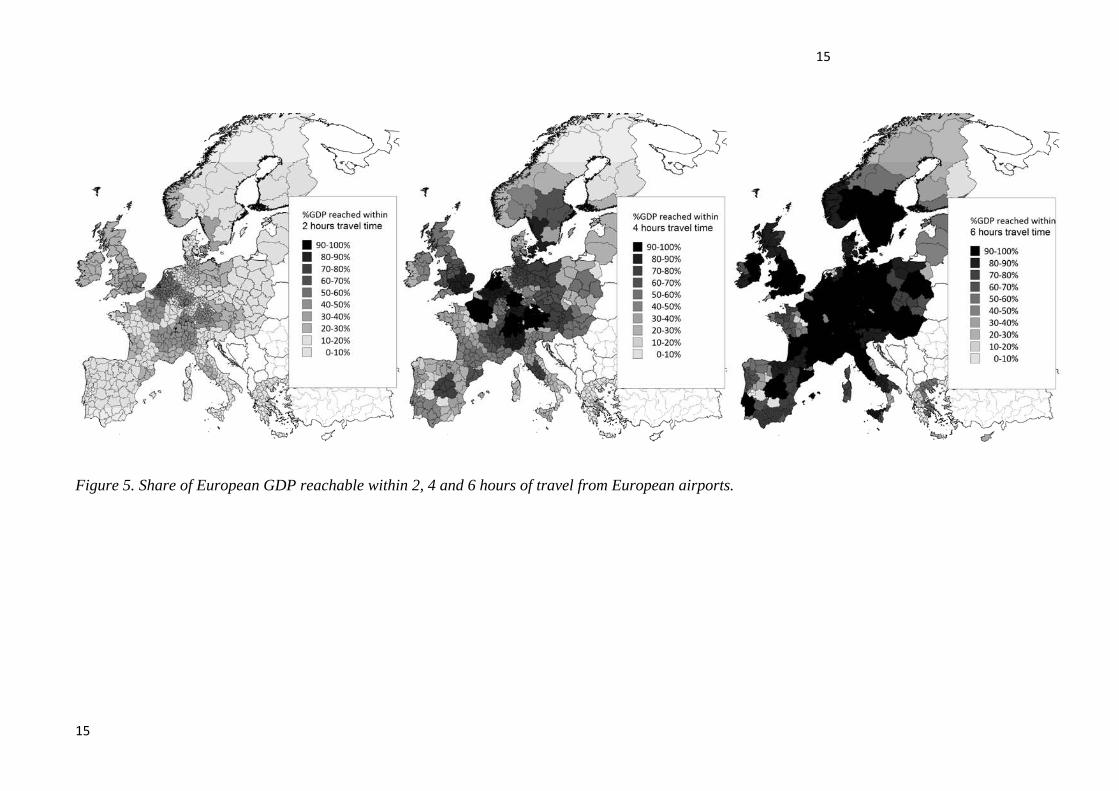
All airports Figure 4. Cumulated percentages of European GDP reached by departing from the main European airports at 9:00. Figure 5 offers maps of Europe giving the percentage of GDP that can be reached from each region within 2, 4 and 6 hours of travel. Dark zones represent the most connected areas, whereas lighter zones are the least connected. Looking at the 2-hour map, we see that there are highly connected areas centered on London and Paris, as well as some regions of Germany, eastern France, Switzerland, and northern Italy. As we progress from the 2-hour graph to the 6-hour graph, we see these zones darken and expand to encompass nearly all of central Europe. However, even after 6 hours of travel some areas in Scandinavia, Spain, Greece, and France are still connected to less than 30% of the European GDP. We now look at how much of this connectivity remains unexploited by the existing alliance system (Table 4.) The destinations reachable in one day from any given airport are about 400. If a passenger limits travel to one of the three main alliances, however, this number decreases to between 100 and 150. The Star alliance has the greatest number of available destinations from the 20 best-connected European airports. The average minimum travel times and best starting times are computed again for these networks. The main bases of the three alliances can be easily identified: London Heathrow for One World, Paris Charles De Gaulle for the SkyTeam, and Frankfurt for the Star Alliance.
15
15
Figure 5. Share of European GDP reachable within 2, 4 and 6 hours of travel from European airports.
16
One World SkyTeam Star Low-cost
Airport
Ave
rage
min
imum
Tr
avel
tim
e (m
in)
Con
nect
ed a
irpor
ts
Opt
imal
D
epar
ture
tim
e A
vera
ge m
inim
um
Trav
el ti
me
(min
)
Con
nect
ed a
irpor
ts
Opt
imal
D
epar
ture
tim
e A
vera
ge m
inim
um
Trav
el ti
me
(min
)
Con
nect
ed a
irpor
ts
Opt
imal
D
epar
ture
tim
e A
vera
ge m
inim
um
Trav
el ti
me
(min
)
Con
nect
ed a
irpor
ts
Opt
imal
D
epar
ture
tim
e
Amsterdam Schiphol 337 125 11.31 207 132 13.46 289 155 13.11 403 200 10.13Munich 433 120 11.04 288 130 12.11 229 157 12.50 394 186 11.11Copenhagen 423 109 12.46 314 129 11.49 242 154 13.05 421 171 10.36Brussels 334 120 12.14 297 130 11.47 284 156 13.07 458 160 11.07Dusseldorf 380 121 11.37 288 130 12.29 261 157 11.40 348 202 11.20Paris Charles De Gaulle 355 118 12.36 192 132 13.51 307 151 12.53 543 197 7.53Frankfurt 372 122 12.14 279 130 13.24 205 157 12.28 514 177 9.05London Heathrow 252 127 13.02 301 128 12.56 287 156 13.02 London Stansted 634 115 9.50 246 204 12.40Prague 453 109 11.38 236 130 13.40 317 154 12.23 421 145 11.24Oslo 467 110 11.02 388 128 11.28 275 157 11.56 460 153 10.30Manchester 292 126 12.33 321 129 12.30 338 149 11.45 348 188 12.03Zurich 362 116 12.36 294 130 11.47 254 158 12.38 459 183 10.03Hamburg 457 118 10.50 333 128 12.53 273 157 11.38 402 166 11.26Geneve 357 122 12.11 293 129 12.45 311 155 11.27 453 184 9.43Echterdingen 477 118 9.48 286 130 12.16 294 157 11.38 423 197 9.45Berlin Tegel 432 120 10.21 323 129 11.13 288 155 11.52 364 199 10.50London Gatwick 293 133 11.55 538 117 11.49 608 138 11.11 379 152 13.05Vienna 458 109 11.35 340 129 11.57 261 157 13.12 540 171 9.57Barcelona 280 121 13.02 305 130 11.44 317 154 11.48 429 189 10.32
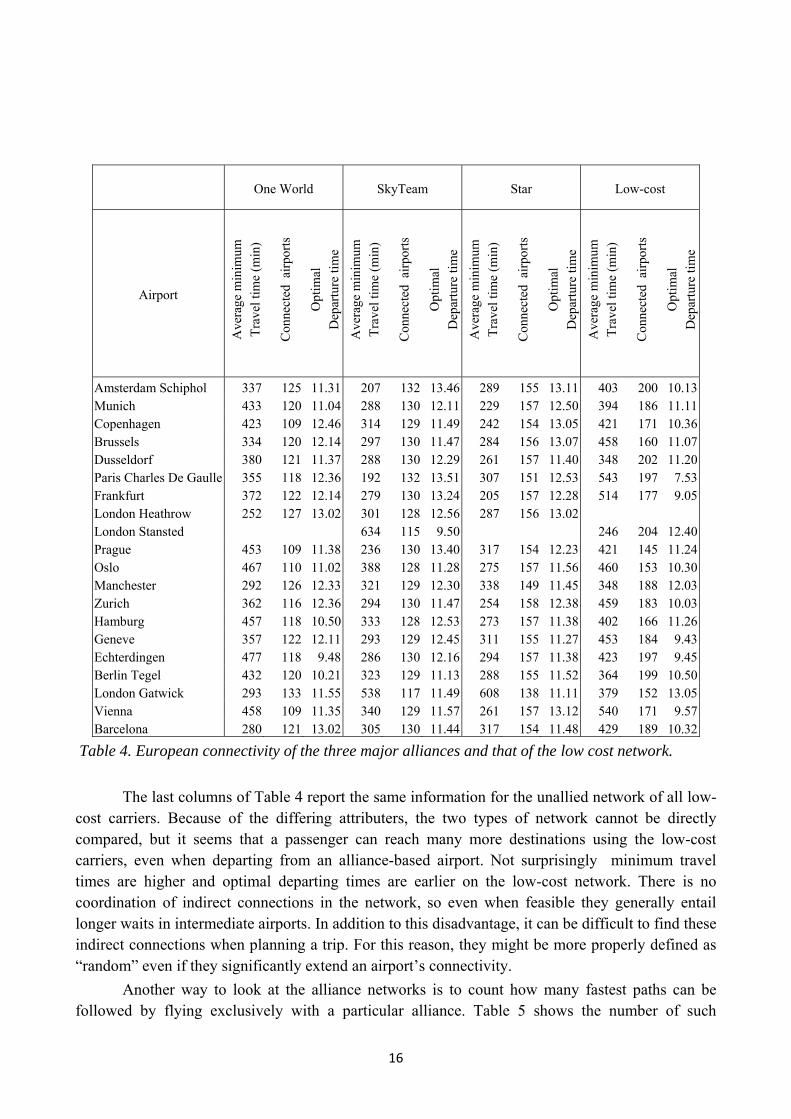
Table 4. European connectivity of the three major alliances and that of the low cost network. The last columns of Table 4 report the same information for the unallied network of all low-cost carriers. Because of the differing attributers, the two types of network cannot be directly compared, but it seems that a passenger can reach many more destinations using the low-cost carriers, even when departing from an alliance-based airport. Not surprisingly minimum travel times are higher and optimal departing times are earlier on the low-cost network. There is no coordination of indirect connections in the network, so even when feasible they generally entail longer waits in intermediate airports. In addition to this disadvantage, it can be difficult to find these indirect connections when planning a trip. For this reason, they might be more properly defined as “random” even if they significantly extend an airport’s connectivity. Another way to look at the alliance networks is to count how many fastest paths can be followed by flying exclusively with a particular alliance. Table 5 shows the number of such
17
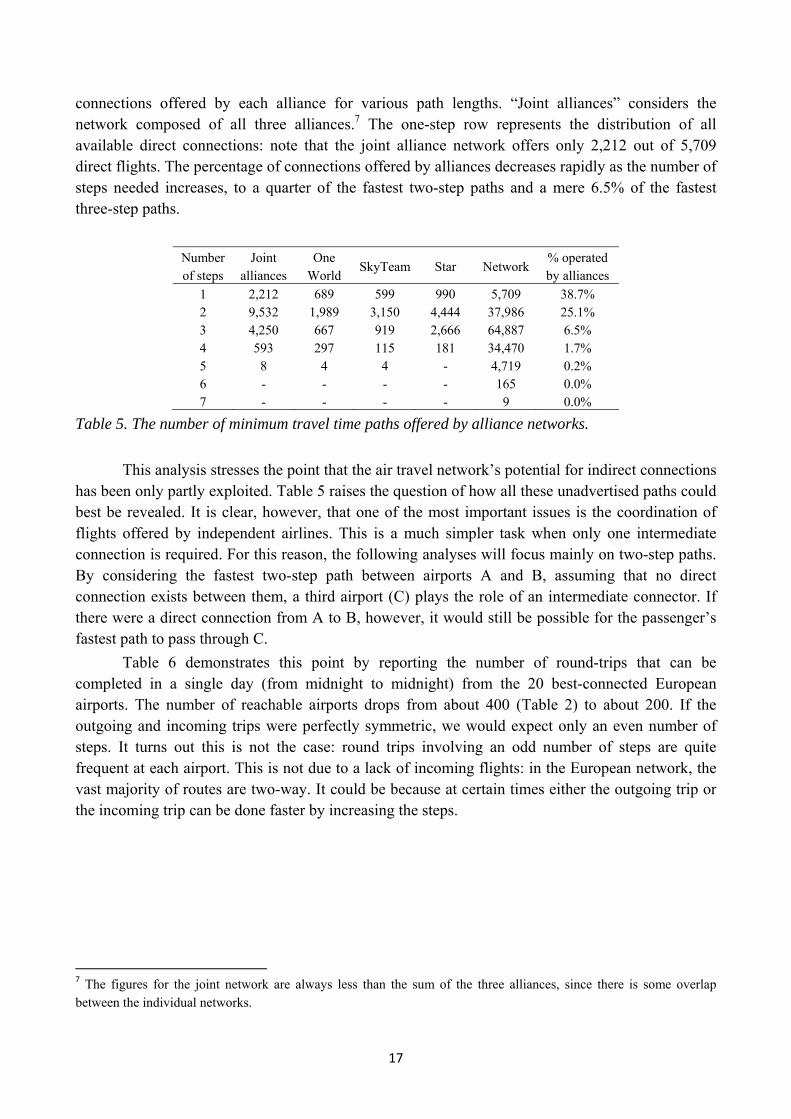
connections offered by each alliance for various path lengths. “Joint alliances” considers the network composed of all three alliances.7 The one-step row represents the distribution of all available direct connections: note that the joint alliance network offers only 2,212 out of 5,709 direct flights. The percentage of connections offered by alliances decreases rapidly as the number of steps needed increases, to a quarter of the fastest two-step paths and a mere 6.5% of the fastest three-step paths.
Number of steps
Joint alliances
One World
SkyTeam Star Network % operated by alliances
1 2,212 689 599 990 5,709 38.7% 2 9,532 1,989 3,150 4,444 37,986 25.1% 3 4,250 667 919 2,666 64,887 6.5% 4 593 297 115 181 34,470 1.7% 5 8 4 4 - 4,719 0.2% 6 - - - - 165 0.0% 7 - - - - 9 0.0%
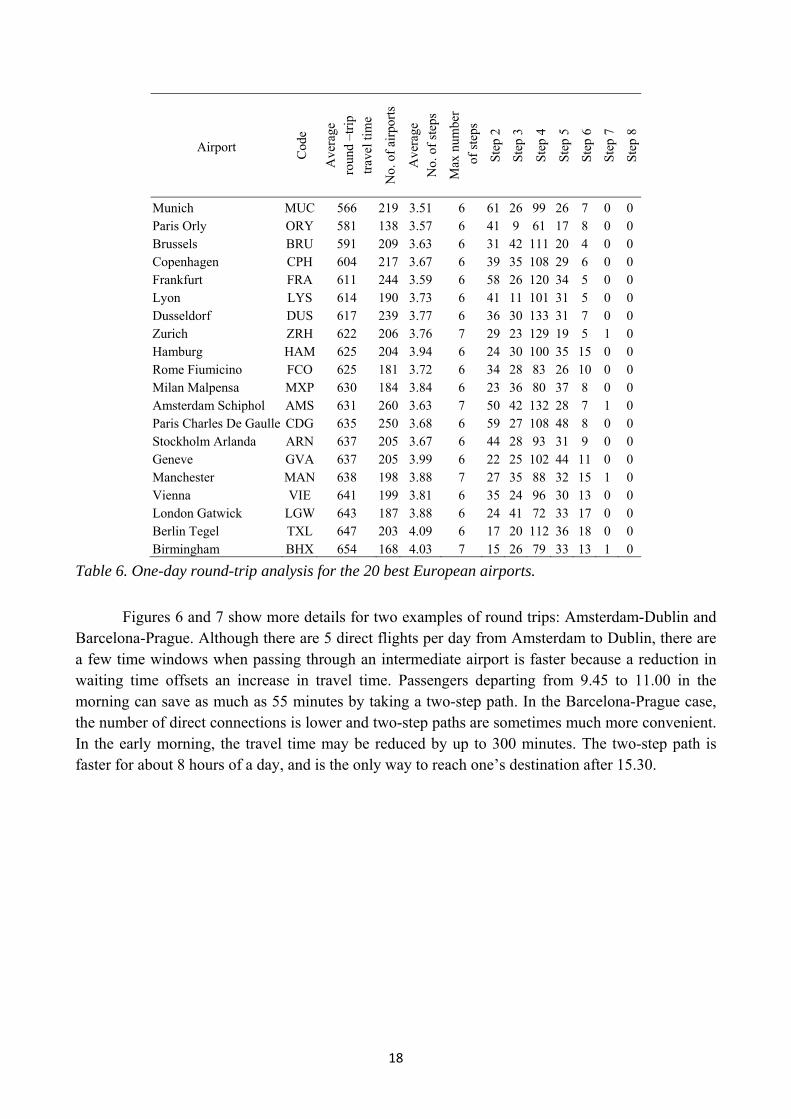
Table 5. The number of minimum travel time paths offered by alliance networks. This analysis stresses the point that the air travel network’s potential for indirect connections has been only partly exploited. Table 5 raises the question of how all these unadvertised paths could best be revealed. It is clear, however, that one of the most important issues is the coordination of flights offered by independent airlines. This is a much simpler task when only one intermediate connection is required. For this reason, the following analyses will focus mainly on two-step paths. By considering the fastest two-step path between airports A and B, assuming that no direct connection exists between them, a third airport (C) plays the role of an intermediate connector. If there were a direct connection from A to B, however, it would still be possible for the passenger’s fastest path to pass through C. Table 6 demonstrates this point by reporting the number of round-trips that can be completed in a single day (from midnight to midnight) from the 20 best-connected European airports. The number of reachable airports drops from about 400 (Table 2) to about 200. If the outgoing and incoming trips were perfectly symmetric, we would expect only an even number of steps. It turns out this is not the case: round trips involving an odd number of steps are quite frequent at each airport. This is not due to a lack of incoming flights: in the European network, the vast majority of routes are two-way. It could be because at certain times either the outgoing trip or the incoming trip can be done faster by increasing the steps.
7 The figures for the joint network are always less than the sum of the three alliances, since there is some overlap between the individual networks.
18
Airport Cod
e
Ave
rage
ro
und
–trip
tra
vel t
ime
No.
of a
irpor
ts
Ave
rage
N
o. o
f ste
ps
Max
num
ber
of s
teps
Step
2
Step
3
Step
4
Step
5
Step
6
Step
7
Step
8
Munich MUC 566 219 3.51 6 61 26 99 26 7 0 0 Paris Orly ORY 581 138 3.57 6 41 9 61 17 8 0 0 Brussels BRU 591 209 3.63 6 31 42 111 20 4 0 0 Copenhagen CPH 604 217 3.67 6 39 35 108 29 6 0 0 Frankfurt FRA 611 244 3.59 6 58 26 120 34 5 0 0 Lyon LYS 614 190 3.73 6 41 11 101 31 5 0 0 Dusseldorf DUS 617 239 3.77 6 36 30 133 31 7 0 0 Zurich ZRH 622 206 3.76 7 29 23 129 19 5 1 0 Hamburg HAM 625 204 3.94 6 24 30 100 35 15 0 0 Rome Fiumicino FCO 625 181 3.72 6 34 28 83 26 10 0 0 Milan Malpensa MXP 630 184 3.84 6 23 36 80 37 8 0 0 Amsterdam Schiphol AMS 631 260 3.63 7 50 42 132 28 7 1 0 Paris Charles De Gaulle CDG 635 250 3.68 6 59 27 108 48 8 0 0 Stockholm Arlanda ARN 637 205 3.67 6 44 28 93 31 9 0 0 Geneve GVA 637 205 3.99 6 22 25 102 44 11 0 0 Manchester MAN 638 198 3.88 7 27 35 88 32 15 1 0 Vienna VIE 641 199 3.81 6 35 24 96 30 13 0 0 London Gatwick LGW 643 187 3.88 6 24 41 72 33 17 0 0 Berlin Tegel TXL 647 203 4.09 6 17 20 112 36 18 0 0 Birmingham BHX 654 168 4.03 7 15 26 79 33 13 1 0
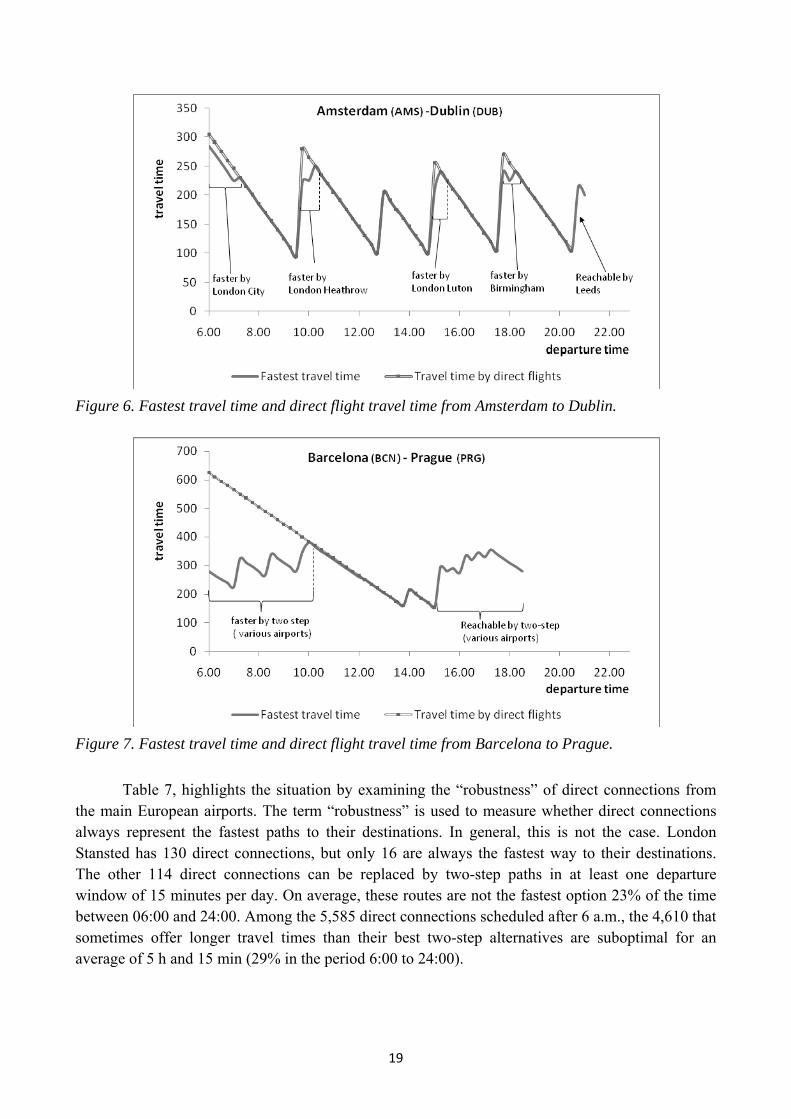
Table 6. One-day round-trip analysis for the 20 best European airports. Figures 6 and 7 show more details for two examples of round trips: Amsterdam-Dublin and Barcelona-Prague. Although there are 5 direct flights per day from Amsterdam to Dublin, there are a few time windows when passing through an intermediate airport is faster because a reduction in waiting time offsets an increase in travel time. Passengers departing from 9.45 to 11.00 in the morning can save as much as 55 minutes by taking a two-step path. In the Barcelona-Prague case, the number of direct connections is lower and two-step paths are sometimes much more convenient. In the early morning, the travel time may be reduced by up to 300 minutes. The two-step path is faster for about 8 hours of a day, and is the only way to reach one’s destination after 15.30.
19
Figure 6. Fastest travel time and direct flight travel time from Amsterdam to Dublin.
Figure 7. Fastest travel time and direct flight travel time from Barcelona to Prague. Table 7, highlights the situation by examining the “robustness” of direct connections from the main European airports. The term “robustness” is used to measure whether direct connections always represent the fastest paths to their destinations. In general, this is not the case. London Stansted has 130 direct connections, but only 16 are always the fastest way to their destinations. The other 114 direct connections can be replaced by two-step paths in at least one departure window of 15 minutes per day. On average, these routes are not the fastest option 23% of the time between 06:00 and 24:00. Among the 5,585 direct connections scheduled after 6 a.m., the 4,610 that sometimes offer longer travel times than their best two-step alternatives are suboptimal for an average of 5 h and 15 min (29% in the period 6:00 to 24:00).

20
Airport Code Num. of European
destination
Faster 2 steps
% time faster 2 steps
from 6:00 to 24:00 London Stansted STN 130 114 23% Amsterdam Schiphol AMS 97 85 25% Munich MUC 94 78 20% Dublin DUB 91 84 34% Paris Charles De Gaulle CDG 88 74 20% Frankfurt FRA 84 74 20% Barcelona BCN 83 69 28% London Gatwick LGW 80 73 26% Brussels BRU 77 70 30% Copenhagen CPH 76 61 24% Stockholm Arlanda ARN 74 40 20% Madrid MAD 73 60 25% Dusseldorf DUS 69 65 29% Rome Fiumicino FCO 67 52 24% Paris Orly ORY 66 40 18% Manchester MAN 65 59 33% Vienna VIE 64 56 28% Koeln/Bonn CGN 63 60 41% Milan Malpensa MXP 62 59 29% Oslo OSL 61 46 28% European network 5,585 4,610 29%
Table 7. The incidence of faster 2-step paths on routes where a direct flight exists. The 20 airports with the largest number of direct flights are considered. Table 5 reports the fastest path of the day, with no reference to a specific departure time. Although this analysis proves that indirect connections are only partially exploited by alliance networks, it fails to draw attention to the role of intermediate airports: i.e., those who would draw the most benefit from this potential. To resolve this, the betweenness of airports is recalculated considering each departure time after 6 a.m. The time-based shortest path algorithm offers information on the connecting airport and the time of each intermediate connection.8 Table 8 shows the average number of fastest paths passing through each airport per hour and compares the European network to the joint alliance network for both all connections and two-step paths.
8 This measure of betweenness depends on both the time at which an interconnection occurs (the connecting time) and the time a passenger arrives at the departure airport (the starting time). In other words, it is a function of two variables. In the following tables, however, we only report how betweenness is related to the connecting time. For each intermediate airport and connecting time, we take this value as the maximum betweenness with respect to all possible starting times.
21
Betweenness Two-step betweenness Temporal coordination
Airport
Cod
e
All
allia
nces
(A
)
Net
wor
k (B
)
Peak
/ave
rage
Peak
hou
r
A/B
All
allia
nces
(A
)
Net
wor
k (B
)
A/B
All
allia
nces
(A
)
Net
wor
k (B
)
A/B
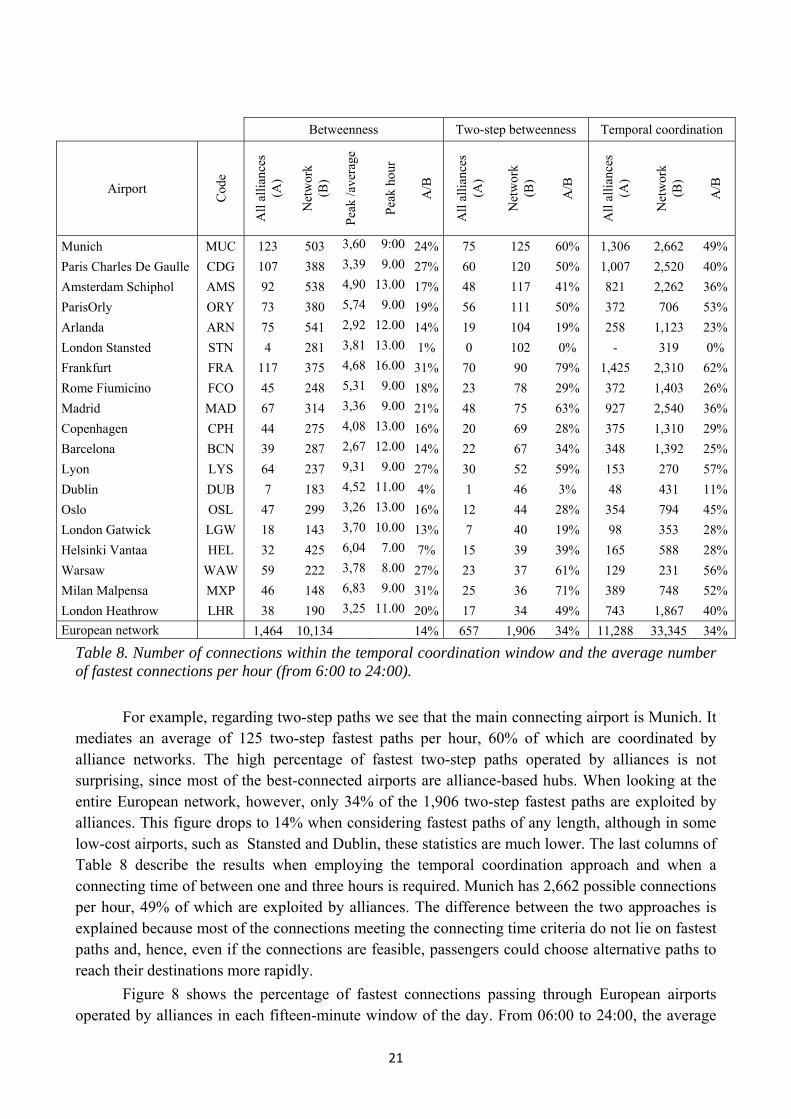
Munich MUC 123 503 3,60 9:00 24% 75 125 60% 1,306 2,662 49% Paris Charles De Gaulle CDG 107 388 3,39 9.00 27% 60 120 50% 1,007 2,520 40% Amsterdam Schiphol AMS 92 538 4,90 13.00 17% 48 117 41% 821 2,262 36% ParisOrly ORY 73 380 5,74 9.00 19% 56 111 50% 372 706 53% Arlanda ARN 75 541 2,92 12.00 14% 19 104 19% 258 1,123 23% London Stansted STN 4 281 3,81 13.00 1% 0 102 0% - 319 0% Frankfurt FRA 117 375 4,68 16.00 31% 70 90 79% 1,425 2,310 62% Rome Fiumicino FCO 45 248 5,31 9.00 18% 23 78 29% 372 1,403 26% Madrid MAD 67 314 3,36 9.00 21% 48 75 63% 927 2,540 36% Copenhagen CPH 44 275 4,08 13.00 16% 20 69 28% 375 1,310 29% Barcelona BCN 39 287 2,67 12.00 14% 22 67 34% 348 1,392 25% Lyon LYS 64 237 9,31 9.00 27% 30 52 59% 153 270 57% Dublin DUB 7 183 4,52 11.00 4% 1 46 3% 48 431 11% Oslo OSL 47 299 3,26 13.00 16% 12 44 28% 354 794 45% London Gatwick LGW 18 143 3,70 10.00 13% 7 40 19% 98 353 28% Helsinki Vantaa HEL 32 425 6,04 7.00 7% 15 39 39% 165 588 28% Warsaw WAW 59 222 3,78 8.00 27% 23 37 61% 129 231 56% Milan Malpensa MXP 46 148 6,83 9.00 31% 25 36 71% 389 748 52% London Heathrow LHR 38 190 3,25 11.00 20% 17 34 49% 743 1,867 40% European network 1,464 10,134 14% 657 1,906 34% 11,288 33,345 34%
Table 8. Number of connections within the temporal coordination window and the average number of fastest connections per hour (from 6:00 to 24:00). For example, regarding two-step paths we see that the main connecting airport is Munich. It mediates an average of 125 two-step fastest paths per hour, 60% of which are coordinated by alliance networks. The high percentage of fastest two-step paths operated by alliances is not surprising, since most of the best-connected airports are alliance-based hubs. When looking at the entire European network, however, only 34% of the 1,906 two-step fastest paths are exploited by alliances. This figure drops to 14% when considering fastest paths of any length, although in some low-cost airports, such as Stansted and Dublin, these statistics are much lower. The last columns of Table 8 describe the results when employing the temporal coordination approach and when a connecting time of between one and three hours is required. Munich has 2,662 possible connections per hour, 49% of which are exploited by alliances. The difference between the two approaches is explained because most of the connections meeting the connecting time criteria do not lie on fastest paths and, hence, even if the connections are feasible, passengers could choose alternative paths to reach their destinations more rapidly. Figure 8 shows the percentage of fastest connections passing through European airports operated by alliances in each fifteen-minute window of the day. From 06:00 to 24:00, the average

22
level is 34% for two-step paths. There are peaks in the statistic at 8:00-9:00, 13:00-15:00 and 20:00-22:00.
‐10,0%
0,0%
10,0%
20,0%
30,0%
40,0%
50,0%
60,0%
70,0%
80,0%
4.00 8.00 12.00 16.00 20.00 0.00
% betweenness % betweenness 2 steps
Figure 8. Intraday percentage of fastest connections passing through European airports operated by alliances by both any-length paths and two-step paths. In conclusion, it is certainly possible to say that European indirect connections are only partially operated by alliances. On average, two-thirds of the possible two-step fastest connections have not yet been exploited. Single airports are more likely to benefit from this opportunity, which if properly exploited could increase their number of passengers and improve their performance.9 5. Conclusion
Indirect connectivity represents a valuable and intangible asset for airports. Its precise significance depends on the airport’s direct flights and its position within the network. Those airports lying on many fastest paths should explore this possibility of increasing their traffic. With reference to intra-European traffic, we have seen that this resource has been only partly exploited by the world’s three major alliances. Acknowledgements
9 In practice, transferring from one alliance to another may be expensive for passengers. Low‐cost carriers, however, tend to be more punctual than traditional carriers. Even if low‐cost carriers do not guarantee connectivity, this fact increases the probability of reaching one’s connecting flight. This may provide passengers with sufficient incentive to transfer from an alliance carrier to a low‐cost carrier, or from one low‐cost carrier to another.
23
We wish to thank participants at the ATRS 2007 conference in Berkeley for their useful comments and ideas. In particular, we thank Guillaume Burghouwt and two anonymous referees for their useful comments. The authors remain responsible for any remaining errors and inaccuracies. We gratefully acknowledge the financial contribution of the Italian Minister of University and Research through program number 2005099094, year 2005. References
Alamdari, F., Iatrou, K., 2005. The empirical analysis of the impact of alliances on airline
operations. Journal of Air Transport Management 11, 127-134. Albert, R., Barabási, A., 2002. Statistical mechanics of complex networks. Reviews of Modern
Physics 74, 47-97. Bagler, G., 2004. Analysis of the Airport Network of India as a complex weighted network.
arXiv:cond-mat/0409773. Borenstein, S., 1989. Hubs and high fares: dominance and market power in the U.S. airline
industry. Rand Journal of Economics 20, 344-65. Burghouwt, G., de Wit, J., 2005. Temporal configurations of European airline networks. Journal of
Air Transport Management 11, 185-198. Burghouwt , G., 2007. Airline Network Developments in Europe and its Implications for Airport
Planning, Ashgate, Aldershot. Caves, D.W., Christenses, L.R., Tretheway, M.W., 1984. Economics of density versus economies
of scale: why trunks and local service airline costs differ. Rand Journal of Economics 15, 471-489.
Danesi, A., 2006. Measuring airline hub timetable co-ordination connectivity: definition of a new index and to a sample of European hubs European Transport. Trasporti Europei 34, 54-74.
Dennis, N., 1994. Airline hub operations in Europe. Journal of Transport Geography 2, 219-233. Dennis, N., 2005. Industry consolidation and future airline network structures in Europe. Journal of
Air Transport Management 11, 175-183. Doganis, R., 1966. Traffic forecasting and the gravity model. Flight International, September, 547. Doganis, R., 2001. The Airline Business in the Twenty-first Century. London: Routledge. European Commission, 2001. European Transport Policy for 2010 - time to decide. European
Commission White Paper, Brussels. Forsyth, P., 2007. The impacts of emerging aviation trends on airport infrastructure. Journal of Air
Transport Management 13, 45-52. Franke, M., 2004. Competition between network carriers and low-cost carriers: retreat, battle of
breakthrough to a new level of efficiency? Journal of Air Transport Management 10, 15-21. Freeman, L.C., 1977. A Set of Measures of Centrality Based on Betweenness. Sociometry 40, 35-
41. Goetz, A., Sutton, C. J., 1997. The Geography of Deregulation in the US Airline Industry. Annals
of the Association of American Geographers 87, 238-263. Guida, M., Funaro M., 2007. Topology of the Italian airport network: A scale-free small-world
network with a fractal structure? Chaos, Solitons and Fractals 31, 527–536. Guimerà, R., Mossa S.,Turtschi, A., Amaral, L., 2005, The worldwide air transportation network:
Anomalous centrality, community structure, and cities' global roles. PNAS Proceedings of the National Academy of Sciences of the United States of America 102, 7794-7799.
Guimerà, R., Sales-Pardo, M., Amaral, L., 2006. Classes of complex networks defined by role-to-role connectivity profiles. Nature physics 3, 63-69.
Holmes, B.J, Scott, J., 2004. Transportation Network Topologies. 4th ICNS Conference, Fairfax . Li, W., Cai, X., 2004. Statistical Analysis of Airport Network of China, Physical Review E 69, 1-5.
24
Milgram, S., 1977. The small world problem, in Milgrim, S and Sabini, J, (Eds), The Individual in a Social World: Essays and Experiments, Reading, Addison-Wesley.
Miller-Hooks, E., Patterson, S.S., 2004. On Solving Quickest Time Problems in Time-Dependent Dynamic Networks. Journal of Mathematical Modelling and Algorithms 3, 39–71.
Oum, T.H., Zhang, H.O., Zhang, A., Zhang,Y., 1995. Airline network rivalry. The Canadian Journal of Economics, 836-857.
Reynolds-Feighan, A.J., 1998. The impact of US airline deregulation on airport traffic patterns Geographical Analysis 30, 234-253.
Reynolds-Feighan, A.J., 2001. Traffic distribution in low-cost and full service carrier networks the US air transportation market. Journal of Air Transport Management 7, 265-275.
Reynolds-Feighan, A.J., McLay P. 2006. Accessibility and attractiveness of European airports: A simple small community perspective. Journal of Air Transport Management 12, 313-323.
Starkie, D., 2007. The dilemma of slot concentration at network hubs. In: How to make slot markets work. Ed. by A. Czerny, P. Forsyth, D. Gillen, H-M. Nieneier, London:Ashgate Aldershot.
Stoneham, A.K.M., 1977. The small-world problem in a spatial context. Environment and Planning A 9, 185-195.
Veldhuis, J., 1997. The competitive position of airline networks. Journal of Air Transport Management 3, 181-188.
Watts, D.J., Strogatz, S.H., 1998. Collective dynamics of small-world networks. Nature 363, 202-204.
Related Documents