1 Connectivity in the Yeast Cell Cycle Transcription Network: Inferences from Neural Networks Christopher E. Hart 1,2 , Eric Mjolsness 3,5 , Barbara J. Wold 2,4,5 1 Current Address: Department of Molecular, Cellular, and Developmental Biology, Yale University, New Haven, CT 06405 2 Division of Biology, California Institute of Technology, Pasadena, CA 91125 3 University of California, Irvine, Institute for Genomics and Bioinformatics, School of Information & Computer Science, Irvine, CA 92697, 4 Corresponding Author 5 Caltech Beckman Institute, Biological Network Modelling Center

Welcome message from author
This document is posted to help you gain knowledge. Please leave a comment to let me know what you think about it! Share it to your friends and learn new things together.
Transcript

1
Connectivity in the Yeast Cell Cycle Transcription Network:Inferences from Neural Networks
Christopher E. Hart1,2, Eric Mjolsness3,5, Barbara J. Wold2,4,5
1 Current Address: Department of Molecular, Cellular, and Developmental Biology, Yale University,New Haven, CT 06405
2 Division of Biology, California Institute of Technology, Pasadena, CA 91125
3 University of California, Irvine, Institute for Genomics and Bioinformatics, School of Information& Computer Science, Irvine, CA 92697,
4 Corresponding Author
5 Caltech Beckman Institute, Biological Network Modelling Center

2
Abstract
Background: A current challenge is to develop computational approaches to infer gene network
regulatory relationships based on multiple types of large-scale functional genomic data.
Methodology/primary findings: We find that single-layer feed-forward Artificial Neural Net-
work (ANN) models can effectively discover gene network structure by integrating global in vivo
protein:DNA interaction data (ChIP/Array) with genome-wide microarray RNA data. We test this on
the yeast cell cycle transcription network, which is composed of several hundred genes with phase
specific RNA outputs. These ANNs were robust to noise in data and to a variety of perturbations. They
reliably identified and ranked 10 of 12 known major cell cycle factors at the top of a set of 204, based
on a sum-of-squared weights metric. Comparative analysis of motif occurrences among multiple yeast
species independently confirmed relationships inferred from ANN weights analysis.
Conclusions/significance:ANN models can capitalize on properties of biological gene networks
that other kinds of models do not. ANNs naturally take advantage of patterns of absence, as well as
presence, of factor binding associated with specific expression output; they are easily subjected to in
silico "mutation" to uncover biological redundancies; and they can use the full range of factor binding
values. A prominent feature of cell cycle ANNs suggested an analogous property might exist in the bi-
ological network. This postulated "network-local discrimination" occurs when regulatory connections
(here between MBF and target genes) are explicitly disfavored in one network module (G2), relative
to others and to the class of genes outside the mitotic network. If correct, this predicts that MBF mo-
tifs will be significantly depleted from the discriminated class and that the discrimination will persist
through evolution. Analysis of distantly related S. pombe confirmed this, suggesting that network-local
discrimination is real and complements well–known enrichment of MBF sites in G1 class genes.

1 INTRODUCTION 3
1 Introduction
Hundreds of yeast RNAs are expressed in a cell cycle dependent, oscillating manner. In both budding
yeast and fission yeast, these RNAs cluster into four or five groups, each corresponding roughly to a
phase of the cycle (Spellman et al., 1998; Cho et al., 1998; Rustici et al., 2004; Peng et al., 2004; Oliva
et al., 2005; Zhang, 1999; Breeden, 2000; Breeden, 2003; Hart et al., 2005). Large sets of phase specific
RNAs are also seen in animal and plant cells (Cho et al., 2001; Whitfield et al., 2002; Menges et al.,
2003), arguing that an extensive cycling transcription network is a fundamental property of Eukaryotes.
The complete composition and connectivity of the cell cycle transcription network is not yet known for
any eukaryote, and many components may vary over long evolutionary distances (Rustici et al., 2004;
Peng et al., 2004; Oliva et al., 2005; Bahler, 2005), but some specific regulators (e.g. MBF of yeast and
the related E2Fs of plants and animals) are paneukaryotic, as are some of their direct target genes (DNA
polymerase, ribonucleotide reductase). Coupled with experimental accessibility, this conservation of
core components and connections, make the yeast mitotic cycle an especially good test case for studies
of network structure, function and evolution.
To expose the underlying logic of this transcription network, a starting point is to decompose the
cell cycle into its component phases (i.e. G1, S, G2, M) and link the pertinent regulatory factors with
their immediate regulatory output patterns, here in the form of phasic RNA expression. One way to do
this is to integrate multiple genome-wide data types that impinge on connection inference, including
factor:DNA interaction data from chromatin IP (ChIP) studies, RNA expression patterns, and compar-
ative genomic analysis. This is appealing partly because these assays are genome-comprehensive and
hypothesis independent, so they can, in principle, reveal regulatory relationships not detected by clas-
sical genetics. However, the scale and complexity of these datasets require new methods to discover
and rank candidate connections, while also accommodating considerable experimental and biological

1 INTRODUCTION 4
noise (e.g. (Wang et al., 2002; Bar-Joseph et al., 2003; Luscombe et al., 2004; M. A. Beer, 2004; Lee
et al., 2004; Gao et al., 2004; Sun et al., 2006)).
Microarray RNA expression studies in budding yeast have identified 230 to 1100 cycling genes, the
upper number encompassing nearly a fifth of all yeast genes ((Spellman et al., 1998; Cho et al., 1998;
Breeden, 2003; de Lichtenberg et al., 2005)). Specifics of experimental design and methods of analysis
contribute to the wide range in the number of genes designated as cycling, but there is agreement on a
core set of nearly 200. Yeast molecular genetic studies have established that transcriptional regulation
is critical for controlling phase specific RNA expression for some of these genes, though this does
not exclude modulation and additional contributions from post-transcriptional mechanisms. About a
dozen Saccharomyces transcription factors have been causally associated with direct control of cell
cycle expression patterns, including repressors, activators, co-regulators, and regulators that assume
both repressing and activating roles, depending on context: Ace2, Fkh1, Fkh2, Mbp1, Mcm1, Ndd1,
Stb1, Swi4, Swi5, Swi6, Yhp1, and Yox1.
These can serve as internal control true-positive connections. Conversely, a majority of yeast genes
have no cell cycle oscillatory expression, and true negatives can be drawn from this group. A practical
consideration is how well the behavior of a network is represented in critical datasets. In this case, cells
in all cell cycle phases are present in the mixed phase, exponentially growing yeast cultures used for the
largest and most complete set of global protein:DNA interaction (ChIP/array) data so far assembled in
functional genomics ((Harbison et al., 2004)). These data are further supported by three smaller studies
of the same basic design (Horak et al., 2002; Iyer et al., 2001; Lee et al., 2002). This sets the cell cycle
apart from many other transcription networks whose multiple states are either partly or entirely absent
from the global ChIP data. Equally important are RNA expression data that finely parse the kinetic
trajectory for every gene across the cycle of budding yeast (Cho et al., 1998; Spellman et al., 1998)

1 INTRODUCTION 5
and also in the distantly related fission yeast,�S. pombe (Rustici et al., 2004; Peng et al., 2004; Oliva
et al., 2005). This combination of highly time-resolved RNA expression data and phase-mixed (but
nevertheless inclusive) ChIP/array data can be used to assign protein:DNA interactions to explicit cell
cycle phases, while evolutionary comparison withS. pombehighlight exceptionally conserved and
presumably fundamental network properties.
Many prior efforts to infer yeast transcription network connections from genome-wide data (Bar-
Joseph et al., 2003; Segal et al., 2003b; Tsai et al., 2005; Luscombe et al., 2004; M. A. Beer, 2004))
were designed to address the global problem of finding connection patterns across the entire yeast tran-
scriptiome by using very large and diverse collections of yeast RNA, DNA and/or chromatin immuno-
precipitation data. The present work focuses instead on a single cellular process and its underlying
gene network, which represents a natural level of organization positioned between the single gene at
one extreme and the entire interlocking community of networks that govern the entire cell.
To model regulatory factor: target gene behavior, we adapt neural networks and use them to inte-
grate global expression and protein:DNA interaction data.
Artificial neural networks (ANNs) are structural computational models with a long history in pat-
tern recognition (Bishop, 1995). A general reason for thinking ANNs could be effective for this task
is that they have some natural similarities with transcription networks, including the ability to create
non-linear sparse interactions between transcriptional regulators and target genes. They have previ-
ously been applied previously to model relatively small gene circuits (Mjolsness et al., 1991; Weaver
et al., 1999; Vohradsky, 2001), though they have not, to our knowledge, been used for the problem
of inferring network structure by integrating large-scale data. We reasoned that a simple single layer
ANN would be well suited to capture and leverage two additional known characteristics of eukaryotic
gene networks. First, factor bindingin vivo varies over a continuum of values, as reflected in ChIP

1 INTRODUCTION 6
data,in vivo footprinting, binding site numbers and affinity ranges, and site mutation analyses. These
quantitative differences can have biological significance to transcription output by affecting cooperativ-
ity, background "leaky expression" or the lack of it, and the temporal sequencing of gene induction as
factors become available or disappear. This is quite different from a world in which binding is reduced
to a simple two state, present/absent call. Neural networks are able to use the full range of binding
probabilities in the dataset. Second, ANNs can give weight and attention to structural features such as
the persistent absence of specific factors from particular target groups of genes. This “negative image”
information is not recovered and used by other methods applied to date ((Harbison et al., 2004; Bar-
Joseph et al., 2003; Sun et al., 2006; Workman et al., 2006)). The inherent ability of ANNs to use these
properties is a potential strength compared with algorithms that rest solely on positive evidence of fac-
tor:target binding or require discretization of binding measurements into a simplified bound/unbound
call.
ANNs have been most famously used in machine learning as "black boxes" to perform classification
tasks, in which the goal is to build a network based on a training dataset that will subsequently be used
to perform similar classifications on new data of similar structure. In these classical ANN applications,
the weights within the network are of no particular interest, as long as the trained network performs
the desired classification task successfully when extrapolating to new data. ANNs are used here in
a substantially different way, serving as structural models (Reinitz et al., 1995). Specifically, we use
simple feed-forward networks in which the results of interest are mainly in the weights and what they
suggest about the importance of individual transcription factors or groups of factors for specifying
particular expression outputs.
Here ANNs were trained to predict the RNA expression behavior of genes during a cdc28 synchro-
nized cell cycle, based solely on transcription factor binding pattern, as measured by ChIP/array for

2 RESULTS 7
204 yeast factors determined in an exponentially growing culture (Harbison et al., 2004). The resulting
ANN model is then interrogated to identify the most important regulator-to-target gene associations,
as reflected by ANN weights. Ten of the twelve major known transcriptional regulators of cell cycle
phase specific expression ranked at the very top of the 204-regulator list in the model. The cell cycle
ANNs were remarkably robust to a series of in silico “mutations”, in which binding data for a specific
factor was eliminated and a new family of ANN models were generated. Additional doubly and triply
"mutated" networks correctly identified epistasis relationships and redundancies in the biological net-
work. This approach was also applied to two additional, independent cell cycle expression studies to
illustrate generality across data platforms, and to probe how the networks might change under distinct
modes of cell synchronization.
Analysis of the weights matrices from the resulting models shows that the neural nets take ad-
vantage of information about specifically disfavored or disallowed connections between factors and
expression patterns, together with the expected positive connections (and weights) for other factors, to
assign genes to their correct expression outputs. This led us to ask if there is a corresponding bias in the
biological network against binding sites for specific factors in some expression families as suggested
by the ANN. We found that this is the case, in multiplesensu strictoyeast genomes relatively closely
related toS. cerevisiae, and also in the distantly related fission yeast,S. pombe. This appears to be a
deeply conserved network architecture property, even though very few specific orthologous genes are
involved.
2 Results
Classifier artificial neural networks (ANNs) were trained to predict membership in cell cycle phase
specific RNA clusters, based on global transcription factor binding data (figure 1). As expression input

2 RESULTS 8
data, these ANNs used time course microarray data (Cho et al., 1998) for 384 cycling genes that had
been grouped into five clusters by an expectation maximization (EM) algorithm (Hart et al., 2005).
As measured by receiver operator characteristic (ROC) analysis, these clusters are quantitatively well
separated from each other, with less than 10% overlap at their margins with any other clusters, except
that the S-phase cluster (EM3) was somewhat less well-separated from its kinetic neighbors, EM2 and
EM4 (Hart et al., 2005). The primary goal of the ANN modeling is to infer the set of regulatory connec-
tions that underlies each of the cell cycle phased expression groups. Note that a given cluster might be
composed of more than one regulatory subgroup; it need not be the case that all associated regulators
interact with all–or even most–of the genes in a cluster. ANNs were trained to assign expression cluster
membership for each gene based on 204 measured binding probabilities from ChIP/array experiments
(Harbison et al., 2004). To accommodate the scarcity of data, while minimizing effects of overtraining,
we generated an average-of-bests artificial neural network (aobANN) (Materials and Methods). As
anticipated, the aobANN classified input genes best, correctly assigning the expression class of 86%
of included cell cycle genes (figure 2). Individual best-of-ten networks, each trained on 80% of the
data and tested on the remaining 20% correctly assigned expression class membership for 50% of
the genes, with an accuracy range between 40% and 65%, where as only 27% of genes would be ex-
pected to be classified correctly if genes were classified by a random process (supplemental figure 1).
As shown in supplemental information (supplemental figure 4), a substantial fraction of genes (32%)
are always classified correctly by every ANN, another subset (28%) are never classified "correctly",
and the remaining fraction (40%) are intermediate. An examination of possible correlates of high or
low predictability, including absolute level of RNA expression and bidirectional versus unidirectional
orientation of the a gene relative to its upstream neighbor found no correlation except that the EM2
(late G1) class is enriched in highly predictable genes, while the EM5 (M phase expression peak) is

2 RESULTS 9
most impoverished (supplemental figure 4). The major conclusion from global statistics is that individ-
ual ANNs and the aobANN have developed weighting schemes that are effective in connecting factor
binding information from ChIP/array to RNA expression patterns, even in the presence of considerable
experimental noise that is a widely acknowledged property of the input datasets.
2.1 Parsing the ANN Weight Matrix to Infer Regulatory Relationships
We next interrogated the aobANN weight matrix to find out which regulators are most important for
assigning genes to specific gene expression behavior. Regulators were sorted by a sum-of-squares rank
calculation (see methods) over of the expression classes. The factor ranking, based exclusively on the
ANN weights, assigned nearly all transcription factors previously definitively associated with phase
specific regulation to the very top of the ordered list. Figures 3 and 5 summarize data from the weight
matrix of the average-of-bests network. A plot of the sum of squared weights for each factor, shows that
the top 10% of all regulators carry much higher weights than all the rest, and the drop off in weight is
quite dramatic (figure 3a). Focusing on the top 20%, the relative contribution to each sum derived from
positive (blue) versus negative (red) weights is shown (figure 3b). Both negative and positive weights
contribute substantially, and the way in which weights associate with each individual expression class
is shown in figure 3B. The top regulators in this ranking are Swi6, Ndd1, Stb1, Fkh2, and Mbp1, all of
which are known direct regulators of the cell cycle. In most instances high positive weight for a factor
(blue) is associated with the expression class or pair of classes expected from more detailed molecular
genetics studies. For instance, Swi6, Stb1 and Mbp1 are the first, second and sixth ranked regulators,
and they are known to function together at genes expressed in EM2 (G1). Mbp1 binds DNA directly
and Swi6 and Stb1 bind to Mbp1 (Koch et al., 1993; Costanzo et al., 2003). Ndd1 and Fkh2, the second
and fourth ranked regulators, also function together in a molecular complex (Koranda et al., 2000). In

2 RESULTS 10
the aobANN model, they are associated with EM3/4 (S/G2), again recapitulating expected domain of
action.
2.2 ANN Stability
Regulator-to-target relationships suggested by the ANNs were very stable with respect to permutation
of the input DNA binding data and to a range of biologically reasonable differences among input
expression clusterings (classifications). We find the relative ranking of the top regulators to be stable
across all networks generated during the training paradigm (figure 4). The ranking of regulators was
also stable across networks that were trained to predict expression classes derived from clusterings
with either more or fewer clusters (the experiment was performed over K= 5,6,7, or 8 and results are
summarized in supplemental figure 2. Lower K values than 4 fit the data poorly and are therefore
irrelevant; and still higher K values than 7 force an entirely unjustified over-splitting of clusters that is
clearly inappropriate.
2.3 In silico network mutations
We next performed a series of in silico network mutations in which binding data for one, two or
three top-ranked regulators were removed before training a new set ANNs. The resulting deletion
ANNs were used to produce a new average-of-bests network, as before, and the corresponding sum of
squared weights ranking was constructed (figure 6). These perturbations further test network stability
and also identify specific instances of factor redundancy. Overall the ANNs proved remarkably stable
to elimination of high-ranking factors. When each of the top 20 were eliminated singly, the identity of
the remaining top regulators proved very stable (Figure 6a). The color code for each cell reflects its
rank order from the parental, unperturbed network (shown in the bottom row). Each subsequent row

2 RESULTS 11
reports the outcome for the mutant network with the indicated factor or factors removed. Although the
cells are placed according to their rank order in the mutant AOB network, the color is based on the
ranking from the unperturbed, “wildtype” network. In general, factors from lower rankings were not
promoted into the high ranking (dark blue) domain, nor were previously highly ranked factors (blue)
demoted significantly into yellow and red domains. Thus the first major conclusion from the mutation
experiments is that neither the connections the ANNs infer, nor the absolute performance of the ANNs
depend heavily on a single factor or even a factor pair. The ability of the models to highlight other
important connections is not compromised by elimination any high scoring factor.
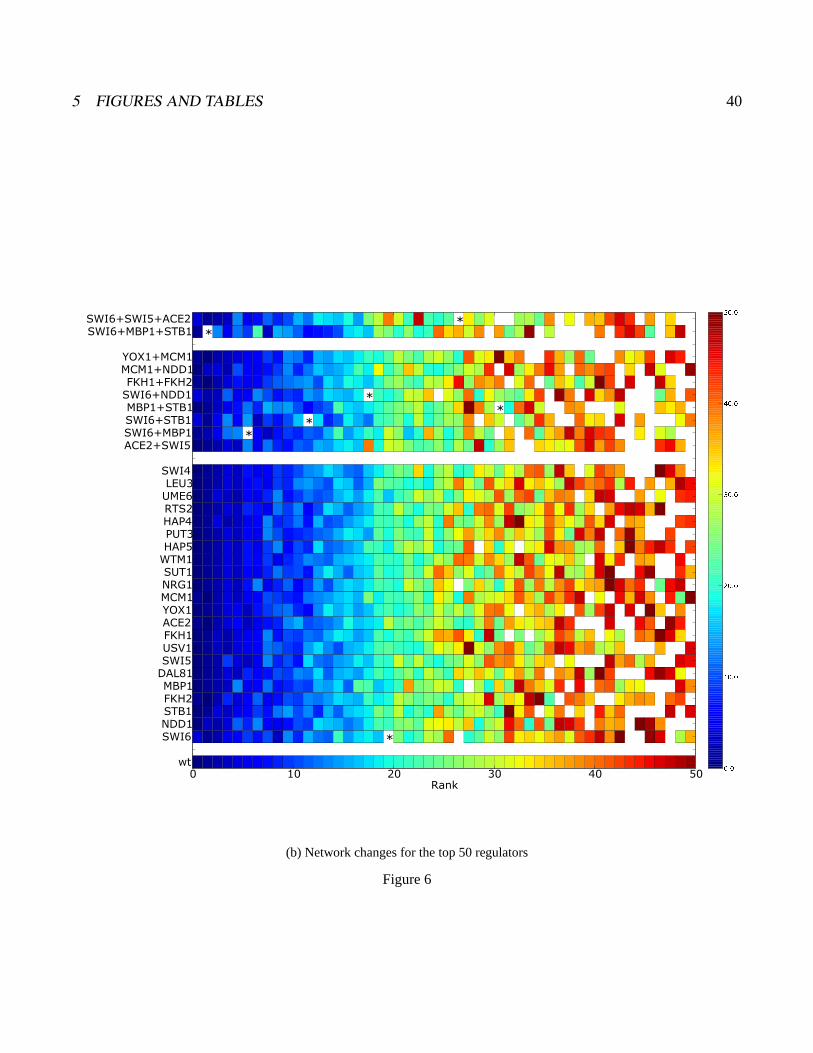
Panel b in figure 6 shows the same mutant networks at higher resolution, so that all factors whose
original rank was >50 appear in the summary as white cells. Original rank order is again indicated by
the color of each cell, although the color scale has been shifted to make it more sensitive to changes in
rank among the top 50 regulators. A few specific exceptions to overall stability were observed, in which
a relatively low ranked regulator has been elevated by mutation into higher ranks. The most striking
example is Swi4, which is demarcated with a star. Swi4 is a very well-studied cell cycle transcription
factor that did not fall in the top 10% in the wild-type network (it ranked 80th). As shown in panel
C, “mutant” networks for all factors associated with the G1 (EM2) caused Swi4 to advance in rank,
with double or triple mutations moving it progressively higher. We discuss later the causes and conse-
quences of Swi4’s initial low ranking in the wildtype ANN and the implicates for detecting biological
redundancy. However, the general conclusion for ANN analysis is that systematic single and multiple
perturbations of high ranking regulators provides a way to detect redundancy, even when a connection -
here Swi4 with G1 - was not evident in the unperturbed "wildtype" ANN. Additional double and triple
mutations for the major cycle classes were performed and no other change as remarkable as Swi4 was
found.

2 RESULTS 12
2.4 Out-of-sample accuracy
We next tested out-of-sample accuracy, which is the ability of the training paradigm to generalize to
another set of independently collected binding measurements, in which both experimental error and
biological error will differ from the first series of models. We constructed a new aobANN trained again
from data collected from Harbison, but included only binding measurements from the 111 regulators
available in both the Harbison et al. (2004) study and the independent Lee et al. (2002) study. De-
spite biological and experimental difference between the two datasets, this aobANN delivered a highly
significant out of sample accuracy of 56%, which is 17 standard deviations from the average linear
assignment score (.27± 0.017) of a random partitioning of the genes, where class sizes are determined
by drawing from a multinomial distribution based on the cluster sizes.
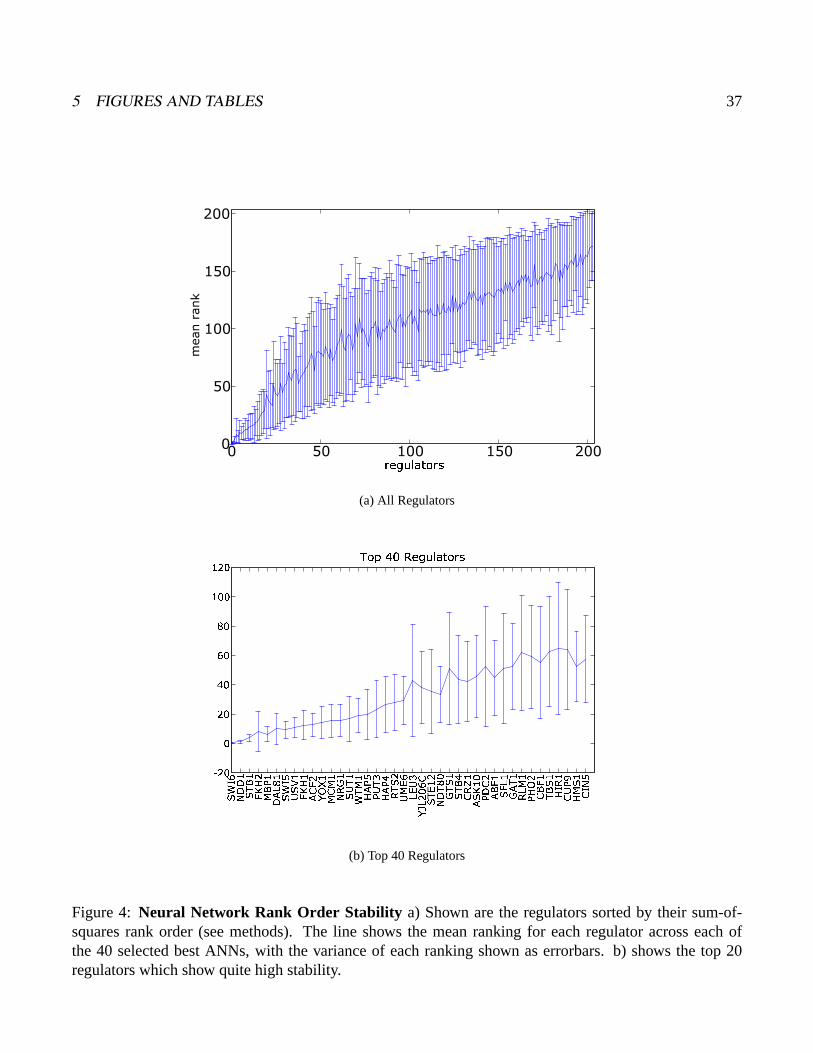
2.5 Regulator Rank Stability and Power
The stability of weight ranks across the 40 individual "best" networks that contribute to the aobANN
was examined. We postulated that factors whose rankings are less stable across many individual net-
works would also be less likely to be functionally significant than factors showing high stability across
the individual networks, even if the median sum-of-squares weight is quite high in all cases. The well
known regulators of cell cycle transcription, ranking in the top dozen showed greatest stability, and
a substantial discontinuity was found to separate the top 20 from the remaining factors (Figure 4).
We then asked how well the top regulators can perform if they are used to build a new aobANN over a
sweep that ranges from three to 28 regulators. This experiment showed that a network built from the top
20 regulators performed almost as well as the full 204 regulator network and ranked its regulators very
similarly (Supplemental figure 3). The top 5 regulators on their own (Swi6/Mbp1/Stb1 plus Fkh2and
Ndd1) were surprisingly powerful in parsing G1 vs. G2/M. Conversely, an aobANN composed from

2 RESULTS 13
the bottom 184 regulators was much less successful in predicting expression.
2.6 ANN models from independent cell cycle experiments
We next independently clustered Cdc15 TS and alpha factor synchronized cell cycle RNA expression
data (Spellman et al., 1998), and used these new clusters to build two new ANN cell cycle models.
These datasets are from two different cell cycle experiments, each measured using deposition microar-
rays and a ratiometric design, in contrast to the cdc28 arrest described above, which used Affymetrix
data. By focusing on each synchronization method individually, rather than using a merged dataset,
we aimed to capture possible differences in the biology that might arise from different methods of
synchronization, while also revealing the relationships that are robust across the three experiments and
two assay platforms. For example, these data differ from each other in quality The ChIP/chip dataset
is unique and was therefore used to build ANNs across cdc28, cdc15 and alpha factor experiments.
As demonstrated with the cdc28 data above we found these additional ANN models return the
same core cell cycle regulators highlighted by the cdc28 ANNs. Six of these; Ndd1, Mbp1, Swi5,
Stb1, Swi6, and Fkh2 are among the top seven regulators found, regardless of which cell cycle data
and clusterings were used as input to the ANNs. This robustness in the central regulatory relationships
is quite remarkable considering that, of 780 genes belonging to at least one of the cycling datasets,
only 147 genes are common to all three experiments. Quantitation of pairwise clustering overlap,
using the linear assignment metric, makes it very clear that the gene number and clustering patterns
differ substantially (figure 7). Thus ANNs highlight major shared cell cycle relationships, even though
the gene sets used and the clusterings are quite different. (table 1)
Cdc15ts-synchronized cells are arrested at the end of M phase (Spellman et al., 1998). Correspond-
ingly, we find the expression cluster that peaks first – at 10 minutes in the Cdc15 data – associates

3 DISCUSSION 14
strongly with the early G1 factors Swi5 and Ace2 (EM1 in figure 7). Note that in the previous cdc28
ANN, the same association was made, even though – under that release condition – genes of this reg-
ulatory group are not upregulated until the second cycle after release ((Hart et al., 2005) and above).
Alpha factor arrest is similar in this way to cdc28, reflecting their similar blockade points. Thus the
ANNs easily related the cdc15 early G1 cluster to the alpha factor and cdc28 early G1 clusters, even
though the cluster trajectory is strikingly different and the clusters themselves contain no individual
genes in common with the cdc28 or alpha factor datasets (figures 5, 8, 9). Other high-ranking regu-
lators appear in one or two, but not all three ANN cell cycle models. Yox1 and Yhp1, for example,
differ among the models, because the gene classes derived from the RNA clusterings differ in content.
Finally, Pho2 emerges as a potentially significant regulator associated with an M-phase kinetic pattern
in the two Spellman datasets, consistent with the previously reported Pho2/Pho4 mediated, cell cycle
expression for some phosphate regulated genes (Neef and Kladde, 2003). This is thought to be due
to intracellular polyphosphate pools, which vary through the cycle in some culture conditions, but can
also be influenced by growth media and history.
3 Discussion
We found that single layer artificial neural network (ANN) classifier models can effectively integrate
global RNA expression and protein:DNA interaction data (ChIP/chip). The resulting models promi-
nently highlight factors known to drive the transcriptional regulatory network underlying cell cycle
phase specific expression. The weight matrices from these ANN models generally associated previ-
ously known cell cycle transcription factors with the cell cycle phase they are thought to regulate,
and they did so as well as or better than other methods, based on flexible iterative thresholding (Bar-
Joseph), network dynamics ((Luscombe et al., 2004)) or, most recently, Bayesian methods ((Sun et al.,

3 DISCUSSION 15
2006)). In general, we feel that more conventional statistical approaches and ANNs complement each
other. Both generate hypothesized relationships and rank them. The strengths of the single layer neu-
ral network architecture used here is that it mirrors several basic properties of natural gene networks:
1) Both presence and absence of factor binding determine when and where a gene is expressed. 2)
Factor occupancyin vivo is a continuum, not an all-or-nothing phenomenon, and the graded differ-
ences can have biological significance. For example, graded binding of the transcription factor Pha4
creates spatiotemporal gradients of target gene expression during pharyngeal development inC. ele-
gans(Gaudet and Mango, 2002). These features of the neural network distinguish it from algorithms
that depend solely on positive evidence of binding and require discretization of the binding signal to
bound or unbound. A further distinction is that the neural network models can be easily and infor-
matively “mutated” to ask how the overall network connection patterns and outputs are affected by
specific changes, such as eliminating data for individual factors, combinations of factors, or making
even larger structural changes. The obvious complementary strength of statistical methods is in quan-
titative thresholding based on significance measures.
A general conclusion that can be drawn from this work comes from the overall success of ANNs
in classifying expression output according to transcription factor binding patterns. This might not
have been true, but this overall observation argues strongly that transcriptional regulation, rather than
differential post-transcriptional regulation, is the dominant mechanism in shaping phase specific RNA
prevalence clusters. This observation does not preclude a role for other mechanisms operating on a
minority of genes (perhaps explaining some difficult-to-predict genes) or a post-transcriptional role that
is uniform over an entire class. For example, confusion matrix analysis of expression classes versus the
predicted expression pattern from the ANNs identified a group of genes with EM3 (S phase) kinetics
that comprise 10% of that cluster, but are associated with the EM2 G1 group by the ANN model (Figure
3 DISCUSSION 16
2), and these are reasonable candidates to be differentially regulated by post-transcriptional processes
such as slower turnover.
3.1 Relating the Inferred Connections to Known Biology
The sum-of-squared weights metric proved to be simple and useful for objectively ranking regulators
according to their importance in the network model, regardless of the input expression dataset. Even
though ANN weights are not direct physical measures of binding, the resulting rankings correspond
remarkably well with what is known from decades of work on transcription in the yeast cell cycle.
The ANN models even highlighted subtle regulatory differences between different cell cycle synchro-
nization methods. The top dozen of the 204 total regulators in the cdc28 ANN model contained 10 of
12 transcription factors present in the Harbison ChIP dataset and known to operate on cycling genes.
Swi6 ranked at the top of the cell cycle regulators list in the cdc28, cdc15 and alpha factor ANN models
and is always associated with G1 expression. Swi6 also shows a relative absence of binding to genes
expressed highly during G2. The pattern of weights evaluated across the RNA expression clusters
provide additional information. For instance, the cdc28 ANN weight vector for Mbp1 across the cell
cycle clusters tracks very closely with Swi6 (Correlation coefficient r=.92). This mirrors underlying
molecular biology in which Mbp1 and Swi6 combine to form the heteromeric active G1 transcription
factor MBF. Stb1 is similarly grouped with Swi6 and Mbp1 as a co-regulator of G1 (cdc28 EM2) genes
(r=.95 and .89 for Stb1 with Mbp1 or with Swi6, respectively). Ace2 and Swi5 are paralogous factors
with similar DNA binding target sites (Dohrmann et al., 1996; Doolin et al., 2001), and both are posi-
tively associated with the early G1 (cdc28 EM 1) expression profile with similar in weights profiles (r=
.71).
Also confirming expectations from studies of target genes and epistatsis predictions, Fkh1 and
3 DISCUSSION 17
Fkh2 were associated with cdc28 S/G2 expression clusters by the ANN. This inferred joint association
is consistent with double knockout experiments, which indicate that the two complement each other
(Zhu et al., 2000), and with studies showing the two factors bind the same sites in vitro (Hollenhorst
et al., 2000). Examined in detail, the cdc28 ANN weights suggest a more nuanced view, in which both
Fkh1 and Fkh2 are important for some genes in early S/G2 (EM3), whereas S/G2 class genes (cluster
EM4) rely more heavily on NDD1 and Fkh2 and less on Fkh1. RNA expression data for Fkh1 and Fkh2
is consistent with this, since Fkh1 increases in expression nearly 20 minutes before Fkh2 in expression
data collected by Cho et al., 1998. This is also consistent with a detailed study ofin vivo binding at a
few specific target genes (Hollenhurst et al., 2001), which showed that the two Fkh factors do not bind
identicallyin vivo, and that there is a distinction between genes of the so-called Clb2 cluster (a subset of
Cluster EM4 here), that are dominated by Fkh2 in conjunction with Mcm1/Ndd1, versus Fkh1 which
is thought to bind independently. The alpha factor and cdc15 ANNs place diminished emphasis on
Fkh1, compared with cdc28 ANNs, which is consistent with the idea that the two factors have different
molecular activities and targets.
Time and sign of action. Cdc28 ANN Weight vectors for Mcm1 and Yox1 were also correlated
(r=.69), defining an association with EM5 target genes where they displayed the two highest positive
weights. They are known to act on some of the same genes, including EM5 group members (Pramila
et al., 2002). In this example the ANN is picking up molecular effects that are of opposing molecular
activity, with Yox1 repressing Mcm1 activity. This illustrates an issue of interpretation. Because the
original binding data are from a mixed phase cell population, it reveals nothing about when during the
cycle detected binding occurs. For positive acting factors whose binding and function are contempora-
neous, we see a peak of binding simply correlated with a peak of RNA expression. But for a repressor
acting on genes expressed in M phase, binding occurs at other times (late G1 , S, G2 alone, or in com-

3 DISCUSSION 18
binations (Pramila et al., 2002). Thus the ANN correctly connected the factor with its targets, but only
by independently determining the mode of Yox1 action, or by adding temporally resolved binding data,
can the sign and timing of action be discerned. For factors whose action - repressing or activating - is
unknown or is conditional depending on context, temporally resolved ChIP data will be needed to infer
the mode and time of action.
Swi4, a “missing” regulator. The ANN models did not assign high weight to Swi4, which one
would expect to rank highly. Although Swi4 is a well known direct transcriptional regulator of Early
G1 genes, providing the DNA binding moiety of SBF factor (Andrews and Herskowitz, 1989), it was
not even close to the top 20 in the cdc28 aobANN, ranking 80 of 204. Its preferential association
with G1 target genes only came to light when we performed in silico mutation analyses, eliminating
one or more G1 factors. There are two possible explanations for its weak values in the wildtype
ANNs, and they are not mutually exclusive. One simple possibility is that redundancy with other G1
regulatory factors is widespread, and this masks Swi4 when training the ANNs. Especially if coupled
with generally less robust signals in the ChIP assay, the ANNs might have simply ignored Swi4. A
second explanation is that Swi4 has greater breadth of binding across multiple clusters than its paralog,
Mbp1. In this scenario, Swi4 spills over, binding to members of multiple cell cycle expression clusters
when compared with other G1-specific regulators such as Mbp1, Swi6, or Stb1. This would give Swi4
less discrimination power in classifying genes, despite active G1 binding and could arise from purely
technical issues, or from an unappreciated biological role outside its function in SBF.
An independent analysis of the Harbison ChIP data in the context of a much larger library of ex-
pression data across many conditions other than cell cycle phases, using a different computational
approach, supports the idea of broad Swi4 distribution among cell cycle regulatory classes (Bar-Joseph
et al., 2003). Specifically, the GRAM algorithm uses co-expression patterns to incorporate into the con-

3 DISCUSSION 19
nection map ChIP interactions that are below statistical significance when evaluated on their own (Lee
et al., 2002; Bar-Joseph et al., 2003; Harbison et al., 2004). They reported regulatory modules con-
sisting of pairs of factors in which Swi4 is partnered by binding and expression data with one or more
factors from each and every expression cluster: Ace2, Fhk2, Ndd1 and Mcm1, as well as the “clas-
sic” associated G1 factors, Mbp1, Stb1, Swi6. In addition, an entirely independent set of ChIP/chip
measurements and analysis from Snyder and colleagues (Horak et al., 2002) showed substantial Swi4
binding activity upstream of non-G1 genes. Taken together, these data suggest Swi4 might have one or
more previously unappreciated functions within exponentially growing cells that are distinct from its
classic role as part of SBF.
Finally, a picture of partly, but not entirely, redundant functions for the Swi4/Mbp1 paralogs was
also emphasized in a recent genetic study (Bean et al., 2005). We therefore think it likely that the way
the unperturbed ANNs treat Swi4 reflects partial biological redundancy combined with its more widely
distributed binding across non-G1 clusters.
3.2 Potential Newly Identified Regulatory Connections
Do the ANNs suggest new factors associated phase specific expression? Focusing on the cdc28 ex-
ample, and using stability across ANNs as an added filtering criterion, factors ranking above Leu3
stood out. In particular, both Usv1 and Dal81 are interdigitated among the otherwise well-documented
ten major regulators cell cycle regulators, although not previously associated with this function to our
knowledge. A different explanation is that factors like Usv1, Dal81, and a handful of others ranking in
the top 20, may be in the ANN model for reasons having nothing to do with the cell cycle explicitly, but
having much to do with the partially overlapping architecture of transcriptional networks in eukaryotes.
Thus, we expect that some genes – perhaps most – within cycling clusters will also belong to one or
3 DISCUSSION 20
more other functional modules. In the context of those other functions, they will presumably be regu-
lated by factors that have nothing to do with directing cell cycle phase patterns. This kind of network
intersection and partial overlap is strikingly evident in global module maps (Segal et al., 2003a). Some
factors appearing in the ANN top 20 may be there for this reason. There are others (Pho2, for example)
that seem to be drawn into regulating phase specific expression because of metabolic links (in this case
through polyphosphate pools and membrane biogenesis ((Neef and Kladde, 2003)). We expect that the
overall approach we have taken for the cell cycle network, using global ChIP/chip data, could easily
be extended to any network whose states of interest are well represented in available ChIP/chip data,
and whose RNA datasets are of sufficient quality and resolution to cluster the expression behaviors of
interest. However, a decisive improvement in sophistication of the ANN model, and the hypotheses it
generates, will come with time-resolved ChIP data.
3.3 Neural network weights predict evolutionarily conserved binding
motif frequencies
If binding data are predictive of expression class, and if meaningful transcription factor binding is mo-
tif specific, then it should be possible to independently verify relationships from the weights matrix
by measuring the frequency of binding motifs. We can also ask if any observed site enrichment and
depletion are evolutionarily conserved, as would be expected if they mediate functionally relevant fac-
tor binding. Motif frequency across cell cycle clusters in multiple yeast species correlated remarkably
well with binding probabilities from the ChIP data and also with the ANN weights trajectories across
the same clusters (Figure 10). The conserved motif data for Mbp1 and Swi5/Ace2, and Fkh1/Fkh2, all
factors with well-defined binding motifs, provided independent support for conclusions from the ANN,
since the ANN was constructed without any input information about DNA sites.

3 DISCUSSION 21
3.4 Conservation of site enrichment and depletion over great evolution-
ary distance
The distribution of MCB sites across the cycle phases was striking and prompted us to ask if both
enrichment and depletion holds over very great evolutionary distance. If specific depletion is a func-
tionally important network characteristic, then we would predict that it would retained over very great
evolutionary distance. We performed the same site enrichment analysis across cell cycle gene classes
in S. pombe, which is said to be as distant from budding yeast as are humans (∼ 500my). We used the
EM algorithm to cluster theS. pombecycling data of (Rustici et al., 2004) in the same way that the
various Sacharomyces experiments had been clustered (Hart et al., 2005). At this evolutionary distance
there are no large blocks of conserved noncoding DNA sequence.S. pombedoes, however, have an
identified MBF ortholog, and the short binding motif for MBF shows significant site enrichment in
our expression cluster 3, together with significant depletion from cluster 5, mirroring the pattern in
budding yeast (figure 11). The positive regulator-to-target group conservation was noted previously
(Rustici et al., 2004; Peng et al., 2004; Oliva et al., 2005), but in this study we were able to detect
it without strongly pre-filtering gene sets for their explicit experimental responsiveness to MBF. The
new observation here is that depletion of MBF sites, operating specifically in the group of genes nor-
mally expressed later in the cell cycle, is a very highly-conserved property. This cis-motif depletion
suggests there is selective restriction against MBF sites and that it is phase specific: it does not apply
broadly to most genes in the genome, but does apply preferentially to genes in late cell cycle cluster
(in this case cluster 5 for S. pombe, cluster 4 forS. cerevisae). In both organisms, this cluster contains
genes whose products are involved in mitosis, and it seems possible that their heterochronic expression
during G1/S phases, as MCB sites might cause, could disrupt proper control or execution of S phase.
However, the observed conservation is apparently a network property, even though the specific genes

4 METHODS 22
in each phase group are – mainly – not orthologous. Thus the surprising observation that most genes
in these oscillating clusters are not the same ones in pombe and Saccharomyces (reviewed in (Bahler,
2005)), if correct, suggests that conserved enrichment and depletion of regulatory motifs are network
architecture properties that are shared across hundreds of millions of years, even though most specific
genes involved are different.
4 Methods
4.1 Data Pre-processing
The primary expression dataset for modeling is Affymetrix microarray data measuring RNA levels of
nearly every gene in yeast through two cell cycles, following release from conditional CDC28TS arrest
(Cho et al., 1998). That time course sampled RNA levels at 10 minute intervals over 170 minutes,
which covers two cycles. These data were obtained from the original authors and preprocessed in three
steps. 1) Any gene that did not show sustained absolute expression greater than the 2.5% quantile of
the data (an absolute signal of 8) for three consecutive timepoints was eliminated. 2) For the remaining
6174 expression vectors, each time point measurement was divided by the median expression value
across all time points for the gene. 3) The log2 of each ratio was then taken and these values comprised
the expression matrix for all further analysis. For key model building in this work, we focused on the
subset of expression vectors (384) that had been identified by Cho et. al. as displaying a cell cycle
dependent pattern and also passed the above filter for absolute expression, operationally we refer to
this set as the "cycling" set.
The primaryin vivo protein:DNA interaction dataset (ChIP/array) used here is from Harbison et
al. (2004). These data were obtained at http://web.wi.mit.edu/young/regulatory_code/ and the re-

4 METHODS 23
ported P-values were used directly. Briefly, for each of 204 transcriptional regulators, Harbison and
colleagues constructed a yeast strain containing a myc-epitope-tagged version of the factor that was
inserted into the corresponding transcription factor locus. Each strain was used to perform three inde-
pendent ChIP/array measurements taken from freely cycling exponential phase cultures. The cells were
subjected to standard formaldehyde crosslinking to attach transcription factors to theirin vivo binding
sites, the chromatin was sheared, factor bound DNA was enriched by IP, amplified by LMPCR and
fluorescently labeled. ChIP enriched DNA was then co-hybridized with control DNA to microarrays
containing essentially all intergenic sequences in yeast. A binding ratio was then calculated for each
array feature based on the relative hybridization signal for targets synthesized from ChIP enriched
DNA vs. whole cell extract control DNA . Three biological replicate experiments were performed,
each beginning from an independent yeast culture. Based on an error model first described in (Hughes
et al., 2000) and the three replicate binding ratios for each intergenic sequence, a P-value was reported
for each upstream intergenic sequence. This p-value roughly estimates the probability that a given
transcription factor is bound to a particular intergenic sequence.
4.2 Neural Network Implementation and Training
Figure 1 illustrates the overall structure of the artificial neural networks (ANN) trained in this study.
Backpropagation was implemented by the UWBP package (Maclin et al., 1992) to train a single layer
network with no hidden units. Each ANN was trained using 300 epochs using a learning rate of .002.
RNA expression array data for the subset of 384 cycling genes as described above were clustered using
an expectation maximization algorithm fitting the data to a mixture of Gaussians probability distribu-
tions with a diagonal covariances (EM MoDG (Hart et al., 2005; Dempster et al., 1977). Networks
to predict cluster membership for each gene based on an input vector composed of ChIP derived in-
4 METHODS 24
vivo factor binding probabilities for the 204 measured regulators in the Harbison dataset. Individual
networks were trained using 80% of the data and tested on 20% of the data. For each 80/20 dataset
split, ten neural networks were trained using different random seeds for each network. The network
with the best prediction accuracy on the testing dataset was then selected and denoted as “best”. This
process was then repeated 40 times splitting the dataset into different testing and training datasets. The
network weights from the resulting 40 selected “best” networks were then averaged together to create
the average-of-bests neural network (aobANN). We focus on this network for subsequent biological in-
terpretation, with the primary goal of identifying regulatory connections between transcription factors
and their direct target genes. Because the purpose of this network is not to repeatedly classify similar
data, the implications of overtraining are different than they would be for classical uses of ANNs. In
this unconventional usage we show by measuring the behavior of 10 internal "gold standard" known
cell cycle regulators, that any "overtraining" is not deleterious for the intended goal, which is extracting
a series of ranked hypotheses about regulator-to-output relationships. Regulators within aobANNs are
ranked based on the median sum-of-squares rank across all of the individual ANNs trained to generate
the aobANN. The sum-of-squares ranking for a regulator within an individual network is simply the
sum of squared weights across the classes in the weight matrix (∑
c w2c,r).
4.2.1 Consensus Site Enrichment and Depletion Calculations:
In order to determine whether an expression cluster showed an enrichment in genes that contain a
particular consensus site we calculated the likelihood of the observed enrichment, or depletion, being a
chance occurrence according to a binomial model of occurrence probabilities. We count the observed
number of genes that have at least one instance of a consensus sequence within the 1KB directly
upstream of the coding sequence for all genes in an expression cluster versus the number of genes
that would be expected by chance. As no known background sequence model is completely provably

REFERENCES 25
correct, for each consensus sequence we calculate the expected background frequency (f̂ ) using a
bootstrapping method. We randomly selected 1000 different sets of genes the same size as the cluster
being compared (n). These randomly selected background sets are drawn from either the entire genome
or from only the “cycling” genes, which were used in training the ANNs. The number of genes that
contain at least a single instance of the consensus is counted for each randomly selected set. The
average count across the 1000 samples is normalized and used as our estimate of the expected number
of genes within a cluster that have a single occurrence within 1KB upstream (Ec). Since the chances
of any given gene within a cluster having a given consensus sequence within the 1KB upstream can be
assumed to be independent, we can estimate the probability of finding the observed number of counts
(Oc) using a standard binomial distribution (1). If the site is enriched we estimate the p-value for the
likelihood of finding at least the observed count, but if the site is depleted we calculate likelihood of
finding at most the observed count (equation 2).
P (i|c, n) =(
n
i
) ( c
n
)i (1− c
n
)n−i(1)
p =
∑n
i=0cP (i|Ec, n) if Oc > Ec
1−∑n
i=0cP (i|Ec, n) if Oc ≤ Ec
(2)
References
Andrews, B. and Herskowitz, I. (1989). The yeast swi4 protein contains a motif present in develop-
mental regulators and is part of a complex involved in cell-cycle-dependent transcription.Nature,
342:830–3.
Bahler, J. (2005). Cell-cycle control of gene expression in budding and fission yeast.Annu Rev Genet,

REFERENCES 26
39:69–94.
Bar-Joseph, Z., Gerber, G. K., Lee, T. I., Rinaldi, N. J., Yoo, J. Y., Robert, F., Gordon, D. B., Fraenkel,
E., Jaakkola, T. S., Young, R. A., and Gifford, D. K. (2003). Computational discovery of gene
modules and regulatory networks.Nat Biotechnol, 21:1337–42.
Bean, J. M., Siggia, E. D., and Cross, F. R. (2005). High functional overlap between mlui cell-cycle
box binding factor and swi4/6 cell-cycle box binding factor in the g1/s transcriptional program in
saccharomyces cerevisiae.Genetics, 171:49–61.
Bishop, C. (1995).Neural Networks for Pattern Recognition. Oxford University Press.
Breeden, L. L. (2000). Cyclin transcription: Timing is everything.Curr Biol, 10:R586–8.
Breeden, L. L. (2003). Periodic transcription: A cycle within a cycle.Curr Biol, 13(1):R31–8.
Cho, R. J., Campbell, M. J., Winzeler, E. A., Steinmetz, L., Conway, A., Wodicka, L., Wolfsberg,
T. G., Gabrielian, A. E., Landsman, D., Lockhart, D. J., and Davis, R. W. (1998). A genome-wide
transcriptional analysis of the mitotic cell cycle.Mol Cell, 2(1):65–73.
Cho, R. J., Huang, M., Campbell, M. J., Dong, H., Steinmetz, L., Sapinoso, L., Hampton, G., Elledge,
S. J., Davis, R. W., and Lockhart, D. J. (2001). Transcriptional regulation and function during the
human cell cycle.Nat Genet, 27(1):48–54.
Costanzo, M., Schub, O., and Andrews, B. (2003). G1 transcription factors are differentially regulated
in saccharomyces cerevisiae by the swi6-binding protein stb1.Mol Cell Biol, 23:5064–77.
de Lichtenberg, U., Wernersson, R., Jensen, T. S., Nielsen, H. B., Fausboll, A., Schmidt, P., Hansen,
F. B., Knudsen, S., and Brunak, S. (2005). New weakly expressed cell cycle-regulated genes in
yeast.Yeast, 22(15):1191–1201.

REFERENCES 27
Dempster, A., Laird, N., and Rubin, D. (1977). Maximum lielihood from incomplete data via the em
algorithm.J. Royal Statistical Society, Series B, 39:1–38.
Dohrmann, P. R., Voth, W. P., and Stillman, D. J. (1996). Role of negative regulation in promoter
specificity of the homologous transcriptional activators ace2p and swi5p.Mol Cell Biol, 16:1746–
58.
Doolin, M., Johnson, A., Johnston, L., and Butler, G. (2001). Overlapping and distinct roles of the
duplicated yeast transcription factors ace2p and swi5p.Mol Microbiol, 40:422–32.
Gao, F., Foat, B. C., and Bussemaker, H. J. (2004). Defining transcriptional networks through inte-
grative modeling of mrna expression and transcription factor binding data.BMC Bioinformatics,
5:31.
Gaudet, J. and Mango, S. E. (2002). Regulation of organogenesis by the caenorhabditis elegans foxa
protein pha-4.Science, 295:821–5.
Harbison, C. T., Gordon, D. B., Lee, T. I., Rinaldi, N. J., Macisaac, K. D., Danford, T. W., Hannett,
N. M., Tagne, J. B., Reynolds, D. B., Yoo, J., Jennings, E. G., Zeitlinger, J., Pokholok, D. K.,
Kellis, M., Rolfe, P. A., Takusagawa, K. T., Lander, E. S., Gifford, D. K., Fraenkel, E., and Young,
R. A. (2004). Transcriptional regulatory code of a eukaryotic genome.Nature, 431:99–104.
Hart, C. E., Sharenbroich, L., Bornstein, B. J., Trout, D., King, B., Mjolsness, E., and Wold, B. J.
(2005). A mathematical and computational framework for quantitative comparison and integra-
tion of large-scale gene expression data.Nucleic Acids Res, 33:2580–94.
Hollenhorst, P. C., Bose, M. E., Mielke, M. R., Muller, U., and Fox, C. A. (2000). Forkhead genes in
transcriptional silencing, cell morphology and the cell cycle. overlapping and distinct functions
for fkh1 and fkh2 in saccharomyces cerevisiae.Genetics, 154:1533–48.
REFERENCES 28
Horak, C. E., Luscombe, N. M., Qian, J., Bertone, P., Piccirrillo, S., Gerstein, M., and Snyder, M.
(2002). Complex transcriptional circuitry at the g1/s transition in saccharomyces cerevisiae.
Genes Dev, 16(23):3017–33.
Hughes, T. R., Marton, M. J., Jones, A. R., Roberts, C. J., Stoughton, R., Armour, C. D., Bennett,
H. A., Coffey, E., Dai, H., He, Y. D., Kidd, M. J., King, A. M., Meyer, M. R., Slade, D., Lum,
P. Y., Stepaniants, S. B., Shoemaker, D. D., Gachotte, D., Chakraburtty, K., Simon, J., Bard, M.,
and Friend, S. H. (2000). Functional discovery via a compendium of expression profiles.Cell,
102(1):109–26.
Iyer, V., Horak, C., Scafe, C., Botstein, D., Snyder, M., and Brown, P. (2001). Genomic binding sites
of the yeast cell-cycle transcription factors sbf and mbf.Nature, 409:533–8.
Koch, C., Moll, T., Neuberg, M., Ahorn, H., and Nasmyth, K. (1993). A role for the transcription
factors mbp1 and swi4 in progression from g1 to s phase.Science, 261:1551–7.
Koranda, M., Schleiffer, A., Endler, L., and Ammerer, G. (2000). Forkhead-like transcription factors
recruit ndd1 to the chromatin of g2/m-specific promoters.Nature, 406:94–8.
Lee, I., Date, S. V., Adai, A. T., and Marcotte, E. M. (2004). A probabilistic functional network of
yeast genes.Science, 306(5701):1555–1558.
Lee, T. I., Rinaldi, N. J., Robert, F., Odom, D. T., Bar-Joseph, Z., Gerber, G. K., Hannett, N. M.,
Harbison, C. T., Thompson, C. M., Simon, I., Zeitlinger, J., Jennings, E. G., Murray, H. L.,
Gordon, D. B., Ren, B., Wyrick, J. J., Tagne, J. B., Volkert, T. L., Fraenkel, E., Gifford, D. K., and
Young, R. A. (2002). Transcriptional regulatory networks in saccharomyces cerevisiae.Science,
298(5594):799–804.
Luscombe, N. M., M, M. B., a. b. u. Madan, B., Yu, H., Snyder, M., Teichmann, S. A., and Gerstein,
REFERENCES 29
M. (2004). Genomic analysis of regulatory network dynamics reveals large topological changes.
Nature, 431:308–12.
M. A. Beer, S. T. (2004). Predicting gene expression from sequence.Cell, 117:185–98.
Maclin, R., Opitz, D., and Shavlik, J. W. (1992). University of wisconsin-madison backpropagation
(uwbp).
Menges, M., Hennig, L., Gruissem, W., and Murray, J. A. (2003). Genome-wide gene expression in an
arabidopsis cell suspension.Plant Mol Biol, 53:423–42.
Mjolsness, E., Sharp, D. H., and Reinitz, J. (1991). A connectionist model of development.J Theor
Biol, 152(4):429–53.
Neef, D. W. and Kladde, M. P. (2003). Polyphosphate loss promotes snf/swi- and gcn5-dependent
mitotic induction of pho5.Mol Cell Biol, 23(11):3788–3797.
Oliva, A., Rosebrock, A., Ferrezuelo, F., Pyne, S., Chen, H., Skiena, S., Futcher, B., and Leatherwood,
J. (2005). The cell cycle-regulated genes of schizosaccharomyces pombe.PLoS Biol, 3:e225.
Peng, X., Karuturi, R. K., Miller, L. D., Lin, K., Jia, Y., Kondu, P., Wang, L., Wong, L. S., Liu, E. T.,
Balasubramanian, M. K., and Liu, J. (2004). Identification of cell cycle-regulated genes in fission
yeast.Mol Biol Cell.
Pramila, T., Miles, S., GuhaThakurta, D., Jemiolo, D., and Breeden, L. L. (2002). Conserved home-
odomain proteins interact with mads box protein mcm1 to restrict ecb-dependent transcription to
the m/g1 phase of the cell cycle.Genes Dev, 16:3034–45.
Reinitz, J., Mjolsness, E., and Sharp, D. H. (1995). Model for cooperative control of positional infor-
mation in drosophila by bicoid and maternal hunchback.J Exp Zool, 271(1):47–56.
Rustici, G., Mata, J., Kivinen, K., Lio, P., Penkett, C. J., Burns, G., Hayles, J., Brazma, A., Nurse,

REFERENCES 30
P., and Bahler, J. (2004). Periodic gene expression program of the fission yeast cell cycle.Nat
Genet, 8:809–817.
Segal, E., Shapira, M., Regev, A., Pe’er, D., Botstein, D., Koller, D., and Friedman, N. (2003a). Mod-
ule networks: identifying regulatory modules and their condition-specific regulators from gene
expression data.Nat Genet, 34:166–76.
Segal, E., Yelensky, R., and Koller, D. (2003b). Genome-wide discovery of transcriptional modules
from dna sequence and gene expression.Bioinformatics, 19 Suppl 1:i273–i282.
Spellman, P. T., Sherlock, G., Zhang, M. Q., Iyer, V. R., Anders, K., Eisen, M. B., Brown, P. O.,
Botstein, D., and Futcher, B. (1998). Comprehensive identification of cell cycle-regulated genes
of the yeast saccharomyces cerevisiae by microarray hybridization.Mol Biol Cell, 9(12):3273–
97.
Sun, N., Carroll, R. J., and Zhao, H. (2006). Bayesian error analysis model for reconstructing tran-
scriptional regulatory networks.Proc Natl Acad Sci U S A, 103(21):7988–7993.
Tsai, H. K., Lu, H. H., and Li, W. H. (2005). Statistical methods for identifying yeast cell cycle
transcription factors.Proc Natl Acad Sci U S A, 102:13532–7.
Vohradsky, J. (2001). Neural model of genetic network.J Biol Chem, 276(39):36168–36173.
Wang, W., Cherry, J. M., Botstein, D., and Li, H. (2002). A systematic approach to reconstructing
transcription networks in saccharomyces cerevisiae.Proc Natl Acad Sci U S A, 99(26):16893–
16898.
Weaver, D. C., Workman, C. T., and Stormo, G. D. (1999). Modeling regulatory networks with weight
matrices.Pac Symp Biocomput, pages 112–23.
Whitfield, M. L., Sherlock, G., Saldanha, A. J., Murray, J. I., Ball, C. A., Alexander, K. E., Matese,

REFERENCES 31
J. C., Perou, C. M., Hurt, M. M., Brown, P. O., and Botstein, D. (2002). Identification of genes
periodically expressed in the human cell cycle and their expression in tumors.Mol Biol Cell,
13(6):1977–2000.
Workman, C. T., Mak, H. C., McCuine, S., Tagne, J. B., Agarwal, M., Ozier, O., Begley, T. J., Samson,
L. D., and Ideker, T. (2006). A systems approach to mapping dna damage response pathways.
Science, 312(5776):1054–1059.
Zhang, M. Q. (1999). Large-scale gene expression data analysis: a new challenge to computational bi-
ologists [published erratum appears in genome res 1999 nov;9(11):1156].Genome Res, 9(8):681–
8.
Zhu, G., Spellman, P. T., Volpe, T., Brown, P. O., Botstein, D., Davis, T. N., and Futcher, B. (2000).
Two yeast forkhead genes regulate the cell cycle and pseudohyphal growth.Nature, 406:90–4.

5 FIGURES AND TABLES 32
5 Figures and Tables
5 FIGURES AND TABLES 33
All
Reg
ulat
ors
AB
F1
AB
T1
AC
A1
AD
R1
ZA
P1
ZM
S1
YR
R1
0 5 10 15
−2
0
2
0 5 10 15
−2
0
2
0 5 10 15
−3
−2
−1
0
1
0 5 10 15
−2
0
2
0 5 10 15
−3
−2
−1
0
1
Expression C
lasses
Weights
A)
ABF1
ABT1
ACA1
ADR1
ZAP1
ZMS1
EM1
EM2
EM3
EM4
EM5YRR1
B)
EM4
EM3
EM1
EM2
EM5
Weights Matrix
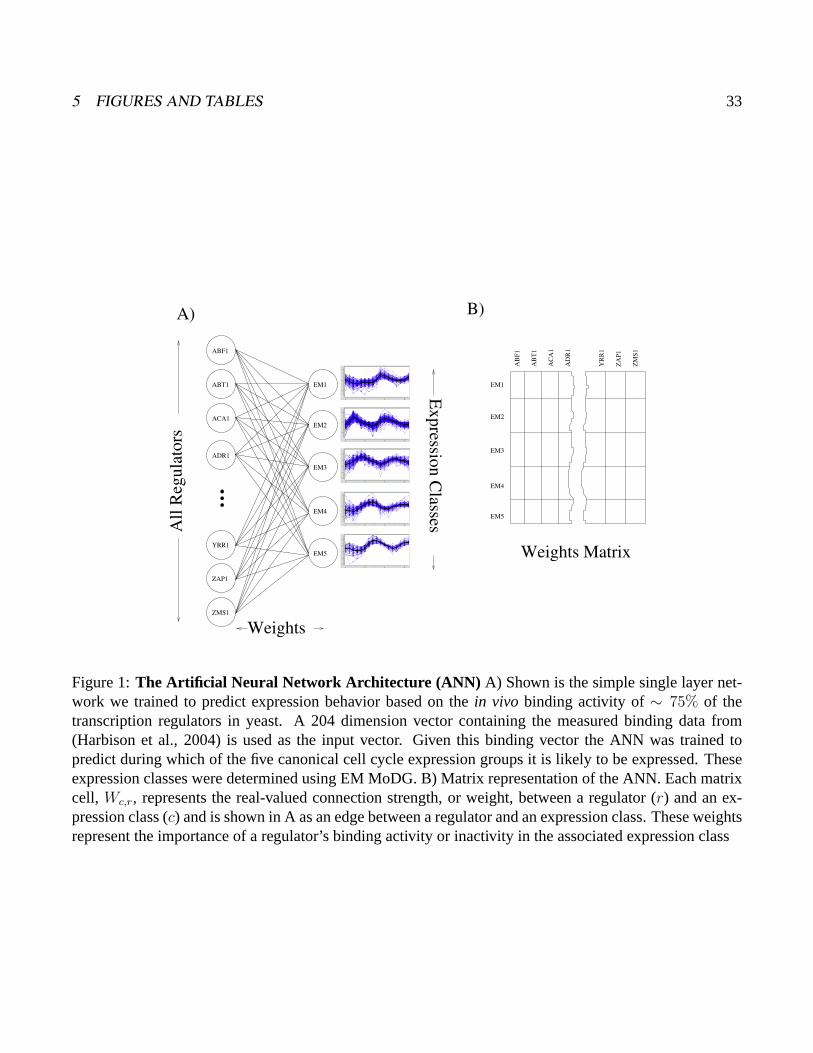
Figure 1:The Artificial Neural Network Architecture (ANN) A) Shown is the simple single layer net-work we trained to predict expression behavior based on thein vivo binding activity of∼ 75% of thetranscription regulators in yeast. A 204 dimension vector containing the measured binding data from(Harbison et al., 2004) is used as the input vector. Given this binding vector the ANN was trained topredict during which of the five canonical cell cycle expression groups it is likely to be expressed. Theseexpression classes were determined using EM MoDG. B) Matrix representation of the ANN. Each matrixcell, Wc,r, represents the real-valued connection strength, or weight, between a regulator (r) and an ex-pression class (c) and is shown in A as an edge between a regulator and an expression class. These weightsrepresent the importance of a regulator’s binding activity or inactivity in the associated expression class

5 FIGURES AND TABLES 34
1 4 10 55
1 2 142 3
2 66 7
1 40 3 6 5
25 2 2 3 1
26
5
46
4
77
3
168
2
64
1
70
1
149
2
75
3
57
4
33
5
Confusion Matrix- NMI= 0.65, NMI’= 0.62, LA = 0.86
EM
MoD
G E
xpression Class
NN Predictions
Figure 2:Confusion Array showing the average-of-best ANN vs EM MoDG expression classes. Herewe compare the expression class prediction of the average-of-bests ANN which was created by averaging40 ANNs trained to predict expression behavior from the binding data available for a gene. Each of the40 ANNs were trained on 80% of the data and tested on the remaining 20% and they were selected as thebest performing network out 10 networks trained on the same data split but initialized with differing seeds.These two classifications have a similarity of .86 by linear assignment (Hart et al., 2005)

5 FIGURES AND TABLES 35
������������ �� ��� ����� ����� ����� ���� ���� � � ������ �� � � � ���� �� �� ���� � �� � � ����� � �� ��� �� ����� � � ��� ���� ���� �� � ���� ��� � ��� � �� ���� � � � ���� ��� ���� ��� � �� �! � �� ��� � ��� � ���� ���� � �� �� � � �� �� � � � ���� � ��� ��� ���� ����� �� �� ���� ���� ���� ���� �� �� ��� � � ��� ��� ���� ��� � ��� � ���� �� ��� � �� � ��� ���� ���� ��� � ��� ���� ����� �� ���� ���! � � � ���� ���� ��� � � ��� ��� � ����� � � ��� ���� ���� ���� ���� � ��� ��� � ���� ���� ���� ���� ����� ���� � � � � ���� ���� ���� �����!� � �� ��" ���� ���" �� �� � � ��� �� �� ����� � ��
���� ���� � �� ��� ���� � �� ���� � ��� ��� ��� ���� �� � ��� ��� � ������� � ����� ��� � ���� �� � � �� ��� ���� �� �� ��� ��� � �� �� ��� � �� �" ���� ��# ��� ��� � ��� ��� ���# ��� � ��� ��"� ��� � � �� � ���� � ��� ���� ���� �� �� ���� �� ��� � � �� �"�� ��� � � �� ��� � �� �! �� � � ��� � �� � ���� � ��� � ����� ���� �� " � ��� ���� �� �� ����� � ��� � ��� ��$ � �� ���� � ��� ��� � � �� ���� ��% ����& ��� � ���� � ��� ���� � �� ��$ � �� ���� ���� ��� � �� � ���� ��� ���� ��� ���� ����� ���� �"� �� � �� ����� ��� � ��� ��� ��� ��!# ����
')(
*+,-./*/+/0,123456789:;7<85= 23> 24?@AB
(a)
Sum
ofS
quar
edW
eigh
tsD
istr
ibut
ion
Fig
ure
3

5 FIGURES AND TABLES 36
� � � � � ��� ��� ��� ������� �� ��� � � � � ��� ��� ��� ������� �� ��� � � � � ��� ��� ��� ����
� �� ���� � � � � � ��� ��� ��� ��������� ������ � � � � � ��� ��� ��� ����� �� ����
� �� ���� ����
���� ����
�����
� �� �� � ����
�!"�
#$%�
�!�� �&'� �
��� ��� ���� �
��( ���)
&��� ��"��"�(
#*��+�!
��"�� ����
+'��� ���
)!&,�
����+
��!� ��
�� ���� '���
&���
��$� !��
����� ��
&�!��- ��
�� !��� ��
&�
.0/21436587:9<;=.?>
�
�
�
�
�����
���������
@ AB C DEF GHIJ
F KGDLABM AC NO P Q RTSVUXWVY[Z \]S_^`SaZbUXcdY[efhg eiZbY[Z \]S_^jSVZkUdcdY[e
(b) Details of top Regulators
Figure 3
Figure 3:Weight matrix for the Average-of-bests ANN. a) Regulators were sorted based on the sum-of-squares metric (methods), and the total sum-of-square rank is plotted as a bar for each regulator. b) Shownare the top 20 regulators after sorting each regulator by importance in predicting expression behavior usinga sum-of-squared weights measure. The top panel reproduces a zoomed in view of the top 20 regulators asin panel a. Here each regulator’s bar is split into positive weights (red) and negative weights (blue). Theleft hand column shows a trajectory summary for each expression cluster as classified by EM MoDG. Theright hand color map represents the weight matrix where expression classes are displayed along the rowscorresponding to the drawn trajectory summaries. Regulators are sorted along the columns in rank order.Each cell is colored proportional to its value in the weight matrix.
5 FIGURES AND TABLES 37
����������� �����
(a) All Regulators
������������ ��������������
������� �!" #$%&'"(
�)*+ ���,-�. #$% )/0&12 3 '/' �45 �-!
�!' %)(,(-!6%)(74!�&-'0�*0-6
18*&9 �/�!0 &
��!+95!� �!"7
/4: )�$ 9(�/&)"# �#* 5)!
4*'
(%2&/"# !"� %�4
/-(;%'� /��,
<>=@?
?
=A?
B ?
C ?
D ?
E ?@?
E =@?
(b) Top 40 Regulators
Figure 4: Neural Network Rank Order Stability a) Shown are the regulators sorted by their sum-of-squares rank order (see methods). The line shows the mean ranking for each regulator across each ofthe 40 selected best ANNs, with the variance of each ranking shown as errorbars. b) shows the top 20regulators which show quite high stability.

5 FIGURES AND TABLES 38
� � � � � ��� ��� ��������� �� ��
� ��
���� ���� ����
����
�����
���� ���� ��
�!!�
"#�$
��#�
���� ���
� ����
��$
%�&$
��'! ����
(���)�
&���
� � � � � ��� ��� ��������� �� ��
���)
"'��
��'�
���� ��
"��� $
%���
���*)� ���$
&���� ��#
���"��
"�)
"�%$
# +�
&���
�,� �
�$&�%�
�-��
� � � � � ��� ��� �������� � ����
�-��
� �$
�-��
�,� ���� ��
"� -�����
��"�
' �� "��
$$���� ���
��&#� ���! ���� �"
-�����
��%� �
����
��"�
� � � � � ��� ��� ��������. �� � ����
&��� ���
� �����
����
�-��
�"�!
"'��
����
�&# !
"�)
"'��
���� ���� ���� ���� ��
)"���
���/ %�
�����)
� � � � � ��� ��� ��������� �� ��
# +�
"�"�
���/
����
&�%� ����
��# !
���!*�
����
����$
����
"�) ���
$"���$
'��� ���
��� $ ���� ���
) �"��
Top 10 Negative RegulatorsTop 10 Positive Regulators
Figure 5: ANN weights sorted on an expression class basis. Shown are the ANN weights from theaverage-of-best network as in figure 3 with the exception that the top and bottom regulators for each classare displayed. The regulator ranking for each class is simply based on its weight in the weight matrix foreach expression class. Detailed annotations for these regulators are listed in table 1

5 FIGURES AND TABLES 39
(a) Overview of network changes
Figure 6
5 FIGURES AND TABLES 40
�����
� �����
�������
�������
�����
�����
(b) Network changes for the top 50 regulators
Figure 6

5 FIGURES AND TABLES 41
�����
� �����
�������
�������
�����
�����
(c) Highlights of G1 network changes
Figure 6

5 FIGURES AND TABLES 42
Figure 6:in silico network mutations Shown are results from training ANNs missing one or more regula-tors as indicated on the left margin of each heatmap. Within each heatmap each cell represents a regulator,the position of the cell along the x-axis of the plot is determined by the mutated network, but the color isindicative of the regulator’s rank in the unperturbed network (as shown in figure 3). The lowest strip showsthe rank order color spectrum for the wildtype network a) An overview showing the overall rank stabilityof the regulators across all mutant networks generated. b) A higher resolution view of the top ranked reg-ulators for each mutant network. Only the top 50 regulators are shown, and the color spectrum is adjustedto only span 1-50. Any regulator that was ranked within the top 50 regulators in a mutant network, butnot in the wildtype network is shown as white. The position of Swi4 in each network is denoted by ’*’. c)A zoomed in version of our mutant network analysis focusing only on networks generated by the top G1regulators (Swi6, Mbp1, Stb1, Ace2, Swi5, Swi4).

5 FIGURES AND TABLES 43
Synchronization MethodAlpha Factor Cdc15 Cdc28
Alpha Factor 1.00 0.57 0.61Cdc15 - 1.00 0.47Cdc28 - - 1.00
Table 1: Similarity of clustering results from different synchronization methods as measured by LinearAssignment (Hart et al., 2005).
Figure 7: Overlap of cell cycle groups. Venn Diagram illustrating the total number of genes that arecycling in each of the three synchronization methods after our filtering and normalization.

5 FIGURES AND TABLES 44
� � ��� ��� ������� �� ������ � ��� ��� ���� ��
���� �� ������ � ��� ��� ���� ��
���� �� ����� � ��� ��� ���� ���
� ������ � ��� ��� �������
�� �� �� � � ��� ��� ������ �� ���� �� �� �� � � ��� ��� ���� ���� �� �� ���� � ��� ��� ������� �
� �����
�� �
���� ���� ���� ����
���� ��
������
��� ����
� �!�
���"# ��$� ���% ��
�����
����
� �!�
����
���! ���� ��
�� ��� ���� �&
��
'�����(
��$�!
'� � ���% &��! �
��� ���� ����
� �� �� � ��
�% ���� ���� ��&
�
'�$#�%�
'���!)(�
�
�
�
*
+
(a) Cdc15 ANN Weights, sorted by sum of squares
Figure 8

5 FIGURES AND TABLES 45
� � ��� ��� ������ ���� ���
�� � ���� ���� � �
�����
���� � �
����� � !� �
��� ��
����� ��
����� "�
����
����
���# $!%& ���
����
� ��
� � ��� ��� ���� �� ��� �� �� ���
�'��
��'�
� (� ��%�
� ��
�� �
����
�� # �����
��%�
(���
��(�
���� ��)
�����*
��(�
!��+
���� ���
�&�!%� � !�
� � ��� ��� ���� �� ��� �� �� ��
�!%�
�� #(���&
��,�&
$��� ##-
(� �
����
�'��
���� ��
��� ��.�
���� �
�!� ��!�
!,�� �
���(���
,����
� ��
����
� � ��� ��� ���� ��� �� �� �
��!�
���� � �,
� � �!%�
�'!�
����
����& ���
��(!�
���� � (� $��
� ##-
����
$���
����
���
����
'��� � !�
���
� � ��� ��� ������ �� ���� ���
��!��
(���&
��%��
��%��
����
���# $'���/-
����&
��'�
����
� ��
�%�� ��'� � �
�� !� �� ,
���!�
���� ��
��� � ��� ��� ����0� ��
��� �� ����
!,��
(���
����
��%� �
����
$!%& ���
����
,���
����
��� �!�
�����
�����
��� � �
�%/ ��'�
���� ���� �� # �'�
�� � ��� ��� ���� ���
�� �����
����
$%�� +��
���� � !��� "� ��
��$!%& ���
�����
���
�!"�
(� �
$,�& #��
����
��%��
�!%�
��'�
���� !
������ � �� #
� � ��� ��� ������ �� �����
����
$����&�
� ��
� ��
"'��
(�� ���
���(�
$� "�
����
�%�� ��
������
����
��%�&
����
�,� � ���# � !� �
�%��
(b) Cdc15 ANN Weights, sorted by expression class weights
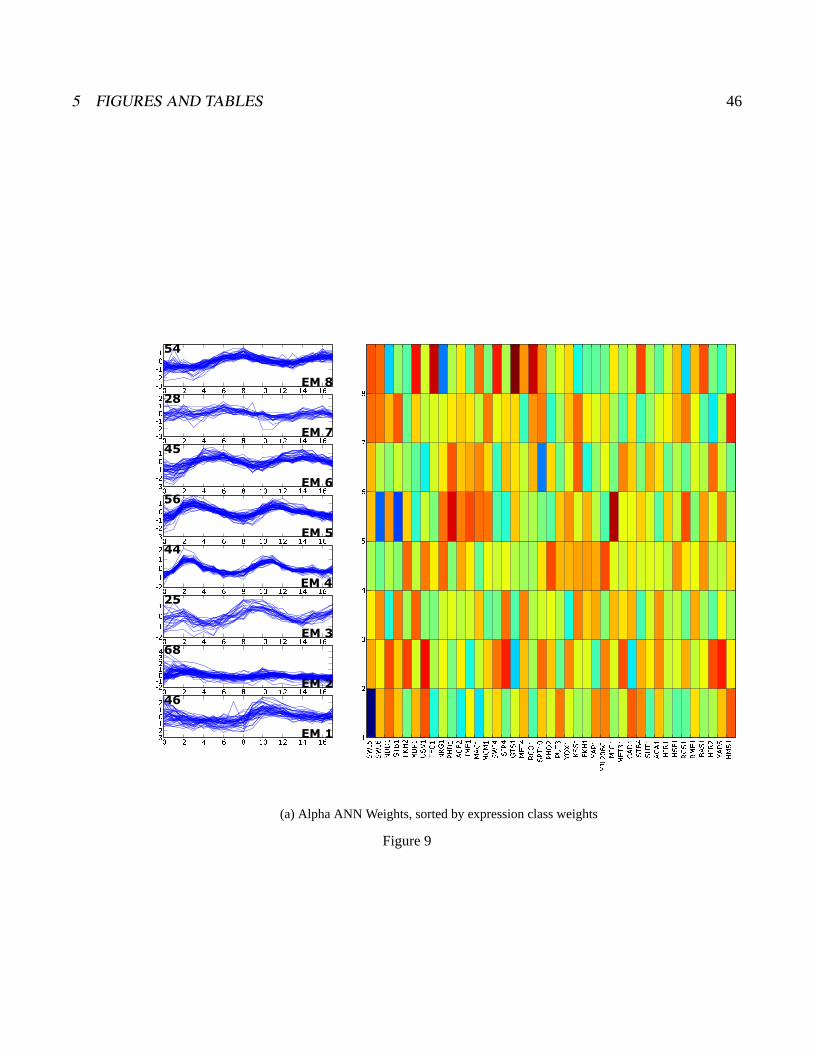
Figure 8
Figure 8:Cdc15 ANN weights. a) Shown are the ANN weights sorted by our sum-of-squares metric asin figure 3b. b) Shown are the ANN weights from the average-of-best network as in figure 5 for ANNstrained to predict RNA expression clusters derived from yeast cultures synchronized using Cdc15 TSmutant (Spellman et al., 1998)
5 FIGURES AND TABLES 46
� � � � � ��� ��� ��� ������� �� ��� � � � � ��� ��� ��� ���� �� �
� ���� � � � � ��� ��� ��� ���� �
� ���� � � � � ��� ��� ��� ���� �
� ���� � � � � � ��� ��� ��� ������� �� �� � � � � ��� ��� ��� �����
�� �� �� � � � � ��� ��� ��� �����
�� �� �� � � � � � ��� ��� ��� ������� �� �
�� � �� � ���� ����
����
����
����
���� �� �
���� !�
�� ���
�!��
����
�� " � �" ��� ���" ��
#�����$
��#� �
��% &#'�
���� ��
��&!��
&()�$�� �
����%�
�!�� ��
�" ����
!�!� �
������
���� ���
��!��
� �� &!�� ��
���
�
�
*
�
+
�
(a) Alpha ANN Weights, sorted by expression class weights
Figure 9

5 FIGURES AND TABLES 47
� � � � � ��� ��� ��� ������ �� ����
�� ���� ����
���� ����� ��
����
����
��� � ��� �
�� ������!
����
�� �
"�#�
��� ��
�� �$� �%
�#&�
� � � � � ��� ��� ��� ���� �� �� ����
"��
����
���� ��"�
��%���!('
�#) ����� ����
��� � %�
�� ���� � #���
����
&*��
�*� �� �
) ��
�$� �
���� ��� � � � � ��� ��� ��� ���� ��
���
�� +� #��� �%
��%) "�
����� ��
�� �
�� ��"� "��� *
��&�� �(,
�%� � ) ��
�)&-&� �%
� ��%� �*�
�& �
� � � � � ��� ��� ��� ���� ������ ��"
��� � "�
�� "��) ���� ����
����
� ���� �
���
���� �$� ��
���+�� ��
"� �� �
&*��
#�"�
&� .
�/��� ��
���
� � � � � ��� ��� ��� �������� �� �
�%� ��� �
�� � ) ��
!&�� �%
� *��
�� �"���/��� ��
#��
"��) ����
����
����
�%���!('
�����
���� �
�� ��"�� � � � � ��� ��� ��� ������
�� �� �
���
�$� &*�� "�
��#���� ��) �%
���!('
��� �� � �#
����� ��"
�*� �-&� �
�� -� � �
) ��
����� *#
.� � � � � ��� ��� ��� ������ �
� ����
���� �
�� ���) �%) *����
�����
%�� ���� � �
�
&*��
���
���
��� �&
���� *
� �� � �
��%� �
��� � � � � ��� ��� ��� ������
�� �� �
#�"�
#��� ��
� "���
*� ��
.�� ��
��� ����
�%���!('
�%) �"��
#���� ��
"� ��) &�� �%
� ��
� � ���� "��
(b) Alpha ANN Weights, sorted by expression class weights
Figure 9
Figure 9: Alpha Factor ANN weights. a) Shown are the ANN weights sorted by our sum-of-squaresmetric as in figure 3b. b) Shown are the ANN weights from the average-of-best network as in figure 5 forANNs trained to predict RNA expression clusters derived from yeast cultures synchronized using Cdc15TS mutant (Spellman et al., 1998)

5 FIGURES AND TABLES 48
1 2 3 4 5 6EM MoDG Cluster
-15
-10
-5
0
5
10
15
20
25
log p
-valu
e
(a) Mbp1 (EM2 or G1)
1 2 3 4 5 6EM MoDG Cluster
-4
-2
0
2
4
log p
-valu
e
(b) Swi5/Ace2 (EM1 or Early G1)
1 2 3 4 5 6EM MoDG Cluster
-4
-2
0
2
4
log p
-valu
e
(c) Fkh1 (EM3 or S)
1 2 3 4 5 6EM MoDG Cluster
-4
-2
0
2
4
6
8
10lo
g p
-valu
e
(d) Fkh2 (EM3 or S)
S. cerevisiae
S. paradoxus
S. mikatae
S. bayanus
Figure 10: Binding Site Enrichment and Depletion. For several of the regulators highlighted by strongpositive or negative association with particular expression classes (figure 5 and denoted pathetically) wecalculated site enrichment p-values for each EM MoDG cluster across each of shown Saccharomycesspecies (see methods). Each p-value was calculated using only the cell cycle identified genes that werealso used as input genes to the ANN. Each block of bars along the x-axis represent log p-values (y-axis)for a EM MoDG clusters. Each bar within these blocks are log p-value measurements for a differentSaccharomyces species as indicated by the color legend. Enrichment is shown as positive values (-logp-values) and depletion is shown as negative values( log p-values). The species have been arranged byevolutionary distance from S. cerevisiae. From left to right: S. cerevisiae, S. paradoxus, S. mikatae, S.bayanus. A dashed line along the graphs at p-value = .05 has been drawn to help visualize the scaledifference between the plots. a-d) enrichment bar charts for the specified binding sites, if the binding siteis referred to by a name other than the regulator that binds to it, the regulators that bind are parentheticallyshown. A displaying the color map used for each bar is shown at the bottom of the figure.

5 FIGURES AND TABLES 49
� � � � � ��� ��� ��� ��� ���� ���� ���� � ��
� ��
� ��
���
���
� � � � � ��� ��� ��� ��� ���� ���� ���� � ��� ��� ��������� ��
� � � � � ��� ��� ��� ��� ������
� �� �
�
�
��
� � � � � ��� ��� ��� ��� ���� �
� �
�
�
�
� � � � � ��� ��� ��� ��� ���� � ��� � ��� ���� ���� � ����������������������
� �
� �
� �
�
�
�
�
�������������������� "!#���
Figure 11: Binding Site Enrichment and Depletion for S. Pombe. Shown are the MCB enrichment p-values for S. pombe based an EM MoDG clustering of the expression data from (Rustici et al., 2004).Cluster summaries for each of the expression clusters are shown along the top panels, red lines are themean expression trajectory and cluster sizes are in the upper left corner. Below is a bar chart of p-values.Shown are the p-values normalized against only the cycling genes (blue) and p-values normalized againstthe whole genome (red).

6 SUPPLEMENTAL FIGURES 50
6 Supplemental Figures

6 SUPPLEMENTAL FIGURES 51
0 0.2 0.4 0.6 0.8 1
Prediction Accuracy
0
2
4
6
8
10
12
14
16
Num
ber
of
AN
Ns
(a) ANN Accuracy
0 50 100 150 200Mean rank in second 20 NN runs
0
50
100
150
200
Mean r
ank
in f
irst
20
NN
runs
(b) ANN Reproducibility
-0.2 0 0.2 0.4 0.6 0.8 1 1.2
Fraction of NNs correctly classifing
-200
0
200
400
600
800
1000
1200
Expre
ssio
n L
evel
(c) Predictability Vs Expression Level
-0.2 0 0.2 0.4 0.6 0.8 1 1.2
Fraction of NNs correctly classifing
-0.02
0
0.02
0.04
0.06
0.08
0.1
0.12
0.14
0.16
Bin
din
g L
evel
(d) Predictability Vs Binding Level
Figure 1:ANN Prediction Accuracy Histogram and correlations with binding and expression levels.We trained 40 ANNs (see methods) to predict a gene expression behavior from only the regulator bindingactivity upstream to its start of transcription. For each network we trained on 80% of the data and testedon the remaining 20%. a) The distribution of ANN accuracy across the 40 trained ANNs. Along the x-axisare bins of accuracy ranges, the y-axis counts the number of ANNs that showed the designated predictionaccuracy. b) Displays the relative reproducibility of the ANN rankings. Each regulator was ranked by itsnet influence in the ANN using a sum of squared weights metric across the classes in the weight matrix.Shown is a scatter plot of the regulator ranks from the first 20 ANNs vs the second 20 ANNs trained. c)Scatter plot of the predictability (fraction of ANNs correctly classifying a gene correctly) vs mean absoluteexpression level of the 4 highest measured time points for each gene. d) Predictability vs mean bindinglevel for the 10 highest bound regulators.
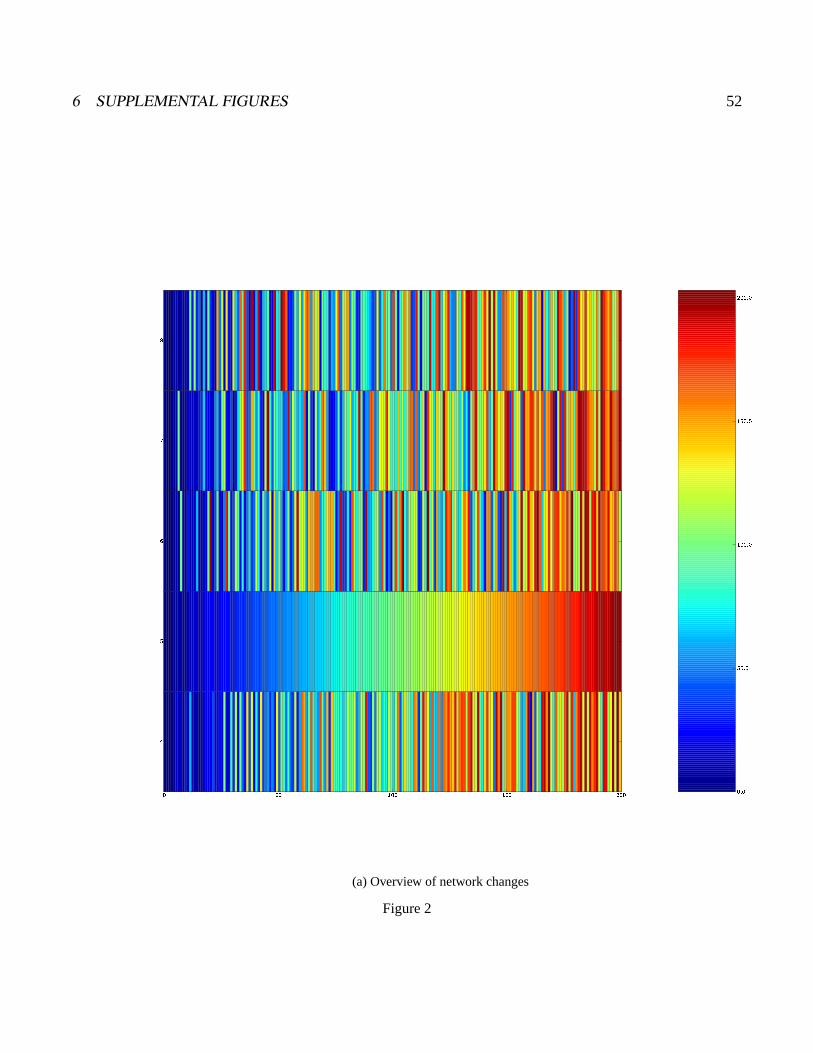
6 SUPPLEMENTAL FIGURES 52
� ��� ����� ����� �����
�
�
�
��� �
����� �
������� �
������� �
������� �
(a) Overview of network changes
Figure 2

6 SUPPLEMENTAL FIGURES 53
� ��� ��� ��� ��� ���� ���
�
�
�
�
�
�����
�������
�������
�������
�������
�������
(b) Network changes for the top 50 regulators
Figure 2
6 SUPPLEMENTAL FIGURES 54
Figure 2: Network Ranks Across Varying Ks Shown are results from training ANNs starting with aclustering composed of k=4,5,6,7 or 8 clusters. Within each heatmap each cell represents a regulator, theposition of the cell along the x-axis of the plot is determined by the k-altered network, but the color isindicative of the regulator’s rank in the k=5 network (as shown in figure 3). a) An overview showing theoverall rank stability of the regulators across all mutant networks generated. b) A higher resolution viewof the top ranked regulators for each mutant network. Only the top 50 regulators are shown, and the colorspectrum is adjusted to only span 1-50. Any regulator that was ranked within the top 50 regulators in amutant network, but not in the wildtype network is shown as white.

6 SUPPLEMENTAL FIGURES 55
� � ��� ��� ��� ��� ������� ���������������������� "!��#���%$'&)(*!��� ,+-��
��./���
��./���
��./���
��./0��
��./0��
��./���
��./���
��./1��
��./1��
��./2��
345 6778 9:; 4:<3=>9
Figure 3: We trained aobANNs (see methods) using only the top 3-30 regulators. Plotted is the aobANNperformance as a function of the number of top regulators included.

6 SUPPLEMENTAL FIGURES 56
21 5 2 3 3 6 2 1 5 5 17
15 5 4 2 3 10 3 5 6 12 83
25 8 4 3 3 4 1 3 4 1 19
30 5 3 3 1 1 2 4 6
17 4 3 3 1 1 1 3
108
0.04
27
0.12
13
0.21
14
0.29
10
0.38
3
0.46
22
0.54
6
0.62
10
0.71
18
0.79
25
0.88
125
0.96
70
1
148
2
75
3
55
4
33
5
Predictability Bins0
20
40
60
80
100
120
140
gene c
ount
EM
Clu
sters
Figure 4:Distribution of Neural Network Prediction Accuracy across EM MoDG Clusters. The y-axis on the top panel measures the number of genes correctly classified by the indicated fraction of thetrained ANNs (x-axis, bin range specified in the lower right corner of corresponding confusion array cells).Each bin is then broken up across the 5 EM MoDG clusters using a confusion array.

7 TABLE OF TOP REGULATORS 57
7 Table of Top regulators
Gene Descriptions for the top ten positively and negatively associated regulators for each cluster as
determined by the ANN weights matrix figure 5. (Source http://www.yeastgenome.org)

7 TABLE OF TOP REGULATORS 58
Cluster ± Regulator Description
+ SUT1 Involved in sterol uptake+ SWI5 transcriptional activator+ HAP5 Regulates respiratory functions; subunit of a heterotrimeric complex required for
CCAAT binding+ ACE2 involved in transcriptional regulation of CUP1. enters nucleus only at the end of mito-
sis.+ RTS2 similar to mouse KIN7 protein+ DAL80 Negative regulator of multiple nitrogen catabolic genes+ TEC1 transcription factor of the TEA/ATTS DNA-binding domain family, regulator of Ty1
expression+ AZF1 probable transcription factor, suppressor of mutation in the nuclear gene for the core
subunit of mitochondrial RNA polymerase+ YFL044C None+ MOT3 DNA-binding protein implicated in heme-dependent repression, repression of a sub-
set of hypoxic genes by Rox1p, repression of several DAN/TIR genes during aerobicgrowth, and regulation of membrane-related genes
EM 1
- NDD1 Nuclear Division Defective 1- YJL206C None- HAP2 Global regulator of respiratory genes- STB4 binds Sin3p in two-hybrid assay- GLN3 Responsible for nitrogen catabolite repression (NCR)-sensitive transcription. During
nitrogen starvation, Gln3 is nuclear. Under excess nitrogen, Gln3 is cytoplasmic. Alsoregulates glutamine-repressible gene products.
- YAP3 bZIP protein; transcription factor- WAR1- SFL1 Transcription factor with domains homologous to myc oncoprotein and yeast Hsf1p
required for normal cell surface assembly and flocculence- CAD1 Transcriptional activator involved in resistance to 1,10-phenanthroline; member of
yeast Jun-family of transcription factors related to mammalian c-jun- PHO2 Regulation of phosphate metabolism

7 TABLE OF TOP REGULATORS 59
Cluster ± Regulator Description
+ SWI6 Involved in cell cycle dependent gene expression+ MBP1 transcription factor+ STB1 binds Sin3p in two-hybrid assay and is present in a large protein complex with Sin3p
and Stb2p+ SFL1 Transcription factor with domains homologous to myc oncoprotein and yeast Hsf1p
required for normal cell surface assembly and flocculence+ WTM1 WD repeat containing transcriptional modulator 1+ LEU3 Regulates genes involved in branched chain amino acid biosynthesis and in ammonia
assimilation. Positively regulated by alpha-isopropylmalate, an intermediate in leucinebiosynthesis.
+ GAT1 activator of transcription of nitrogen-regulated genes; inactivated by increases in intra-cellular glutamate levels
+ YPR196W None+ HAP3 Regulates respiratory functions; encodes divergent overlapping transcripts+ NDT80 Meiosis-specific gene; mRNA is sporulation specific; required for exit from pachytene
and for full meiotic recombinationEM 2
- FKH2 Fork Head homolog two- NRG1 involved in regulation of glucose repression- PUT3 Positive regulator of PUT (proline utilization) genes- USV1 None- NDD1 Nuclear Division Defective 1- YOX1 Homeodomain protein that binds leu-tRNA gene. acts as a repressor at early cell cycle
boxes (ECBs) to restrict their activity to the M/G1 phase of the cell cycle.- MIG3- UME6 Regulator of both repression and induction of early meiotic genes. Ume6p requires
Ume4 for mitotic repression and interacts with and requires Ime1p and Rim11p forinduction of meiosis-specific transcription
- SMP1 Second MEF2-like Protein 1<br>Transcription factor of the MADS (Mcm1p, Aga-mous, Deficiens, SRF) box family; closely related to RLM1
- ARO80

7 TABLE OF TOP REGULATORS 60
Cluster ± Regulator Description
+ FKH1 forkhead protein+ PUT3 Positive regulator of PUT (proline utilization) genes+ FKH2 Fork Head homolog two+ USV1 None+ ARR1 Similar to transcriptional regulatory elements YAP1 and cad1+ RLM1 serum response factor-like protein that may function downstream of MPK1 (SLT2)
MAP-kinase pathway+ YKL222C None+ WTM2 WD repeat containing transcriptional modulator 2+ BYE1+ MAL33 Part of complex locus MAL3; nonfunctional in S288C, shows homology to both func-
tional & nonfunctional MAL-activator proteins in other Sc strains & to other nonfunc-tional MAL-activator sequences from S288C (i.e. MAL33, YPR196W, & YFL052W)
EM 3
- WTM1 WD repeat containing transcriptional modulator 1- ACE2 involved in transcriptional regulation of CUP1. enters nucleus only at the end of mito-
sis.- ARG81 Regulator of arginine-responsive genes with ARG80 and ARG82- IFH1 Interacts with fork head protein. Protein controlling pre-rRNA processing machinery
in conjunction with Fhl1p- SMK1 SMK1 encodes a mitogen-activated protein kinase required for spore morphogenesis
that is expressed as a middle sporulation-specific gene.- RPI1 possesses a transcriptional activation domain and affects the mRNA levels of several
cell wall metabolism genes.- HAP4 Regulates respiratory functions; encodes divergent overlapping transcripts- INO2 Transcription factor required for derepression of inositol-choline-regulated genes in-
volved in phospholipid synthesis- SFL1 Transcription factor with domains homologous to myc oncoprotein and yeast Hsf1p
required for normal cell surface assembly and flocculence- RAP1 DNA-binding protein involved in either activation or repression of transcription, de-
pending on binding site context. Also binds telomere sequences and plays a role intelomeric position effect (silencing) and telomere structure.

7 TABLE OF TOP REGULATORS 61
Cluster ± Regulator Description
+ NDD1 Nuclear Division Defective 1+ DAL81 Positive regulator of multiple nitrogen catabolic genes+ ACA1 contains an ATF/CREB-like bZIP domain; transcriptional activator+ PDC2 Regulates transcription of PDC1 and PDC5, which encode pyruvate decarboxylase+ FKH2 Fork Head homolog two+ IME4 IME4 appears to activate IME1 in response to cell-type and nutritional signals and
thereby regulate meiosis+ MBF1+ WAR1+ INO4 Transcription factor required for derepression of inositol-choline-regulated genes in-
volved in phospholipid synthesis+ UME6 Regulator of both repression and induction of early meiotic genes. Ume6p requires
Ume4 for mitotic repression and interacts with and requires Ime1p and Rim11p forinduction of meiosis-specific transcription
EM 4
- SWI6 Involved in cell cycle dependent gene expression- GAT1 activator of transcription of nitrogen-regulated genes; inactivated by increases in intra-
cellular glutamate levels- FAP7- MAC1 metal-binding transcriptional activator- YAP6 bZIP protein- HIR1 Involved in cell-cycle regulation of histone transcription- HAP5 Regulates respiratory functions; subunit of a heterotrimeric complex required for
CCAAT binding- TEC1 transcription factor of the TEA/ATTS DNA-binding domain family, regulator of Ty1
expression- SWI5 transcriptional activator- MBP1 transcription factor

7 TABLE OF TOP REGULATORS 62
Cluster ± Regulator Description
+ YOX1 Homeodomain protein that binds leu-tRNA gene. acts as a repressor at early cell cycleboxes (ECBs) to restrict their activity to the M/G1 phase of the cell cycle.
+ MCM1 Involved in cell-type-specific transcription and pheromone response+ FAP7+ CRZ1 calcineurin responsive zinc-finger+ NRG1 involved in regulation of glucose repression+ HAP5 Regulates respiratory functions; subunit of a heterotrimeric complex required for
CCAAT binding+ PHO4 Transcription factor that activates expression of phosphate pathway+ YDR049W None+ PHD1 protein similar to StuA of Aspergillus nidulans+ SPT23 Dosage dependent suppressor of Ty-induced promoter mutations. Homolog of Mga2.
Spt23p and Mga2p differentially activate and regulate OLE1 transcription.EM 5
- HMS1 High-copy mep2 suppressor- SWI6 Involved in cell cycle dependent gene expression- HSF1 heat shock transcription factor- LEU3 Regulates genes involved in branched chain amino acid biosynthesis and in ammonia
assimilation. Positively regulated by alpha-isopropylmalate, an intermediate in leucinebiosynthesis.
- STP2 Involved in pre-tRNA splicing and in uptake of branched-chain amino acids- BAS1 Transcription factor regulating basal and induced activity of histidine and adenine
biosynthesis genes- MAL13 Part of complex locus MAL1; nonfunctional in S288C, shows homology to both func-
tional & nonfunctional MAL-activator proteins in other Sc strains & to other nonfunc-tional MAL-activator sequences from S288C (i.e. MAL33, YPR196W, & YFL052W)
- HIR3 Involved in cell-cycle regulation of histone transcription- UME6 Regulator of both repression and induction of early meiotic genes. Ume6p requires
Ume4 for mitotic repression and interacts with and requires Ime1p and Rim11p forinduction of meiosis-specific transcription
- PPR1 Positive regulator of URA1 and URA3
Table 2:
Related Documents