Department of Geo-information Processing AGILE AGILE Interoperability Interoperability Workshop, Lyon, April 23rd, 2003 Workshop, Lyon, April 23rd, 2003 Connecting Distributed Geoservices: Connecting Distributed Geoservices: Interoperability research at ITC Interoperability research at ITC Barend Köbben & Rob Lemmens {kobben,lemmens}@itc.nl International Institute for Geo-information Science and Earth Observation (ITC)

Welcome message from author
This document is posted to help you gain knowledge. Please leave a comment to let me know what you think about it! Share it to your friends and learn new things together.
Transcript
Department of Geo-information Processing
AGILE AGILE InteroperabilityInteroperability Workshop, Lyon, April 23rd, 2003 Workshop, Lyon, April 23rd, 2003
Connecting Distributed Geoservices: Connecting Distributed Geoservices: Interoperability research at ITCInteroperability research at ITC
Barend Köbben & Rob Lemmens {kobben,lemmens}@itc.nl
International Institute for Geo-information Science and Earth Observation (ITC)
Department of Geo-information Processing
ITC Research related to interoperabilityITC Research related to interoperability
Knowledge node Distributed Geoservices 4 fte, within Department of Geo-Information Processing geodata infrastructure, internet / mobile gis (,multiscale)
MSc and PhD student projects Discovery & chaining of Webservices Consuming Webservices
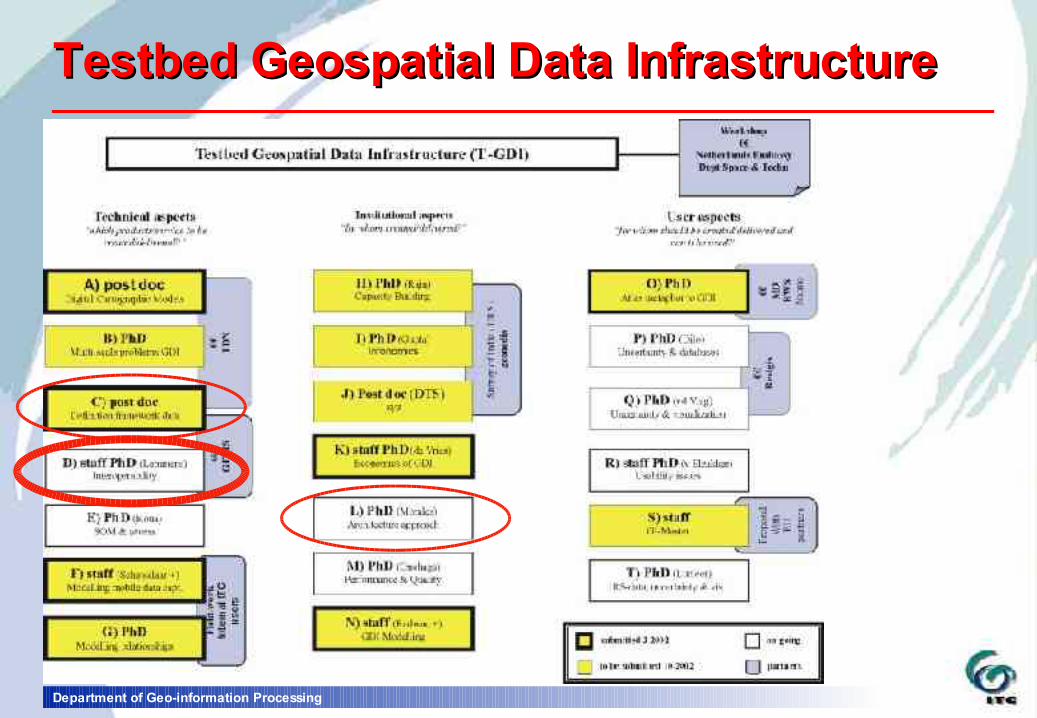
Input in various research projects Testbed GeoData Infrastructure (T-GDI)
research Rob Lemmens paper Lemmens / de Vries Interoperable Web services for Risk Indicator Maps
(SLARIM) Cross Border GDI presentation Lars Bernard
Department of Geo-information Processing
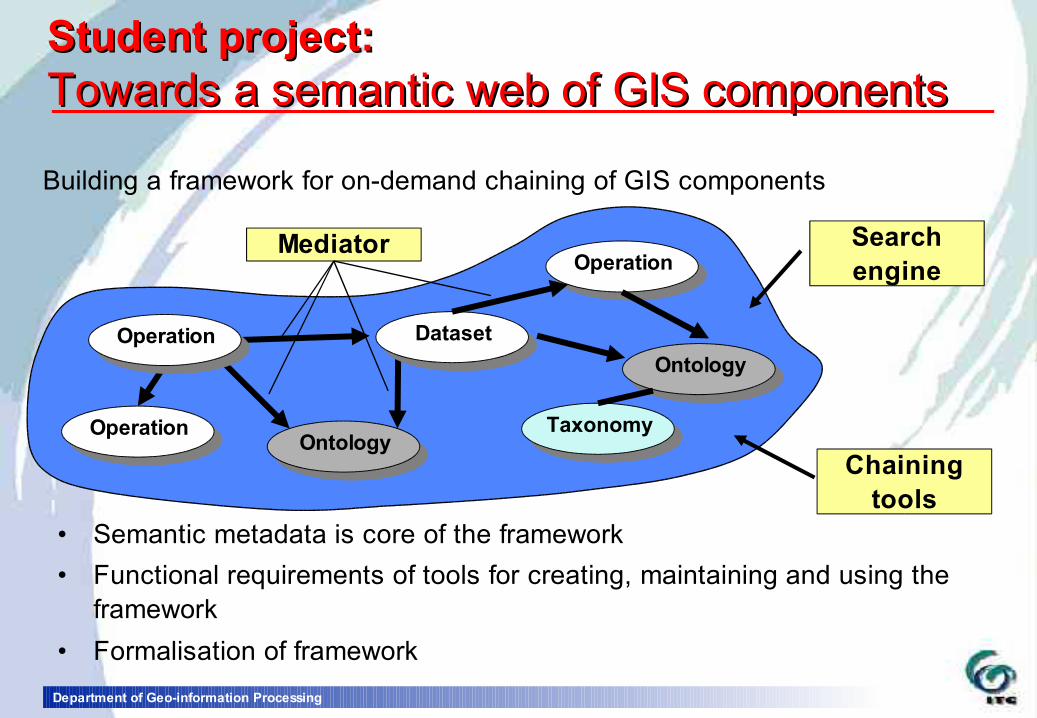
Student project: Student project: Towards a semantic web of GIS componentsTowards a semantic web of GIS components
Operation Dataset
OntologyOperation Taxonomy
OperationMediator Search
engine
Chaining tools
Ontology
• Semantic metadata is core of the framework• Functional requirements of tools for creating, maintaining and using the
framework • Formalisation of framework
Building a framework for on-demand chaining of GIS components
Department of Geo-information Processing
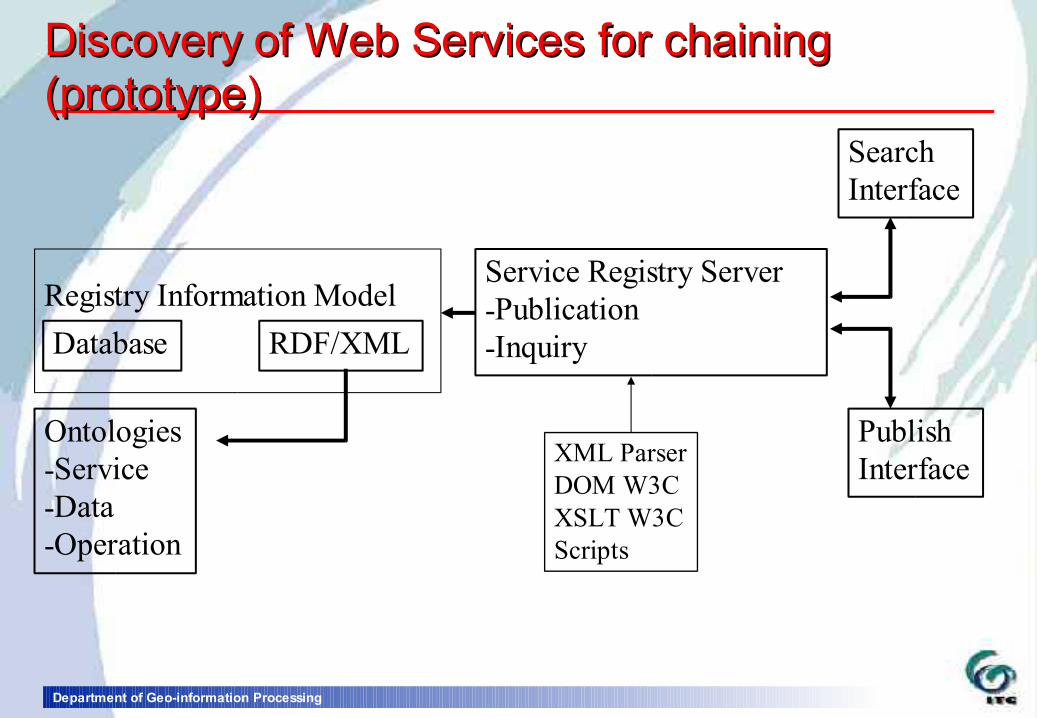
Service Registry Server-Publication-Inquiry
SearchInterface
PublishInterface
Ontologies-Service-Data-Operation
Database RDF/XMLRegistry Information Model
XML ParserDOM W3CXSLT W3CScripts
Discovery of Web Services for chaining Discovery of Web Services for chaining (prototype)(prototype)
Department of Geo-information Processing
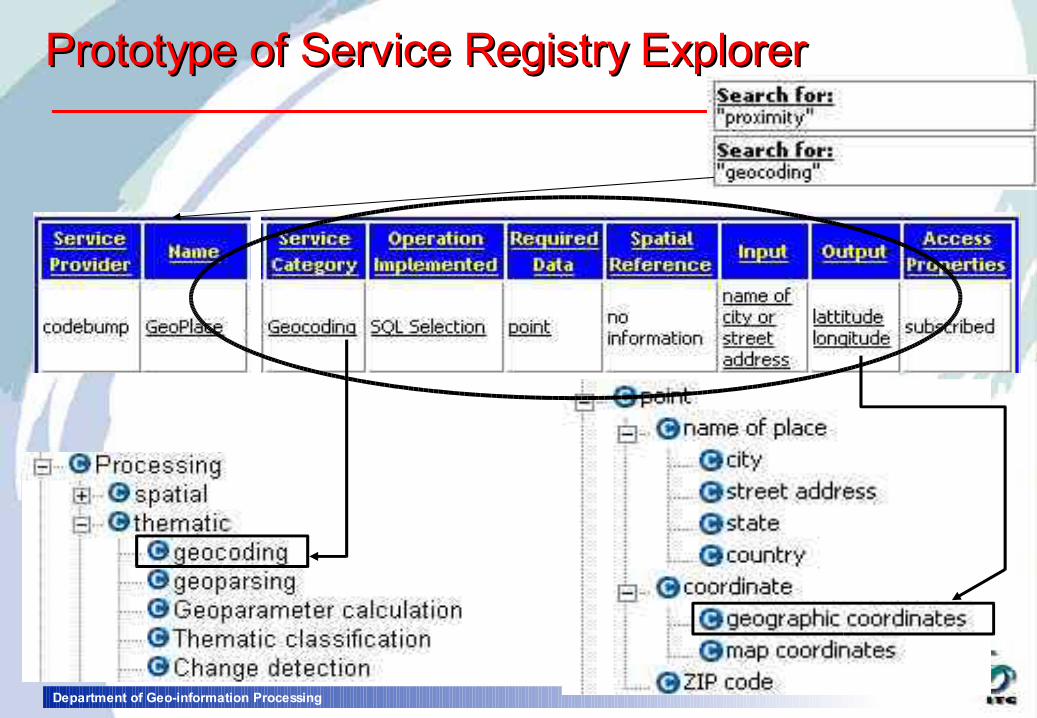
Prototype of Service Registry ExplorerPrototype of Service Registry Explorer

Department of Geo-information Processing
•Classes (concepts)•Properties•Relationships
ISO 19119 as ontology (Ontoedit)ISO 19119 as ontology (Ontoedit)
Department of Geo-information Processing
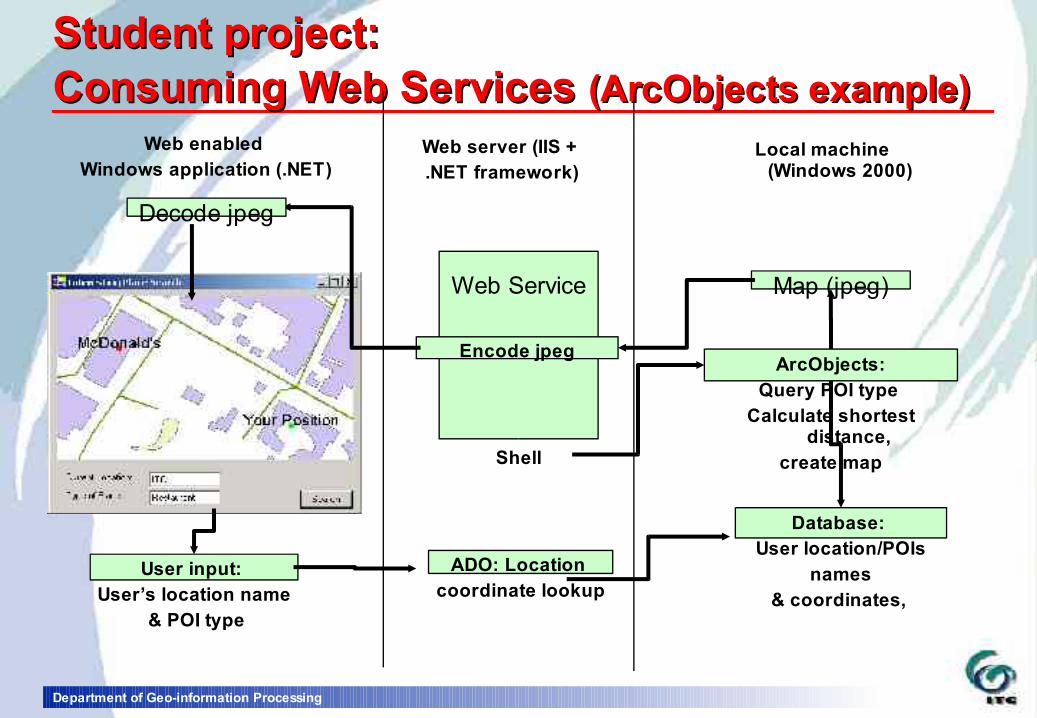
Student project: Student project: Consuming Web Services Consuming Web Services (ArcObjects example)(ArcObjects example)
User input: User’s location name
& POI type
Web Service
Database: User location/POIs
names & coordinates,
ArcObjects:Query POI type
Calculate shortest distance,
create map
Map (jpeg)
Encode jpeg
Web enabled Windows application (.NET)
Web server (IIS + .NET framework)
Local machine (Windows 2000)
ADO: Location coordinate lookup
Shell
Decode jpeg
Department of Geo-information Processing
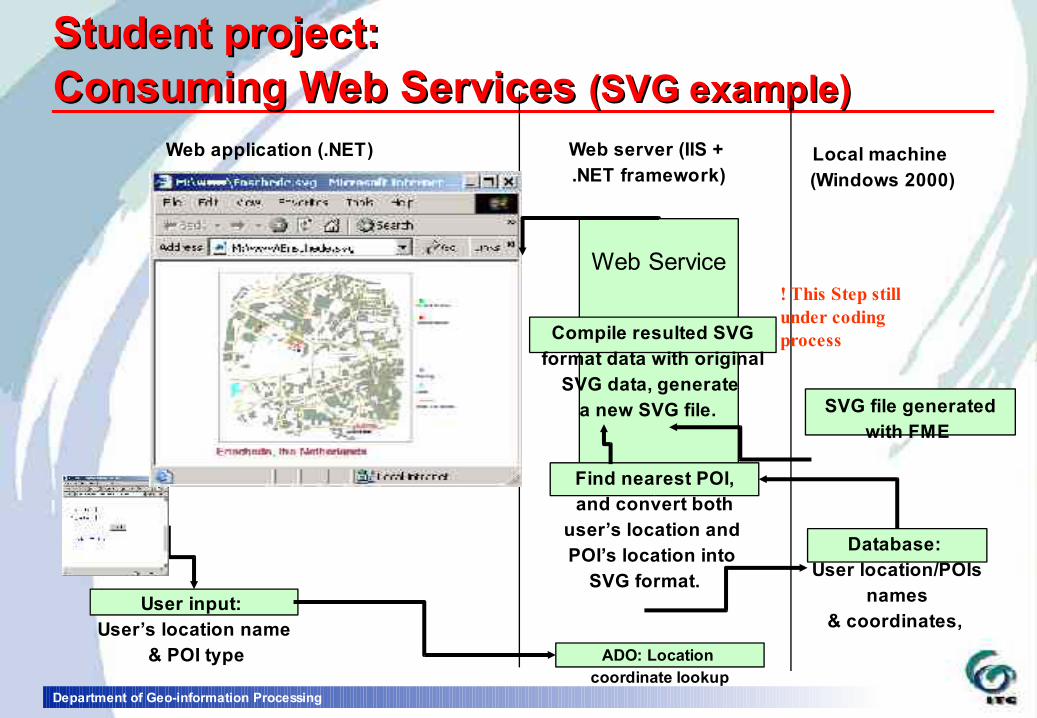
Student project: Student project: Consuming Web Services Consuming Web Services (SVG example)(SVG example)
User input: User’s location name
& POI type
Web Service
Database: User location/POIs
names & coordinates,
Web application (.NET) Web server (IIS + .NET framework)
Local machine (Windows 2000)
ADO: Location coordinate lookup
Find nearest POI, and convert both
user’s location and POI’s location into
SVG format.
Compile resulted SVG format data with original
SVG data, generate a new SVG file.
! This Step still under coding process
SVG file generated with FME
Department of Geo-information Processing
Testbed Geospatial Data InfrastructureTestbed Geospatial Data Infrastructure

Department of Geo-information Processing
Web services scenario - exampleWeb services scenario - example
Disaster event: “Is this place in danger?”
Your location: Street address
Geocoding Hazard database
Your location (X,Y)
Spatial analysis
Visualisation
Local hazard map
Local hazard dataset
Crd transf
GPS
Mobile Local office
Distributed web
services
Department of Geo-information Processing
SLARIM projectSLARIM project
Strengthening Local Authorities in Risk Management methodology for the implementation of risk assessment
and spatial decision support systems for risk management by local authorities flood and earthquake threatened urban areas directed towards the needs of medium sized local
authorities in developing countries ITC staff-members input supported by
visiting scientists and PhD research

Department of Geo-information Processing
Online mapping of risk indicatorsOnline mapping of risk indicators
Methods: Cartographic design of risk indicator maps (RIMs) Technical concepts of RIM Web services
In order to design RIMs, one needs: Analysis of geospatial risk data (from other WPs) Cartographic grammar for visualisation of (real and
perceived) risks Theoretical review (eg. of perception properties) Best practices review (real solutions)

Department of Geo-information Processing
Interoperable Web services for Risk Interoperable Web services for Risk Indicator Maps (SLARIM WP3300 + 3500)Indicator Maps (SLARIM WP3300 + 3500)Interoperability aspects and visualisationKeywords:
On-line, distributed data Scalable (ranging from in-office planning to rapid
response in the field) Time-aware (comparisons, real-time, extrapolation) Distributed processing, interoperability research and
the impact of OpenGIS specs XML-based solutions (GML,SVG for visualisation)

Department of Geo-information Processing
(GML,XHTML,Xforms,SVG, etc…) = XML(GML,XHTML,Xforms,SVG, etc…) = XML
XMLXHTML
SVG
SMILXSLT + DTD
Xforms
GML

Department of Geo-information Processing
Thank you for your attention!Thank you for your attention!
{kobben,lemmens}@itc.nl
Related Documents