Connecting bacterial colonization to physical and biochemical changes in a sand box infiltration experiment S. Rubol a,c,⇑ , A. Freixa b , A. Carles-Brangarí c , D. Fernàndez-Garcia c , A.M. Romaní b , X. Sanchez-Vila c a Dept. of Civil, Environmental and Mechanical Engineering, University of Trento, Italy b Institute of Aquatic Ecology, University of Girona, Spain c Hydrogeology Group, Dept. Geotechnical Engineering and Geosciences, Universitat Politècnica de Catalunya, UPC-BarcelonaTech, Spain article info Article history: Received 15 January 2014 Received in revised form 13 May 2014 Accepted 15 May 2014 Available online 24 May 2014 This manuscript was handled by Peter K. Kitanidis, Editor-in-Chief, with the assistance of Christophe Darnault, Associate Editor Keywords: Infiltration Microbial growth Clogging Water retention curve EPS Preferential flow summary Infiltration through sediments is linked to complex biogeochemical processes occurring at small spatial scales, often leading to a progressive reduction in infiltration rates due to microbial growth and/or mechanical clogging. Unraveling the linkage between microbial dynamics and water infiltration in a het- erogeneous medium is of concern in artificial recharge ponds and natural infiltration systems. We present an 84-day laboratory infiltration experiment that aims at studying the temporal variation of selected bio- geochemical parameters at different depths along the infiltration path. The experimental setup consists of a 1.2 m high tank packed with a heterogeneous soil and instrumented with arrays of sensors as well as soil and liquid samplers. Results indicate that: (i) microbial processes are responsible for infiltration reduction, enhancing the spatially heterogeneous distribution of infiltration rates with time, (ii) bacteria and extracellular polymeric substances (EPS) are present at all monitored depths, indicating the potential for deep biological clogging, (iii) bacteria functioning and richness exhibit depth zonation after the sys- tem reaches a mature state and (iv) the retention curve changes towards highest saturation by the end of the experiment. The increase in water holding capacity is largest at depth, where the presence of EPS is noticeable. The reduction in time of the quantity of water infiltrating along the tank can only be accounted for with a truly interdisciplinary approach involving physical, chemical and biological processes. Ó 2014 Elsevier B.V. All rights reserved. 1. Introduction In natural porous media the flow of water is the basis for a number of complex interactions between physical, geochemical, and biological processes that occur at different spatial and tempo- ral scales. Accounting for such interrelationships using an interdis- ciplinary approach is crucial for understanding natural, induced or artificial infiltration systems, and thus it is of interest for the water resources management sectors. While it is well known that artificial recharge ponds, slow sand filters and river bed surfaces can clog over time due to microbial activity (Baveye et al., 1998; Vandevivere and Baveye, 1992; Vandevivere et al., 1999), limited investigation have been carried out to investigate the role of different microbial components at different depths, as well as the non-stationary effects on preferential flow paths. Mathematical models, field and laboratory experiments have traditionally been conducted to improve our understanding of the hydrodynamic effects and the biochemical processes regulating such systems (Hunter et al., 1998; Tuxen et al., 2006; Van Stempvoort and Kwong, 2010). However, the actual objectives as well as the approaches used in both modeling and experimen- tal studies differ substantially among scientific disciplines (Morgenroth and Milferstedt, 2009). On the one hand, hydrogeo- chemists typically focus on the understanding of changes in soil physical properties. This includes accounting for the effects of water infiltration (Rogiers et al., 2012; Pfingsten et al., 2006) and the dynamics of flow and transport both in aquifers and in the hyp- orheic zones (Farnsworth and Hering, 2011; Krause et al., 2011). Additional research explores the transport of reactive substances, where bacteria act as kinetic reactions catalysts (Gramling et al., 2002; Wissmeier and Barry, 2008). On the other hand, microbial ecologists study porous media to investigate biogeochemical processes such as microbial metabo- lism (responsible for the uptake and the storage of nutrients and organic matter), or diversity and structure for bio-fouling and http://dx.doi.org/10.1016/j.jhydrol.2014.05.041 0022-1694/Ó 2014 Elsevier B.V. All rights reserved. ⇑ Corresponding author at: Dept. of Civil, Environmental and Mechanical Engineering, University of Trento, Italy. Tel.: +39 0461282617. E-mail address: [email protected] (S. Rubol). Journal of Hydrology 517 (2014) 317–327 Contents lists available at ScienceDirect Journal of Hydrology journal homepage: www.elsevier.com/locate/jhydrol

Welcome message from author
This document is posted to help you gain knowledge. Please leave a comment to let me know what you think about it! Share it to your friends and learn new things together.
Transcript
Journal of Hydrology 517 (2014) 317–327
Contents lists available at ScienceDirect
Journal of Hydrology
journal homepage: www.elsevier .com/ locate / jhydrol
Connecting bacterial colonization to physical and biochemical changesin a sand box infiltration experiment
http://dx.doi.org/10.1016/j.jhydrol.2014.05.0410022-1694/� 2014 Elsevier B.V. All rights reserved.
⇑ Corresponding author at: Dept. of Civil, Environmental and MechanicalEngineering, University of Trento, Italy. Tel.: +39 0461282617.
E-mail address: [email protected] (S. Rubol).
S. Rubol a,c,⇑, A. Freixa b, A. Carles-Brangarí c, D. Fernàndez-Garcia c, A.M. Romaní b, X. Sanchez-Vila c
a Dept. of Civil, Environmental and Mechanical Engineering, University of Trento, Italyb Institute of Aquatic Ecology, University of Girona, Spainc Hydrogeology Group, Dept. Geotechnical Engineering and Geosciences, Universitat Politècnica de Catalunya, UPC-BarcelonaTech, Spain
a r t i c l e i n f o
Article history:Received 15 January 2014Received in revised form 13 May 2014Accepted 15 May 2014Available online 24 May 2014This manuscript was handled by Peter K.Kitanidis, Editor-in-Chief, with theassistance of Christophe Darnault, AssociateEditor
Keywords:InfiltrationMicrobial growthCloggingWater retention curveEPSPreferential flow
s u m m a r y
Infiltration through sediments is linked to complex biogeochemical processes occurring at small spatialscales, often leading to a progressive reduction in infiltration rates due to microbial growth and/ormechanical clogging. Unraveling the linkage between microbial dynamics and water infiltration in a het-erogeneous medium is of concern in artificial recharge ponds and natural infiltration systems. We presentan 84-day laboratory infiltration experiment that aims at studying the temporal variation of selected bio-geochemical parameters at different depths along the infiltration path. The experimental setup consistsof a 1.2 m high tank packed with a heterogeneous soil and instrumented with arrays of sensors as well assoil and liquid samplers. Results indicate that: (i) microbial processes are responsible for infiltrationreduction, enhancing the spatially heterogeneous distribution of infiltration rates with time, (ii) bacteriaand extracellular polymeric substances (EPS) are present at all monitored depths, indicating the potentialfor deep biological clogging, (iii) bacteria functioning and richness exhibit depth zonation after the sys-tem reaches a mature state and (iv) the retention curve changes towards highest saturation by the end ofthe experiment. The increase in water holding capacity is largest at depth, where the presence of EPS isnoticeable. The reduction in time of the quantity of water infiltrating along the tank can only beaccounted for with a truly interdisciplinary approach involving physical, chemical and biologicalprocesses.
� 2014 Elsevier B.V. All rights reserved.
1. Introduction
In natural porous media the flow of water is the basis for anumber of complex interactions between physical, geochemical,and biological processes that occur at different spatial and tempo-ral scales. Accounting for such interrelationships using an interdis-ciplinary approach is crucial for understanding natural, induced orartificial infiltration systems, and thus it is of interest for the waterresources management sectors. While it is well known thatartificial recharge ponds, slow sand filters and river bed surfacescan clog over time due to microbial activity (Baveye et al., 1998;Vandevivere and Baveye, 1992; Vandevivere et al., 1999), limitedinvestigation have been carried out to investigate the role ofdifferent microbial components at different depths, as well as thenon-stationary effects on preferential flow paths.
Mathematical models, field and laboratory experiments havetraditionally been conducted to improve our understanding of thehydrodynamic effects and the biochemical processes regulatingsuch systems (Hunter et al., 1998; Tuxen et al., 2006; VanStempvoort and Kwong, 2010). However, the actual objectivesas well as the approaches used in both modeling and experimen-tal studies differ substantially among scientific disciplines(Morgenroth and Milferstedt, 2009). On the one hand, hydrogeo-chemists typically focus on the understanding of changes in soilphysical properties. This includes accounting for the effects ofwater infiltration (Rogiers et al., 2012; Pfingsten et al., 2006) andthe dynamics of flow and transport both in aquifers and in the hyp-orheic zones (Farnsworth and Hering, 2011; Krause et al., 2011).Additional research explores the transport of reactive substances,where bacteria act as kinetic reactions catalysts (Gramling et al.,2002; Wissmeier and Barry, 2008).
On the other hand, microbial ecologists study porous media toinvestigate biogeochemical processes such as microbial metabo-lism (responsible for the uptake and the storage of nutrients andorganic matter), or diversity and structure for bio-fouling and
318 S. Rubol et al. / Journal of Hydrology 517 (2014) 317–327
water technology implications (Romani et al., 1998; Battin andSengschmitt, 1999; Calderón et al., 2012). The cited studies havebeen conducted either in natural surface sediments or at themicrobioreactor scale, where the effect of spatial variability inwater flow at the mesoscale can hardly be reproduced(Morgenroth and Milferstedt, 2009; Seymour et al., 2004).
Recently, some authors tried to combine the knowledge fromboth communities by linking flow to bacterial activity in flumes,sand boxes, or field experiments (Durham et al., 2012; Rubolet al., 2012; Foulquier et al., 2010; Hödl et al., 2011; Weiss andCozzarelli, 2008). Field observations stress the relevance of waterfluxes on microbial biofilm development (Baveye et al., 1998;Thullner, 2010; Pedretti et al., 2011) as well as the need for betterwater tracing to define clogging and biogeochemical processes inthe hyporheic sediments (Nogaro et al., 2010).
Interdisciplinarity is a key element to approach a number ofenvironmental issues which have in common the presence ofwater and bacterial activity under changing redox conditions. Forinstance, the availability of water, oxygen and nutrients is the lim-iting factor controlling bacterial growth and metabolic activity(Hall et al., 2012; Rubol et al., 2013). Furthermore, bacterial growthmay cause pore-clogging, linked to the production of extracellularpolymeric substances (EPS), with the subsequent changes in thedistribution of pore sizes and the increase in the soil water holdingcapacity (Thullner et al., 2002). Or et al. (2007b) concluded thatbiofilms develop preferentially in the largest pores (whereas dis-crete colonies develop at pore constrictions and near grain con-tacts), incrementing the residence time for dissolved nutrients,and thus the potential for reactions to occur.
A point that complicates the analysis of flow and microbialinteraction in real sites is soil heterogeneity, potentially causingthe development of preferential flow pathways through which dis-solved oxygen and chemical compounds (nutrients) can concen-trate in local areas. Beven and Germann (1982) observed thatsuch preferential flows could promote a faster and a deeper prop-agation of the moisture front while bypassing large portions of theporous system. Therefore, hazardous compounds such as pesti-cides might migrate deep in the geological formation (Flury,1996; Samm et al., 1998). Moreover, the sorption capacity and deg-radation rates at preferential flow pathways may substantially dif-fer from those of other parts of the soil, leading to differentmicrobial populations (Pivetz and Steenhuis, 1995; Mallawatantriet al., 1996). Vinther et al. (1999) and Bundt et al. (2001) found thatboth substrate availability and nutrient supply are largest in pref-erential flow paths, leading to enhanced values of bacterial bio-mass and associated microbial processes, ultimately promotingbioclogging and thus water diversion (see also Thullner andBaveye, 2008). Yet, studying these mutual effects is highly chal-lenging, given the non-stationary nature of microbial activity inresponse to environmental changes. Understanding this interrela-tionship can provide keen information for river bed systems andartificial recharge ponds management. For instance, advancingthe knowledge in biochemical processes, and their possible bypassin case of preferential flow, can provide useful insight on the feasi-bility of improving the quality of infiltrating water in artificialrecharge by promoting in situ biological treatments.
In this work, we performed an experimental study to measurethe temporal evolution of infiltration under artificial rechargeconditions, using an interdisciplinary approach that treats hydro-biogeochemical processes simultaneously. The study is conductedon a meter-scale lysimeter, system slightly larger than what hasbeen used so far, aiming at monitoring relevant infiltration pro-cesses and biogeochemical activity at selected depths. Our specificobjective was to address the following questions: (i) How do phys-icochemical characteristics and biological activity interact andchange spatially and temporally? (ii) How is the infiltration rate
modulated in time by microbial and hydromechanical processes?(iii) How does microbial colonization develop along the soil profileunder continuous infiltration? and (iv) Are changes in microbialand hydromechanical processes affecting the soil retention curve?
To answer these questions, we built a 1.2 m vertical tank packedwith heterogeneous soil and instrumented with arrays of sensorsplus liquid and solid samplers. They were located at differentdepths along the tank in order to monitor a suitable number ofphysical, biological, and chemical quantities in space and for upto 84 days. Our system is capable of assessing and monitoringsimultaneously: (i) The development of a natural freshwatermicrobial biofilm and its heterogeneous distribution in space. (ii)The space–time mapping of dissolved oxygen (O2) in continuous,representing the different stages at which the system develops(aerobic, transitional, and finally anaerobic). Emphasis is placedupon the link between the temporal evolution of selected hydro-chemical and biological parameters at selected depths, includingthe live/dead bacteria density ratio, EPS concentration, and micro-bial functional diversity, which have seldom been measured inhydrological studies.
2. Materials and methods
2.1. Soil collection and tank packing
Sediments were collected from the top 20 cm of an artificialrecharge facility test site located in the prodelta region of the Llob-regat River, Spain (UTM coordinates 418446.63N, 4581658.18E,zone 31T). After sieving at 0.5 cm to remove large grains andboulders, while preserving the structure of the micro-aggregates,the resulting granular material was 10.6% of coarse sand, 18.1%of medium sand, 61.3% of fine sand, 9.6% of silt, and 0.5% of clay.No metals were detected.
Immediately after collection, soils were packed into a 1.20 mheight � 0.46 m length � 0.15 m width tank (Fig. 1). Firstly andin order to avoid the washing of soil fines out of the system, thebase of the tank was filled with a 15 cm layer of silica sand(0.7–1.8 mm diameter, supplied by Triturados Barcelona, Inc.)and covered with a geo-synthetic fabric membrane, allowing easyflow through. Later, collected soil was placed in 5–15 cm layers toallow manual compaction. The top 20 cm were left free of soil.Additional compaction was induced prior to the start of the infil-tration experiment by repeating a series of wetting and dryingcycles. The average value of soil porosity, determined as the ratioof the volume of water added to saturate the soil divided by thetank volume, was 0.25.
2.2. The infiltration experiment and sampling strategy
The experiment was designed to reproduce water infiltrationthrough the vadose zone under continuous ponding in a controlledlaboratory environment. The experiment involved supplying a con-tinuous flow of chemically controlled water to the top of the tank,forcing vertical infiltration. The flow rate was changed over timein order to keep the ponding level approximately constant through-out the test, thus compensating for the temporal variations in soilinfiltration capacity. The initial infiltration rate, used as the flowbaseline for our experiment, was 40 L/day (equivalent to 0.59 m/day, and indicative of a highly permeable soil). The amount of watersupplied and the height of the resulting pond were recorded contin-uously. An external water reservoir connected to the tank outletdetermined the location of the water table, placed 0.7 m below thesoil surface. Room air temperature (T) was recorded constantly.
Synthetic water was continuously prepared and immediatelysupplied to the tank, with no recirculation. It was supplied by a
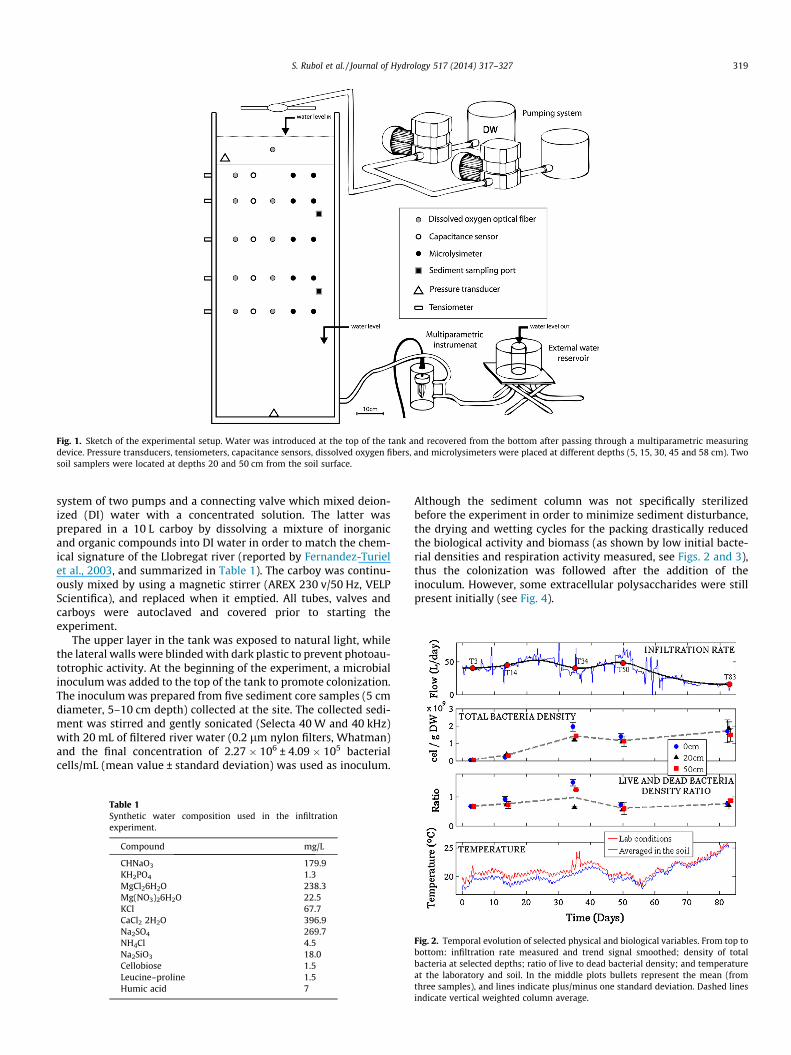
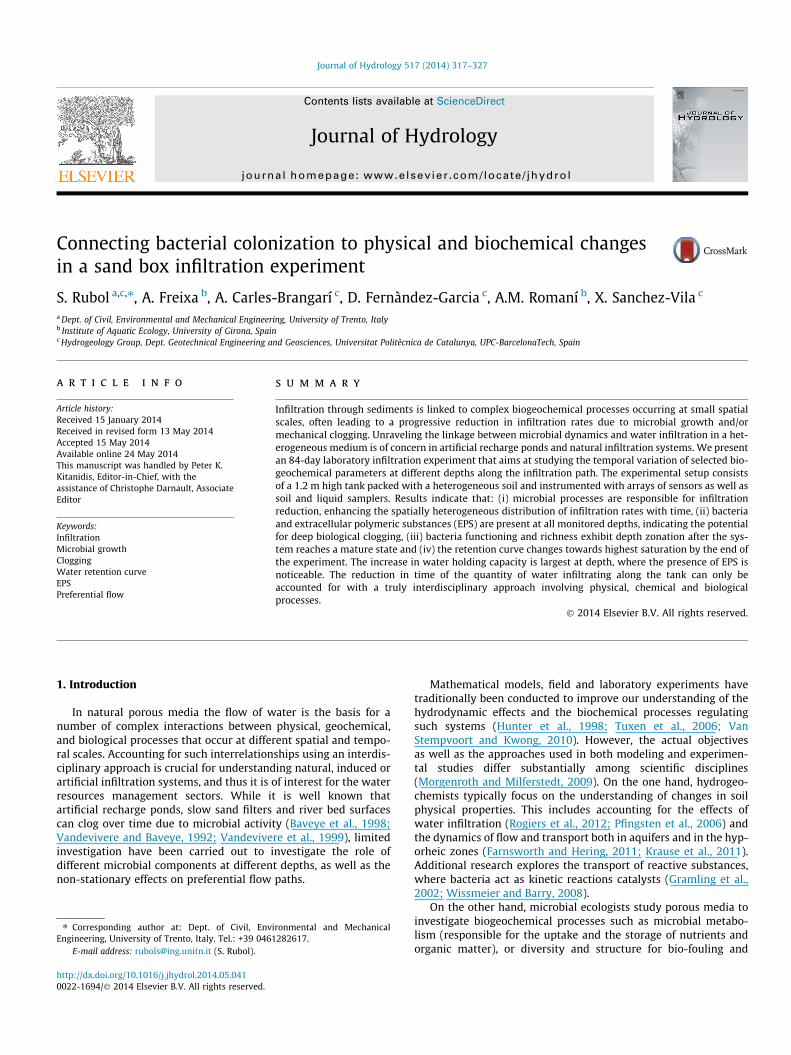
Fig. 1. Sketch of the experimental setup. Water was introduced at the top of the tank and recovered from the bottom after passing through a multiparametric measuringdevice. Pressure transducers, tensiometers, capacitance sensors, dissolved oxygen fibers, and microlysimeters were placed at different depths (5, 15, 30, 45 and 58 cm). Twosoil samplers were located at depths 20 and 50 cm from the soil surface.
S. Rubol et al. / Journal of Hydrology 517 (2014) 317–327 319
system of two pumps and a connecting valve which mixed deion-ized (DI) water with a concentrated solution. The latter wasprepared in a 10 L carboy by dissolving a mixture of inorganicand organic compounds into DI water in order to match the chem-ical signature of the Llobregat river (reported by Fernandez-Turielet al., 2003, and summarized in Table 1). The carboy was continu-ously mixed by using a magnetic stirrer (AREX 230 v/50 Hz, VELPScientifica), and replaced when it emptied. All tubes, valves andcarboys were autoclaved and covered prior to starting theexperiment.
The upper layer in the tank was exposed to natural light, whilethe lateral walls were blinded with dark plastic to prevent photoau-totrophic activity. At the beginning of the experiment, a microbialinoculum was added to the top of the tank to promote colonization.The inoculum was prepared from five sediment core samples (5 cmdiameter, 5–10 cm depth) collected at the site. The collected sedi-ment was stirred and gently sonicated (Selecta 40 W and 40 kHz)with 20 mL of filtered river water (0.2 lm nylon filters, Whatman)and the final concentration of 2.27 � 106 ± 4.09 � 105 bacterialcells/mL (mean value ± standard deviation) was used as inoculum.
Table 1Synthetic water composition used in the infiltrationexperiment.
Compound mg/L
CHNaO3 179.9KH2PO4 1.3MgCl26H2O 238.3Mg(NO3)26H2O 22.5KCl 67.7CaCl2 2H2O 396.9Na2SO4 269.7NH4Cl 4.5Na2SiO3 18.0Cellobiose 1.5Leucine–proline 1.5Humic acid 7
Although the sediment column was not specifically sterilizedbefore the experiment in order to minimize sediment disturbance,the drying and wetting cycles for the packing drastically reducedthe biological activity and biomass (as shown by low initial bacte-rial densities and respiration activity measured, see Figs. 2 and 3),thus the colonization was followed after the addition of theinoculum. However, some extracellular polysaccharides were stillpresent initially (see Fig. 4).
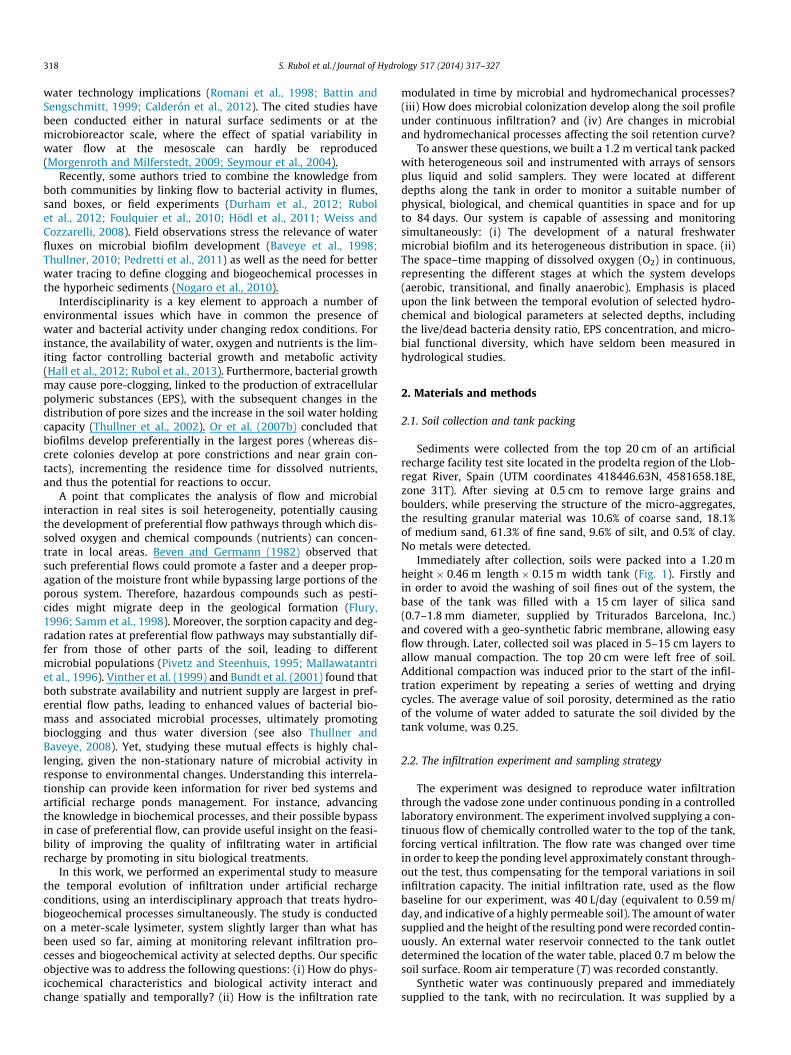
Fig. 2. Temporal evolution of selected physical and biological variables. From top tobottom: infiltration rate measured and trend signal smoothed; density of totalbacteria at selected depths; ratio of live to dead bacterial density; and temperatureat the laboratory and soil. In the middle plots bullets represent the mean (fromthree samples), and lines indicate plus/minus one standard deviation. Dashed linesindicate vertical weighted column average.
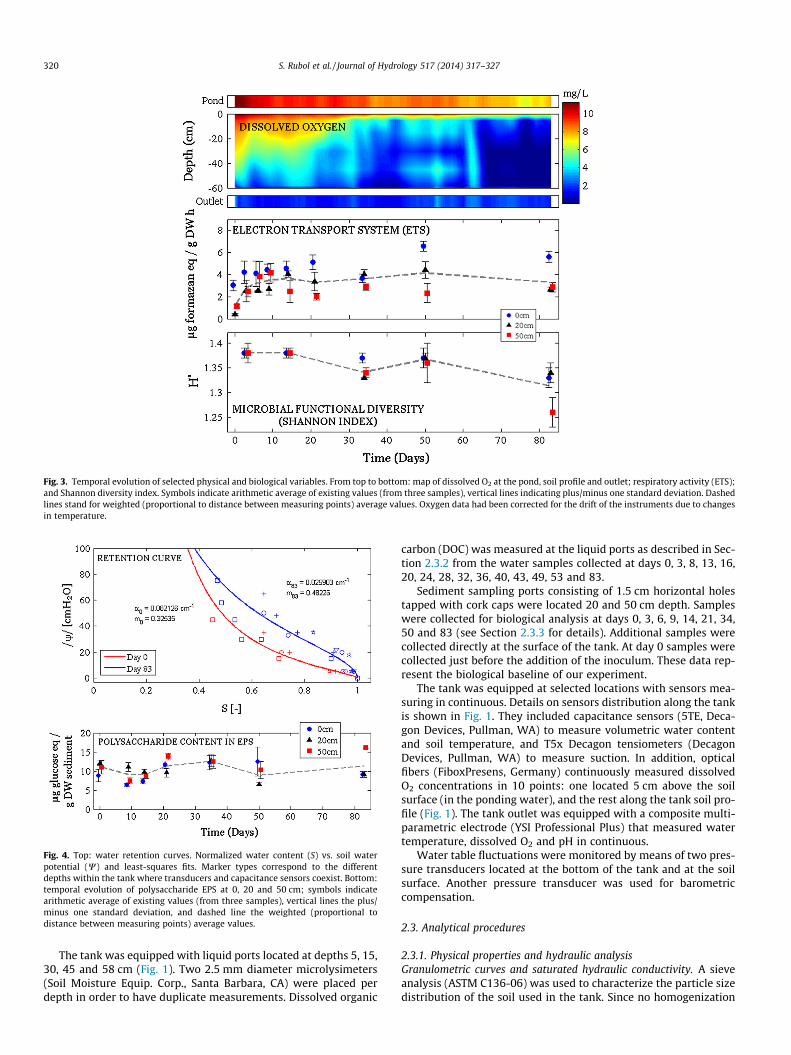
Fig. 3. Temporal evolution of selected physical and biological variables. From top to bottom: map of dissolved O2 at the pond, soil profile and outlet; respiratory activity (ETS);and Shannon diversity index. Symbols indicate arithmetic average of existing values (from three samples), vertical lines indicating plus/minus one standard deviation. Dashedlines stand for weighted (proportional to distance between measuring points) average values. Oxygen data had been corrected for the drift of the instruments due to changesin temperature.
Fig. 4. Top: water retention curves. Normalized water content (S) vs. soil waterpotential (W) and least-squares fits. Marker types correspond to the differentdepths within the tank where transducers and capacitance sensors coexist. Bottom:temporal evolution of polysaccharide EPS at 0, 20 and 50 cm; symbols indicatearithmetic average of existing values (from three samples), vertical lines the plus/minus one standard deviation, and dashed line the weighted (proportional todistance between measuring points) average values.
320 S. Rubol et al. / Journal of Hydrology 517 (2014) 317–327
The tank was equipped with liquid ports located at depths 5, 15,30, 45 and 58 cm (Fig. 1). Two 2.5 mm diameter microlysimeters(Soil Moisture Equip. Corp., Santa Barbara, CA) were placed perdepth in order to have duplicate measurements. Dissolved organic
carbon (DOC) was measured at the liquid ports as described in Sec-tion 2.3.2 from the water samples collected at days 0, 3, 8, 13, 16,20, 24, 28, 32, 36, 40, 43, 49, 53 and 83.
Sediment sampling ports consisting of 1.5 cm horizontal holestapped with cork caps were located 20 and 50 cm depth. Sampleswere collected for biological analysis at days 0, 3, 6, 9, 14, 21, 34,50 and 83 (see Section 2.3.3 for details). Additional samples werecollected directly at the surface of the tank. At day 0 samples werecollected just before the addition of the inoculum. These data rep-resent the biological baseline of our experiment.
The tank was equipped at selected locations with sensors mea-suring in continuous. Details on sensors distribution along the tankis shown in Fig. 1. They included capacitance sensors (5TE, Deca-gon Devices, Pullman, WA) to measure volumetric water contentand soil temperature, and T5x Decagon tensiometers (DecagonDevices, Pullman, WA) to measure suction. In addition, opticalfibers (FiboxPresens, Germany) continuously measured dissolvedO2 concentrations in 10 points: one located 5 cm above the soilsurface (in the ponding water), and the rest along the tank soil pro-file (Fig. 1). The tank outlet was equipped with a composite multi-parametric electrode (YSI Professional Plus) that measured watertemperature, dissolved O2 and pH in continuous.
Water table fluctuations were monitored by means of two pres-sure transducers located at the bottom of the tank and at the soilsurface. Another pressure transducer was used for barometriccompensation.
2.3. Analytical procedures
2.3.1. Physical properties and hydraulic analysisGranulometric curves and saturated hydraulic conductivity. A sieveanalysis (ASTM C136-06) was used to characterize the particle sizedistribution of the soil used in the tank. Since no homogenization
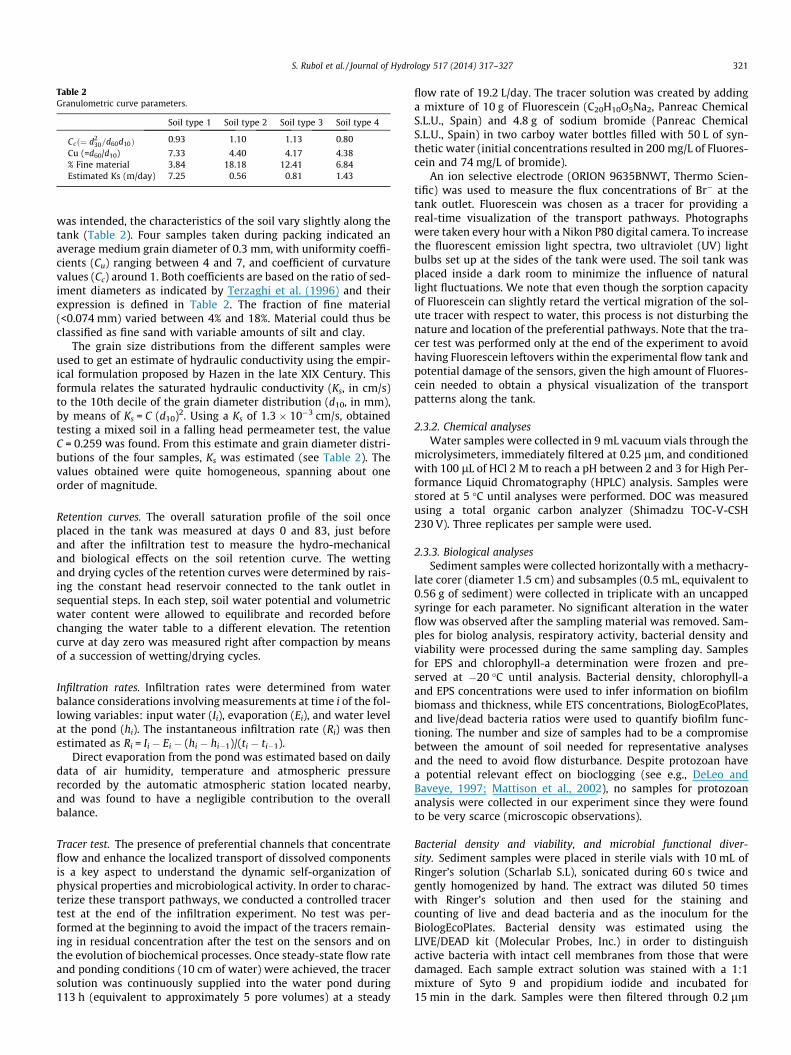
Table 2Granulometric curve parameters.
Soil type 1 Soil type 2 Soil type 3 Soil type 4
Ccð¼ d230=d60d10Þ 0.93 1.10 1.13 0.80
Cu (=d60/d10) 7.33 4.40 4.17 4.38% Fine material 3.84 18.18 12.41 6.84Estimated Ks (m/day) 7.25 0.56 0.81 1.43
S. Rubol et al. / Journal of Hydrology 517 (2014) 317–327 321
was intended, the characteristics of the soil vary slightly along thetank (Table 2). Four samples taken during packing indicated anaverage medium grain diameter of 0.3 mm, with uniformity coeffi-cients (Cu) ranging between 4 and 7, and coefficient of curvaturevalues (Cc) around 1. Both coefficients are based on the ratio of sed-iment diameters as indicated by Terzaghi et al. (1996) and theirexpression is defined in Table 2. The fraction of fine material(<0.074 mm) varied between 4% and 18%. Material could thus beclassified as fine sand with variable amounts of silt and clay.
The grain size distributions from the different samples wereused to get an estimate of hydraulic conductivity using the empir-ical formulation proposed by Hazen in the late XIX Century. Thisformula relates the saturated hydraulic conductivity (Ks, in cm/s)to the 10th decile of the grain diameter distribution (d10, in mm),by means of Ks = C (d10)2. Using a Ks of 1.3 � 10�3 cm/s, obtainedtesting a mixed soil in a falling head permeameter test, the valueC = 0.259 was found. From this estimate and grain diameter distri-butions of the four samples, Ks was estimated (see Table 2). Thevalues obtained were quite homogeneous, spanning about oneorder of magnitude.
Retention curves. The overall saturation profile of the soil onceplaced in the tank was measured at days 0 and 83, just beforeand after the infiltration test to measure the hydro-mechanicaland biological effects on the soil retention curve. The wettingand drying cycles of the retention curves were determined by rais-ing the constant head reservoir connected to the tank outlet insequential steps. In each step, soil water potential and volumetricwater content were allowed to equilibrate and recorded beforechanging the water table to a different elevation. The retentioncurve at day zero was measured right after compaction by meansof a succession of wetting/drying cycles.
Infiltration rates. Infiltration rates were determined from waterbalance considerations involving measurements at time i of the fol-lowing variables: input water (Ii), evaporation (Ei), and water levelat the pond (hi). The instantaneous infiltration rate (Ri) was thenestimated as Ri = Ii � Ei � (hi � hi�1)/(ti � ti�1).
Direct evaporation from the pond was estimated based on dailydata of air humidity, temperature and atmospheric pressurerecorded by the automatic atmospheric station located nearby,and was found to have a negligible contribution to the overallbalance.
Tracer test. The presence of preferential channels that concentrateflow and enhance the localized transport of dissolved componentsis a key aspect to understand the dynamic self-organization ofphysical properties and microbiological activity. In order to charac-terize these transport pathways, we conducted a controlled tracertest at the end of the infiltration experiment. No test was per-formed at the beginning to avoid the impact of the tracers remain-ing in residual concentration after the test on the sensors and onthe evolution of biochemical processes. Once steady-state flow rateand ponding conditions (10 cm of water) were achieved, the tracersolution was continuously supplied into the water pond during113 h (equivalent to approximately 5 pore volumes) at a steady
flow rate of 19.2 L/day. The tracer solution was created by addinga mixture of 10 g of Fluorescein (C20H10O5Na2, Panreac ChemicalS.L.U., Spain) and 4.8 g of sodium bromide (Panreac ChemicalS.L.U., Spain) in two carboy water bottles filled with 50 L of syn-thetic water (initial concentrations resulted in 200 mg/L of Fluores-cein and 74 mg/L of bromide).
An ion selective electrode (ORION 9635BNWT, Thermo Scien-tific) was used to measure the flux concentrations of Br� at thetank outlet. Fluorescein was chosen as a tracer for providing areal-time visualization of the transport pathways. Photographswere taken every hour with a Nikon P80 digital camera. To increasethe fluorescent emission light spectra, two ultraviolet (UV) lightbulbs set up at the sides of the tank were used. The soil tank wasplaced inside a dark room to minimize the influence of naturallight fluctuations. We note that even though the sorption capacityof Fluorescein can slightly retard the vertical migration of the sol-ute tracer with respect to water, this process is not disturbing thenature and location of the preferential pathways. Note that the tra-cer test was performed only at the end of the experiment to avoidhaving Fluorescein leftovers within the experimental flow tank andpotential damage of the sensors, given the high amount of Fluores-cein needed to obtain a physical visualization of the transportpatterns along the tank.
2.3.2. Chemical analysesWater samples were collected in 9 mL vacuum vials through the
microlysimeters, immediately filtered at 0.25 lm, and conditionedwith 100 lL of HCl 2 M to reach a pH between 2 and 3 for High Per-formance Liquid Chromatography (HPLC) analysis. Samples werestored at 5 �C until analyses were performed. DOC was measuredusing a total organic carbon analyzer (Shimadzu TOC-V-CSH230 V). Three replicates per sample were used.
2.3.3. Biological analysesSediment samples were collected horizontally with a methacry-
late corer (diameter 1.5 cm) and subsamples (0.5 mL, equivalent to0.56 g of sediment) were collected in triplicate with an uncappedsyringe for each parameter. No significant alteration in the waterflow was observed after the sampling material was removed. Sam-ples for biolog analysis, respiratory activity, bacterial density andviability were processed during the same sampling day. Samplesfor EPS and chlorophyll-a determination were frozen and pre-served at �20 �C until analysis. Bacterial density, chlorophyll-aand EPS concentrations were used to infer information on biofilmbiomass and thickness, while ETS concentrations, BiologEcoPlates,and live/dead bacteria ratios were used to quantify biofilm func-tioning. The number and size of samples had to be a compromisebetween the amount of soil needed for representative analysesand the need to avoid flow disturbance. Despite protozoan havea potential relevant effect on bioclogging (see e.g., DeLeo andBaveye, 1997; Mattison et al., 2002), no samples for protozoananalysis were collected in our experiment since they were foundto be very scarce (microscopic observations).
Bacterial density and viability, and microbial functional diver-sity. Sediment samples were placed in sterile vials with 10 mL ofRinger’s solution (Scharlab S.L), sonicated during 60 s twice andgently homogenized by hand. The extract was diluted 50 timeswith Ringer’s solution and then used for the staining andcounting of live and dead bacteria and as the inoculum for theBiologEcoPlates. Bacterial density was estimated using theLIVE/DEAD kit (Molecular Probes, Inc.) in order to distinguishactive bacteria with intact cell membranes from those that weredamaged. Each sample extract solution was stained with a 1:1mixture of Syto 9 and propidium iodide and incubated for15 min in the dark. Samples were then filtered through 0.2 lm
322 S. Rubol et al. / Journal of Hydrology 517 (2014) 317–327
black polycarbonate filters (GE Water and Process Technologies).Filters were placed on a slide and counted by epifluorescencemicroscopy (Nycon E600, 1000X in immersion oil). Green (live)and red (dead) bacterial cells were counted in 20 randomlyselected fields per filter. Bacterial total density was calculated astheir sum and expressed as cells per g of sediment DW (standingfor dry weight). The relationship was expressed as live/deadbacterial density (LDBD) ratio.
For the microbial functional diversity a BiologEcoPlate™ (BiologInc., Hayward, CA) was incubated in all samples taken for eachdepth and sampling day. Each plate contained three replicates cellsof 31 carbon sources and a blank one (no substrate). EcoPlateswere inoculated with 130 lL of sample extracted under sterile con-ditions and incubated at 20 �C in dark conditions for 6 days. Plateswere read every 24 h at 590 nm using a microplate reader (BioTek,SynergyTM 4) until color saturation (optical density > 2). Results atcolor saturation were analyzed by means of Average Well ColorDevelopment (AWCD) and the Shannon diversity index (H0) toevaluate microbial community functional diversity (Garland andMills, 1991).
Sediment samples collected at day 83 at 50 cm depth for Biolog-Ecoplates were analyzed both in anoxic and in aerobic conditions.Before inoculation, anoxic sample extracts were purged withnitrogen gas via an aquarium tube (5 mm diameter). Immediatelythe plates were covered with silicone sealing film (Sigma), prevent-ing a headspace of air. Plates were incubated during 6 days in abottle container which anaerobic conditions inside (created byAnaeroGen system, Oxoid, UK) to avoid oxygen.
Respiratory activity (ETS). Sediment samples for respiratory (ETS,Electron Transport System) activity were placed in sterile vials with4 mL of filtered artificial water (0.2 lm, nylon filters, Whatman).Samples were incubated in 0.02% INT (iodonitrotetrazolium) solu-tion in a shaker at 20 �C during 12 h in the dark (Blenkinsopp andLock, 1990). INT-formazan was then extracted with methanol for1 h at 4 �C in the dark. The extracts were filtered (GF/F filters,Whatman) and their absorbance measured at 480 nm (ShimadzuUV-1800). A stock solution of 60 lg/ml INT-formazan (Sigma–Aldrich) in methanol was used to prepare a standard curve. Resultswere expressed as lg INT-formazan per g DW of sediment per hour.
Polysaccharide content of extracellular polymeric substances (EPS).EPS from each sediment sample were extracted using a cation-exchange resin (Dowex Marathon C, Na+ form, strongly acidic,Sigma–Aldrich), following the procedure described in Romaníet al. (2008). The polysaccharide content was measured by thephenol–sulfuric acid assay (Dubois et al., 1956) after the extractionof EPS. Glucose standards (0–200 lg mL–L) were prepared. Resultswere given as lg glucose equivalents per g DW of sediment.
Chlorophyll-a. Chlorophyll-a from sediment samples was extractedin 90% acetone for 12 h in the dark at 4 �C. Samples weresonicated (2 min), and after filtrating the extract (GF/F, Whatman),chlorophyll concentration was determined using spectrophotome-try following the protocol of Jeffrey and Humphrey (1975). Resultswere expressed as lg chlorophyll-a per g DW of sediment. Despitechlorophyll-a is metabolically active only at the surface due tothe presence of light, we measured it in all the sediment core, sincephototrophic organisms may be transported to deeper soil layersand cause clogging (despite being non-active).
3. Results: linking biological and physical processes in the tank
This section aims at combining the observations regarding thephysical and the biological observations, with the intention of
building up on their interrelations to produce an understandingof the processes occurring in the tank, including: (1) the connec-tion between infiltration and bacteria activity, (2) the microbialcomponents of freshwater biofilm and (3) the variations in the soilphysical properties during the infiltration process.
3.1. Bacterial colonization and reduction in the infiltration rate
The infiltration rate changed throughout the experiment pre-senting an overall decrease of 62% ranging from 40 L/day at day0 to 15 L/day at day 83. Two local maxima were observed arounddays 20 and 50 (see Fig. 2).
The reduction in the infiltration rate with time (clogging) mightin principle be associated to either mechanical/physical or biolog-ical processes (Thullner and Baveye, 2008). We ruled out theformer for three reasons: (1) no colloids were supplied in the syn-thetic water feeding the system, (2) deposition of sediment orremobilization of fine particles was minimized by the initial soilcompaction achieved through a series of wetting and drying cyclesand (3) no significant gas production was visually observed neitherat the surface nor along the tank, or could be deduced from themeasurements gathered from capacitance sensors (values notshown). Despite not observed, we could not rule out the potentialpresence of small stagnant bubbles, reported in experiments else-where (see Amos and Mayer, 2006).
Contrarily, bacteria colonized the full tank (Fig. 2), supportingthat bioclogging was the dominant process occurring, and showingthe capability of microbes to colonize rapidly the entire soil profile,as observed by Okubo and Matsumoto (1983) and Zhong and Wu(2013). Bacterial colonization might be due to active attachmentto sand grains but, at the same time, favored by the transport ofsubstances linked to flowing water (Vandevivere and Baveye,1992). Total Bacterial (TB) density increased with time, and stabi-lized after day 34. On the contrary, live bacterial density (LB) washigher at the surface and varied dynamically in depth. Infiltrationrates showed a negative correlation with LB (r = �0.86, p = 0.13)and TB (r = �0.8, p = 0.2) at 20 cm depth.
Changes in the LDBD ratio (Fig. 2) are a good indicator of thedynamics of biofilm development. It is known that in natural bio-films about 20–70% of bacteria may be dead or inactive at anygiven point and time (our values are within this range); bacterialcell lysis is naturally occurring within the biofilm and promotesbiofilm development by the release of adhesion molecules(Bayles, 2007; Mai-prochnow et al., 2004). After two weeks, theLDBD ratio on the surface was 96% and increased to a maximumof 150% at day 34, indicating that an active biomass was growingat this date. This maximum coincided with a local minimum ininfiltration rate. We attributed this reduction in flow rate to theactive growing biomass being involved in bioclogging since meta-bolically active bacteria are capable of producing sufficient EPSconcentration, stabilizing the biofilm (Irie et al., 2012).
However, at the second part of the experiment, the LDBD ratiodecreased to 72% (day 50) and 77% (day 83), suggesting the micro-bial community could be considered old (Diaz Villanueva et al.,2011). On the other hand, the evolution of the sediment withinthe tank to rather hypoxic conditions with depth (see Section 3.2)could also affect the death of bacteria that could not adapt to lim-iting O2 conditions (Okubo and Matsumoto, 1979). The LDBD ratioremained almost constant at 20 cm depth (ranging between 57%and 77%) and it was surprisingly similar or lower than the onemeasured at 50 cm depth, indicating appropriate conditions forlive of bacteria at the bottom of the tank. This possibility isexplored in the following Section 3.2.
The potential effect of water temperature on clogging was alsoassessed. The observed trend of water temperature at the soil sur-face was non-monotonic, with an overall increase of 7.5 �C from
S. Rubol et al. / Journal of Hydrology 517 (2014) 317–327 323
day 0 to day 83. At any given day, variations in water temperaturewithin the tank (excluding the surface) did not exceed 2 �C. A sig-nificant negative linear correlation between the infiltration rateand the water temperature was found at all depths (r = �0.85,p = 0.004). This might be reflecting that temperature evolved alongthe experiment at the same time microbial community was aging,so that the correlation might be fortuitous. Notice that it has beenshown elsewhere that bacteria activity and microbial colonizationincrease with water temperature, thus reducing infiltration capac-ity and enhancing the kinetics of biogeochemical transformations(e.g., Diaz Villanueva et al., 2011).
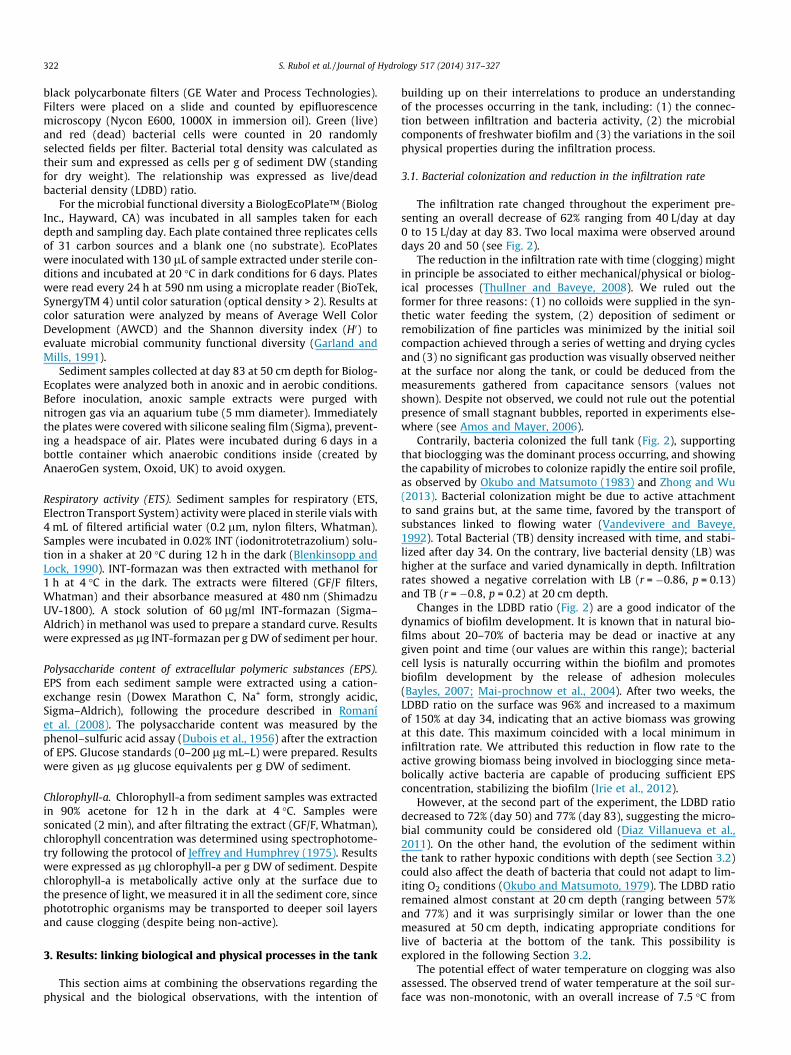
3.2. Oxygen dynamics and microbial metabolism
The contour plot of O2 (Fig. 3, top) is reconstructed fromexhaustive data recorded in time by the optical fibers placed alongthe soil tank as shown in Fig. 1 (thus involving the smoothing andinterpolation of the monitored profiles shown in Fig. 1).
The resulting map indicates three different stages concurrentwith the ones described by Okubo and Matsumoto (1979):
(i) Well oxygenated sediment column in the upper 30 cm, withO2 depleted towards the bottom from the beginning of theexperiment to day 30.
(ii) Transition to hypoxia conditions in depth (from day 30 today 64).
Fig. 5. Top: snapshots of the tracer experiment with Fluorescein, showing a heterogen
(iii) Hypoxia conditions at all point below 5 cm (O2 concentra-tion below 3 mg/L) from day 64 until the end of theexperiment.
At all times the ponding water presented high O2 levels(8–10 mg/L), associated to equilibrium with temperature and theatmosphere. The slight increase in O2 at days 50–55 was due to aone-day failure of the pumps that caused drying conditions andre-oxygenation, rapidly washed out in the subsequent days. Thedissolved oxygen measured in the tank had been monitored alongselected profiles (see Fig. 1); on the other hand, the tank outletactually collected all flowing paths, thus representing the averagedflux concentration at the bottom. In some occasions the oxygenvalues measured at the outlet were higher than those measuredat the specific tank sediment depths, particularly at late times(see Fig. 6). Such phenomenon is a consequence of differential flowvelocities throughout the sediment tank. This is further discussedin Section 4.
More information in the oxic/hypoxic transition is illustrated bythe spatial and temporal variations in ETS (Fig. 3, middle).Observed peaks for the data set recorded at the surface correlatewith those of the infiltration rate (Fig. 2), associated to the higherinput of oxygenated water. At all times the largest ETS values aremeasured at the surface of the sediments. However, the rate wasnot high enough to significantly decrease the pH at the outletwater (pH ranged between 7.6 and 8.1).
eous infiltration path. Bottom: normalized bromide BTC recovered at the outlet.
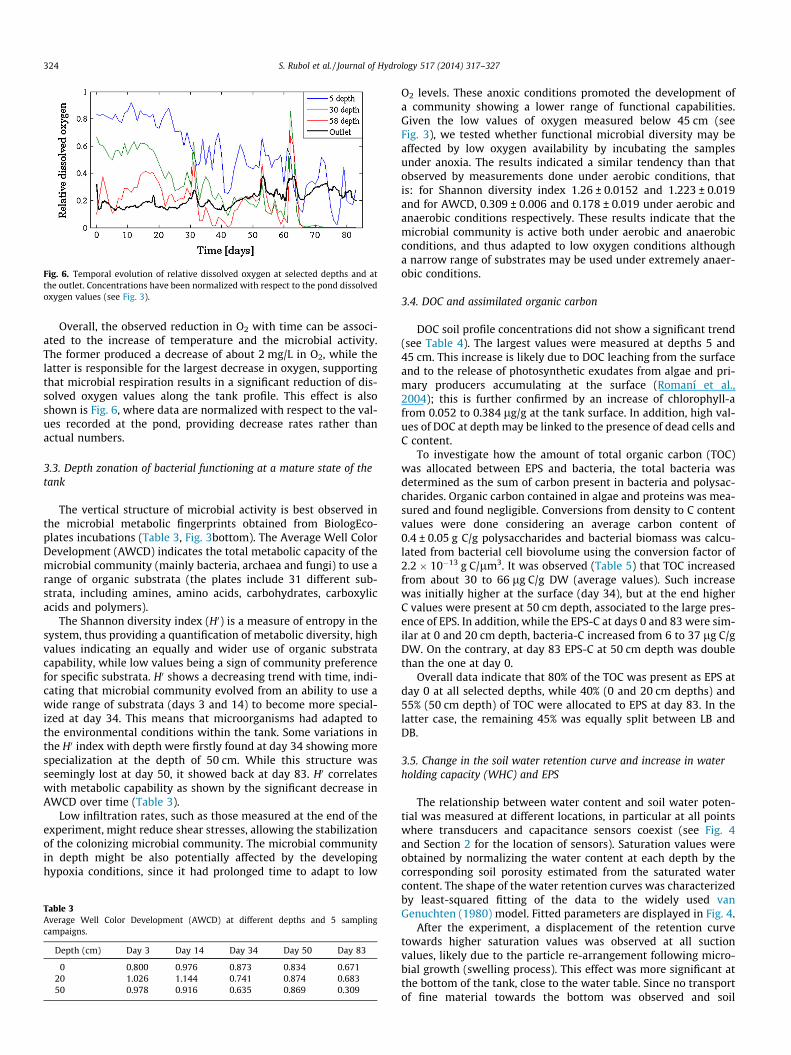
Fig. 6. Temporal evolution of relative dissolved oxygen at selected depths and atthe outlet. Concentrations have been normalized with respect to the pond dissolvedoxygen values (see Fig. 3).
324 S. Rubol et al. / Journal of Hydrology 517 (2014) 317–327
Overall, the observed reduction in O2 with time can be associ-ated to the increase of temperature and the microbial activity.The former produced a decrease of about 2 mg/L in O2, while thelatter is responsible for the largest decrease in oxygen, supportingthat microbial respiration results in a significant reduction of dis-solved oxygen values along the tank profile. This effect is alsoshown is Fig. 6, where data are normalized with respect to the val-ues recorded at the pond, providing decrease rates rather thanactual numbers.
3.3. Depth zonation of bacterial functioning at a mature state of thetank
The vertical structure of microbial activity is best observed inthe microbial metabolic fingerprints obtained from BiologEco-plates incubations (Table 3, Fig. 3bottom). The Average Well ColorDevelopment (AWCD) indicates the total metabolic capacity of themicrobial community (mainly bacteria, archaea and fungi) to use arange of organic substrata (the plates include 31 different sub-strata, including amines, amino acids, carbohydrates, carboxylicacids and polymers).
The Shannon diversity index (H0) is a measure of entropy in thesystem, thus providing a quantification of metabolic diversity, highvalues indicating an equally and wider use of organic substratacapability, while low values being a sign of community preferencefor specific substrata. H0 shows a decreasing trend with time, indi-cating that microbial community evolved from an ability to use awide range of substrata (days 3 and 14) to become more special-ized at day 34. This means that microorganisms had adapted tothe environmental conditions within the tank. Some variations inthe H0 index with depth were firstly found at day 34 showing morespecialization at the depth of 50 cm. While this structure wasseemingly lost at day 50, it showed back at day 83. H0 correlateswith metabolic capability as shown by the significant decrease inAWCD over time (Table 3).
Low infiltration rates, such as those measured at the end of theexperiment, might reduce shear stresses, allowing the stabilizationof the colonizing microbial community. The microbial communityin depth might be also potentially affected by the developinghypoxia conditions, since it had prolonged time to adapt to low
Table 3Average Well Color Development (AWCD) at different depths and 5 samplingcampaigns.
Depth (cm) Day 3 Day 14 Day 34 Day 50 Day 83
0 0.800 0.976 0.873 0.834 0.67120 1.026 1.144 0.741 0.874 0.68350 0.978 0.916 0.635 0.869 0.309
O2 levels. These anoxic conditions promoted the development ofa community showing a lower range of functional capabilities.Given the low values of oxygen measured below 45 cm (seeFig. 3), we tested whether functional microbial diversity may beaffected by low oxygen availability by incubating the samplesunder anoxia. The results indicated a similar tendency than thatobserved by measurements done under aerobic conditions, thatis: for Shannon diversity index 1.26 ± 0.0152 and 1.223 ± 0.019and for AWCD, 0.309 ± 0.006 and 0.178 ± 0.019 under aerobic andanaerobic conditions respectively. These results indicate that themicrobial community is active both under aerobic and anaerobicconditions, and thus adapted to low oxygen conditions althougha narrow range of substrates may be used under extremely anaer-obic conditions.
3.4. DOC and assimilated organic carbon
DOC soil profile concentrations did not show a significant trend(see Table 4). The largest values were measured at depths 5 and45 cm. This increase is likely due to DOC leaching from the surfaceand to the release of photosynthetic exudates from algae and pri-mary producers accumulating at the surface (Romaní et al.,2004); this is further confirmed by an increase of chlorophyll-afrom 0.052 to 0.384 lg/g at the tank surface. In addition, high val-ues of DOC at depth may be linked to the presence of dead cells andC content.
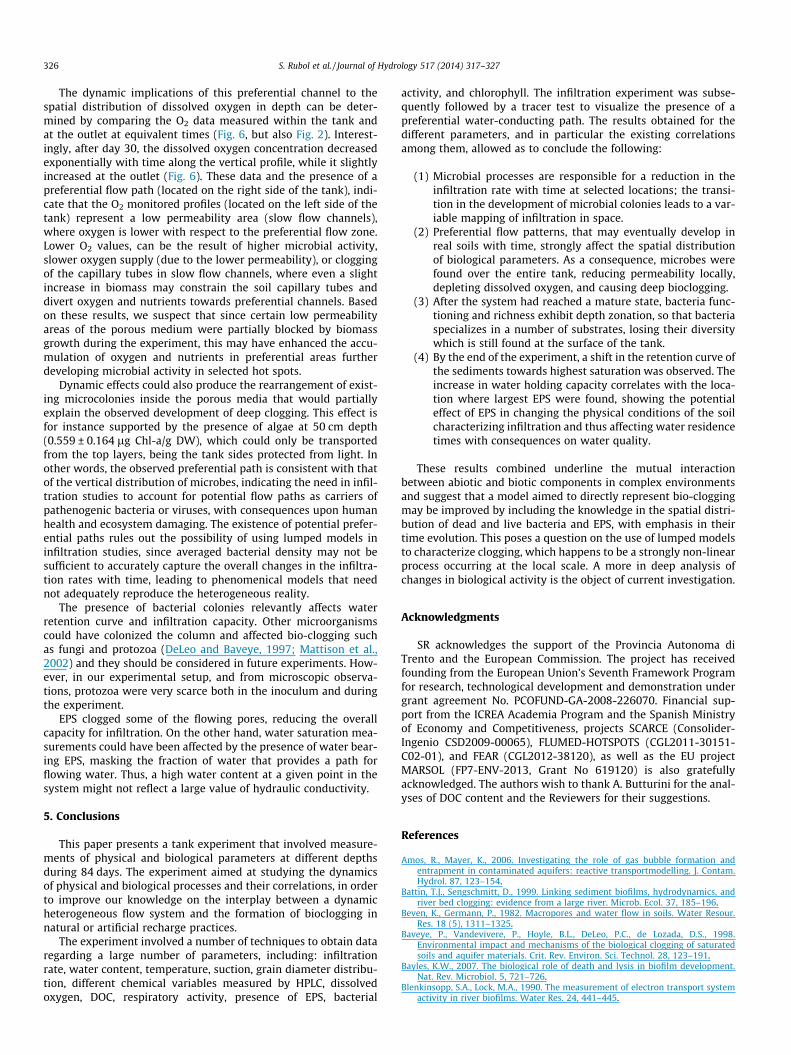
To investigate how the amount of total organic carbon (TOC)was allocated between EPS and bacteria, the total bacteria wasdetermined as the sum of carbon present in bacteria and polysac-charides. Organic carbon contained in algae and proteins was mea-sured and found negligible. Conversions from density to C contentvalues were done considering an average carbon content of0.4 ± 0.05 g C/g polysaccharides and bacterial biomass was calcu-lated from bacterial cell biovolume using the conversion factor of2.2 � 10�13 g C/lm3. It was observed (Table 5) that TOC increasedfrom about 30 to 66 lg C/g DW (average values). Such increasewas initially higher at the surface (day 34), but at the end higherC values were present at 50 cm depth, associated to the large pres-ence of EPS. In addition, while the EPS-C at days 0 and 83 were sim-ilar at 0 and 20 cm depth, bacteria-C increased from 6 to 37 lg C/gDW. On the contrary, at day 83 EPS-C at 50 cm depth was doublethan the one at day 0.
Overall data indicate that 80% of the TOC was present as EPS atday 0 at all selected depths, while 40% (0 and 20 cm depths) and55% (50 cm depth) of TOC were allocated to EPS at day 83. In thelatter case, the remaining 45% was equally split between LB andDB.
3.5. Change in the soil water retention curve and increase in waterholding capacity (WHC) and EPS
The relationship between water content and soil water poten-tial was measured at different locations, in particular at all pointswhere transducers and capacitance sensors coexist (see Fig. 4and Section 2 for the location of sensors). Saturation values wereobtained by normalizing the water content at each depth by thecorresponding soil porosity estimated from the saturated watercontent. The shape of the water retention curves was characterizedby least-squared fitting of the data to the widely used vanGenuchten (1980) model. Fitted parameters are displayed in Fig. 4.
After the experiment, a displacement of the retention curvetowards higher saturation values was observed at all suctionvalues, likely due to the particle re-arrangement following micro-bial growth (swelling process). This effect was more significant atthe bottom of the tank, close to the water table. Since no transportof fine material towards the bottom was observed and soil
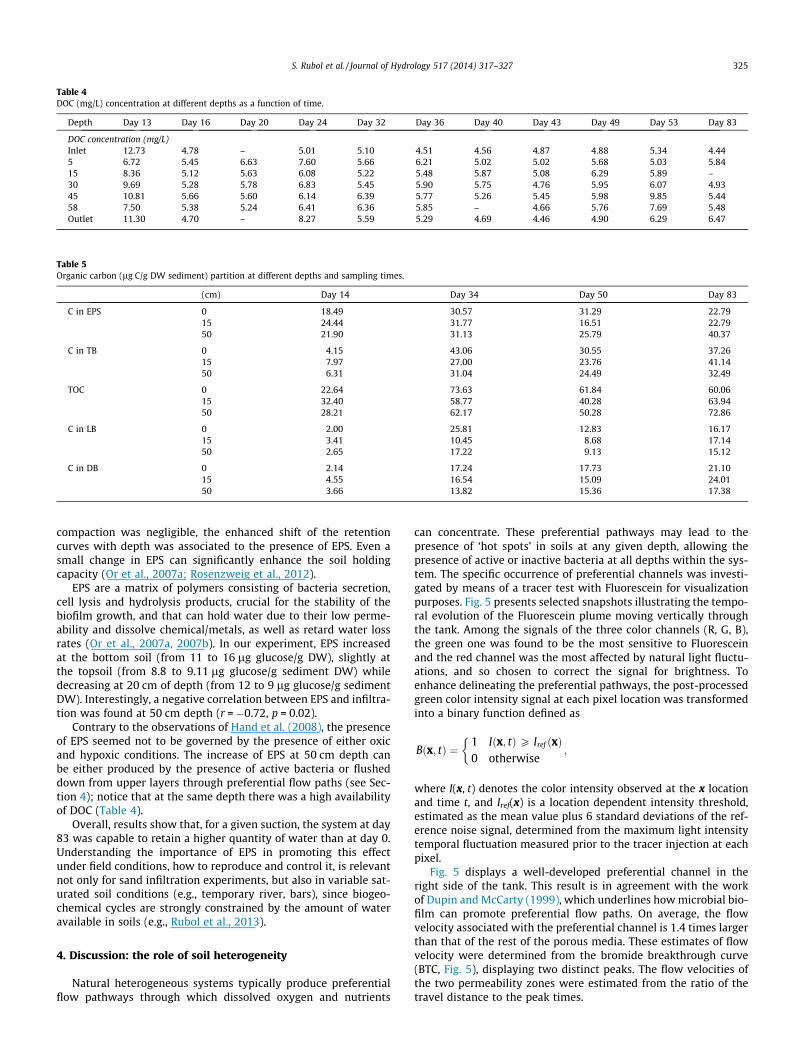
Table 4DOC (mg/L) concentration at different depths as a function of time.
Depth Day 13 Day 16 Day 20 Day 24 Day 32 Day 36 Day 40 Day 43 Day 49 Day 53 Day 83
DOC concentration (mg/L)Inlet 12.73 4.78 – 5.01 5.10 4.51 4.56 4.87 4.88 5.34 4.445 6.72 5.45 6.63 7.60 5.66 6.21 5.02 5.02 5.68 5.03 5.8415 8.36 5.12 5.63 6.08 5.22 5.48 5.87 5.08 6.29 5.89 –30 9.69 5.28 5.78 6.83 5.45 5.90 5.75 4.76 5.95 6.07 4.9345 10.81 5.66 5.60 6.14 6.39 5.77 5.26 5.45 5.98 9.85 5.4458 7.50 5.38 5.24 6.41 6.36 5.85 – 4.66 5.76 7.69 5.48Outlet 11.30 4.70 – 8.27 5.59 5.29 4.69 4.46 4.90 6.29 6.47
Table 5Organic carbon (lg C/g DW sediment) partition at different depths and sampling times.
(cm) Day 14 Day 34 Day 50 Day 83
C in EPS 0 18.49 30.57 31.29 22.7915 24.44 31.77 16.51 22.7950 21.90 31.13 25.79 40.37
C in TB 0 4.15 43.06 30.55 37.2615 7.97 27.00 23.76 41.1450 6.31 31.04 24.49 32.49
TOC 0 22.64 73.63 61.84 60.0615 32.40 58.77 40.28 63.9450 28.21 62.17 50.28 72.86
C in LB 0 2.00 25.81 12.83 16.1715 3.41 10.45 8.68 17.1450 2.65 17.22 9.13 15.12
C in DB 0 2.14 17.24 17.73 21.1015 4.55 16.54 15.09 24.0150 3.66 13.82 15.36 17.38
S. Rubol et al. / Journal of Hydrology 517 (2014) 317–327 325
compaction was negligible, the enhanced shift of the retentioncurves with depth was associated to the presence of EPS. Even asmall change in EPS can significantly enhance the soil holdingcapacity (Or et al., 2007a; Rosenzweig et al., 2012).
EPS are a matrix of polymers consisting of bacteria secretion,cell lysis and hydrolysis products, crucial for the stability of thebiofilm growth, and that can hold water due to their low perme-ability and dissolve chemical/metals, as well as retard water lossrates (Or et al., 2007a, 2007b). In our experiment, EPS increasedat the bottom soil (from 11 to 16 lg glucose/g DW), slightly atthe topsoil (from 8.8 to 9.11 lg glucose/g sediment DW) whiledecreasing at 20 cm of depth (from 12 to 9 lg glucose/g sedimentDW). Interestingly, a negative correlation between EPS and infiltra-tion was found at 50 cm depth (r = �0.72, p = 0.02).
Contrary to the observations of Hand et al. (2008), the presenceof EPS seemed not to be governed by the presence of either oxicand hypoxic conditions. The increase of EPS at 50 cm depth canbe either produced by the presence of active bacteria or flusheddown from upper layers through preferential flow paths (see Sec-tion 4); notice that at the same depth there was a high availabilityof DOC (Table 4).
Overall, results show that, for a given suction, the system at day83 was capable to retain a higher quantity of water than at day 0.Understanding the importance of EPS in promoting this effectunder field conditions, how to reproduce and control it, is relevantnot only for sand infiltration experiments, but also in variable sat-urated soil conditions (e.g., temporary river, bars), since biogeo-chemical cycles are strongly constrained by the amount of wateravailable in soils (e.g., Rubol et al., 2013).
4. Discussion: the role of soil heterogeneity
Natural heterogeneous systems typically produce preferentialflow pathways through which dissolved oxygen and nutrients
can concentrate. These preferential pathways may lead to thepresence of ‘hot spots’ in soils at any given depth, allowing thepresence of active or inactive bacteria at all depths within the sys-tem. The specific occurrence of preferential channels was investi-gated by means of a tracer test with Fluorescein for visualizationpurposes. Fig. 5 presents selected snapshots illustrating the tempo-ral evolution of the Fluorescein plume moving vertically throughthe tank. Among the signals of the three color channels (R, G, B),the green one was found to be the most sensitive to Fluoresceinand the red channel was the most affected by natural light fluctu-ations, and so chosen to correct the signal for brightness. Toenhance delineating the preferential pathways, the post-processedgreen color intensity signal at each pixel location was transformedinto a binary function defined as
Bðx; tÞ ¼1 Iðx; tÞP Iref ðxÞ0 otherwise
�;
where I(x, t) denotes the color intensity observed at the x locationand time t, and Iref(x) is a location dependent intensity threshold,estimated as the mean value plus 6 standard deviations of the ref-erence noise signal, determined from the maximum light intensitytemporal fluctuation measured prior to the tracer injection at eachpixel.
Fig. 5 displays a well-developed preferential channel in theright side of the tank. This result is in agreement with the workof Dupin and McCarty (1999), which underlines how microbial bio-film can promote preferential flow paths. On average, the flowvelocity associated with the preferential channel is 1.4 times largerthan that of the rest of the porous media. These estimates of flowvelocity were determined from the bromide breakthrough curve(BTC, Fig. 5), displaying two distinct peaks. The flow velocities ofthe two permeability zones were estimated from the ratio of thetravel distance to the peak times.
326 S. Rubol et al. / Journal of Hydrology 517 (2014) 317–327
The dynamic implications of this preferential channel to thespatial distribution of dissolved oxygen in depth can be deter-mined by comparing the O2 data measured within the tank andat the outlet at equivalent times (Fig. 6, but also Fig. 2). Interest-ingly, after day 30, the dissolved oxygen concentration decreasedexponentially with time along the vertical profile, while it slightlyincreased at the outlet (Fig. 6). These data and the presence of apreferential flow path (located on the right side of the tank), indi-cate that the O2 monitored profiles (located on the left side of thetank) represent a low permeability area (slow flow channels),where oxygen is lower with respect to the preferential flow zone.Lower O2 values, can be the result of higher microbial activity,slower oxygen supply (due to the lower permeability), or cloggingof the capillary tubes in slow flow channels, where even a slightincrease in biomass may constrain the soil capillary tubes anddivert oxygen and nutrients towards preferential channels. Basedon these results, we suspect that since certain low permeabilityareas of the porous medium were partially blocked by biomassgrowth during the experiment, this may have enhanced the accu-mulation of oxygen and nutrients in preferential areas furtherdeveloping microbial activity in selected hot spots.
Dynamic effects could also produce the rearrangement of exist-ing microcolonies inside the porous media that would partiallyexplain the observed development of deep clogging. This effect isfor instance supported by the presence of algae at 50 cm depth(0.559 ± 0.164 lg Chl-a/g DW), which could only be transportedfrom the top layers, being the tank sides protected from light. Inother words, the observed preferential path is consistent with thatof the vertical distribution of microbes, indicating the need in infil-tration studies to account for potential flow paths as carriers ofpathenogenic bacteria or viruses, with consequences upon humanhealth and ecosystem damaging. The existence of potential prefer-ential paths rules out the possibility of using lumped models ininfiltration studies, since averaged bacterial density may not besufficient to accurately capture the overall changes in the infiltra-tion rates with time, leading to phenomenical models that neednot adequately reproduce the heterogeneous reality.
The presence of bacterial colonies relevantly affects waterretention curve and infiltration capacity. Other microorganismscould have colonized the column and affected bio-clogging suchas fungi and protozoa (DeLeo and Baveye, 1997; Mattison et al.,2002) and they should be considered in future experiments. How-ever, in our experimental setup, and from microscopic observa-tions, protozoa were very scarce both in the inoculum and duringthe experiment.
EPS clogged some of the flowing pores, reducing the overallcapacity for infiltration. On the other hand, water saturation mea-surements could have been affected by the presence of water bear-ing EPS, masking the fraction of water that provides a path forflowing water. Thus, a high water content at a given point in thesystem might not reflect a large value of hydraulic conductivity.
5. Conclusions
This paper presents a tank experiment that involved measure-ments of physical and biological parameters at different depthsduring 84 days. The experiment aimed at studying the dynamicsof physical and biological processes and their correlations, in orderto improve our knowledge on the interplay between a dynamicheterogeneous flow system and the formation of bioclogging innatural or artificial recharge practices.
The experiment involved a number of techniques to obtain dataregarding a large number of parameters, including: infiltrationrate, water content, temperature, suction, grain diameter distribu-tion, different chemical variables measured by HPLC, dissolvedoxygen, DOC, respiratory activity, presence of EPS, bacterial
activity, and chlorophyll. The infiltration experiment was subse-quently followed by a tracer test to visualize the presence of apreferential water-conducting path. The results obtained for thedifferent parameters, and in particular the existing correlationsamong them, allowed as to conclude the following:
(1) Microbial processes are responsible for a reduction in theinfiltration rate with time at selected locations; the transi-tion in the development of microbial colonies leads to a var-iable mapping of infiltration in space.
(2) Preferential flow patterns, that may eventually develop inreal soils with time, strongly affect the spatial distributionof biological parameters. As a consequence, microbes werefound over the entire tank, reducing permeability locally,depleting dissolved oxygen, and causing deep bioclogging.
(3) After the system had reached a mature state, bacteria func-tioning and richness exhibit depth zonation, so that bacteriaspecializes in a number of substrates, losing their diversitywhich is still found at the surface of the tank.
(4) By the end of the experiment, a shift in the retention curve ofthe sediments towards highest saturation was observed. Theincrease in water holding capacity correlates with the loca-tion where largest EPS were found, showing the potentialeffect of EPS in changing the physical conditions of the soilcharacterizing infiltration and thus affecting water residencetimes with consequences on water quality.
These results combined underline the mutual interactionbetween abiotic and biotic components in complex environmentsand suggest that a model aimed to directly represent bio-cloggingmay be improved by including the knowledge in the spatial distri-bution of dead and live bacteria and EPS, with emphasis in theirtime evolution. This poses a question on the use of lumped modelsto characterize clogging, which happens to be a strongly non-linearprocess occurring at the local scale. A more in deep analysis ofchanges in biological activity is the object of current investigation.
Acknowledgments
SR acknowledges the support of the Provincia Autonoma diTrento and the European Commission. The project has receivedfounding from the European Union’s Seventh Framework Programfor research, technological development and demonstration undergrant agreement No. PCOFUND-GA-2008-226070. Financial sup-port from the ICREA Academia Program and the Spanish Ministryof Economy and Competitiveness, projects SCARCE (Consolider-Ingenio CSD2009-00065), FLUMED-HOTSPOTS (CGL2011-30151-C02-01), and FEAR (CGL2012-38120), as well as the EU projectMARSOL (FP7-ENV-2013, Grant No 619120) is also gratefullyacknowledged. The authors wish to thank A. Butturini for the anal-yses of DOC content and the Reviewers for their suggestions.
References
Amos, R., Mayer, K., 2006. Investigating the role of gas bubble formation andentrapment in contaminated aquifers: reactive transportmodelling. J. Contam.Hydrol. 87, 123–154.
Battin, T.J., Sengschmitt, D., 1999. Linking sediment biofilms, hydrodynamics, andriver bed clogging: evidence from a large river. Microb. Ecol. 37, 185–196.
Beven, K., Germann, P., 1982. Macropores and water flow in soils. Water Resour.Res. 18 (5), 1311–1325.
Baveye, P., Vandevivere, P., Hoyle, B.L., DeLeo, P.C., de Lozada, D.S., 1998.Environmental impact and mechanisms of the biological clogging of saturatedsoils and aquifer materials. Crit. Rev. Environ. Sci. Technol. 28, 123–191.
Bayles, K.W., 2007. The biological role of death and lysis in biofilm development.Nat. Rev. Microbiol. 5, 721–726.
Blenkinsopp, S.A., Lock, M.A., 1990. The measurement of electron transport systemactivity in river biofilms. Water Res. 24, 441–445.
S. Rubol et al. / Journal of Hydrology 517 (2014) 317–327 327
Bundt, M., Widmer, F., Pesaro, M., Zeyer, J., Blaser, P., 2001. Preferential flow paths:biological ‘hot spots’ in soils. Soil Biol. Biochem. 33, 729–738.
Calderón, K., Martín-Pascual, J., Poyatos, J.M., Rodelas, B., González-Martínez, A.,González-López, J., 2012. Comparative analysis of the bacterial diversity in alab-scale moving bed biofilm reactor (MBBR) applied to treat urban wastewaterunder different operational conditions. Bioresour. Technol. 121, 119–126.
DeLeo, P.C., Baveye, P., 1997. Factors affecting protozoan prediation of bacteriaclogging laboratory aquifer microcosms. Geomicrobiol. J. 14, 127–149.
Diaz Villanueva, V., Font, J., Schwartz, T., Romani, A.M., 2011. Biofilm formation atwarming temperature: acceleration of microbial colonization and microbialinteractive effects. Biofouling 27, 59–71.
Dubois, M., Gilles, K., Hamilton, J., Rebers, P., Smith, F., 1956. Colorimetric methodfor determination of sugars and related substances. Anal. Chem. 28, 350–356.
Dupin, H.J., McCarty, P.L., 1999. Mesoscale and microscale observations of biologicalgrowth in a silicon pore imaging element. Environ. Sci. Technol. 33 (8), 1230–1236.
Durham, W.M., Tranzer, O., Leombruni, A., Stocker, R., 2012. Division by fluidincision: biofilm patch development in porous media. Phys. Fluids 24, 91102–91107.
Farnsworth, C.E., Hering, J.G., 2011. Inorganic geochemistry and redox dynamics inbank filtration settings. Environ. Sci. Technol. 45, 5079–5087.
Fernandez-Turiel, J.L., Gimeno, D., Rodriguez, J.J., Carnicero, M., Valero, F., 2003.Spatial and seasonal variations of water quality in a Mediterranean catchment:the Llobregat River (NE Spain). Environ. Geochem. Health 25, 453–474.
Flury, M., 1996. Experimental evidence of transport of pesticides through fieldsoils—a review. J. Environ. Qual. 25 (1), 25–45.
Foulquier, A., Mermillod-Blondin, F., Malard, F., Gibert, J., 2010. Response ofsediment biofilm to increased dissolved organic carbon supply in groundwaterartificially recharged with stormwater. J. Soils Sediments 11, 382–393.
Garland, J.L., Mills, A.L., 1991. Classification and characterization of heterotrophicmicrobial communities on the basis of patterns of community-level sole-carbon-source utilization. Appl. Environ. Microbiol. 57, 2351–2359.
Gramling, C.M., Harvey, C.F., Meigs, L.C., 2002. Reactive transport in porous media: acomparison of model prediction with laboratory visualization. Environ. Sci.Technol. 36, 2508–2514.
Hall, E.K., Besemer, K., Kohl, L., Preiler, C., Riedel, K., Schneider, T., Wanek, W., Battin,T.J., 2012. Effects of resource chemistry on the composition and function ofstream hyporheic biofilms. Front. Microbiol. 3, 35.
Hand, V.L., Lloyd, J.R., Vaughan, D.J., Wilkins, M.J., Boult, S., 2008. Experimentalstudies of the influence of grain size, oxygen availability and organic carbonavailability on bioclogging in porous media. Environ. Sci. Technol. 42, 1485–1491.
Hödl, I., Hödl, J., Wörman, A., Singer, G., Besemer, K., Battin, T.J., 2011. Voronoitessellation captures very early clustering of single primary cells as induced byinteractions in nascent biofilms. PloS one 6 (10), e26368.
Hunter, K., Wang, Y., Vancappellen, P., 1998. Kinetic modeling of microbially-drivenredox chemistry of subsurface environments: coupling transport, microbialmetabolism and geochemistry. J. Hydrol. 209, 53–80.
Irie, Y., Borlee, B.R., O’Connor, J.R., Hill, P.J., Harwood, C.S., Wozniak, D.J., Parsek,M.R., 2012. Self-produced exopolysaccharide is a signal that stimulates biofilmformation in Pseudomonas aeruginosa. Proc. Natl. Acad. Sci. USA 109, 20632–20636.
Jeffrey, S., Humphrey, G., 1975. New spectrophotometric equations for determiningchlorophylls a, b, c1 and c2 in higher-plants, algae and natural phytoplankton.Biochem. und Physiol. der Pflanz. 167, 191–194.
Krause, S., Hannah, D.M., Fleckenstein, J.H., Heppell, C.M., Kaeser, D., Pickup, R.,Pinay, G., Robertson, A.L., Wood, P.J., 2011. Inter-disciplinary perspectives onprocesses in the hyporheic zone. Ecohydrology 4, 481–499.
Mai-prochnow, A., Evans, F., Dalisay-saludes, D., Stelzer, S., Egan, S., James, S., Webb,J.S., Kjelleberg, S., 2004. Biofilm development and cell death in the marinebacterium pseudoalteromonas tunicata. Appl. Environ. Microbiol. 70, 3232–3238.
Mallawatantri, A.P., McConkey, B.G., Mulla, D.J., 1996. Characterization of pesticidesorption and degradation in macropore linings and soil horizons of Thatuna siltloam. J. Environ. Qual. 25, 227–235.
Mattison, R.G., Taki, H., Harayama, S., 2002. The bacterivorous soil flagellateheteromita globosa reduces bacterial clogging under denitrifying conditions insand-filled aquifer columns. Appl. Environ. Microbiol. 68 (9), 4539–4545.
Morgenroth, E., Milferstedt, K., 2009. Biofilm engineering: linking biofilmdevelopment at different length and time scales. Rev. Environ. Sci. Biotechnol.8, 203–208.
Nogaro, G., Datry, T., Mermillod-Blondin, F., Descloux, S., Montuelle, B., 2010.Influence of streambed sediment clogging on microbial processes in thehyporheic zone. Freshwater Biol. 55, 1288–1302.
Okubo, T., Matsumoto, J., 1979. Effect of infiltration rate on biological clogging andwater quality changes during artificial recharge. Water Resour. Res. 15, 1536–1542.
Okubo, T., Matsumoto, J., 1983. Biological clogging of sand and changes of organicconstituents during artificial recharge. Water Res. 17, 813–821.
Or, D., Phutane, S., Dechesne, A., Ection, S.P., 2007a. Extracellular polymericsubstances affecting pore-scale hydrologic conditions for bacterial activity inunsaturated soils. Vadose Zone J. 6, 298–305.
Or, D., Smets, B.F., Wraith, J.M., Dechesne, A., Friedman, S.P., 2007b. Physicalconstraints affecting bacterial habitats and activity in unsaturated porousmedia – a review. Adv. Water Resour. 30, 1505–1527.
Pedretti, D., Fernàndez-Garcia, D., Sanchez-Vila, X., Barahona-Palomo, M., Bolster,D., 2011. Combining physical-based models and satellite images for the spatio-temporal assessment of soil infiltration capacity. Stoch. Environ. Res. RiskAssess. 25 (8), 1065–1075.
Pfingsten, W., Paris, B., Soler, J.M., Mäder, U.K., 2006. Tracer and reactive transportmodelling of interactions between high-pH fluids and fractured rock: field andlaboratory experiments. J. Geochem. Explor. 90 (1–2), 95–113.
Pivetz, B.E., Steenhuis, T.S., 1995. Soil matrix and macropore biodegradation of 2,4-D. J. Environ. Qual. 24 (4), 564–570.
Rogiers, B., Mallants, D., Batelaan, O., Gedeon, M., Huysmans, M., Dassargues, A.,2012. Estimation of hydraulic conductivity and its uncertainty from grain-sizedata using GLUE and artificial neural networks. Math. Geosci. 44 (6), 739–763.
Romani, A.M., Butturini, A., Sabater, F., Sabater, S., 1998. Heterotrophic metabolismin a forest stream sediment: surface versus subsurface zones. Aquat. Microb.Ecol. 16, 143–151.
Romaní, A.M., Fund, K., Artigas, J., Schwartz, T., Sabater, S., Obst, U., 2008. Relevanceof polymeric matrix enzymes during biofilm formation. Microb. Ecol. 56, 427–436.
Romaní, A.M., Guasch, H., Muñoz, I., Ruana, J., Vilalta, E., Schwartz, T., Emtiazi, F.,Sabater, S., 2004. Biofilm structure and function and possible implications forriverine DOC dynamics. Microb. Ecol. 47, 316–328.
Rosenzweig, R., Shavit, U., Furman, A., 2012. Water retention curves of biofilm-affected soils using xanthan as an analogue. Soil Sci. Soc. Am. J. 76, 61.
Rubol, S., Silver, W.L., Bellin, A., 2012. Hydrologic control on redox and nitrogendynamics in a peatland soil. Sci. Tot. Environ. 432, 37–46.
Rubol, S., Manzoni, S., Bellin, A., Porporato, A., 2013. Modeling soil moisture andoxygen effects on soil biogeochemical cycles including dissimilatory nitratereduction to ammonium (DNRA). Adv. Water Resour. 62 (2013), 106–124.
Seymour, J.D., Gage, J.P., Codd, S.L., Gerlach, R., 2004. Anomalous fluid transport inporous media induced by biofilm growth. Phys. Rev. Lett. 93, 198103.
Samm, C., Flühler, H., Gächter, R., Leuenberger, J., Wunderli, H., 1998. Preferentialtransport of phosphorus in drained grassland soils. J. Environ. Qual. 27.3, 515–522.
Terzaghi, K., Peck, R.B., Mesri, G., 1996. Soil Mechanics in Engineering Practice, thirded. Wiley-Interscience, ISBN 0-471-08658-4.
Thullner, M., 2010. Comparison of bioclogging effects in saturated porous mediawithin one- and two-dimensional flow systems. Ecol. Eng. 36, 176–196.
Thullner, M., Baveye, P., 2008. Computational pore network modeling of theinfluence of biofilm permeability on bioclogging in porous media. Biotechnol.Bioeng. 99, 1337–1351.
Thullner, M., Mauclaire, L., Schroth, M.H., Kinzelbach, W., Zeyer, J., 2002. Interactionbetween water flow and spatial distribution of microbial growth in a two-dimensional flow field in saturated porous media. J. Contam. Hydrol. 58, 169–189.
Tuxen, N., Albrechtsen, H.J., Bjerg, P.L., 2006. Identification of a reactive degradationzone at a landfill leachate plume fringe using high resolution sampling andincubation techniques. J. Contam. Hydrol. 85, 179–194.
Vandevivere, P., Baveye, P., 1992. Relationship between transport of bacteria andtheir clogging efficiency in sand columns. Appl. Environ. Microbiol. 58, 2523–2530.
Vandevivere, P., Baveye, P., Sanchez de Lozada, D., DeLeo, P., 1999. Microbialclogging of saturated soils and aquifer materials: evaluation of mathematicalmodels. Water Resour. Res. 31, 2173–2180.
van Genuchten, M.T., 1980. A closed form equation for predicting the hydraulicconductivity of unsaturated soils. Soil Sci. Soc. Am. J. 44, 892–898.
Van Stempvoort, D.R., Kwong, Y.T.J., 2010. Sulfur analyses as tracers of microbialdegradation of hydrocarbons in the capillary fringe. J. Contam. Hydrol. 114, 1–17.
Vinther, F.P., Eiland, F., Lind, A.M., Elsgaard, L., 1999. Microbial biomass andnumbers of denitrifiers related to macropore channels in agricultural and forestsoils. Soil Biol. Biochem. 31 (4), 603–611.
Weiss, J.V., Cozzarelli, I.M., 2008. Biodegradation in contaminated aquifers:incorporating microbial/molecular methods. Ground Water 46, 305–322.
Wissmeier, L., Barry, D.A., 2008. Reactive transport in unsaturated soil:comprehensive modelling of the dynamic spatial and temporal mass balanceof water and chemical components. Adv. Water Res. 31 (5), 858–875.
Zhong, X., Wu, Y., 2013. Bioclogging in porous media under continuous-flowcondition. Environ. Earth Sci. 68, 2417–2425.
Related Documents