Connect with Consumers Value Added Services: The Next Wave www.pwc.com/india

Welcome message from author
This document is posted to help you gain knowledge. Please leave a comment to let me know what you think about it! Share it to your friends and learn new things together.
Transcript
Connect with ConsumersValue Added Services: The Next Wave
www.pwc.com/india

2 PwC
Connect with Consumer - Value Added Services 3
Traditionally, speed has been considered as limiting factor in growth of value added services. The ongoing roll-out of 3G and BWA services could potentially address this gap.
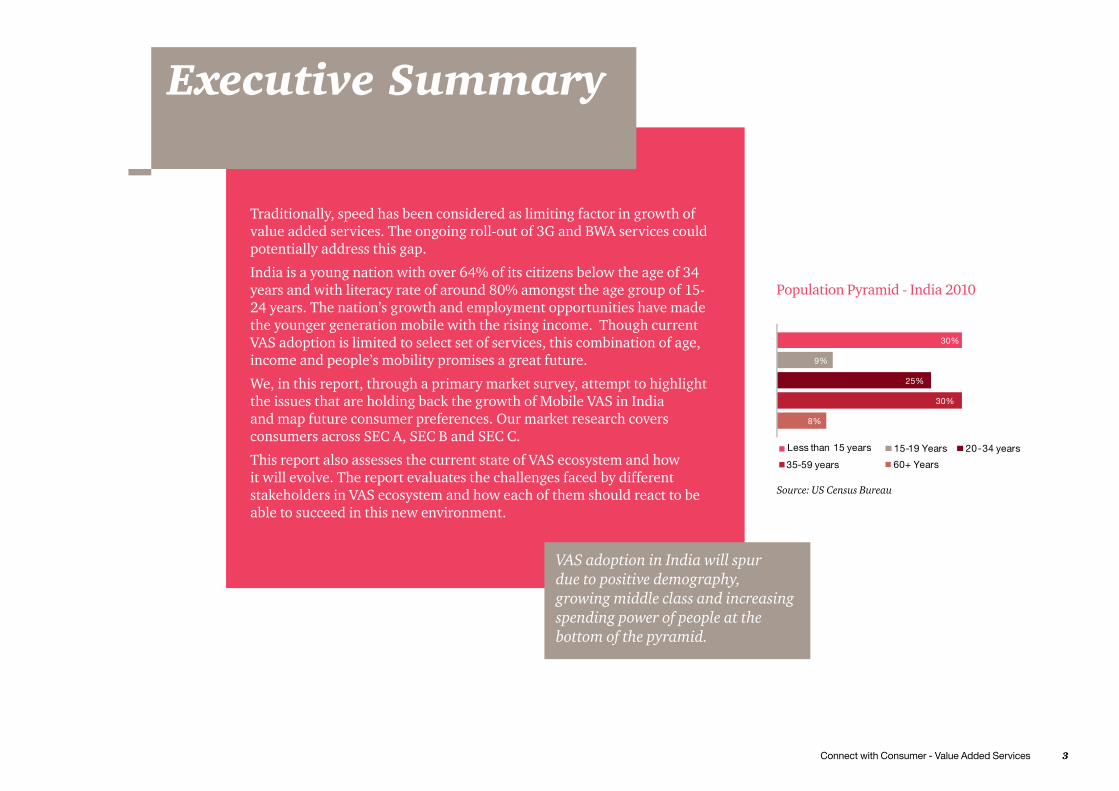
India is a young nation with over 64% of its citizens below the age of 34 years and with literacy rate of around 80% amongst the age group of 15-24 years. The nation’s growth and employment opportunities have made the younger generation mobile with the rising income. Though current VAS adoption is limited to select set of services, this combination of age, income and people’s mobility promises a great future.
We, in this report, through a primary market survey, attempt to highlight the issues that are holding back the growth of Mobile VAS in India and map future consumer preferences. Our market research covers consumers across SEC A, SEC B and SEC C.
This report also assesses the current state of VAS ecosystem and how it will evolve. The report evaluates the challenges faced by different stakeholders in VAS ecosystem and how each of them should react to be able to succeed in this new environment.
Executive Summary
VAS adoption in India will spur due to positive demography, growing middle class and increasing spending power of people at the bottom of the pyramid.
Source: US Census Bureau
Population Pyramid - India 2010

4 PwC
Study MethodologyPage 05
Current VAS Value chain in Indian contextPage 16
VAS: Way ForwardPage 43
VAS in IndiaPage 12
Executive SummaryPage 03
Solving the VAS puzzlePage 18
IntroductionPage 07
Mapping of Mobile VAS UsersPage 33
Tax Imperatives of VASPage 39

Connect with Consumer - Value Added Services 5
Primary Research Methodology
PwC undertook a detailed and wide scale market research with the objective of understanding the behavior of Indian mobile subscribers towards VAS and off take of services in future. Our research focuses on urban India, it covers 1050 respondents across 10 cities of Delhi, Mumbai, Hyderabad, Bangalore, Chennai, Bhubaneswar, Kochi, Ahmedabad, Pune and Kolkata.
Respondents By Location Respondents by Age Respondents by Type of Connection
The study and the subsequent analysis of primary and secondary information also brings out an understanding of the services of the future, and the price people are willing to pay. Another key output of the analysis, apart from segmentation of the services, has been segmentation of the users according to their behavior, tastes and preferences.
The respondents were spread across different Socio Economic Classes (SEC), age groups, education backgrounds and working status. Thus giving deep insights into various sections of the urban mobile users. This report details the results of a sub-set of the larger study. The charts below provide an overview of the sample set analysed for the purpose of this report.

6 PwC
Respondents By Working Status
Respondents by SEC
The survey focuses on 30 VAS services across Entertainment, Information, Communication and m-Commerce

Connect with Consumer - Value Added Services 7
Introduction
Summary of Key Messages • Multilingual content, application support around
languages, killer applications and readiness of handsets could drive over INR 55,000 crores of VAS revenue by 2015.
• With the launch of 3G services and expected launch of high bandwidth BWA services, VAS currently has reacheditsinflexionpoint.TheconstituentsofVASecosystem such as mobile operators, content creator, handset manufacturer will need to show greater collaboration to achieve full potential of VAS.
• The future growth in VAS is expected to be broad based in contrast to the past where fewer services dominated the VAS scene.
- There is strong demand and increasing propensity to pay for Regional and multi-lingual content.
- Medical Advice VAS has the capability to allow the deprived sections of society to access quality medical advice at an affordable price.
- Surprisingly, Indian users are keen to explore video calling
- Transactional VAS(m-commerce) would need special attention to address the issues of ease of use and data privacy.
- Demand for news updates through VAS is high and operator and VAS value chain players would need to address the challenges in delivering news updates in multimedia at a reasonable cost.
Demand: Serviced vs. Future Adoption vs. Untapped PotentialThe bird’s eye view of 30 services covered by the study shows that future adoption of communication and entertainment VAS is higher than that of information and transaction VAS
Source: PwC Analysis
Additional Future Adoption
Untapped Potential
Unaware of the serviceFuture adoption relates closely to the current awareness levels of consumers. Trends depict a growing demand for entertainment services like listening to music and watching movies over mobile. These are followed by high potential information based VAS such as news updates and medical services over mobile.
8 PwC
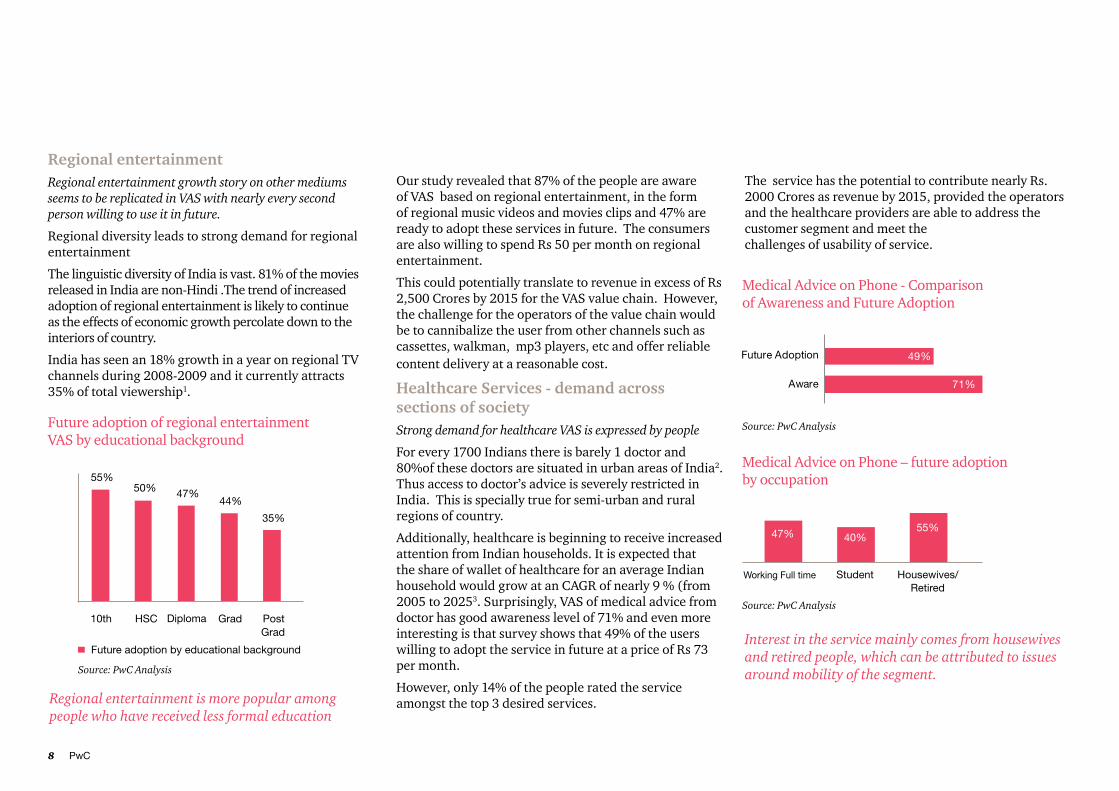
Regional entertainmentRegional entertainment growth story on other mediums seems to be replicated in VAS with nearly every second person willing to use it in future.
Regional diversity leads to strong demand for regional entertainment
The linguistic diversity of India is vast. 81% of the movies released in India are non-Hindi .The trend of increased adoption of regional entertainment is likely to continue as the effects of economic growth percolate down to the interiors of country.
India has seen an 18% growth in a year on regional TV channels during 2008-2009 and it currently attracts 35% of total viewership1.
Our study revealed that 87% of the people are aware of VAS based on regional entertainment, in the form of regional music videos and movies clips and 47% are ready to adopt these services in future. The consumers are also willing to spend Rs 50 per month on regional entertainment.
This could potentially translate to revenue in excess of Rs 2,500 Crores by 2015 for the VAS value chain. However, the challenge for the operators of the value chain would be to cannibalize the user from other channels such as cassettes, walkman, mp3 players, etc and offer reliable content delivery at a reasonable cost.
Healthcare Services - demand across sections of societyStrong demand for healthcare VAS is expressed by people
For every 1700 Indians there is barely 1 doctor and 80%of these doctors are situated in urban areas of India2. Thus access to doctor’s advice is severely restricted in India. This is specially true for semi-urban and rural regions of country.
Additionally, healthcare is beginning to receive increased attention from Indian households. It is expected that the share of wallet of healthcare for an average Indian household would grow at an CAGR of nearly 9 % (from 2005 to 20253. Surprisingly, VAS of medical advice from doctor has good awareness level of 71% and even more interesting is that survey shows that 49% of the users willing to adopt the service in future at a price of Rs 73 per month.
However, only 14% of the people rated the service amongst the top 3 desired services.
The service has the potential to contribute nearly Rs. 2000 Crores as revenue by 2015, provided the operators and the healthcare providers are able to address the customer segment and meet the challenges of usability of service.
Future adoption of regional entertainment VAS by educational background
Source: PwC Analysis
Medical Advice on Phone - Comparison of Awareness and Future Adoption
Source: PwC Analysis
Interest in the service mainly comes from housewives and retired people, which can be attributed to issues around mobility of the segment.
Medical Advice on Phone – future adoption by occupation
Source: PwC Analysis
Regional entertainment is more popular among people who have received less formal education

Connect with Consumer - Value Added Services 9
Informational VAS – news updates on the moveUsers are willing to spend on news updates contrary to the perception of it being a freely available service
Indians are thirsty for news, the largest English language newspaper (by circulation) is published in India and yet, it ranks 11th in India by circulation4. India also has 250+ news channels which represent nearly 51% of total licensed channels1.
With current awareness levels of 89% and future adoption levels of 62% news updates is among the top VAS services of the future. Even though it is perceived that people would not pay for news, our survey reveals users are willing to spend an average of Rs 51 per month for the service. The challenge for VAS value chain is to ensure that newsserviceistailoredtospecificneedsoftargetsegment which mainly consists of people working full time.
The news updates VAS has the potential to bring in nearly Rs 3,300 Crores of revenue by 2015.
People working full time are expected to be the biggest consumers of news updates due to paucity of time and need for information on the move
News updates - present and future adoption
Source: PwC Analysis
Transactional VAS - route to financial inclusionPotential for transactional VAS to serve different needs of the affluent and the deprived classes of society
It is estimated that 41% of the urban population in India do not have access to bank accounts5.Thisfigureis60%for rural India5.
Thus, there is need for methods to reach people who are not serviced by conventional methods.
The mobile based transactional VAS is an opportunity to bring the deprived people in the fold and increase financialinclusion.
The survey highlights that the people who already have access to bank accounts are also keen on using transactional VAS to save time and for convenience. This is evident from the future adoption levels of transactional VAS
Average awareness of transaction services is 69% with future adoption levels of 39% . Also, people are willing to spend an average of Rs. 54 for these services.
Transactional VAS services have potential to contribute nearly Rs 1,600 Crores as revenue by 2015 provided operators and banks successfully respond to challenges of concerns of users around data privacy, usability and language independence of the applications
News updates – future adoption by occupation
Source: PwC Analysis
Future adoption of booking tickets (a type of transactional VAS) on mobile by occupation
Future adoption levels for transaction services like booking tickets on mobile is highest for students. Hence, the future holds looks promising for transactional VAS services
Source: PwC Analysis

10 PwC
Source: TRAI
SMS – Continues to rule but hold weakensSMS as a % of mobile VAS revenue is expected to decline to around 25% by 2015 from current levels of around 60%
SMS has been the mainstay of VAS in India. This is evident from the highest awareness level (94%) and current adoption levels (66%).
In India, only 19% of the population has knowledge of English6 . The primary language for SMS had been English thus limiting the size of the market. With theintroductionofIndiaspecificeditionsofphones,the users can now SMS in Hindi and other major regional languages.
Outgoing SMS per subscriber per month (Number)
Source: PwC Analysis
SMS - Comparison of Awareness and Adoption(Current and Future)
The simplicity and effectiveness of SMS as medium of communication will allow it to dominate VAS in terms of usage.
4 out of 5 people are willing to use SMS in future and spend monthly average of Rs 42. In terms of revenues, SMS can contribute nearly Rs. 14,000 Crores of revenue by 2015 for the mobile VAS value chain players.The operators, however, would need to focus on the multilingual SMSs and handset manufacturers would need to design keyboards (or applications) which are designed for ease of typing in Indian languages.
While the Minutes of Usage are falling, the number of SMS per subscriber has increased 51% just a year
Video Calling - Comparison of Awareness and Adoption(Current and Future)
Source: PwC Analysis
Video Calling – Language ceases to be a barrierSurprisingly, Video calling has appeal across age groups and students are likely to be heavy users
Surprising interest in Video calling Connecting people with voice plus video interests many and has a 76% Awareness.The low adoption levels are attributed to limited availability of the service. Also, there are concern amongst people on the ease of use of the service.
And many are willing to use it The survey shows that nearly 51% of the people are ready to adopt the service in future.
Connect with Consumer - Value Added Services 11
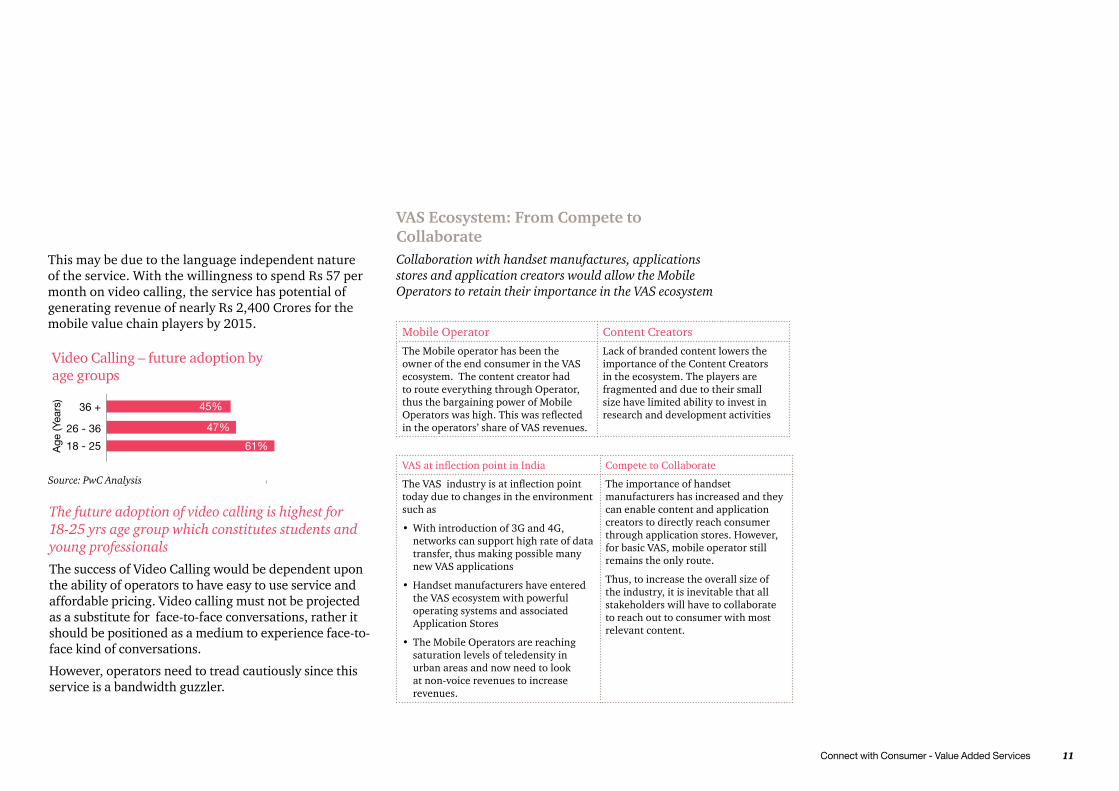
Video Calling – future adoption by age groups
Source: PwC Analysis
This may be due to the language independent nature of the service. With the willingness to spend Rs 57 per month on video calling, the service has potential of generating revenue of nearly Rs 2,400 Crores for the mobile value chain players by 2015.
The future adoption of video calling is highest for 18-25 yrs age group which constitutes students and young professionals
The success of Video Calling would be dependent upon the ability of operators to have easy to use service and affordable pricing. Video calling must not be projected as a substitute for face-to-face conversations, rather it should be positioned as a medium to experience face-to-face kind of conversations.
However, operators need to tread cautiously since this service is a bandwidth guzzler.
VAS Ecosystem: From Compete to CollaborateCollaboration with handset manufactures, applications stores and application creators would allow the Mobile Operators to retain their importance in the VAS ecosystem
Mobile Operator Content Creators
The Mobile operator has been the owner of the end consumer in the VAS ecosystem. The content creator had to route everything through Operator, thus the bargaining power of Mobile Operatorswashigh.Thiswasreflectedin the operators’ share of VAS revenues.
Lack of branded content lowers the importance of the Content Creators in the ecosystem. The players are fragmented and due to their small size have limited ability to invest in research and development activities
VASatinflectionpointinIndia Compete to Collaborate
TheVASindustryisatinflectionpointtoday due to changes in the environment such as
•With introduction of 3G and 4G, networks can support high rate of data transfer, thus making possible many new VAS applications
•Handset manufacturers have entered the VAS ecosystem with powerful operating systems and associated Application Stores
•The Mobile Operators are reaching saturation levels of teledensity in urban areas and now need to look at non-voice revenues to increase revenues.
The importance of handset manufacturers has increased and they can enable content and application creators to directly reach consumer through application stores. However, for basic VAS, mobile operator still remains the only route.
Thus, to increase the overall size of the industry, it is inevitable that all stakeholders will have to collaborate to reach out to consumer with most relevant content.
Age
(Yea
rs)

12 PwC
VAS in India - Current Context
Addition of low value subscriberIncremental growth in mobile service revenues does not reflect growth in subscriber base
Source: TRAI
Overall tele-density touches 66%. Margin challenge for operator will continue as teledensity will increase
Mobile subscriber base has surpassed 752 million subscribers by Dec’10, growing at CAGR of 47% from March 2008 to December 2010
In contrast to high growth in subscribers, the telecom industry has grown in revenue at CAGR of 17% (as of Dec’10) over the last 2 years
Overall Teledensity (%) Adjusted Gross Revenue (Thousand Crores)Subscriber in Millions
Source: TRAI QE: Quater EndingSource: TRAI
Connect with Consumer - Value Added Services 13
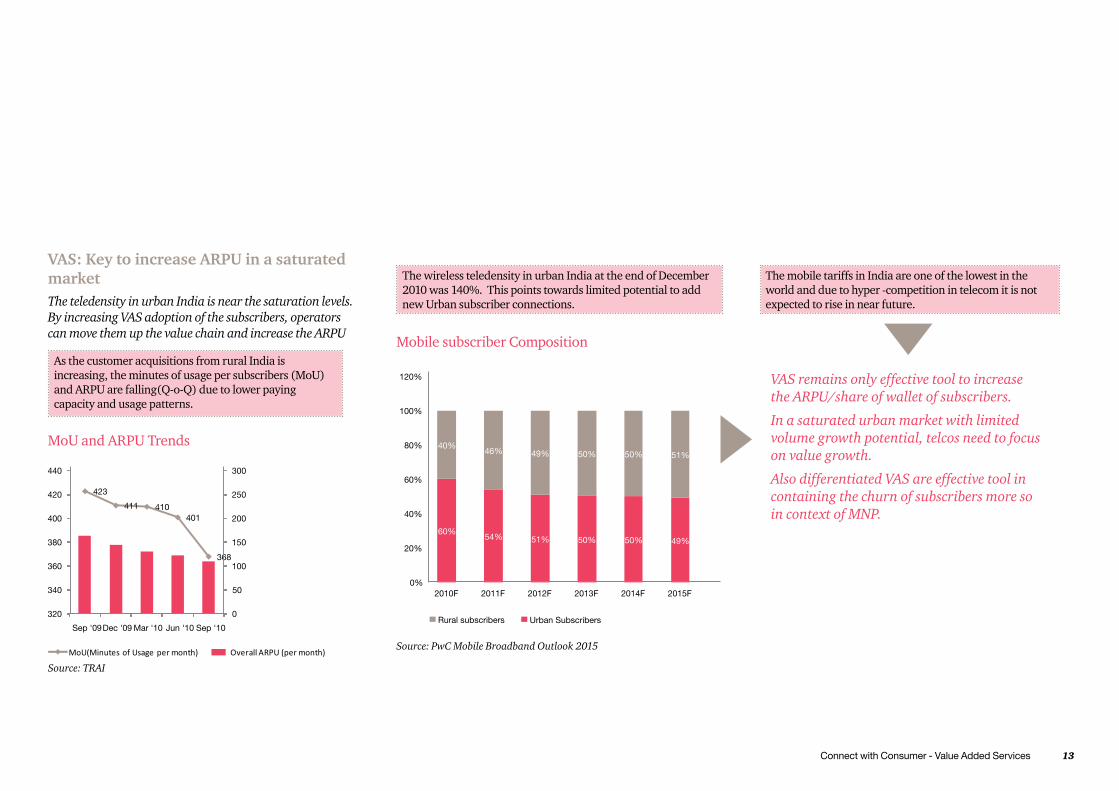
VAS: Key to increase ARPU in a saturated marketThe teledensity in urban India is near the saturation levels. By increasing VAS adoption of the subscribers, operators can move them up the value chain and increase the ARPU
Source: PwC Mobile Broadband Outlook 2015
Mobile subscriber Composition
The mobile tariffs in India are one of the lowest in the world and due to hyper -competition in telecom it is not expected to rise in near future.
As the customer acquisitions from rural India is increasing, the minutes of usage per subscribers (MoU) and ARPU are falling(Q-o-Q) due to lower paying capacity and usage patterns.
The wireless teledensity in urban India at the end of December 2010 was 140%. This points towards limited potential to add new Urban subscriber connections.
VAS remains only effective tool to increase the ARPU/share of wallet of subscribers.
In a saturated urban market with limited volume growth potential, telcos need to focus on value growth.
Also differentiated VAS are effective tool in containing the churn of subscribers more so in context of MNP.
MoU and ARPU Trends
Source: TRAI

14 PwC
Right time for VAS – An idea whose time has comeRoll out of 3G and BWA networks along with increasing penetration of advanced devices, VAS is an idea whose time has come
Source: TRAI
3G Penetration (Q2 2009)
Source: Morgan Stanley - The Mobile Internet Report
Availability of device : With increasing penetration of smartphones, advanced feature phones, iPad and tablets, consumption of VAS will evolve from traditional VAS (SMS etc.,) to advanced VAS. The price point of these devices have increased the penetration
Device readiness: Handsets have also matured in terms of giving a comparable experience as a full screen device
Diverse applications: Alongwith growing number of app stores and available apps, the quality of apps are also improving
Smart pipe: Another major roadblock has been inability to deliver high bandwidth consuming VAS.
India is right timed in adoption of 3G/4G technology. 3G/4G is the platform on which, due to support for higher data rates, advanced VAS can be reliably delivered .
With operators rolling out their 3G as well as BWA networks, the constraint would be removed and operators can offer high quality VAS to their subscribers

Connect with Consumer - Value Added Services 15
VAS will help in increasing Share of WalletThe future spend on mobile services is expected to rise in India on account of increasing incomes
The GNI per capita for India has been witnessing a healthy growth. However, the ratio of ARPU (Blended) to average monthly GNI per capita is falling, indicating that paying capacity has increased but spending on mobile services has not increased proportionately, perhaps due to supply side constraints, which are likely to ease.
Based on an analysis of prepaid spend (the dominant payment method), the average monthly spend in India is low when compared with other developing and developed nations . Therefore, there is further scope for mobile service revenues to grow as GNI per capita grows.
VAS is the key to increased share of customer wallet since voice is a commodity.
7.7%
8390
98
4.0%
6.0%
Monthly GNI Per Capita (Current USD)
Ratio of ARPU (Blended) to GNI Per Capita
Source: TRAI and World Bank
Source: ITU Data
2007 2008 2009

16 PwC
Current VAS Value chain in Indian context
Looking at present VAS value chainThe value chain player who manages the customer, appears to be the winner with lion’s share of 60-80% of VAS revenues.
Source: PwC Mobile Broadband Outlook 2015
As compared to the global counterparts, Indian mobile operators are able to negotiate better terms with other players in the chain. Globally operators share nearly 25-30% of the revenue and possess lesser control over VAS players7.
Why operators dominate in India• Complete control over the ‘data pipe’ being the major
customer touch-point.
• Lack of branded content providers leading to smaller players entering the market with little negotiation power.
• No clear emergence of a ‘Killer content’ leading to absence of demand side pull creating space for mobile content providers
Emergence of Handset manufacturer’s role in application based VAS market
Handset linked ‘App Store’ serving as content aggregator and technology enabler
Connect with Consumer - Value Added Services 17
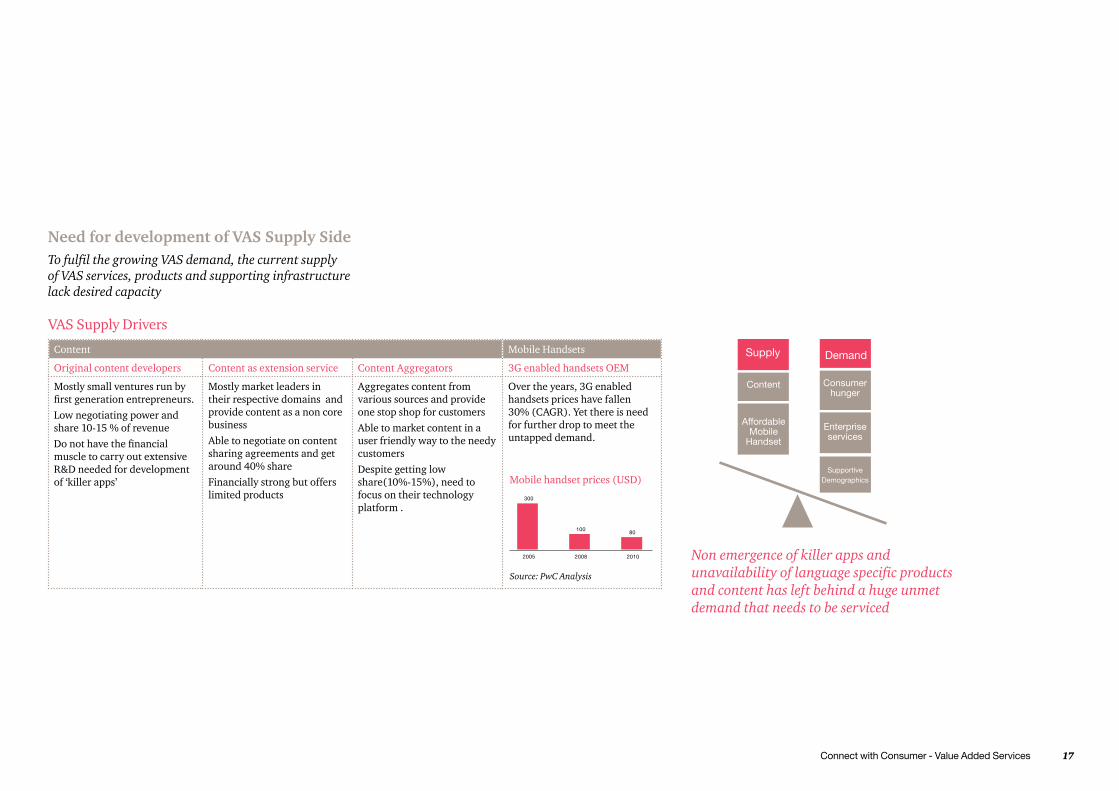
Need for development of VAS Supply SideTo fulfil the growing VAS demand, the current supply of VAS services, products and supporting infrastructure lack desired capacity
Content Mobile Handsets
Original content developers Content as extension service Content Aggregators 3G enabled handsets OEM
Mostly small ventures run by firstgenerationentrepreneurs.Low negotiating power and share 10-15 % of revenue Donothavethefinancialmuscle to carry out extensive R&D needed for development of ‘killer apps’
Mostly market leaders in their respective domains and provide content as a non core businessAble to negotiate on content sharing agreements and get around 40% shareFinancially strong but offers limited products
Aggregates content from various sources and provide one stop shop for customersAble to market content in a user friendly way to the needy customersDespite getting low share(10%-15%), need to focus on their technology platform .
Over the years, 3G enabled handsets prices have fallen 30% (CAGR). Yet there is need for further drop to meet the untapped demand.
Non emergence of killer apps and unavailability of language specific products and content has left behind a huge unmet demand that needs to be serviced
Mobile handset prices (USD)
Source: PwC Analysis
18 PwC
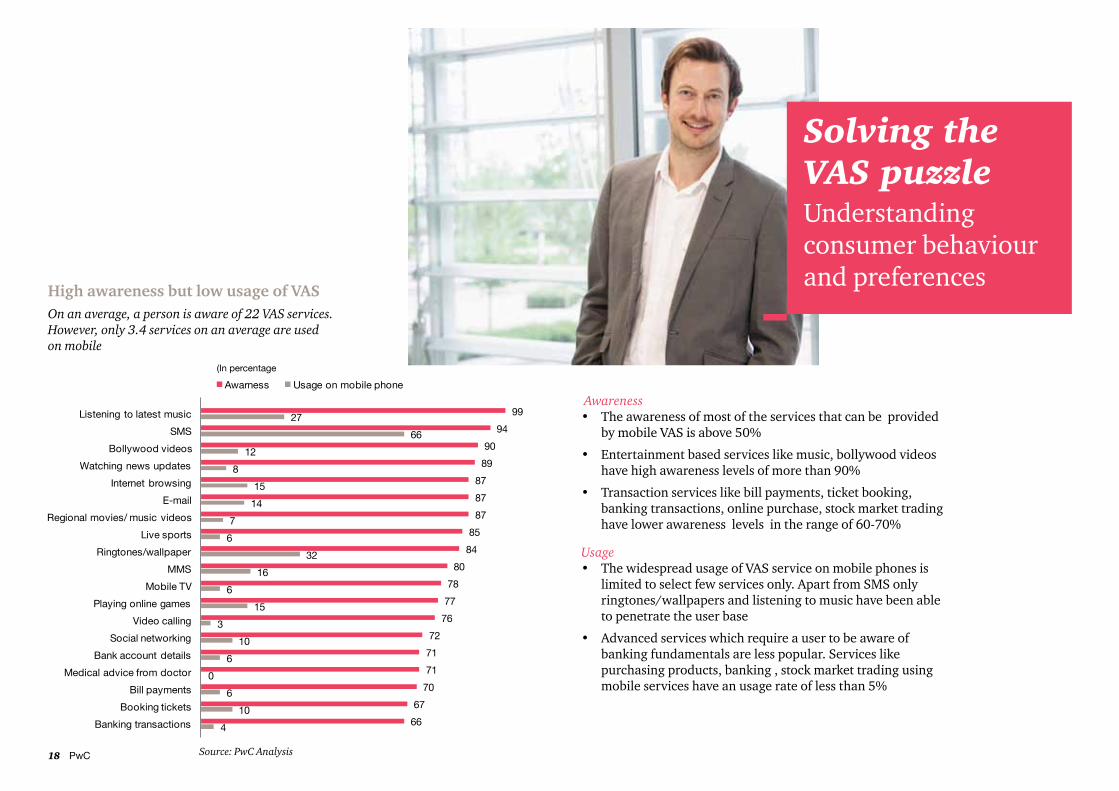
Solving the VAS puzzleUnderstanding consumer behaviour and preferences
High awareness but low usage of VASOn an average, a person is aware of 22 VAS services. However, only 3.4 services on an average are used on mobile
Awareness • The awareness of most of the services that can be provided
by mobile VAS is above 50%
• Entertainment based services like music, bollywood videos have high awareness levels of more than 90%
• Transaction services like bill payments, ticket booking, banking transactions, online purchase, stock market trading have lower awareness levels in the range of 60-70%
Usage• The widespread usage of VAS service on mobile phones is
limited to select few services only. Apart from SMS only ringtones/wallpapers and listening to music have been able to penetrate the user base
• Advanced services which require a user to be aware of banking fundamentals are less popular. Services like purchasing products, banking , stock market trading using mobile services have an usage rate of less than 5%
(In percentage
Source: PwC Analysis
Connect with Consumer - Value Added Services 19
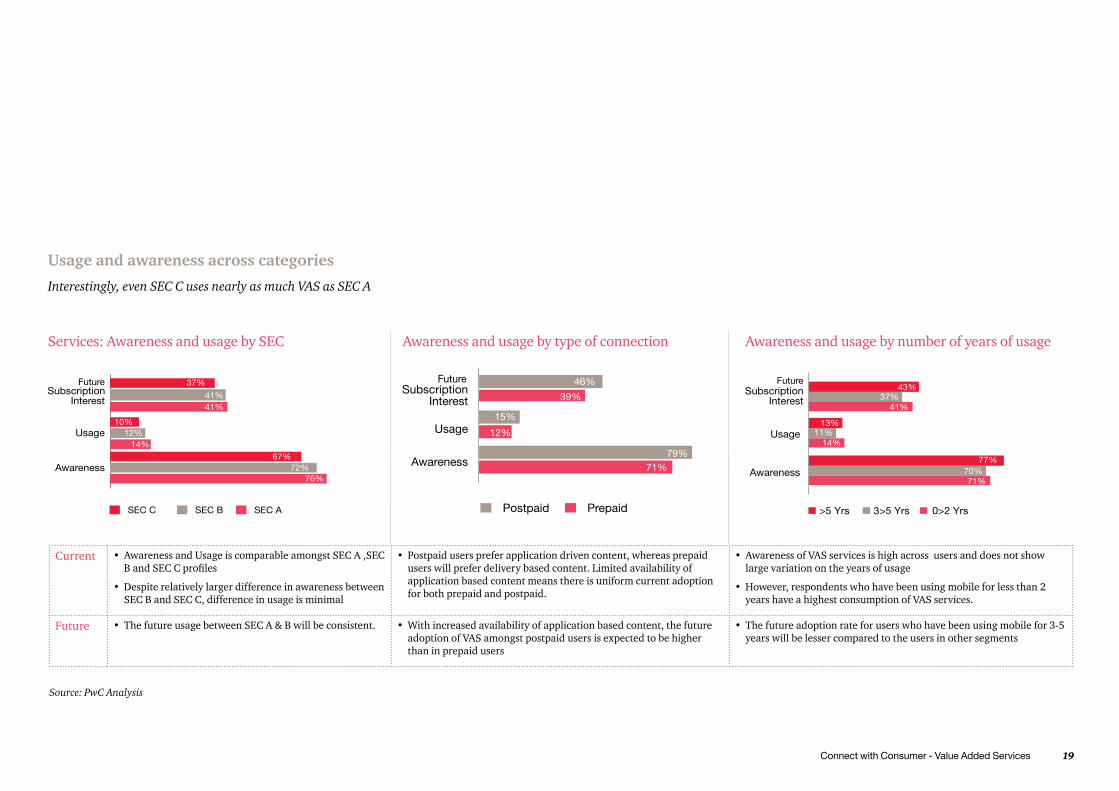
Usage and awareness across categories
Interestingly, even SEC C uses nearly as much VAS as SEC A
Services: Awareness and usage by SEC Awareness and usage by type of connection Awareness and usage by number of years of usage
Source: PwC Analysis
Current •Awareness and Usage is comparable amongst SEC A ,SEC BandSECCprofiles
•Despite relatively larger difference in awareness between SEC B and SEC C, difference in usage is minimal
• Postpaid users prefer application driven content, whereas prepaid users will prefer delivery based content. Limited availability of application based content means there is uniform current adoption for both prepaid and postpaid.
•Awareness of VAS services is high across users and does not show large variation on the years of usage
•However, respondents who have been using mobile for less than 2 years have a highest consumption of VAS services.
Future • The future usage between SEC A & B will be consistent. •With increased availability of application based content, the future adoption of VAS amongst postpaid users is expected to be higher than in prepaid users
• The future adoption rate for users who have been using mobile for 3-5 years will be lesser compared to the users in other segments
20 PwC
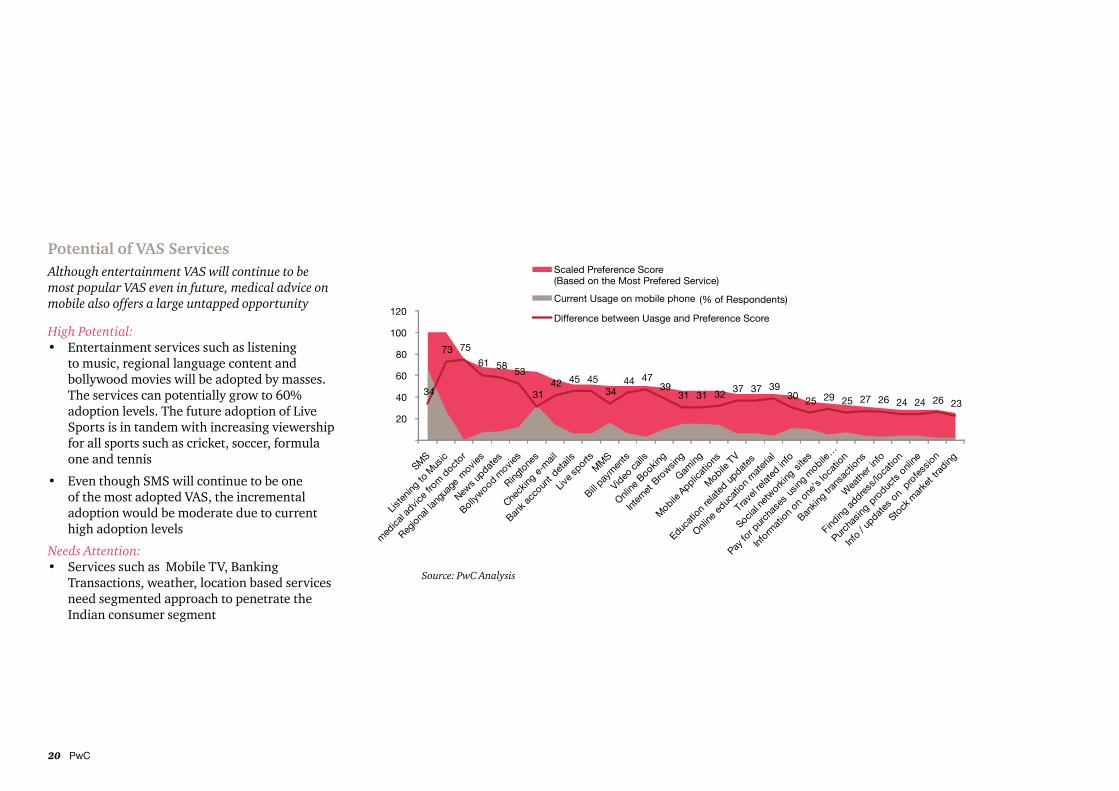
Potential of VAS ServicesAlthough entertainment VAS will continue to be most popular VAS even in future, medical advice on mobile also offers a large untapped opportunity
High Potential:• Entertainment services such as listening
to music, regional language content and bollywood movies will be adopted by masses. The services can potentially grow to 60% adoption levels. The future adoption of Live Sports is in tandem with increasing viewership for all sports such as cricket, soccer, formula one and tennis
• Even though SMS will continue to be one of the most adopted VAS, the incremental adoption would be moderate due to current high adoption levels
Needs Attention:• Services such as Mobile TV, Banking
Transactions, weather, location based services need segmented approach to penetrate the Indian consumer segment
Source: PwC Analysis

Connect with Consumer - Value Added Services 21
Factors that can influence the adoption of VASAccess to required information and ease of use are two dominating motivator for adoption of VAS Services. Lack of perceived need and cost are two major barriers for adoption
Reasons for not adopting a VAS (% of respondents)*
•Ease of use of VAS as well as providing multilingual content of choice is the key to increasing adoption particularly among SEC B and SEC C
•Value chain players should focus on design elements to address ease of use and multilingual content
•Promotion is the key to convert people who show willingness to buy
Reasons for adopting a VAS (% of respondents)*
*People responded to multiple reasons for opting/not opting a given service.
Source: PwC AnalysisSource: PwC Analysis

22 PwC
Solving the VAS puzzleCommunication VAS
Communication – Current ScenarioVideo calling which is a recent introduction has higher awareness levels in comparison to social networking
Communication services
Current Adoption
Future Adoption
Willingness to pay ( Rs. per month)
% Respondents for which it is in Top 3 VAS services
SMS 66% 82% 42 37%
Making Video calls 3% 51% 57 18%
Social networking sites
10% 30% 44 4%
MMS 16% 53% 60 11%
Checking e-mail 14% 48% 53 12% Awareness ( % )
Cur
rent
Usa
ge (
% )
CommunicationServices: SMS, checking mails on gmail or always on push mail interface, accessing mobile search engines, instant messaging on blackberry, video calling, facebook etc.,
Source: PwC Analysis Source: PwC Analysis
Connect with Consumer - Value Added Services 23
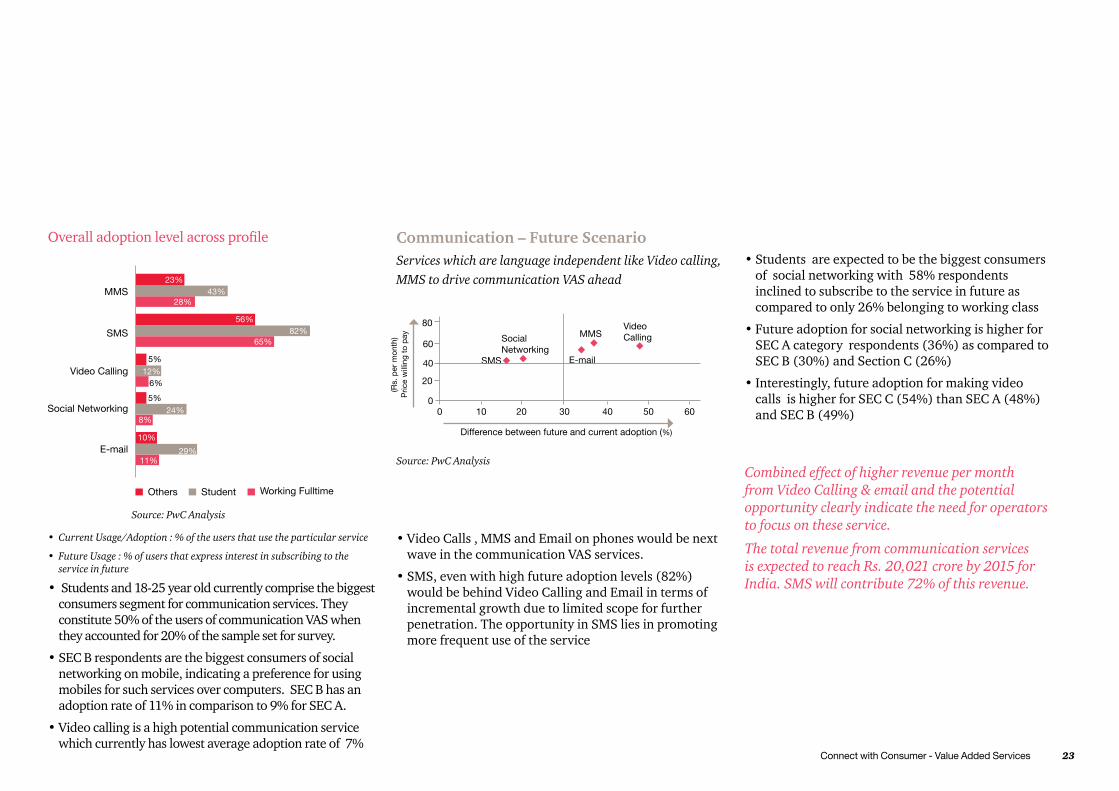
• Students and 18-25 year old currently comprise the biggest consumers segment for communication services. They constitute 50% of the users of communication VAS when they accounted for 20% of the sample set for survey.
•SEC B respondents are the biggest consumers of social networking on mobile, indicating a preference for using mobiles for such services over computers. SEC B has an adoption rate of 11% in comparison to 9% for SEC A.
•Video calling is a high potential communication service which currently has lowest average adoption rate of 7%
• Current Usage/Adoption : % of the users that use the particular service
• Future Usage : % of users that express interest in subscribing to the service in future
Communication – Future ScenarioServices which are language independent like Video calling, MMS to drive communication VAS ahead
•Video Calls , MMS and Email on phones would be next wave in the communication VAS services.
•SMS, even with high future adoption levels (82%) would be behind Video Calling and Email in terms of incremental growth due to limited scope for further penetration. The opportunity in SMS lies in promoting more frequent use of the service
•Students are expected to be the biggest consumers of social networking with 58% respondents inclined to subscribe to the service in future as compared to only 26% belonging to working class
•Future adoption for social networking is higher for SEC A category respondents (36%) as compared to SEC B (30%) and Section C (26%)
•Interestingly, future adoption for making video calls is higher for SEC C (54%) than SEC A (48%) and SEC B (49%)
Combined effect of higher revenue per month from Video Calling & email and the potential opportunity clearly indicate the need for operators to focus on these service.
The total revenue from communication services is expected to reach Rs. 20,021 crore by 2015 for India. SMS will contribute 72% of this revenue.
Overalladoptionlevelacrossprofile
MMS
SMS
Video Calling
Social Networking
Source: PwC Analysis
Source: PwC Analysis
Difference between future and current adoption (%)
(Rs.
per
mon
th)

24 PwC
Solving the VAS puzzleEntertainment VAS
Entertainment – Current ScenarioAll entertainment services lie in the emerging category indicating their future potential
Entertainment services Current Adoption
Future Adoption
Willingness to pay (Rs. per month)
% Respondents for which it is in Top 3 VAS services
Listening to music 27% 88% 62 51%
Ringtones/ Wallpaper 32% 56% 55 12%
Bollywood movies/ videos
12% 54% 77 15%
Regional language movies/ videos
7% 47% 80 15%
Live sports 6% 46% 64 14%
Mobile TV 6% 38% 53 7%
Online games 15% 34% 55 4%
Awareness ( % )
Cur
rent
Usa
ge (
% )
EntertainmentServices: CRBT, Wallpapers, downloading or playing online games, video streaming , conferencing, mobile TV
Source: PwC Analysis Source: PwC Analysis
Connect with Consumer - Value Added Services 25
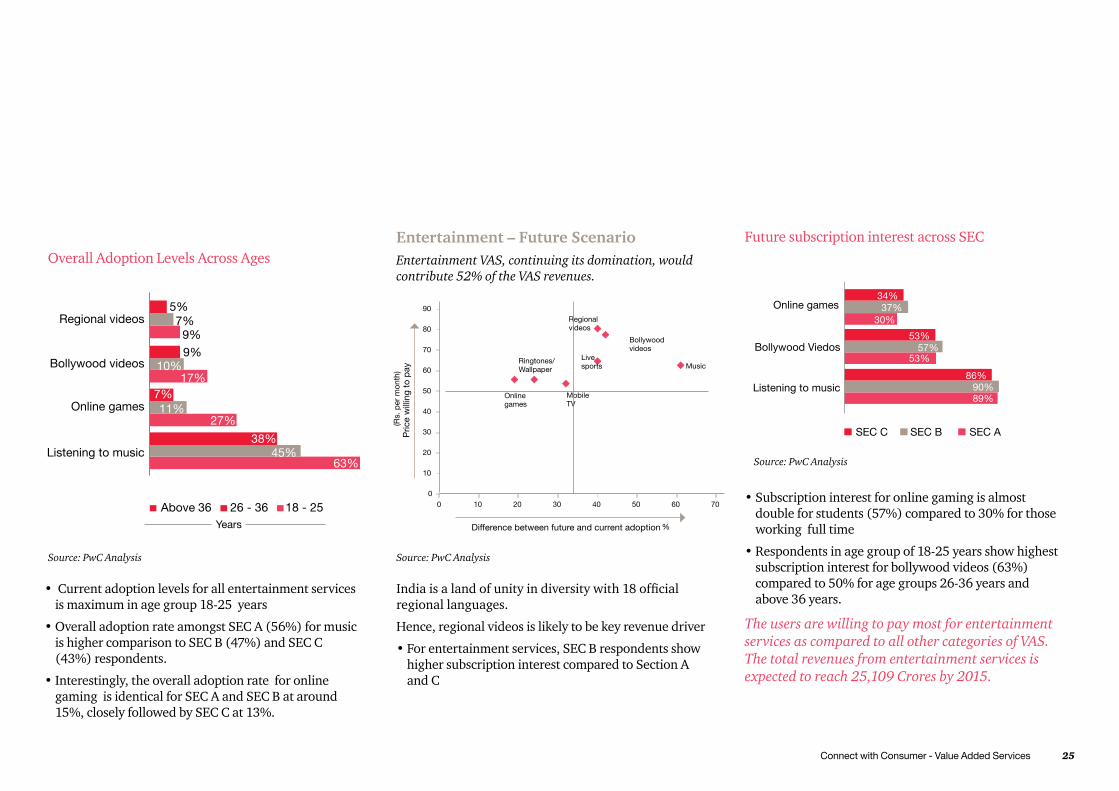
• Current adoption levels for all entertainment services is maximum in age group 18-25 years
•Overall adoption rate amongst SEC A (56%) for music is higher comparison to SEC B (47%) and SEC C (43%) respondents.
•Interestingly, the overall adoption rate for online gaming is identical for SEC A and SEC B at around 15%, closely followed by SEC C at 13%.
Entertainment – Future ScenarioEntertainment VAS, continuing its domination, would contribute 52% of the VAS revenues.
Future subscription interest across SEC
Source: PwC Analysis
The users are willing to pay most for entertainment services as compared to all other categories of VAS. The total revenues from entertainment services is expected to reach 25,109 Crores by 2015.
Indiaisalandofunityindiversitywith18officialregional languages.
Hence, regional videos is likely to be key revenue driver
•For entertainment services, SEC B respondents show higher subscription interest compared to Section A and C
•Subscription interest for online gaming is almost double for students (57%) compared to 30% for those working full time
•Respondents in age group of 18-25 years show highest subscription interest for bollywood videos (63%) compared to 50% for age groups 26-36 years and above 36 years.
Overall Adoption Levels Across Ages
Source: PwC Analysis
Source: PwC Analysis
(Rs.
per
mon
th)
%

26 PwC
Solving the VAS puzzleInformation VAS
Information services
Current Adoption
Future Adoption
Price willing to pay (Rs. per month)
% Respondents for which it is in Top 3 VAS services
Watching news updates
8% 62% 51 23%
Getting medical advice from doctor
0% 49% 73 14%
Internet browsing
15% 46% 62 14%
Education related
6% 31% 55 4%
Weather information
3% 21% 49 2%
Information related to location
7% 20% 51 1%
Getting info/updates on profession
2% 11% 111 1%
• The adoption level for information services is marginally higher for SEC A followed by SEC B and C
• However, for news related updates adoption rate amongst SEC A (7%) is lower in comparison to SEC B (10%)
• Adoption of profession related services like job update is low across working/non-working/student class indicating potential among all classes
Overall adoption level across Section
Profesion
LBS
Medical advice
Internet browsing
News
SEC C SEC B SEC A
7%10%
8%
16%15%
12%
15%15%
13%
10%6%
4%
2%
2%
1%
Information – Current ScenarioVideo calling which is a recent introduction has higher awareness levels in comparison to social networking
Source: PwC Analysis
Awareness ( % )
Cur
rent
Usa
ge (
% )
Information Services : Getting weather forecast, news websites, information related to location, info updates on profession, online maps etc
Source: PwC Analysis
Source: PwC Analysis
Connect with Consumer - Value Added Services 27
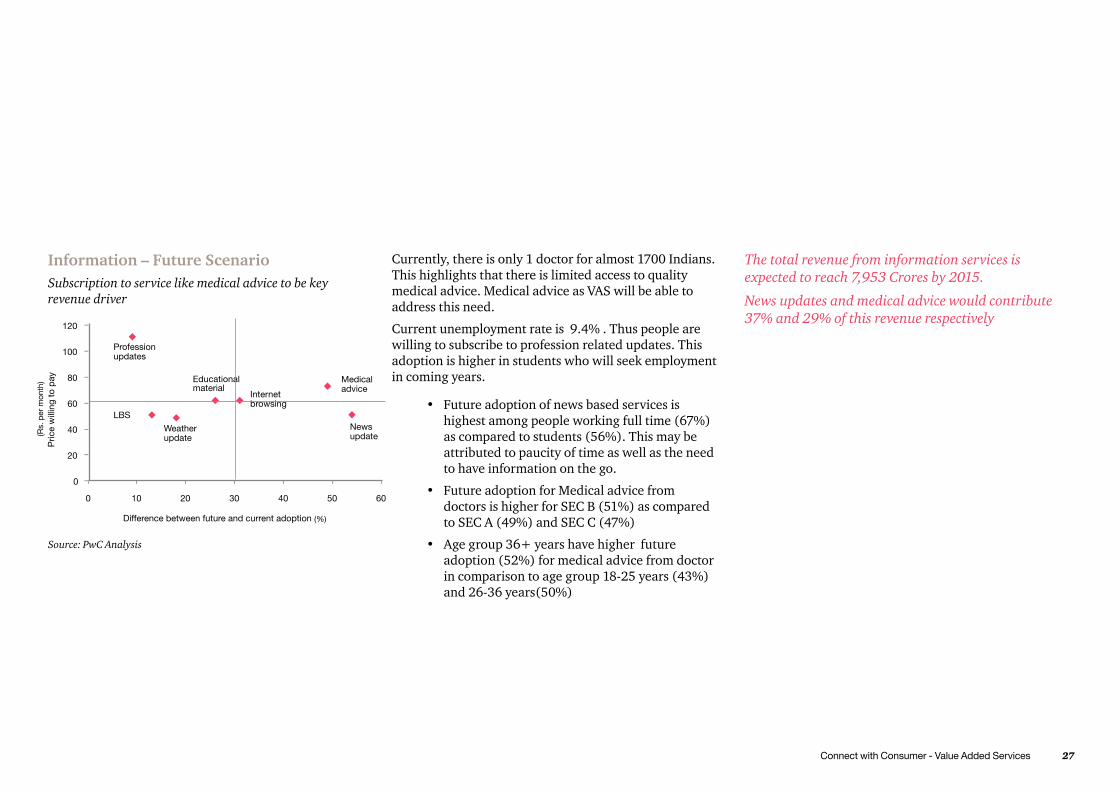
Currently, there is only 1 doctor for almost 1700 Indians. This highlights that there is limited access to quality medical advice. Medical advice as VAS will be able to address this need.
Current unemployment rate is 9.4% . Thus people are willing to subscribe to profession related updates. This adoption is higher in students who will seek employment in coming years.
• Future adoption of news based services is highest among people working full time (67%) as compared to students (56%). This may be attributed to paucity of time as well as the need to have information on the go.
• Future adoption for Medical advice from doctors is higher for SEC B (51%) as compared to SEC A (49%) and SEC C (47%)
• Age group 36+ years have higher future adoption (52%) for medical advice from doctor in comparison to age group 18-25 years (43%) and 26-36 years(50%)
The total revenue from information services is expected to reach 7,953 Crores by 2015.
News updates and medical advice would contribute 37% and 29% of this revenue respectively
Information – Future ScenarioSubscription to service like medical advice to be key revenue driver
Source: PwC Analysis
(Rs.
per
mon
th)
(%)
28 PwC
Solving the VAS puzzlemCommerce VAS
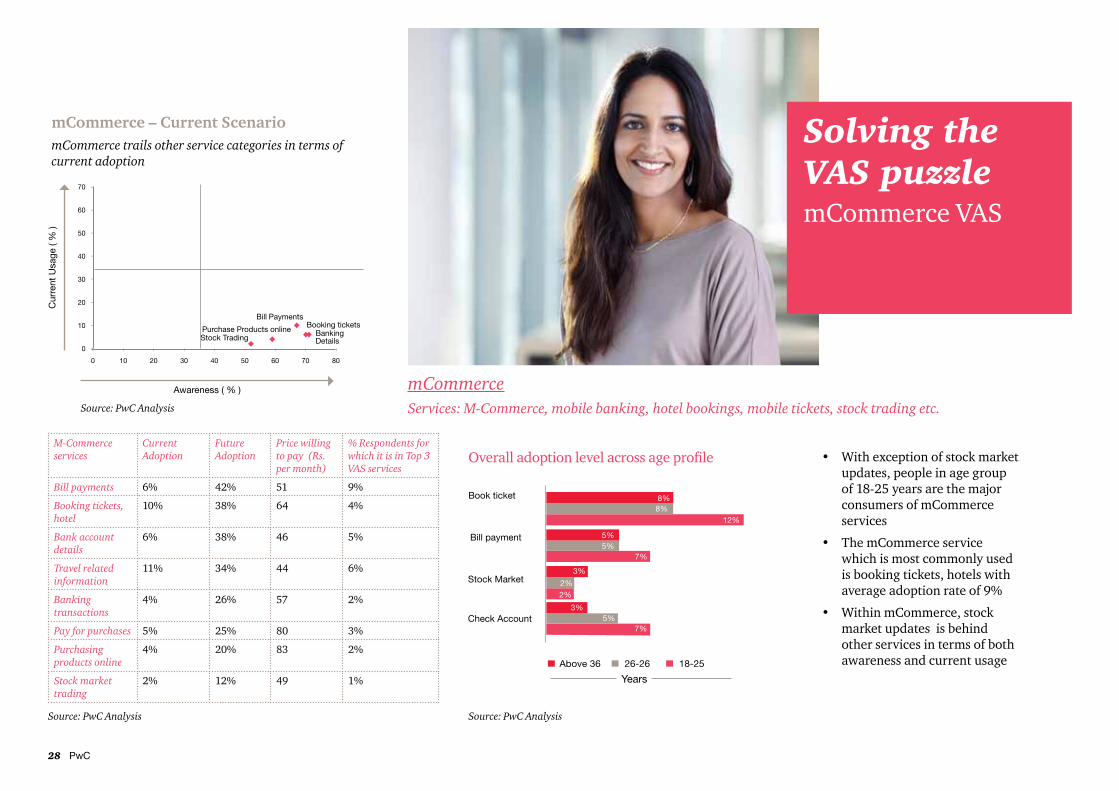
mCommerce – Current ScenariomCommerce trails other service categories in terms of current adoption
M-Commerce services
Current Adoption
Future Adoption
Price willing to pay (Rs. per month)
% Respondents for which it is in Top 3 VAS services
Bill payments 6% 42% 51 9%
Booking tickets, hotel
10% 38% 64 4%
Bank account details
6% 38% 46 5%
Travel related information
11% 34% 44 6%
Banking transactions
4% 26% 57 2%
Pay for purchases 5% 25% 80 3%
Purchasing products online
4% 20% 83 2%
Stock market trading
2% 12% 49 1%
• With exception of stock market updates, people in age group of 18-25 years are the major consumers of mCommerce services
• The mCommerce service which is most commonly used is booking tickets, hotels with average adoption rate of 9%
• Within mCommerce, stock market updates is behind other services in terms of both awareness and current usage
Overalladoptionlevelacrossageprofile
Awareness ( % )
Cur
rent
Usa
ge (
% )
Source: PwC Analysis
mCommerceServices: M-Commerce, mobile banking, hotel bookings, mobile tickets, stock trading etc.
Source: PwC Analysis Source: PwC Analysis
Connect with Consumer - Value Added Services 29
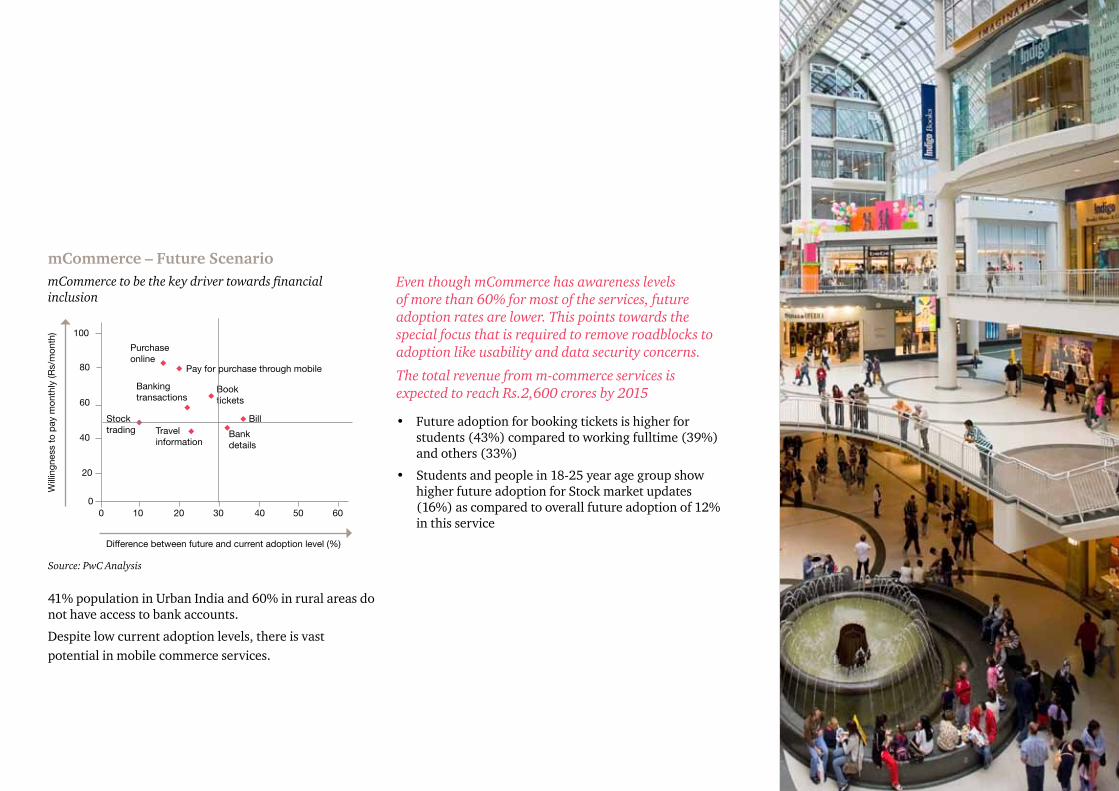
mCommerce – Future ScenariomCommerce to be the key driver towards financial inclusion
41% population in Urban India and 60% in rural areas do not have access to bank accounts.
Despite low current adoption levels, there is vast potential in mobile commerce services.
Even though mCommerce has awareness levels of more than 60% for most of the services, future adoption rates are lower. This points towards the special focus that is required to remove roadblocks to adoption like usability and data security concerns.
The total revenue from m-commerce services is expected to reach Rs.2,600 crores by 2015
• Future adoption for booking tickets is higher for students (43%) compared to working fulltime (39%) and others (33%)
• Students and people in 18-25 year age group show higher future adoption for Stock market updates (16%) as compared to overall future adoption of 12% in this service
Source: PwC Analysis
30 PwC
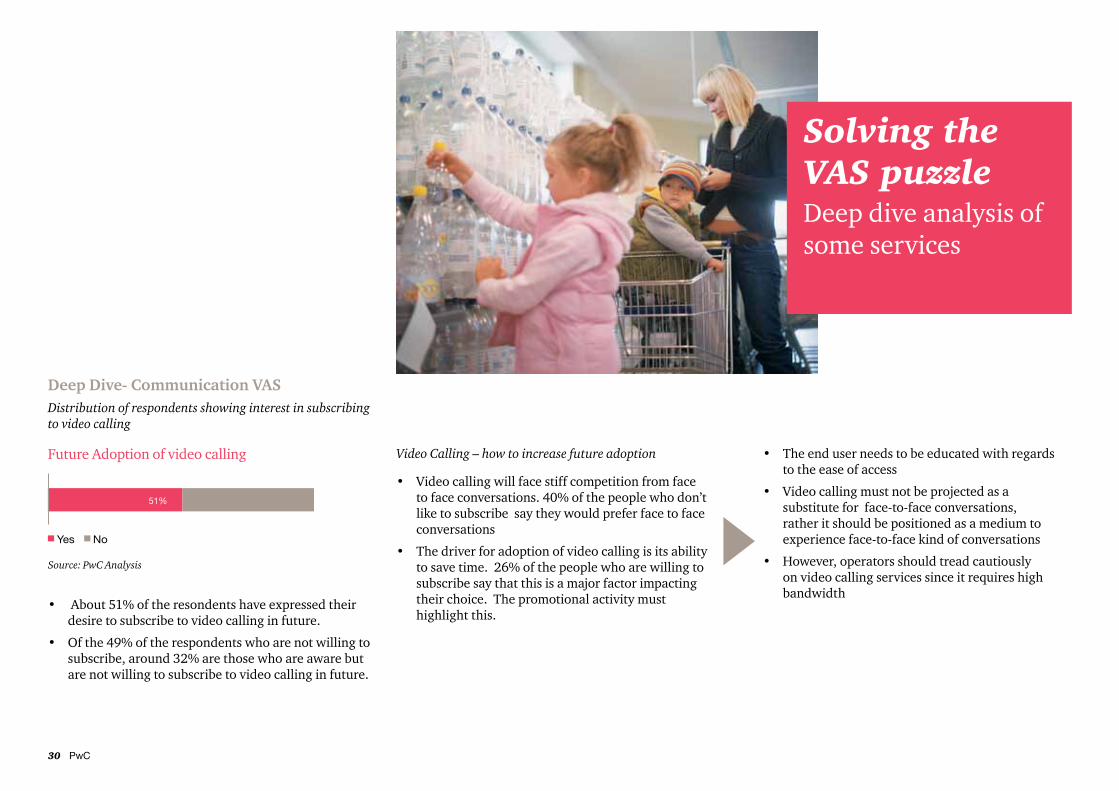
Solving the VAS puzzleDeep dive analysis of some services
Deep Dive- Communication VASDistribution of respondents showing interest in subscribing to video calling
• About 51% of the resondents have expressed their desire to subscribe to video calling in future.
• Of the 49% of the respondents who are not willing to subscribe, around 32% are those who are aware but are not willing to subscribe to video calling in future.
Future Adoption of video calling • The end user needs to be educated with regards to the ease of access
• Video calling must not be projected as a substitute for face-to-face conversations, rather it should be positioned as a medium to experience face-to-face kind of conversations
• However, operators should tread cautiously on video calling services since it requires high bandwidth
Video Calling – how to increase future adoption
• Video calling will face stiff competition from face to face conversations. 40% of the people who don’t like to subscribe say they would prefer face to face conversations
• The driver for adoption of video calling is its ability to save time. 26% of the people who are willing to subscribe say that this is a major factor impacting their choice. The promotional activity must highlight this.
Source: PwC Analysis

Connect with Consumer - Value Added Services 31
Deep Dive- Entertainment VASMusic and Videos have wider audience and uniform adoption
• Listening to music, Bollywood movies/music videos and regional movies/music videos have appeal across SECs
• The operators, therefore would need to use mediums with mass reach for increasing awareness and increasing adoption of these services.
Deep Dive- Entertainment VAS Mobile gaming – who are the customers?
Future adoption rate of Mobile Gaming (%)
• The adoption rate of mobile gaming is higher in Metros. The adoption is relatively low in smaller cities.
• Even in metros the adoption rate is higher in SEC B and SEC C as compared to in SEC A.
• The games should thus be designed keeping in mind the entertainment requirements of SEC B and SEC C users.
• The games should be less complex and should be playable on cheap handsets also. This would make possible adoption by wider audience.
Deep Dive- Information VASMedical Advice
• Medical advice is one of the few VAS which has high future adoption rate even in SEC C. This may be attributed to limited access to quality healthcare for SEC C.
• Although the people are willing to pay a higher than average price per month (of Rs 73) for this service, the operators must charge price which can be easily afforded by SEC C and people in smaller cities.
• This would allow the VAS to achieve its full potential and become a broad based VAS just like listening to music
Future adoption rate of listening to music service (%) Future adoption rate of Medical Advice (%)
Source: PwC Analysis Source: PwC Analysis Source: PwC Analysis

32 PwC
Deep Dive- Information VASOnline maps and location based services
Proportion of demand for online maps from different age groups (%)
• Operators looking to tap this segment should focus more in terms of utility and perceived value of this services. Almost 47% of who are willing to subscribe are in age range of 18-25 years.
• Amongst the working class, online maps have shown highest interest in salesperson and clerical category
• The location based services and online maps should, there fore, be offered at nominal price and the revenues from advertising and paid listing should be the main source of revenues for these services.
Source: PwC Analysis

Connect with Consumer - Value Added Services 33
Mapping of Mobile VAS Users
MethodologyPwC undertook cluster analysis to segment respondents based on the preference of respondents for various VAS. The input for cluster analysis was the relative preference score (utility) for each service for each respondent. This was derived using Maximum difference analysis*.
Then the K means clustering method was used to arrive at cluster solutions. The criterion for selection was based on how the clusters were differentiated in terms of needs (services that they prefer). Following are the results of the segment sizes. Then the demographic patterns and the mobile usage patterns were studied to assess the common attributes of different segments
TrendsettersView their mobile phones as a device for surfing the internetYoung Preferred Services: Email, Gaming. Social Networking, Education, SMS, Basic Downloads
and Entertainment (Music, Movies, Sports)
Highly Educated Segment Profile: Age: Mainly 18 – 25 (Young), will also include individuals in 25-35 age bracket
Students & young working
Gender: Equal mix of men and womenSocio-Economic Classification: Most Affluent, 42% belong to SEC A
Mostly unmarried Education: Majority i.e. 52% either are Graduate or Post GraduateOccupation: Students and WorkingMarital Status: Mostly UnmarriedAverage Voice Minutes Used Per Day: 56 (Highest Usage)Type of Handset Used: Many have Qwerty Phone
*Maximum difference analysis is a technique that identifies the “best” of many alternatives (VAS services in our case). A respondent is asked to choose from a set of services which is most preferred and which is least preferred out of the four or five items at a time. The outcome is a MaxDiff score for each item that indicates both absolute and relative importance
based on preference of the items
Segment sizes
Source: PwC Analysis
Depending on usage patterns and preferences VAS customers can broadly be segmented into trendsetters, followers and entertainment seekers and others.

34 PwC
Insights on Trendsetters
Awareness of ServicesOn an average trendsetters in urban India are aware of about 29 VAS services
This segment is considerably more aware of services such as online maps, stock trading, location base services than the overall mix of users
Usage of ServicesOnly 5 out of 30 services on an average are used on mobile. This is much lower than the average awareness of 29 services.
Services that are more popular in this seg-ment relative to the overall mix include MMS, Online Maps. Social Networking, Travel Related Information
Awareness of Services
Usage of Services
Source: PwC Analysis

Connect with Consumer - Value Added Services 35
‘Followers’ will adopt tomorrow the trends exhibited by ‘Trendsetters’ today
FollowersView their mobile phones as a device for surfing the internetYoung Preferred Services: SMS, Basic Downloads
,Entertainment (Music, Movies, Sports) and Transaction Services (Includes Experimental Usage also)
Highly Educated Segment Profile: Age: Mainly 25-36 years old
Students & young working
Gender: Equal Mix of Men and Women Socio-Economic Classification: – Mixed, 33% belong to SEC A and the Rest are in SEC B & C
Mostly unmarried Education: SSC, HSC, Graduates, Post GraduatesOccupation: Working (Including Traders & Businessmen)Marital Status: Mostly MarriedAverage Voice Minutes Used Per Day: 40 to 45 Type of Handset Used: Conventional and Qwerty Phones
Insights on Followers
Awareness of ServicesFollowers exhibit similar awareness levels for most services as the overall mix
Usage of ServicesUsage among followers is slightly less than the overall mix
Awareness of Services (In percentage)
Usage of Services (In percentage)
Source: PwC Analysis

36 PwC
Entertainment seekers would continue to bring in volumes to VAS
Entertainment Seekers
View their mobile phones as an personalized entertainment Device
Middle Age Preferred Services: Entertainment services like bollywood and regional movies, soap operas and listening to music
Less Affluent Segment Profile:Age: 36+Gender : Women constitute 2/3rds of the segment
Mostly Women Socio-Economic Classification: Least Affluent, 78% belong to SEC B & C
Mostly unmarried Education: Least Educated, around 55% have some schooling/ SSC/HSCOccupation: Mix of Housewives and working populationMarital Status: Mostly MarriedAverage Voice Minutes Used Per Day: Less than 4oType of Handset Used: Conventional
Insights on Entertainment seekers
Awareness of ServicesEntertainment seekers are generally less aware of services as compared to overall mix
Usage of ServicesEntertainment seekers use less services on mobile than overall mix
However, their usage for Bollywood and regional videos is closer to the overall mix as compared to other services
Awareness of Services
Usage of Services
Source: PwC Analysis
Connect with Consumer - Value Added Services 37
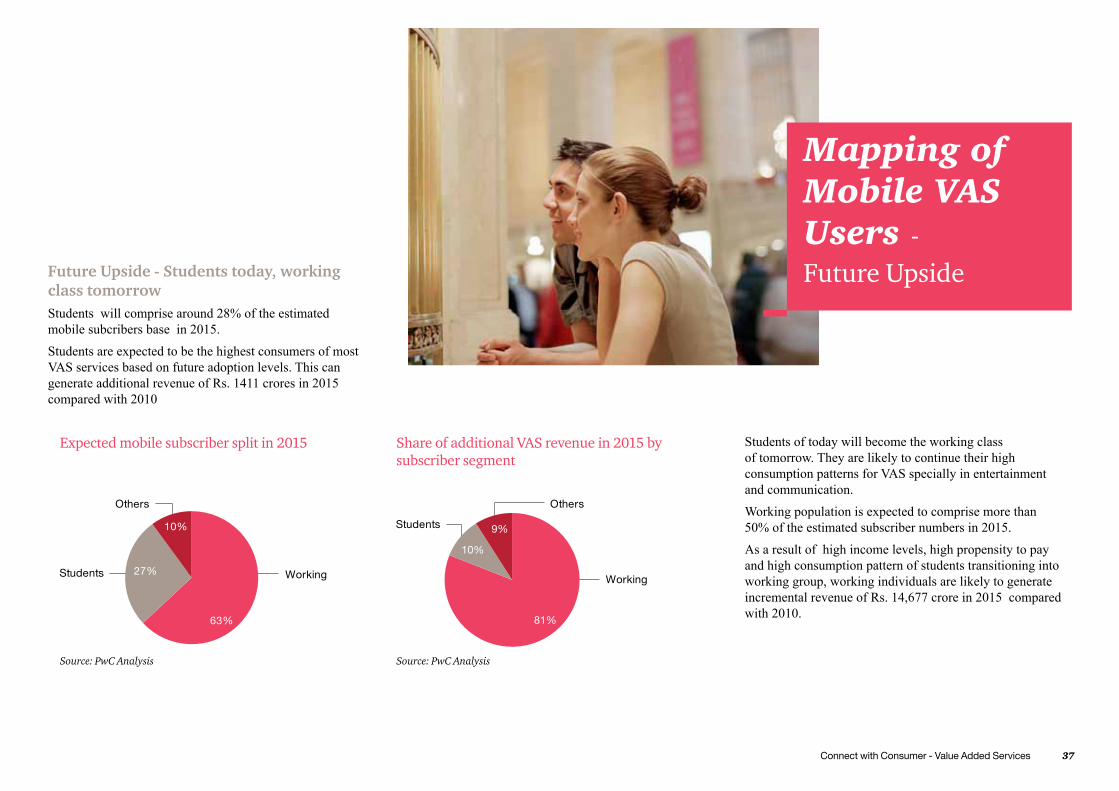
Students of today will become the working class of tomorrow. They are likely to continue their high consumption patterns for VAS specially in entertainment and communication.
Working population is expected to comprise more than 50% of the estimated subscriber numbers in 2015.
As a result of high income levels, high propensity to pay and high consumption pattern of students transitioning into working group, working individuals are likely to generate incremental revenue of Rs. 14,677 crore in 2015 compared with 2010.
Mapping of Mobile VAS Users - Future UpsideFuture Upside - Students today, working
class tomorrow Students will comprise around 28% of the estimated mobile subcribers base in 2015.
Students are expected to be the highest consumers of most VAS services based on future adoption levels. This can generate additional revenue of Rs. 1411 crores in 2015 compared with 2010
Share of additional VAS revenue in 2015 by subscriber segment
Expected mobile subscriber split in 2015
Source: PwC Analysis Source: PwC Analysis

38 PwC
• The adoption interest for both students and working individuals is expected to rise across most of the VAS services
• The future adoption interest is expected to further increase in working segment as more students transition to working class
• Working class will be crucial for operators to tap as it would combine high future adoption (students) with better capacity to pay (Working)
Future Upside - Students today, working class tomorrow
Students Working
Source: PwC Analysis Source: PwC Analysis

Connect with Consumer - Value Added Services 39
Tax Imperatives of VAS
Why Taxation aspects are important• The auction of the 3G spectrum by the Government lastyearrangprofitbellsfortheVASindustry.
• The roll-out of the 3G network is expected to fuel the growth of the Indian VAS industry. It is expected that the Indian mobile market would witness different, varied and profound VAS being offered, which were earlier not possible over the current 2G/2.5G networks.
• In view of the dynamic and ever-evolving nature of the VAS industry in India, tax implications of the innovative business combinations/joint ventures/collaborations in this space necessitate due consideration and attention on part of all the stakeholders.
• This matter assumes importance especially since the VAS industry is still perceived to be at a very nascent stage in India as compared to other developed countries of the world and consequently, most transactions/arrangements in the VAS space could involve a mind-boggling set of tax issues which are unprecedented.
In this chapter of the Report, we have highlighted some of the key tax issues which may be useful for the various stakeholders to bear in mind in view of the complex and daunting nature of the transactions in the VAS space.
Managed VAS • With declining ARPU’s, mobile operators are increasingly looking to offer a wide range of VAS that address diverse customer requirements.
• 3G technology usage will open up the pipe for a staggering number of applications that earlier speeds could not support. With video and multimedia content becoming important components of VAS, managing VAS in-house is a tough proposition for most mobile operators today.
• Managed VAS refers to the outsourcing of a part or all of the VAS operations including everyday management to another organisation, which might be a demerged company of the same group. In this connection, there are some tax neutral amalgamation/demerger related provisions under Income-tax Act, 1961 (Act), which

40 PwC
may be applicable and which may need to be considered. Typically, in such strategic models, end-to-end operations, right from offering services to the users, to billings are handled by the outsourced organisation.
• Though still in an infant stage, in recent times, mobile operators are increasingly turning towards the outsourcing model to manage the plethora of VAS services being offered to the users.
• Managed VAS enables mobile operators to offer value added services to their customers at reduced costs, while giving them more time and resources to focus on understanding customer requirements and creating new attractive service propositions.
• Taxation aspects assume great importance in such outsourcing arrangements due to the sheer nature of transactions involved.
• Typical issues, amongst others, involve the section of the Act/the rate at which tax is required to be deducted at source by the mobile operators before making payments to the outsourced organisations for services rendered by them.
• In case of resident outsourced companies, an issue would arise as to whether tax is required to be deducted at source under section 194C of the Act which deals with contractor payments; or whether section 194J of the Act, which deals which payments for professional services, amongst others, needs to be applied.
• Section 194C of the Act is applicable in case of contracts which involve carrying out of “work”. Section 194C of the Act contains an inclusive definitionoftheterm“work”.Ontheotherhand,section 194J broadly deals with payments for professional services, technical services and royalty payments.
• There could be instances where both the sections may appear to overlap. In such cases, it would be important to analyse the agreement and the exact nature of services in order to be able to analyse and differentiate between the scope of operation of these two sections of the Act.
• In case of non-resident outsourced companies, applicability of section 195 of the Act which deals with payments to non-residents would need to be examined. Section 195 of the Act would be applicable only if the income payable to the non-resident company is “chargeable to tax” in India.
• Determination of the portion of income “chargeable to tax” in India is a function of the payee company’s residential status and presence/activities in India.
• Depending upon whether the arrangement is on principal-to-principal basis or not and other factors like the nature and substance of the agreement, the transacting parties could run the risk of being treated as an “Association of Persons” (AOP). AOP is a unique concept whereby two or more parties joining together
for a common purpose/cause, may be jointly treated as a distinct, separate taxable entity under the Act.
• Formation of an AOP could have adverse implications for the parties in the form of possible higher tax rate,uncertaintyonavailabilityofbenefitsofDoubleTaxation Avoidance Agreement between India and other countries (DTAA), restrictions on allowability of carry-forward of losses etc.
• Ascertaining whether an AOP is formed or not is atediousexercisesincetheActdoesnotdefineanAOP or list out the exhaustive list of factors that go towards formation of an AOP. Reliance needs to be placed on judicial precedents on the subject for the same.
• Thus, every outsourcing arrangement would involve intricate and complex tax issues, for which appropriate, advance tax planning and due deliberation is the Need of the Hour!
Connect with Consumer - Value Added Services 41
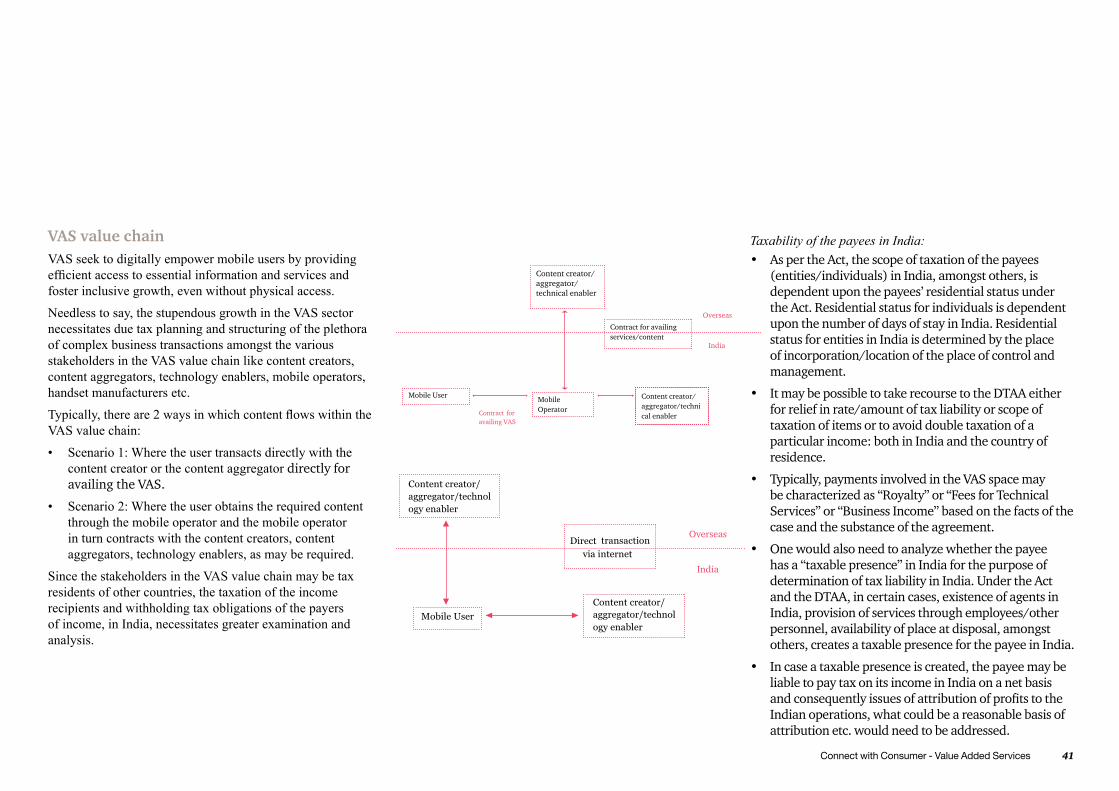
VAS value chainVAS seek to digitally empower mobile users by providing efficient access to essential information and services and foster inclusive growth, even without physical access.
Needless to say, the stupendous growth in the VAS sector necessitates due tax planning and structuring of the plethora of complex business transactions amongst the various stakeholders in the VAS value chain like content creators, content aggregators, technology enablers, mobile operators, handset manufacturers etc.
Typically, there are 2 ways in which content flows within the VAS value chain:
• Scenario 1: Where the user transacts directly with the content creator or the content aggregator directly for availing the VAS.
• Scenario 2: Where the user obtains the required content through the mobile operator and the mobile operator in turn contracts with the content creators, content aggregators, technology enablers, as may be required.
Since the stakeholders in the VAS value chain may be tax residents of other countries, the taxation of the income recipients and withholding tax obligations of the payers of income, in India, necessitates greater examination and analysis.
Taxability of the payees in India:• As per the Act, the scope of taxation of the payees
(entities/individuals) in India, amongst others, is dependent upon the payees’ residential status under the Act. Residential status for individuals is dependent upon the number of days of stay in India. Residential status for entities in India is determined by the place of incorporation/location of the place of control and management.
• It may be possible to take recourse to the DTAA either for relief in rate/amount of tax liability or scope of taxation of items or to avoid double taxation of a particular income: both in India and the country of residence.
• Typically, payments involved in the VAS space may be characterized as “Royalty” or “Fees for Technical Services” or “Business Income” based on the facts of the case and the substance of the agreement.
• One would also need to analyze whether the payee has a “taxable presence” in India for the purpose of determination of tax liability in India. Under the Act and the DTAA, in certain cases, existence of agents in India, provision of services through employees/other personnel, availability of place at disposal, amongst others, creates a taxable presence for the payee in India.
• In case a taxable presence is created, the payee may be liable to pay tax on its income in India on a net basis andconsequentlyissuesofattributionofprofitstotheIndian operations, what could be a reasonable basis of attribution etc. would need to be addressed.

42 PwC
Mildly put, it is a highly risky proposition to assume that tax liability in India cannot be triggered in the absence of physical or other modes of presence of the payee in India.
Illustration of a transaction in the VAS value chain:Let’s take an example of a technology enabler company located overseas which has set-up a joint venture (JV) Indian company. The platform/technology is located overseas and the JV Indian company is licensed the use of the technology. In consideration for the same, the JV Indian company would pay license fees to the overseas company.
In this case, there could be an entire range of tax implications which may need to be considered like
- characterization of payments made by the JV Indian company to the overseas company: whether the same is in the nature of “Royalty”/”Fees for technical services” under the Act/respective DTAA
- withholding tax obligations of the JV Indian company while making payment to the overseas company
- whether the overseas company has a “presence” in India: whether any employees come down to India; whether any control is exercised from overseas; whether any space is being made available to the overseas company in India etc. If at all, questions are: whetherpresenceiscreated,howmuchprofitswouldbeattributedtoIndia;howtheseprofitswouldbedetermined
- service tax implications and state VAT implications
- compliance with transfer pricing regulations
Tax deduction at source obligations for the payers in India:• The Act also imposes vicarious tax deduction at source
obligations on the payers of income.
• In fact, apart from stringent penalties and interest exposures, there is also the paramount risk of disallowance of the expenditure incurred, in case of default in complying with the tax deduction at source obligations.
Direct Taxes Code Bill, 2010 (DTC):While the DTC is slated to be effective from 1 April, 2012, a revised and final draft Bill is awaited.
Some key amendments proposed in the DTC are given under:
• TheDTCproposestoexpandthedefinitionof“Royalty”and “Fees for Technical Services”.
• Amongstothers,thedefinitionof“FeesforTechnicalServices”nowproposestospecificallycover‘paymentsfor development and transfer of design, drawing, plan or software, or similar services’.
• Payments for acquisition of standardised software for providing services are also proposed to be covered within the ambit of “Fees for Technical Services”.
• Introduction of General Anti-Avoidance Rule, which can override DTAAs, will give the Revenue authorities wider powers to assess transactions/tax payers.
One would need to wait and watch how the DTC is finalized and enacted in the final form, as the provisions therein are likely to have far-reaching impact for the stakeholders in the VAS value chain.
Connect with Consumer - Value Added Services 43
VAS: Way Forward
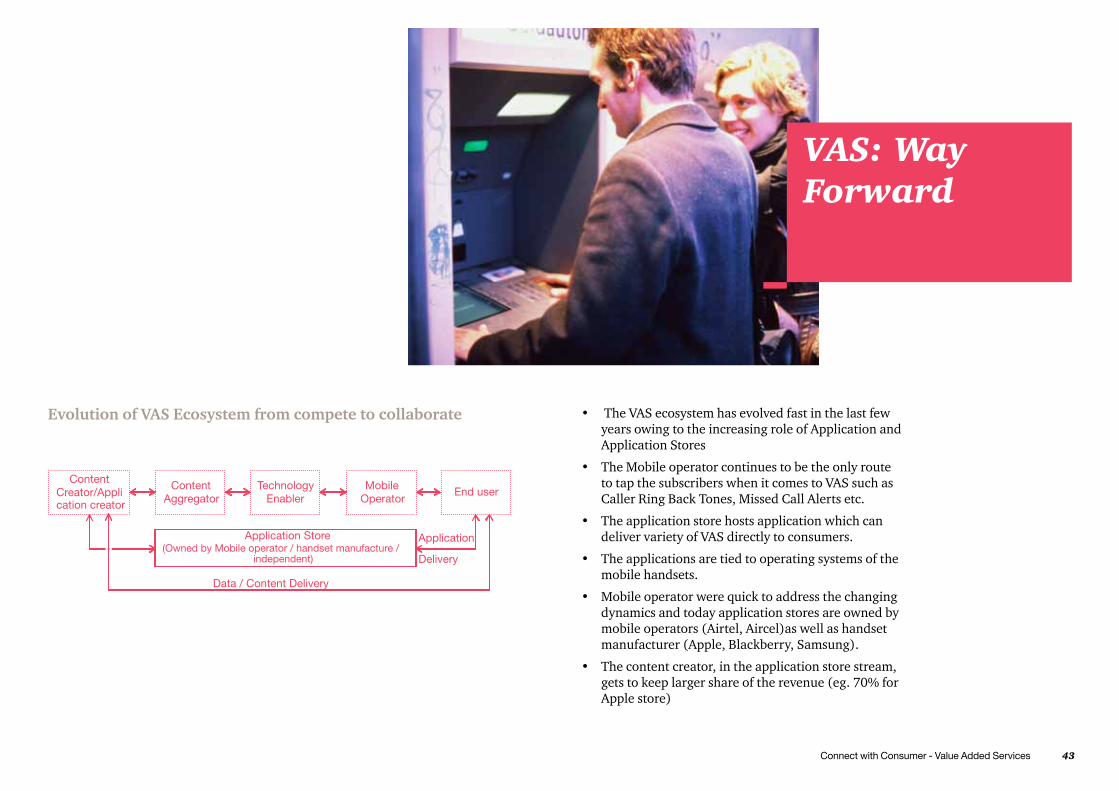
Evolution of VAS Ecosystem from compete to collaborate • The VAS ecosystem has evolved fast in the last few years owing to the increasing role of Application and Application Stores
• The Mobile operator continues to be the only route to tap the subscribers when it comes to VAS such as Caller Ring Back Tones, Missed Call Alerts etc.
• The application store hosts application which can deliver variety of VAS directly to consumers.
• The applications are tied to operating systems of the mobile handsets.
• Mobile operator were quick to address the changing dynamics and today application stores are owned by mobile operators (Airtel, Aircel)as well as handset manufacturer (Apple, Blackberry, Samsung).
• The content creator, in the application store stream, gets to keep larger share of the revenue (eg. 70% for Apple store)

44 PwC
Way forwardMobile VAS revenues are expected to reach Rs.55,000 crore by 2015, in order to capture this opportunity the following needs to be done:
Content Creator / Content Aggregator
Handset manufacturer Mobile operator Regulator
• With the introduction of 3G the content creators / aggregators to focus on proving more interactive content to push VAS usage.
• Provide more multilingual / local language content “Indian VAS companies
• Develop alternate reveune channels such as off deck portals to reduce relience on operator.
• Focus on niche segments where users are willing to pay a premium for content. Go beyond entertainment and cricket and create applications for high potential VAS such as medical services, location based services etc.
• Influence customer usage behaviour through closer collaboration with content/application creator to pre-load application on the handsets . Preloading will also increase penetration to users who are not touched by application stores
• Handset manufacturers can also work together with operaors to introduce handsets which enable easy access to advanced VAS
• Mobile operator’s may invest in VAS development for increasing their proprietary content and create customer stickiness. This will be a differentiator for the operator
• Increase uptake of VAS through attractive pricing and by offering relevant content.
• Although, RBI has issued operative guidelines for banks on mobile payments, there is a need for a more detailed regulatory framework to encourage growth of mobile in banking in India.
• Mobile payments / banking may pose risk to sensitive customer information. Existing laws need to be amended to address data security issues relating to mobile commerce.

Connect with Consumer - Value Added Services 45
References1. PwC - Indian entertainment and media outlook: 2010
2. PwC Mobile Broadband outlook 2015
3. McKinsey Global Institute report titled ‘The Bird of Gold’
4. World Press Trends 2008 by World Association of Newspapers
5. Deputy Governor, Reserve Bank of India at the HMT-DFID Financial Inclusion Conference 2007
6. English as a Global Language, 2003
7. Boston Analytics report on MVAS market in India (2007)
8a.www.stockbriefings.com accessed as on 04-Mar-2011
8b.www.setteb.it accessed as on 04-Mar-2011
9a.Silicon India news Article’ 3G phone prices to fall by half ’ published 06-August-2008, accessed as on 04-Mar- 2011.
9b.Rediff money article titled ‘Hi-tech 3G mobile phones are here’, published 15-March-2005, accessed as on 04-Mar- 2011.

46 PwC
Notes

Connect with Consumer - Value Added Services 47
About PwCPwCfirmsprovideindustry-focusedassurance,taxandadvisoryservicestoenhancevaluefortheirclients.Morethan161,000peoplein154countriesinfirmsacrossthePwCnetworksharetheirthinking,experienceandsolutionstodevelopfreshperspectivesandpracticaladvice. See pwc.com for more information.
At PwC, we push ourselves - and our clients - to think harder, to understand the consequences of every action and to consider new perspectives. Our goal is to deliver a distinctive experience to our clients and people around the world.
In India, PwC (www.pwc.com/India) offers a comprehensive portfolio of Advisory and Tax & Regulatory services; each, in turn, presents abasketoffinelydefineddeliverables.NetworkfirmsofPwCinIndiaalsoprovideservicesinAssuranceaspertherelevantrulesandregulations in India.
Complementing our depth of industry expertise and breadth of skills is our sound knowledge of the local business environment in India. We are committed to working with our clients in India and beyond to deliver the solutions that help them take on the challenges of the ever-changing business environment.
TheIndianfirmhasofficesinAhmedabad,Bangalore,Bhubaneshwar,Chennai,DelhiNCR,Hyderabad,Kolkata,MumbaiandPune.
ContactsAmbarish Dasgupta - Executive Director Email: [email protected]:+91- 9830037200
Sivarama Krishnan - Executive DirectorEmail: [email protected]: +91- 9650788787
Sandeep Ladda - Executive Director Email: [email protected]: +91- 9820263630
Siddharth Vishwanath - Associate DirectorEmail: [email protected]: +91-9873434609

www.pwc.com/india
This report does not constitute professional advice. The information in this report has been obtained or derived from sources believed by PricewaterhouseCoopers Private Limited (PwCPL) to be reliable but PwCPL does not represent that this information is accurate or complete. Any opinions or estimates contained in this report represent the judgment of PwCPL at this time and are subject to change without notice. Readers of this report are advised to seek their own professional advice before taking any course of action or decision, for which they are entirely responsible, based on the contents of this report. PwCPL neither accepts or assumes any responsibility or liability to any reader of this report in respect of the information contained within it or for any decisions readers may take or decide not to or fail to take.
© 2011 PricewaterhouseCoopers Private Limited. All rights reserved. In this document, “PwC” refers to PricewaterhouseCoopers Private Limited (a limited liability company in India), which is a member firm of PricewaterhouseCoopers International Limited (PwCIL), each member firm of which is a separate legal entity.
MS 141 - March 2011 vas .inddDesigned by: PwC Brand & Communications, India
Related Documents