Conjoint and Segmentation Market Intelligence Julie Edell Britton Session 8 September 26, 2009

Conjoint and Segmentation Market Intelligence Julie Edell Britton Session 8 September 26, 2009.
Dec 25, 2015
Welcome message from author
This document is posted to help you gain knowledge. Please leave a comment to let me know what you think about it! Share it to your friends and learn new things together.
Transcript
Conjoint and Segmentation
Market IntelligenceJulie Edell Britton
Session 8September 26, 2009
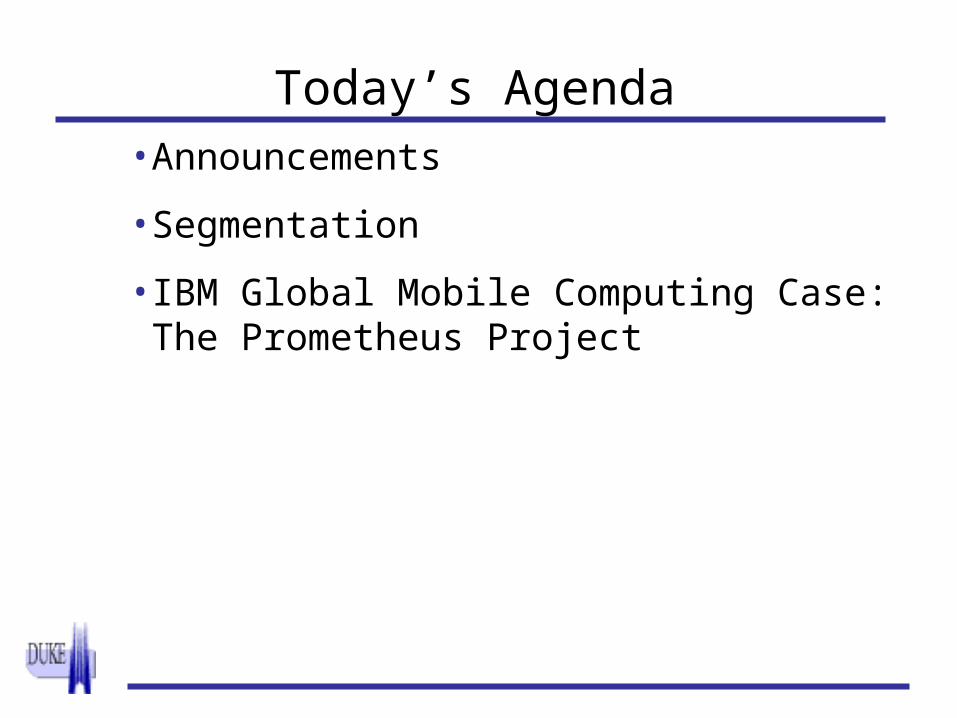
Today’s Agenda•Announcements
•Segmentation
•IBM Global Mobile Computing Case: The Prometheus Project

Announcements
• Submit WEMBA C by 10pm on Thursday, October 8. One solution per team. This is a major case write-up
4
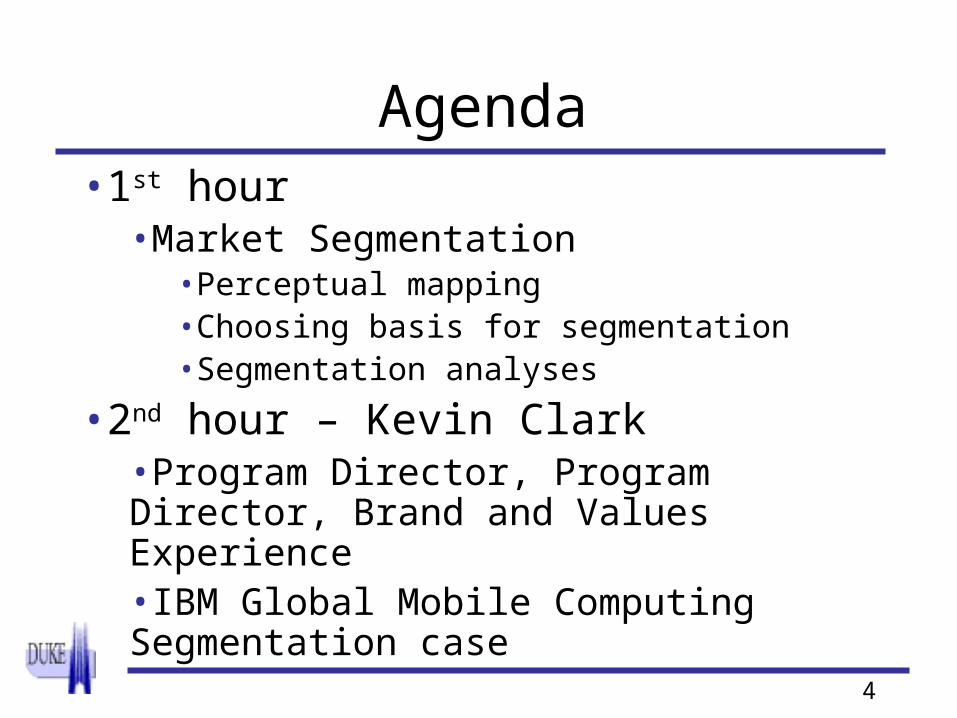
Agenda•1st hour
•Market Segmentation•Perceptual mapping•Choosing basis for segmentation•Segmentation analyses
•2nd hour – Kevin Clark•Program Director, Program Director, Brand and Values Experience•IBM Global Mobile Computing Segmentation case
5
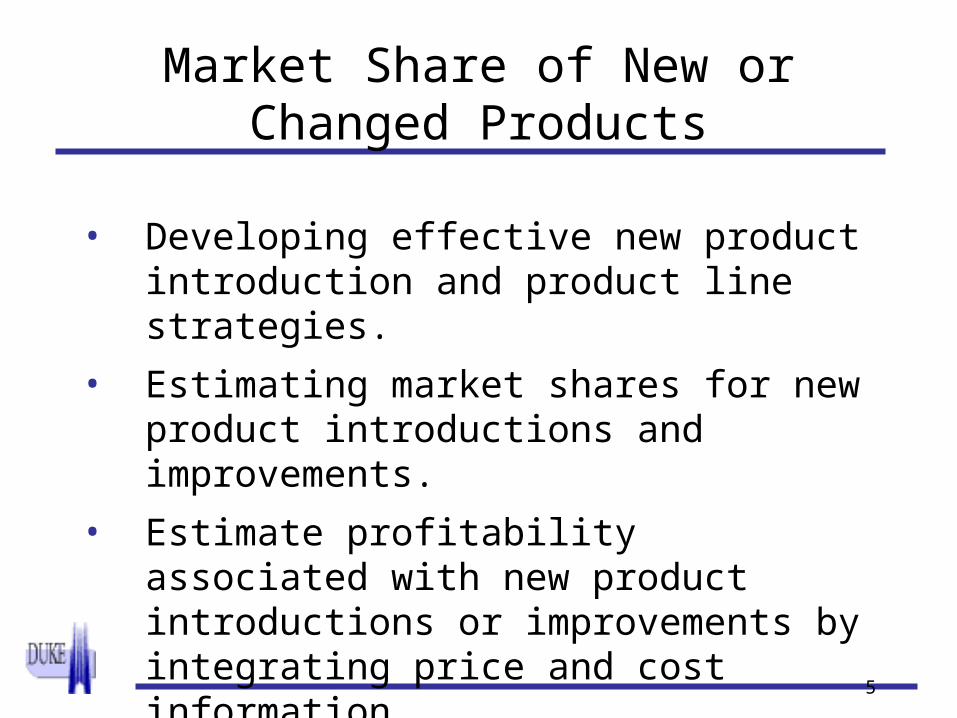
Market Share of New or Changed Products
• Developing effective new product introduction and product line strategies.
• Estimating market shares for new product introductions and improvements.
• Estimate profitability associated with new product introductions or improvements by integrating price and cost information.
6
Selling Plexiglas Aquaria to Builders
John Wolf is a manufacturer of Plexiglas spas sold to building contractors. He discovers that he has the technology to make large Plexiglas fish tanks cheaply. These tanks look very sharp and make it possible to burnish attractive designs on the back wall. He wants to manufacture Plexiglas tanks to sell into the commercial construction market for installation into banks, restaurants, and public places.
77
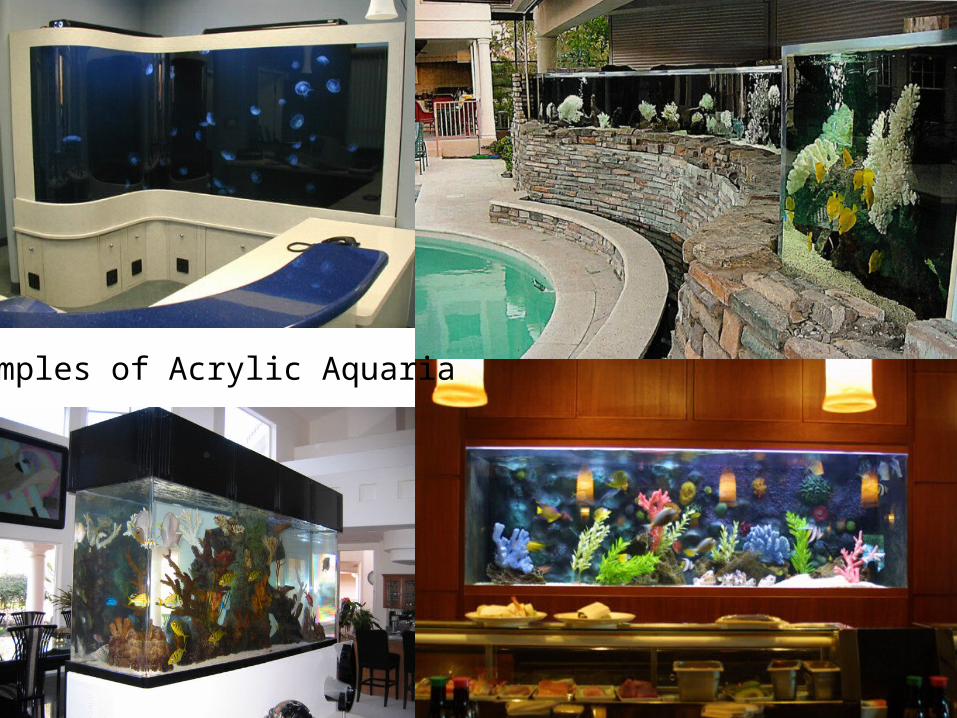
Examples of Acrylic Aquaria

Selling Plexiglas Aquaria to Builders
Plexiglas fish tanks have heretofore garnered a small market share. Mr. Wolf assumes that this is due
to the high price ($30,000) relative to the price of similar sized glass fish tanks ($10,000). Since he can produce Plexiglas fish tanks cheaply enough to make a sizeable profit based upon a price of $10,000, he thinks it can be
a good new product offering.
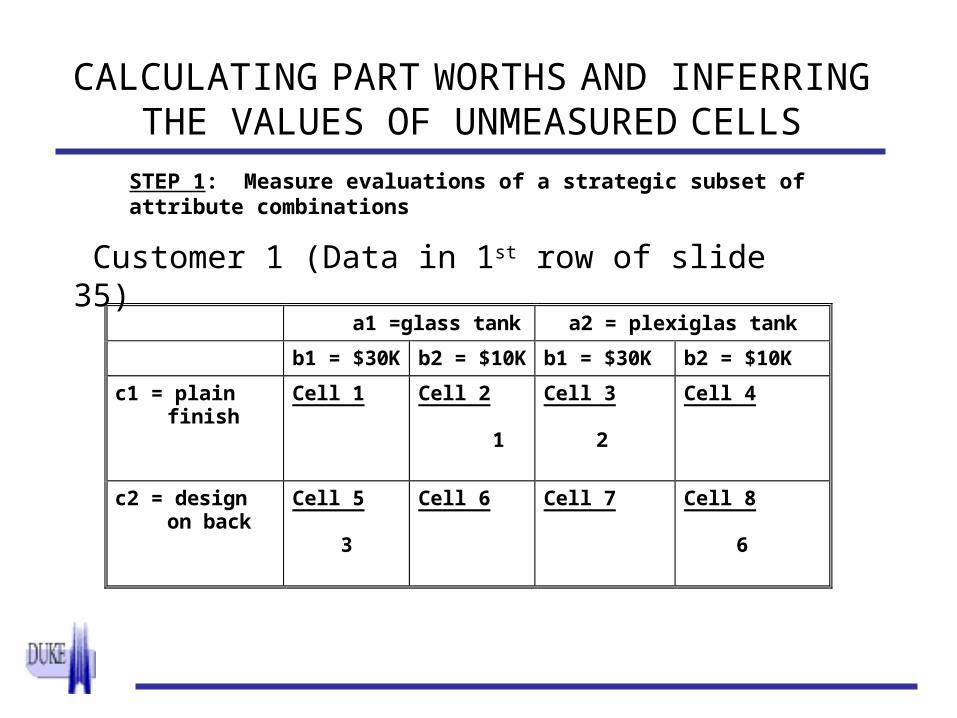
CALCULATING PART WORTHS AND INFERRING THE VALUES OF UNMEASURED CELLS
STEP 1: Measure evaluations of a strategic subset of attribute combinations
a1 =glass tank a2 = plexiglas tank
b1 = $30K b2 = $10K b1 = $30K b2 = $10K
c1 = plain finish
Cell 1
Cell 2 1
Cell 3 2
Cell 4
c2 = design on back
Cell 5 3
Cell 6
Cell 7
Cell 8 6
Customer 1 (Data in 1st row of slide 35)
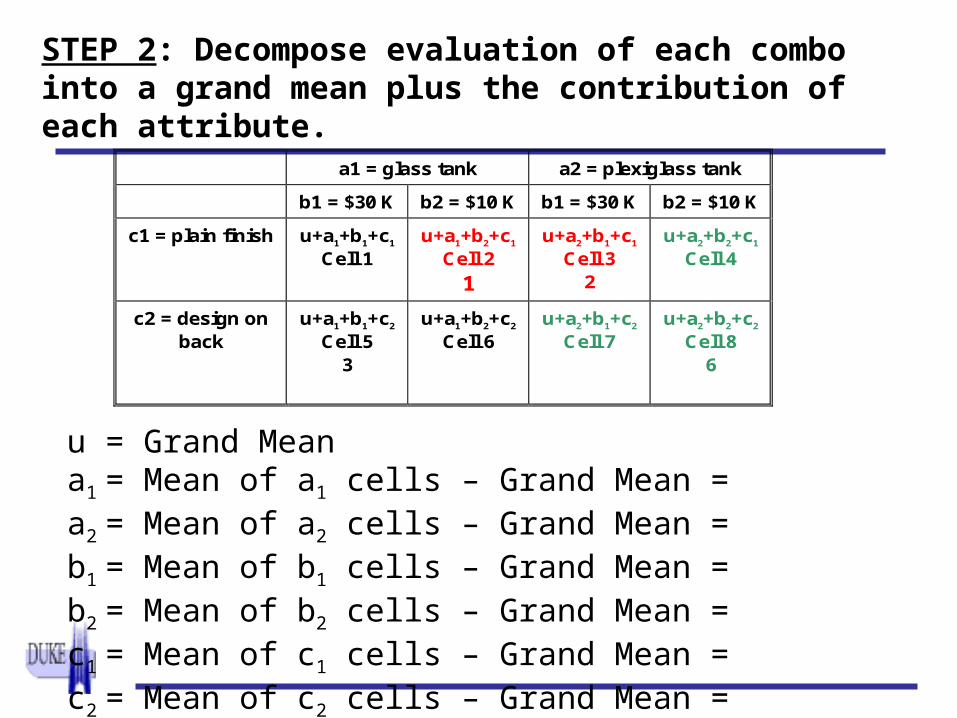
STEP 2: Decompose evaluation of each combo into a grand mean plus the contribution of each attribute.
a1 = glass tank a2 = plexiglass tank
b1 = $30 K b2 = $10 K b1 = $30 K b2 = $10 K
c1 = plain finish
u+a1+b1+c1 Cell 1
u+a1+b2+c1 Cell 2
1
u+a2+b1+c1 Cell 3
2
u+a2+b2+c1 Cell 4
c2 = design on back
u+a1+b1+c2 Cell 5
3
u+a1+b2+c2 Cell 6
u+a2+b1+c2 Cell 7
u+a2+b2+c2 Cell 8
6
u = Grand Mean a1 = Mean of a1 cells – Grand Mean = a2 = Mean of a2 cells – Grand Mean = b1 = Mean of b1 cells – Grand Mean = b2 = Mean of b2 cells – Grand Mean = c1 = Mean of c1 cells – Grand Mean = c2 = Mean of c2 cells – Grand Mean =

a1 = glass tank a2 = plexiglas tank
b1 = $30 K b2 = $10 K b1 = $30 K b2 = $10 K
c1 = plain finish
u+a1+b1+c1
u+a1+b2+c1 Cell 2
C
u+a2+b1+c1 Cell 3
C
u+a2+b2+c1 Cell 4
?
c2 = design on back
u+a1+b1+c2
NOT
u+a1+b2+c2
NOT
u+a2+b1+c2 Cell 7
?
u+a2+b2+c2 Cell 8
?
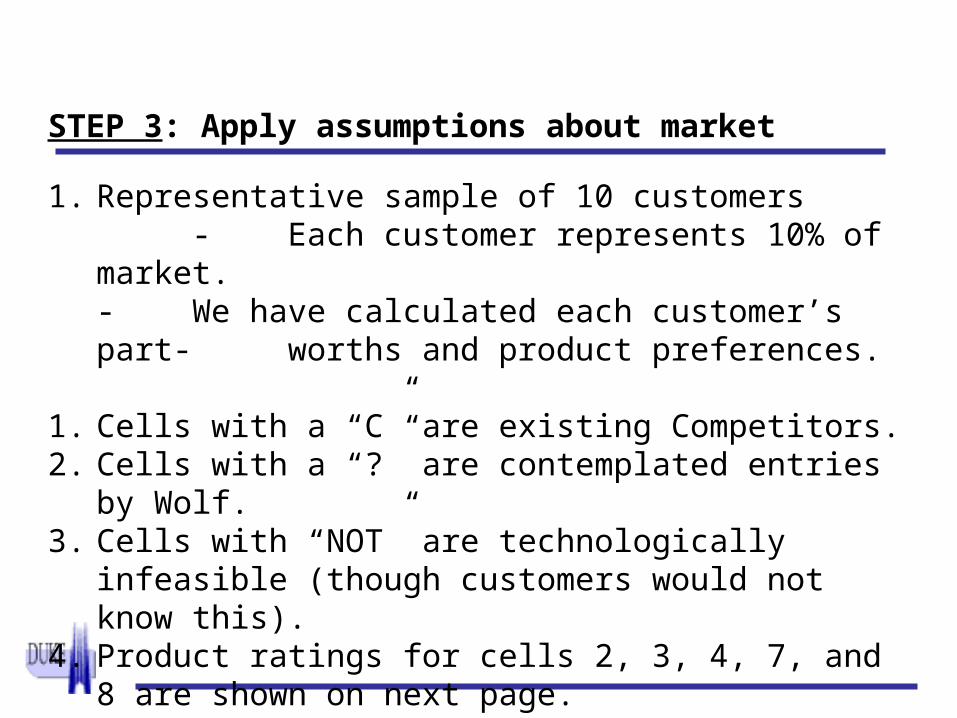
STEP 3: Apply assumptions about market
1. Representative sample of 10 customers - Each customer represents 10% of market.
- We have calculated each customer’s part- worths and product preferences.
1. Cells with a “C” are existing Competitors. 2. Cells with a “?” are contemplated entries by Wolf.3. Cells with “NOT” are technologically infeasible (though
customers would not know this). 4. Product ratings for cells 2, 3, 4, 7, and 8 are shown on
next page.

13
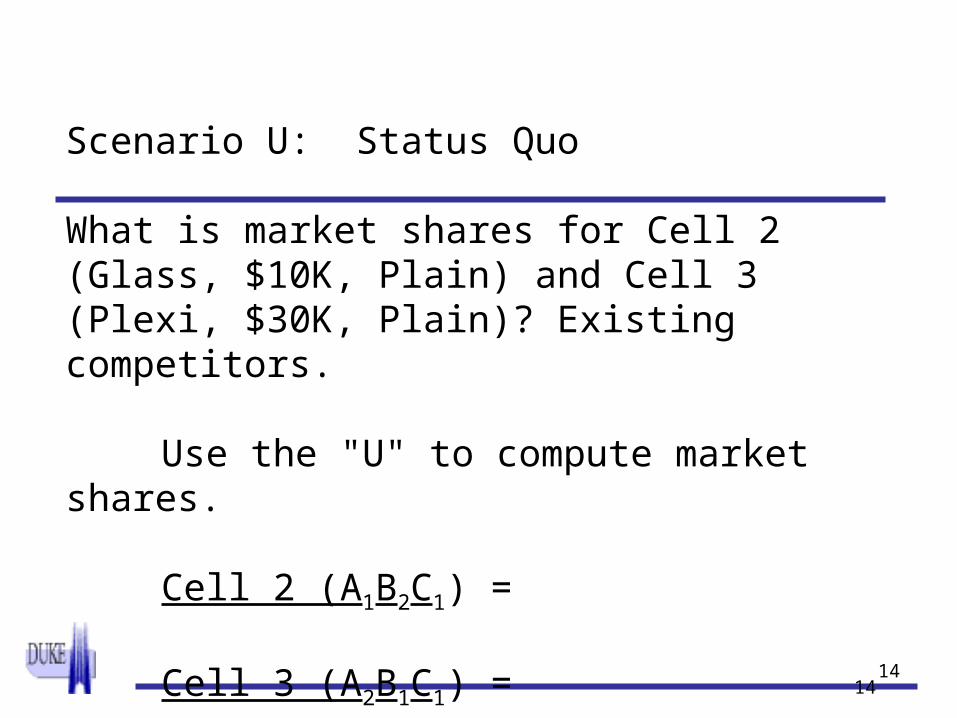
Scenario U: Status Quo
What is market shares for Cell 2 (Glass, $10K, Plain) and Cell 3 (Plexi, $30K, Plain)? Existing competitors.
Use the "U" to compute market shares.
Cell 2 (A1B2C1) =
Cell 3 (A2B1C1) =
1414
Scenario U: Status Quo
What is market shares for Cell 2 (Glass, $10K, Plain) and Cell 3 (Plexi, $30K, Plain)? Existing competitors.
Use the "U" to compute market shares.
Cell 2 (A1B2C1) =
Cell 3 (A2B1C1) =
15
15
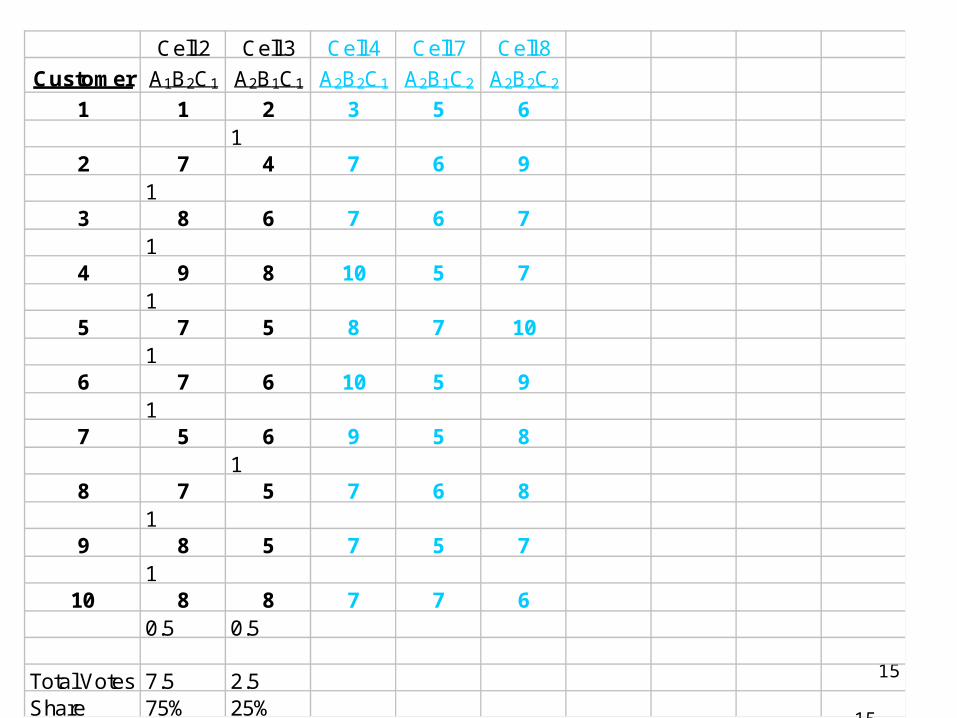
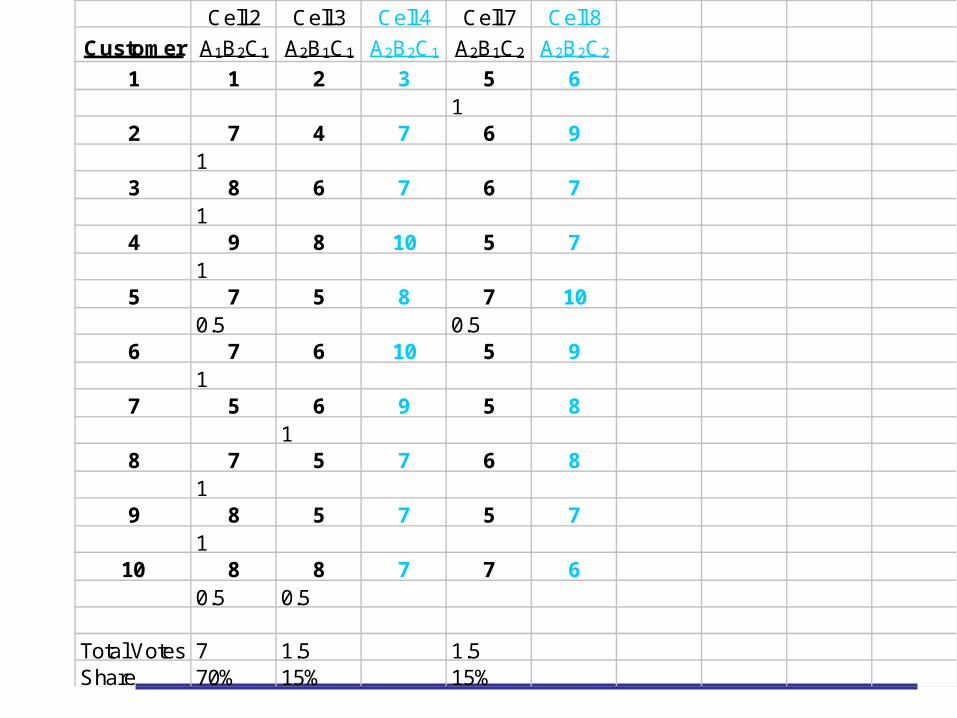
Cell 2 Cell 3 Cell 4 Cell 7 Cell 8
Customer A1B2C1 A2B1C1 A2B2C1 A2B1C2 A2B2C2
1 1 2 3 5 61
2 7 4 7 6 91
3 8 6 7 6 71
4 9 8 10 5 71
5 7 5 8 7 101
6 7 6 10 5 91
7 5 6 9 5 81
8 7 5 7 6 81
9 8 5 7 5 71
10 8 8 7 7 60.5 0.5
Total Votes 7.5 2.5Share 75% 25%
16
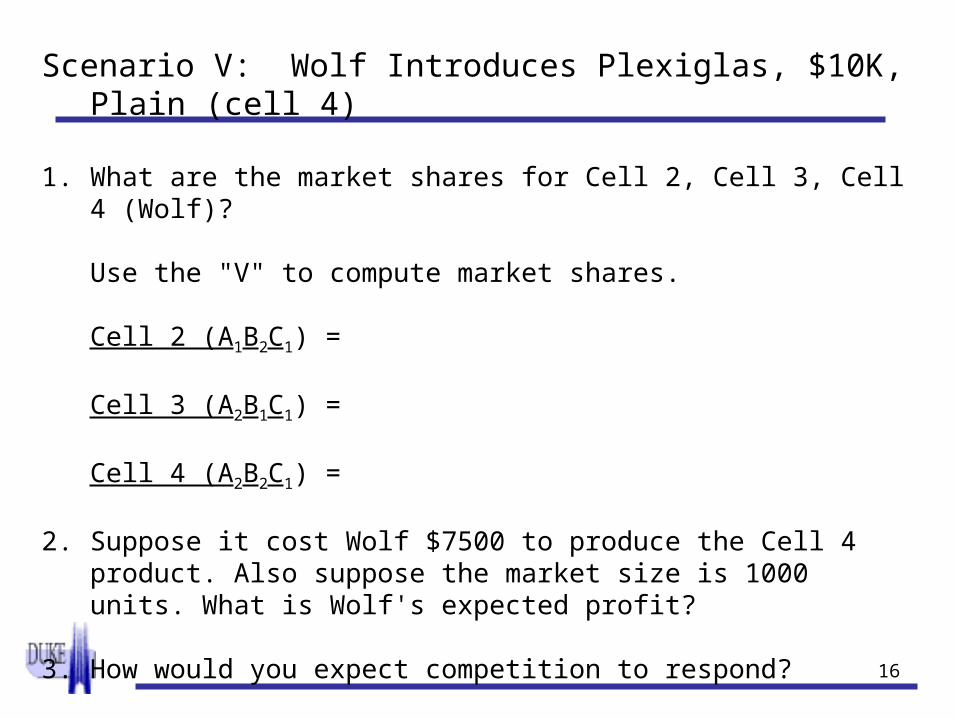
Scenario V: Wolf Introduces Plexiglas, $10K, Plain (cell 4)
1. What are the market shares for Cell 2, Cell 3, Cell 4 (Wolf)?
Use the "V" to compute market shares.
Cell 2 (A1B2C1) =
Cell 3 (A2B1C1) =
Cell 4 (A2B2C1) =
2. Suppose it cost Wolf $7500 to produce the Cell 4 product. Also suppose the market size is 1000 units. What is Wolf's expected profit?
3. How would you expect competition to respond?
4. How might Wolf respond to their response?
17
Cell 2 Cell 3 Cell 4 Cell 7 Cell 8
Customer A1B2C1 A2B1C1 A2B2C1 A2B1C2 A2B2C2
1 1 2 3 5 61
2 7 4 7 6 90.5 0.5
3 8 6 7 6 71
4 9 8 10 5 71
5 7 5 8 7 101
6 7 6 10 5 91
7 5 6 9 5 81
8 7 5 7 6 80.5 0.5
9 8 5 7 5 71
10 8 8 7 7 60.5 0.5
Total Votes 3.5 0.5 6Share 35% 5% 60%

Cell ID # 2 3 4 7 8
Marginal Cost $7,500 $8,000 $8,000
CompetitorCompetitor Wolf Wolf WolfGlass Plexi Plexi Plexi Plexi
$10,000 $30,000 $10,000 $30,000 $10,000 WolfScenario Plain Plain Plain Design Design Profit
U 75% 25%V 35% 5% 60% $1,500,000U-V 40% 20%
Scenario V: Wolf Introduces Plexi, $10K, Plain
19
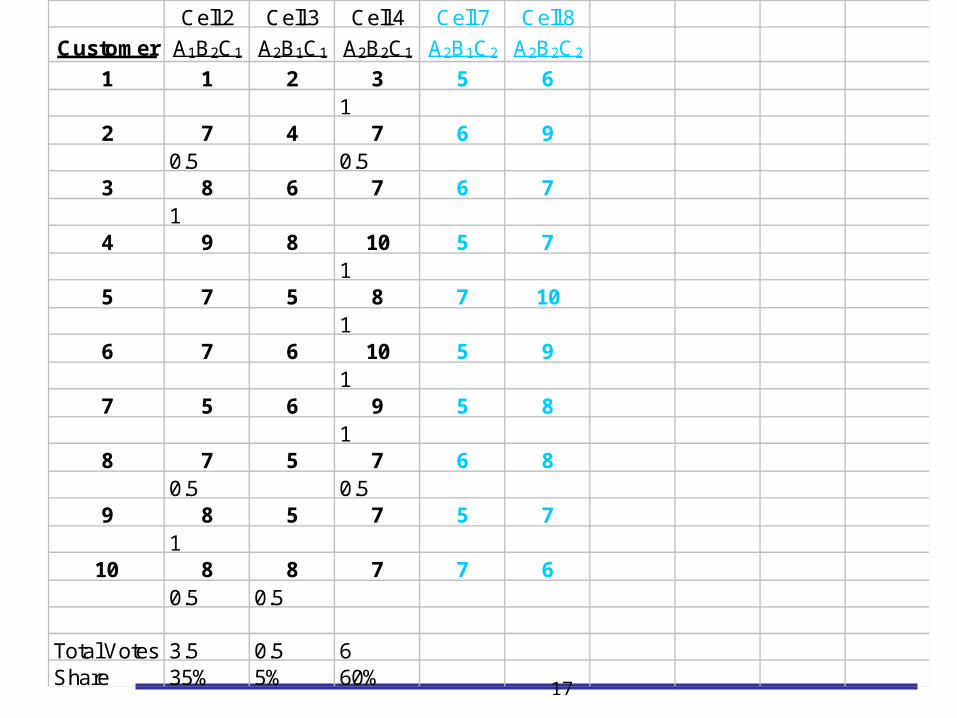
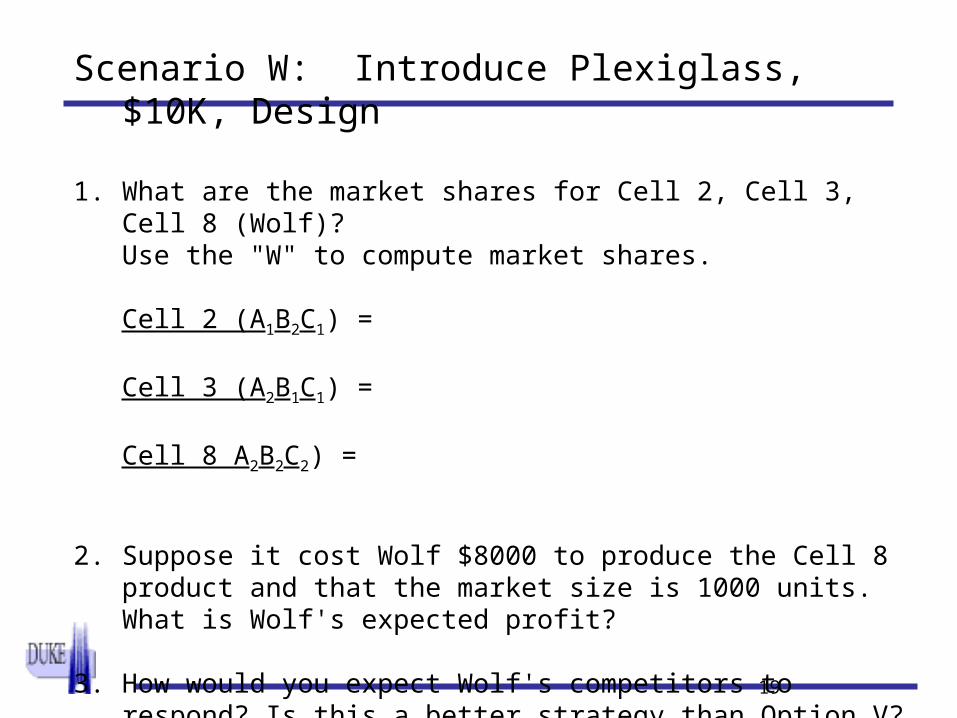
Scenario W: Introduce Plexiglass, $10K, Design
1. What are the market shares for Cell 2, Cell 3, Cell 8 (Wolf)?Use the "W" to compute market shares.
Cell 2 (A1B2C1) =
Cell 3 (A2B1C1) =
Cell 8 A2B2C2) =
2. Suppose it cost Wolf $8000 to produce the Cell 8 product and that the market size is 1000 units. What is Wolf's expected profit?
3. How would you expect Wolf's competitors to respond? Is this a better strategy than Option V? Is there a more profitable Option? What should Wolf be charging for their etched tank?
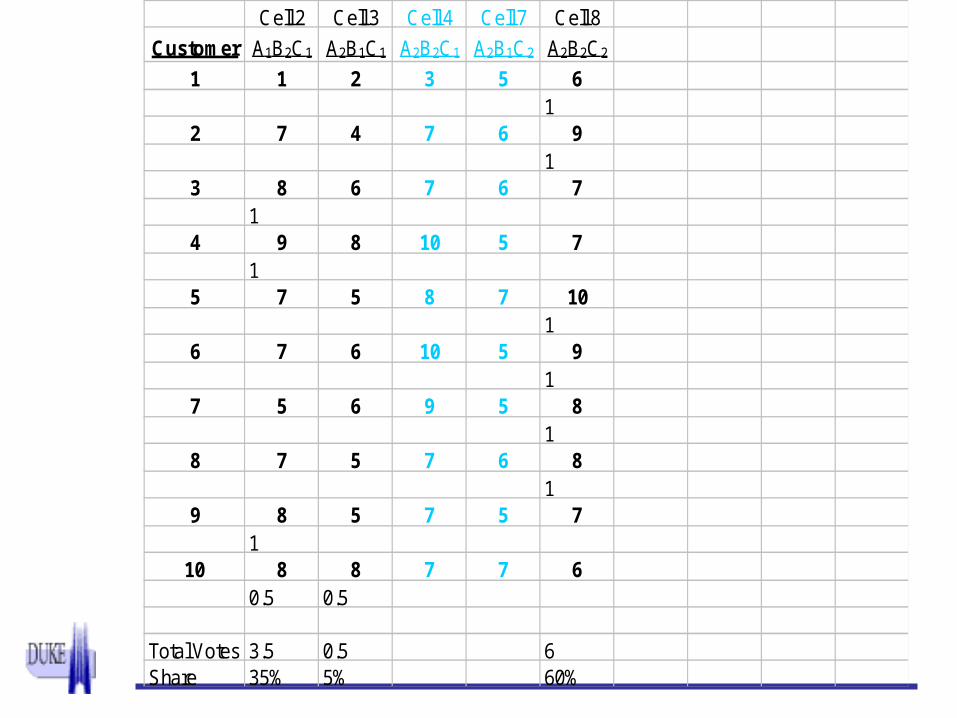
Cell 2 Cell 3 Cell 4 Cell 7 Cell 8
Customer A1B2C1 A2B1C1 A2B2C1 A2B1C2 A2B2C2
1 1 2 3 5 61
2 7 4 7 6 91
3 8 6 7 6 71
4 9 8 10 5 71
5 7 5 8 7 101
6 7 6 10 5 91
7 5 6 9 5 81
8 7 5 7 6 81
9 8 5 7 5 71
10 8 8 7 7 60.5 0.5
Total Votes 3.5 0.5 6Share 35% 5% 60%
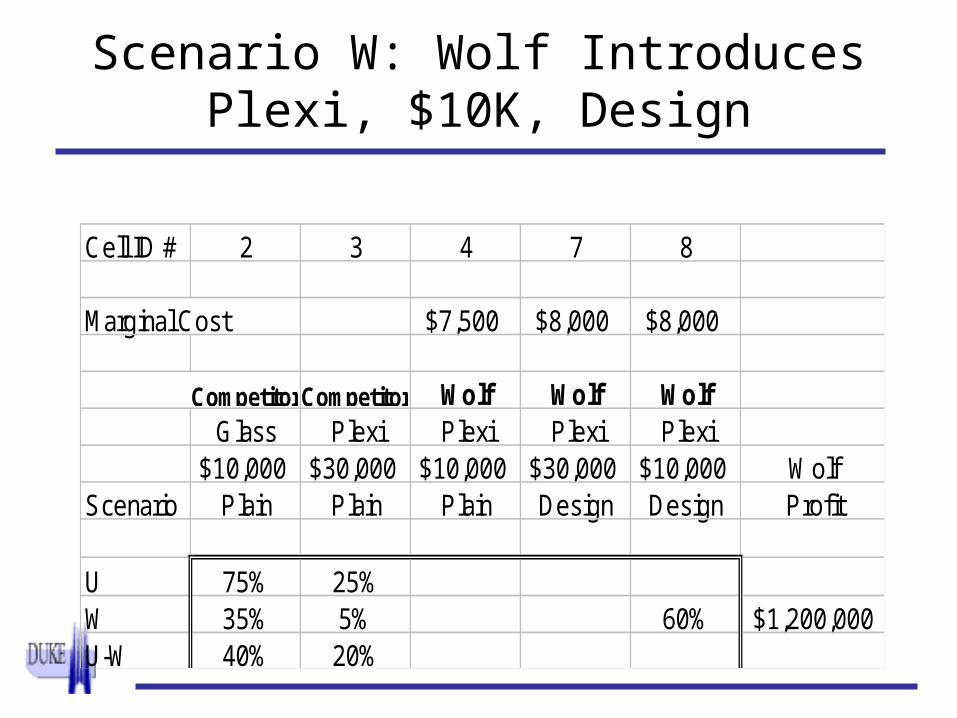
Scenario W: Wolf Introduces Plexi, $10K, Design
Cell ID # 2 3 4 7 8
Marginal Cost $7,500 $8,000 $8,000
CompetitorCompetitor Wolf Wolf WolfGlass Plexi Plexi Plexi Plexi
$10,000 $30,000 $10,000 $30,000 $10,000 WolfScenario Plain Plain Plain Design Design Profit
U 75% 25%W 35% 5% 60% $1,200,000U-W 40% 20%

22
Scenario X: Introduce Plexiglas, $30K, Design
1. What are the market shares for Cell 2, Cell 3, Cell 7 (Wolf)?Use the "X" to compute market shares.
Cell 2 (A1B2C1)=
Cell 3 (A2B1C1) =
Cell 7 (A2B2C2) =
2. Suppose it cost Wolf $8000 to produce the Cell 7. Also suppose the market size is 1000 units. What is Wolf's expected profit?
3. Is this strategy better than Scenario V and W?
4. Can you draw a demand curve for etched plexiglass tanks?
5. Is this the best scenario?
Cell 2 Cell 3 Cell 4 Cell 7 Cell 8
Customer A1B2C1 A2B1C1 A2B2C1 A2B1C2 A2B2C2
1 1 2 3 5 61
2 7 4 7 6 91
3 8 6 7 6 71
4 9 8 10 5 71
5 7 5 8 7 100.5 0.5
6 7 6 10 5 91
7 5 6 9 5 81
8 7 5 7 6 81
9 8 5 7 5 71
10 8 8 7 7 60.5 0.5
Total Votes 7 1.5 1.5Share 70% 15% 15%
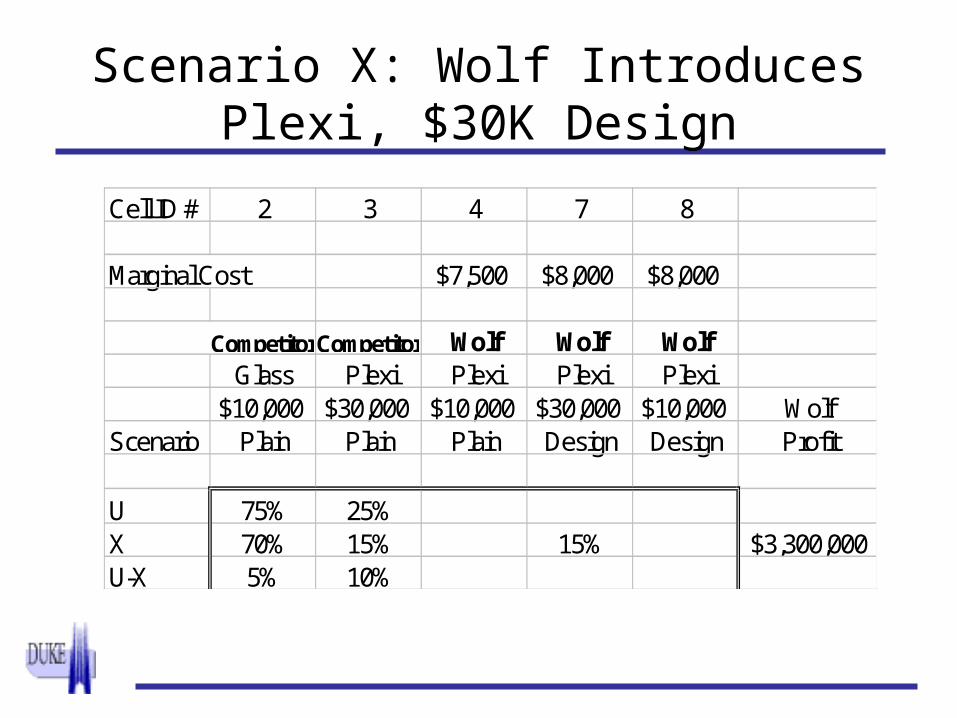
Scenario X: Wolf Introduces Plexi, $30K Design
Cell ID # 2 3 4 7 8
Marginal Cost $7,500 $8,000 $8,000
CompetitorCompetitor Wolf Wolf WolfGlass Plexi Plexi Plexi Plexi
$10,000 $30,000 $10,000 $30,000 $10,000 WolfScenario Plain Plain Plain Design Design Profit
U 75% 25%X 70% 15% 15% $3,300,000U-X 5% 10%
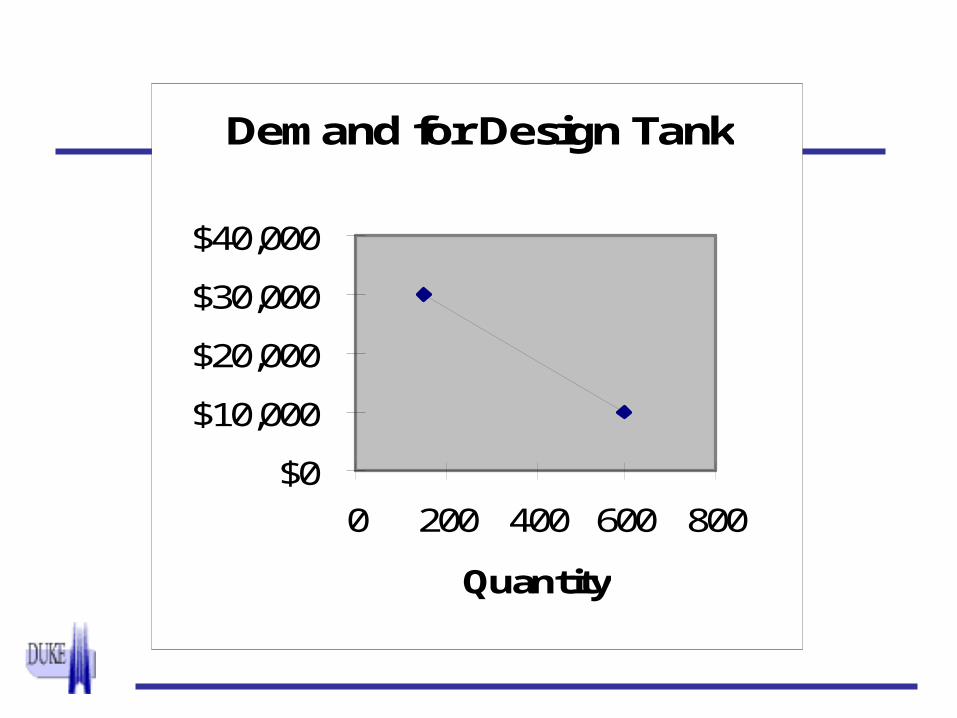
Demand for Design Tank
$0
$10,000
$20,000
$30,000
$40,000
0 200 400 600 800
Quantity
Conjoint Summary
•Experimental, so test threats to forecast validity
•Conjoint is useful for •new & existing products•pricing •profit maximization when costs are incorporated•Product line decisions•Competition and cannibalization
•For really new products, requires modification because people don’t have set tradeoffs
27
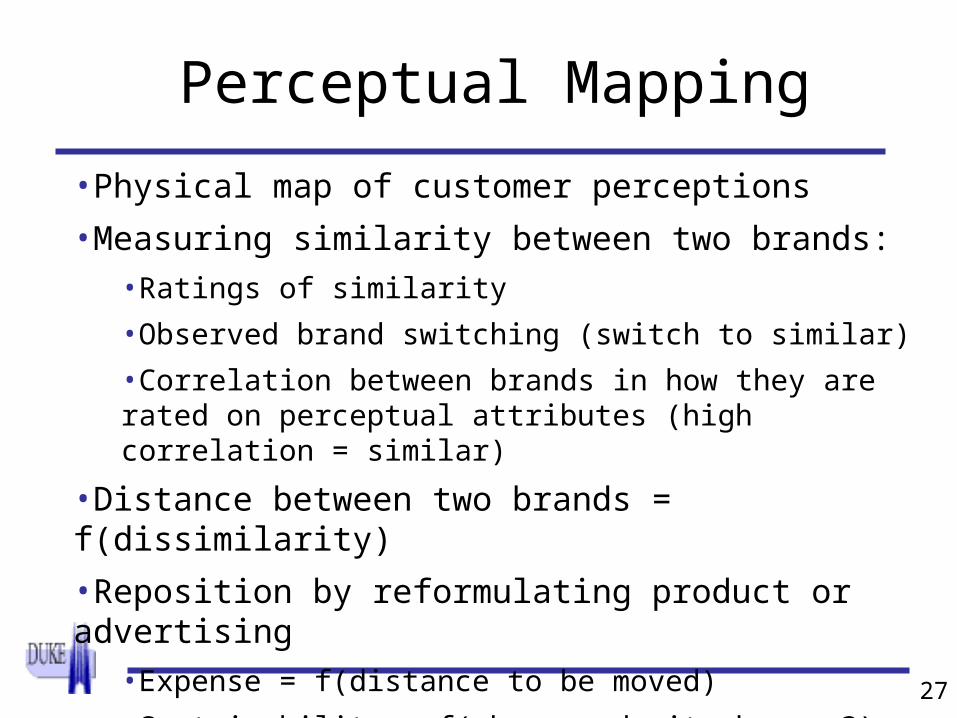
Perceptual Mapping
•Physical map of customer perceptions
•Measuring similarity between two brands:
•Ratings of similarity
•Observed brand switching (switch to similar)
•Correlation between brands in how they are rated on perceptual attributes (high correlation = similar)
•Distance between two brands = f(dissimilarity)
•Reposition by reformulating product or advertising
•Expense = f(distance to be moved)
•Sustainability = f(who can do it cheaper?)
28
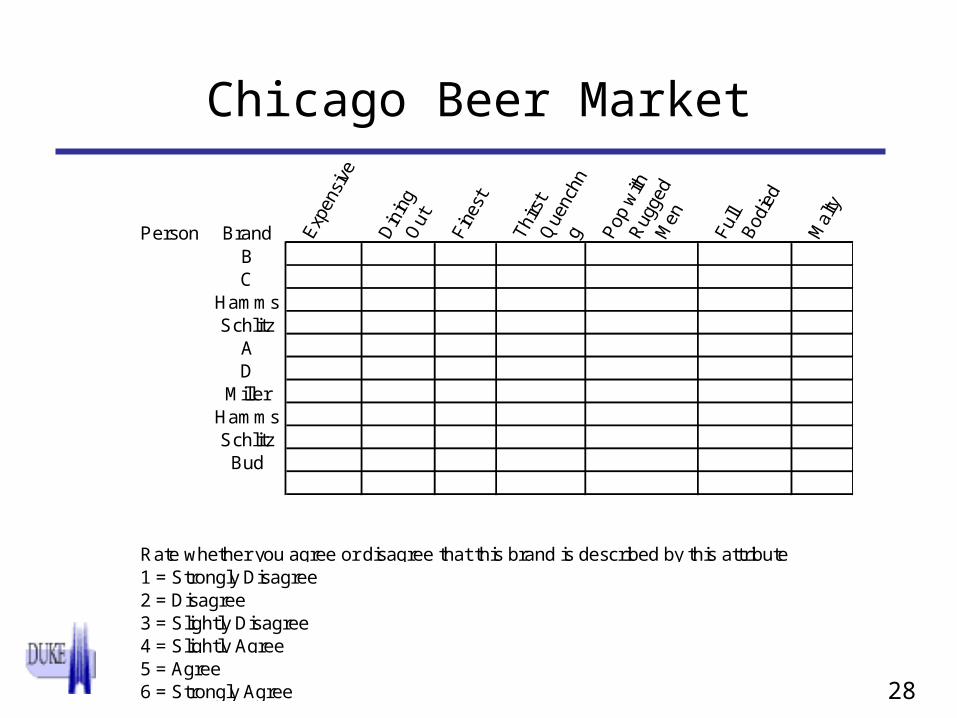
Chicago Beer Market
Person BrandB
C Hamms Schlitz A D Miller Hamms Schlitz Bud
Rate whether you agree or disagree that this brand is described by this attribute1 = Strongly Disagree2 = Disagree3 = Slightly Disagree4 = Slightly Agree5 = Agree6 = Strongly Agree
29
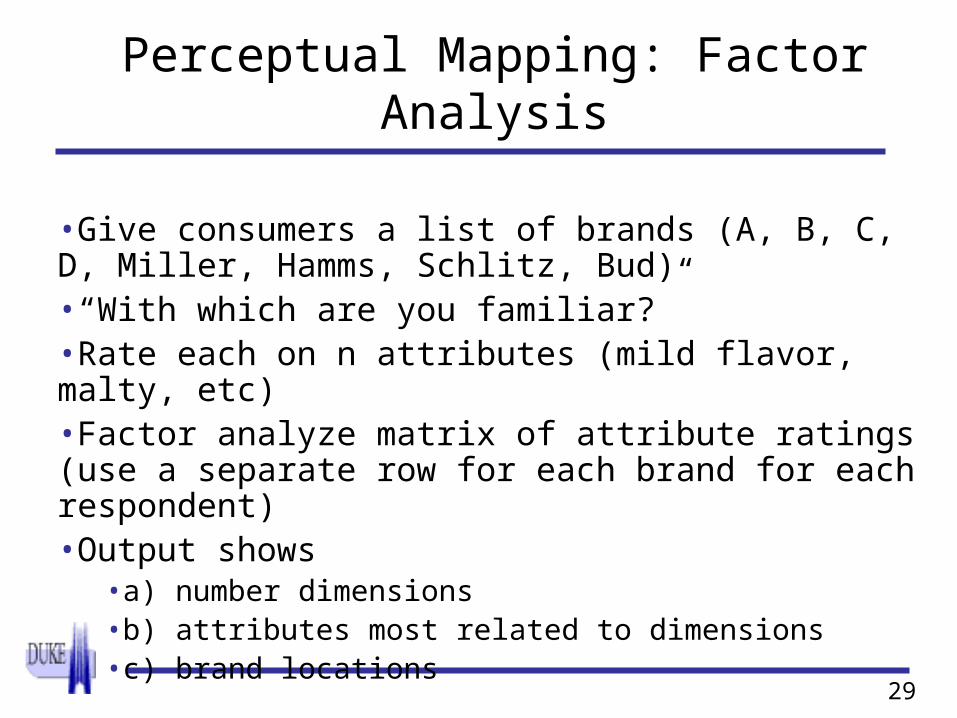
Perceptual Mapping: Factor Analysis
•Give consumers a list of brands (A, B, C, D, Miller, Hamms, Schlitz, Bud)•“With which are you familiar?”•Rate each on n attributes (mild flavor, malty, etc)•Factor analyze matrix of attribute ratings (use a separate row for each brand for each respondent)•Output shows
•a) number dimensions•b) attributes most related to dimensions•c) brand locations

30
31
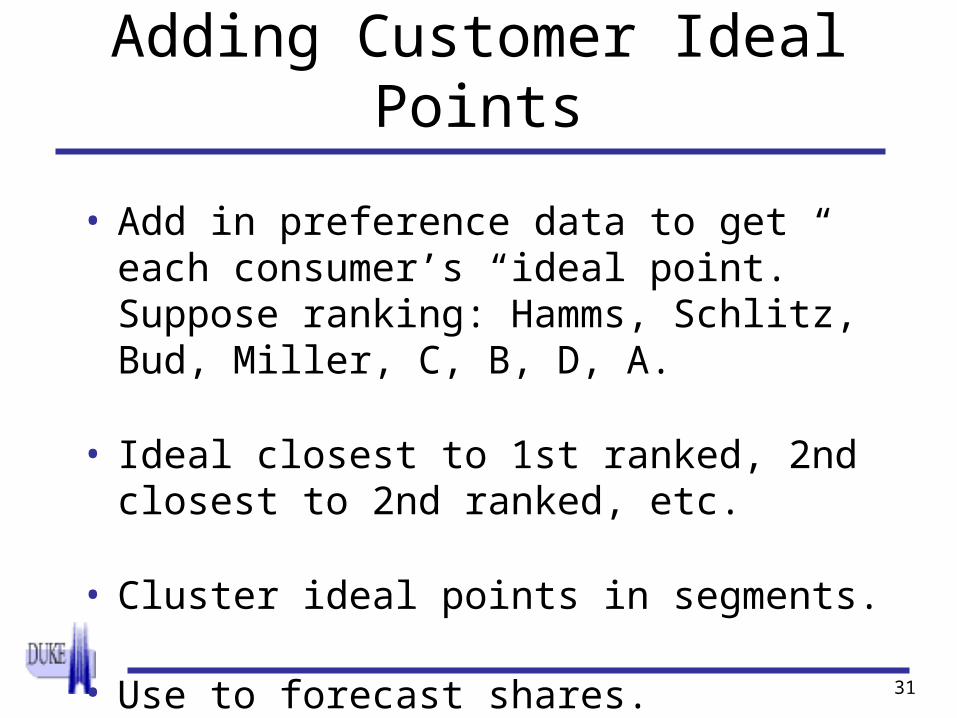
Adding Customer Ideal Points
• Add in preference data to get each consumer’s “ideal point.” Suppose ranking: Hamms, Schlitz, Bud, Miller, C, B, D, A.
• Ideal closest to 1st ranked, 2nd closest to 2nd ranked, etc.
• Cluster ideal points in segments.
• Use to forecast shares.

32

33
Perceptual Map Summary
•Uses for Perceptual Maps:
•Identify your closest competitors
•Suggest repositioning strategies
•Suggest advertising themes supporting repositioning
•Identify brands that should be harvested
•Identify new product opportunities where some segment not well served by current brands
34
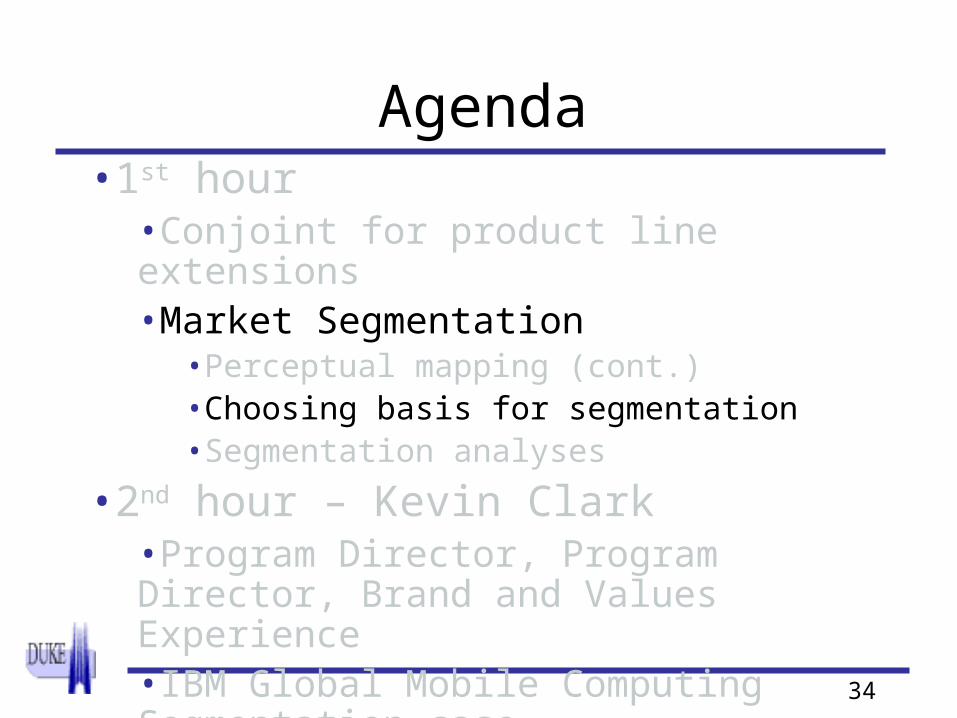
Agenda•1st hour
•Conjoint for product line extensions•Market Segmentation
•Perceptual mapping (cont.)•Choosing basis for segmentation•Segmentation analyses
•2nd hour – Kevin Clark•Program Director, Program Director, Brand and Values Experience•IBM Global Mobile Computing Segmentation case
35
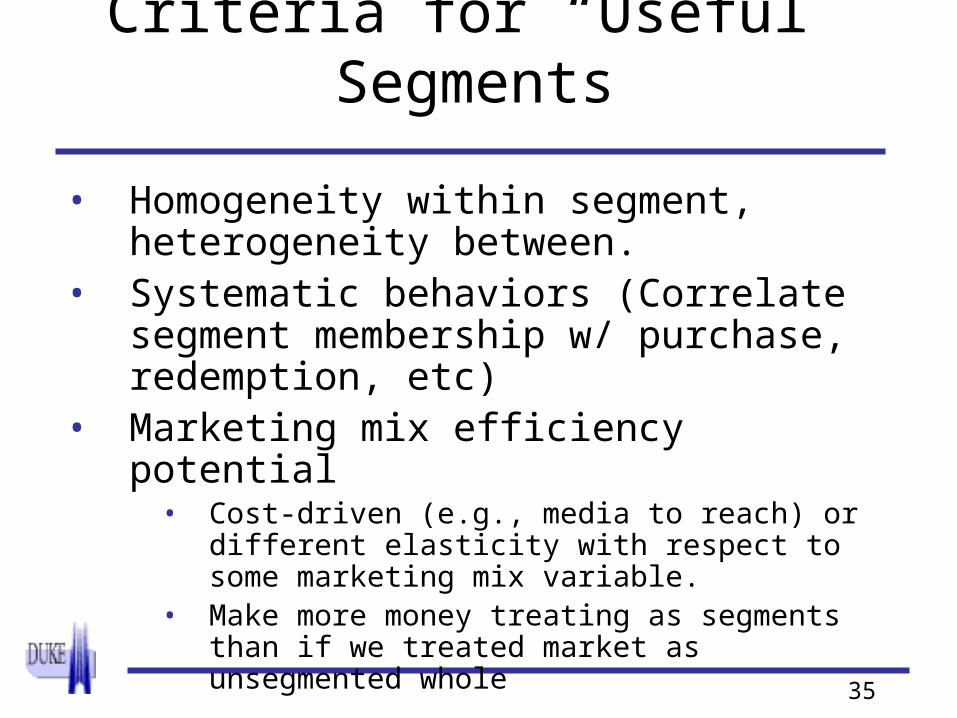
Criteria for “Useful” Segments
• Homogeneity within segment, heterogeneity between.
• Systematic behaviors (Correlate segment membership w/ purchase, redemption, etc)
• Marketing mix efficiency potential• Cost-driven (e.g., media to reach) or different
elasticity with respect to some marketing mix variable.
• Make more money treating as segments than if we treated market as unsegmented whole

36
Strategic v. Tactical
•Strategic segmentation -- what product markets to serve? ESPN The Magazine, IBM which segments to deselect / select?
•Tactical Segmentation -- should groups be treated same or differently wrt specific marketing decision variable?
•Dog Food: Size of Dog as Segmentation•Hi Price, Meat & Cereal v. Lo Price, All Cereal•Ad Theme: Love of Master v. Dog’s Active Life
37
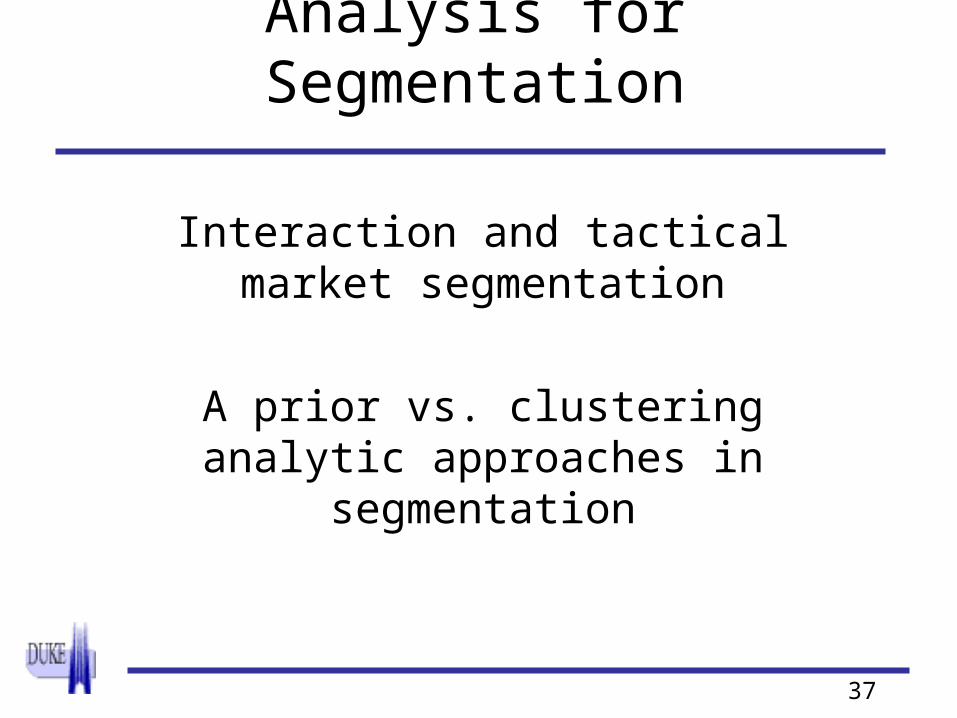
Analysis for Segmentation
Interaction and tactical market segmentation
A prior vs. clustering analytic approaches in segmentation

38
Owners ofHi Price, Meat
& CerealLo Price, All
CerealRow
AverageSmall Dogs 9 4 6.5Large Dogs 4 8 6Column Average 6.5 6
Owners ofLove Between Master & Dog
Dog's Active Life
Row Average
Small Dogs 9 6 7.5Large Dogs 7 4 5.5Column Average 8 5
39
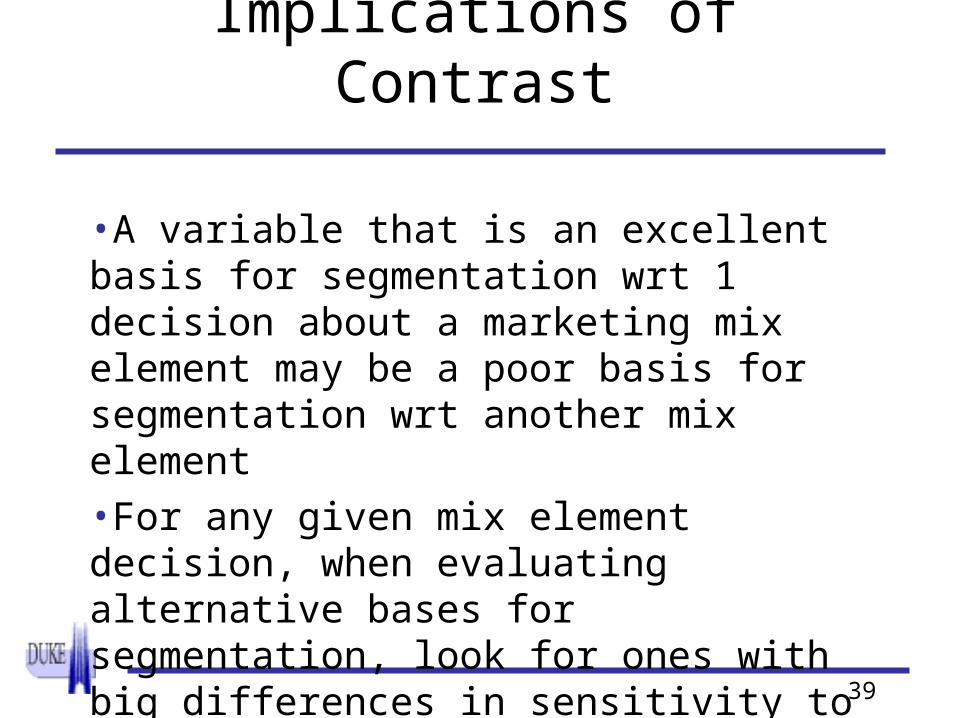
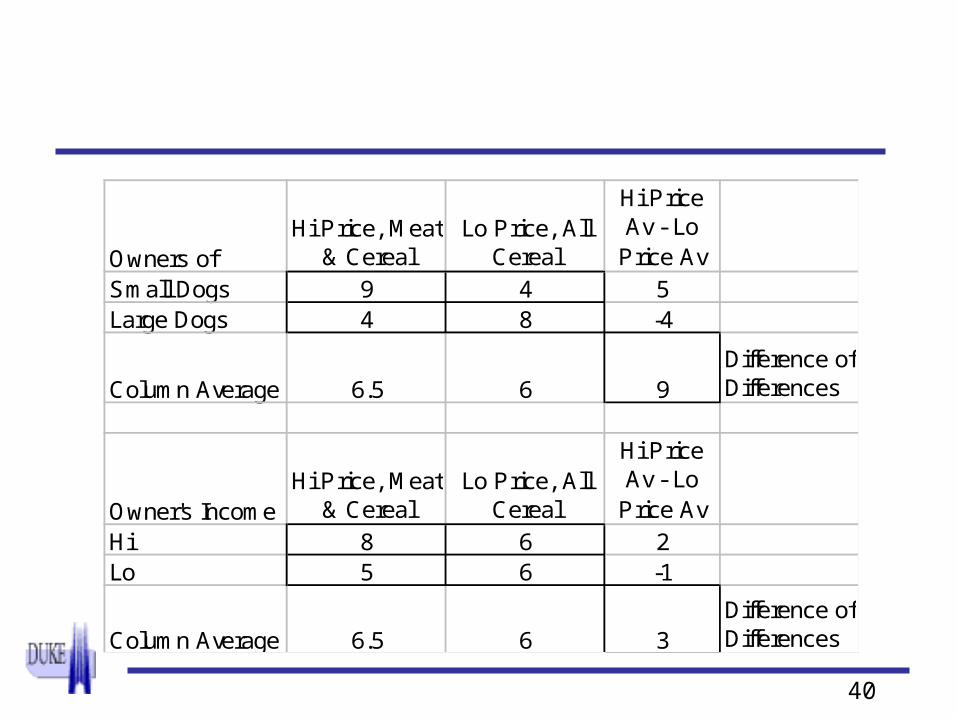
Implications of Contrast
•A variable that is an excellent basis for segmentation wrt 1 decision about a marketing mix element may be a poor basis for segmentation wrt another mix element•For any given mix element decision, when evaluating alternative bases for segmentation, look for ones with big differences in sensitivity to mix variable.
40
Owners ofHi Price, Meat
& CerealLo Price, All
Cereal
Hi Price Av - Lo
Price AvSmall Dogs 9 4 5Large Dogs 4 8 -4
Column Average 6.5 6 9Difference of Differences
Owner's IncomeHi Price, Meat
& CerealLo Price, All
Cereal
Hi Price Av - Lo
Price AvHi 8 6 2Lo 5 6 -1
Column Average 6.5 6 3Difference of Differences

41
Analysis: A Priori vs. Clustering Approaches
•A priori -- Segments chosen by the analyst before collecting data
•Gender (M,F), Age (20-39; 40-59;60+), Heavy v. medium v. light user
•Clustering-based approaches (a posteriori)•Ask battery of questions (lifestyle, benefits sought, etc). •Find natural clusters/ segments. Approach taken in IBM case.•Don’t know going in how many segments•Describe segments by their mean answers to battery of usage situation questions
42
Summing Up
•Choosing a basis for segmentation•3 Criteria for useful segments•Strategic vs. Tactical Segmentation
•Analysis for segmentation•Interaction and Tactical Segmentation…A segmentation base that is useful for one tactical decision may be useless for another•A priori vs. clustering (a posteriori) approaches to segmentation
Related Documents


