Conformational Transitions of the Ras Protein Involved in Macromolecular Interactions and Modulated by Small Compounds. A Biophysical Approach Using NMR and X-Ray Crystallography at Ambient and High Pressures DISSERTATION ZUR ERLANGUNG DES DOKTORGRADES DER NATURWISSENSCHAFTEN (DR. RER. NAT.) DER FAKULTÄT FÜR BIOLOGIE UND VORKLINISCHE MEDIZIN DER UNIVERSITÄT REGENSBURG Vorgelegt von Pedro Lopes aus Marinhas, Esposende. Portugal 2018

Welcome message from author
This document is posted to help you gain knowledge. Please leave a comment to let me know what you think about it! Share it to your friends and learn new things together.
Transcript

Conformational Transitions of the Ras Protein Involved in Macromolecular Interactions and
Modulated by Small Compounds. A Biophysical Approach Using NMR and X-Ray Crystallography
at Ambient and High Pressures
DISSERTATION ZUR ERLANGUNG DES DOKTORGRADES DER
NATURWISSENSCHAFTEN (DR. RER. NAT.) DER FAKULTÄT FÜR
BIOLOGIE UND VORKLINISCHE MEDIZIN DER UNIVERSITÄT
REGENSBURG
Vorgelegt von Pedro Lopes
aus Marinhas, Esposende. Portugal
2018

Das Promotionsgesuch wurde eingereicht am:
Die Arbeit wurde angeleitet von:
Prof Dr. Dr. Hans Robert Kalbitzer
Unterschrift

- This page was deliberately left blank -

i
Table of Contents
Acknowledgments ............................................................................................................ ix
Summary ........................................................................................................................... xi
Zusammenfassung ......................................................................................................... xiii
1. Introduction
1.1 Ras as a Molecular Switch ....................................................................................... 3
1.1.1 Structural and Biochemical Considerations .................................................... 4
1.1.2 Interaction with GEF’s: the ‘Switch On’ Reaction ............................................ 9
1.1.3 Interaction with Effectors ............................................................................... 11
1.1.4 Interaction with GAP’s: the ‘Switch Off’ Reaction .......................................... 14
1.1.5 Differential Dynamics of the Switch Mechanism ........................................... 16
1.1.6 Consequences of Ras Mutations .................................................................. 17
1.1.7 Partial Loss-of-Function Mutants .................................................................. 18
1.1.8 Probing the Bound Nucleotide: 31P NMR spectroscopy ................................ 18
1.2 Drugging an Undruggable Protein ......................................................................... 20
1.2.1 General Strategies ........................................................................................ 20
1.2.2 Recent Breakthroughs .................................................................................. 22
1.2.3 Allosteric Inhibition: the Case of Zn2+-Cyclen ................................................ 22
1.3 HP Technologies in The Study of Protein Conformation and Dynamics ........... 23
1.3.1 31P HP NMR to Study the Nucleotide-bound Ras Proteins ........................... 25
1.3.2 Rare Interaction States Detected by [1H-15N]-HSQC HP NMR ..................... 26
1.3.3 High Pressure Macromolecular Crystallography (HPMX) ............................. 27
1.4 Research Goals of This Thesis .............................................................................. 29

ii
2. Methods
2.1 Material ..................................................................................................................... 33
2.1.1 Plasmids ........................................................................................................ 33
2.1.2 Oligonucleotides ............................................................................................ 33
2.1.3 Bacterial Strains used for DNA Cloning and Amplification ............................ 34
2.1.4 Bacterial Strains used for Protein Expression ............................................... 34
2.1.5 Media and Antibiotics .................................................................................... 35
2.1.5.1 Lysogeny Broth (LB) ......................................................................... 35
2.1.5.2 Terrific Broth (TB) ............................................................................. 35
2.1.5.3 New Minimal Medium (NMM) ............................................................ 36
2.1.6 Chemicals ..................................................................................................... 37
2.1.7 Expendable Materials and Common Software .............................................. 38
2.1.8 Main Instrumentation ..................................................................................... 39
2.1.9 Software ........................................................................................................ 40
2.2 Methods .................................................................................................................... 40
2.2.1 Molecular Biology ................................................................................................ 40
2.2.1.1 Preparation of Chemically Competent Cells .............................................. 40
2.2.1.2 Bacterial Transformation by Heat-Shock ................................................... 42
2.2.1.3 Plasmid Isolation and DNA sequencing ..................................................... 43
2.2.1.4 Expression of Unlabelled Ras .................................................................... 43
2.2.1.5 Expression of 15N Labelled Ras ................................................................. 45
2.2.1.6 Expression of the Effector Protein Raf-RBD .............................................. 46
2.2.1.7 Expression of the GAP Protein NF1 ........................................................... 47
2.2.1.8 Expression of the GEF Protein SOScat(W729E) .............................................. 47
2.2.1.9 Polymerase Chain Reaction (PCR) ............................................................ 47
2.2.1.10 Agarose Gel Electrophoresis ................................................................... 48
2.2.1.11 Site-Directed Mutagenesis (SDM) ............................................................ 49
2.2.2 Protein Biochemistry ........................................................................................... 50
2.2.2.1 Purification of Ras Proteins ........................................................................ 50
2.2.2.1.1 Cell Lysis ........................................................................................ 50
2.2.2.1.2 Protein Precipitation with (NH4)2SO4 .............................................. 52
2.2.2.1.3 Ion Exchange Chromatography (IEX) ............................................ 53

iii
2.2.2.1.4 Size Exclusion Chromatography (SEC) ......................................... 57
2.2.2.2 Purification of Raf-RBD and NF1 ............................................................... 59
2.2.2.2.1 Cell Lysis ........................................................................................ 59
2.2.2.2.2 Affinity Chromatography: GST-Fusion ........................................... 59
2.2.2.3 Purification of SOScat(W729E) ......................................................................... 61
2.2.2.3.1 Cell Lysis ........................................................................................ 61
2.2.2.3.2 Affinity Chromatography: Histidine-Tag Methodology .................... 61
2.2.2.4 Nucleotide Exchange Reactions ................................................................ 62
2.2.2.4.1 GDP Against GppNHp ................................................................... 62
2.2.2.4.2 GDP Against GTP .......................................................................... 64
2.2.2.5 Polyacrylamide Gel Electrophoresis (SDS-PAGE) .................................... 64
2.2.2.6 Determination of Protein Concentration ..................................................... 66
2.2.2.6.1 The Bradford Method ..................................................................... 66
2.2.2.6.2 UV-Absorption at 280 nm using Nanodrop™ ................................. 67
2.2.2.6.3 Analytical High Performance Liquid Chromatography (HPLC) ...... 67
2.2.3 Nano Differential Scanning Fluorimetry (nanoDSF) .......................................... 68
2.2.4 Isothermal Calorimetry (ITC) ............................................................................... 69
2.2.5 NMR Spectroscopy .............................................................................................. 73
2.2.5.1 Sample Preparation. General Considerations ............................................ 73
2.2.5.2 Ambient Pressure and HP 31P NMR Data Acquisition ............................... 73
2.2.5.3 [1H-15N]-HSQC NMR Acquisition, Processing and Evaluation ................... 74
2.2.5.4 31P (HP) NMR Processing and Evaluation ................................................. 75
2.2.6 High Pressure Macromolecular Crystallography .............................................. 78
2.2.6.1 Protein Crystallization ................................................................................ 78
2.2.6.2 Data Collection ........................................................................................... 79

iv
3. results
3.1 Dynamics, Equilibrium and Inhibition of FL Ras Studied by 31P NMR ............... 85
3.1.1 Comparison of the Conformational Equilibrium in HRasWT and KRas4bWT ... 85
3.1.2 Modulation of the Conformational Equilibrium in KRas4bWT by Zn2+-cyclen . 89
3.1.3 Effect of Raf-RBD on the Displacement of Zn2+-cyclen From HRasWT .......... 91
3.1.4 Conformational Equilibria of KRasG12D•GTP and KRasG12V•GTP ................. 93
3.1.5 Modulation of the Equilibrium in KRasG12D by Zn2+-cyclen ............................ 94
3.2 Inhibition of KRasG12D(1-188)•Mg2+•GppNHp Investigated by 31P NMR and ITC 97
3.2.1 Effect of DMSO ............................................................................................. 98
3.2.2 Compound #16324643 .................................................................................. 99
3.2.3 Compound #16328098 .................................................................................. 99
3.2.4 Compound #35127727 .................................................................................. 99
3.2.5 Compound #35139703 ................................................................................ 101
3.2.6 Compound #35141449 ................................................................................ 101
3.2.7 Compound #35145071 ................................................................................ 102
3.2.8 Compound #35117109 ................................................................................ 103
3.2.9 Compound #35129755 ................................................................................ 103
3.2.10 Compound #35129757 .............................................................................. 106
3.2.11 Compound #35131307 .............................................................................. 108
3.2.12 Compound #35131308 .............................................................................. 108
3.2.13 Compound #35135612 .............................................................................. 109
3.2.14 Compound #35135613 .............................................................................. 109
3.2.15 Compound #35135624 .............................................................................. 110
3.2.16 Compound #35135616 .............................................................................. 111
3.3 High Pressure 31P NMR Spectroscopy ................................................................ 115
3.3.1 Studies on GppNHp .................................................................................... 115
3.3.2 31P HP NMR on HRasWT(1-166)•Mg2+•GppNHp ......................................... 118
3.3.2.1 Measurements Conducted at 278 K ............................................... 118
3.3.2.2 Measurements Conducted at 303 K ............................................... 125
3.3.3 31HP NMR on HRasT35S(1-166)•Mg2+•GppNHp .......................................... 127

v
3.3.4 31HP NMR on KRasG12V(1-188)•Mg2+•GTP ................................................. 132
3.4 Mutational Analysis of HRasWT(1-166) studied by 31P NMR and ITC ................. 139
3.4.1 Preliminary Considerations about RasWT(1-166) ........................................ 140
3.4.1.1 Conformational Equilibria of H, K and NRasWT•Mg2+•GppNHp ...... 140
3.4.1.2 Titration of HRasWT•Mg2+•GppNHp with NF1 Followed by 31P NMR
spectroscopy ................................................................................... 142
3.4.2 Site Directed Mutagenesis .......................................................................... 147
3.4.2.1 2(T)-to-1(T) Transition: N26K, H94D and A66T .............................. 147
3.4.2.1.1 31P NMR GppNHp and GTP Spectra. Raf Interaction and GTPase
Activity .......................................................................................... 148
3.4.2.2 2(T)-to-1(0) Transition: S39L and E3V ............................................ 153
3.4.2.2.1 31P NMR GppNHp and GTP Spectra. Raf Interaction and GTPase
Activity .......................................................................................... 154
3.4.2.3 2(T)-to-3(T) Transition: H27E and D33K ......................................... 157
3.4.2.3.1 31P NMR GppNHp and GTP Spectra. Raf Interaction and GTPase
Activity .......................................................................................... 157
3.4.3 Interaction Between HRasH27E•Mg2+•GppNHp and Raf-RBD ..................... 161
3.4.4 Interaction Between HRasD33K•Mg2+•GppNHp and Raf-RBD ..................... 163
3.4.5 Interaction Between HRasD33K•Mg2+•GppNHp and NF1 ............................. 165
3.4.6 31P T1 Longitudinal Relaxation Times of RasWT, RasT35A and RasD33K ......... 168
3.4.7 31P HP NMR on HRasD33K•Mg2+•GppNHp .................................................. 171
3.4.8 Thermal Unfolding of HRas Proteins Investigated by nanoDSF ................. 175
3.4.9 [1H-15N]-HSQC NMR on HRasWT and HRasD33K .......................................... 177
3.4.10 31P NMR Investigations of HRasG12P and HRasG12V/T35S ............................ 180
3.4.10.1 31P NMR GppNHp and GTP Spectra. Raf Interaction and GTPase
Activity ........................................................................................... 180
3.4.10.2 Interaction Between HRasG12P•Mg2+•GppNHp and Raf-RBD ....... 186
3.4.10.3 Interaction Between HRasG12P•Mg2+•GppNHp and NF1 ............... 188
3.4.10.4 Interaction Between HRasG12V/T35S•Mg2+•GppNHp and Raf-RBD . 190

vi
3.5 High Pressure Macromolecular Crystallography (HPMX) ................................. 193
3.5.1 Crystal Structure of RasWT(1-166)•Mg2+•GppNHp at Ambient Pressure .... 197
3.5.2 Crystal Structure of RasWT(1-166)•Mg2+•GppNHp at High Pressure .......... 197
3.5.2.1 Analysis of the Compressibility Curve ............................................. 197
3.5.2.2 Analysis of rmsd and b-factor Values ............................................. 198
3.5.2.2.1 Structure at 270 MPa ............................................................ 199
3.5.2.2.2 Structure at 490 MPa ............................................................ 200
3.5.2.2.3 Structure at 650 MPa ............................................................ 200
3.5.3 Crystal Structure of RasD33K(1-166)•Mg2+•GppNHp at Ambient Pressure .. 205
3.5.4 Crystal Structure of RasD33K(1-166)•Mg2+•GppNHp at High Pressure ........ 207
3.5.4.1 Analysis of the Compressibility Curve ............................................. 207
3.5.4.2 Analysis of rmsd and b-factor Values ............................................. 208
3.5.4.2.1 Structure at 200 MPa ............................................................ 208
3.5.4.2.2 Structure at 880 MPa ............................................................ 209
3.5.4.2.3 RasD33K at 880 MPa vs RasWT at 650 MPa ........................... 209
3.5.5 Crystal Structure of RasWT•Mg2+•GppNHp Soaked with Zn2+-cyclen .......... 213
3.5.5.1 Analysis of the Compressibility Curve ............................................. 213
3.5.5.2 Analysis of the rmsd and b-factor Values ....................................... 214
3.5.5.2.1 Ras Apo vs Ras•Zn2+-cyclen at Ambient Pressure .............. 214
3.5.5.2.2 Structure at 240 MPa ............................................................ 214
3.5.5.2.3 Structure at 520 MPa ............................................................ 215
4. Discussion
4.1 FL H and KRas. Conformational Equilibria and Inhibition by Zn2+-cyclen ....... 221
4.1.1 Interaction of KRasWT(1-188)•Mg2+•GppNHp with Raf-RBD ....................... 221
4.1.2 Stabilization of State 1(T) by Zn2+-cyclen Studied by 31P NMR ................... 223
4.1.3 Conformational Equilibria of KRasG12D•GTP and KRasG12V•GTP ............... 223

vii
4.2 Modulation of the Conformational Equilibrium of KRasG12D(1-188)•Mg2+•GppNHp
by Small Compounds ............................................................................................ 225
4.2.1 General Considerations .............................................................................. 225
4.2.2 Inhibition of Ras-Raf Interaction by #755 and #757 Followed by ITC ......... 226
4.2.3 Inhibition of Ras-Raf Interaction by #616 (DCAI) Followed by ITC ............. 227
4.3 High Pressure 31P NMR Spectroscopy ................................................................ 229
4.3.1 High Pressure 31P NMR on GppNHp .......................................................... 229
4.3.1.1 Pressure Effects in Presence and Absence of Mg2+ ....................... 229
4.3.2 High Pressure 31P NMR on Ras Proteins .................................................... 231
4.3.2.1 HP 31P NMR on HRasWT(1-166)•Mg2+•GppNHp ............................. 231
4.3.2.1.1 Pressure Coefficients, Energy and Volume Changes .......... 232
4.3.2.2 HP 31P NMR on HRasT35S(1-166)•Mg2+•GppNHp ........................... 233
4.3.2.3 HP 31P NMR on KRasG12V(1-188)•Mg2+•GTP ................................. 234
4.3.2.4 HP 31P NMR on KRasD33K(1-166)•Mg2+•GppNHp ........................... 235
4.3.2.5 General Considerations .................................................................. 235
4.4 31P NMR Spectra of H, K and NRasWT(1-166)•Mg2+•GppNHp ............................. 237
4.5 Interaction of RasWT, RasG12P and RasD33K with NF1 Followed by 31P NMR ...... 237
4.5.1 RasWT(1-166)•Mg2+•GppNHp•NF1 ............................................................. 237
4.5.2 RasG12P(1-166)•Mg2+•GppNHp•NF1 ........................................................... 238
4.5.3 RasD33K(1-166)•Mg2+•GppNHp•NF1 ........................................................... 238
4.6 Mutational Studies on HRasWT(1-166) .................................................................. 239
4.6.1 General Considerations .............................................................................. 239
4.6.2 2(T)-to-1(T) Transition: N26K, A66T and H94D .......................................... 241
4.6.3 2(T)-to-1(0) Transition: E3V and S39L ........................................................ 241
4.6.4 2(T)-to-3(T) Transition: H27E and D33K ..................................................... 242
4.7 Interaction Between RasD33K and Raf-RBD Followed by 31P NMR. Structural Basis
for the Loss of Affinity ........................................................................................... 245
4.8 Thermal Unfolding of Ras Followed by nanoDSF .............................................. 247

viii
4.9 Conformational Dynamics of RasG12P and RasG12V/T35S ....................................... 247
4.9.1 Considerations About RasG12P ..................................................................... 247
4.9.2 Considerations About RasG12V/T35S .............................................................. 248
4.10 High Pressure Macromolecular Crystallography (HPMX) ............................... 249
4.10.1 HRasWT(1-166)•Mg2+•GppNHp ................................................................. 249
4.10.2 HRasD33K(1-166)•Mg2+•GppNHp ............................................................... 251
4.10.3 HRasWT(1-166)•Mg2+•GppNHp in Complex with Zn2+-cyclen .................... 253
5 Appendix ................................................................................................................... 255
5.1 Figures ........................................................................................................... 257
5.2 Tables ............................................................................................................ 267
5.3 List of Figures ................................................................................................. 274
5.4 List of Tables .................................................................................................. 280
5.5 Abbreviations Used in this Thesis .................................................................. 283
5.6 List of Publications ......................................................................................... 286
6 References ................................................................................................................ 289

ix
Acknowledgments
First and foremost I would like to thank the Bayerischen Forschungsstiftung for their
complete financial support and to Prof. Dr. Dr. Hans Robert Kalbitzer for accepting me in
his group, for sharing his ideas, scientific knowledge and for his overall contribution as main
supervisor of the entire project.
I would like to thank to Dr. Michael Spoerner, without whom this work would have been
impossible to perform. His insightful ideas, 31P NMR expertise and broad knowledge on the
Ras field were always detrimental for the project’s well being.
Many thanks to Prof. Dr. Werner Kremer, for all the suggestions, advices and concerns not
only with the scientific side but also with the human side, not only with me but with all
members of the group.
My deepest gratitude to Dr. Sunilkumar P. Narayanan for helping me with his incredible
scientific expertise, particularly for all the teachings in the field of high pressure NMR. More
importantly, thank you for your friendship and for guiding me through the ways of life and
science.
My deepest gratitude to the high pressure crystallography team that I had the pleasure to
work with: Dr’s. Nathalie Colloc´h, Eric Girard, Anne-Claire Dhaussy and Prof. Dr. Thierry
Prangé. Your brightness, insightful ideas and seemingly endless wisdom caused my
scientific interests to irrevocably entwine with the field of X-ray crystallography. Your
expertise and extraordinary technical skills are to me the prototype of what great scientists
and the scientific method should always be.
The warmest thank you to Dr. Malte Andrasch for sharing with me his extensive and
remarkable knowledge in the fields of protein biochemistry and biophysics. More
importantly, thank you for your positive and vibrant energy during many dark moments.
Thank you still for your ongoing help and concern towards the future.
I am grateful to Sabine Laberer for her help in the scope of molecular biology techniques,
particularly with DNA technologies. Similarly, I would like to thank Sabine Ruppel, to whom
I owe all the expertise I acquired in the field of protein biochemistry and purification
techniques. Thank you for your constant effort to teach me, even through the barriers
imposed by communicating in a different language.
My deepest thank you to Dominique Quetting, for her help with the expression and
purification of difficult proteins and for the permanent concern in providing the most
organised and efficient laboratorial environment. Above all, thank you for your friendship,
for all the laughs, relaxing coffees together with Sunil and the nice moments we spent
looking for furniture.

x
I want to show my gratitude to Dr. Markus Bech Erlach for his help and know-how with the
processing and interpretation of NMR spectra and contagious positive attitude.
From many students that I had the pleasure to meet and work with side-by-side, I leave
here my heartfelt thank you to all: Beatta Zablocka, Gani, Margarita Neun, Maria Watzlowik,
Silvia Planck, Linda Stabi, Martin Winter, Simon Nimmermehr, Andy, Mathias Karl, Marcell
Kaljanac. Thank you, for your eagerness to learn the ways of science, for your questions
and for your teachings. Above all, thank you for the awesome moments and stories we
shared and for introducing me to the subtle details of another culture and lifestyle.
I am grateful to Claudia Kiesewetter and Marcus Hoering for their prompted availability to
help me with the translation of the summary of this thesis. Thank you Claudia for your
brightness and lovely friendship and Marcus for all the good laughs and memorable stories.
I am ever so grateful to my brother João Miguel for always being a positive influence in my
life and to my parents Manuel Lopes and Maria Celina for their support and concern with
my well-being.
I leave here a word of appreciation to all the musicians that accompanied me for the long
hours and lonely nights spent at the biochemistry and NMR laboratories. Among many, I
am especially grateful to Sirs Mark Knopfler, David Gilmour and Gary Moore for the legacy
they gave to all of us. Their music was countless times the only motivation to carry on and
it will always be a source of inspiration through my entire life.
Last but by no means least, I leave here my heartfelt deepest gratitude to the most important
person of all: my Carina! Thank you for your constant tender and care, for your patience
and for helping me more times than I can remember. As you know so well my dear, writing
this book has been an exercise of sustained suffering through which I persisted only
because of your relentless support and dedication. It came to realisation only because of
you and therefore it is dedicated to you!

xi
Summary
The guanine binding nucleotide protein Ras is a small GTPase that controls central
regulatory processes such as cell differentiation, proliferation and apoptosis by alternating
between an active, GTP-bound, and an inactive, GDP-bound state. Both, the intrinsic
hydrolysis of GTP and the exchange reaction from GDP to GTP are very slow. Two classes
of regulatory proteins called GAP’s and GEF’s are necessary to accelerate these two
respective reactions. Active Ras interacts also with another class of proteins generally
called effectors. Using 31P NMR spectroscopy two conformational states that interconvert
in the millisecond time scale could be directly observed. They are named state 1(T) and
state 2(T) (T or D, depending whether if Tri- or Di-phosphate is bound) and correspond to
the GEF and to the effector recognition states, respectively. Their nature is influenced by
specific mutations and by the type of bound nucleotide. It was verified that specific somatic
mutations render Ras a very potent oncogene. As consequence, the protein becomes
insensitive to inactivation by GAP’s and therefore locked in the active state, leading
ultimately to uncontrolled cellular proliferation. Approximately 30% of all human tumours are
estimated to harbour mutations in one of the three isoforms (H, K and NRas) at positions
12, 13 or 61, with KRas being the most preponderant one. Due to its key role in malignant
transformation, efforts have been made over the years to develop effective inhibitors against
a seemingly undruggable protein.
In the framework of this thesis, it was demonstrated that KRasWT shows an almost identical
behaviour to HRasWT in terms of their intrinsic equilibria. Their 31P NMR spectra is
dominated by two conformational states with an equilibrium constant, K12, of 2.0 measured
at the g-phosphate of bound GppNHp. The ability to modulate the equilibrium was further
addressed by elucidating the mode of action of Zn2+-cyclen. It was shown that this
compound can selectively recognise and stabilise state 1(T), disrupting the affinity of both
isoforms towards effectors such as Raf-RBD. Titration experiments showed a cooperative
binding at two different sites with a Hill coefficient of 2 and an apparent dissociation constant
of 9.9 mM for both isoforms.
The inhibition of the oncogenic KRasG12D by a library of 15 different small compounds was
further investigated. 31P NMR showed that at least two of them (#755 and #757) led to a
significant stabilisation of state 1(T), with more than 70% decrease in the equilibrium
constant. A 75% decrease in the affinity of the Ras-Raf complex in the presence of 300 µM
of each drug was obtained from ITC measurements. The screening showed that the
compounds initially developed for inhibition of Ras bound to GDP are also able to inhibit

xii
Ras in the triphosphate-bound form and are good candidates for further lead optimisation.
High pressure (HP) 31P NMR was conducted in the isolated GppNHp molecule and in
several Ras proteins. For all of them, the pressure-dependence of the chemical shifts
revealed to be non-linear as given by the obtained positive values of the second order
pressure coefficients, B2. A direct shift of the conformational equilibrium from state 2(T)
towards state 1(T), given by the decrease in the equilibrium constant from 1.7 at 0.1 MPa
to 0.24 at 250 MPa was observed for RasWT. Additional transitions were detected involving
the GAP binding and the nucleotide-free states, named 3(T) and 1(0), respectively.
State 3(T) was identified by 31P NMR upon titration of Ras with NF1 and assigned to the
resonance line at d= -3.00 ppm in the spectrum of RasWT•Mg2+•GppNHp. At equimolar
concentrations saturation was achieved for the g-phosphate but not for the b-phosphate,
supporting the existence of conformational differences in the local environment of this
phosphate group upon formation of the protein complex.
Using site-directed mutagenesis and 31P NMR spectroscopy, it was verified that several
point mutants (H27E, S39L, E3V and D33K) led to a pronounced modification of the
conformational equilibrium. The highest effect was observed for RasD33K•Mg2+•GppNHp
that is almost completely shifted towards state 2(T) as given by the increase of the
equilibrium constant from 1.7 to 11.3. The mutation is located in the effector-loop region of
Ras involved in the interaction with different proteins. A 30-fold decreased affinity towards
Raf-RBD (KD= 10.4 µM) comparatively to RasWT (KD= 0.42 µM) and an impaired affinity
towards NF1 was observed. The increase of the equilibrium constant from 1.7 to 2.0 in the
case of RasE3V represents a good example of a typical conformational modulation by an
allosteric mechanism, as the mutation is located in a distal site relative to the bound
nucleotide.
The crystal structures of RasWT and RasD33K were solved for the first time under high
pressure. Analysis of the unit cell compressibility revealed the existence of a transition zone
for RasWT between 200 and 270 MPa. A decrease of the main-chain temperature factors
from 20 Å2 at 0.1 MPa to 13.5 Å2 at 650 MPa, together with the increase in the average
rmsd values, gave an insight for the possible stabilisation of non-native conformations at
high pressures. RasD33K, on the other hand, is less sensitive to pressure, with the transition
zone occurring around 500 MPa and significant rearrangements at 880 MPa. Typical
pressure-induced modifications involved the helix a2 as part of switch 2, the loop λ7, helix
a1 at the beginning of switch 1.

xiii
Zusammenfassung
Das Guaninnukleotid-bindende Ras Protein ist eine kleine GTPase, die durch den Wechsel
zwischen dem aktiven, GTP-gebundenen Zustand und dem inaktiven, GDP-gebundenen
Zustand verschiedene regulatorische Prozesse in der Zelle kontrolliert, wie z.B.
Zelldifferenzierung, Zellproliferation und Apoptose. Sowohl die intrinsische Hydrolyse von
GTP als auch die Austauschreaktion von GDP zu GTP sind sehr langsam. Um diese
Reaktionen zu beschleunigen wird die Hilfe der zwei regulatorischen Proteinklassen GAP’s
und GEF’s benötigt. Außerdem interagiert Ras in seinem aktiven Zustand mit einer weiteren
Proteinklasse, den sogenannten Effektoren. Mit Hilfe der 31P-NMR-Spektroskopie können
die zwei Konformationen, deren Umwandlung nur Millisekunden benötigt, direkt detektiert
werden. Die beiden Zustände werden als 1(T) und 2(T) bezeichnet (T bzw. D, je nachdem
ob Tri- oder Diphosphat gebunden ist) und entsprechen jeweils dem GEF und dem Effektor-
erkennenden Zustand. Beeinflusst werden sie durch spezifische Mutationen und durch die
gebundene Nukleotidform. Außerdem ist bekannt, dass spezifische somatische Mutationen
Ras zu einem potenten Onkogen machen. Als Folge daraus wird das Protein unempfindlich
gegen die Inaktivierung durch GAP’s und verbleibt im aktiven Zustand, der zu einer
unkontrollierten Zellteilung führt. In 30% aller menschlichen Tumore liegen Mutationen in
einer der drei Ras Isoformen (H, K und NRas) in den Positionen 12, 13 oder 61 vor, von
denen KRas am häufigsten betroffen ist. Wegen seiner Schlüsselfunktion bei der
Tumorbildung wurden im Laufe der letzten Jahre viele Versuche unternommen, um
effektive Inhibitoren gegen das scheinbar unbehandelbare Protein zu finden.
Im Rahmen dieser Arbeit konnte nachgewiesen werden, dass KRasWT und HRasWT ein
nahezu identisches Verhalten in Bezug auf ihre intrinsischen Gleichgewichte besitzen. Ihre 31P-NMR-Spektren werden von zwei konformationellen Zuständen dominiert, die eine
Gleichgewichtskonstante K12 von 2.0 besitzen, die am g-Phosphat des gebundenen
GppNHp bestimmt wurde. Die Möglichkeit dieses Gleichgewicht zu beeinflussen wurde
durch den Wirkungsmechanismus von Zn2+-Cyclen verdeutlicht. Es konnte gezeigt werden,
dass diese Komponente selektiv den Zustand 1(T) stabilisiert und die Affinität beider
Isoformen gegenüber den Effektoren (z.B. Raf-RBD) stört. Titrationsexperimente haben
eine kooperative Bindung an zwei verschiedenen Seiten mit einem Hill-Koeffizienten von 2
und einer Dissoziationskonstanten von 9.9 mM für beide Isoformen ergeben.
Die Inhibition von onkogenem KRasG12D durch 15 verschiedene kleine Substanzen wurde
weiter untersucht und es konnte mit Hilfe der 31P-NMR-Spektroskopie gezeigt werden, dass
mindestens zwei dieser Komponenten (#755 und #757) zu einer signifikanten Stabilisierung

xiv
des Zustands 1(T), mit einer Verkleinerung der Gleichgewichtskonstanten von mehr als
70%, führen. Mittels ITC Messungen konnte eine 75%ige Abnahme der Affinität des Ras-
Raf Komplexes in der Anwesenheit von 300 µM der entsprechenden Komponente bestimmt
werden. Die Experimente zeigten, dass die Komponenten, die ursprünglich für die Inhibition
des GDP-gebundenen Ras entwickelt wurden, auch Ras in seiner Triphosphat-gebundenen
Form inhibieren können und dementsprechend optimale Kandidaten für eine weitere
Optimierung wären.
Das isolierte GppNHp Molekül sowie verschiedene Ras Proteine wurden mittels Hochdruck 31P-NMR-Spektroskopie untersucht. In allen Fällen konnte eine nicht lineare Abhängigkeit
der chemischen Verschiebung anhand der positiven Werte des Druckkoeffizienten zweiter
Ordnung (B2) gezeigt werden. Für RasWT konnte eine direkte Verschiebung des
koformationellen Gleichgewichts von Zustand 2(T) zu Zustand 1(T) anhand der Abnahme
der Gleichgewichtskonstanten von 1.7 bei 0.1 MPa zu 0.24 bei 250 MPa beobachtet
werden. Außerdem wurden zwei zusätzliche Übergänge detektiert, die Zustand 3(T) und
1(0) benannt wurden. Dabei handelt es sich um den GAP-bindenden Zustand und um den
Nukleotid freien Zustand.
Der Zustand 3(T) wurde mittels Titrationsexperiment und 31P-NMR-Spektroskopie
identifiziert, bei dem NF1 zu Ras titriert wurde und die Resonanzlinie bei d= -3.00 ppm dem
Spektrum von RasWT•Mg2+•GppNHp zugeordnet wurde. Bei equimolarer Konzentration
wurde eine Sättigung für das g-Phosphat, aber nicht für das b-Phosphat, erzielt. Diese
Tatsache unterstützt die Existenz der konformationellen Unterschiede in der lokalen
Umgebung dieser Phosphat Gruppe bei der Bildung des Proteinkomplexes.
Mit Hilfe von ortsspezifischer Mutagenese und der 31P-NMR-Spektroskopie konnte
nachgewiesen werden, dass einige Punktmutationen (H27E, S39L, E3V und D33K) zu
einer starken Modifikation des konformationellen Gleichgewichts führen. Der stärkste Effekt
wurde bei RasD33K•Mg2+•GppNHp beobachtet. Hier erfolgt eine nahezu komplette
Verschiebung hin zu Zustand 2(T), wie anhand der Zunahme der Gleichgewichtskonstanten
von 1.7 zu 11.3 zu erkennen ist. Die Mutation befindet sich an der Effektor-Schleifen Region
von Ras, die in die Interaktion mit verschiedenen Proteinen involviert ist. Eine 30-fache
Abnahme der Affinität zu Raf-RBD (KD= 10.4 µM) im Vergleich mit RasWT (KD= 0.42 µM)
und eine gestörte Affinität zu NF1 konnte beobachtet werden. Die Zunahme der
Gleichgewichtskonstanten von 1.7 zu 2.0 von RasE3V stellt ein gutes Beispiel einer
typischen konformationellen Änderung durch einen allosterischen Mechanismus dar, da
sich die Mutation auf der entfernten Seite des Nukleotid Bindungszentrums befindet.

xv
Die Kristallstrukturen von RasWT und RasD33K wurden erstmals unter Hochdruck ermittelt.
Die Analyse der Kompressibilität der Einheitszelle zeigte die Existenz einer Übergangszone
für RasWT zwischen 200 und 270 MPa. Durch die Abnahme der Hauptketten Temperatur
Faktoren von 20 Å2 bei 0.1 MPa zu 13.5 Å2 bei 650 MPa, zusammen mit der Zunahme der
Durchschnittwerte von rmsd, konnte ein Einblick in die mögliche Stabilisierung von nicht
nativen Konformationen bei Hochdruck erhalten werden. Auf der anderen Seite ist RasD33K
weniger sensitiv zu Druck und besitzt seine Übergangszone bei etwa 500 MPa und
signifikante Änderungen treten ab 880 MPa auf. Typische Druck induzierte Modifikationen
involvieren die Helix a2 als Teil des Switch 2, die Schleife λ7 und die Helix a1 am Anfang
des Switch 1.

xvi
- This page was deliberately left blank -

1. Introduction
“No human investigation can be called true science
without passing through mathematical tests”
Leonardo Da Vinci


1. Introduction
3
1.1 Ras as a Molecular Switch
This thesis deals with the Ras protein, a prototype member of a large superfamily called
guanine nucleotide binding proteins (GNBP’s or G proteins, for short) that act as molecular
switches by cycling between an ‘on’ (active) and an ‘off’ (inactive) state, thus controlling
diverse regulatory processes of capital importance in the living cells. Ras was identified in
1964 when Jennifer Harvey observed that a preparation of murine leukaemia virus (MLV)
induced rat sarcomas in newborn mice [1]. Within the next three years, an additional
retrovirus containing a new Ras gene, homologous to the first one, was further discovered
by Werner Kirsten [2]. Ten years later, a third gene was identified in human Neuroblastoma
cells [3]. The three homologue proteins codified by the three genes were thereafter named
as H, K and NRas. Their complex structural dynamics and profound biochemical importance
has been unveiled slowly but steadily for more than half a century, up to the present day.
Since the last decade there has been an uprising interest by the scientific community in the
chemistry of Ras (particularly KRas) due to its involvement in tumour formation and
progression, triggered by an impaired function of the molecular switch mechanism that
originates the permanent activation of the protein. A renewed scientific endeavour is taking
place at the moment, in an attempt to find truly effective Ras inhibitors capable of drugging
a seemingly undruggable protein [4].
The GNBP superfamily can be grouped by sequence homology into five major subgroups.
Incidentally the subgroups also define a more or less similar biological function. The Ras
family is a branch that contains the Ras protein itself, together with the three isoforms and
is involved in cell proliferation, gene expression, differentiation and apoptosis; the Rho (Ras
homologous) controls the dynamics of the cytoskeleton; the Rab (Ras in the brain) and Arf
(ADP ribosylation factor) families regulate the vesicular transport and the Ran (Ras in the
nucleolus) determines the direction of the nucleocytoplasmic transport and regulates the
mitotic spindle organization [5]. Altogether they are the masters of the signalling
transduction pathways, controlling virtually all molecular events by which any chemical or
physical stimuli is relayed into the nucleus and culminates with an appropriate cellular
response (e.g. transcription of specific genes). All members have the ability to bind the small
nucleotides guanosine di-phosphate (GDP) and guanosine tri-phosphate (GTP) with high
selectivity and affinity (in order of 10 pM), being the binding process strongly dependent of
Mg2+, which is their natural co-factor.
With exception of Ran, all G proteins are posttranslationally modified by addition of lipids
either at their N-terminus by acetylation (myristoylation) or at their C-terminus by prenylation

1. Introduction
4
and palmitoylation [6]. Prenylation takes place by addition of farnesyl or geranyl-geranyl
lipidic groups via a stable thioether linkage, catalysed by the enzyme farnesyltransferase.
Palmitoylation takes place through the formation of a reversible thioester linkage and is
used to dynamically regulate membrane localization. These modifications serve as
important components of their membrane targeting motifs and promote membrane binding.
GNBP’s can be also regulated by non-lipidic modifications such as phosphorylation,
nitrosylation, mono- and di-ubiquitination, acetylation and oxidation, all of which alter the
protein localization and/or interaction with regulatory molecules. An in-depth coverage of
these topics can be found in excellent recent reviews [7-9].
The human Ras superfamily contains 167 proteins, of which 39 belong to the Ras sub-
family and comprise a total of 940 structures deposited in the protein data bank (pdb), as
of October 2017, either in uncomplexed forms or bound to any regulatory protein or small
ligand.
1.1.1 Structural and Biochemical Considerations
The first crystal structure of Ras was solved in 1988 independently by Sung-Hou Kim [10]
and Alfred Wittinghofer [11] with a 2.1 and 2.6 Å resolution, respectively. In the next year,
the latter group published a refined structure with a resolution of 1.35 Å that became a
representative model of the protein and a starting point for many theoretical and
experimental structural studies in the years to come (pdb: 5p21) [12]. All Ras members
share the same structural fold, so-called “G domain”, containing the catalytic machinery
comprised of 6 b-strands (b1-b6) flanked by and 5 a-helices (a1-a5) and 10 connecting loops
(λ1-λ10, Figure 1.1). The G domain contains five fingerprint regions, named from G1 to G5,
all of them located in loops: G1, also called the P-loop (aa 10-17; GxxxxGKS, x= any
aliphatic amino acid) is a glycine-rich loop that twines around the negatively charged
phosphate groups, binding tightly to them through its main chain positively charged N
atoms. Lys16 contacts directly the b- and g-phosphates and is crucial for nucleotide binding.
The OH group of Ser17 contacts the b-phosphate and the Mg2+ ion [13]. The region G2,
also called switch 1 (switch 1, aa 30-40 in HRas) or “effector region” since is involved in the
binding of effectors when in the GTP state, is one of the regions that changes conformation
upon nucleotide exchange. It contains a Thr35 that is totally conserved in all members of
the superfamily and crucial for sensing the presence of the g-phosphate of GTP,
establishing a polar contact with it via its NH main chain. The same amino acid also binds
the Mg2+ ion via its OH side chain [14]. The region G3, also called switch 2 (switch 2, aa 59-
70 in HRas) has no conserved sequence besides a small loop at its beginning called the

1. Introduction
5
DxxG motif (aa 57-60) in
which Gly60 forms a main
chain H-bond with the g-
phosphate. Another
important residue in switch 2
is Gln61 that plays a crucial
role in the stimulation of GTP
hydrolysis (section 1.1.4)
[15]. G4 is the N/TKxD motif
(aa 116-119), where the
Asp119 contacts the
nitrogen atoms from the
base with a bifurcated H-bond and Asn116 contacts the C=O group from the purine ring,
thus conferring specificity for the guanidinium base. Lys117 stacks along the plane of the
base [16]. G5, also called SAK (aa 145-147), is a weakly conserved motif in which the
backbone NH groups interact with the C=O moiety from the guanine base. These five
structural elements of the G domain are depicted in Figure 1.2, along with key molecular
contacts to the nucleotide.
The three Ras isoforms (H, K and NRas) share more than 90% identity across the catalytic
domain but differ considerably in the last 25 residues, having less than 15% similarity.
These residues constitute the C-terminal part of the protein and are called the hypervariable
region (HVR). They are necessary for interaction with the membrane and play a
fundamental role in signalling processes. For technical reasons, most of the biochemical
studies were performed over the years with truncated variants of Ras, comprising only the
catalytic domain (aa 1-166, 18 kDa). It was demonstrated that the first 166 residues are
necessary and sufficient for the biochemical properties of the protein [15, 17]. In fact, to the
present date, there are no crystal structures of the full-length (aa 1-189, 21 kDa) wild type
Ras deposited in pdb. The only available structure was obtained in 2012 for the mutant
KRas4bG12D•Mg2+•GDP [18]. FL Ras undergoes crystallization as easy as the truncated
variant but attempts to retrieve diffraction data from HVR fail consistently due to the lack of
electron density, which portends the high flexibility of this region. In recent years, however,
the scientific interest in FL Ras instead of the truncated variant gained much more attention,
especially after the discovery that the HVR is capable of acting on the catalytic domain,
modulating its action and being largely responsible for the biological differences across the
three isoforms [19-21].
Figure 1.1. Topology of the G domain. The diagram represents the order of secondary structure. Helices are shown as cylinders and marked as a1-a5 (helix a3 is slightly distorted) and the b-sheets are shown as arrows and marked as b1-b6. Loops are labelled λ1-λ10. The amino acids flanking the beginning and the end of each element of secondary structure are indicated.

1. Introduction
6
Ras is intrinsically capable
of hydrolysing the GTP
nucleotide by transferring
electrons to a water
molecule strategically
placed in the catalytic centre
that promotes the
nucleophilic attack of the g-
phosphate (Figure 1.2). The
averaged half-life for this
process is ca. 25 min.
(Table 3.14). Very often the
natural nucleotides need to
be replaced by more stable,
non-hydrolysable ones,
especially when performing
long term experiments of
several hours or days,
common in NMR
spectroscopy. A frequently
used analogue is GppNHp,
being structurally identical to
GTP except for the oxygen
atom that mediates the b-
and g-phosphates that
becomes replaced by an NH group. Other analogues include GTPgS and GppCH2p [22].
Detailed analysis revealed that both GTP and GppNHp bind Ras in the same manner with
only slight differences in the bridging NH group, indicating that small local changes can still
lead to drastic differences in the dynamics of the catalytic site [23].
The switch mechanism between the active and the inactive states is accompanied by
prominent structural changes in the switch 1 and switch 2 regions: in GppNHp-bound HRas,
the g-phosphate forms two H-bonds with Gly60 from switch 2 and Thr35 from switch 1. The
Mg2+ ion is bidentately coordinated by the non-bridging oxygen atoms of b- and g-
phosphates, Thr35, Ser17 (from the P-loop) and two H2O molecules [24-26]. Quantum
mechanical (QM) calculations showed that Mg2+ provides a temporary storage for electrons
Figure 1.2. HRas•Mg2+•GppNHp as the prototype of the G domain: structural details of the catalytic centre. A. Schematics of the interaction between selected residues and B. their representation in the crystal structure (pdb: 5p21). switch 1 and switch 2 are coloured in red and green, respectively, the P-loop is coloured in orange and the G4 and G5 motifs are coloured in blue and yellow, respectively. The position of important residues is indicated by small spheres (centred at their a-carbon) or explicitly by lines. Q61 is implicated in the hydrolysis of the g-phosphate by interacting transiently with a nearby catalytic water (shown as a light blue sphere). Thr32, whose side chain (not represented) can bind transiently to the g-phosphate is also indicated. Its neighbor, Asp33, is a very important residue in the scope of the work developed in this thesis. The Mg2+ ion is shown as a black sphere. The detail of the amide group of the non-hydrolysable GppNHp nucleotide is shown in blue colour. The nitrogen atom establishes a polar contact with Gly13 from the P-loop. This interaction is absent in the case of the natural nucleotide GTP.

1. Introduction
7
taken from the triphosphate and that after release of the g-phosphate it returns them back
to GDP, contributing for the process of hydrolysis [27].
Upon GTP hydrolysis, the b-phosphate has no direct interactions with Thr35 and Gly60;
coupled with the loss of coordination between the Mg2+ ion and Thr35. These alterations
promote an extensive remodelling of switch 1 and switch 2, both adopting now a more
‘relaxed’ or open conformation and effectively moving away from the nucleotide, as shown
in Figure 1.3. At the same time the helix a2 (aa 66-74, Figure 1.1) undergoes a large rotation
together with the unwind of one of its helical turns. This open conformation contributes
afterwards for the dissociation of GDP, perpetuating the cycle. Another important difference
upon nucleotide exchange is Tyr32 located in switch 1: in GppNHp-bound Ras, Tyr32 is set
upwards, pointing to the solvent, whereas in the GDP-bound Ras undergoes a large flip and
shifts towards the interaction site. The root mean square deviation (rmsd) between the
whole catalytic domains of GppNHp and GDP-bound HRas is 1.58 Å for the backbone
Figure 1.3. The switch mechanism in three dimensions. The Ras protein is in a continuous cycle of activation/ inactivation defined by the permanent exchange between GTP and GDP nucleotides. The crystal structures of the inactive, GDP-bound (blue colour), and active, GTP-bound, (red colour) HRas protein are shown (pdb: 1q21 and 5p21, respectively). The flexible switch 1 and switch 2 regions are coloured in orange and the coordinated Mg2+ ion is shown as a black sphere. The two common mutation sites in cancer (G12 and G13) lie close to the nucleotide and are represented as grey spheres. The totally conserved Q61 is shown as an orange sphere and can be used here to visually understand the movement of the switch regions as the protein cycles between GDP and GTP. The activation mechanism is catalysed by GEF’s and the intrinsically slow hydrolysis of GTP is catalysed by GAP’s. In the active form, Ras interacts with effectors to trigger downstream signaling events.

1. Introduction
8
atoms. If the switch regions are excluded, the rmsd is only 0.66 Å [28, 29].
Ras is an incomplete enzyme: its intrinsic rate of GTP hydrolysis (also called GTPase
activity) is too slow for many cellular processes and needs to be catalysed by a group of
proteins called GTPase activating proteins (GAP’s). Similarly, the release of GDP is also
intrinsically very slow and needs to be catalysed by guanine nucleotide exchange factors
(GEF’s) [30, 31].
Ras is capable of initiating more than 10 different signalling cascades (Figure 1.4) that
control cell differentiation, proliferation or apoptosis by transducing extracellular ligand-
mediated stimuli to the nucleolus. The general mechanism for transduction can be
described as follows: upon recognition of the external stimuli, different receptors (tyrosine
kinases, RTK’s, G-protein-coupled receptors, etc.) hetero-dimerize and auto-phosphorylate
each other. In the case of the common RTK receptor, additional adaptor proteins called
Grb2 or Shc bind to one of its domains called SH2. The binding promotes the recruitment
of GEF’s to the membrane, which, in turn, will activate the Ras protein by stimulating the
exchange of GDP to GTP. Active Ras can now interact with its multiple downstream targets
generally called effectors (from more than 10 known effectors of Ras, the most
representative ones within the framework of this thesis, are Raf-RBD, Ral-GDS, PI3K and
Byr2 [32, 33]). Each effector will activate specific kinase proteins that will start a series of
kinase chain reactions through which the signal is relayed down, reaching the cellular
nucleus and culminating with the transcription of genes that will confer an appropriate
response to the original stimuli. One of the most common signalling cascades of Ras is the
Figure 1.4. Schematics of the main Ras signaling pathways. From more than 10 known signaling cascades under direct control of Ras, the MAPK (Ras/Raf/MEK/ERK) is the best understood. For sake of simplicity the full names for the abbreviations in the scheme are not given here. The reader is submitted to the original review [34] from where this scheme was adapted.

1. Introduction
9
mitogen-activated protein kinase (MAPK) pathway that uses the protein Raf as effector and
two different MAP kinases: MEK and ERK.
Phosphorylated ERK translocates to the nucleus and triggers gene transcription [34]. The
signalling cascade is eventually inactivated by negative feedback from the nucleus after
gene transcription, which leads to the hydrolysis of g-phosphate of GTP-bound Ras,
catalysed by GAP’s, as the protein returns to the original (inactive) GDP-bound state [35].
1.1.2 Interaction with GEF’s: the ‘Switch On’ Reaction
The direct consequence of the picomolar affinity between Ras and GDP/GTP is that
nucleotide dissociation is not compatible with the time scale of most cellular processes. The
activation of Ras needs to be catalysed by GEF’s, a large class of multidomain enzymes
capable of accelerating the exchange reaction by 3 to 4 orders of magnitude [36, 37]. The
GEF-catalysed reaction is an intricate multistep process whose kinetics have been
described in detail only for the HRas•Cdc25 complex. The affinity of binding between the
two proteins (KD) was found to be 4.6 nM and the maximal acceleration by Cdc25 of the
rate of nucleotide dissociation was estimated to be more than 105-fold [36]. In general, Ras
has a similar affinity for both, GDP and GTP, and GEF’s do not favour the re-binding of
either nucleotide. The direction of the reaction is dictated instead by the concentrations of
the free nucleotides in the cell at a given time. Since normally the GTP concentration is 10-
fold higher than GDP, the resulting product of the catalytic reaction is Ras loaded with GTP
[38].
GEF’s can be grouped in two different classes. The first one comprises the RasGEF’s which
are activated by second messengers like Ca2+, calmodulin or diacylglycerol [39]. The
second class is represented by the son-of-sevenless (SOS). Human SOS1 is a very large
multiprotein of ~1330 residues (152.4 kDa) containing at least 4 different domains, from
which the catalytic domain (aa 551-1050, abbreviated as SOScat, 36 kDa) is the one involved
in Ras binding and catalysis [40, 41]. SOScat comprises the Ras exchanger motif (Rem, aa
551-750), the Cdc25 motif (aa 751-1050) and a C-terminal region (aa 1051-1333) that
provides a docking site for the adaptor protein Grb2 (Figure 1.4) [42]. Previous
investigations have shown that the Rem motif is responsible for the stability of the whole
catalytic domain and that the Cdc25 motif is necessary and sufficient for nucleotide
exchange [36, 43]. The first crystal structure of the nucleotide free HRas•SOScat complex
was solved in 1998 [44] and shows Ras bonded to the Cdc25 motif, with no direct contacts
to Rem (Figure 1.5A). The primary contact regions are the P-loop, helix a1 and the switch
regions. The most significant conformational change in HRas is due to the insertion of an

1. Introduction
10
helical hairpin composed of
helices aH and aI from
Cdc25 that penetrates
through the catalytic pocket
and projects switch 1 away
from the nucleotide binding
site (Figure 1.5B). The
hairpin introduces in the
nucleotide binding site a
hydrophobic side chain
(Leu938), which blocks
magnesium binding by
interacting with Ser17 from
Ras, and an acidic side
chain (Glu942), which
overlaps with the site where
the a-phosphate of the
nucleotide would otherwise
be bound. At the same time,
switch 2 is held very tightly
by SOS and constitutes the heart of the interface between the two proteins. A cluster of
three residues with hydrophobic side chains from Ras, Tyr64, Met67 and Tyr71, is buried
into the hydrophobic core of SOS. Surrounding this hydrophobic triad is an array of polar
interactions between the two proteins making almost all side chains of switch 2 coordinated
to SOS (for example, Ala59 occupies the previous position of Mg2+ ion and the Glu62 side
chain interacts with both, the NH group from Gly60 and the side chain of Lys16). As
consequence, the conformation of switch 2 is very well defined in the complex, contrary to
the typical poorly ordered conformation in the nucleotide-bound forms of Ras. In summary,
switch 1 is pushed away from its normal position whereas switch 2 is pulled towards the
nucleotide binding site [31, 44]. From these structural insights, the mechanism of nucleotide
association/ dissociation was proposed to be as follows: in the dissociation process, the
phosphate moieties of GDP are released first after binding of SOS, and then the base and
ribose moieties are released. In contrast, the association process takes place by binding
first the base and the ribose moieties of GTP and only then the phosphate groups.
Significant conformational changes of the switch regions are thought to occur to rebuild the
Figure 1.5. Structural insights on the Ras•SOS complex (pdb: 1bkd). A. Surface and cartoon representation of nucleotide free Ras (coloured in grey) bound to the catalytic domain of SOS (coloured in blue). The Rem, N-terminal motif (coloured in light purple) is also shown. The hairpin formed by the helixes aH and aI from SOS is indicated. B. Details of the binding interface between the two proteins. Switch 2 is ‘clamped’ by SOS through interaction with hydrophobic residues and switch 1 is projected away from the vicinity of the nucleotide upon insertion of the helical hairpin. Adapted from [44].

1. Introduction
11
binding sites for the phosphate and Mg2+ and subsequently to displace SOS [31, 37].
It is worth mention that a new binding site of Ras to SOScat was found in 2003. This site is
located between the Rem and the Cdc25 motifs and is in a distal position relative to the
binding site on the Cdc25 motif [45]. Interestingly, the solved crystal structure is of a ternary
complex HRas•GppNHp•SOScat:Ras(nucleotide-free) (pdb: 1nvw), where the nucleotide-
bound Ras is located in the newly discovered distal site and the nucleotide-free Ras is
located at the ‘usual’ place, at the Cdc25 domain. The implications of a second biding site
are thought to be related to a mechanism of feedback activation of SOS: the binding at the
distal site has a profound influence in the conformation of the Rem motif, resulting in its
rotation by about 10° relative to Cdc25. In turn, this rotation echoes the interactions between
the helical hairpin and switch 1 of nucleotide-free Ras in the active site [45, 46].
1.1.3 Interaction with Effectors
In the active state, GTP-bound Ras relays signals to the downstream targets by direct
association with different proteins generally called “effectors”. There are more than 10
different known families of effectors capable of interacting with the Ras subfamily alone and
many more that bind to other GTPases [47-49]. All known effectors differ in their function
and surprisingly show no homology in their structure despite having a common region of
~100 amino acids usually named ‘Ras binding domain’ (RBD) that was found to be
necessary and sufficient for Ras recognition. RBD binds preferentially Ras-GTP with typical
dissociation constants between 0.01 and 3 µM [48, 50, 51] in contrast with Ras-GDP, whose
apparent KD values are in the upper µM range, corresponding to an averaged 1000-fold
decreased affinity [52]. The most representative and well-studied effector of Ras is the Raf
protein (from rapid accelerated fibrosarcoma), expressed in all mammals as three
paralogues (ARaf, BRaf and CRaf. CRaf is sometimes called Raf1 and is the variant used
in the work presented in this thesis) [35]. Raf is a 72 kDa serine-threonine kinase involved
in the signalling of the MAPK pathway composed of three conserved main regions (Figure
1.6): the RBD located in its N-terminal segment (aa 55-132, 9.4 kDa), presenting a ubiquitin-
like architecture (bbabbab), followed by a C-kinase homologous (C1 or CRD) domain (aa
133-184), which is a specialized zinc finger, rich in cysteines and stabilized by two zinc ions.
Both domains (RBD and CRD) act as a single unit to negatively regulate the activity of the
protein [53]. They are labelled together as belonging to the CR1 region (conserved region
1). Between this auto inhibitory CR1 region and the catalytic domain (CR3) there is a hinge
region, named CR2 (aa 185-349), whose sequence is rich in serine amino acids despite
being poorly conserved across related Raf genes. CR2 acts as a natural hinge between the

1. Introduction
12
rigid auto inhibitory (CR1) and
catalytic (CR3) domains enabling
complex movements and
profound conformational
rearrangements within the
molecule [54]. This hinge
contains a small island of amino
acids that are responsible for
recognition of a protein named 14-3-3 when a critical Ser259 (in CRaf) becomes
phosphorylated. The C-terminal part of Raf, labelled as CR3 (aa 350-648), holds the kinase
domain and is responsible for its catalytic activity [55]. In many biophysical investigations it
is a common procedure to express the RBD domain of Raf alone and use it in subsequent
kinetic and/or thermodynamic Ras-binding experiments. The RBD’s of different effectors
share very little homology: comparative studies show that no particular sequence pattern is
recognizable between Raf, AF6, Ral-GDS or Ral-GEF, which envisages the idea that the
C1 domain is a structural module that appears to have been “shuffled around” in the course
of evolution [56, 57]. Rather interestingly, their non-similarity constitutes the basis for the
description of Ras as a master switch of the cell, capable of adapting its surface and
interacting with a such wide conformational variety of effectors [58]. Despite of the observed
differences, the topology of RBD is identical for many effectors [59]. The first structural
insights for the interaction between Ras and Raf were discovered in 1996 by Nassar and
co-workers, who solved a 2.0 Å crystal structure of the complex between the HRas
homologue Rap1A bound to GppNHp and Raf-RBD (pdb: 1gua) [60]. Rap1A is highly
homologous to Ras with more than 57% similarity and shares the same effector interface.
The complex revealed that Raf-RBD interacts mainly with switch 1, in good agreement with
previous experiments indicating that specific mutations in HRas switch 1 (Y32F, P34S/G
T35V, E37A and D38A/N, among others) significantly impaired the association to Raf-RBD
[61, 62]. The binding interface is thus formed by the antiparallel co-alignment of RBD b2 and
Rap1A b2 within the switch 1 region. Detailed analysis showed that the crucial contacts stem
from strong/weak salt bridges formed between Rap1AE31-RafK84, Rap1AD33-RafK84/R73,
Rap1AE37-RafR59/R67 and Rap1AD38-RafR89. Subsequent molecular dynamics (MD)
investigations using a model structure of HRasD33A•Mg2+•GTP•Raf-RBD showed that
Asp33 establishes one of the strongest salt bridges at the interaction surface and that a
mutation at this position severely impairs the binding between the two proteins [63].
The first crystal structure of HRasWT•Mg2+•GppNHp bound to Raf-RBD was solved only in
Figure 1.6. General architecture of effector proteins representing the auto inhibitory domain (CR1), where Ras binds at the RBD site, the hinge region (CR2), and the kinase, catalytic, domain (CR3).
1. Introduction
13
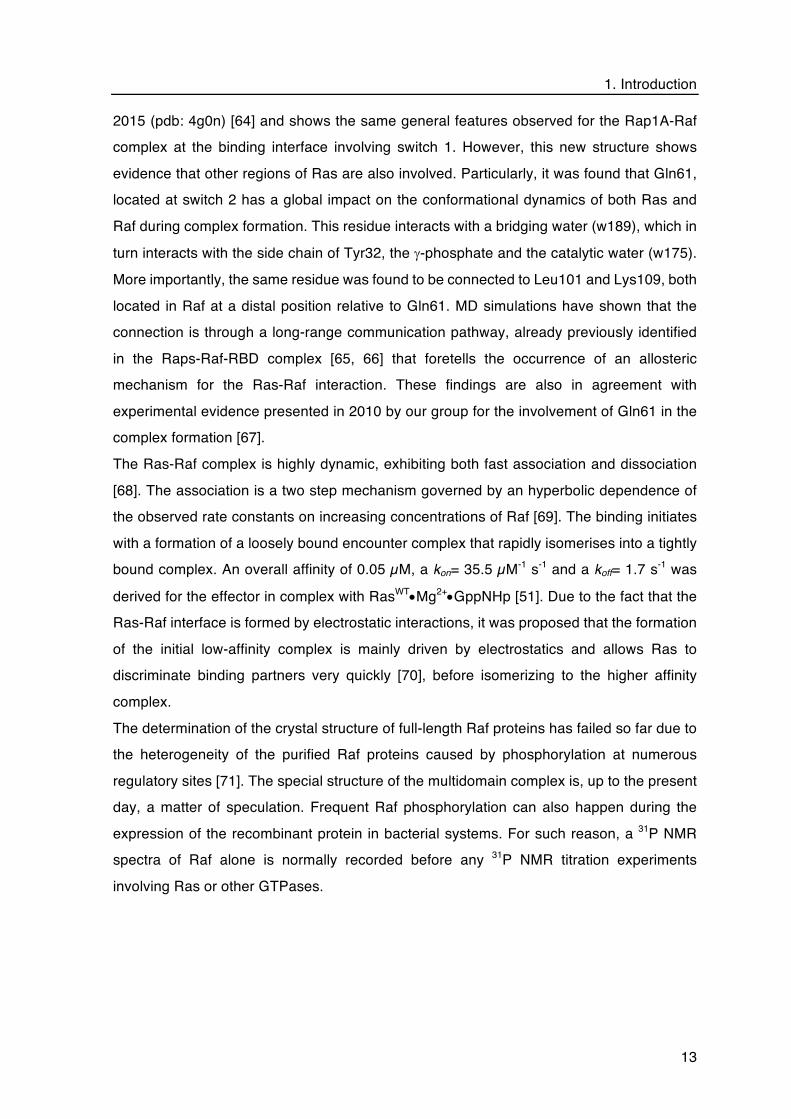
2015 (pdb: 4g0n) [64] and shows the same general features observed for the Rap1A-Raf
complex at the binding interface involving switch 1. However, this new structure shows
evidence that other regions of Ras are also involved. Particularly, it was found that Gln61,
located at switch 2 has a global impact on the conformational dynamics of both Ras and
Raf during complex formation. This residue interacts with a bridging water (w189), which in
turn interacts with the side chain of Tyr32, the g-phosphate and the catalytic water (w175).
More importantly, the same residue was found to be connected to Leu101 and Lys109, both
located in Raf at a distal position relative to Gln61. MD simulations have shown that the
connection is through a long-range communication pathway, already previously identified
in the Raps-Raf-RBD complex [65, 66] that foretells the occurrence of an allosteric
mechanism for the Ras-Raf interaction. These findings are also in agreement with
experimental evidence presented in 2010 by our group for the involvement of Gln61 in the
complex formation [67].
The Ras-Raf complex is highly dynamic, exhibiting both fast association and dissociation
[68]. The association is a two step mechanism governed by an hyperbolic dependence of
the observed rate constants on increasing concentrations of Raf [69]. The binding initiates
with a formation of a loosely bound encounter complex that rapidly isomerises into a tightly
bound complex. An overall affinity of 0.05 µM, a kon= 35.5 µM-1 s-1 and a koff= 1.7 s-1 was
derived for the effector in complex with RasWT•Mg2+•GppNHp [51]. Due to the fact that the
Ras-Raf interface is formed by electrostatic interactions, it was proposed that the formation
of the initial low-affinity complex is mainly driven by electrostatics and allows Ras to
discriminate binding partners very quickly [70], before isomerizing to the higher affinity
complex.
The determination of the crystal structure of full-length Raf proteins has failed so far due to
the heterogeneity of the purified Raf proteins caused by phosphorylation at numerous
regulatory sites [71]. The special structure of the multidomain complex is, up to the present
day, a matter of speculation. Frequent Raf phosphorylation can also happen during the
expression of the recombinant protein in bacterial systems. For such reason, a 31P NMR
spectra of Raf alone is normally recorded before any 31P NMR titration experiments
involving Ras or other GTPases.

1. Introduction
14
1.1.4 Interaction with GAP’s: the ‘Switch Off’ Reaction
Ras is not a GTPase on its own right. The experimentally measured rate of hydrolysis
(defined as kcat) is 4.7x10⁻⁴ s-1 at 310 K [31]. GTPase activating proteins, or GAP’s,
effectively accelerate this reaction by at least 5 orders of magnitude, with a kcat= 19 s-1
measured at 298 K [72]. Both, the intrinsic and the GAP-accelerated hydrolysis, are
complex phosphoryl-transfer reactions still not very well understood. At the basis of the
mechanism is the transfer of the g-phosphoryl group to a water molecule responsible for the
nucleophilic attack. During the process the electrophilicity of the g-phosphate is enhanced
by the Mg2+ ion that acts as a Lewis acid, leading to a decrease in the dipole-moment of the
P-O bond. The overall mechanism is very much like a typical SN2 reaction at a carbon: the
nucleophilic water approaches the electrophilic centre from the backside position, opposite
to the leaving group. As the pair approaches, the geometry at the phosphate centre changes
from tetrahedral to trigonal bipyramidal at the transition state. As the Pg-O-Pb bond gets
longer, the geometry around the leaving group returns to its original tetrahedral state, but
now with an inverted stereochemical configuration [73-75]. The matter of disagreement is
about the nature of the phosphoryl transfer, which might be associative involving a
metaphosphate-like PO32-, where bond breaking of the b,g-anhydride linkage takes place
when the nucleophile approaches, or dissociative, where bond making to the nucleophile
takes place before bond breaking (Figure 1.7A) [76, 77]. The difference between the
intrinsic hydrolysis and the GAP-assisted one is in the substrate used to activate the
catalytic water molecule involved in the nucleophilic attack: the intrinsic reaction relies in a
substrate-assisted mechanism, in which the g-phosphate itself acts as a base and activates
the nucleophilic water (w189), which in turn donates a proton to the O3 atom of the g-
phosphate. This primary protonation changes the electrostatic environment and promotes
a ~1.5 Å movement of the catalytic water (w175) coordinated to Gln61 towards the g-
phosphorous atom. In the new position, this water can form an H-bond with the primary
hydroxyl ion and exchange a proton with it, thus regenerating the original w189, or could
contact directly the g-phosphorous atom, forming a secondary hydroxyl ion. In either case
the result is the formation of the transition state and concomitant hydrolysis of the g-
phosphate (Figure 1.7B, left side) [23, 72, 78]. The influence of GAP in this process has
been a matter of discussion for a long time. One assumption is that GAP is confined to the
catalysis of a rate-limiting isomerization step in Ras, which becomes activated only through
its action but Ras is, on itself, an efficient GTPase [79]. A second assumption is that GAP
is directly involved in the hydrolysis process, providing crucial residues and stabilizing the
transition state.

1. Introduction
15
The true role of GAP is still
unknown but it was glimpsed
in the 90ies by the use of
metal-fluorides such as AlF3
[80, 81], or more recently,
MgF3- [82], both capable of
mimicking the transition state
of the phosphor-transfer
reaction. A representative
structure for the Ras-GAP
interaction is the one solved
for
HRas•Mg2+•GDP•AlF3•GAP-
334 in 1997 by Alfred
Wittinghofer and his team
(pdb: 1wq1) [83] and seems
to indicate that GAP has an
active role in the process by
providing a crucial positive
charge through the insertion
of an arginine side chain
(Arg789), often called
‘arginine finger’ into the
catalytic site of Ras, thus
neutralizing the developing
negative charges during the transition state (Figure 1.7B, right side) [84-86]. Arg789
coordinates to the O3 atom of g-phosphate and to the b,g-bridging oxygen. Its carbonyl
oxygen is H-bonded to the side chain NH of Ras Gln61, which also forms H-bonds to the
attacking water (w175) along with Thr35. The engagement of Arg789 stabilizes the
intrinsically mobile switch 2 region and works like a ‘trigger of a gun’ by acting on Gln61,
positioning it correctly in space and allowing it to extract an hydrogen atom from the catalytic
water, which can in turn, act as the nucleophilic substrate for the hydrolytic reaction [87].
Additional biochemical studies showed that the interplay between Arg789 and Gln61 is
crucial, as mutants of Gln61 show severely impaired GAP-mediated hydrolysis [88, 89]. It
is worth mention that the complete mechanism is far from being fully understood. In fact,
Figure 1.7. Molecular mechanism of the phosphoryl transfer reaction. A. There are two possible reaction paths through which the phosphoryl transfer reaction can happen, depending if the nucleophile attacks before (associative) or after (dissociative) P-O bond breaking B. Comparison of Ras catalytic environment for the intrinsic (left) and GAP-activated (right) GTP hydrolysis. In the first case, w189 makes two H-bonds, one with the O3 of g-phosphate and another with w175, the latter being held in place by Gln61 and Thr35. The second case represents the proposed transition sate for the complex Ras•Mg2+•GDP•AlF3•GAP-334. No H2O molecule equivalent to w189 is described in this structure (pdb: 1wq1). Instead, Arg789 acts as an arginine finger that ‘pulls the trigger’ in the reaction by forming two H-bonds, one with the O3 atom from g-phosphate and another with the bridging O atom between b- and g-phosphates. Adapted from [23].

1. Introduction
16
many Ras-like proteins lack the arginine finger during the GAP-assisted reaction.
RanGAP’s use a tyrosine instead, and RapGAP’s use a tandem switch 1 Tyr and an Asn
from GAP [90, 91].
1.1.5 Differential Dynamics of the Switch Mechanism
The multitude of crystal structures of the G domain tend to confer a misleading picture that
the switch regions are preponderantly fixed in space, either in a “closed” conformation, as
in GTP-bound Ras or when bound to effectors, or in an “open” conformation, as in GDP-
bound Ras, that disfavours effector binding. However, this is an inadequate or at least an
incomplete picture of the overall dynamics. In fact, 3D NMR spectroscopy has shown that
the switch regions of HRas•Mg2+•GDP are disordered and fluctuate in the nanosecond time
scale (Figure 1.8A) [92]. The topology of the fold of the solution structure (pdb: 1crp) is
identical to the crystal structure (pdb: 4q21 [30]), but the segments comprising switch 2 are
highly flexible (contrary to switch 1 that seems to be moderately restrained), suggesting the
presence of multiple conformations especially in switch 2 which provide an unprecedented
insight into the activation of the GTPase activity by GAP’s: when GAP binds to Ras, the
mobility of switch 2 is restricted and the catalytically active conformation becomes
stabilized. In its absence, the population of the active conformation is much lower due to
the continuous conformational fluctuations, hence the slower intrinsic GTP hydrolysis [28,
93]. Attempts have been made to determine the solution structure of wild type GppNHp-
bound Ras but due to chemical exchange broadening processes, most of the P-loop and
switch regions are undetectable [94]. However, solution structures of the mutant
RasT35S•Mg2+•GppNHp in which the slow conformational exchange is eradicated have been
recently obtained and show
that contrary to GDP-bound
Ras, switch 1 displays a
wide range of
conformational variety in
contrast with the moderate
changes of the switch 2 and
P-loop (Figure 1.8B) [95].
The dynamics of
RasT35S•GppNHp are
therefore fundamentally
different from RasWT•GDP,
Figure 1.8. Dynamics of the switch regions. A. Cartoon representation of the backbone superposition of the first 20 lowest-energy NMR structures of GDP-bound HRas (pdb: 1crp). switch 1 and switch 2 are coloured in pink and blue, respectively. B. Similar representation for the NMR structure of HRasT35S•Mg2+•GppNHp (pdb: 2lcf). Note the different mobility of switch 1 between the two structures. Adapted from [28].

1. Introduction
17
an observation that could not be easily done if considering only the ‘static’ crystal structures
[96]. Frequently, the switch regions are also found to be disordered in the crystal (i.e. they
do not show appreciable electron density). In some cases, where well-defined electron
density can be found, they often pack against neighbouring molecules. Such situation
prompts a careful examination of the structure: if a specific conformation of an intrinsically
disordered region is stabilized just because of packing forces, it should be regarded as a
crystallization artefact and not as a true structural feature. This effect is evidenced for
example by comparing two available structures of Ras•GDP: in the first one (pdb: 4q21,
[30]) there are extensive contacts with the neighbouring molecules and both switch regions
are well defined. In the second one (pdb: 1ioz, [97]) switch 2 is located next to a wide solvent
channel and shows no density. The difference makes evident that crystallization conditions
and the crystal environment have an influence on the study of mobile regions. The
equilibrium between the different states of the switch conformations in the GTP form is a
delicate balance, fine-tuned to transiently stabilize the active Ras sufficiently to allow
activation of downstream effectors without switching it off again via intrinsic GTP hydrolysis,
while allowing stabilization of the switch regions into the catalytically competent
conformation by the GAP proteins [98, 99].
1.1.6 Consequences of Ras Mutations
Specific point-mutations at one of three amino acid positions, Gly12, Gly13 and Gln61, are
able to turn Ras into a potent oncogenic protein, rendering it a driving force in the initiation
and proliferation of a significant set of human cancers [100]. A survey from the COSMIC
database shows that mutated Ras is present in more than 30% of all human tumours [101,
102], with an incidence level of more than 95% in pancreas carcinomas [103], 65% in colon
cancer [104], 46% in endometrial carcinomas, among many others [105]. The structural
mechanisms that potentiate oncogenic activity are well known. Glycine is the smallest
amino acid. Introducing any other side chain (even the small valine) in the confined catalytic
space leads to a steric clash with both Gln61 from Ras and the arginine finger from GAP,
disturbing the necessary spatial molecular arrangements for the GAP-assisted hydrolysis
[83]. This steric hindrance renders the G12 mutants insensitive to GAP, resulting in an
impaired GTP hydrolysis. The protein becomes then permanently locked in the active, GTP-
bound state, relaying permanent signals its downstream targets that culminate with the
permanent activation of specific signalling cascades such as MAPK, sustaining permanent
proliferation and differentiation [102]. The most frequently mutated isoform is KRas (86%),
followed by NRas (11%) and HRas (3%). The preponderance of KRas and the necessity to

1. Introduction
18
develop of isoform specific inhibitors is one of the reasons that led to the revival of the field
in the recent years [21, 106]. The most prevalent mutations at position 12 are G12D (36%),
G12V (23%), G12C (14%), G13D (7%) and Q61H (0.6%) [107]. Nevertheless, it was shown
that except for proline, any amino acid substitution at position 12 renders Ras oncogenic
[100, 108]. It is notwithstanding that any G12 mutation is in general tolerated in the ground
state of the Ras-GAP complex, meaning that the binding to GAP can still take place with
equal or only slightly decreased affinity compared to RasWT. However, the transition state
cannot be formed due to the above mentioned steric hindrances [109].
1.1.7 Partial Loss-of-Function Mutants
All Ras-driven cancers are a consequence of the constitutive activation of this protein. For
such reason the oncogenic mutants are also sometimes called ‘gain-of-function’. However
not all Ras mutations are gain-of-function. Particular relevance is given in this thesis to the
so-called ‘partial-loss-of-function’ mutants, which are capable of interacting only with a
specific subset of known Ras effectors [61, 110]. A common example is RasT35S: Thr35 is a
totally conserved residue in switch 1 (Figure 1.2) involved in the coordination to the Mg2+
ion and to the g-phosphate. Mutation to serine or alanine impairs the association of Ras with
the effectors Byr and RalGDS but not with Raf. The basis for such selection lies on the fact
that Thr35 interacts with the residue Lys52 of both RalGDS and Byr2 but it does not interact
with Raf [111, 112]. Another example is RasE37G (binds to RalGDS but not to Raf, [113]) and
the double mutant RasG12V/T35S. These differences are a preposition for the key role that
specific residues play in effector selectivity when Ras is constrained by a preferred
interaction site with respect to the membrane. Kinetic and stopped-flow analysis showed
that the interaction of RasT35S with Raf-RBD still follows a two-step mechanism, like the wild
type protein. However, the affinity to Raf is lowered more than 60-fold [51]. On the other
hand, similar experiments done with RasT35A showed that Raf association is a one step
mechanism and has a linear dependence on the concentration of Raf. The mutant can still
bind and form the weak complex but isomerization to the high affinity complex is impossible.
1.1.8 Probing the Bound Nucleotide: 31P NMR Spectroscopy
The main instrumental method used within the work conducted in this thesis is 31P NMR
spectroscopy. Phosphorous-31 is an active nucleus with a spin quantum number of I=1/2
and a natural abundance of 100%. 31P NMR is in general a very attractive tool for the study
of GNBP’s or any other biological molecular system containing phosphate groups. The
conformational modifications during the operation of the Ras molecular switch are

1. Introduction
19
accompanied by structural changes of the regions directly involved in nucleotide binding,
which can be followed and quantified by modifications observed in the 31P NMR spectra
such as chemical shift values, linewidths or relaxation characteristics. The peak areas can
be used as a direct measure of the relative populations of conformational states. The major
drawbacks of the method, however, are the high amount of protein needed (in the 0.5-1.5
mM range) and the rather long acquisition times due to the low magnetic susceptibility of
this nucleus (only 6.64% of 1H) [114, 115]. 31P NMR performed on Ras bound either to its natural nucleotide, GTP, or to non-
hydrolysable ones such as GppNHp at 310 K originates very simple spectra containing
three single lines labelled as a, b and g, one for each phosphate group. However, at 278 K
the situation is different: two distinct conformational sates (named as 1 and 2) represented
by different chemical shifts are obtained. These conformational states are actually only
defined when any guanosine triphosphate is bound (T) and may be different when
guanosine diphosphate is bound (D). To this respect, they are written within the conventions
of this thesis as states 1(T) and 2(T) or 1(D) and 2(D), whenever the nucleotide ligand is
concerned [67]. These states are in a dynamic equilibrium with exchange rates in the
millisecond time scale at low temperature. The relative population of 2(T) over 1(T) varies
among different Ras isoforms and mutants as it will be demonstrated in this thesis. For
HRasWT(1-189)•Mg2+•GppNHp state 2(T) was found to be 1.9 times more populated than
sate 1(T) [51, 116, 117]. At high temperatures (310 K), the exchange process obeys to the
fast condition and the two split signals of each phosphate coalesce into one, whose
chemical shift value is located at the population averaged position. The coexistence of the
two conformational states was also revealed by solid-state 31P NMR performed on Ras
crystals [118, 119] and
precipitated Ras [120]. Figure 1.9
shows a typical 31P NMR spectrum
of HRasWT(1-189)•Mg2+•GppNHp
(spectrum a). Upon addition of
Raf-RBD (spectrum d), s
tate 1(T) disappears and state
2(T) becomes stabilised. For such
reason this state is also described
as the effector binding state (i.e. it
corresponds to the population of
Ras whose conformation is
Figure 1.9. 31P NMR spectroscopy on HRas•Mg2+•GppNHp proteins. The spectrum of Ras wild type is shown (a), together with the state 1(T) mutant RasT35S (b). The protein complexes of RasWT•SOScat and RasWT•Raf-RBD are shown in (c) and (d), respectively. Taken from [125].

1. Introduction
20
selectively recognised by effectors) [117, 121, 122]. In contrast, state 1(T) shows more than
20-fold lower affinity towards effectors, as shown by 31P NMR, calorimetric and
fluorescence-based studies [123, 124]. Additional experiments demonstrated that it is
selectively recognized by GEF proteins, as revealed by strong line broadening of its
resonance line upon titration with SOS (spectrum c). For this reason, state 1(T) is
sometimes referred as the weak effector-binding or the GEF interacting state [125].
1.2 Drugging an Undruggable Protein
The frequency of Ras mutations in three of the four most lethal cancers (lung, colon and
pancreatic) has spurred an intense interest in developing inhibitors in the form of small
molecules capable of acting directly or indirectly in the oncogenic protein and quell its
permanent activation. This necessity was further increased in the 90ies when it was
discovered that alongside with its involvement in cancer, some KRas mutations in the
human germinative line can cause severe developmental diseases generally named
Rasophathies [126] and that result from direct Ras point mutations in different locations
(some common positions are 12, 13, 61, 14, 22, 26, 34,50, 58, 60, 152, 153, 156, all being
gain-of-function) [127], leading to conditions known as Noonan syndrome (NS) [128],
Costello syndrome (CS) [129], cardio-facio-cutaneous syndrome (CFC) [130], among
others [131, 132].
A tremendous effort was indeed devoted to the endeavour of finding effective inhibitors over
the last half century, with some ups, downs, and many frustrations along the way, dictated
by the fact this globular protein has no direct or obvious pockets where small molecules can
bind. For a long time Ras was considered to be undruggable [133]. However, since 2012 a
renaissance on the topic is taking place and the scientific research has never been as active
as nowadays, either at academic institutions or pharmaceutical companies. A very concise
description of the most common strategies used to turn off the aberrant molecular switch
will be presented in the following section. For an in-depth coverage of this topic the reader
is referred to a variety of recent and excellent review publications [17, 133-137].
1.2.1 General Strategies
Inhibitors of posttranslational modifications
As stated in section 1.1, these modifications are crucial for the intracellular trafficking and
attachment of Ras to the plasma membrane. The search of compounds that block its
lipidation at the C-terminus, catalysed by farnesyl transferase, was intensively pursued in

1. Introduction
21
the last century through the creation of specific inhibitors for this enzyme (generally called
FTI’s). Three of the most potent ones were Lonafarnib [138], Tipifarnib [139] and Salirasib
[140]. All have shown to be effective in HRas-driven cancer models in the pre-clinical setting
but ultimately failed in advanced human clinical trials against KRas and showed a serious
toxicity to normal tissues [141, 142]. The scientific interest for this approach was further
decreased in 1995 when it was found that cancer cells have mechanisms to bypass
lipidation on KRas and NRas, contributing to acquired resistance to this class of drugs [143].
Inhibitors for the interaction with GEF’s
Several inhibitors of GDP-to-GTP exchange GEF-catalysed reaction have been reported.
A peptide based on the aH helix of SOS1 was found to bind Ras in a cleft near the switch
regions with a KD= 158 µM. Although not very potent, further optimization of the helical
peptide is currently underway [144].
In 2012 two independent groups reported several KRas4b binders that were discovered
using fragment-based screening by NMR and have a similar mode of action [18, 145]: they
bind close to the a2 helix and b1 sheet in a pocket that is not readily observed in the ligand-
free structure of the protein. The pocket seems to be formed only upon binding of the
compounds by the movement of Tyr71 and Met67 out of the way, creating a primary and a
secondary binding cleft. All compounds tested bind to KRasG12D•Mg2+•GDP with KD values
in the low hundred µM range, and although not very potent, they revealed to be promising
candidates for further lead optimization. 31P NMR spectroscopic studies were conducted in
the framework of this thesis with some of these drugs and are presented in detail in section
3.2 of the results.
Inhibitors for the interaction with effectors
The direct inhibition of the interaction with effectors is a widely used strategy to prevent
aberrant signalling in oncogenic Ras. Within this group it is worth mentioning the
nonsteroidal anti-inflammatory drug called Sulindac sulphide and derivatives [146] which
were found to bind Ras at the Raf binding site and have a median inhibitory concentration
(IC) of 30 µM [147, 148]. Due to the fact that both switch regions are not visible in [1H-15N]-
HSQC NMR experiments, the exact binding place of this class of drugs is unknown but
thought to be close to switch 1 [147]. 31P NMR titration studies involving this drug are
presented in section 3.2.12 of the results.

1. Introduction
22
1.2.2 Recent Breakthroughs
A major breakthrough in the direct targeting of mutated Ras was achieved five years ago
when for the first time, small inhibitors that bind specifically and irreversibly to KRasG12C
were developed [149]. These compounds rely on the mutated cysteine residue for selective
binding and allosterically alter the preference of KRasG12C to favour GDP over GTP,
impairing at the same time the binding to Raf-RBD. The feat was achieved by attaching
different electrophiles to the b-phosphate of GTP that can covalently bind to Cys12 [150].
Further structural investigations by X-ray crystallography and affinity measurements
showed that upon binding of the drug, the switch regions assume an open, inactive
conformation, which is incompatible with effector binding [151]. The compounds are
especially relevant in the treatment of lung cancer as the G12C mutation is the most
prevalent one, occurring in 7% of these tumours [101]. At the same time, they provide a
useful conceptual framework to develop other compounds that could selectively target other
common Ras mutations such as G12D and G12V.
Another emerging area, although not in the scope of direct Ras inhibition, is the
development of ERK and Raf dimer inhibitors. The dimerization of ERK, triggered by the
activation of the MAPK pathway, is necessary for its extracellular function. Based on this
observation, in 2015 a water-soluble small compound named DEL-22379 was identified to
be capable of blocking the dimerization process and consequently to inhibit growth and
induced-apoptosis in cultured Ras mutant cancer cell lines [152]. At the same time, it was
discovered that dimerization of Raf is also required for normal Ras-dependent Raf
activation. On this basis a small peptide named Vemurafenib was developed and shown to
be efficient in the inhibition of Raf dimers [153]. Although this drug has limited efficacy
against tumours that possess constitutive Ras-independent, Raf-activating dimers [154], it
already has received FDA approval and shows a promising future.
1.2.3 Allosteric Inhibition: the Case of Zn2+-cyclen 31P NMR spectroscopic investigations revealed the existence of a dynamic equilibrium
between at least two different conformational states in Ras•Mg2+•GppNHp named 1(T) and
2(T), as mentioned in section 1.1.7. Based on these findings it was hypothesised that the
use of small compounds capable of shifting the equilibrium towards state 1(T) would
represent a novel approach in the antitumoural therapy against Ras. This hypothesises was
tested using the small drug Zn2+-cyclen, developed at our department and found to be
capable of recognizing and selectively stabilising state 1(T), impairing therefore Ras-Raf
association [155, 156]. Structural NMR experiments revealed that the compound binds in

1. Introduction
23
two different locations in the surface of the protein,
one at the nucleotide binding site, near the g-
phosphate and the other at the distal position, close
to the C-terminus, interacting directly with His166. X-
ray crystallography was also performed for the
protein-drug complex HRasWT•Mg2+•GppNHp•Zn2+-
cyclen and allowed its direct visualization bound at
His166 (Figure 1.10) but not at the second binding
site, close to the nucleotide. Analysis of the crystal
packing showed that the proteins in the unit cell were
in contact by means of the effector loops, lying face-to-face next to each other. The
concentration of Zn2+-cyclen used (25mM) was too low to overcome the crystal forces that
held the effector loop shut [157, 158]. Due to its ability to selectively recognise and bind a
specific conformational state, Zn2+-cyclen can be viewed as a parental drug and a lead
compound that can be used for the development of novel allosteric Ras inhibitors, capable
of selectively recognising rare conformational and functional states of the protein.
1.3 High Pressure Technologies in the Study of Protein Conformation and Dynamics
Proteins exist in solution in a dynamic equilibrium as an ensemble of conformers; they are
multiconformational entities designed by natural selection not just for the ground or native
sate but also for higher energy, non-native states involved in function, folding and unfolding
events. Multiple conformations are universal rather than exceptional [159].
The conformational landscape of a protein can be represented by the folding funnel model
(Figure 1.11A) [160] upon which the protein energy landscape can also be drawn [161] and
allows one to correlate conformation with function: the lowest energy state is depicted as a
global minimum and folding intermediates as local minima that can widely differ in depth
and shape. High energy intermediates populate the walls of the funnel. From this picture it
can be reasoned that all functional states of a protein need to be sterically possible and
have to coexist in solution, that is, the minimum number of folding intermediates is given by
the number of its functional states (however not all folding intermediates need to be
necessarily correlated to function) [125]. A similar reasoning arises by generalization of the
Wyman-Changeux theory for cooperative binding [162]. Despite from the fact that NMR can
be able to detect signals from the conformational ensemble in solution, the reality is that it
Figure 1.10. Electron density map showing the coordination of Zn2+-cyclen at the C-terminus of RasWT (pdb: 3l8y). Adapted from [157].

1. Introduction
24
reports a single structure,
close to the one in the crystal
[163] and neglects minor
conformers either because
the fluctuation is too rapid
(>103 s-1) or slow but rare.
One way to populate and
consequently detect these
low-lying intermediate and
excited states is by varying
physico-chemical
parameters such as pH,
concentration of a
denaturant, temperature,
etc. However, the drawback
is that it cannot be generally
assured that conformers under extreme conditions represent the same intrinsic conformers
in the absence of chemical perturbants [164, 165]. The alternative to this approach is to
apply pressure. Indeed, pressure leads to a shift of the population distribution based on the
simple ground that it favours a smaller volume for the system, as a direct consequence of
the Le Châtelier principle (i.e. it favours “excited” states, with lower free energy of
stabilisation at normal pressure). The effective volume of a protein in solution is given by
the partial molar volume that includes the volume of hydration water as it is inseparable
from the volume of the protein alone [166]. There are two ways through which the partial
molar volume can fluctuate when subjected to pressure (Figure 1.11B): one is within the
same subensemble of conformers (the case where the high-energy conformers are far
distant) and leads to a general compression of the system, where the population shifts
towards the lower-volume microscopic state but within the same subensemble. The second
case (generally more interesting for identification of rare states in proteins) is a shift of the
conformational equilibrium from the native subensemble (N) to a different, energetically
higher subensemble (I), both differing in their topology of folding and function [163, 167].
Figure 1.11. Physics of high pressure applied to biomolecules. A. Functional states of Ras and their relationship with the folding funnel. The free energy of the microstates is plotted for the two components of the conformational space. The native, lowest energy conformers corresponding to states 1(T) and 2(T) lie at the bottom of the funnel (the enlarged view of the bottom is depicted) and high energy states such as 3(T) populate its walls. B. Representation of the two possible ways through which a molecular system can attain a lower effective volume: by general compression within the same subensemble of conformer N or I (top) and/or by a shift of the equilibrium from N to I, in favour of the subensemble I with lower volume (bottom). Adapted from [160].

1. Introduction
25
1.3.1 31P HP NMR to Study Nucleotide-bound Ras Proteins
Pioneering work was done in our department over the years in the field of HP NMR to study
protein structure, conformation and dynamics. Some examples include the b-amyloid fibril
tangles [168], the HPr protein [169], the human prion proteins [170] and the Ras protein
[125, 171]. As shown by 31P NMR (section 1.1.7), HRasWT•Mg2+•GppNHp exists in a
dynamic equilibrium between at least two conformational subensembles denoted as states
1(T) and 2(T). Using HP, it could be demonstrated that this equilibrium can be shifted
towards state 1(T) in a reversible manner (Figure 1.12A): at 200 MPa the relative population
of state 2(T) over 1(T) at the g-phosphate decreases from 1.9 to 0.44 at 278 K. The
difference in the specific partial molar volume, DV, for the transition was found to be 17.2
mL mol-1 [125]. From the instrumental point of view, high hydrostatic pressure can be
transmitted to the sample inserted in the NMR spectrometer in two ways: either
automatically using a commercially available piston compressor [172] or manually, using
an in-house built high pressure line. Technical aspects prevent 31P HP NMR of being
performed automatically, therefore for the time being, this nucleus can only be recorded
using the manually operated pressure line whose main components are depicted in Figure
1.12B and include a water reservoir, a piston with a manually operating lever, a bourdon
manometer and at least two valves that can be used to open and close different parts of the
circuit. The protein sample is inserted in an especial NMR tube made of ceramic, capable
Figure 1.12. 31P HP NMR spectroscopy. A. 31P HP series of HRasWT(1-189)•Mg2+•GppNHp at 278 K, pH 7.4. The conformational transition from state 2(T) into state 1(T) can be observed at the g-phosphate by following the evolution of the relative integrals along the pressure series. B. Schematics of the in-house built manually operated HP line. C. Photograph of the autoclave and the HP ceramic NMR tube that is connected at the end of the line. D. Photograph of the HP line inserted through the magnet bore of an 800 MHz spectrometer. Adapted from [125].

1. Introduction
26
of withstanding very high pressures (up to 300 MPa, Figure 1.12C) and then mounted in an
autoclave which is a small piece of alloy specifically engineered to close the circuit and to
connect the ceramic tube to the HP line. The end of the line is inserted into the spectrometer
as shown in Figure 1.12D and pressure is applied by rotating the lever of the piston.
1.3.2 Rare Interaction States Detected by [1H-15N]-HSQC HP NMR Spectroscopy
Subsequent automated HP NMR investigations using heteronuclear [1H-15N]-HSQC
experiments were conducted on HRasWT bound to GppNHp [171] and allowed the
identification of additional rare states from which a more accurate picture of the
conformational landscape could be drawn: the Ras switch mechanism envisages at least
three states, corresponding to
complexes with GEF’s (state 1(T)),
effectors (state 2(T)) and GAP’s
(state 3(T)), which could all be
identified by fitting the 1H and 15N
pressure-induced chemical shifts and
cross peak volume changes (i.e.
distances between components) for
each amino acid with a second order
Taylor expansion. From the fitting
routine a fourth state came out,
corresponding to the nucleotide-free
Ras (represented as 1(0)). This
additional state can be envisaged as
the one that ‘closes’ the cycle. In
parallel, the pressure-dependent
chemical shifts were fitted with a
thermodynamic model, allowing the
determination of DG and DV values
for the transition between any two
conformational states at a given
temperature. By gathering the values
obtained for each amino acid and
grouping them in specific numeric
intervals with appropriate margins of
Figure 1.13. Pressure dependence of the conformational transitions. A. amino acids sensing different transitions are colour-coded in the crystal structure of Ras (2-to-1, 2-to-3, 2-to-0 are depicted in yellow, orange and pink, respectively. Residues sensing more than one transition at the same time are coloured in red. Residues that could not be detected are in green and residues showing no pressure response are in blue). B. Calculated thermodynamic model for the relative evolution of the population of states 1 to 4 with pressure. Taken from [171].

1. Introduction
27
error, it was possible to identify the residues that are involved in (or ‘sensing’) a specific
conformational transition. They were colour coded in the surface of the crystal structure as
shown in Figure 1.13A and reveal important information about the dynamics of the ‘hidden’
conformations. For example, all the orange residues are involved in the transition from the
ground state 2(T) to the excited state 3(T), whose population is very low at ambient pressure
(0.1 MPa), as indicated by the diagram in Figure 1.13B. This information constitutes the
basis of the mutational analysis on Ras performed in this thesis and presented in section
3.4 of the results: the main idea is that the substitution of an amino acid involved in a
particular transition (e.g. 2(T)-to-3(T)) could shift of the conformational equilibrium towards
the lowest populated state (3(T) in the present example), allowing its direct observation at
ambient pressure in the newly created Ras-mutant. Within this framework, the information
retrieved from HP guides the search for specific residues on the protein that are prone to
be involved in some kind of interaction with an otherwise undetectable, high-energy state.
This represents a novel method to detect conformational ensembles that are often the true
functional states of a protein and the ones involved in a specific disease or anomaly, instead
of the native one(s) commonly detected. As in the case of Ras, the development of drugs
that could directly bind at its surface and promote a shift of the equilibria towards a non-
native, low populated state, such as 3(T) (the GAP recognising state), would promote an
immediate increase of the GTPase activity of the protein and therefore lead to its
deactivation in Ras-driven cancer cells. The feasibility of this methodology has already been
shown with the mode of action of Zn2+-cyclen, capable of selectively binding and recognising
state 1(T) [157].
1.3.3 High Pressure Macromolecular Crystallography (HPMX)
Nowadays HP is used together not only with NMR but with almost all spectroscopic
techniques available, with the aim to understand the properties of matter and chemical
reactions. Its relationship with crystallography is also not new: the field has been very active
for many years in the study of the earth and materials science [173]. However, the situation
is different regarding biosciences. HPMX of proteins is still a technically challenging and
complex task that requires a great level of expertise. In Europe, it can be performed in very
few beamline facilities (Figure 1.14A) and its application was initially confined to the study
of deep sea organisms until very recently [174, 175].
HPMX can be performed either at cryo-temperature or at room temperature (RT). This
distinction has implications in the physico-chemical state for the protein. In the scope of this
thesis, the attention will be centred in the second case. RT HPMX can be performed using

1. Introduction
28
two techniques: the first one
is based on a beryllium
pressure cell [176] and the
second one is based in the
diamond anvil cell (DAC,
Figure 1.14B) [177, 178].
The development of the
DAC was a feat of technical
engineering, pioneered by
Roger Fourne, Eric Girard
and other experts in the field,
which contributed to the
routine collection of
macromolecular crystals in
the recent years [179-181],
showing that HPMX is a full-
fledged technique [182,
183]. During the DAC-based
data collection, the crystal
impregnated with mother
liquor is kept in between the
culets of the two diamonds
that constitute the DAC and
pressure is transmitted and
constantly maintained using
an inert gas (typically He). Its
major drawback lies in the cell geometry that imposes constrains on the data collection. The
aperture of the cell limits the rotation angle that can be scanned to a maximum of 85º.
However, this constrain can be compensated by the use of very bright X-ray sources (30-
40 keV) that contribute to increase the accessible reciprocal space and at the same time to
reduce the absorption of the diamond windows [184, 185].
It is worth mention that in the scope of HPMX, protein crystals should not be considered as
rigid systems. On the contrary, they are biphasic entities in which a solid phase, the protein,
coexists with a solvent phase made of channels that run across the crystal and represent a
total of 30-80% of its volume. The channels communicate with the surrounding liquid in
Figure 1.14. Instrumentation for HPMX. The technique requires especial diffractometers engineered to accommodate the high pressure cell. A. view of the 6-axis diffractometer located at the Crystal beamline in Soleil synchrotron, Paris. The DAC is mounted in the metallic block at the centre. The X-ray source (coming from the right side) needs to be perfectly aligned with the rotation axis. A close-up of the DAC mounted in the goniometer is shown in the right photograph. B. Components of the DAC evidencing the two diamond faces and a metallic gasket positioned in between the diamond culets. C. Lysozyme protein crystals: a) multiple impacts of the X-ray beam into a single crystal by translating the DAC by 50 µm every 10º. b) as alternative, multiple crystals can be loaded into the compression chamber. c) tiny diamond splinter introduced in the compression chamber to modify the orientation of the protein crystal with respect to the culets of the diamond. Adapted from [177, 178].

1. Introduction
29
which the crystal is grown and ensure that a true hydrostatic pressure is applied to the
protein. Most of the crystals are grown in low symmetry space groups, in monoclinic or
orthorhombic, lattices that difficult the generation of high completeness data. Furthermore,
the low aperture of the DAC poses additional difficulties in the application of the rotation
method. The problem can sometimes be solved by merging diffraction data from several
crystals and/or by introducing a tiny, X-ray transparent, diamond splinter (from a broken
anvil) within the sample cavity to change the orientation of the crystal with respect to the
diamond culets (Figure 1.14C).
Despite the large amount of crystallographic studies, HPMX has never been reported on
Ras. In an attempt to shed light into the unanswered question of why most ambient pressure
Ras crystals reveal only the “closed” conformation of the switch regions instead the
observed equilibrium between the “opened” and “closed” subensembles, (roughly
corresponding to states 1(T) and 2(T)), as detected by liquid and solid-state 31P NMR,
HPMX on RasWT was conducted in the framework of this thesis.
1.4 Research Goals of this Thesis
The focus of this thesis can be comprehensively divided into five main topics.
• Due to the increasingly interest by the scientific community on the dynamics and inhibition
of the full-length KRas isoform, a primary concern was to address the conformational
equilibria of this protein by means of 31P NMR and compare it directly with the wealth of
experimental data obtained for HRas. The primary intent of the study was to understand if
some of the structural and biochemical properties of HRas can indeed be transferred to
KRas. In the follow-up of these investigations, a series of experiments were devised for both
isoforms in order to gain insight into the perturbation of Ras-effector interaction by a typical
state 1(T) inhibitor such as Zn2+-cyclen.
• In the sequence of the gathered results, a systematic investigation on the inhibition of the
oncogenic KRasG12D•Mg2+•GppNHp protein by a series of 15 different compounds was
pursued. Their effect on the conformational equilibria of the protein was investigated by 31P
NMR and their ability to disrupt the Ras-Raf complex formation was inspected by ITC. The
main intent of the study was to shed some light into the mode of action of these drugs, to
score them according to their ability to modulate the conformational dynamics of the protein
and to demonstrate the usefulness of 31P NMR as a screening method that can be
applicable to all GNBP’s.

1. Introduction
30
• The investigation of the conformational dynamics of proteins by pressure perturbation is
a central topic at our department. Given our expertise and recent new instrumentation
available, a series of HP 31P NMR investigations were envisaged by starting first with the
study of the pressure effects on the isolated GppNHp nucleotide, in the absence and in the
presence of the Mg2+ ion, and following up to similar studies on RasWT and the mutants
T35S, G12V and D33K. Two main goals were set in this extensive study: the first was to
obtain a framework for the correction of the intrinsic pressure effects arising from the
nucleotide alone (that would be given by the HP measurements on the isolated GppNHp)
from the true effects arising from the conformational modification of the nucleotide-bound
protein under pressure. The second goal was to investigate how different Ras proteins
respond under pressure in terms of their equilibrium dynamics measured at the nucleotide
level.
• Taking together the present HP data and the past, 2D [1H-15N]-HSQC HP NMR
investigations established by our group, specific amino acids on the surface of Ras were
selected and chosen to perform site directed mutagenesis with the expectation that the
mutation could shift the conformational equilibria in the same direction as the one observed
from the HP investigations. A total of seven mutants were created de novo for the purpose.
Their conformational equilibria was screened by 31P NMR for the GDP-, GppNHp- and GTP-
bound nucleotides and their biochemical properties were analysed by ITC for their affinity
to bind the effector Raf-RBD and by HPLC for their intrinsic GTPase activity. The mutants
showing more drastic modifications comparatively to RasWT were further investigated by a
variety of methods including 31P NMR titrations, 2D [1H-15N]-HSQC NMR, T1 relaxation time
measurements, nanoDSF and HP 31P NMR. The ultimate goal of the proposed task was to
give a proof-of-concept for the use of HP as a screening method for rare states and to find
novel potential allosteric binding sites that could be targeted in the future by state-specific
Ras inhibitors.
• The last chapter of this thesis deals with a topic of great scientific endeavour: HPMX. The
motivation to perform HP crystallography on Ras arose in the first place as an attempt to
complement the HP NMR data and, secondarily, to try to solve an apparently contradictory
scientific mystery: the observation that Ras exists in solution as an equilibrium between two
conformational states, 1(T) and 2(T), which are equally detected when Ras crystals are
subjected to solid state 31P NMR but not detected when the very same crystals are used in
conventional X-ray crystallography.

2. Methods
“The strongest arguments prove nothing so
long as the conclusions are not verified by experience.
Experimental science is the queen of sciences and the goal of all speculation”
Karl Popper


2. Methods
33
2.1 Material
2.1.1 Plasmids
pTac
This vector was provided by Dr. Kühlmann from Max Planck Institute of Molecular
Physiology, Dortmund, and it was used for the expression in LB media of all Ras proteins
(WT and mutants). The expression was induced by the presence of isopropyl-β-D-
thiogalactopyranoside (IPTG), which binds the lac repressor, thus allowing the transcription
by the RNA polymerase. IPTG itself is not metabolized by the bacterial system.
pGEX4T1 (GE Healthcare®)
This vector carries an N-terminal glutathione S-transferase (GST) and a sequence encoding
ampicillin resistance. The 26 kDa GST-tag was used for purification by affinity
chromatography and accounts for increasing further the solubility of the expressed protein
during the purification. The vector was used in the expression of the catalytic domains of
the effector protein Raf-RBD and the GAP protein Neurofibromatin 1 (NF1-333). The
constructs were provided by S. Wohlgemuth and P. Stege from the Max Planck Institute of
Molecular Physiology, Dortmund.
pET14b (Novagene®)
This vector includes a T7lac promoter, ampicilin resistance and an additional N-terminal six
histidine tag (His6-tag) that allows the efficient purification of the recombinant protein by
affinity chromatography, being the tag cleavable with thrombin. The vector was used in the
expression of the GEF protein, Son-of-Sevenless (SOS).
2.1.2 Oligonucleotides
The nucleotide sequences listed below correspond to the primers designed to perform site
directed mutagenesis on HRasWT(1-166). They were manufactured either at Metabion AG
(Planegg) or Mycrosynth AG (Lindau) in the desired quantities and degrees of purity.
Table 2.1. Primers used in site-directed-mutagenesis to obtain the respective mutants. Mutation Primer sequence 5’- 3’ Mutant Name
C79G_T81G_antisense GGTCGTATTCGTCCACAAACTCGTTCTGGATCAGCTGGATG H27E C79G_T81G CATCCAGCTGATCCAGAACGAGTTTGTGGACGAATACGACC G97A_C99G_antisense GGAATCCTCTATAGTGGGCTTGTATTCGTCCACAAAATGGTT D33K G97A_C99G AACCATTTTGTGGACGAATACAAGCCCACTATAGAGGATTCC C78G_antisense GTATTCGTCCACAAAATGCTTCTGGATCAGCTGGATG N26K C78G CATCCAGCTGATCCAGAAGCATTTTGTGGACGAATAC
C280G_antisense TGCTCCCTGTACTGGTCGATGTCCTCAAAAGAC H94D C280G GTCTTTTGAGGACATCGACCAGTACAGGGAGCA

2. Methods
34
2.1.3 Bacterial Strains Used for DNA Cloning and Amplification
These strains inhibit the Lac/Tac promoter by the action of the Laclq- gene, preventing any
unwanted expression of the target gene from the transformed plasmids. They were used to
achieve high level multiplication of plasmids during the production of the transgenic protein
constructs.
E. coli TG1 (Lucigen)
Genotype: F’[traD36 lacIq Δ(lacZ)M15 proA+B+] glnV (supE) thi-1 Δ(mcrB-hsdSM)5 (rK mK
McrB-) thi Δ(lac-proAB).
One Shot® TOP10 Chemically Competent E. coli (Invitrogen)
Genotype: F- mcrA Δ(mrr-hsdRMS-mcrBC) φ80lacZΔM15 ΔlacΧ74 recA1 araD139 Δ(ara-
leu)7697 galU galK rpsL (StrR) endA1 nupG λ-.
DH5a™-T1® Chemically Competent E. coli (Thermo Fisher), as part of the SDM kit
Genotype: F- φ80lacZ∆M15 ∆(lacZYA-argF)U169 recA1 endA1 hsdR17(rk-, mk+) phoA
supE44 thi-1 gyrA96 relA1 tonA (confers resistance to phage T1).
2.1.4 Bacterial Strains used for Protein Expression
These strains were used with the purpose of obtaining the highest possible yields of the
desired constructs upon expression. They are specific protease deficient to avoid
degradation of the target recombinant proteins.
E. coli BL21 (Novagen)
Genotype: F- ompT hsdSB (RB- MB) gal dcm
The strain has no Laclq- gene, so that the induction by IPTG is only possible due to the
properties of the transformed plasmid. Otherwise there would be a basal/permanent
expression of the target construct, which can become a problem in some cases.
E. coli BL21 (DE3) pLysS (Novagen)
Genotype: F- ompT hsdSB (RB- MB) gal dcm (DE3) pLysS (CAMR)
As BL21, but with an additional DE3 element which codes for a T7-RNA polymerase and a
lac repressor. This allows a IPTG inducible expression if the transformed plasmid contains
a T7 promoter. Additionally, the strain is resistant to chloramphenicol and contains a pLys
G196A_antisense TGGTCCCGCATGGTGCTGTACTCCTCC A66T G196A GGAGGAGTACAGCACCATGCGGGACCA C116T_C117A_antisense ACCTGCTTCCGGTATAAATCCTCTATAGTGGGGTCGTATTCG S39L C116T_C117A CGAATACGACCCCACTATAGAGGATTTATACCGGAAGCAGGT A29T_antisense CCAACAACAACAAGCTTGTATACTGTCATAGAATTCTGTTTCC E3V A29T GGAAACAGAATTCTATGACAGTATACAAGCTTGTTGTTGTTGG

2. Methods
35
sequence that codifies the T7 lysozyme, capable of inhibiting the T7 RNA polymerase,
leading to an even stronger control of basal expression and a more stringent induction by
IPTG
E. coli CK600K (Stratagene)
Genotype: McrA-, sup E44, thi-1, thr-1, leuB6, lacY1, tonA21
2.1.5 Media and Antibiotics
2.1.5.1 Lysogeny Broth (LB)
LB is a rich medium that contains all the nutritional requirements for E. coli to support a high
cell density and maintaining growth in the logarithmic phase for an extended period,
resulting in good yields of plasmidic DNA and heterologous protein expression. Tryptone
and yeast extract are the sources of carbon, nitrogen, vitamins, minerals and amino acids
essential for growth.
Composition:
• 10.0 g bacto-tryptone • 10.0 g NaCl
• 5.0 g yeast extract • NaOH 0.1 g (pH 7.0)
Dissolved in 1.0 L Millipore H2O and autoclaved. The medium can be stored at 4 ºC for two
weeks or longer (if antibiotic is added). For bacterial platting, LB/Agar was prepared by
adding 15 g/L of bacteriological grade agar to the aforementioned medium. If the medium
had to be used immediately after autoclaving, care was taken to let it cool down to a
temperature suitable for addition of antibiotics without causing any degradation to them.
2.1.5.2 Terrific Broth (TB)
TB was mainly used for the overexpression of SOS. This medium contains slightly more
bacto-tryptone and 5 times more yeast extract than LB, providing large quantities of growth
factors and nucleic acid precursors. Glycerol was used as an additional source of
carbohydrates, having the advantage of not being metabolized into acetic acid, as it
happens with glucose (which, in some expression systems, also acts as a repressor). The
presence of phosphate buffer allows a better control of the physiological pH during the
exponential growth.
Composition of the TB buffer:
• 12.0 g bacto-tryptone • 24.0 g yeast extract
• 4.0 mL glycerine
Dissolved in 900 mL of Millipore H2O and autoclaved.
Separately, a phosphate buffer was prepared by dissolving 164.32 g of K2HPO4 and 23.13

2. Methods
36
g KH2PO4 in 1.0 L of Millipore H2O and autoclaved. It Is important to not autoclave the TB
buffer with the phosphate buffer added to it. Therefore, both components were autoclaved
separately and mixed afterwards at room temperature. This prevents the precipitation of the
phosphates, that undergo exothermic dissolution, by ionic metals (brought in trace
quantities from the yeast extract or tryptone) at high temperatures [186].
The final medium was prepared by adding 100 mL of the phosphate buffer to 900 mL of the
aforementioned TB buffer, to yield 1.0 L of TB medium ready to use.
2.1.5.3 New Minimal Medium (NMM)
NMM contains the minimum of nutrients that support the proliferation of cells and colony
growth. All amino acids, nutrients and complex molecules need to be built de novo by the
cellular machinery [187]. This is the medium of choice to express uniformly 15N and/or 13C-
labeled proteins needed to perform heteronuclear multidimensional NMR experiments.
In the scope of this thesis, RasWT and selected mutants were uniformly labelled with 15NH4Cl
with the aim to investigate their conformation and dynamics by 2D [1H-15N]-HSQC NMR.
Below are described the details of the procedure:
A – Preparation of minimal medium
MM contains a Carbon source which is typically glucose (or sometimes a less energy rich
sugar such as succinate) and different salts that provide essential elements (e.g. Mg, N, P,
S) and allow protein and nucleic acid synthesis by the bacteria.
Composition:
• 7.5 g Na2HPO4 • 0.25 g MgSO4 x 7H2O
• 3.0 g KH2PO4 • 0.014 g CaCl2 x 2H2O
• 0.5 g NaCl
Dissolved in 1.0 L of Millipore H2O and autoclaved. This medium can be stored for long
term usage at 4 ºC. Sodium phosphate dibasic and nitrogen dihydrogenophosphate act as
a source of Na, K and P and are simultaneously buffers for maintaining the pH during the
bacterial growth.
B – Preparation of a micronutrient stock solution (SL6)
This solution contains all the micronutrients needed for cell growth dissolved in 1.0 L of
Millipore H2O and autoclaved. The solution can be stored in the dark at 4 ºC for long term
usage.
Composition:
• 100 mg ZnSO4 x7H2O • 10 mg CuCl2 x 2H2O
• 30 mg MnCl2 • 20 mg NiCl x 2H2O

2. Methods
37
• 300 mg HBO3 • 30 mg Na2MoO4
• 200 mg CoCl2 x 6H2O
C – Preparation of the Iron sulphate/EDTA solution (SL4)
This solution needs to be freshly prepared and used shortly after.
Composition:
• 500 mg EDTA • 200 mg FeSO4 x 7H2O
Dissolved in a total volume of 90 mL of previously autoclaved H2O.
For a better dissolution and to avoid the occurrence of slight precipitation, the two chemicals
were dissolved separately and only then mixed together. The final solution is light green
coloured, typical of aqueous ferrous sulphate (green vitriol). As the oxidative process takes
place over time, formation of ferric sulphate will give rise to a deep yellow/green colour. At
such point, the solution should not be used any longer and a freshly one should be
prepared.
D – Preparation of a SL6/SL4 mixture (SL mix)
In this procedure 1.0 mL of the micronutrient (SL6) solution was added to 0.9 mL of the SL4
solution. The mixture was filled in up to a final volume of 10 mL using previously autoclaved
H2O.
E – Adding the SL mix to the minimal medium and the N and C sources
Final composition:
• 900 mL minimal medium
• 10 mL SL mix • 4.0 g Glucose
Filled up to a final volume of 1.0 L with previously autoclaved H2O.
NMM was ready to use after filtration. The amount of glucose and ammonium sulphate can
be adjusted accordingly to the growth demands of the bacterial strain. A minute amount of
thiamine, taken in the tip of a spatula was added to the medium prior to filtration. The active
form of this vitamin, thiamine pyrophosphatase, is a cofactor of enzymes involved in the
synthesis of three amino acids: valine, isoleucine and leucine. Its addition to the medium is
not essential but it can help to enhance the bacterial growth, especially in the case strains
such as DH5a, which are knocked out for thiamine synthesis (genotype: thy-) [188, 189].
2.1.6 Chemicals
All pro analysis grade chemicals were purchased from the following companies: Fluka (Neu-
Ulm), Merck (Darmstadt), Roche (Mannheim), Novabiochem (Läufelingen, Switzerland),
Roth (Karlsruhe), Pharma-Waldorf (Düsseldorf), Sigma (Deisenhofen), Serva (Heidleberg)

2. Methods
38
and QIAGEN. They were always analysed and used accordingly to their respective safety
datasheets. Metal(II)-cyclens were synthesized by the Organic Chemistry Department
(chair Prof. B. König) at Regensburg University.
2.1.7 Expendable Materials and Common Solutions
Table 2.2. List of the enzymes used. Enzyme Provider Alkaline Phosphatase Boehringer/Roche DNaseI Boehringer/Roche Lysozyme Sigma Thrombin Sigma Immobilized Alkaline Phosphatase MoBiTec Taq DNA Polymerase Fermentas, Quiagen, NEB PierceTM protease inhibitor ThermoFisher
Table 2.3. List of protein and DNA ladders used. Standard Provider PageRuler Unstained Protein Ladder Thermo Scientific/Fermentas PageRuler Unstained Protein Ladder Low Range Thermo Scientific/Fermentas Page Ruler Prestained Protein Ladder (10-180 kDa) Thermo Scientific/Fermentas 1 kb/ 100 bp DNA Ladder New England Biolabs (NEB)
Table 2.4. Commonly used buffer solutions. Buffer B 50 mM Tris/HCl pH 7.5; 5 mM EDTA; 5 mM DTE; 1mM PMSF Cell Lysis Ras Buffer C 32 mM Tris/HCl pH 7.5; 10 mM MgCl2; 1mM DTE IEX Ras Buffer D 64 mM Tris/HCl pH 7.5; 10 mM MgCl2; 400 mM NaCl; 2 mM DTE;
0.1 mM GDP SEC Ras
Buffer E 50 mM Tris/HCl pH 7.5; 2 mM DTE Nuc. Exchange Buffer F 40 mM Tris/HCl pH 7.5; 10 mM MgCl2; 2mM DTE Storage Buff Ras
Table 2.5. List of commonly used expendable materials.
Material Supplier
Bradford reagent Rotiquant™ Roth Cuvettes UV/Vis, macro, semi-micro and micro Carl Roth NMR tubes: • 3 and 5 mm Norell Inc. • 5, 8 and 10 mm Shigemi Co LTD Vivaspin ultrafiltration units Vivascience Filter unities Steritop™0.22 µM Millipore Eppendorf cups 0.5, 1.5 and 2.0 mL VWR Falcon tubes 15/50 mL (16000g) VWR Vivaspin® 20 concentrators (various sizes) Sartorious

2. Methods
39
2.1.8 Main Instrumentation
Table 2.7. Main instrumentation used in this thesis.
Instrument Supplier
Incubator EB 53 Juan Electrophoretic chambers GE Healthcare pH-Meter Φ 32, Φ 340 Beckman Coulter Thermocycler Mastercycler Personal Eppendorf Sonifier 250/450 Branson Ultrasonic machine (cell lysis) Branson Water system Purelab® Ultra, Elga Millipore J-6B, Avanti J-20, Avanti J-25 Beckman Coulter Biofuge Pico, mini Spin Hereaus Instruments Analytical Balance CP64, Sartorius PM 600 Mettler Beckman HPLC System Gold® 125 Solvent Module Beckman Coulter Beckman HPLC 166 Detector Beckman Coulter AKTA™ FPLC system, UPC 900, Frac 900 Amersham Pharmacia water systems Purelab Ultra, Elga Millipore UV/Vis spectrophotometer LambdaBIO+ PerkinElmer Microcal PEAQ-ITC Malvern Instruments Monolith NT.115 Series Nanotemper Techologies 2.0 KBar NMR Ceramic Cell Daedalus Innovations LLC 2.5 KBar NMR Ceramic Cell Daedalus Innovations LLC NMR Spectrometers 500 MHz Avance with QXI or 31P broadband probe Bruker Corporation 600 MHz Avance with Prodigy probe Bruker Corporation 800 MHz Avance with TCI-Cryoprobe Bruker Corporation Beamline ID09 ESRF synchrotron. Grenoble, France Beamline ID27 ESRF synchrotron. Grenoble, France “Crystal” Beamline Soleil synchrotron. Paris, France HP “ELMA” DAC cell Almax HP “ELSA” DAC cell Almax
Table 2.6. Most often used chromatography columns. Column Materials Supplier Hiload™ 26/10 Q-Sepharose™ Fast-Flow Amersham Pharmacia Hiload™ 26/600 Superdex™ 200 prep. grade GE Healthcare Hiload™ 16/60 Superdex™ 75 prep. grade GE Healthcare Superdex 75 10/300 GL GE Healthcare Glutathione Sepharose™ Fast Flow 4 GE Healthcare Pierce Glutathione Spin Columns (3 ml) ThermoScientific Ni Sepharose™ Superflow/Fast Flow 6 GE Healthcare Sephadex™ G25 NAP10/ NAP15/ PD10 Amersham Biosciences Nucleosil 100 C18 precolumn Beckman Coulter ODS hypersil C18 column Beckman Coulter

2. Methods
40
2.1.9 Software
Table 2.8. Most commonly used software. Software Manufacturer/URL Description Gold Chromatography V1.7 Beckman HPLC control and evaluation
UNICORN Control system Amersham Biosciences ÄKTA-FPLC control and evaluation
Topspin 3.2 Bruker NMR acquisition, processing and evaluation
AUREMOL2.4.1beta Uni-Regensburg/ Kalbitzer NMR processing and evaluation MestReNova 10.0 Mestrelab Research NMR processing and evaluation GENtle http://gentle.magnusmanske.de DNA and protein sequence analysis
PyMol https://www.pymol.org/ Protein visualization and structure analysis
Chimera 1.9 http://www.cgl.ucsf.edu/chi- mera/ Protein visualization Microcal Origin 6.0 http://www.originlab.de/ NMR Data analysis and statistics Origin 10 http://www.originlab.de/ NMR Data analysis and statistics Microsoft Office Microsoft Word processor and data analysis CorelDraw 16 Corel corporation Image editor Microcal PEAQ ITC Malvern Instruments ITC analysis software Online tools/Databanks Manufacturer/URL Description ExPASy Bioinformatic portal http://www.expasy.org/ Proteomics tool (very useful)
PDB Databank http://www.wwpdb.org/ Repository of X-Ray, NMR structures Uniprot http://www.uniprot.org/ Protein databank
BLAST https://blast.ncbi.nlm.nih.gov/Blast.cgi Basic Local Alignment Search Tool (very usefull)
2.2 Methods
2.2.1 Molecular Biology
2.2.1.1 Preparation of Chemically Competent Cells
E. coli can incorporate exogenous circular DNA molecules, commonly referred as plasmids.
One can take advantage of this feature and build specific plasmids containing genetic
information for desired proteins or parts of proteins. These can be introduced in bacterial
cells in a process called transformation. The transformed bacteria are called competent and
can transcribe the genetic information contained in the plasmid into proteins. Some natural
prokaryotes are genetically determined to be naturally transformable (e.g. Bacillus subtilis).
By contrast, many bacteria are poorly transformable, if at all, under natural circumstances.
E. coli falls in such category [190]. However, if E. coli cells are treated with high
concentrations of Ca2+ and then chilled, they become adequately competent, increasing
their ability to intake double stranded DNA. Inducing artificial competence is always a mildly
efficient process, yielding very few (approx. 106) transformants per µg of plasmidic DNA
[191]. This technique also makes it possible to transcribe genetic information from other
organisms into E.coli, a concept that allows, for example, the study of human proteins like
Ras, without the need of dealing with human material [191].
All material (flasks, pipette tips, etc.) were autoclaved and the conditions kept as sterile as

2. Methods
41
possible. The handling of the medium and bacterial growth was done in the absence of
antibiotics throughout the whole procedure. As result, especial care was taken to avoid
contaminations. Vortexing or hard shaking of the samples was also avoided to minimize cell
death.
Day 1
With the help of a toothpick, the frozen E. coli strains (BL21 and BL21DE3) from a -80 ºC
glycerol stock were directly plated in LB/Agar. The bacteria were allowed to grow overnight
at 37 ºC.
Day 2
Upon inspection, an individual (isolated) colony was picked and streaked again in a new
LB/agar plate. The culture grew overnight once more (this process can be repeated a third
time, if desired, to ensure that the final population on the plate arises from a truly, isolated
colony, characterized by a single genotype).
Day 3
A 5 mL LB culture was prepared by picking an isolated colony with a toothpick from the
double (or tripled) streaked plate. The culture was grown overnight at 37 ºC, 220 rpm.
Day 4
The overnight grown culture was diluted with 100 mL of LB medium. The corresponding
OD600 was 0.02. The cells were allowed to grow in the same conditions as before (37 ºC,
220rpm), until the OD600 reached a value of 0.4-0.5 (ca. 3 h). The growth stage of the
bacteria has a significant impact for its ability to take up DNA: in the log phase, they are
metabolically more active and prone to perform efficient DNA repair as compared with their
activity in the stationary phase. As a result, it is preferred to use bacteria in a log phase.
• At OD600= 0.4-0.5 the bacterial growth was stopped by keeping the cultures on
ice with gentle stirring for ca. 15 min.
•The cell culture was centrifuged 6-8 min. at 4 ºC, 4000 rpm. The supernatant was
discarded and the pellet re-suspended in transformation buffer 1 (TFB1).
10x TFB1 composition:
• 1.176 g KOH • 4.8 g RbCl
• 0.588 g CaCl2 • 4.0 g MnCl2
The pH was adjusted to 5.8 with 1.0 M HCl, in a final volume of 40.0 mL. Because of the
small amount of powder to be weighted, this buffer was prepared in a 10x concentration
stock solution, that can be stored for long periods of time. The buffer was diluted to 1x
before adding it to the cells. The resuspension of the pellet is a time-consuming process
and should be done slowly to avoid cell lysis.

2. Methods
42
• The re-suspended cells were left shacking on ice ca. 15 min. After the elapse of
this time, they were centrifuged again at 4000 rpm, 6-8 min, 4 ºC.
• The supernatant was discarded and the pellet was re-dissolved in TBF2.
5x TFB2 composition:
• 1.1 g CaCl2
• 0.121 g RuCl
• 0.21 g MOPS
The pH was adjusted to 6.5 with 0.1 M NaOH in a final volume of 20.0 mL.
The presence of CaCl2 accounts for the neutralization of the negative charges at the cell
surface and therefore to avoid electrostatic repulsion between the cell wall and the DNA
phosphate groups. At the same time the hypotonic transformation buffer solutions lead to
cell swelling and to the expulsion of some membranar proteins. Rb2+ and Mn2+ are reported
to have a complementary and enhanced effect as compared to the one of CaCl2 [192]. All
the components components become embedded in the cell wall and in the membrane,
creating “holes” through which the exogenous plasmids can enter the cell.
• The re-suspended cells were aliquoted in previously cooled Eppendorfs (100 µl),
flash frozen with liquid N2 and stored at -80 ºC.
2.2.1.2 Bacterial Transformation by Heat-Shock
In this process the exogenous genetic material is taken up by the competent cells by altering
their membranar fluidity upon a 0ºC-42ºC-0ºC heat shock sequence. The membrane
becomes momentaneously more fluid when exposed for a short time to a high temperature,
allowing the entrance of genetic material. The enclosed RbCl2 and MnCl2 salts detached
from the cell wall and plasma membrane it, leaving the artificially created open “pores”,
through which the plasmids can access the cytoplasm [190]. The detailed methodology is
presented below.
• An aliquot of the previously prepared competent cells was thawed on ice, the desired
plasmid was added (50-200 ng, corresponding to 2-10 µl) and mixed by inverting the
Eppendorf cup up and down (care was taken to not abruptly shake the mixture. Polystyrene
reaction tubes are to be avoided since DNA can adhere to their surface, reducing the
transformation efficiency). The mixture was incubated on ice for ca. 20 min. and subjected
to heat shock for about 30-60 seconds at 42 ºC (the exact time depends on the
characteristics of the bacterial strain used and should be optimized. The water bath should
be brought to the correct temperature before initiating the experiment). After the heat step,
the membrane was regenerated by placing the cells on ice for 2-8 min. Following heat

2. Methods
43
shock, the transformed E. coli were cultured in antibiotic free liquid medium for a short
period to allow expression of antibiotic resistance genes from the recently acquired plasmid.
Typically, 100 µl competent cells were incubated in 1.0 mL SOC medium and allowed to
grow at 37 ºC, 500 rpm for 1 hour. Rich media containing glucose and MgCl2, like SOC, is
recommended in order to maximize the transformation efficiency [192]. Afterwards the cells
were platted on LB/agar containing Ampicillin 1mg/mL (the plates were pre-warmed at 37
ºC and free of condensation). Typically, 50-100 µl of E. coli grown in SOC medium were
platted for BL21 and BL21DE3, as the process was generally very efficient. In other
situations, and when different bacterial strains were used, the quantity of cells platted was
optimized to produce a sufficient (but not too numerous) number of individual, distinct
colonies. When necessary, the cells cultured with SOC were pelleted by centrifugation for
5 minutes at 600-800 rpm and re-suspended in a smaller volume.
2.2.1.3 Plasmid Isolation and DNA Sequencing
Plasmids from transformed E. coli were isolated in order to evaluate their degree of
contamination and to scrutinize the correct DNA sequence of newly created Ras mutants.
The isolation was carried out using a standard, miniprep kit protocol from Promega™. The
methodology used strictly follows the protocol presented by the manufacturer of the kit and
it will not be discussed in detail here. The reader is submitted to the respective online
miniprep quick protocol [193]. The concentration of the isolated plasmids was typically in
the range of 20-100 ng/µl. When needed, larger amounts were also isolated (up to 600
ng/µl) using the midiprep kit from the same manufacturer [194].
All the isolated plasmids were sequenced at SeqLab GmbH (Göttingen). The minimum
amount required was 10 µl (150-350 ng). The sequencing of small constructs (up to 1000
bp) was performed by the standard Sanger method employing dideoxynucleotides, using a
5’-3’ (sense direction) primer located prior to the open reading frame (ORF) of the inserted
sequence. Constructs bigger than 1000 bp were stepwise sequenced, using different
overlapping primers.
2.2.1.4 Expression of Unlabelled Ras
Overexpression of wild type and mutants of H, K and NRas, either their truncated (1-166)
or full length (1-188/189) forms was accomplished according to Tucker et al. [195], using
either the 6K600K, BL21 or the BL21DE3 strains transformed with the pTac vector
containing a codifying region for antibiotic resistance to ampicillin. The 6K600K strain
contains an additional plasmid, accounting for resistance to kanamycin. Experimentally,
ampicillin was substituted in our laboratory by carbenicilin. The latter is a carboxyl based

2. Methods
44
analogue of the former (which has an amine group instead). The basis of the selective
growth inhibition is the same: both antibiotics become hydrolysed and therefore inactive by
b-lactamase, an enzyme expressed from the plasmid-borne bla gene, which is involved in
the synthesis and crosslinking of the peptidoglycan wall. However, b-lactamase is secreted
by the bacteria into the medium during their exponential growth and the resulting build-up
of extracellular b-lactamase can inactivate ampicillin present in the culture medium, thus
removing the induced selective pressure on the population. This affects liquid cultures
because there is always a portion of the population that is not transformed with the plasmid
and also agar platted cultures, as the ampicillin degradation leads to the appearance of
satellite colonies: very small groups of cells that have not incorporated the plasmid and
therefore can grow around a larger transformed colony. As the b-lactamase is released by
the main colony in its vicinity, more ampicillin is degraded by it and the satellite colonies
tend to strive. Carbenicilin, on the other hand, is not easily degraded by b-lactamase, thus
being a better choice as antibiotic [196].
Following is presented the methodology used for the expression of Ras proteins:
• From a -80 ºC glycerol stock containing the frozen bacteria, 200 mL LB containing 50
mg/mL of the appropriate antibiotic (carbenicilin and kanamycin in case of 6K600K and
carbenicilin alone in the case of BL21/ BL21DE3) were inoculated. This so-called pre-
culture was grown overnight, typically at 35-37 ºC (E. coli 6K600K) or 30 ºC (E. coli
BL21/BL21DE3), with a constant aeration and shaking velocity of 180 rpm. The detailed
methodology on the preparation of LB medium is described in section 2.1.5.1.
• In the second day, the overnight pre-culture was used to inoculate 10.0 L of previously
autoclaved LB medium containing 50 mg/mL of the appropriate antibiotics. For a better
handling of the volumes, the 10 L were always divided in 4 flasks of 2.5 L each. The cultures
were grown at constant aeration and speed, 180 rpm, 37 ºC. The OD600 was monitored by
optical photometry at specific time intervals. When the culture reached the exponential
growth phase (comprised by a OD600 value between 0.6-0.8 units), protein expression was
initiated by induction with 1.0 mM or 0.3 mM, depending on the E. coli strain used (6K600K
or BL21/BL21DE3, respectively) of the non-hydrolysable lactose analogue, IPTG. This
sugar binds to the lac repressor and promotes a conformational modification that hinders
its ability to regulate (repress) the promoter. This leads ultimately to the expression of the
Ras gene that is under control of the promoter sequence [190]. The induced culture was
allowed to grow overnight at 37 ºC (6K600K) or 30 ºC (BL21/BL21DE3), with a constant
speed of 180 rpm.

2. Methods
45
• In the third day, the culture now in the log phase, was harvested by centrifugation during
40-45 min, at 4 ºC, 4000 g. In order to better handle the 10 L volumes, the centrifugation
process was performed 3 times in fractions of 4 L each. The supernatant was discarded
and the bacterial pellet was directly stored at -20ºC until further use.
The studies comprising the mutational analysis of HRas(1-166) (see results section 3.4.2)
led to the de novo creation of several Ras mutant constructs using E. coli BL21. For each
individual construct, the optimal expression conditions related to expression time, IPTG
concentration of the induction, type of medium, temperature, aeration, and, if necessary,
the construct per se were optimized as best as possible.
2.2.1.5 Expression of 15N labelled Ras
Due to the economic costs involved in the expression of labelled proteins (arising
fundamentally from the high prices of 15N and 13C isotopes), all the HRas(1-166) constructed
mutants were optimized beforehand for the best possible expression yields. The advantage
of performing isotopic labelling lies in overcoming the ambiguity of resonance overlaps in
NMR, allowing an unambiguous assignment of the spectra, which would be impossible
otherwise for most proteins with a size beyond 10 kDa. Structural studies of large proteins
(>30 kDa) require triple-labelling 2H/13C/15N for the use of TROSY techniques [197]. In such
cases, bacteria must grow in D2O, usually causing a significant reduction on the protein
yield. The strategy taken on the present work to optimize the cell growth of 15N enriched
Ras focused primarily on increasing the cell density of the bacterial expression, without
manipulating the expression vector [198]. This was accomplished by selecting high-
expressing colonies and optimizing growth temperatures and times. Parameters such as
O2 levels, pH and nutrients were disregarded because they can be much better controlled
using a fermenter. By contrast, they are more difficult to control using a regular incubator
shaker, as the one used during this work. For this purpose, wild type Ras and selected
mutants were overexpressed in NMM – a “bare bones food” – containing a single source of
enriched 15N, added in the form of 15NH4Cl. The details regarding its preparation are
discussed in section 2.1.5.3. During the optimization process, the expression strategy is
determined by simulating a “isotope marked” expression in which the composition of the
media is the same, except for the isotope sources, which are the non-labelled ones, 14N-
ammonium chloride and 12C-glucose.
In the case of truncated RasWT and mutants such as D33K, H27E, T35S, the optimized
methodology is similar to the one used for the expression of the bacteria in LB (section
2.1.5.1). However, the expression of some variants such as the full length wild type KRas

2. Methods
46
isoform, have been more difficult to obtain in the amounts required for NMR spectroscopy,
despite the very good expression yields obtained in rich LB media. A very thorough
optimization study of the expression conditions for this protein in NMM is presently an
ongoing project at our department.
The typical methodology used for expression of 15N-labelled truncated HRas is as follows:
• From a -80 ºC glycerol stock containing the frozen bacteria, 100 mL of LB containing 50
mg/mL of carbenicilin were inoculated. The pre-culture was grown overnight at 30 ºC with
constant aeration and shaking at 200 rpm.
• In the second day, the overnight pre-culture was used to inoculate 5 L of sterile NMM
containing 50 mg/mL of carbenicilin. For a better handling, the volume was divided as 2x2.5
L in two Erlenmeyer flasks of 5 L maximum capacity. The culture was grown at 30 ºC, 200
rpm. After reaching an OD600 of 0.8-1.0, protein expression was initiated by induction with
0.28 mM IPTG.
Typically, the bacterial growth time is much longer in NMM as compared to the same
expression in LB. For example, the time necessary to reach an OD of 0.8 is around 3 hours
in LB and 7 hours in NMM. After induction, the cultures were grown overnight at 30 ºC, 200
rpm. For some Ras mutants (D33K, H27E) expression tests determined the best growth
temperature to be 25-28 ºC.
• At the third day the cells where harvested by centrifugation during 40-45 min, at 4 ºC,
4000 g. The supernatant was discarded and the bacterial pellet was directly stored at -20
ºC until further use. Cell lysis and the purification of the 15N labeled Ras proteins was
accomplished according to the same principle described for the unlabelled proteins (see
section 2.2.2.1).
2.2.1.6 Expression of the Effector Protein Raf-RBD
The catalytic domain of Raf-RBD (amino acids 51-131) was expressed in E. coli BL21(DE3)
as a GST fusion protein using a pGex-4T1 vector. The expression strategy follows the
methodology described in section 2.2.1.4 with minor modifications. Briefly, 200 mL of an
overnight grown pre-culture, containing 50 mg/mL of carbenicilin were used to inoculate 10
L of LB media containing also 50 mg/mL of carbenicilin. The culture was grown at 37 ºC,
180 rpm, until an OD600 of 0.6-0.8 was reached. At this point the growth was slowed down
and protein expression initiated by induction of 0.3 mM IPTG. Overnight incubation at 30 ºC
was followed by centrifugation of the culture media. The bacterial pellet was frozen and
stored at -20 ºC for further use. The cells were lysed and the protein purified by GST-tag
affinity chromatography (section 2.2.2.2.2).

2. Methods
47
2.2.1.7 Expression of the GAP Protein Neurofibromatin 1 (NF1)
The GAP protein NF1 (aa 1198-1531, 35 kDa), a negative regulator of Ras in signal
transduction, was expressed as a GST-fusion protein in E. coli. BL1DE3. The methodology
closely follows the one applied to the expression of Raf-RBD. Inoculation volumes,
incubation times and antibiotic concentrations are identical. The purification was
accomplished by GST-tag affinity chromatography (section 2.2.2.2.2).
2.2.1.8 Expression of the GEF Protein SOScat(W729E)
The ubiquitous SOS1 was expressed in E. coli BL21DE3 in the form of a Histidine tag fusion
protein using the pProEx HTb vector. Only the catalytic domain was engineered into the
expression vector (aa 566-1049, 55 kDa). The expression was carried in TB medium
(section 2.1.5.2).
• A 100 mL pre-culture was prepared by mixing 10.0 mL TB Buffer with 90.0 mL of
autoclaved TB medium, containing 50 mg/mL of carbenicilin. The medium was inoculated
with the transformed bacteria and the culture was allowed to grow overnight at 30 ºC, 200
rpm.
• 4.5 L of TB medium were autoclaved, followed by the addition of 500 mL of TB buffer,
while stirring under sterile conditions (using the laminar flow chamber). To the final medium,
50 mg/mL of carbenicilin were added and the overnight grown pre-culture was used for
inoculation. The 5 L volume was divided in 2x2.5 L in two Erlenmeyer’s of 5 L maximum
capacity. Protein expression was initiated at an OD600 of 0.5 by induction with 0.3 mM IPTG.
The culture grew overnight at room temperature with constant aeration and speed of 200
rpm.
• Upon overnight incubation, the cells were pelleted by centrifugation at 4 ºC, 4000 rpm and
the bacteria stored at -20 ºC until further usage. After cell lysis, the protein was purified by
Ni-NTA affinity chromatography described in section 2.2.2.3.2.
2.2.1.9 Polymerase Chain Reaction (PCR)
PCR was mainly used in the scope of this thesis to amplify the DNA sequence of newly
created Ras mutants through site directed mutagenesis (section 2.2.1.11). The details of
the amplification process (temperature, number of cycles, etc.) were followed according to
the instructions provided in the Geneart® Site-Directed Mutagenesis Kit [199]. The reader
is referred to the online website of the manufacturer (TermoFisher®) for additional
information. A brief description is present below:

2. Methods
48
• For a single PCR reaction, a pair of
oligonucleotides containing the desired
point mutation in the middle of the
sequence were used as primers (see
Table 2.1). They were mixed with 20-25
ng of plasmidic DNA from RasWT and the
deoxyribonucleotides (dATP, dCTP,
dGTP dTTP) were added alongside with
the thermostable DNA polymerase
provided with the kit. These four
components were gently mixed and
brought to a thermocycler. The general PCR setup is described in Figure 2.1. The
denaturation of the double helix was carried out for 2 minutes at 94 ºC, followed by the
annealing of the primers to the single stranded DNA at 57ºC for 30 seconds. The synthesis
of new DNA took place at 68ºC for 2.5 min. The full cycle was repeated 20 times. The PCR
reaction proved to be very effective in most cases. The newly amplified DNA was tested by
Agarose gel electrophoresis, purified if necessary, and used directly in the next stages of
the site-directed mutagenesis protocol.
2.2.1.10 Agarose Gel Electrophoresis
DNA electrophoresis was routinely carried to assess the quality of PCR products and the
purity of isolated plasmids. In this technique, nucleic acids are separated by their molecular
mass when subjected to a directional electric field. Their negative charge (due to the
phosphate groups of the DNA backbone) promotes their migration from the cathode
(negatively charged) to the anode (positively charged). The migration occurs in a polymer
matrix made of agarose. The presence of the gel meshwork hinders the progress of the
DNA, and small or compact molecules migrate more rapidly than large molecules. The
higher the concentration of the gel, the larger molecules are hindered. Consequently, gels
of different concentrations are used to separate molecules of different sizes. Ethidium
bromide (EtBr), 0.5 µg/µl, is added to the gel for the revelation of the DNA bands. Later in
our laboratory it was replaced by Midori green because it is not as health threatening as the
first one. Both compounds are dyes that can bind to the DNA fragments and fluoresce with
an orange colour under ultraviolet light. The excitation of EtBr can be done directly at 366
nm and indirectly at 254 nm. For Midori green, the excitation occurs at 490 nm. The medium
through which the electric current is conducted is either based on a Tris-borate-EDTA (TBE)
Figure 2.1. Overview of the PCR reaction used for the creation of Ras mutants. Times and temperatures used for each step were optimized accordingly to the size of the amplified plasmid and led generally to good amplification yields. The axes are not up to scale.

2. Methods
49
or on a Tris-acetate-EDTA (TAE) buffer. Both present their own advantages and
disadvantages. TAE is preferred when the DNA is to be used in subsequent enzymatic
reactions such as cloning experiments and it is a better conductor of electricity than TBE,
being ideal in long runs and in the separation of large fragments. Borat salts from TBE are
often inhibitors of many enzymes, which makes this buffer inappropriate if the DNA is to be
used in enzymatic reactions.
• 1% Agarose w/v was prepared by mixing 1.0 g of the powder with 100 mL TBE buffer.
Upon microwave heating until complete dissolution, the hot liquid was carefully poured in
an appropriate chamber and left at 4 ºC for faster solidification. TBE was normally prepared
in a 10x stock solution and diluted before usage to 1x (final 1x concentration: 89 mM Tris-
base pH 7.6, 89 mM Boric acid and 2 mM EDTA). TAE was rarely used (final 1x
concentration: 40 mM Tris/HCl pH 7.6, 20 mM acetic acid, 2 mM EDTA). The DNA samples
were mixed with a DNA loading buffer, previously prepared as a 6x stock solution (30% w/v
glycerol, 0.25% w/v bromophenol blue and 0.25% xylene cyanol FF). The mixture was
properly loaded into the electrophoretic chamber and the gel was run at a constant voltage
(100 V for TAE and 200 V for TBE), for approximately 30-40 min.
2.2.1.11 Site-Directed Mutagenesis (SDM)
In vitro site-directed mutagenesis is an invaluable method for glimpsing the complex
relationships between protein structure and function, for studying gene expression
elements, and for carrying out vector modifications. From the different approaches available
to perform this technique, the one chosen in the present work relies on the PCR
amplification using the double primer method [200]: for each mutant, two complementary
primers (30-45 nucleotides) were designed in such a way that they contained the desired
mutated codon in the middle of their sequence (Table 2.1). These primers were directly
mixed with the pTac vector containing the codifying sequence for HRasWT(1-166) and with
all the other necessary elements for the reaction, provided by the Geneart® Site-Directed
Mutagenesis kit, from Invitrogen® [199]. These included DNTP’s, the taq polymerase, DNA
methylase and its cofactor S-adenosyl methionine (SAM). All the components were directly
used and the protocol provided by the manufacturer was strictly followed. The reaction
yields were generally good and no additional purification steps were required at the end.
The mutated plasmids were used after the reaction to transform the highly competent
DH5α™-TTR-E. coli cells, also provided in the same kit. Upon bacterial growth the plasmids
were isolated and tested for the mutation through DNA sequencing using the Sanger
method.

2. Methods
50
2.2.2 Protein Biochemistry
2.2.2.1 Purification of Ras Proteins
Due to the different isoforms and Ras mutants that were studied in the scope of this thesis,
it is impossible to provide a detailed purification methodology for each one. Nevertheless,
most of the methodologies employed are common to all of them, with the exceptions on
details such as concentrations, temperature, salt gradients used, etc., which were
sometimes fine-tuned according to the characteristics of a specific mutant or changed more
drastically from truncated to full length Ras proteins.
2.2.2.1.1 Cell Lysis
All Ras proteins were expressed, secreted and folded into the bacterial cytoplasm. Because
they are not directly secreted into the surrounding medium, E. coli must be subjected to
disruption of their wall and membrane as a means to retrieve them. Some proteins however
are expressed as a form of inclusion bodies and therefore not secreted directly into the
cytoplasm or to the exogenous media. Although not being the case with Ras, the reader is
referred to the possibility of occurrence of this situation. In such cases, a purification in
denaturing conditions can retrieve the proteins from the inclusion bodies, provided that they
are able to re-fold into their native conformation [201].
In the case of Ras, cell lysis was accomplished by employing firstly a chemical disruption
strategy, followed by a mechanical disruption one:
• Using a 500 mL beaker, the frozen bacterial pellet from a 10 L LB culture was dissolved
in 200 mL of lysis buffer at room temperature, with constant stirring. The lysis buffer (buffer
B, Table 2.4), is prepared by mixing 32 mM Tris/HCl pH 7.5, 5.0 mM
Ethylenediaminetetracetic acid (EDTA), 2.0 mM Dithioerythritol (DTE) and 1.0 mM
phenylmethane sulfonyl fluoride (PMSF).
EDTA is capable of chelating metal ions with a +2-charge making them unavailable as co-
factors of some proteases and DNAses, leading to a reduction of the catalytic activity of
those enzymes. PMSF is a serine protease inhibitor. This compound is very unstable in
aqueous solutions, having a half-life of 110 min. at pH 7 and 25 ºC. Its activity is therefore
rapidly reversible. For more demanding cell lysates, the reader is referred to the alternative
AEBSF, an isomer with irreversible inhibitory activity. (Both compounds are neurotoxins and
should be handled with care) [202]. DTE is a sulphur containing sugar from the
corresponding saccharide erythrose, capable of reducing disulphide bonds of proteins and,
more generally, to prevent intramolecular and intermolecular disulphide bonds from forming
between cysteine residues [203]. DTT, an epimer of DTE with a slightly higher reducing

2. Methods
51
potential, can also be used with the same practicality. As a general rule, DTE was added to
all the intermediate and final storage buffers (typically in a 0.2 mM concentration).
• After resuspension of the bacterial cells, the beaker was placed at 4 ºC with constant
stirring and the chemical lysis process was initiated by adding lysozyme, 1.0 mg/mL. This
enzyme catalysis the hydrolysis of 1,4-b-linkages between N-acetylmuramic acid (NAM)
and N-acetyl-D-glucosamide (NAG) that comprise the peptidoglycan, leading to the
disruption of the bacterial wall [204]. For the next steps of the lysis, ca. 15-20 minutes were
waited before the addition of the next component to the cell suspension.
• After the elapse of the above-mentioned time, 8.0 mL of 6% Na-deoxycholic acid were
added to the 200 mL lysate. Deoxycholate is an anionic detergent that helps in the
denaturation and solubilisation of highly hydrophobic molecules and membranar proteins.
Its effect leads to a further disruption of the cell wall [205]. The suspension should have a
viscous appearance at this stage.
• In a last step, 20.0 mg per 100 mL of cell suspension of DNAse were added. This enzyme
catalysis the hydrolytic cleavage of phosphodiester linkages in the DNA backbone, thus
degrading the nucleic acids [206]. It was sometimes necessary to add a small amount of
Mg to the cell suspension, normally in the form of MgCl2 (from 2 to 10 µM), because the
active DNAse requires Mg2+ as co-factor. The cell lysate should have a fluidic, water-like,
behaviour by the end of this step. Whenever presented still with appreciable viscosity, some
steps of the chemical lysis were repeated (e.g. adding extra lysozyme and/or Na-
deoxycholate).
Perhaps because in most of the cases, mechanical and chemical lysis are redundant
processes, it is common practice when working with cell lysates, to use only one of them
and, generally, one will suffice for the intended purposes. Nevertheless, in the present work
a short mechanical disruption was always applied to the cells, to ensure complete
effectiveness:
• The beaker containing the suspension was brought on ice to an ultrasonic pulse device.
This method induces strong pressure changes and shear forces which lead to further
destruction of the cellular structure. Temporary heat spots on the sample are created in the
process, which can be harmful for the stability of the overexpressed protein. To prevent
that, the disruption was accomplished by keeping the cells all the time on ice and by
applying short pulse bursts (typically 5 pulses of 10 seconds each).
• Following the mechanical disruption, the bacterial fragments were separated by
centrifugation from the lysate containing the soluble cellular proteins. The process was

2. Methods
52
carried out at 4 ºC and at 50000-60000 g for ca. 1 hour. The clear, deep yellow supernatant
was brought to a clean Erlenmeyer and used immediately in the next purification step.
The lysis of the cells containing uniformly 15N-labelled overexpressed Ras followed the
exact same methodology.
2.2.2.1.2 Protein Precipitation with (NH4)2SO4
Cell lysates of overexpressed FL Ras proteins (aa 1-188/189) from a single 10 L cell culture
were typically subjected to (NH4)2SO4 precipitation to capture Ras at an early stage of the
process. This method was not applied to truncated Ras variants (aa 1-166) since, from
experimental evidence, they are not prone to precipitate as easily as the FL ones.
The solubility of globular proteins is normally increased upon addition of salt (< 0.15 M), an
effect termed salting in [207]. However, at higher salt concentrations, the protein stability
decreases leading to precipitation. This is commonly referred as salting out [208]. Salts that
reduce the solubility of proteins also tend to enhance the stability of the native conformation,
as opposed to salting-in ions which are usually denaturants. The mechanism of salting-out
is based on preferential solvation due to exclusion of the co-solvent (salt) from the layer of
water closely associated with the surface of the protein (hydration layer), which plays a
critical role in maintaining solubility and the correctly folded native conformation. There are
three main protein-water interactions: ion hydration between charged side chains (e.g., Asp,
Glu, Lys), H-bonding between polar groups and water (e.g., Ser, Thr, Tyr, and the main
chain of all residues), and hydrophobic hydration (Val, Ile, Leu, Phe). In hydrophobic
hydration, the configurational freedom of water molecules is reduced in the proximity of non-
polar residues. This ordering of water molecules results in a loss of entropy and is thus
energetically unfavourable. When salt is added to the solution, the surface tension of the
water increases, resulting in increased hydrophobic interaction between protein and water.
The protein responds to this situation by decreasing its surface area in an attempt to
minimize contact with the solvent—as manifested by folding (the folded conformation is
more compact than the unfolded one) and then self-association leading to precipitation.
Both folding and precipitation free up bound water, increasing the entropy of the system
and making these processes energetically favourable [208]. The increase in surface tension
of water by salt follows the Hofmeister series [209]. As an approximation, those salts that
favour salting-out raise the surface tension of water the highest. As (NH4)2SO4 has much
a higher solubility than any of the phosphate salts, it is the reagent of choice for salting-out.
The methodology is described as follows:

2. Methods
53
• After purification by IEX chromatography, the fractions containing Ras were identified by
SDS-PAGE and pooled together into a clean Erlenmeyer flask. Typically, their combined
volume was 400-500 mL.
• The amount of (NH4)2SO4 necessary to induce precipitation in a 3-3.5 M salt solution was
calculated (ca. 200-250 g for a 500 mL volume) and added to the pooled fractions in a
stepwise manner, with an waiting time of 15-20 min. between the next addition, (2-3 spoons
each time). The entire process took place with continuous slow stirring, at 4 ºC.
• HRas(1-189) precipitated at its maximum for a salt concentration of 3.1 M. When this
value was reached, the solution was completely slurry and further addition of salt had no
effect on the extent of precipitation (care was taken to not overcome too much this this
value, as the opposite effect – an increase in solubility – can sometimes happen).
• The slurry was centrifuged at 4 ºC, 20000 g, for ca. 40-50 min. The supernatant was
decanted and stored for further analysis by SDS-PAGE and the precipitated protein fraction
was slowly re-dissolved in the smallest possible volume of buffer D (typically 15-18 mL,
Table 2.4) and immediately used in the next purification step.
2.2.2.1.3 Ion Exchange Chromatography (IEX)
IEX is based on the electrostatic attraction between proteins in solution and charged groups
of the ion exchanger (a matrix with acidic or basic functional groups). The strength of such
interaction depends on the charge of these two partners, the dielectric constant of the
medium (D) and the competition from other ions for the charged groups of the ion exchanger
and protein. When the concentration of the competing ions is low, the proteins adsorb to
the ion exchanger. When it is high, the proteins are desorbed. The most common variation
of such interplay is the adsorption of target proteins from a buffer of low ionic strength,
followed by desorption with a buffer of high ionic strength. At higher concentrations of
competing ions, the proteins with the weakest interaction will be displaced first. There is no
general rule as to what salt concentration is needed to displace a protein with a certain net
charge from an ion exchanger. However, most proteins are eluted at salt concentration
lower than 1.0 M [210].
The physical mechanism behind protein binding to charged surfaces is not completely
understood and can be tentatively explained according to different models: In the simplest
approach, called the stoichiometric model of Boardman and Partridge [211], a number of
charged groups bind to the same number of oppositely charged groups of an ion exchanger.
In this process counter ions are released from both. This model assumes that one group on
the protein interacts with just one group in the ion exchanger.

2. Methods
54
In chromatography, substances alternate between being bound to the stationary phase and
moving in the mobile phase. The stationary phase in IEX is a column and the mobile phase
a buffer. A substance that spends more time in the stationary phase moves slower.
Substances that do not bind to the adsorbent are constantly in the mobile phase. They pass
through un-retarded and are, strictly speaking, not submitted to chromatography. This
happens when the ionic strength is so high that it eliminates the electrostatic attraction to
the ion exchanger and with molecules with no charge or a charge of the same sign as the
ion exchanger [210]. Other factors other than the net charge can influence IEX such as the
charge distribution on the protein surface, the nature of the particular ions on the solvent
(according to the Hofmeister series [209]) and non-electrostatic interactions with the ion
exchanger (hydrophobic interactions, H-bonding), the temperature and the presence of
additives such as organic solvents as for example acetonitrile (ACN) and methanol (MeOH)
leading to an increase of electrostatic interactions.
Ion exchangers consist of a matrix with either acidic or basic groups on the attached ligand.
The matrices can be roughly divided into hydrophilic and hydrophobic. Hydrophilic ones are
best suited for protein chromatography, since the interaction due to hydrophobic forces is
weak and proteins are often irreversibly adsorbed (or denatured in the process of
desorption) to hydrophobic matrices, such as polystyrene. Typical hydrophilic matrixes used
in IEX separation of proteins are agarose or sepharose. The latter was used in the present
work and is based on chains of agarose, arranged in bundles and with different degrees of
cross-linking to give a range of rigid, macroporous matrices with good capacity and low
nonspecific adsorption.
The functional groups substituted onto a chromatographic matrix determine the charge of
an IEX medium: basic ion exchangers are called anion exchangers and contain positive
groups. Acidic ion exchangers are called cation exchangers and contain negative groups.
Ras has a negative surface net charge at pH 7.5 and therefore binds to anion exchangers.
A strong anion exchanger was chosen for Ras purification: the quaternary ammonium (Q),
based on 90 µm agarose beads, with the –CH2N+-(CH3)3 functional group. Another group,
DEAE sepharose, (-CH2-CH2-N+-(CH2-CH3)2), is an example of a weak anion exchanger.
Similarly, weak (carboxymethyl - CM) or strong (sulphopropyl - SP) cation exchangers are
available, among many others. The reader is advised to consult an updated online list
provided by manufacturers [212].
It is worth mention that despite the ion exchangers being usually classified as weak or
strong, the name refers to the pKa values of their functional groups, and indicates nothing
regarding their ability to bind proteins. At pH values far from the pKa protein binding can be

2. Methods
55
equally strong to either a weak or a
strong ion exchanger. Strong ion
exchangers show no variation in ion
exchange capacity with change in
pH, remaining fully charged over a
broad pH range. A direct advantage
of a strong exchanger lies in the
sample loading (binding) capacity,
which is maintained at high or low
pH since there is no loss of charge
from the ion exchanger. Also, the
interaction mechanism is simple, as
there are no intermediate forms of
charge interaction. Most proteins
have a pI within the range 5.5 to 7.5
and can be separated on either
strong or weak ion exchangers. An
advantage of a weak ion exchanger,
such as DEAE (anionic) or CM (cationic) is that they can offer a different selectivity (i.e. the
ability of the system to separate peaks, the distance between two peaks) compared to
strong ion exchangers. A disadvantage arises from the fact that weak ion exchangers can
take up or loose protons with changing pH, their ion exchange capacity varies with pH.
Normally, the concentration of buffer salts during protein adsorption is low (10–50 mM).
Proteins adsorbed at a salt concentration too far below desorption concentration can be
difficult to desorb and some denaturation can occur. A suitable adsorption concentration
can be determined by simple test tube experiments (1-1.5 mL of ion exchanger were
equilibrated with the starting buffer and mixed for 1-2 min. with the sample equilibrated in
the same buffer. After centrifugation the supernatant was assayed for the protein to
determine the level of binding). The residence time on the column can also affect elution.
Proteins adsorbed to a column for prolonged periods may be more difficult to elute than
proteins desorbed shortly after adsorption.
Below is presented the methodology employed in the purification of Ras proteins:
• After cell lysis, overexpressed protein was purified using Q-Sepharose® Fast Flow™ from
GE Healthcare. Two columns of different dimensions were used, depending on the volume
of cell lysate: FL Ras was generally expressed in 10 L cell culture batches. The
Figure 2.2. Schematics of the experimental setup mounted for the purification of Ras proteins from a 10 L cell culture. After loading the 500 mL Q-sepharose column and washing the unbound molecules, a linear salt gradient was applied to it with aid of a peristaltic pump and at constant stirring: to the low ionic strength buffer C (left container) a high ionic strength buffer C + 800 mM NaCl (right container) was gradually mixed. The elution proceeded overnight using a fraction collector. The red line on the chromatogram indicates the percentage of NaCl during the overall process. The shaded area represents the sample injection volume. The chromatogram does not correspond to a real Ras purification, since the present setup has no detector for absorbance measurement at 280 nm. Adapted from gehealthcare.com

2. Methods
56
corresponding 300-380 mL cell lysates were loaded into a 500 mL column (herein defined
as column A). Truncated Ras proteins were generally expressed in 5 L batches and the
corresponding 150-180 mL cell lysates were loaded into a 280 mL column (herein defined
as column B). Both columns were previously equilibrated with 3-5 column volumes (CV) of
buffer C (32 mM Tris/HCl pH 7.5, 10 mM MgCl2, 2 mM DTE).
Column B was mounted on a AKTA-FPLC system. The development of the method was
done from scratch in this case (from the building of the column to the details of the run) and
care was taken to make the process as automated as possible. Column A, due to its bigger
dimensions, could not be mounted on AKTA. In such case, the purification was handled by
‘manually’ setting up a chromatographic separation system inside a 4 ºC refrigerated room.
The schematics of the setup are presented in Figure 2.2.
• The clear cell lysate was loaded at low flow rates (ca. 1.5-2.0 mL/min.) to increase the
residence time and to avoid high backpressure (especially in column B). Unbound material,
including neutral or positively charged molecules was washed with 2-4 CV of buffer C.
• The elution of Ras proceeded by two different methods, according with the type of column
used. In both cases a salt gradient elution was done by using Buffer C in the presence of
800 mM NaCl. Column A was eluted with a linear salt gradient mostly due to the limitation
of the available experimental setup (Figure 2.2) and column B was eluted using a step
gradient profile, previously optimized. Often, a small-scale test tube experiment was
performed for a specific Ras mutant and the steps of the gradient were slightly adjusted if
necessary. Figure 2.3 shows the step gradient used in the purification of truncated HRasD33K
as general example. The eluted fractions were collected overnight with a fixed volume of
18-20 mL (column A) and 12 mL (column B).
• The collected fractions were analysed by SDS-PAGE and immediately used in the next
purification step.
• After elution both exchangers contained some material bound (often denatured or
precipitated proteins). They were regenerated
by extensively running a 2.0 M NaCl solution at
low flow rates during 2-3 CV, followed by a
thorough washing with 5-10 CV of ultrapure
H2O. Periodically (every 5 runs or so), the
columns were further cleaned with NaOH 0.5-
1.0 M at room temperature, followed by water
and 50% ethanol (EtOH) to remove lipoproteins
and lipids. Blank runs, in which only buffers, but
Figure 2.3. Representative Ras elution profile from IEX using a NaCl step gradient with volume fractionation. The peak surrounded by the dashed lines corresponds to the elution of RasD33K.

2. Methods
57
no sample, are applied to the columns were also performed periodically (every 10 runs) to
determine the presence of the contaminants after a cleaning protocol
• Finally, the columns were transferred to 20% EtOH for storage to avoid stagnation and to
minimize chance of microbial growth. After a long period (more than 5 weeks), they were
opened on the top and recirculation or agitation of the resin was performed with the aid of
a glass rod.
2.2.2.1.4 Size Exclusion Chromatography (SEC)
Gel filtration, also called size exclusion chromatography is a method that separates
molecules according to their differences in size, as they pass through a matrix packed in a
column. Unlike ion exchange or affinity chromatography, molecules do not bind to the matrix
so buffer composition does not directly affect the resolution (degree of separation between
peaks). In addition to separate molecules by size, SEC has proven to be a valuable tool for
a variety of applications, especially to determine the molecular mass of macromolecules,
despite the diversity of available methods (mass spectroscopy, dynamic light scattering,
analytical centrifugation, etc.) due to its versatility and ease of establishment in a modern
laboratory by integration with an AKTA system (Figure 2.4). It can also be used for desalting
a reaction mixture, purification of a monomer from a multimer, and to study protein-protein
interactions. SEC can be used in group separation mode to remove small molecules from
a group of larger molecules and as simple solution for buffer exchange or in fractionation
mode, to separate multiple components on a sample based on their Mw. Different factors
affect the resolution in SEC (i.e. the degree of separation between peaks): sample volume,
sample-to-column volume ratio, column dimensions, particle size, packing density, pore
size of the particles, flow rate and viscosity of the sample and buffer. The sample volume is
expressed in terms of percentage of the total column volume (packed bed). Generally, the
application of a sample volume between 0.5-4% of the packed bed is recommended for
peak fractionation. The capacity of the SEC separation can be increased by concentrating
Figure 2.4. General schematics of the AKTA FPLC system. Adapted from “GE imagination at work”.

2. Methods
58
the samples to be injected, although concentrations above 70 mg/mL are not
recommended. The height of the packed bed increases both, resolution and the time of the
run. However, a common problem of increasing bed height is the build up of back pressure
due to the tightly packed media.
The materials presently used for SEC are based on silica, hydrophilized vinyl polymers, or
highly crosslinked agarose with bead sizes typically between 5 and 50 mm. The selectivity
of the medium depends solely on its pore size distribution. For the present work, the medium
of choice was Superdex™, a highly cross-linked porous agarose to which dextran was
covalently bound. Depending on the sample volume, two SEC columns of different bed
heights were used for Ras purification: 120 mL Hiload Superdex 26/60 75 PG, with a
separation range between 3-70 kDa at a flow rate of 1.5 mL/min. and a 300 mL Hiload
Superdex 26/600 200 PG with a separation range between 10-600 kDa at a flow rate of 2.2
mL/min.
Following ion exchange chromatography (section 2.2.2.1.3), the fractions containing the
Ras protein were pooled and concentrated by ultracentrifugation or subjected to (NH4)2SO4
precipitation.
• typically, ca. 5 mL of concentrated sample were manually injected (by using an adequate
loop) into a superdex 26/60, previously equilibrated with buffer D (40 mM Tris/HCl pH 7.4,
10 mM MgCl2, 400 mM NaCl, 2 mM DTE, 0.1 mM GDP, Table 2.4). A safety upper pressure
limit on the AKTA pump system was set to 0.4 MPa and the isocratic elution initiated with
the same buffer. 3.0 mL fractions were collected after 0.2 CV, until a total length of 1.4 CV.
This process was repeated 4 or 5 times for the complete purification of the 20-25 mL of the
initial protein mixture.
• Typical SEC chromatograms led to the straightforward identification of the Ras proteins,
in single, narrow peaks. The fractions underlying the peak area were pooled and
concentrated up to a final value of 3.6 mg/mL (2.0 mM). When the identification of Ras by
simple evaluation of the chromatogram was ambiguous, a final SDS-PAGE was performed.
• The pure, concentrated Ras proteins dissolved in buffer D were shock frozen in liquid N2
and stored at -80ºC in 500-600µl aliquots until further use.
• The SEC columns were cleaned according to the same protocol used for IEX (section
2.2.2.1.3). In cases of severe contamination the flow was reversed and the cleaning
procedure applied.

2. Methods
59
2.2.2.2 Purification of Raf-RBD and NF1
Raf-RBD and NF1 333 were both expressed as GST-fusion proteins in E. coli BL21DE3.
The purification methodology used follows the same principles for both proteins
2.2.2.2.1 Cell Lysis
• The frozen cell pellet from a 10 L cell culture was re-suspended in 200 mL of lysis buffer
(50mM Tris/HCl pH 7.5, 250 mM NaCl, 5 mM EDTA, 1mM PMSF, 5mM DTE). NaCl is an
important stabiliser of both proteins. During the lysis, its concentration was gradually
increased overtime, from 250 mM up to 300 mM.
• The cell pellet was left stirring at room temperature for ca. 15 min. until complete
dissolution. The mixture was then kept at 4 ºC with constant, slow stirring. The chemical
and mechanical cell lysis was carried out as described elsewhere (section 2.2.2.1.1).
• After lysis, the cell fragments were sedimented by centrifugation at 4 ºC, 25000g for ca.
30 min. The yellow coloured supernatant was decanted from the bacterial precipitate and
brought immediately to a 25 mL glutathione sepharose column.
2.2.2.2.2 Affinity Chromatography: GST Fusion Purification
Glutathione-S-transferase (GST) fusion proteins are purified by affinity chromatography
using glutathione (GSH) immobilized to a matrix such as sepharose. The binding of a GST-
tagged protein to the GSH ligand is reversible, and the protein can be eluted under mild,
non-denaturing conditions by the addition of reduced GSH to the elution buffer. This
technique provides a mild purification process that does not affect a protein’s native
structure and function. Figure 2.5 shows a schematic representation of the terminal
structure of GSH sepharose.
One of the most important parameters affecting the
binding of the GST protein to the solid matrix is the
flow rate at which the protein loading is performed.
The binding kinetics between GSH and GST is slow,
thus it is important to keep a low flow rate (normally
lower than 1mL/min.). Washing and elution can be
performed at a slightly higher flow rates to save time
(2-3 mL/min. using GST sepharose™). The yield of
the fusion protein in pure samples can be estimated
by A280, giving that the concentration of the GST tag
is approximately 0.5 mg/mL for 1 unit of absorbance.
Figure 2.5. Terminal structure of Glutathione Sepharose. Glutathione is specifically and stably coupled to Sepharose by reaction of the SH-group with oxirane groups obtained by epoxy-activation of the Sepharose matrix. The structure of glutathione is complementary to the binding site of glutathione S-transferase. Adapted from GE.healthcare.

2. Methods
60
The methodology used for the two proteins is presented bellow:
• The corresponding cell lysate was loaded into a 25 mL GSH sepharose® fast flow™
column, previously equilibrated with 3-4 CV of 50 mM Tris/HCl pH 7.5, 250 mM NaCl and
5mM DTE. The sample was loaded at a flow rate of 0.8 mL/min. with the help of a peristaltic
pump. The entire process took place inside of a 4 ºC room. Due to the big volume involved
(150-200 mL), the AKTA system was not used for the loading of the lysate into the column.
• After protein loading, unbound material was removed by equilibration with the same buffer
during 5 CV at 0.8 mL/min.
• The cleavage of either Raf-RBD or NF1 from the GSH column was done by the addition
of 10U of thrombin per 2 mg of fusion protein (estimated by A280 - thrombin has a specific
activity higher than 7500 U per mg of protein. 1U of this protease will digest more than 90%
of 100 µg of a test fusion protein in 16h at 22ºC). Cleaving of the fusion protein was allowed
to proceed ‘on the column’, overnight at a very slow rate (0.3 mL/min.). The circuit was
closed by connecting the top end to the bottom end of the column. The continuous re-
circulation of the mobile phase through the system was ensured by a peristaltic pump.
• Following up next day, the closed circuit was opened and the final protein (Raf-RBD or
NF1), now cleaved from GST, was immediately collected into 3 or 4 fractions of 25 mL each,
using the same buffer as above.
• The GST bound protein was removed from the column by washing with 6M guanidine
hydrochloride (GdmCl), 4-5 CV, followed by 5-10 CV of ultrapure H2O.
• Oxidized GSH sepharose was restored by equilibrating the column with a 30 mM reduced
GSH solution in 100 mM Tris/HCl pH 7.5, for at least 2 CV. (Note that reduced GSH is
acidic. The pH was properly adjusted with NaOH during the preparation of this solution).
Finally, excess of GSH was removed by equilibration with ultrapure H2O, rendering the
column ready to be re-used. For long term storage, the column was equilibrated with 20%
EtOH.
• All the fractions (equilibration, protein loading, elution, column recovery) were stored
during the entire process and analysed by SDS-PAGE.
In the final polishing step, both Raf and NF1 were further subjected to SEC chromatography
to separate them from thrombin and other possible impurities. The pure protein fractions
were aliquoted in 200 µl fractions, shock frozen in liquid N2 and stored at -80 ºC. Raf-RBD
is very stable and was stored in high concentrations, up to 6.5 mg/mL (7 mM). However,
NF1 has a rapid degradation time. In fact, NF1 cannot withstand room temperatures and
the purification process needs to be accomplished in the shortest time possible to avoid
further degradation. Care was taken while concentrating the protein to avoid further losses.

2. Methods
61
From experimental evidence, the protein cannot be concentrated to higher values than 0.6-
0.7 mM (21-24 mg/mL), otherwise precipitation will occur.
2.2.2.3 Purification of SOScat(W729E)
The catalytic domain of SOSW729E was expressed in E. coli BL21DE3 in the form of a
histidine-tag fusion protein (His-tag).
2.2.2.3.1 Cell Lysis
The pelleted cells from a 5.0L E. coli culture were dissolved in 100 mL of 25 mM Tris/HCl
pH 7.5, 500 mM NaCl, 20 mM imidazole, 1mM PMSF and 2 mM b-mercaptoethanol.
Chemical and mechanical cell disruption was accomplished according to the steps
described above for the cell lysis of Ras proteins (section 2.2.2.1.1). By the end of the
process, the cell suspension was subjected to centrifugation at 4 ºC, 50000g for approx. 50
min. The clear cell lysate was decanted from the bacterial pellet and loaded immediately in
a Ni-NTA affinity column.
2.2.2.3.2 Affinity Chromatography: Histidine-Tag Methodology
Recombinant SOS contains a tag with six histidine residues (histidine6) that feature a high
selective affinity for Ni2+ and several other metal ions (Zn2+, Co2+) capable of being
immobilized on a chromatographic media using chelating ligands. Consequently, a protein
containing a His-tag will be selectively bound to metal-ion-charged media such as Ni-
Sepharose®, while other cellular proteins will not bind or will bind weakly. Column
equilibration, protein loading and elution takes place in a similar way as described above
for GST-fusion proteins (section 2.2.2.2.2). The elution step is performed in the presence
of imidazole that competes with the recombinant protein for binding to the Ni2+ ions.
Equilibration and sample buffers are normally complemented with a low concentration of
imidazole to reduce the non-specific binding of host cell proteins and the elution can be
done as a linear gradient of Imidazole concentration or as a step-gradient. The method of
choice should be adjusted beforehand and the final concentration of imidazole to be used
is dependent on the characteristics of the recombinant protein. As a general rule, 500 mM
imidazole ensures a complete elution of most His-tagged proteins. An alternative is a pH
dependent elution that works on the basis that at pH values close to 4.5, the metal ions will
be stripped out from the medium. The choice of this alternative depends of course on the
tolerance of the protein for low pH values. Chelating agents such as EDTA and EGTA are
to be avoided in this chromatographic process as they can strip down the metals from the

2. Methods
62
column.
The strategy used in SOS purification is described as follows (the complete work was
performed in a 4 ºC refrigerated room):
• A 5.0 mL Ni-Sepharose® column connected to a peristaltic pump was equilibrated with the
lysis buffer above mentioned (25 mM Tris/HCl pH 7.5, 500 mM NaCl, 20 mM imidazole,
1mM PMSF, 2 mM b-mercaptoethanol), followed by protein loading and removing of
unbound material (15-20 CV) with the same buffer at a very low flow rate (0.3-0.5 mL/min.).
• Elution of SOS was accomplished in a single step by preparing a buffer containing 25 mM
Tris/HCl pH 7.5, 500 mM NaCl, 2mM b-mercaptoethanol and 500 mM imidazole.
• After elution, the column was regenerated by washing with 10CV of biding buffer.
All the fractions were collected and analysed by SDS-PAGE. Fractions containing SOS
were pooled, concentrated and purified by SEC that in this case served two purposes:
further purification and polishing from minor contaminants and change the final buffer of the
protein, allowing the removal of the high imidazole concentration. Collected fractions from
SEC were analysed by SDS-PAGE, pooled, concentrated up to 16 mg/mL (0.3 mM) and
aliquoted in 200 µl fractions. The protein was shock frozen in liquid N2 and stored at -80 ºC.
The final storage buffer (after SEC) was 40 mM Tris/HCl pH 7.5, 10 mM MgCl2, 2 mM DTE,
150 mM NaCl.
2.2.2.4 Nucleotide Exchange Reactions
Recombinant Ras is obtained in the GDP-bound form. Although, to study the structure,
dynamics and conformational equilibria of other nucleotide-bound forms, a simple but
reliable methodology for exchanging the nucleotides was developed. The same
methodology and can also be applied to other GNBP’s such as Rap and Arf.
2.2.2.4.1 GDP Against GppNHp
There are two different ways to accomplish this task. The first one can be considered the
‘classical’ method of exchanging the protein and involves an overnight incubation of Ras
with alkaline phosphatase (AP). Because both proteins are mixed in a solution, the main
disadvantage of this method lies in the difficulty of completely separating both, Ras and AP,
by SEC at the end. This was especially problematic for Ras samples that were studied by
HP NMR, where sometimes fast hydrolysis of the bound GppNHp was observed and
resulting from contamination with AP, even if residually present in the sample.
In an attempt to solve this problem, a second methodology was developed, involving the
use of an immobilised AP into a solid matrix.

2. Methods
63
Exchanging GDP to GppNHp in the ‘classical’ way.
• Ras has an extremely high affinity for nucleotides (KD ~ 10 pM). This affinity is highly
dependent of Mg2+ ions and in their absence it decreases by more than 30 times [213].
Thus, in the first step of the process, Mg2+ ions were removed from the solution either by
several ultracentrifugation steps (using 5.0 mL vivaspin concentrators with an adequate
molecular cut-off) or by a small size exclusion chromatography using PD10 columns. In any
choosen approach the result was equivalent: Ras-GDP previously stored in buffer D (40
mM Tris/HCl pH 7.5, 10 mM MgCl2, 2 mM DTE, 0.1 mM GDP) was exchanged to buffer E
(40 mM Tris/HCl pH 7.5, 2 mM DTE).
• The concentration of the GDP-bound protein now in buffer E was calculated by HPLC
(section 2.2.2.6.3) and a 3-fold excess of the non-hydrolysable analogue GppNHp was
added, followed by the addition of 200 mM of (NH4)2SO4. Finally, 2U of AP per mg of Ras
were added. AP catalyses the nucleophilic attack by the water to the phosphate groups,
facilitating the dephosphorilation of GDP but not GppNHp. As Ras has a low affinity to the
newly formed GMP, a dynamic equilibrium is established in which the nucleotide-free Ras
rapidly incorporates the available GppNHp in its binding pocket.
• After overnight incubation with slow shaking at 4 ºC, the completeness of the reaction was
verified by HPLC and purification of Ras-GppNHp from by-products (GDP, GMP,
guanosine) was done by using either a PD10 or a bigger SEC column connected with the
AKTA systems, which allowed the reincorporation of MgCl2 into the final buffer: 40 mM
Tris/HCl pH 7.5, 10 mM MgCl2, 2 mM DTE (Buffer F).
• The final concentration of Ras•Mg2+•GppNHp was adjusted by HPLC to the desired value,
the exchanged protein shock frozen in liquid N2 and stored at -80 ºC until further use.
Exchanging GDP to GppNHp using immobilized AP.
This method relied on the use of immobilized AP columns provided by MoBiTec®, which
were handled according to the manufacturer’s instructions. Ras-GDP proteins were
exchanged to buffer E, their concentration measured by HPLC and a 3-fold excess of
GppNHp, together with 200 mM of (NH4)2SO4 were added, exactly as described above.
However, no AP was added. Instead, the 1.5-2.0 mL final solution was brought to the
immobilized AP, previously equilibrated in buffer E. Due to the small size of the column, 150
µl of sample were injected each time with the help of a syringe and a small needle. Between
each injection a minimum waiting time of 15 min. was held, so that the loaded sample could
have enough contact time for the reaction to happen. Elution was simply done by loading
the next 150 µl of sample into the column or by pushing air with a syringe (there is no

2. Methods
64
harmful effect if the column runs dry). The eluted fractions were all collected in the same
1.5-2.0 mL Eppendorf tube and the completeness of the process was evaluated by HPLC.
If GDP was still present, the procedure was repeated by passing again the protein through
the column. The purification of newly GppNHp-bound Ras and the re-incorporation of Mg2+
was done using a PD10 column. The final exchanged protein was stored in buffer F, with
the desired concentration.
The immobilized AP method allows the exchanged proteins to be virtually free of AP that
could otherwise affect the stability of the bound nucleotide. The process is also faster than
the ‘classical’ way since no overnight incubation is needed.
2.2.2.4.2 GDP Against GTP
Exchanging Ras-GDP to Ras-GTP proceeds in a similar way as the one described above,
with the exception that AP cannot be added since it would also hydrolyze GTP. Instead, a
great excess of GTP is added, with the expectation to shift the equilibrium towards the Ras-
GTP complex:
• After removing Mg2+ from the initial buffer D and adding 200 mM of (NH4)2SO4, as
described above 20 mM EDTA were added (helping further in the chelation of possible
residual free Mg2+ ions) along with GTP in a 30 to 50-fold excess relative to GDP. The
mixture is left for 3-4 hours, slowly shaking, at 4 ºC.
• After the elapse of this time, the free nucleotides were separated from the protein using
the same process described above and the GTP-bound/GDP-bound ratio quantified by
HPLC. Typical RasWT proteins have a 70-80% exchange. Oncogenic mutants such has
G12D or G12V can achieve 90-95%. It is worth note that, contrary to GppNHp, 100%
exchange is never possible in this case.
• The final Ras•Mg2+•GTP was stored in buffer F, at -80 ºC until further use.
2.2.2.5 Polyacrylamide Gel Electrophoresis (SDS-PAGE)
Protein gel electrophoresis was routinely carried to check the success of protein purification.
In this technique, proteins become denatured in the presence of sodium dodecylsulfate
(SDS), losing their secondary and tertiary structure. SDS is a strong anionic detergent that
wraps around the polypeptide backbone when heated at high temperature. The intrinsic
charges of the polypeptides become negligible when compared with the negative charges
contributed by SDS. The protein-SDS complexes become rod-like structures with a uniform
negative charge density and their electrophoretic mobility becomes only a linear function of
their molecular masses. In the presence of a directional electric field, small size proteins

2. Methods
65
move faster than bigger proteins, from the cathode (negatively charged) towards the anode
(positively charged). The medium where the electrophoretic movement occurs is a gel made
of a polymer matrix called polyacrylamide produced in the laboratory by cross-linking
acrylamide with bisacrylamide. This requires a radical initiator and a catalyst to take place
in a few minutes instead of several hours. The radical used was normally ammonium
persulfate (APS) and the catalyst was Tetramethylethylenediamine (TEMED). The latter
reacts with APS and causes the splitting of persulfate ions into sulphate free radicals
responsible for initiating the polymerization.
The proteins were loaded firstly into a stacking (or collecting) gel and subsequently
separated in a running gel. Typically, the stacking gel has a low concentration of acrylamide
and a pH of 6.8 and the running gel a higher concentration of acrylamide (that retards the
movement of proteins) and a pH of 8.3. To conduct the current from the cathode to the
anode a medium was needed. This medium can be continuous (if the buffer, in the
electrophoretic tank and in the gel, is the same) or discontinuous (if the buffer is different).
The continuous method was proposed by Lämmli et al in 1970 [214] and the discontinuous
method was proposed by Schägger et al in 1987 [215]. The first is more suitable for the
separation of proteins of an average size higher than 30 kDa, while the second is most
suitable for best separation of smaller proteins (< 30 kDa). All Ras proteins (truncated and
full length) together with Raf-RBD were detected by using the Schägger method. NF1 and
SOS were detected by using Lämmeli. The methodology is presented as follows:
• 6.0 µl of a 4-fold concentrated SDS solution (150 mM Tris/HCl pH 6.8, 2% m/v SDS, 20%
w/v glycerol) were added to 18.0 µl of protein sample.
• The mixture was incubated for 5 min. at 100 ºC to enhance the denaturation process,
followed by centrifugation for 2 min., 10000 rpm at RT. 10 µl of each sample were then
directly applied in the top of the stacking gel.
• In the Schägger method, the composition of the buffer used in the gel was 3.0 M Tris/HCl
pH 8.4, 0.3% SDS and 0.01% NaN3. The acrylamide content used on the stacking gel was
5% and in the running gel was 16.5%. The anode buffer (located in the bottom part of the
electrophoretic chamber) was 200 mM Tris/HCl pH 8.9 (10x stock solutions were prepared
and stored at 4 ºC for routine use) and the cathode buffer (located in the upper part of the
chamber) was made by mixing 100 mM Tris/HCl pH 8.9, 100 mM Tricine, 0.1% w/v SDS
and 0.01% w/v NaN3 (similarly, 10x stock solutions were also prepared). For the Lämmeli
methodology, the buffer was made of 25 mM Tris-base, 200 mM glycine and 0.1% w/v SDS.
The acrylamide content used in the stacking gel was 5% and in the running gel 15%.

2. Methods
66
• Schägger gels were run at a constant voltage of 100 V for approx. 120-140 min. and
Lämmeli gels were run at a constant current of 36 mA for about 50-60 min.
• The Separated proteins by both electrophoretic methods were stained with coomassie
solution containing 0.1% w/v of tryphenylmethane brilliant blue G250, 40% v/v methanol
and 10% v/v acetic acid. Coomassie binds to proteins through ionic and Van der Waals
interactions between the dye sulfonic groups and positive protein amine groups, staining
them unspecifically.
• The staining procedure was accomplished by heating the gel for 1-2 min. in a microwave
and then shaking it for at least 30 min. at RT. The revealing of the protein bands was
accomplished by adding a unstaining solution made upon mixing 20% v/v acetic acid, 10%
MeOH v/v and 70% H2O. The gel was microwaved (1-2 min.) in the presence of this
unstaining solution and shaken for at least 30 min.
• In a final step, the revealed gel was transferred to a translucid plastic bag and
photographed or digitalized, if necessary.
2.2.2.6 Determination of Protein Concentration
In an attempt to minimize systematic and random errors and, whenever possible, different
methods were used to find the most correct concentration for the proteins involved in this
project. The obtained values by different methods were always combined and averaged.
2.2.2.6.1 The Bradford Method
The Bradford method is based on the proprieties of coomassie brilliant blue (see also
section 2.2.2.5 for details). This dye binds primarily to the negatively charged amino acids
of the proteins and changes from a cationic to an anionic state. This is associated with a
colorimetric change that can be followed by visible spectroscopy at 595 nm.
• The Bradford assays preformed in this work were all based in a previous calibration curve
using BSA. The Roti®-Quant assay kit from Roth® was used in the preparation of the curve.
Briefly, a BSA dilution series from 0.5 mg up to 2 mg/mL was set. 1.0µl of each sample was
transferred directly into a plastic cuvette and 1.0 mL of Bradford solution was added. Upon
gentle mixing by pipetting with up-and-down movements, the mixture was left to rest for ca.
5 min. at 298K and then measured directly at 595 nm (the ‘blank’ or the ‘zero’ was previously
made by measuring the absorbance of the Bradford solution alone). Using the obtained
values, a linear dependence between A595 and the mass (in mg or µg) of the protein was
plotted. Upon linear fitting in the form of y=mx+b (m being the slop and b being the y-
intercept), the protein concentration can be calculated through the equation C=(Abs595-b)/m.

2. Methods
67
The most striking disadvantage of this method is the lack of accuracy by the simple fact that
the amino acid composition varies greatly between different proteins. The higher the
number of non-polar, reactive side chains, the higher the concentration this method will
(inaccurately) deliver.
2.2.2.6.2 UV Absorption at 280 nm Using Nanodrop™
This method is based in the simple fact that proteins that contain tryptophan, tyrosine and,
to a small extent, phenylalanine in their primary sequence will strongly absorb light at 280
nm. It relies more in the presence of tryptophan than the others because tryptophan is the
amino acid with the highest absorption efficiency at this wavelength. The direct
measurement at 280 nm has the advantage of being a very simple and non-destructive
process (unlike Bradford). Nowadays, instrumental advances in photometry led to the
development of highly accurate and versatile machines such as the Nanodrop™ that allows
the determination of protein concentration in less than 30 seconds.
Within the framework of this thesis, all the measurements were performed using
Nanodrop™ One (ThermoFisher Scientific) from the department of Biophysics II (chair Prof.
Dr. Reinhard Sterner), using the single channel mode by sweeping in a 190-850 nm range.
2.0 µl of protein sample was pipetted directly into the pedestal of the device. The
concentration can be obtained from the direct application of the Beer-Lambert law,
A280=c.l.e. When the extinction coefficient, e, of the protein is rigorously known, this is a
method of choice (provided that the protein absorbs strongly at 280 nm). When there is no
accurately published literature about e, its value can be estimated by using an online
application such as ExPAsy ProtParam tool [216]. Because ProtParam only considers the
linear sequence of the protein and doesn’t take into account the structure (which can affect
the ‘real’ extinction coefficient value), the protein was always denatured before measuring
its concentration.
2.2.2.6.3 Analytical High Performance Liquid Chromatography (HPLC)
Analytical HPLC was the method of choice in this work to measure the concentration of Ras
proteins, to measure their intrinsic GTPase activity and to follow up nucleotide exchange
reactions (section 2.2.2.4). Ras concentration was quantified by reverse phase
chromatography (RPLC), according to Hoffman et al [217]. The system consists of a C18
nucleosil pre-column, a hypersil C18 reversed-phase column and a UV detector, mounted
in this respective order. In RPLC, the polarity of the stationary and mobile phases is
interchanged in comparison to normal-phase chromatography: the mobile phase (HPLC

2. Methods
68
buffer: 100 mM K2HPO4/KH2PO4 pH 6.4, 10 mM tetrabutylammonium (TBA) and 2% up to
8% acetonitrile (ACN)) is polar and the stationary phase (derivatized silica gel, C18 column)
is highly hydrophobic. The Ras protein is denatured by the acetonitrile in the mobile phase
(HPLC buffer) and by the highly hydrophobic properties of the pre-column, becoming
retained on it as it travels through the system. In the denaturation process the bound-
nucleotide is released and travels subsequently through the C18 reversed-phase column.
The process of separation of a mixture of different nucleotides happens as follows: the
positively charged TBA ions from the HPLC buffer bind to the negatively charged phosphate
groups of the nucleotides, neutralizing their charges. Now, the non-polar nucleotide-TBA
complexes can interact with the stationary phase, i.e. the C18 reversed-phase column. The
order of appearance (retention time) of a mixture upon an isocratic elution can be
rationalized in terms of charges and reversed phase interactions: the retention time of
increases with increasing number of phosphates - longer non-polar nucleotides can interact
better with the stationary phase, travelling slower through the column. As consequence, the
different nucleotides are separated according to their increasing order of molecular mass
(guanosine, GMP, GDP, GppNHp, GTP).
The elution profile was determined by a UV detector operating at λ= 254 nm, were
absorption of the conjugated π-electron ring system of the purine base takes place. A
calibration of the complete HPLC system was carried out periodically with a GDP stock
solution of known concentration (λ= 254 nm, ε254nm(GDP)= 13700 M-1 cm-1). Ras proteins
were typically measured by injecting 20 µl of a 1:10 dilution into the chromatographic
system. In the isocratic elution method, the concentration of ACN was adjusted in a way
that the time interval between the elution of each nucleotide was long enough to allow the
proper integration of the peak areas without peak overlapping. Protein concentration was
obtained by using directly the values from the integrated areas into the calibration equation.
2.2.3 Nano Differential Scanning Fluorimetry (nanoDSF) nanoDSF is a modified differential scanning fluorimetry method in which the fluorescence
of natural aromatic amino acids of proteins, especially tryptophan and tyrosine, is employed
to monitor protein unfolding as the protein is subjected to a temperature gradient. Both, the
fluorescence intensity and the fluorescence maximum depend strongly on the close
surroundings of the aromatic amino acids [218, 219]. Thus, the ratio of the fluorescence
intensity at 350 nm over 330 nm (corresponding to the maximum of emission for the
unfolded and folded cases, respectively) can be plotted as a function of time or temperature
and used to obtain the melting temperature (Tm) defined as the temperature at which 50%

2. Methods
69
of the protein population is unfolded and corresponding to the midpoint of the transition from
folded to unfolded. By following the shift in fluorescence emission wavelength, an unfolding
curve can be generated. Calculation of Tm can be performed using different methods. A
commonly used approach is to determine the maximum of the first derivative of the
absorbance signal. This method circumvents the subjective determination of baseline levels
and also allows for the determination of multiple melting points, e.g. for antibody unfolding
or more complex multi-domain proteins. The method works especially well when one or
more tryptophan residues are present but can also be employed in the study of proteins
that have no tryptophan residues as is in the case of the Ras protein [220].
In the scope of this work the melting temperature of Ras wild type was compared with the
mutants H27E, D33K, T35A and T35S. All the samples dissolved in buffer F with
concentrations ranging between 1.0 and 1.5 mM were loaded into thin capillaries and
measured in the Prometheus NT.48 from Nanotemper® Technologies (Munich, Germany),
in a temperature range between 20° and 95°C. Before every Melting Scan a Discover Scan
of 7 seconds detecting the capillaries that were loaded into the instrument was performed.
Data analysis was performed using the NT Melting Control software (Nanotemper®). Tm
values were determined by fitting the tryptophan fluorescence emission at the ratio of
350/330nm using a polynomial function in which the maximum slope is indicated by the
peak of its first derivative.
2.2.4 Isothermal Titration Calorimetry (ITC)
ITC is used to determine the thermodynamics of (bio)molecular interactions and the kinetics
of enzyme-catalysed reactions in solution and is based in the simple principle that any
chemical reaction or physical process is accompanied by a change in heat or enthalpy (DH)
of the system under study, that can be measured and quantified. Distinct molecular
interactions have distinct heat signatures that constitute a unique thermodynamic fingerprint
for a particular system and can be rationalised to help with the question of why two
biomolecules can bind to each other.
ITC is one of the oldest methods used in the field of biophysics to prove molecular
interactions but still one of the most common due to its robustness. It allows the
measurement of virtually any molecule in solution without the need of previous labelling,
contrary to other more modern techniques such as microscale thermophoresis (MST),
which sometimes requires hydrophobic fluorescence labelling that can cause unspecific
binding [221]. The emitted or absolved heat is also measured directly in solution, contrary

2. Methods
70
to other methods that require
immobilisation of one of the partners
into a solid matrix to derive binding
parameters (e.g. surface plasmon
resonance (SPR) and quartz crystal
microbalance (QCM)) [222].
Additional advantages of ITC include
no molecular mass limitations and no
restrictions regarding the optical
properties of the sample, since only
heat variations are measured. One of
its greatest limitations is, however, the
large amount of sample needed,
despite recent technological
advances in miniaturizing the reaction
cell of the instrument [223]. A second
disadvantage is its low throughput,
with an averaged time of 1 hour per
experiment.
An ITC instrument is a very sensitive device capable of measuring heat effects as small as
0.4 µJ and allows the determination of binding constants between 1.0 nM and 100 µM. The
detected heat rates can be as small as 0.4 µJ s-1, permitting for the determination of Km and
kcat values in the range of 10-2-103 µM and 0.05-500 s-1, respectively [224, 225]. The
calorimetric experiments conducted in this thesis were performed in a Microcal® PEAQ-ITC
(Malvern Instruments Ltd.) calorimeter which is based on the compensation of the thermal
effect generated by the addition of ligand (titrant, located in a syringe) to the sample being
titrated, located in an adiabatic cell, as shown in Figure 2.6A: close to the sample cell is
located a reference cell that is periodically filled with Millipore water. A thermoelectric device
measures the temperature difference between the reference and the sample cells as well
as between each cell and an adiabatic jacket that isolates the complete chamber. As the
reaction is developed (i.e. the titrant is stepwise added to the sample being titrated, a
process that is fully automated), the temperature difference between the two cells
decreases to zero either by automatically heating the sample cell (if the reaction is
endothermic) or by heating the reference cell (if the reaction is exothermic). For each
addition, the heating originates a characteristic spike over (endothermic) or under
Figure 2.6. ITC as a method to probe molecular interactions. A. Representative diagram of a power compensation ITC device showing the syringe (green) used to incrementally add the ligand to the sample located in the cell (red), whose heat variation is constantly monitored and adjusted to a close by reference cell (blue). B. The raw heat of the reaction is shown by the spikes that develop from the baseline for each injection (upper graph). Integration of this area over the molar ratio gives the thermogram (lower graph), from which the parameters DH, N (binding sites) and KD can be explicitly calculated. Adapted from [221, 222].

2. Methods
71
(exothermic) the baseline. In other words, the generated spikes correspond simply to the
power compensation (sometimes called raw heat, measured in µJ s-1 or µcal s-1) of the
calorimeter that is required to keep the sample cell from changing temperature over the
course of the titration. The plot of the raw heat over time is called a thermogram. When
designing an ITC experiment it is fundamental to give enough time between each
consecutive injection to allow the heat spike to return to the baseline. A typical thermogram
of an exothermic reaction is shown in the upper graph of Figure 2.6B. The integration of the
individual raw heat over the time for each injection (more specifically, the time needed for
the control heat power to return to a baseline level) gives the heat change that can be
plotted as a function of the molar ratio of the two interacting partners. The fitted curve of a
1:1 binding model is shown in the bottom graph. In this case the enthalpy is fitted at the
heat of 100% binding and the stoichiometry is intuitively denoted by the midpoint of the
titration. The slope of the sigmoidal curve is related to the binding constant (Kb and KD=
1/Kb) and to the sample concentration for a given system. Considering a general binding of
a ligand [L] to a macromolecule [M], Kb is given by:
The Gibbs free energy (in kJ mol-1) of binding is given by:
Where R is the gas constant given in J-1 K-1 mol-1 and T the absolute temperature, given in
K. The entropic contribution, DS, is implicitly calculated from the second law of
thermodynamics and given in kJ mol-1:
A useful parameter is N that defines the number of binding sites per macromolecule and is
mathematically given by:
In an ITC experiment, the initial heats are larger than the heats for subsequent additions
because at the beginning of the titration there is a large excess of empty or unpopulated
binding sites which leads to a complete reaction when [L] is added to [M]. The heat produced
is linearly dependent of DH and non-linearly dependent of Kb. The generic thermogram is
modelled by the following equations:
M + L! ML Kb =[ML][M ].[L]
(1)
ΔG = −RT lnKb = RT lnKD (2)
ΔG = ΔH −TΔS (3)
N =[L]b[M ]T
= [ML][M ]+ [ML]
=Kb[L]1+ Kb[L]
(4)

2. Methods
72
Eqn. (5) is just a particularization of eqn. (4). Θi is the is the fraction of site i occupied by
ligand; [L]T is the total ligand concentration, [L] is the free ligand concentration, PT is the
total macromolecule concentration, Ki is the binding constant of process i and ni is the
stoichiometric ratio for the injection i. The total heat produced can be calculated from:
Where V0 is the initial volume of the sample cell and DHi is the molar enthalpy change for
the process i. The differential heat is defined by eqn. (8) where k is the injection number. A
non-linear regression algorithm is performed on eqn. (7) to obtain a fit of the experimental
data. There are different models that explain the binding process (one-set of sites, two
independent sites, sequential sites). All the interactions measured in the present work
correspond to a 1:1 binding with the macromolecule having one binding site. In this
particular case, the equilibrium constant is given by:
All the titration experiments were performed according to the default setting of the device
used with a referential power of 10 µcal s-1 and a spacing between injections of 150 s or
longer, with an injection time of 2 s and a stirring speed of 750 rpm. A total of either 19 or
31 injections of 2 µl each were applied in the determination of the KD values. For a
qualitative, rapid assessment of the binding strength a faster run comprised of 13 injections,
3 µl each, was performed. All the measurements were conducted at 298 K, using 270 µl of
Ras (always located in the cell) and 70 µl of the titrant (always located in the syringe).
Q = PTV0 niΘ iΔHii=1
j
∑⎛⎝⎜⎞⎠⎟
(7)
ΔQ(k) = Q(k)−Q(k −1) (8)
K = Θ(1−Θ).[L]
(9)
Θ i =Ki[L]1+ Ki[L]
(5)
[L]T = [L]+ PT (niΘ i )i=1
j
∑ (6)

2. Methods
73
2.2.5 NMR Spectroscopy
2.2.5.1 Sample Preparation. General Considerations
All NMR measurements involving different Ras isoforms, variants and mutants were
performed by dissolving the protein in buffer F (40 mM Tris/HCl pH 7.5, 10 mM MgCl2, 2
mM DTE, 0.2-0.4 mM DSS (2,2-dimethyl- 2-silapentane-5-sulfonate) in 5-10% D2O, or 20%
in the case of HP experiments). For measurements involving the titration of Ras with Raf-
RBD, NF1 or SOS1, a minimum of 150 mM and a maximum of 250 mM NaCl, depending
on the titrant and general aspect of the mixture, were added prior the titration with the intent
to stabilize the protein complexes and to avoid dimerization.
In the NMR investigations performed for GppNHp, the nucleotide was bought from Sigma-
Aldrich (Germany) and used directly, without any additional purification. From the white
crystalline powder two samples were prepared by dissolving it either in buffer F, which
included MgCl2 in one case but not in the other. In order to minimise pH dependent chemical
shift changes during the HP experiments, a pH value for the solutions of ca. 2-3 units above
the apparent pKa values of the second deprotonation step of the terminal phosphate. This
corresponded to a final pH of 9.0 for the Mg2+•GppNHp sample and 11.5 for GppNHp
sample [116, 226]. All NMR measurements performed in this thesis were recorded at either
278 K or 303 K (or both). The temperature of the NMR probehead was always controlled
prior to the experiments by using the line separation between methyl and hydroxyl groups
of external MeOH as a calibration method [227].
2.2.5.2 Ambient Pressure and HP 31P NMR Data Acquisition
Ambient pressure and HP 31P NMR was recorded either in one of the two spectrometers
located at our department: in a Bruker Avance 500 MHz, operating at a 31P frequency of
202.45 MHz and in a Bruker Avance 600 MHz, operating at a 31P frequency of 242.89 MHz.
In the first spectrometer either a selective broadband 10 mm 31P probe or a 5 mm QXI probe
was used. The protein samples were typically measured in high quality grade 5 mm NMR
tubes or in 5/8 mM Shigemi tubes. The second spectrometer was equipped with a Prodigy™
cold probe (Bruker) allowing for the enhanced sensitivity detection of the 31P nucleus.
Protons were usually decoupled during data acquisition with a GARP sequence operating
at a B1 field of 830 Hz or 980 Hz, accordingly to the spectrometer used [228]. A 70º-90º
pulse and a repetition time of 6-7 s was typically used. A 1H spectrum was recorded for
each 31P spectrum.

2. Methods
74
HP 31P NMR was performed using a home-built online high hydrostatic pressure system
which includes a bourdon manometer and a manually operated piston compression (for
details see Figure 1.12 and [229]. Pressure was transmitted via a metal-alloy line filled with
water to a high pressure ceramic cell connected at the end by an autoclave (Figure 1.12).
One of two ceramic cells were used in the multiple experiments, a 200 MPa or a 250 MPa
of maximum permissible pressure. Both have an inner diameter of 3 mm and an outer
diameter of 5 mm. Recently, a third one was acquired by our department, capable of
withstanding a maximum pressure of 300 MPa. A flexible membrane, made of polyethylene
terephthalate (PET), was used to separate the water of the pressure line from the buffer of
the protein sample. The total volume of both ceramic cells is 320 µl. However, the effective
volume where the sample can be recorded is considerably smaller. To reduce the
unnecessary volume and therefore economise protein sample, a cylindrical displacement
body with a length of ca. 3 cm, made of propylene, was inserted into the ceramic cell. In the
process, the protein solution that leaked from the cell was collected, stored and used for
other experiments.
2.2.5.3 [1H-15N]-HSQC NMR Acquisition, Processing and Evaluation
2D experiments performed in HRasWT(1-166)•Mg2+•GppNHp (1.1 mM) and HRasD33K(1-
166)•Mg2+•GppNHp (1.3 mM). For each protein, a temperature series was recorded ranging
from 278 K to 303 K in five-degree step intervals. Prior the experiment both proteins were
extensively dialysed against the same buffer. 1H and 15N data collection was performed in
a Bruker Avance spectrometer, equipped with a TXI cryoprobe operating at a 1H frequency
of 800.12 MHz and a 15N frequency of 81.08 MHz. Each 2D spectrum was recorded as a
complex data matrix comprised of 256 or 512x2048 points using a sweep width of 8400 or
9600 Hz in the proton dimension and 2400 Hz or 2800 Hz in the 15N dimension. A recycling
delay of 3.4 s was used with 64 scans/FID. Before each 2D experiment, a standard 1H
spectrum was recorded. 1H chemical shifts were directly and 15N indirectly referenced to
DSS as described elsewhere [230].
All spectra were processed using the Topspin 3.2 program (Bruker Biospin). The
assignment of the amide resonances for RasWT•Mg2+•GppNHp was based on the reported
literature [94] and transferred to the presently obtained spectra using the Auremol software
[231].

2. Methods
75
2.2.5.4 31P (HP) NMR Processing and Evaluation
All 31P NMR spectra were processed using the Topspin® program. Each spectrum was
baseline corrected, phase corrected and indirectly referenced to DSS with a Ξ-value of
0.404807356 reported by Maurer and Kalbitzer [232], corresponding to 85% external
phosphoric acid contained in a spherical bulb. The FID was filtered with appropriate window
functions, depending on the characteristics of the data and the intended purpose of the
analysis. Typically, either an exponential multiplication filter (EM) with a line broadening
(LB) of 4-15 Hz or a Gaussian multiplication filter (GM) was used. The processed data was
subsequently converted to the ASCII format using the MestreC® (v6.1) program and
evaluated using the Origin® (v8.9) software. The deconvolution of the spectra was
performed by application of a standard non-linear least square routine gradient fit procedure
such as the Levenberg-Marquardt (L-M) method [233, 234]. In this process, an initial
empirical estimation of the chemical shift position for each resonance line is given and fitted
with a Lorentzian line that is then optimized by the algorithm, allowing for the obtention of
accurate chemical shift values, peak intensities, areas and half-width linewidths. 31P NMR longitudinal relaxation times (T1) were determined by an inversion-recovery pulse
sequence at 278 K, using a maximum repetition time of 20 s. The obtained integrated areas
were plotted and fitted according to the following equation:
where Mz(t) is the z-magnetization (signal integral) at time t and M0 is the magnetization in
thermal equilibrium [235]. 31P NMR studies on the binding of Zn2+-cyclen to HRas and KRas led to the determination
of the microscopic dissociation constant, KD, as well as to the coefficient of cooperativity, n,
given by the Hill equation [236, 237]:
Where df and dc are the chemical shift values of free Ras in state 1(T) and in complex with
a ligand, respectively. [Ras]0 and [L]0 correspond to the total concentrations of the protein
and the ligand, respectively. [L]f is the concentration of the free ligand and n is the Hill
coefficient [156].
δ −δ f = (δ c −δ f )[L] f
n
KDn + [L] f
n = (δ c −δ f )[L]0 − N[Ras]0
δ −δ f
δ c −δ f
⎛
⎝⎜
⎞
⎠⎟
n
KDn + [L]0 − N[Ras]0
δ −δ f
δ c −δ f
⎛
⎝⎜
⎞
⎠⎟
n (11)
Mz (t) = M0 + Mz (0)− M0( )−tT1 (10)

2. Methods
76
Under equilibrium conditions, if a protein occurs in N conformational states, the population
difference between two states, 1 and 2, in thermodynamic equilibrium is given by their
differences in the Gibbs free energy, DGi,j, given in kJ mol-1:
The equilibrium constant K12 is dependent on pressure, P, and absolute temperature, T.
Given the universal relation DG = DG0 + PDV, the pressure dependence of the Gibbs free
energy for the two states at constant T is given by:
Where DV012= DV12(P0)= V2(P0)-V1(P0) is the difference of the partial molar volumes. The
complete quadratic term of this equation is sometimes abbreviated as Db12 and corresponds
to the difference of the partial molar compressibilities. In most cases this term is neglected
and the equation can be simply written as:
A phenomenological description of the chemical shift pressure-dependence observed for
any NMR spectra can be obtained by a model-free approximation of the Taylor expansion
to the second order:
Where d0 is the chemical shift at ambient pressure and B1 and B2 are the first and second
order pressure coefficients, related with a linear (conformational transition within the same
ensemble) and non-linear (conformational transition between different ensembles) pressure
dependence, respectively. The magnitude of their values depends on the magnitude of the
local structural changes induced by pressure. This relationship is not truly quantitative but
it can be used at least empirically to evaluate such changes. In some situations, the use of
a third order (B3) Taylor expansion is required for a proper fit of the data. The actual
pressure response observed in an NMR spectrum depends on the timescale of the
exchange between the different states, characterized by the exchange correlation time, τc.
If there is an equilibrium between M states i, (i=1, N) of the protein and under a fast
ΔG12(P) = ΔG120 + (P − P0 )ΔV12
0 + 12∂ΔV12
0
∂P(P − P0 )
2 (13)
δ (P,T0 ) = δ0(P0 ,T0 )+ B1(P0 ,T0 )(P − P0 )+ B2(P0 ,T0 )(P − P0 )2 (15)
(12) p2p1
= K12 = e−ΔG12RT
⎛⎝⎜
⎞⎠⎟
ΔG12(P) = ΔG120 + (P − P0 )ΔV12
0 (14)

2. Methods
77
exchange condition (|Dωij|=|ωj-ωi|<<1/τc), the observed chemical shift is a combination of
the chemical shifts of each state given by the general equation:
Where Z is the state sum over all possible structural states of M. For a conformational
transition between only two states, 1 and 2, the above equation can be greatly simplified:
Indeed, this was the used equation to fit the pressure-dependent chemical shifts of the 31P
NMR lines behaving according to the fast exchange regime.
When the conformational change between states 1 and 2 is slow in the NMR time scale
(|Dωij|=|ωj-ωi|>>1/τc), the signal areas (in the case of 31P spectra, A) or volumes, V (in the
case of [1H-15N]-HSQC spectra) are proportional to their respective concentration and the
equilibrium constant K12 can be calculated according to:
The relative population pi of a state i in an N system can be calculated from the equilibrium
constant Kij=[i]/[j] as:
In terms of 31P NMR, the intrinsic pressure effects arising from the isolated nucleotide were
separated from the pressure effects ascribed to the nucleotide-bound Ras for the first time
in this thesis. This was achieved by subtracting the variation of the chemical shift values
(Dd) measured in the isolated nucleotide to the uncorrected shift values of the Ras protein
obtained directly from the experimental spectra [226].
K12 =V1V2
= e−ΔG12RT (18)
pi(P,T0 ) =Kij (P,T0 )
Kij (P,T0 )i=1
N
∑ (19)
δ = 11+ K12
δ1 +K121+ K12
δ 2 =δ1 +δ 2e
−ΔG12RT
1+ e−ΔG12RT
(17)
δ = Piδ ii=1
M
∑ = 1Z
δ ii=1
M
∑ e−GiRT =
δ ie−ΔG1iRT
i=1
M
∑
e−ΔG1iRT
i=1
M
∑(16)

2. Methods
78
2.2.6 High Pressure Macromolecular Crystallography (HPMX)
Contrary to HP NMR, HPMX is technically more challenging and requires complex
instrumental skills. Nevertheless, it is a remarkable technique with a bright future. Its
improvement towards a routinely, user friendly methodology, is dependent on technological
advances related to the construction of brighter synchrotron radiation sources for faster data
acquisition, development of, newer high pressure cells, fully automatic analysis of the
diffraction images and new efficient methods for pressure calibration [173].
Conventional, ambient pressure (pamb), X-ray diffraction data was collected for HRasWT(1-
166) and for HRasD33K(1-166). In parallel, a broad crystallographic study involving wild type
Ras and RasD33K was performed using state-of-the-art high pressure X-ray techniques.
2.2.6.1 Protein Crystallization
All the proteins studied by HPMX refer to the C-terminal truncated (1-166) and GppNHp-
bound HRas used in a concentration between 1-1.5 mM and dissolved in buffer F (40 mM
Tris/HCl pH 7.5, 10 mM MgCl2, 2 mM DTE).
Crystallization of RasWT and RasD33K
The technique requires the use of large crystals, typically bigger than 200 µm in edge-
length. They were produced for the purpose according to the “batch mode” process, using
an appropriate crystallization chamber containing 3-spot wells made of glass that were
previously siliconized. To each of these spots, typically 15-30 µl of 80 mM Tris/HCl pH 7.5,
20 mM MgCl2, 4 mM DTE and 52-60% PEG-400 were placed at their centre. Afterwards,
30 µl of the protein solution were carefully added in the centre of the previous drop. The two
solutions were slowly mixed by gentle pipetting. The chambers were immediately sealed at
the top with transparent adhesive tape and placed in a vibration-free zone, in the dark.
Nucleation spots were visible under the microscope after ca. 6 h and full crystals were
grown after 2-3 days.
Crystallization of RasWT in complex with Zn2+-cyclen
A series of HP experiments were devised with the intent to understand how the binding of
Zn2+-cyclen at the first binding site, near the nucleotide g-phosphate, is affected upon
pressure-induced conformational rearrangements of the switch regions. For the purpose,
the previously grown RasWT crystals were soaked with 10-12 mM of Zn2+-cyclen from a
highly concentrated (> 20 mM) stock solution (dissolved in the same buffer used for
crystallisation), for at least 10 hours prior data acquisition.

2. Methods
79
2.2.6.2 Data Collection
Upon committee approval for beam time, X-ray data was collected at the European
Synchrotron Radiation Facility (ESRF, Grenoble, France) in the beamlines ID09A and ID27,
and at the SOLEIL synchrotron (Saint-Aubain, Paris, France) in the “Crystal” beamline. A
total of 4 runs (2 at ESRF, 2 at SOLEIL) were performed, comprising a total of 20 days of
synchrotron radiation devoted to the project. The following description on how to acquire
HPMX can be used as a practical guide to any of the three different beamlines used.
Although, the reader is advised for the existence of specific instrumental and technical
details of each beamline that are impossible to cover here in full detail.
• Two identical DAC’s (named ELSA and ELMA) of the cylinder-piston type were used
(Figure 1.14) [185], one cell being loaded while the other being used for data collection. The
first step of sample loading in the DAC was the preparation of a gasket. This is a piece of
copper or inconel®, with a typical thickness of 200 µm. The gasket was inserted between
the two diamonds, the cap of the DAC was screwed and the gasket was indented by
applying a small thrust (achieved by slightly pressurizing the cell with helium gas).
Afterwards, the cap was removed and a hole was machined in the gasket by electroerosion
with a diameter of exactly 350 µm. The gasket was then placed on the diamond, using the
indentation as a guide. A drop of mother liquor (2-3 µl) was deposited in the hole. A crystal
was fished out of one of the crystallization drops and gently pushed into the cavity, together
with a tiny ruby sphere (Figure 1.14). The drop was deposited just before the deposition of
the crystal to reduce evaporation of its most volatile components. The cap of the diamond
cell was screwed and a moderate thrust applied to it.
• The slightly pressurized DAC already containing the crystal in its centre was then mounted
on the goniometer by attaching it to the c-cradle set at w=0. The X-ray beam cross section
was typically adjusted to 50x50 µm2 at ESRF and 20x20 µm2 at SOLEIL. The pressure was
ramped until the desired value by slowly increasing thrust. This was either done by using a
manual pressure setup system or an automatic one. Pressure was generated in both cases
not by a lever but by a pneumatic mechanism that lets He gas flow into the membrane of
the DAC [238]. The pressure inside the DAC cannot be assessed by the applied load
because it is difficult to predict the elastic forces and plastic and elastic deformations in its
mechanical parts [239]. This determination was performed using the known pressure-
dependence of a laser-excited fluorescence from a ruby (R1 line, l= 694.2 nm at pamb, the
equipment is a commercial product from Betsa®) [182, 240]. The optical system that is used
to measure the fluorescence was placed on the X-ray path between the DAC and the
detector and can be remotely removed when the pressure adjustment is completed. The

2. Methods
80
same device, coupled to a CCD camera was also used to image the sample on TV monitors
(Figure 1.14).
• The centre of the cavity where the protein crystal was deposited was accurately located
in both, the goniometer rotation axis and in the X-ray beam pathway. This was
accomplished in two steps: first the cell was scanned in the y direction (i.e. perpendicular
to the beam in the horizontal plane) at ±w angles. The intensity transmitted through the
cavity was monitored by using a photodiode. The centre of the cavity was perfectly placed
on the rotation axis when the transmitted signals at ±w were equal. In the second step, the
centre of the cavity was placed in the X-ray beam by scanning along z (the vertical direction)
according to the same principle. Afterwards, the optical system which allows to visualize
the crystal and the ruby chip on a TV monitor was switched on. The X-ray position (now
located exactly at the centre of the cavity) was marked with a pen by making a dot in the
TV monitor. This method was used as a guide-trough for the successive irradiation of a
fresh (i.e. non-irradiated) region of the crystal by performing step translations along the y
and z directions, spaced between with each other by a distance slightly greater than the
radius of the collimated beam. This process of “walking” on the crystal is a successful
strategy to alleviate its rather fast degradation due to the free radical formation (Figure
1.14).
• After centring the crystal, a few frames were recorded. From these frames, information
necessary to undertake data collection (lattice type, cell parameters and orientation matrix)
was derived. Data collection was performed by the rotation method with the HP cell rotating
about the vertical axis.
• Data were collected at a wavelength λ= 0.415 Å in ID09, λ= 0.374 Å in ID27 and λ= 0.510
Å in the Crystal beamlines. The Detectors used were a MarResearch Mar555 flatpanel
(ID09), a MarResearch MarCCD165 (ID27) and a Rayonix SX165 (Crystal). The exposure
times were 5 s, 30 s and 10 s per frame, respectively, with an oscillation of 1º in all cases.
Crystallographic structures of wild type and RasD33K were previously determined using
standard cryo-crystallography. However, since HPMX data are collected at room
temperature (RT), reference data sets at ambient pressure in the same sample environment
were also collected to minimize potential experimental bias and to provide accurate and
meaningful comparisons of high pressure effects.
Diffraction always disappeared anytime the pressure was continuously ramped (i.e. with no
waiting time) from 0.1 to ca. 300 MPa. However, when Ras crystals were kept pressurized
at 200-300 MPa overnight, diffraction could be generally maintained.

2. Methods
81
• All data sets were indexed and integrated using XDS. The integrated intensities were
scaled and merged using SCALA and TRUNCATE and the structures were solved by
molecular replacement (MR) with MOLREP. In order to minimize any bias in the areas
involved in the transition between states, MR’s were performed using a model where the
switch 1 (aa 30-41) and switch 2 (aa 60-76) were removed in addition to all heteroatoms
and alternate positions. The structure refinements were performed using REFMAC. All
these programs are part of the CCP4® package. The graphic program Coot® was used to
visualize |2Fobs–Fcalc| and |Fobs– Fcalc| electron density maps and for manual rebuilding during
refinement steps.
Crystal-cell compressibility curves (i.e. unit-cell parameter changes versus the pressure)
were determined for RasWT in the absence and in presence of Zn2+-cyclen inhibitor, and for
RasD33 alone. All refined crystals belong to the trigonal space-group P3221. The rmsd values
and the thermal b-factors were computed using programs from CCP4 package. In the
following, rmsd’s were always calculated between Ca atoms and average b-factors only for
main chain atoms to avoid the alternate positions of the side chains.

2. Methods
82
- This page was deliberately left blank -

3. Results
“Science is the belief in the ignorance of experts”
R. Feynman


3. Results
85
3.1 Dynamics, Equilibrium and Inhibition of Full-Length Ras Studied by 31P NMR
Until recently most biochemical investigations on full length Ras were rare. The work of the
past decades was devoted to the truncated variant of 166 amino acids, perhaps because it
was easier to handle from the experimental point of view. However, owing the change of
paradigm from HRas to KRas, and from studies on the truncated protein to studies on the
full length one, a primary concern on our department was to investigate up to which extent
the conformational equilibrium detected by 31P NMR for HRas in terms of states 1(T) and
2(T) could be transferred to the KRas protein.
3.1.1 Comparison of the Conformational Equilibrium in HRasWT and KRas4bWT
A great number of studies assessing the equilibrium between states 1(T) and 2(T) has been
published for HRas [67, 122, 241, 242] but not as many for KRas. Because the latter is the
isoform predominantly mutated is most types of cancer [100, 134], an investigation in terms
of equilibria between for the isoforms KRas4b(1-188) and HRas(1-189), was performed
herein. Figure 3.1A shows the 31P NMR spectra recorded at 278 K of both proteins bound
to Mg2+•GppNHp. The corresponding chemical shift values and linewidths are summarized
in Table 3.1. The obtained spectra are very similar: in both cases (and generally for any
case within the scope of 31P NMR spectroscopy of Ras proteins) the separation between
states 1(T) and 2(T) is the greatest for the γ-phosphate signal. The integration of each
resonance signal upon proper deconvolution is directly proportional to the population of the
corresponding conformational state at a given pressure and temperature. This can be
quantitatively defined by the equilibrium constant which is simply the ratio between the two
areas: K12= Astate 2(T)/Astate 1(T). For KRas4b, K12= 2.0 and for HRas, K12= 1.9. Both values are
determined with an error of ± 0.2 that arises from the fitting procedure of the partially
superimposed signals. Qualitatively it can be inferred that under equilibrium conditions at
278 K, the conformational state 2(T) of KRas is ever so slightly more populated as
compared with HRas, despite the difference between both being within the limits of the error
of the measurement. In terms of chemical shifts, the results show that state 2(T) in KRas is
downfield shifted by a dD of 0.06 ppm compared with HRas (d= -3.30 vs -3.24 ppm), a
difference that is small but still significant compared with the typical error values of ca. ±0.02
ppm.
Figure 3.1B shows the 31P NMR spectra of the titration of KRas4bWT with the Ras binding
domain of the effector Raf kinase. The effects of the titration can be qualitatively interpreted
as follows: with increasing amounts of effector new resonance signals close to the ones of
state 2(T) arise. At the same time, the integrals corresponding to the state 1(T) decrease

3. Results
86
with increasing concentrations of effector. At equimolar concentrations of Ras-Raf, state
1(T) disappears completely. The same observations were previously published for HRasWT
[51, 116, 117]. The b-phosphate resonance line becomes broader as the titration proceeds
due to the increased molar mass of the complex. This is corroborated by the experimental
increase of the linewidth values: at a Ras:Raf ratio of 1:1 the molecular mass of the complex
becomes 1.52-fold greater than the one of Ras alone (18 kDa + 9.4 kDa = 29 kDa). The
linewidths of the signals representing the conformational state 2(T) become broadened by
a factor of 1.5, 1.8 and 1.7 for the a-, b- and g-phosphate, respectively.
Figure 3.1. Conformational equilibria of human Ras proteins detected by 31P NMR spectroscopy. A. 31P NMR spectra of the wild type isoforms HRasWT(1-189) and KRas4bWT(1-188) complexed with Mg2+•GppNHp. The resonances corresponding to the a, b and g phosphates are indicated, as well as the conformational states 2(T), coloured green, and 1(T), coloured red, respectively. B) Interaction between KRas4bWT and effector protein Raf-RBD. To an initial concentration of 1.3 mM of KRas, increasing amounts of a highly concentrated Raf-RBD solution were added. The molar ratio of Ras to Raf is indicated. The final concentration of Ras is 0.93 mM.

3. Results
87
There is a wealth of published data on the binding energetics of Ras-effector interactions
measured mainly by ITC and fluorescence techniques that can be taken as reference [243,
244]. But because the binding strength is always dependent on the experimental conditions,
the association of Raf-RBD to HRasWT and KRasWT was presently studied by ITC using the
same buffer employed for the 31P NMR measurements. The ionic strength is particularly
important in this case since the affinity is greatly influenced by the concentration of salt
(studies reported a variation from a KD of 0.010 µM in the absence of NaCl up to 0.35 µM
at 125 mM NaCl [245]). The obtained isotherms are presented in Figure 3.2. Raf was placed
on the syringe of the calorimeter at a typical concentration of 600 µM and a 12-fold diluted,
50 µM, Ras sample was placed in the cell. The measurements were recorded in duplicate
at 298 K by using one of the default methods provided by the instrument manufacturer. All
the interaction partners were previously dialyzed against the same buffer ((buffer F: 40 mM
Tris/HCl pH 7.5, 10 mM MgCl2, 2 mM DTE) with additionally 150 mM NaCl). The obtained
results are shown in two forms: the differential raw power recorded by the instrument,
originated after each successive addition of 2.0 µl of Raf to Ras as a function of time is
presented in the upper graphs of Figure 3.2 The integration of this heat signature with
respect to the Ras:Raf molar ratio over the course of the titration was also plotted (middle
graphs). The sigmoidal distribution was fitted with a 1:1 binding model (experimental section
Table 3.1. 31P chemical shift values and linewidths for H and KRasWT(1-188/189)•Mg2+•GppNHp and their titration with the effector Raf-RBD.
protein complex P:l
a-phosphate b-phosphate g-phosphate d1(T) [ppm]
d2(T) [ppm]
d1(T) [ppm]
d2(T) [ppm]
d1(T) [ppm]
d2(T) [ppm]
K12b
FLHRasWT -- -11.25 -11.71 -0.26 -0.16 -2.54 -3.24 1.9 -- FLKRasWT -- -11.27 -11.73 -0.32 -0.21 -2.58 -3.30 2.0 +150 mM NaCl -- -11.20 -11.74 -0.33 -0.20 -2.57 -3.29 2.0 + Raf-RBD 1:0.4 -11.21 -11.71 -0.24 -2.55 -3.37 4.5 1:0.8 -11.19 -11.68 -0.23 -2.57 -3.46 6.9 1:1.2 -- -11.61 -0.27 -- -3.51 -- Dn1/2 1(T)
[Hz] Dn1/2 2(T)
[Hz] Dn1/2 1(T)/2(T)
a
[Hz] Dn1/2 1(T)
[Hz] Dn1/2 2(T)
[Hz] --
FLHRasWT -- 136.4 80.5 57.5 94.6 58.5 -- FLKRasWT -- 113.0 87.2 54.4 69.0 60.2 +150 mM NaCl -- 125.6 87.6 46.8 80.2 75.4 + Raf-RBD 1:0.4 117.2 108.7 54.9 117.2 104.0 1:0.8 -- -- 64.6 106.6 119.0 1:1.2 130.0 89.3 128.3 All values are fitted from the experimental spectra recorded at 278 K, pH 7.5 with 40 mM Tris/HCl pH 7.5,10 mM MgCl2, 2 mM DTE and 150 mM NaCl. a The given linewidth values for b-phosphate were fitted as a single Lorentzian line. b K12 is given by the ratio of the areas of state 2(T) over state 1(T), calculated at the g-phosphate. The estimated error is ± 0.2. This data is published in ref. [156]. Comparable values are available in the literature in refs. [116,117].

3. Results
88
2.2.4, eqn. n°5) and the obtained thermodynamic parameters are presented here as the
unchanged output of the fitting routine. From the fitted data, a binding ratio of 0.971 and
1.07 was obtained for HRasWT and KRasWT, respectively. The concomitantly obtained KD
values are 0.24 µM (HRas) and 0.72 µM (KRas).
The most interesting finding taken from these measurements is the different affinity of
binding measured for both Ras isoforms: the dissociation constant for KRas is 3-fold higher
than for HRas, leading to the conclusion that HRas has a greater affinity towards Raf than
KRas.
Figure 3.2. Interaction between RasWT•Mg2+•GppNHp and the effector kinase Raf-RBD studied by ITC. A. Measurement performed for HRasWT(1-189). B. Measurement performed for KRasWT(1-188). The upper graphs show raw heat of the reaction with respect to time. The integration of such curve with respect to the molar ratio of Ras:Raf gives the typical sigmoidal curve for the binding process. The experiments were recorded at 298 K. All the proteins were dissolved in the same buffer F with additionally 150 mM NaCl. The signature plots for each interaction are shown alongside with the fitted thermodynamic values. They represent an easy way to understand qualitatively how the reaction is driven (blue: DG, green: DH, red: -TDS).

3. Results
89
3.1.2 Modulation of the Conformational Equilibrium in KRas4bWT by Zn2+-cyclen
Having in consideration the body of work with metal-cyclens and due to the present results
showing the similarities of states 1(T) and 2(T) determined for HRasWT and KRas4bWT, it
was hypothesized that wild type KRas4bWT could be modulated by Zn2+-cyclen in a similar
way as the one reported for HRasWT. To test if this is the case, a titration of both proteins
with this drug was performed. The experiment was already reported in 2005 by our group
for HRasWT [155] but it was repeated herein in order to have identical conditions for
comparison with KRas. The titration of KRas4bWT was performed for the first time in the
framework of this thesis. Meanwhile, both experiments were published in 2014 [156]. Figure
3.3A shows the titrated complexes. In both cases the integrals of the populations
corresponding to state 2(T) decrease with increasing concentrations of the inhibitor,
whereas the integrals of the populations for state 1(T) increase. At the same time the a-
and g-phosphates shift downfield and the b-phosphate shifts upfield. More specifically it can
be observed that the interaction of the ligand with Ras in state 1(T) follows the fast exchange
condition in the NMR time-scale because one obtains only one shifting resonance with
increasing concentrations of the ligand for this particular signal (red coloured line at the g-
phosphate, Figure 3.3A). Considering the titration of HRas, for example, the chemical shift
value for state 1(T) in the ligand free protein is d= -2.53 ppm and the chemical shift value
for the same state when the ligand is bound to the protein (at a ratio of 1:30) is d= -1.61
ppm (see Table A, appendix section). The chemical shift difference between the free and
Zn2+-cyclen bound states is therefore Dd= -1.66+2.52= 0.90 ppm. This corresponds to a Dν≈
200 s-1. A similar value can be found also in the case of KRas (Table A, appendix). As
consequence, it can be estimated that in the limit, the off-rate between Zn2+-cyclen and both
isoforms in state 1(T) needs to be much faster than 200 s-1 (i.e. koff >> 200 s-1).
Regarding state 2(T), no significant shift changes are detected in the course of the titration,
indicating that the slow exchange condition operates in this case. As for the a-phosphate,
a downfield shift of both states is observed during the titration. In the case of b-phosphate,
dramatic changes occur: in the Ras proteins alone, both states cannot be separated at the
magnetic field used. They are detected as a single resonance line centred at d= -0.24 ppm
for HRasWT and d= -0.21 ppm for KRas4bWT. However, as the titration proceeds, states 1(T)
and 2(T) become clearly separated, with state 1(T) shifting upfield and state 2(T) shifting
downfield. At 30 molar equivalents of Zn2+-cyclen (last titration step on Figure 3.3), the
separation between them is of Dd= 1.0 ppm for HRasWT and Dd= 0.77 ppm for KRas4bWT,
respectively (note that the corresponding Dd of 1.0 ppm in this case is equal to the one
obtained above for state 1(T) at the g-phosphate).

3. Results
90
In an attempt to understand the kinetics of the binding mechanism, the chemical shift
change of state 1(T) on the g-phosphate resonance line induced by the addition of Zn2+-
cyclen was plotted as a function of ligand concentration. The result is presented in Figure
3.3B. For both Ras isoforms, very similar results were obtained: the plotted values describe
a sigmoidal behaviour that is indicative of a cooperative binding mechanism: upon binding
of the first molecules of Zn2+-cyclen, an allosteric modulation of the conformation of the
protein is very likely to take place, changing the subsequent affinity of Ras. The data was
Figure 3.3. Titration of RasWT•Mg2+•GppNHp with Zn2+-cyclen followed by 31P NMR spectroscopy. A. Titration of KRas (left) and HRas (right) with increasing concentrations of Zn2+-cyclen (the concentrations are indicated for each step). Both proteins have the same initial concentration of 1.3 mM. The measurements were carried out at 278 K in 40 mM Tris/HCl pH 7.5; 10 mM MgCl2; 2mM DTE; 150 mM NaCl; 0.1 mM DSS; 5%D2O. At high concentrations of Zn2+-cyclen (above 12 mM) additional small NMR signals arise at chemical shifts of 0.3, -6.5 and -10 ppm, corresponding to the g-, b- and a-phosphates, respectively from free Mg2+•GppNHp. No Zn2+-cyclen•Mg2+•GppNHp was detected. B. Plot of the obtained chemical shift changes of the g-phosphate resonance in state 1(T) induced by Zn2+-cyclen as a function of ligand concentration. The sigmoidal pattern of the points was fitted with the Hill equation (eqn. nº11, section 2.2.5.4). The obtained Ddmax value for KRas is 200 ± 3 Hz. The obtained microscopic dissociation constant (KD) is 9.9 ± 0.2 mM, and the Hill coefficient (n) is 2.0 ± 0.1. The corresponding values obtained for HRas are 200 ± 3 Hz; 10.4 ± 0.3 Hz; 1.9 ± 0.1, respectively. C. Optimized structure of Zn2+-cyclen (1,4,7,10-tetraazacyclododecane.Zn2+) complex with chloride counterions. The optimized structure was calculated for the isolated molecule at the DFT/mP1WPW91 level of theory. The detail of the non-planarity of the cyclen ring is shown. Adapted from [156].

3. Results
91
fitted with the Hill equation (experimental section 2.2.5.4, eqn. nº11) leading to Hill
coefficients of 1.9 ± 0.1 and 2.0 ± 0.1 for HRasWT and KRas4bWT, respectively and to an
apparent KD of 9.9 ± 0.1 mM in both cases. The Hill coefficient is a measure of the degree
of cooperativity, and normally, a number close to the number of binding sites is
characteristic of a large positive cooperativity.
Finally, at high concentrations of Zn2+-cyclen additional small resonance lines are observed
in the spectra (this is clearly observed in the last titration step on Figure 3.3A), at d= 0.3, -
6.5 and -10.0 ppm, corresponding to the chemical shift of g-, b- and a-phosphates,
respectively, of the free nucleotide that becomes dissociated from the protein. This is due
most likely to the lowered affinity between Ras and the nucleotide as Zn2+-cyclen
concentration increases the koff (a factor of 3 was observed at 20 mM Zn2+-cyclen). In the
equilibrium (there was no additional nucleotide added to the buffer) this would lead to a
small fraction of nucleotide-free Ras that is less stable and tend to precipitate, during the
rather time consuming 31P NMR experiments (5 to 6 hours per titration step).
3.1.3 Effect of Raf-RBD Titration on the Displacement of Zn2+-cyclen From HRasWT
The displacement of the Ras-Raf interaction by the presence of Zn2+-cyclen is regulated by
an allosteric mechanism. Since in such mechanism the two binding sites are cooperative
and directly coupled it is possible, in principle, to release Ras-bound Zn2+-cyclen from Ras
at high concentrations of effector Raf-RBD. To prove this hypothesis a 31P NMR titration
experiment was performed, starting with the HRasWT•Mg2+•GppNHp•Zn2+-cyclen protein-
drug complex, to which increasing amounts of effector Raf-RBD were added, up to a 1.5-
fold excess. The titration steps are presented in Figure 3.4 and the fitted values for chemical
shift and linewidths are presented in Table B of the appendix section. Initially the Ras-Zn2+-
cyclen complex exists in a conformational state 1(T), with a remaining fraction of state 2(T),
showing a small upfield shift. Upon addition of increasing amounts of Raf-RBD the integral
of the resonance line corresponding to state 1(T) decreases. It is worth note, however, that
its chemical shift and linewidth remains unperturbed (the small deviations presented on
table B for these parameters are within the limits of the error of the fitting procedure). At the
same time, the signal intensity of state 2(T) increases. The final chemical shift values
obtained by line fitting procedures are d= -11.61, -0.19 and -3.56 ppm for a, b and g-
phosphates, respectively. These values are in close similarity with the ones found for the
HRas-Raf complex (Table 3.1). The chemical shift values for Zn2+-cyclen bound state 1(T)
are unperturbed over the whole concentration range of the titration experiment.

3. Results
92
Figure 3.4. Displacement of Zn2+-cyclen from HRasWT upon titration with Raf-RBD followed by 31P NMR spectroscopy. To an initial 1.3 mM Ras protein solution in buffer F (40 mM Tris/HCl pH 7.5; 10 mM MgCl2; 2 mM DTE) with additionally 150 mM NaCl, a great excess of Zn2+-cyclen was added. The concentration of this ligand was kept constant during all the titration steps and equal to 32 mM. The Ras•Zn2+-cyclen complex thereby formed was titrated with increasing amounts of Raf-RBD up to a final concentration of 2.0 mM. The final Ras concentration was 0.8 mM. The dotted lines indicate the chemical shift position corresponding to Ras in the effector-bound conformational state 2(T)*. Additional small signals are visible when Ras becomes saturated with Zn2+-cyclen, corresponding to the g-, b-, a-phosphate groups of the free nucleotide, located at d= 0.3, -6.5 and -10.0 ppm, respectively. All the experiments were performed at 278 K and data fitted with an artificial Lorentzian line broadening of 15 Hz. For a better assessment of the evolution of the conformational equilibria during the titration, state 1(T) was coloured red and state 2(T) was coloured green. This data is published in ref [156].

3. Results
93
3.1.4 Conformational Equilibria of KRasG12D•GTP and KRasG12V•GTP
The equilibrium of the GTP-bound KRasWT, together with the two oncogenic mutants
KRasG12D and KRasG12V was investigated by 31P NMR. The experimental spectra are shown
in Figure 3.5 and the fitted chemical shifts and linewidths are listed in Table 3.2.
Experimentally, the nucleotide exchange from GDP to GTP is a statistical process solely
based in the great excess of the GTP nucleotide that is added to Ras-GDP bound protein
(20 to 30-fold). This is the reason why the exchange is typically incomplete and the two
resonance lines located at d= -10.58 and -2.00 ppm, corresponding to the a- and b-
phosphates of GDP-bound Ras, are observed in the spectra. For RasWT, about 74%
exchange was obtained. For the oncogenic variants the value is usually higher as they tend
to be less prone to release the nucleotide, with a 82% exchange for KRasG12D and, 100%,
exchange for KRasG12V. The most striking difference between the three proteins, however,
is related with the dynamics observed at the g-phosphate. In fact, the spectra of KRasWT
and KRasG12D shows that state 1(T) is almost non-detectable and lies in the limits of the
noise. For both proteins, the equilibrium constant, K12, cannot be determined as only state
2(T) is detectable. On the other hand, state 1(T) can be directly observed in KRasG12V at d=
-6.01 ppm. The corresponding equilibrium constant is K12= 11.60. A similar value is reported
elsewhere [123]. From the present data it is also observed a significant downfield shift of
state 2(T) in RasG12V (d= -7.51 ppm) compared with RasWT (d= -7.94 ppm) and RasG12D (d=
-7.93 ppm). From the calculation
of the linewidths (Table 3.2) it is
detected a general broadening
of the lines in the case of both
mutants, as compared to the
wild type, which can be
explained by different time
scales of the exchange
broadening process between
conformational sates on RasWT
as compared to RasG12D and
RasG12V. Figure 3.5. Comparison between the 31P NMR spectra of GTP-bound full length KRasWT (bottom), KRasG12D (middle) and KRasG12V (top). The a-, b- and g-phosphates are indicated, along with the corresponding states 1(T) (red colour) and 2(T) (green colour). The samples were dissolved in buffer F with additionally 0.2 mM DSS and 5% D2O. Measurements were carried at 278 K at a 31P frequency of 202.456 MHz. The concentration of the three proteins, from the bottom to the top, is 1.5 mM, 2.7 mM and 0.65 mM, respectively. The dashed lines mark the chemical shift position of the wild type protein.

3. Results
94
3.1.5 Modulation of the Equilibrium in KRasG12D•Mg2+•GppNHp by Zn2+-cyclen
It can be generalized in principle, that the mode of action of state 1(T) inhibitors can be
extended from wild type Ras to partial-loss-of-function mutants and to oncogenic variants.
To test this hypothesis a titration of KRasG12D with Zn2+-cyclen was performed. The results
are presented graphically in Figure 3.6 and the fitted shift values and linewidths are given
in Table C in the appendix section. The experiment follows the same features reported for
KRasWT in section 3.1.2 and leads to the same general result: upon addition of increasing
amounts of the drug, state 1(T) is stabilised (its relative area increases) and the population
of the conformational state 2(T) decreases. At the same time state 1(T) shifts downfield (the
corresponding Dd is 0.78 ppm, from d= -2.48 to d= -1.70 ppm, Table C appendix) and state
2(T) shifts slightly upfield (Dd= -0.08 ppm, from d= -3.54 to d= -3.62 ppm). Similar shifts are
observed in the case of KRasWT (note that the highest molar ratio of Ras:Zn2+-cyclen is not
the same in the two experiments. In the case of KRasWT the last step corresponds to a ratio
of 1:30 and in the case of KRasG12D the ratio is only 1:9). In the last titration step (ratio 1:9)
of KRasG12D, the appearance of sharp resonance lines corresponding to the existence of
free nucleotide in solution is again observed for the afree and bfree-phosphates at d= -10.02
ppm and d= -6.22 ppm, respectively. The chemical shift of the gfree-phosphate (occurring
normally at ca. d= -1.08 ppm) is presently superimposed with state 1(T) and therefore
cannot be detected. The presence of inorganic phosphate (Pi) and GMP can also be
identified at d= 3.80 and d= 2.34 ppm, respectively. It is worth mention that the 31P NMR
spectra of both proteins in the absence of the drug (bottom spectra in Figures 3.4 and 3.6)
Table 3.2. 31P NMR chemical shift values and linewidths of the full length (1-188/189) Mg2+•GTP-bound proteins KRasWT, KRasG12D and KRasG12V.
Protein a-phosphate b-phosphate g-phosphate aGDP bGDP Pi
d1(T)/2(T) [ppm]
d1(T)/2(T) [ppm]
d1(T) [ppm]
d2(T) [ppm]
d [ppm]
d [ppm]
d [ppm]
KRasWT -11.68 -14.87 -- -7.94 -10.58 -2.00 2.64 KRasG12D -11.56 -14.76 -- -7.93 -10.59 -2.26 2.48 KRasG12V -11.56 -14.74 -6.01 -7.51 -- -- --
a-phosphate b-phosphate g-phosphate aGDP bGDP Pi Dn1/2 1(T)/2(T)
[Hz] Dn1/2 1(T)/2(T)
[Hz] Dn1/2 1(T)
[Hz] Dn1/2 2(T)
[Hz] Dn1/2 [Hz]
Dn1/2 [Hz]
Dn1/2 [Hz]
KRasWT 64.20 45.74 -- 40.88 44.67 31.32 2.16 KRasG12D 75.20 75.20 -- 48.79 63.27 43.35 7.33 KRasG12V 98.06 71.74 33.03 63.90 -- -- --
The calculated shift values and linewidths have an error of ±0.001 and ±0.1, respectively. An exponential filter of 15 Hz was applied to the FID and subtracted afterwards from the fitted linewidths. a States 1(T) and 2(T) cannot be separated at the magnetic field used and are therefore represented as single resonance line.

3. Results
95
show also a different equilibria between states 1(T) and 2(T): for KRasWT, K12= 1.9 and for
KRasG12D K12= 0.7 (measured at the g-phosphate, Tables A and C in the appendix section,
respectively).
Figure 3.6. Titration of KRasG12D(1-188)•Mg2+•GppNHp with Zn2+-cyclen followed by 31P NMR spectroscopy at 278 K. To an initial amount of 1.4 mM of protein dissolved in buffer F (40 mM Tris/HCl pH 7.5; 10 mM MgCl2; 2mM DTE; 0.1 mM DSS; 5% D2O) with additionally 150 mM NaCl, increasing amounts of Zn2+-cyclen were added (the concentrations are indicated for each step). In the course of the titration, state 2(T) (indicated in green) shifts slightly upfield by a Dd= -0.08 ppm and state 1(T) (indicated in red) shifts downfield by a Dd= 0.78 ppm. New additional signals appear in the last steps of the titration, comprising the b- and a-phosphates from the free nucleotide, at d= -6.22 and d= -10.02 ppm, respectively. Inorganic phosphate (Pi) is also visible at d= 3.80 ppm. 31P resonances were recorded in a magnetic field operating at a frequency of 202.456 MHz. An EM window with LB= 15 Hz was used during the processing of the FID.

3. Results
96
- This page was deliberately left blank -

3. Results
97
3.2 Inhibition of KRasG12D(1-188)•Mg2+•GppNHp Investigated by 31P NMR and ITC
Direct inhibition of KRas along with the inhibition of Ras-effector and Ras-GEF interactions,
are presently topics of very active and intensive research, not only in academia but also at
the pharmaceutical industry. 31P NMR was used herein to screen for modifications on the
conformational equilibria of oncogenic KRasG12D(1-188) bound to GppNHp upon interaction
with a library of 15 different small drugs. The work reported in this section was performed
in collaboration with Boheringer Ingelheim GmbH. The compounds were kindly provided by
the R&D department of the company and tested by our group. Some of them were already
disclosed to the public domain.
In order to achieve good reproducibility all the KRasG12D•Mg2+•GppNHp samples used were
exchanged to the same buffer F (40 mM Tris/HCl pH 7.5; 10 mM MgCl2; 2 mM DTE; 0.2
mM DSS) in 10% D2O, aliquoted in equal fractions of 1.0 mM each and frozen at -80 ºC. All 31P NMR experiments were performed at 278 K in a magnetic field operating at 202.456
MHz, using a selective 31P 10 mm probe with either 8 or 10 mm Shigemi tubes. For each
measurement, 500 µl, 1mM of protein were used. A 70º degree pulse was applied with a
total repetition time of 7 seconds. Three spectra with 1600 scans each were recorded,
combined and summed up. All the compounds tested were provided by Boheringer as a
powder. They were afterwards dissolved in deuterated DMSO with a final concentration of
50 mM. KRasG12D was titrated in two steps: by adding in total 15 µl (first step) followed by
30µl (second step) of the compound stock. This corresponds to a 1.5 mM and 3.0 mM drug
concentration, respectively. The KRasG12D concentration was always kept at 1.0 mM.
For all the screened compounds, the equilibrium constant K12 was calculated after fitting of
the data. An exponential line broadening of 15 Hz was applied to all spectra and subtracted
at the end from the fitted linewidth values. Following are presented the obtained results from
this study.

3. Results
98
3.2.1 Effect of DMSO
Because all compounds were dissolved in perdeuterated DMSO, the influence of this
solvent alone in the conformational equilibrium was firstly tested. Ras was dissolved in 6%
DMSO, corresponding to the highest concentration used in this work, and the 31P NMR
spectra were recorded. The analysis was made for the g-phosphate to which the states are
best separated. The result is presented in Figure 3.7. Addition of DMSO leads to chemical
shift changes that cannot be neglected. Both states, 1(T) and 2(T) undergo a upfield shift,
with a Dd of -0.08 ppm for the former and -0.04 ppm for the latter. The a- and b-phosphates,
on the other hand, remain unperturbed. DMSO also leads to a general broadening of all
spectral lines of ca. 8.0 Hz, except for state 2(T) that remains unaltered. The obtained
equilibrium constant decreases from 0.70 to 0.64, corresponding to a 10% difference,
which, although small, needs to be accounted in the subsequent titration experiments. All
the fitted chemical shift values for all the tested compounds are shown in Table 3.3 at the
end of section 3.2. The fitted linewidths are presented in Table 3.4. In all experiments, the
a- and b-phosphates were fitted as a single resonance line.
Figure 3.7. Influence of 6% DMSO on the conformational equilibria of KRasG12D•Mg2+•GppNHp.

3. Results
99
3.2.2 Compound #16324643
Upon titration with #643, a slight line
broadening was observed for state
1(T). At 3.0 mM, K12 decreases from
0.64 to 0.57, indicating a shift of the
equilibrium towards state 2(T), which
is unexpected since in the presence
of the drug, the weak effector binding
state 1(T) should in principle be
favoured. The 11% difference might
be not significant due to the spectral
noise and the inherent uncertainty of
the fitting process.
3.2.3 Compound #16328098
Compound #098 promotes a change
in the equilibrium constant from 0.64
to 0.72, with state 2(T) being slightly
favoured over state 1(T). This
corresponds to a small difference of
12% in K12 when compared with Ras
in 6% DMSO. The fitted chemical
shifts and linewidths remain
unperturbed.
3.2.4 Compound #35127727
This drug was identified as an inhibitor of the SOS-catalysed KRas activation by the Fesik
group upon a fragment-based screening using NMR methods [145]. It was determined that
the molecule binds directly to KRasG12D•Mg2+•GDP but also to H- and KRasWT in a
hydrophobic pocket formed by Val7, Leu56 and Tyr71. H-bond contacts are established
between the N1 atom of the imidazopyridine ring and the side chain of Ser37 and between
indole -NH groups and the side chain of Asp54. Figure 3.10 shows the cartoon and
Figure 3.8. Titration of KRasG12D•Mg2+•GppNHp with compound #643.
Figure 3.9. Titration of KRasG12D•Mg2+•GppNHp with compound #098.

3. Results
100
molecular surface representation of the Ras•#727 complex (pdb: 4epv) and the 31P NMR
titration. The equilibrium constant decreases 40% at a 3.0 mM concentration, leading to a
pronounced effect in the dynamics of states 1(T) and 2(T). There are significant chemical
shift changes observed for b-phosphate that shifts upfield by a Dd= -0.07 ppm and for state
1(T) that shifts downfield by a Dd= 0.08 ppm at a 3.0 mM of the Drug (Table 3.3). A 22 Hz
decrease in line broadening is observed for state 1(T) (from Dn1/2=154 to Dn1/2= 138 Hz)
and, at the same time, an increase of 38 Hz is observed for state 2(T) (from Dn1/2= 69 to
Dn1/2= 106 Hz, Table 3.4).
Figure 3.10. A. Surface representation of the crystal structure of KRas•Mg2+•GDP complexed with the compound #727. The switch 1 and switch 2 regions are represented in dark-red and green, respectively. The spatial localization of the small drug relative to the nucleotide position is shown (pdb: 4epv, [145]). B. Zoom around the binding site evidencing the hydrophobic region were the compound fits. C. Titration of KRasG12D•Mg2+•GppNHp with the drug followed by 31P NMR spectroscopy. The 2D structure of the compound (an indole derivate) is shown.

3. Results
101
3.2.5 Compound #35139703
The compound #703 was not
completely soluble when mixed with
the protein. A slight precipitation was
observed in the NMR tube which is
reflected by the decrease of intensity
on the spectra presented in Figure
3.11 (the spectra was “stretched”
vertically – note the difference in the
noise level compared with KRasG12D
in DMSO). No considerable chemical
shift changes are observed except for
the a-phosphate that moves upfield
by Dd= -0.1 ppm. The difference in
the K12 values is not meaningful (from 0.64 to 0.68 at a drug concentration of 3.0 mM).
3.2.6 Compound #35141449
Upon addition of the compound #449
to Ras, slight precipitation was
observed. The equilibrium constant at
3.0 mM is 0.68, corresponding to an
6% increase compared to Ras alone
in 6% DMSO. The difference is within
the limits of the error for the
measurement and is not significant.
An average line broadening of ca. 24
Hz is also observed at 3.0 mM for all
the resonance lines, except for the b-
phosphate that remains unperturbed.
An upfield shift of -0.09 and -0.06 ppm is observed for the a- and b-phosphates,
respectively. The g-phosphate remains unperturbed.
Figure 3.12. Titration of KRasG12D•Mg2+•GppNHp with compound #449.
Figure 3.11. Titration of KRasG12D•Mg2+•GppNHp with compound #703.

3. Results
102
3.2.7 Compound #35145071
This drug is a cyclic peptide obtained by Pei and co-workers through application of the
“rapalog” methodology upon screening of a large combinatorial library against
KRasG12V•Mg2+•GDP [246]. Interaction studies using fluorescence polarization and SPR
showed that #071 binds to KRasG12V with high affinity (KD=0.83 µM) and is also able to
disrupt the Ras-Raf interaction with an IC50 of 0.2 µM [247].
The 31P NMR titration experiments showed that the addition of this compound to KRasG12D
led to protein precipitation in the NMR tube. This is also noticeable by the reduction of the
spectral intensity in Figure 3.13B. The equilibrium constant at 1.5 mM is 0.58, which is not
significantly different from the K12 value for Ras in 6% DMSO (due to the poor spectral
quality, the calculation of K12 has a greater associated error of ± 0.4). At a drug
concentration of 3.0 mM, the resonance lines are broadened almost behind detection and
most of the protein became precipitated, rendering impossible the analysis of this titration
step. A general increase in the line broadening is observed, especially for state 1(T)
(Dn1/2=105 Hz, Table 3.4).
Figure 3.13. A. Representation of the “rapalog” cyclic peptide #071. B. Titration of KRasG12D•Mg2+•GppNHp with increasing amounts of the compound followed by 31P NMR spectroscopy.

3. Results
103
3.2.8 Compound #35117109
Contrary to all the compounds tested,
where a 50 mM stock solution for
each one was prepared prior to the
titration, the solubility of compound
#109 was very limited. Only a
saturated 25 mM solution was
prepared in this case. Upon addition of 50 µl to the protein, there were no obvious spectral
changes (Figure 3.14). At 1.5 mM of drug, K12= 0.70, corresponding to an increase of 10%
compared to the K12 of Ras in 6% DMSO, a difference that again is not significant. Also, no
significant chemical shift differences from the values obtained for Ras alone in 6% DMSO can
be found. The only meaningful effect is an increase of the line broadening for state 2(T) (DDn1/2=
28 Hz, from Dn1/2= 68 Hz in Ras alone to Dn1/2= 97 Hz in the presence of #109).
3.2.9 Compound #35129755
#755 is an indol derivative with a methylbutanamide group whose synthesis was previously
reported by Fesik and co-workers [145]. Its structure is presented in Figure 3.15 (the
derivatised functional group is indicated by the red circle) along with the corresponding 31P
NMR titration series.
Titration of KRasG12D led to a drastic modification in the conformational equilibria of states
1(T) and 2(T). At 1.5 mM, the equilibrium constant was reduced by 38% and at 3.0 mM it
decreased by 70% (from 0.64 to 0.19, Table 3.3). Interestingly, no appreciable line
broadening of the signals or significant chemical shift changes are observed during the
course of the experiment. There is no information in the literature regarding structural details
of the binding mechanism to Ras, neither affinity or kinetic data. From the 31P NMR results
Figure 3.14. Titration of KRasG12D•Mg2+•GppNHp with compound #109.
Figure 3.15 A. Structural representation of the compound #755. B. Titration of KRasG12D•Mg2+•GppNHp with increasing amounts of the compound followed by 31P NMR spectroscopy.

3. Results
104
it seems nevertheless that this small molecule is able to greatly modify the equilibrium
population by stabilising state 1(T). In light of these results it was decided to test it further
by measuring its ability to disrupt the Ras-Raf complex formation by ITC, with the
expectation to retrieve thermodynamic and affinity data. Since in the course of the NMR
titration the population of state 2(T) decreases through the shift of equilibrium towards state
1(T), one can hypothesize that the affinity of KRasG12D to Raf should decrease when
increasing amounts of the drug are added to the system under equilibrium conditions.
Figure 3.16A-D shows the ITC profile of the experiment that was conducted. All the
measurements were done at 298 K in buffer F with additionally 150 mM NaCl and 3%
DMSO. The affinity between KRasG12D and Raf-RBD was initially measured alone (Figure
3.16A). In this case, a total of 19 injections of Raf-RBD (679 µM, located in the syringe) with
a volume of 2 µl each were added to KRasG12D•Mg2+•GppNHp (60 µM, located in the cell).
The thermodynamic parameters were calculated by nonlinear regression analysis using an
iterative routine (eqn. nº5, experimental section 2.2.4). During the optimization process all
the parameters were allowed to vary freely and are presented here as the final unchanged
output from the program. The results indicate a 1:1 binding (N=1) and an obtained apparent
KD= 0.38 µM. Compared to the obtained values for KRasWT (KD= 0.72 µM, section 3.1.1)
one can find that the affinity of KRasG12D towards Raf is 2-fold higher than KRasWT.
The ability to disrupt the Ras-Raf interaction in the presence of the compound #755 was
tested using the same experimental conditions as described above for Ras-Raf (same
temperature, buffer and pH). KRasG12D (35 µM) was placed in the adiabatic cell of the
calorimeter. Raf (always at a concentration of 450 µM) was mixed beforehand with
compound #755, the mixture was placed in the syringe and the Ras protein was titrated by
performing 31 injections of 1.3 µl each, with an interval time of 150 s. Three consecutive
measurements, with increasing concentrations of #755 were tested (Figure 3.16B-150 µM,
C-300 µM and D-500 µM).
The first feature observed from the titration conducted in the presence of the drug is related
to differences in the baseline (Figure 3.16B-D) when compared to the titration of Ras-Raf
alone (Figure 3.16A): for all the three concentrations tested the differential power plot shows
strong baseline perturbations over the complete duration of the experiment. These seem to
be accentuated as the concentration of the drug increases and are not observed in the
isotherm of Ras-Raf alone, nor for any control experiments performed (buffer-in-buffer,
buffer-in-Ras, Raf-in-buffer, #755-in-Raf). They are therefore due to the presence of the
compound. A possible explanation can be related with the existence of microscopically
precipitated or aggregated Ras or Raf proteins by its presence (although no precipitation

3. Results
105
was observed when the solutions were being mixed nor during NMR experiments).
Nevertheless, an initially high heat of injection was obtained in all measurements, which still
allowed the obtention of a well-defined binding curve. The inhibitory effect of #755 in
complex formation can be clearly observed: the KD of the Ras-Raf interaction increases by
a 5-fold factor with increasing concentrations of the drug, from 0.41 µM at 150 mM to 1.94
µM at 500 mM. The affinity between the two proteins is indeed disrupted by the action of
#755.
It is noteworthy the fact that all the four interaction experiments proceed with a very similar
variation in the Gibbs energy. The presence of the compound has no interference in the
degree of spontaneity of the association reaction. The Ras-Raf interaction alone has a
slightly greater enthalpic contribution (DH= -23.4 kJ mol-1) as compared to the entropy
variation (-TDS= -13.3 kJ mol-1). However, upon addition of #755, the profile changes and
the entropic contribution is now greater than the enthalpic one. This is observed at all
concentrations of #755 tested.
Figure 3.16. Titration of KRasG12D•Mg2+•GppNHp with the effector Raf-RBD in the presence of the compound #755 followed by ITC. All the experiments were done at 298 K and in the same buffer F (40 mM Tris/HCl pH 7.5, 10 mM MgCl2, 2 mM DTE) with additionally 150 mM NaCl and 3% DMSO. A. The Ras-Raf interaction was firstly tested alone. The effect of #755 in the affinity of the complex was tested for three different concentrations of the drug: 150 µM (B), 300 µM (C), and 500 µM (D). In all the cases Ras was placed in the cell and Raf, previously mixed with #755 in the desired concentration, was placed in the syringe of the calorimeter. The concentration of both proteins was kept constant while testing the effect of #755. For each experiment, the thermogram is represented as heat per unit of time (upper plot) and as the integrated heat for each injection per ratio of the Ras-Raf complex (lower plot). The signature plot is also shown along with the obtained thermodynamic values. Blue: DG, green: DH, red: -TDS.

3. Results
106
3.2.10 Compound #35129757
#757 is an amino acid analogue consisting of a proline linked to an indole-benzimidazole
moiety that was also developed through derivatization of the same parental compound by
the Fesik group [145]. Structural studies have shown that #757 binds to
KRasG12V•Mg2+•GDP with a KD= 340 µM. The indole moiety binds to the primary binding
cleft, similarly to #727 described in section 3.2.4 and the bezimidazole moiety, being
positive in nature, binds to a nearby secondary electronegative cleft, with the proline
nitrogen of #757 interacting with the carboxylic side chain of Asp38 (similarly to #755
described above) [145].
Figure 3.17 shows the X-ray structure of #757 bound to KRasG12V•Mg2+•GDP (pdb: 4epy)
along with the 31P NMR titration on KRasG12D•Mg2+•GppNHp. Similarly to compound #755,
dramatic spectral changes are observed in the equilibrium between states 1(T) and 2(T) by
the action of #757: at 1.5 mM, K12 is reduced by 45% and at 3.0 mM it decreased by 69%
(from 0.64 to 0.20, Table 3.3). Only state 1(T) undergoes a significant downfield shift of Dd=
0.1 ppm (from d= -2.56 to d= -2.47 ppm) upon addition of 3.0 mM of the drug, with the other
resonances remaining unperturbed.
Figure 3.17. A. Molecular surface representation of KRasG12V•Mg2+•GDP complexed to the compound #757 (pdb: 4epy, [145]). The relative orientation of #757 and GDP is depicted. The surface of the protein is coloured in grey except for the residues comprising switch 1 and switch 2, which are coloured in red and green, respectively. B. Detail around the binding site of #757. The indol moiety of the drug is buried in the first cleft and contacting the carboxylic chain of Asp54. The benzimidazole moiety is located in the second binding cleft and stabilised by polar contacts to Glu38, Ser39 and H2O molecules. C. Titration of KRasG12D•Mg2+•GppNHp with #757 followed by 31P NMR spectroscopy.

3. Results
107
The disruption of the Ras-Raf complex was tested by ITC using the same experimental
design as described above. Figure 3.18 shows the obtained results for the interaction in the
presence of 150 µM (B) and 300 µM (C) of #757. From the recorded differential power it
can be inferred that each injection yields large peaks, even at the end of the titration, when
all the Ras protein is virtually saturated with an excess of Raf and the heat variation should
be minimal. As an injection is made into the sample cell, friction force of the ligand being
injected, slight temperature mismatches between both solutions, and/or any mismatch of
the Ras and Raf buffers will lead to a heat known as the heat of dilution. In this case, as for
all the ITC measurements performed within the work of this thesis, all proteins were dialyzed
against the same buffer prior the experiment. Control tests involving only the injection of
buffer into buffer yielded a residual heat of mixture below 0.1 µcal s-1. However, it was not
possible dialyze the drug alone due to its small size and lyophilization was impractical due
to the presence of DMSO. Therefore, the large peaks from the heat of mixture can be
ascribed to discrepancies in the composition of the buffer in the syringe caused by its
presence. Nevertheless, it was still possible to detect binding events as observed by the
Figure 3.18. Titration of KRasG12D•Mg2+•GppNHp with Raf-RBD in the presence of the compound #757 followed by ITC. All the experiments were done at 298 K in the same buffer F (40 mM Tris/HCl pH 7.5, 10 mM MgCl2, 2 mM DTE) with additionally 150 mM NaCl and 3% DMSO. A. The Ras-Raf interaction was firstly tested alone. The effect of compound #757 was subsequently studied at two different concentrations: 150 µM (B) and 300 µM (C). Tests with higher concentrations rendered impossible the determination of a binding curve due to excessive drifts detected in the baseline. In all experiments, Ras was placed in the cell and Raf, previously mixed with #757 in the desired concentration, was placed in the syringe. Note that the Raf concentration is not constant. The raw heat of the reaction is plotted in the upper graph and the integrated heat per Ras:Raf ratio is shown in the lower graph. The signature plot is also shown with the following colour code: blue: DG, green: DH, red: -TDS.

3. Results
108
typical sigmoidal behaviour of the integrated heats on Figure 3.18B and C. The presence
of the compound #757 has a remarkable inhibitory effect on the interaction between the two
proteins. The KD of the interaction changes from 0.39 µM to 3.54 µM at 300 µM of #757,
corresponding to a 9-fold decrease on the affinity of the protein complex.
3.2.11 Compound #35131307
Compound #307 is an analogue of
the inhibitor Sulindac sulphide [147]
whose structure and mechanism of
action towards KRas have not yet
been disclosed to the scientific
community. Figure 3.19 shows its
influence in the equilibrium of the
conformational states detected by 31P
NMR. At a concentration of 3.0 mM,
the equilibrium constant is 0.41, a
value that compared to the Ras
sample in 6% DMSO, corresponds to
a clearly significant reduction of 36%.
3.2.12 Compound #35131308
Compound #308 is another analogue of Sulindac sulphide developed in parallel with the
compound #307. Titration of KRasG12D
showed that significant spectral changes
are observed for the conformational
states at the g-phosphate. These
changes have the same order of
magnitude as the ones induced by
compound #307, indicating that they are
most likely structurally related. At a 3.0
mM concentration, the equilibrium
constant is 0.46, corresponding to a
reduction of 28% compared to Ras in 6%
DMSO. Also, a downfield shift by a Dd=
Figure 3.19. Titration of RasG12D•Mg2+•GppNHp with compound #307.
Figure 3.20. Titration of RasG12D•Mg2+•GppNHp with compound #308.

3. Results
109
0.08 and Dd= 0.1 ppm is observed for states 1(T) and 2(T), respectively. The b-phosphate,
usually unperturbed, also shifts upfield in this case, with a Dd= -0.07 ppm.
3.2.13 Compound #35135612
#612 is another indol-based molecule containing a methylpentanamide functional group
synthesized by Fesik and co-workers [145]. The functional derivatised moiety is highlighted
by the red circle in Figure 3.21A and the titration series is presented in Figure 3.21B.
Addition of #612 to Ras led to one of the greatest modifications in the equilibrium in terms
of states 1(T) and 2(T) from all the investigated drugs. At 1.5 mM K12 is reduced by 38%
and at 3.0 mM it decreases further to 70% (from 0.64 to 0.19, Table 3.3). The observed
spectral changes are similar to the ones measured for the compound #755.
3.2.14 Compound #35135613
#613 is the parental indole-benzimidazole molecule that was used for the initial
derivatization performed by Fesik and co-workers [145]. Several amino acid-linked
analogues containing positively charged amine groups were synthesized using this scaffold.
The point where #613 was derivatised is represented by the red circle on Figure 3.22A. The
above tested compounds #755 #757 and #612 are its direct analogues obtained by this
method. Studies conducted by the same group had shown that it binds
KRasG12D•Mg2+•GDP with the lowest affinity of the series (KD= 1.3 mM) and has no inhibitory
effect in SOS-catalysed nucleotide exchange assays. Unfortunately, due to the limitations
in the amount of KRasG12D available it was not possible to perform calorimetric
measurements with #613. Figure 3.22B shows the 31P NMR titration series and the effect
Figure 3.21 A. Representation of the compound #612. The derivatised moiety is highlighted B. Titration of KRasG12D•Mg2+•GppNHp with increasing amounts of the compound followed by 31P NMR spectroscopy.

3. Results
110
on the conformational equilibrium of KRasG12D. Similarly to its derivatives, #613 promotes a
drastic decrease in the equilibrium constant from 0.64 to 0.31 at a concentration of 3.0 mM.
Significant chemical shift changes are also observed, especially for state 1(T) that moves
downfield by a Dd of 0.17 ppm, accompanied by a decrease in line broadening of ca. 40 Hz.
3.2.15 Compound #35135624
#624 is a sulfonamide containing an aminopyridin fluorbenzen moiety synthesized by the
Fesik group [145]. The X-ray structure of the KRasG12D•Mg2+•GDP•#624 complex (pdb:
4epx) shows that the pyridine nitrogen atom is bound to the side chains of Asp54, Arg41
and Ser39 through mediated H2O interactions (Figure 3.23A). The 31P NMR experiments
revealed that, as for all the Fesik compounds, the binding of #624 to KRasG12D leads to
significant spectral changes. The equilibrium constant at 3.0 mM is reduced to 0.28,
corresponding to a 60% decrease compared to the Ras protein in 6% DMSO. At the same
time, the most significant chemical shift changes from all the tested compounds are
observed herein: the a- and b-phosphates shift downfield and upfield by Dd= ±0.1 ppm,
respectively and state 2(T) undergoes a very large downfield shift, with a Dd= 0.4 ppm (from
d= -3.49 to d= -3.09 ppm, Table 3.3). In parallel, a decrease in the linewidth of state 1(T) by
48 Hz and an increase in the one of state 2(T) by 58 Hz is detected, both indicating a
modification in the rates of the conformational exchange between states 1(T)/2(T) induced
by this drug.
Figure 3.22. A. Representation of the compound #613. This is the parental molecule whose derivatization lead to the synthesis of compounds #755, #757 and #612 through an amide coupling process at the amine group of the benzoimidazol moiety (red circle). B. Titration of KRasG12D•Mg2+•GppNHp with increasing amounts of the compound followed by 31P NMR spectroscopy.

3. Results
111
3.2.16 Compound #35135616
#616 is another indole derivative containing a dichloro aminoethyl moiety developed by Till
Maurer and co-workers in collaboration with Genentech Inc. [18]. This small molecule was
given the abbreviated designation of DCAI and it binds to KRasG12D•Mg2+•GMPCP in the
same cleft that accommodates the compounds from the Fesik group (pdb: 4dst, Figure
3.24A and B). Studies had shown that the apparent KD of the interaction with Ras is 1.1
mM. From the present 31P NMR titration experiments, DCAI leads to a shift in the equilibrium
constant in the opposite direction of all the other compounds tested, favouring an increase
of the state 2(T) over state 1(T). At 3.0 mM, K12= 1.05, which corresponds to an increase
by 65%. At the same time both, the b-phosphate and state 2(T) shift downfield by a Dd of
0.1 ppm. ITC binding studies performed here showed that the compound is indeed capable
of inhibiting the formation of the Ras-Raf complex (Figure 3.25). At 300 µM of the drug, the
affinity of the protein complex decreases 10-fold compared with the obtained values for
Ras-Raf alone (KD= 3.53 µM vs 0.38 µM). The titration was recorded with a very pronounced
heat of mixture, which even with the best efforts, was impossible to minimize further. From
the signature plot one can observe that the reaction proceeds with a negative entropic
contribution in the presence of DCAI.
Figure 3.23. A. Molecular surface representation of KRasG12V•Mg2+•GDP complexed to the compound #624 (pdb: 4epx, [145]). The relative orientation of #624 and GDP is depicted. The surface of the protein is coloured in grey except for the residues comprising the switch 1 and switch 2, which are coloured in red and green, respectively. B. Detail around the binding site of #624.The blue spheres represent water molecules through which the pyridine NH2, the ortho and the sulfonil nitrogen atoms bind. Note that this binding pocket is common for all the compounds tested from the Fesik group (#624, #755, #757, #613, #612). C. Titration of KRasG12D•Mg2+•GppNHp with #624 followed by 31P NMR spectroscopy. The molecular structure of this drug is represented.

3. Results
112
Figure 3.24 A. Molecular surface representation of KRasG12d•Mg2+•GMPPCP complexed to the compound #616 (DCAI, pdb: 4dst, [18]). The relative orientation with respect to the nucleotide is depicted. The surface of the protein is coloured in grey except for the residues comprising the switch 1 and switch 2, which are coloured in red and green, respectively. B. Detail around the binding site of DCAI. C. Titration of KRasG12D•Mg2+•GppNHp with DCAI followed by 31P NMR spectroscopy. The molecular structure of this drug is represented.
Figure 3.25. Binding between KRasG12D•Mg2+•GppNHp and Raf-RBD in the presence of the compound #616 (DCAI) followed by ITC. All the experiments were done in duplicate, at 298K and in the same buffer F (40 mM Tris/HCl pH 7.5, 10 mM MgCl2, 2 mM DTE) with additionally 150 mM NaCl and 3% DMSO. The Ras-Raf interaction was firstly tested alone (A) and upon addition of 300 µM of the drug (B). The raw heat of the reaction is plotted in the upper graph and the integrated heat per Ras:Raf ratio is shown in the lower graph. The signature plot is also shown with the following colour code: blue: DG, green: DH, red: -TDS.

3. Results
113
Table 3.3. 31P NMR chemical shift values for KRasG12D(1-188)•Mg2+•GppNHp in 6% DMSO and in complex with a library of 15 different inhibitors.
Protein Complex p:l
a-phosphate b-phosphate g-phosphate K12
b d1(T)/2(T)a
[ppm]
d1(T)/2(T)a
[ppm]
d1(T) [ppm]
d2(T) [ppm]
KRasG12D -- -11.49 -0.37 -2.48 -3.53 0.70 + 6% DMSO -- -11.51 -0.40 -2.56 -3.49 0.64 + #643 1:1.5 -11.55 -0.36 -2.50 -3.40 0.60
1:3.0 -11.52 -0.42 -2.57 -3.48 0.57 + #098 1:1.5 -11.54 -0.40 -2.46 -3.50 0.69 1:3.0 -11.57 -0.45 -2.50 -3.49 0.72 + #727 1:1.5 -11.47 -0.42 -2.47 -3.48 0.48 1:3.0 -11.50 -0.47 -2.48 -3.48 0.41 + #703 1:1.5 -11.56 -0.42 -2.50 -3.51 0.59 1:3.0 -11.55 -0.42 -2.51 -3.48 0.68 + #449 1:1.5 -11.56 -0.41 -2.56 -3.49 0.62 1:3.0 -11.60 -0.46 -2.59 -3.53 0.68 + #071 1:1.5 -11.45 -0.40 -2.46 -3.53 0.58 1:3.0 -- -- -- -- -- + #109 1:1.5 -11.51 -0.45 -2.53 -3.49 0.72 1:3.0 -- -- -- -- -- + #755 1:1.5 -11.44 -0.42 -2.54 -3.48 0.40 1:3.0 -11.42 -0.43 -2.55 -3.44 0.19 + #757 1:1.5 -11.45 -0.43 -2.49 -3.46 0.29 1:3.0 -11.46 -0.44 -2.47 -3.48 0.20 + #307 1:1.5 -11.54 -0.45 -2.51 -3.49 0.56 1:3.0 -11.53 -0.45 -2.54 -3.45 0.41 + #308 1:1.5 -11.50 -0.40 -2.49 -3.47 0.60 1:3.0 -11.53 -0.47 -2.48 -3.40 0.46 + #612 1:1.5 -11.43 -0.39 -2.51 -3.39 0.40 1:3.0 -11.43 -0.41 -2.53 -3.41 0.24 + #613 1:1.5 -11.45 -0.43 -2.40 -3.45 0.49 1:3.0 -11.45 -0.47 -2.39 -3.45 0.31 + #624 1:1.5 -11.47 -0.50 -2.44 -3.25 0.49 1:3.0 -11.44 -0.50 -2.44 -3.09 0.28 + #616 1:1.5 -11.55 -0.35 -2.53 -3.43 0.84 1:3.0 -11.51 -0.30 -2.54 -3.40 1.02 All the values were derived from the experimental spectra recorded at 278 K in buffer
F (40 mM Tris/HCl pH 7.5, 10 mM MgCl2, 2 mM DTE), to which a total of 6% (v/v) DMSO was added. The obtained chemical shift values for Ras alone in the presence of DMSO are highlighted in light grey and were used as reference when comparing the effect of the different compounds. All the 31P resonances were recorded in a magnetic field operating at a frequency of 202.456 MHz (500 MHz spectrometer). The estimated error for the fitted chemical shift values is ±0.002 ppm at the g-phosphate. A EM function with LB= 15 Hz was applied during the processing of the FID. a The a- and b-phosphates were fitted as a single resonance line. b The estimated error for the calculated K12 values is ±0.2.

3. Results
114
Table 3.4. 31P NMR linewidths for KRasG12D(1-188)•Mg2+•GppNHp in 6% DMSO and in complex with a library of 15 different inhibitors.
Protein
Complex p:l a-phosphate b-phosphate g-phosphate Dn1/2 (1),(2)
a Dn1/2 (1),(2)a Dn1/2 (1) Dn1/2 (2)
[Hz] [Hz] [Hz] [Hz] KRasG12D -- 107.1a 69.0a 146.3 68.1
+ 6% DMSO -- 117.1 76.8 154.4 68.7 + #643 1:1.5 120.1 78.0 150.8 82.3 1:3.0 116.8 80.2 158.7 75.4 + #098 1:1.5 104.0 75.7 131.7 65.9 1:3.0 105.8 74.9 138.4 91.4 + #727 1:1.5 112.2 77.0 135.6 79.0 1:3.0 120.4 73.1 132.6 106.0 + #703 1:1.5 123.0 77.0 140.3 103.9 1:3.0 107.0 81.1 167.7 66.0 + #449 1:1.5 117.9 72.8 178.2 83.8 1:3.0 129.4 75.4 169.7 102.0 + #071 1:1.5 140.6 130.0 259.0 104.9 1:3.0 -- -- -- -- + #109 1:1.5 129.2 76.16 151.3 97.2 1:3.0 -- -- -- -- + #755 1:1.5 106.0 78.9 143.9 101.4 1:3.0 106.4 85.4 150.8 65.3 + #757 1:1.5 111.7 73.0 150.0 86.7 1:3.0 107.8 74.1 142.3 83.1 + #307 1:1.5 117.3 71.9 153.5 97.6 1:3.0 105.7 77.0 158.6 59.0 + #308 1:1.5 112.6 75.8 142.9 76.0 1:3.0 111.1 75.8 123.3 116.2 + #612 1:1.5 103.9 80.2 125.5 102.9 1:3.0 104.1 89.1 140.6 81.92 + #613 1:1.5 106.2 73.5 113.5 113.5 1:3.0 111.1 74.5 114.9 85.9 + #624 1:1.5 112.8 75.7 126.3 100.2 1:3.0 107.4 77.7 109.6 127.1 + #616 1:1.5 135.3 85.1 143.0 90.9
1:3.0 152.1 91.5 190.0 88.4 All the values were derived from the experimental spectra recorded at 278 K in buffer F (40 mM Tris/HCl pH 7.5, 10 mM MgCl2, 2 mM DTE), to which a total of 6% (v/v) DMSO was added. The obtained linewidths for Ras alone in the presence of DMSO are highlighted in light grey and were used as reference when comparing the effect of the different compounds. All the 31P resonances were recorded in a magnetic field operating at a frequency of 202.456 MHz (500 MHz spectrometer). The estimated error for the fitted linewidth values is ±0.02 ppm at the g-phosphate. A EM function with LB= 15 Hz was applied during the processing of the FID and subtracted afterwards from the calculated linewidths a The a- and b-phosphates were fitted as a single resonance line.

3. Results
115
3.3 High Pressure 31P NMR Spectroscopy.
3.3.1 Studies on GppNHp 31P NMR spectroscopy is nowadays a very attractive method to study phosphate binding
proteins and the behaviour of nucleotides in biological systems, especially when applied
together with high pressure NMR methodologies. The effects of pressure on GTPases,
particularly Ras, were elucidated in work pioneered at our department [125] but up to now,
no high pressure data on the isolated nucleotides alone was available. In this section, a 31P
HP NMR investigation, up to 200 MPa, of the GTP analogue GppNHp is presented with the
intent of having a reference system that can be applied from now on to virtually all GppNHp-
bond proteins, helping in the distinction of trivial pressure effects occurring in the free
nucleotides from the more relevant effects that are a consequence of pressure-induced
conformational changes.
With the intent of shedding light on the influence of magnesium, which is a common co-
factor of many GNBP’s, the current study was conducted in the presence and in the
absence of Mg2+ ions. The results presented here were published in the Journal of
Biomolecular NMR, along with similar HP investigations on GMP, GDP, GTP, GppCH2P
and GTPgS [226]. In order to avoid variations of pH with pressure, a pH that was 2-3 units
above the apparent pKa value for the last deprotonation step of the nucleotide was selected.
This corresponds to a pH of 9.0 for the experiments performed in the presence of Mg2+ and
to a pH of 11.5 for the experiments performed in its absence. Figure 3.26 shows the
obtained HP 31P pressure series. The experimental chemical shift values of the three
phosphate groups were individually plotted against pressure and fitted with a second order
polynomial from the Taylor expansion series (eqn. nº 15, section 2.2.5.4). The coefficients
of this equation denoted as B1 and B2 correspond to the first order (linear) and second order
(non-linear) pressure coefficients. The calculated coefficients for each phosphate group are
given in Table 3.5. From the obtained data it can be observed that all phosphate groups
shift upfield with pressure (towards more negative values of d). This shift is rather small for
the a-phosphate, with a Dd of only -0.03 ppm between pamb and 200 MPa. However, larger
effects are generally observed for the b- and g-phosphates, with a Dd of -0.25 and -0.2 ppm,
respectively. Comparing both measurements, in the presence (A) and in the absence (B) of
Mg2+, it can be observed that the pressure-induced shift changes seem to be more
pronounced in the second case, especially for the g-phosphate, whose Dd is -0.25 ppm and
-0.4 ppm, in the presence and in the absence of the ion, respectively. The plots shown in
Figure 3.26 represent the Dd, i.e. the variation of the chemical shift, (Dd=d200MPa-d0.1MPa). A
similar plot with the absolute chemical shift values (d) for each phosphate group is shown

3. Results
116
Figure 3.26. Pressure dependence of GppNHp in the presence (A) and in the absence (B) of Mg2+ followed by 31P NMR spectroscopy. All measurements were done at 278 K, using a Bruker Avance 600 MHz spectrometer operating at a magnetic field of 242.896 MHz. The corresponding phosphate assignments are indicated, as well as the pressure values (in MPa) for each step. In all spectra, very small signals are observed, they shift continuously downfield, crossing their neighbors, the a- and g-phosphates, as the pressure increases. These signals correspond to trace impurities in the sample such as GppNH+. A splitting of the phosphorous resonances is observed in the absence of Mg2+ (B). They correspond to the J31P,31P homonuclear coupling. The same coupling also exists in the presence of Mg2+ (A) but is weakly recognizable due to the increase of the linewidths by the presence of the metal. The last step of the series is the test for reversibility. Samples were prepared by dissolving 5 mM of GppNHp in 40 mM Tris/HCl, 0.1 mM DSS, 10% D2O, with pH 9.0 and 15 mM MgCl2 (A) or pH 11.0 and 0.5 mM EDTA (B). The observed pressure dependent chemical shift changes (Dd=d(P)-d(P0) for the a-, b- and g-phosphates were plotted and the data fitted with a second order Taylor expansion (see experimental section 2.2.5.4, eqn. nº 15). The obtained pressure coefficients are listed in Table 3.5.

3. Results
117
in Figure A of the appendix section, where the different magnitude of the shift changes for
the two measurements can be better visualised (see also Tables D and E in the appendix).
The pressure coefficients listed in Table 3.5 indicate that the non-linear pressure
contribution is greater for GppNHp than Mg2+•GppNHp. Indeed, all B2 values are
numerically higher in the first case. This portends the idea that Mg2+ has the effect of
stabilising the ground-state conformation(s) of the nucleotide, rendering it more insensitive
to a pressure-induced conformational transition. This is supported by a wealth of reported
studies showing that guanine and adenine nucleotides when in presence of Mg2+ exist in
solution as a mixture of different states, that is, tridentate complexes, with Mg2+ bound to
the three phosphates, bidentate complexes with Mg2+ bound to a- and b-phosphates and
monodentate complexes, with Mg2+ bound to one of the negatively charged oxygens of any
phosphate group [27, 248].
Table 3.5. Pressure dependence of 31P chemical shifts of GppNHp in the presence and in the absence of Mg2+ and respective pressure coefficients.
Nucleotide 31P position d0a /ppm B1 /ppm GPa-1 B2 /ppm GPa-2 Mg2+•GppNHp (pH 9) a -10.09 -0.032 ± 0.03 -0.493 ± 0.16 b -5.59 -1.380 ± 0.055 0.542 ± 0.275 g -1.08 -1.250 ± 0.261 1.470 ± 0.131 Pi 2.56 -0.490 ± 0.159 0.969 ± 0.078 GppNHp (pH 11.5) a -10.44 -0.797 ± 0.018 1.936 ± 0.074 b -7.57 -2.250 ± 0.034 4.843 ±0.141 g -0.69 -2.920 ± 0.024 4.984 ± 0.100 Pi 4.27 -0.442 ± 0.023 1.056 ± 0.094 B1 and B2 were obtained by fitting a second order Taylor expansion to the pressure-dependent chemical shifts (eqn. nº15, section 2.2.5.4). They are a numeric representation of the linear and non-linear pressure-induced conformational changes, respectively. a d0 is the chemical shift value obtained from the fitting at ambient pressure at the corresponding pH.

3. Results
118
3.3.2 31P HP NMR on HRasWT(1-166)•Mg2+•GppNHp
The results gathered from the studies on GppNHp constitute thereafter the basis for the
analysis of the pressure-induced chemical shift changes on the Ras protein using 31P NMR
spectroscopy. The influence of pressure in the intrinsic equilibrium of HRasWT(1-189) was
previously studied in our department by 31P NMR [125] but only in terms of intensity changes
of states 1(T) and 2(T) and related equilibrium constants. Shift changes could not be
evaluated at that time because the pressure effects originating from the nucleotide itself
were missing. Therefore, in the light of the new data on the isolated nucleotide, a more
complete description of the dynamics of Ras will be presented in this section. Since the 31P
NMR GDP, GTP and GppNHp spectra of HRasWT(1-166) and HRasWT(1-189) are almost
identical, being the only detectable difference a small variation in the equilibrium populations
(K12=1.7 for HRasWT(1-166)•GppNHp and K12=1.9 for HRasWT(1-189)•GppNHp) the HP
experiments were performed using the truncated variant and because it was also previously
studied in our department by HP 2D [1H-15N]-HSQC NMR methods, rendering a wealth of
information that can now be compared with the present results [171]. The 31P HP series
were performed at two different temperatures that will be discussed in separate sections.
3.3.2.1 Measurements Conducted at 278 K
Figure 3.27 shows the 31P NMR pressure series recorded at 278 K for HRasWT(1-166). The
measurements were carried in a Bruker Avance-600 spectrometer operating at a 31P
frequency of 242.896 MHz equipped with a prodigy cold probe. High hydrostatic pressure
was transmitted to the sample with the aid of a manually operated compressor piston (for
details see sections 1.3.1 and 2.2.5.2). The pressure was continuously increased from 0.1
MPa up to 250 MPa in 10 MPa steps. For sake of simplicity, only 20 MPa increments are
depicted in Figure 3.27. The 3.0 mM protein loaded with GppNHp was dissolved in buffer
F, with additionally 0.4 mM DSS and 20% D2O. For each step, a 1H and a 31P spectra were
recorded, comprised of 128 and 800 cumulative scans, respectively.
The interpretation of the pressure induced effects can be done separately in terms of
chemical shift changes and peak areas for each one of the 31P resonance lines recorded.
In order to determine the best window function, the HP series was processed separately
with two different apodization functions: exponential multiplication (EM) and Gaussian
multiplication (GM) and the obtained shift values were directly compared in Figure 3.28.
From the analysis, the two functions lead to different degrees of accuracy on retrieving
chemical shifts. This is especially notorious for state 2(T) on the g-phosphate, to which
Dd=d250MPa-d0.1MPa= 0.418 ppm, whilst the same variation for state 1(T) is only 0.015 ppm.

3. Results
119
Figure 3.27. Conformational equilibria of HRasWT(1-166)•Mg2+•GppNHp as a function of pressure determined by 31P NMR. The 3.0 mM protein dissolved in buffer F (40 mM Tris/HCl pH 7.5, 10 mM MgCl2, 2 mM DTE) with additionally 0.4 mM DSS and 20% D2O was subjected to increasing step-variations of pressure, up to a maximum of 250 MPa. The pressure values are indicated near each step. The evolution of states 1(T) and 2(T) is represented by the red and green lines, respectively. The 31P NMR resonances of the free nucleotide observed at higher pressures are also indicated. The last step corresponds to the reversibility test of the pressure-induced changes. The fitted chemical shift values for all the resonance lines are listed in Table F of the appendix section.

3. Results
120
This very small variation of g1(T) is within the limits of error of the fitting process and renders
the accurate chemical shift determination a difficult task, especially when using the EM
method. For state 2(T) on the a-phosphate, Dd= 0.061 ppm, corresponding to a 4-fold
greater shift change compared to the g1(T)-phosphate. Nevertheless, the calculated Pearson
correlation is much smaller for the a2(T)-phosphate (r= 0.752) than for the latter (r= 0.981).
This is due to the greater overlap between states 1(T) and 2(T) on the a-phosphate as
compared to the g-phosphate. From the gathered data, it can be generalized that the GM
filter used in the evaluation of the pressure-induced changes (and ultimately in the
evaluation of the pressure coefficients) leads to a reduction in the absolute errors and was
consequently chosen over the EM method. EM was also used in this pressure series to
evaluate peak areas and linewidths, since GM typically destroys the Lorentzian shape of
the signals and renders no information about such variables.
Using the GM method, the 31P chemical shift values of each phosphate were plotted against
pressure (Figure 3.29, black lines). They represent the uncorrected shift values, as obtained
directly from the experimentally recorded spectra (Figure 3.27). The fitted pressure
coefficients are listed on Table 3.6. Except for the b-phosphate, that shifts upfield, all the
other signals shift downfield with pressure (contrary to the upfield shift of the free
nucleotide). The largest shifts are observed for g2(T) and a1(T) with a Dd= 0.418 and 0.35
Figure 3.28. Correlation of the chemical shift values obtained upon fitting with an exponential filter (LB= 10 Hz) and with a Gaussian filter (selected LB and GB depending on the 31P signals). The parameters were selected based in an optimal separation of the lines and/or an homogenous lineshape. For each plot, the Pearson correlation coefficient, r, is computed along with the linear regression of the data (straight line). In all cases except for the a2(T)-phosphate, there is a strong, positive correlation between the two methods used, with r close to 1. However, big discrepancies are observed for the a2(T)-phosphate, and to a smaller extent, for the g1(T)-phosphate, due not only to their partially overlapped signals in the 31P NMR spectra, but also due to their very small chemical shift variation, Dd=d250MPa-d0.1MPa, leading to difficulties in the proper fitting of the data. The dashed line depicts the slope y=x.

3. Results
121
ppm, respectively. Considerably smaller changes are observed for states g1(T) and a2(T), with
Dd= 0.015 and 0.061 ppm, respectively. Qualitatively, the b and g2(T)-phosphates seem to
show a more linear pressure dependence as compared to states a2(T) and g1(T), which are
associated with a pronounced sigmoidal and parabolic behaviour. The use of a third order
polynomial on these two phosphate lines led to a slightly better fit of the dispersion points
as compared to the use of a second order fit.
The 31P corrected chemical shift values are plotted against pressure for each phosphate
group and are shown in Figure 3.29 (blue lines). The calculated B1 and B2 values are shown
in Table 3.6. Since the free Mg2+•GppNHp and uncorrected HRasWT•Mg2+•GppNHp shift in
opposite directions (upfield and downfield, respectively) for all 31P resonances except the
b-phosphate, due to their opposite direction, the contributions from the free nucleotide add
up to the uncorrected Ras and the final corrected values for the a and g-phosphates shift
downfield compared to the uncorrected case. The reasoning underlying the behaviour of b-
phosphate is different but the correction process leads to the same final result (its downfield
shift). For both cases (free nucleotide and uncorrected Ras), the b-phosphate shifts upfield
with pressure. Since the direction is the same, this implies that the contribution from the
free nucleotide in the original, uncorrected, values needs to be suppressed (subtracted).
The final corrected values have now a reversed direction compared to the uncorrected
ones, shifting therefore downfield. The reason for the reverse of the direction is only due to
the magnitudes of the values involved (free Mg2+•GppNHp: Dda= 0.039 ppm, Ddb= 0.31 ppm
and Ddg= 0.22 ppm. For Ras•Mg2+•GppNHp (uncorrected) Dda1(T)= 0.35 ppm, Dda2(T)= 0.06
ppm, Ddb= 0.18 ppm, Ddg1(T)= 0.014 ppm and Ddg2(T)= 0.42 ppm).
The direction of the chemical shifts can also be inferred from the calculated pressure
coefficients (Table 3.6). Both states a1(T) and a2(T) have positive first order coefficients, which
are correlated with the downfield shift of their respective resonance lines. The small
difference between their uncorrected B1 and B2 values compared to the corrected ones,
respectively, is an indication that the local chemical environment surrounding the a-
phosphate is not greatly modified as the pressure increases, at least not as much as the b
and g-phosphates.
It can be seen from Figure 3.29 that a2(T)corrected shifts by a maximum of 0.09 ppm between
0.1 and 200 MPa, corresponding to a very small variation. State a1(T)corrected, on the other
hand, has a more pronounced downfield shift by a Dd of 0.39 ppm within the same pressure
interval. State g2(T)corrected shows the largest shift changes between 0.1 and 250 MPa (Dd=
0.642 ppm), followed by state a1(T) (Dd= 0.389 ppm). It can also be observed from Figure
3.27 the release of the nucleotide at high pressures (above 200 MPa) from the presence of

3. Results
122
additional small peaks at d= -1.33, -6.0 and -10.15 ppm, corresponding to the a-, b- and g-
phosphates, respectively.
Figure 3.29. Corrected pressure dependence of 31P NMR chemical shifts of HRasWT(1-166)•Mg2+•GppNHp recorded at 278 K. The Ddfreenuc fit were applied as correction factors upon subtraction to dRas uncorrected, leading to the final dcorrected values, represented here for each plot as blue triangles (-▲-). The uncorrected shift changes are also plotted again as black circles (-●-) for comparison. The second order polynomial fit of the Taylor expansion was applied for the determination of B1 and B2 as before. The obtained values are presented on Table 3.6. The calculated Dd=d250MPa-d0.1MPa shift differences are shown near the respective curve. Note that the vertical scaling is different for each plot due to the different magnitudes of the Dd values.

3. Results
123
The pressure coefficients B1 and B2 are a useful mathematical concept to quantify the
magnitude of the observed pressure-induced changes. However, another kind of analysis
that can be performed is based on the thermodynamic laws that govern the system under
pressure: the Gibbs free energy (DG) and partial molar volumes (DV). Given two
conformations in fast exchange, the experimental chemical shift changes can be fitted with
eqn. nº 17 (section 2.2.5.4), to obtain the corresponding parameters. The only condition
needed for a proper fitting of the data is that the dispersion plot of the chemical shifts must
display a clear two-state transition (or higher) characterized by a sigmoidal shape This is
not the always the case for all the plotted 31P chemical shifts in Figure 3.29 (except for state
g2(T)) as they show a more linear tendency, which renders the fitting inaccurate and largely
Table 3.6. Fitted pressure coefficients and thermodynamic molar free energies, DG, and volumes, DV, for HRasWT(1-166)•Mg2+•GppNHp at 278 K and pH 7.5. 31P position d0a /ppm B1 /ppm GPa-1 B2 /ppm GPa-2 -- -- Uncorrected a1(T) -11.17 2.15 ± 0.08 -3.40 ± 0.32
a2(T) -11.66 0.82 ± 0.10 -1.95 ± 0.46 b -0.24 -0.53 ± 0.03 -0.64 ± 0.11
g1(T) -2.52 -0.38 ± 0.03 1.90 ± 0.11 g2(T) -3.33 1.94 ± 0.05 -1.06 ± 0.17
Pi 2.37 0.26 ± 0.03 -1.99 ± 0.10 Corrected a1(T) -11.17 2.18 ± 0.08 -2.90 ± 0.32
a2(T) -11.66 0.85 ± 0.10 -1.46 ± 0.46 b -0.24 0.85 ± 0.03 -1.20 ± 0.11
g1(T) -2.52 -0.88 ± 0.03 0.43 ± 0.11 g2(T) -3.33 3.20 ± 0.05 -2.53 ± 0.18
d1
b /ppm d2
b /ppm DG /kJ mol-1 DV /mL mol-1 Transition
Uncorrected a1(T) -11.38 -10.82 1.17 ± 1.26 -29.89 ± 7.12 1-to-0 a2(T) -11.65 -11.58 9.31 ± 0.92 -121.67 ± 12.39 2-to-3
b -0.23 -0.46 5.50 ± 0.14 -34.03 ± 2.17 g1(T) -2.53 -2.50 2.55 ± 1.39 -125.85 ± 74.71 1-to-0 g2(T) -3.38 -2.86 4.0 ± 0.09 -34.68 ± 1.53 2-to-3
Pi 2.38 2.301 15.0 ± 2.73 -77.33 ± 17.18 Corrected a1(T) -11.34 -10.77 1.81 ± 0.08 -29.21 ± 1.86 1-to-0
a2(T) -11.64 -11.56 8.17 ± 1.25 -85.19 ± 12.3 2-to-3 b -0.27 -0.10 3.12 ± 0.51 -42.44 ± 2.60
g1(T) -2.53 -2.25 5.54 ± 0.12 -39.34 ± 1.58 1-to-0 g2(T) -3.45 -2.68 3.44 ± 0.41 -37.31 ± 1.89 2-to-3
a d0 is the chemical shift value obtained at ambient pressure at the corresponding pH. b d1 and d2 are the chemical shift values obtained for the first and last pressure steps, respectively. Due to the linear tendency of the fitted curves, the obtained values constitute a coarse approximation.

3. Results
124
dependent on the starting values given for d1 and d2 for the initialization of the iteration
process. The calculated DG and DV values are listed in Table 3.6, although the reader is
advised for the large intrinsic error of the fitting of DG and DV.
Under slow exchange conditions, the pressure-induced conformational transition from state
2(T) to state 1(T) is associated with the relative population of both states, that in turn can
be quantified by their respective areas. Taking K12 at each pressure and using it
subsequently in eqn. nº 2 (section 2.2.4), the corresponding DG and DV values for the 2(T)-
to-1(T) transition were calculated as shown in Figure 3.30. The obtained free energy
difference between the two states is 1.53 kJ mol-1 and the associated volume change is -
18.60 mL mol-1. Identical values were previously reported for HRasWT(1-
189)•Mg2+•GppNHp (DG12= 1.42 kJ mol-1 and DV12= -17.2 mL mol-1) [125].
Figure 3.30. Plot of LnK12=Astate2(T)/Astate1(T) as a function of pressure. The calculated difference of the free energy, DG12 and partial molar volume, DV12 is 1.53 kJ mol-1 and -18.60 mL mol-1, respectively. The calculated K12 values at each measured pressure point are given in the table. Comparable results are given in ref. [125].

3. Results
125
3.3.2.2 Measurements Conducted at 303 K
A similar set of 31P HP NMR experiments was conducted at 303 K for HRasWT(1-
166)•Mg2+•GppNHp. The complete pressure series is shown in Figure 3.31. The increase
of the temperature has a direct influence in the dynamics of the chemical exchange between
states 1(T) and 2(T) mostly noticeable for the g-phosphate where the interconversion
between states at 278 K is slow in the NMR time scale and the corresponding resonances
are well separated. As the temperature increases the rate of exchange becomes
numerically similar to the chemical shift difference between states 1(T) and 2(T) (i.e,
τex≈|d1(T)-d2(T)|), leading to severe line broadening that culminates with their coalescence into
a single sharp line at high
temperature. The exchange
rate constants determined in
previous studies for the 1(T)-
2(T) interconversion at 278
and 298 K are 42 s-1 and 387
s-1, respectively [67].
The chemical shift variations
for each one of the
phosphate groups
measured at 303 K follows
the same general trends as
the ones measured at 278 K,
with the a- and g-phosphate
shifting downfield
(dishielding) and b-
phosphate shifting upfield
(shielding) with pressure.
The release of GppNHp is
observed again at high
pressures, especially above
175 MPa (Figure 3.31). Free
GppNHp itself seems to be
rapidly hydrolysed into its
by-products, namely Pi and
free GMP, located at d~ 2.50
Figure 3.31. Conformational equilibria of HRasWT(1-166)•Mg2+•GppNHp as a function of pressure determined by 31P NMR at 303 K. The 5.0 mM protein dissolved in buffer F (40 mM Tris/HCl pH 7.5, 10 mM MgCl2, 2 mM DTE) with additionally 0.4 mM DSS and 20% D2O was subjected to increasing step-variations of pressure, up to a maximum of 225 MPa. The chemical shift evolution of the a-, b- and g-phosphates is represented by the dashed lines. The 31P resonances of free GppNHp observed at higher pressures are also indicated.

3. Results
126
ppm and d~3.35 ppm, respectively. Another resonance line located at d= 1.79 ppm can be
ascribed to another by-product from the GppNHp hydrolysis, possibly, PO3-NH2 or a related
species.
The polynomial fit of the uncorrected chemical shift changes is shown in Figure 3.32 for
each phosphate group (coloured in green), alongside with the uncorrected data recorded at
278 K for comparison (coloured in black). The highest pressure point recorded for the 303
Table 3.7. Fitted pressure coefficients and thermodynamic molar free energies, DG, and volumes, DV, for HRasWT(1-166)•Mg2+•GppNHp at 303 K and pH 7.5. 31P position d0a /ppm B1 /ppm GPa-1 B2 /ppm GPa-2 --
Uncorrected a -11.52 0.59 ± 0.01 1.22 ± 0.22 b -0.21 -0.57 ± 0.03 -0.25 ± 0.15 g -3.05 2.15 ± 0.07 -1.86 ± 0.33
Pi 2.23 1.15 ± 0.19 -3.80 ± 0.49 d1
b /ppm d2
b /ppm DG /kJ mol-1 DV /mL mol-1
Uncorrected a -11.52 -11.29 6.39 ± 0.27 -43.92 ± 1.74 b -0.20 -0.37 5.50 ± 0.23 -43.17 ± 3.48 g -3.05c -2.66c 5.65 ± 0.37 -54.78 ± 0.82
Pi 2.22 2.34 2.42 ± 4.69 -107.3 ± 48.0 a d0 is the chemical shift value obtained at ambient pressure at the corresponding pH. b d1 and d2 are the chemical shift values obtained for the first and last pressure steps, respectively. Due to the linear tendency of the fitted curves, the obtained values constitute a coarse approximation. c These values were fixed during the iteration routine.
Figure 3.32. 31P NMR chemical shift changes of HRasWT(1-166)•Mg2+•GppNHp as a function of pressure. The observed chemical shift dependence is plotted individually for the a-, b- and g-phosphates. Measurements were performed at 303 K (coloured in green -■-) and are compared here with the corresponding ones performed at 278 K (coloured in black, -●-, see Figure 3.29 and corresponding text). Only the uncorrected shift changes are shown and presently discussed due to the lack of data at 303 K for the isolated Mg2+•GppNHp molecule. Note that considerably less pressure points were collected at 303 K as compared to the 278 K series. The obtained values for the chemical shift variations, defined as Dd=d225MPa-d0.1MPa, (225 MPa being the highest pressure point recorded for the 303 K series), are shown near each curve for comparison. The second order polynomial fit of the Taylor expansion was applied for the determination of B1 and B2 as before. The obtained values are presented on Table 3.7. Note that the vertical scaling is different for each plot.
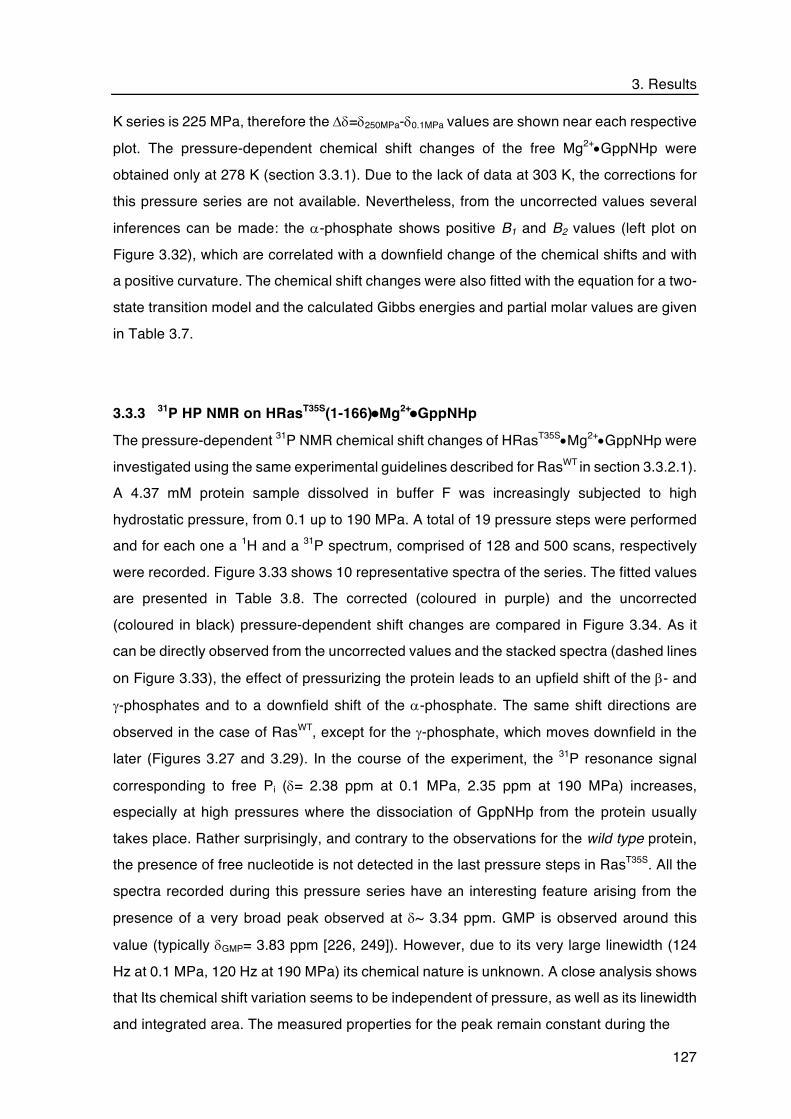
3. Results
127
K series is 225 MPa, therefore the Dd=d250MPa-d0.1MPa values are shown near each respective
plot. The pressure-dependent chemical shift changes of the free Mg2+•GppNHp were
obtained only at 278 K (section 3.3.1). Due to the lack of data at 303 K, the corrections for
this pressure series are not available. Nevertheless, from the uncorrected values several
inferences can be made: the a-phosphate shows positive B1 and B2 values (left plot on
Figure 3.32), which are correlated with a downfield change of the chemical shifts and with
a positive curvature. The chemical shift changes were also fitted with the equation for a two-
state transition model and the calculated Gibbs energies and partial molar values are given
in Table 3.7.
3.3.3 31P HP NMR on HRasT35S(1-166)•Mg2+•GppNHp
The pressure-dependent 31P NMR chemical shift changes of HRasT35S•Mg2+•GppNHp were
investigated using the same experimental guidelines described for RasWT in section 3.3.2.1).
A 4.37 mM protein sample dissolved in buffer F was increasingly subjected to high
hydrostatic pressure, from 0.1 up to 190 MPa. A total of 19 pressure steps were performed
and for each one a 1H and a 31P spectrum, comprised of 128 and 500 scans, respectively
were recorded. Figure 3.33 shows 10 representative spectra of the series. The fitted values
are presented in Table 3.8. The corrected (coloured in purple) and the uncorrected
(coloured in black) pressure-dependent shift changes are compared in Figure 3.34. As it
can be directly observed from the uncorrected values and the stacked spectra (dashed lines
on Figure 3.33), the effect of pressurizing the protein leads to an upfield shift of the b- and
g-phosphates and to a downfield shift of the a-phosphate. The same shift directions are
observed in the case of RasWT, except for the g-phosphate, which moves downfield in the
later (Figures 3.27 and 3.29). In the course of the experiment, the 31P resonance signal
corresponding to free Pi (d= 2.38 ppm at 0.1 MPa, 2.35 ppm at 190 MPa) increases,
especially at high pressures where the dissociation of GppNHp from the protein usually
takes place. Rather surprisingly, and contrary to the observations for the wild type protein,
the presence of free nucleotide is not detected in the last pressure steps in RasT35S. All the
spectra recorded during this pressure series have an interesting feature arising from the
presence of a very broad peak observed at d~ 3.34 ppm. GMP is observed around this
value (typically dGMP= 3.83 ppm [226, 249]). However, due to its very large linewidth (124
Hz at 0.1 MPa, 120 Hz at 190 MPa) its chemical nature is unknown. A close analysis shows
that Its chemical shift variation seems to be independent of pressure, as well as its linewidth
and integrated area. The measured properties for the peak remain constant during the

3. Results
128
complete course of the experiment. From its very broad shape it seems reasonable to
assume that the phosphorous resonance(s) that encompasses is (are) associated with the
Ras protein and are not due to the presence of a small molecule (impurity) or nucleotide
by-product in solution (for which the linewidth would be only 10-20 Hz maximum). The
possibility of being a contaminant from a large macromolecule (another protein) is also very
Figure 3.33. Conformational equilibria of HRasT35S(1-166)•Mg2+•GppNHp as a function of pressure determined by 31P NMR at 278 K. The 4.37 mM protein dissolved in buffer F (40 mM Tris/HCl pH 7.5, 10 mM MgCl2, 2 mM DTE) with additionally 0.4 mM DSS and 20% D2O was subjected to increasing step-variations of pressure, up to a maximum of 190 MPa. The chemical shift evolution of the a-, b- and g-phosphates is represented by the dashed lines. The fitted chemical shift values for all the resonance lines are listed in Table G of the appendix section. An EM function with LB= 4 Hz was applied to the processed FID.

3. Results
129
unlikely since previous biochemical methods such as PAGE and SEC, performed during
protein purification, and HPLC, performed on the sample after the HP NMR series (a
standard procedure done with the intent of quantifying the protein concentration and how
much precipitation occurred during the NMR experiment) revealed no trace of impurities or
other protein contaminants. Within the available data, the nature of this peak remains
unclear. Assumptions accounting for possible phosphorylated Ras can be done. In fact,
recent studies had shown that HRas can undergo phosphorylation at Thr144 and Thr148
by the enzyme GSK3b that targets the protein for proteasome-mediated degradation [250].
In principle, the same regulation mechanism can take place in E. coli. The only other known
site of phosphorylation in Ras is specific for full length KRas4b and involves Ser181, located
at the HVR [5]. Without further experimental evidence using NMR, LCMS or antibody-based
Figure 3.34. 31P NMR chemical shift changes of HRasT35S(1-166)•Mg2+•GppNHp as a function of pressure recorded at 278 K. The observed chemical shift dependence is plotted individually for the a-, b- and g-phosphates. The Ddfreenuc fit were applied as correction factors to dRas uncorrected, leading to the final dcorrected values, represented here for each plot as purple lozenges (-◆-). The uncorrected shift changes are also plotted as black circles (-●-) for comparison. The second order polynomial fit of the Taylor expansion was applied for the determination of B1 and B2. The obtained values are presented on Table 3.8. The calculated shift differences (Dd=d190MPa-d0.1MPa) are shown near the respective curve. Note that the vertical scaling is different for each plot to allow a better visualisation of the details from the different curves.

3. Results
130
methods, the nature of the broad 31P NMR signal cannot be clarified.
It is interesting to note that although no free nucleotide could be detected in the course of
the pressure series, the resonance line of Pi is clearly observed even at the beginning of
the experiment, in the low pressure range. There is no direct explanation for this
phenomenon so far, despite being also often observed during titration experiments between
Ras and its effectors and other regulators such as NF1 (Figures. 3.39 and 3.50).
Interestingly, this peak cannot be found in any of the isolated proteins and is residual in
RasT35S at ambient pressure (Figure 3.33, d= 2.38 ppm), becoming only detectable when
they are mixed, or in the present case, subjected to pressure [156]. It is possible that the
Ras protein carries an additional phosphate molecule which is not detectable due to
intermediate exchange between the protein-free and the protein-bound states but released
by the presence of certain regulators or by pressure effects.
Regarding the uncorrected data (Figure 3.34, black circles), it can be inferred that all
phosphate groups show a shift in the same direction as the corresponding ones in RasWT
(Figure 3.30), however the magnitude of the changes is much smaller for the former than
for the latter. For example, the b- and the g1(T)-phosphates on RasWT have a Dd=d190 MPa-d0.1
MPa equal to -0.125 and 0.304 ppm, respectively. The corresponding values for RasT35S are
-0.063 and 0.066 ppm. Qualitatively, and within the information retrieved from HP 31P NMR,
RasT35S seems less prone to undergo pressure-induced conformational changes between
different states or more precisely between different subensembles of the same state when
compared to RasWT. Upon correcting for unspecific pressure effects of the free nucleotide,
the pressure dependencies (purple colour in Figure 3.34) follow the same trends described
for RasWT, with all phosphates shifting downfield (just as observed for wild type b-, a1(T)- and
g1(T)-phosphates in Figure 3.30). Concomitantly, both proteins follow a rather linear pressure
dependence of the 31P resonances either for the corrected and uncorrected cases, at least
in the tested pressure range. One exception to this is for example the a-phosphate of
RasT35S that shows large second order coefficients (B2(corrected)= -2.27 ppm GPa-2, the
negative sign indicates that the a-phosphate shifts downfield with pressure, as observed in
Figure 3.34).

3. Results
131
Table 3.8. Fitted pressure coefficients and thermodynamic molar free energies, DG, and volumes, DV, for HRasT35S(1-166)•Mg2+•GppNHp at 278 K and pH 7.5. 31P position d0a /ppm B1 /ppm GPa-1 B2 /ppm GPa-2 Uncorrected a -10.971 0.86 ± 0.03 -2.77 ± 0.12
b -0.33 -0.29 ± 0.01 -0.14 ± 0.01 g -2.54 -0.38 ± 0.02 1.67 ± 0.01
Pi 2.39 0.19 ± 0.01 -2.05 ± 0.15 Corrected a -10.97 0.89 ± 0.02 -2.27 ± 0.12
b -0.33 1.09 ± 0.01 -0.70 ± 0.01 g -2.54 0.88 ± 0.01 0.20 ± 0.01
d1
b /ppm d2
b /ppm DG /kJ mol-1 DV /mL mol-1
Uncorrected a -10.98 -10.90 3.20 ± 0.14 -85.18 ± 3.18
b -0.31 -0.39 3.74 ± 0.21 -46.20 ± 2.11 g -2.54c -2.55c 9.55 ± 16.16 -36.17 ± 5.98
Pi 2.40 2.35 14.97 ± 1.46 -105.0 ± 10.1 Corrected a -10.98 -10.89 3.49 ± 0.65 -70.69 ± 5.53
b -0.34 -0.13 4.55 ± 0.15 -50.97 ± 1.46 g -2.55 -2.37c 5.15 ± 0.23 -57.19 ± 2.32
a d0 is the chemical shift value obtained at ambient pressure at the corresponding pH. b d1 and d2 are the chemical shift values obtained for the first and last pressure steps, respectively. Due to the linear tendency of the fitted curves, the obtained values constitute a coarse approximation. c These values were fixed during the iteration routine.

3. Results
132
3.3.4 31P HP NMR on KRasG12V(1-189)•Mg2+•GTP
The body of work performed so far for RasWT and RasT35S was also applied to the oncogenic
mutant KRasG12V(1-188) bound to its natural ligand, GTP.
Contrary to HRasWT and HRasT35S, the HP series conducted on KRasG12V•Mg2+•GTP was
performed in a Bruker Avance 500 MHz spectrometer operating at a 31P frequency of
202.456 MHz and using a selective 31P 10 mm probe. When this series was recorded, the
more sensitive Prodigy cold probe was not yet a member at our department. The use of a
much less sensitive probe intrinsically limited the spectral quality as it can be observed from
Figure 3.35. Even at a protein concentration of 3.23 mM and 3000 cumulative scans per
step, the overall spectra are rather noisy, which rendered the proper fitting of low-populated
states a difficult task. A total of 11 steps were recorded from 1.0 MPa up to 195 MPa are
shown. Measurements above this value were unfruitful due to severe water leaking and
consequently instability of the high-pressure line. Contrary to RasWT (and other mutants),
the GDP-to-GTP nucleotide exchange reaction on RasG12V can be accomplished almost
completely (i.e. the protein was 100% exchanged to GTP, with no Ras-GTP/Ras-GDP
mixture). This can be observed from the spectrum at 1.0 MPa, where there are no visible 31P NMR lines corresponding to the a- and b-phosphate of GDP-bound Ras.
In the course of the experiment, hydrolysis at the g-phosphate occurs and hence the 31P
NMR signals from the GDP-bound protein become visible around d= -10.1 ppm (aGDP) and
d= -2.0 ppm (bGDP). The aGDP resonance shifts downfield with pressure (d70MPa= -10.31 ppm;
d195MPa= -9.99 ppm) and the bGDP shifts upfield (d70MPa= -1.92 ppm; d195MPa= -2.07 ppm, Figure
3.36 and Table 3.9). It is worth mention that the increase in the integral area for these two
signals during the pressure series is dependent of time (as the hydrolysis occurs) and not
on pressure. The recorded series shown in Figure 3.35 do not correspond to the sequential
order by which the spectra were recorded (for example, after recording the 50 MPa step,
the next measurement was performed at 150 MPa, the third one at 100 MPa, and so forth.
This is valid only for the present HP series. All the others shown in this thesis were recorded
by the sequential order of pressure in which they are presented). The appearance of the
aGDP and bGDP signals is concomitant with the increase of Pi, which leads to the sharp line
located at d= 2.5 ppm. Just as detected before for RasWT and RasT35S, the effect of
increasing pressure promotes a shift of the equilibrium towards state 1(T), directly observed
by the decrease of the integrals representing state 2(T) (green lines) and respective
increase of the integrals representing state 1(T) (red lines), following the slow exchange
condition. One of the most interesting findings in the series is related with the partial splitting
of the initial b-phosphate into two lines at high pressures, corresponding to states 1(T) and

3. Results
133
2(T), respectively.
Figure 3.35. Conformational equilibria of KRasG12V(1-188)•Mg2+•GTP as a function of pressure determined by 31P NMR at 278 K. The 3.23 mM protein dissolved in buffer F (40 mM Tris/HCl pH 7.5, 10 mM MgCl2, 2 mM DTE) with additionally 0.4 mM DSS and 20% D2O was subjected to increasing step-variations of pressure, up to a maximum of 195 MPa. The pressure value for each step is indicated together with the evolution of states 1(T) and 2(T), represented by the red and green lines, respectively. The resonance lines corresponding to the phosphate groups of the protein bound to GDP are also indicated as aGDP and bGDP. Note that in this series the order of acquisition of the spectra does not coincide with the sequential increase of pressure. For example, after the 50 MPa, the next step recorded was the 150 MPa, and so on. The fitted chemical shift values for all the phosphate groups (corrected and uncorrected) are shown in Table H of the appendix section.

3. Results
134
The two states are too close together to be resolved at 1.0 MPa but, as the pressure
increases, the initial resonance becomes splitted to a point where the centre of b1(T) can be
properly defined above 150 MPa. The two states on a-phosphate, on the other hand,
become only resolved at very high pressures (above 195 MPa), contrary to the
corresponding a-phosphate of Ras bound to GppNHp. The pressure-dependent chemical
shift changes are shown in Figure 3.36. The uncorrected values, obtained directly upon
application of a Gaussian filter to the FID, are coloured in black and the corresponding
corrected values are coloured in red. For the correction of the data the intrinsic pressure
dependence of the free Mg2+•GTP nucleotide was subtracted to the uncorrected values.
The pressure-dependence of free GTP was investigated in our department under similar
conditions as the ones reported in this thesis for GppNHp (section 3.3.1), with appropriate
adjustments for the physico-chemical properties of GTP [226].
From the RasG12V series, both states 1(T) and 2(T) on the a-phosphate shift downfield with
pressure. Since the a-phosphate on the free nucleotide shifts on the opposite direction, the
correction of the data was done by adding the absolute Dd values from free Mg2+•GTP to
the duncorrected values from RasG12V. The corrected chemical shifts show the same tendency
as the uncorrected ones, moving even further downfield. Due to the low signal-to-noise ratio
and to the asymmetry of the peaks, the fitted pressure coefficients have generally large
associated errors, as in the case of the a1(T)-phosphate, with B2= 16.5 ± 20.0 ppm GPa-2.
The uncorrected b1(T) and b2(T) phosphates move upfield as the pressure increases. Upon
correction, their direction is reversed, following the same trend as observed previously for
RasWT and RasT35S. Qualitatively, b1(T) shows a more linear pressure dependence than b2(T),
with both developing a negative curvature. The calculated B2(corrected). values are -0.027 ±
1.90 ppm GPa-2 for the former and -7.428 ± 4.257 ppm GPa-2 for the latter. A proper fitting
of the b1(T)-phosphate could only be done above 50 MPa and only by using the GM method.
It would be interesting to repeat this series up to 250-300 MPa in order to study the
behaviour of this signal at higher pressures.
In GppNHp-bound Ras, states 1(T) and 2(T) are best separated for the g-phosphate. The
same is observed for RasG12V•Mg2+•GTP but their pressure-dependent shifts are much less
pronounced in the second case. The g1(T)-phosphate shows a negative first order
dependence (B1= -2.02 ppm GPa-1), which becomes largely compensated upon correction
(B1= 0.158 ± 0.109 ppm GPa-1) and the g2(T)-phosphate, on the other hand, shows a large
second order dependency, with B2 values of 7.541 ppm GP-2 and 10.741 ppm GPa-2 for the
uncorrected and corrected cases, respectively.

3. Results
135
Indeed, the overall second order coefficients presented in Table 3.9 for this pressure series
are generally higher than the ones obtained either for RasWT or the T35S mutant, portending
the idea that KRasG12V•GTP is more responsive to pressure, at least in the vicinity of the
nucleotide, than the other two GppNHp-bound proteins.
The slow exchange interconversion between states 1(T) and 2(T) was also analysed based
on the integrated area of each peak. Ln K12 as a function of pressure is plotted in Figure
3.37 using the b- and g-phosphates. From the fitting routine, a Gibbs energy DG12= 5.865 ±
0.455 kJ mol-1 for the b-phosphate and DG12= -6.524 ± 0.295 kJ mol-1 for the g-phosphate
Figure 3.36. Corrected and uncorrected pressure dependence of 31P chemical shifts for KRasG12V(1-188)•Mg2+•GTP recorded at 278 K. The Ddfreenuc fit values of free Mg2+•GTP [226] were applied as correction factors to dRas uncorrected, leading to the final dcorrected values, represented here for each plot as red pentagons (-À-). The uncorrected shift changes are also plotted as black hexagons (-Â-) for comparison. The second order polynomial fit of the Taylor expansion was applied for the determination of B1 and B2 as before. The obtained values are presented on Table 3.9 and the calculated Dd=d195MPa-d1.0MPa values are shown near the respective curve. Note that the vertical scaling is different for each plot to allow a better visualisation of the details from the different curves.

3. Results
136
was obtained. The difference in the specific
volumes for the two states DV12=V2-V1 is -
31.11 ± 3.07 and 26.10 ± 2.19 mL mol-1,
respectively. Within the limits of error, the
obtained values from the two phosphate
groups are numerically similar. They have
opposite signs due to the different directions of
the 1(T)-2(T) transition. Their similarity is to be
expected since they are a measure of a
conformational transition that affects in
principle the chemical environment of both a-
and b-phosphates in a similar way.
Figure 3.37. Plot of LnK12 as a function of pressure for KRasG12V(1-188)•Mg2+•GTP. The transition was analysed for the g- and b-phosphates (coloured in black and red, respectively). The obtained free energy difference, DG12 and partial molar volume, DV12 for the g-phosphate is -6.524 ± 0.295 kJ mol-1 and 26.10 ± 2.19 mL mol-1, respectively. For the b-phosphate, DG12
= 5.865 ± 0.455 kJ mol-1 and DV12 = -31.11 ± 3.07 mL mol-1, respectively.

3. Results
137
Table 3.9. Fitted pressure coefficients and thermodynamic molar free energies, DG, and volumes, DV, for KRasG12V(1-188)•Mg2+•GTP at 278 K and pH 7.5. 31P position d0a /ppm B1 /ppm GPa-1 B2 /ppm GPa-2 -- --
Uncorrected a1(T) -10.91 -4.01 ± 6.57 16.5 ± 20.0 a2(T) -11.54 0.68 ± 0.15 -0.39± 0.72 b1(T) -14.95 -3.28 ± 0.48 7.07 ± 1.90 b2(T) -14.70 -0.68 ± 0.10 -0.33 ± 0.43 g1(T) -6.00 -2.02 ± 0.11 0.64 ± 0.51 g2(T) -7,47 -0.06 ± 0.22 7.54 ± 1.02
Pi 2.34 0.50 ± 0.20 -2.93 ± 0.73 Corrected a1(T) -10.91 -3.48 ± 6.57 16.40 ± 20.0 a2(T) -11.54 1.21 ± 0.15 -0.89 ± 0.72 b1(T) -14.95 1.52 ± 0.48 -0.03 ± 1.90 b2(T) -14.70 4.12 ± 0.09 -7.43 ± 4.26 g1(T) -6.00 0.16 ± 0.11 -2.54 ± 0.51 g2(T) -7.47 -2.24 ± 0.02 10.74 ± 1.02
d1
b /ppm d2
b /ppm DG /kJ mol-1 DV /mL mol-1 Transition
Uncorrected a1(T) -11.15 -11.04c 27.42 ± 1.20 -156.66 ± 68.9 1-to-0 a2(T) -11.53c -11.42 6.77 ± 0.93 -70.00 ± 8.12 2-to-3 b1(T) -15.10 -15.32c 10.57 ± 2.19 -101.18 ± 15.70 1-to-0 b2(T) -14.70c -14.85c 5.74 ± 0.75 -56.05 ± 6.04 2-to-3 g1(T) -6.00c -6.37c 5.97 ± 0.52 -61.42 ± 4.44 1-to-0 g2(T) -7.47c -7.18c 10.05 ± 1.36 -72.32 ± 9.26 2-to-3
Pi 2.36 2.33c 23.19 ± 7.06 -137.50 ± 40.0 -- Corrected a1(T) -11.09c -10.96c 27.42 ± 9.98 -157.82 ± 57.44 1-to-0 a2(T) -11.53 -11.33 6.04 ± 0.57 -62.63 ± 4.93 2-to3 b1(T) -14.90 -14.63 9.18 ± 1.32 -73.88 ± 10.17 1-to-0 b2(T) -14.69c -14.18 5.32 ± 0.63 -66.18 ± 9.05 2-to3 g1(T) -6.00 -6.11 9.96 ± 3.51 -55.23 ± 39.50 1-to-0 g2(T)
d -- -- -- -- 2-to-3 ad0 is the chemical shift value obtained at ambient pressure at the corresponding pH. bd1 and d2 are the chemical shift values obtained for the first and last pressure steps, respectively. Due to the linear tendency of the fitted curves, the obtained values constitute a coarse approximation. c The value was fixed during the fitting routine. d No convergence was attained from the fitting routine.

3. Results
138
- This page was deliberately left blank -

3. Results
139
3.4 Mutational Analysis of HRasWT(1-166) Studied by 31P NMR and ITC
The identification of non-conventional binding sites in the surface of Ras can be done by
analysing the response of its individual amino acids to pressure. In fact specific residues of
the protein (located either at the surface or at the core) could be identified in previous HP
NMR experiments as being predominantly influenced by a given conformational transition
and were colour-coded at the surface of the protein (Figure 1.13, section 1.3.2, [171]).
These investigations constitute a mapping of the pressure-dependent conformational
transitions of Ras and were taken in the present thesis as background information
necessary to select specific amino acids and to perform site directed-mutagenesis on them
with the expectation that the mutation would shit the conformational equilibrium towards
one of the two conformational states in which the selected amino acids are involved. The
correlation between the amino acids and their corresponding conformational transition as
detected by HP is shown in Table 3.10. The ones selected for site-directed mutagenesis
and their respective replacement are highlighted in orange colour. The next sections
describe the results gathered from this mutational study on truncated HRas. An attempt to
correlate the effect of the mutation with the any observed conformational transition is made
herein. All mutants were created de novo, by designing the primers with the mutation at the
centre and using standard PCR techniques (experimental sections 2.2.1.9 and 2.2.1.11).
Table 3.10. List of amino acids according to the associated conformational transition as determined by HP NMR and the ones chosen for SDM.
2(T)-to-3(T) 2(T)-to-1(T) 2(T)-to-1(0) Surface Core Surface Core Surface Core
His27 Glu Leu56 Asn26 Lys Val9 Ser39 Leu Phe82 Asp33 Lys Gly115 His94 Asp Val14 Glu3 Val Met111 Ile46 Thr Thr20 Ala66 Thr Lys42
Val44 Leu79 Gly138 Glu49 Gly48 Val112 Arg Ile139 Arg161 Leu23 Val45 His166 Arg135 Ser127 Tyr137 Asp132 Tyr141 Thr124 Glu143 Asp107 Ala130 Ala121 Ala134
Asn85 Ala Ser136 Asn86 Ile84
1(0), 1(T), 2(T) and 3(T) represent the nucleotide free, the GEF recognition, the effector recognition and the GAP recognition states, respectively. The listed residues have also generally high B1 and B2 pressure coefficients, according to [171]. The ones chosen for site-directed mutagenesis are coloured in orange, together with the respective amino acid replacement. Mutagenesis was also attempted in the residues coloured in blue but with no success. Only residues involved in a two-state transition were considered.

3. Results
140
3.4.1 Preliminary Considerations About RasWT(1-166)
Several 31P NMR spectroscopy studies were firstly conducted on RasWT and used
afterwards as a qualitative and quantitative resource for the assessment and comparison
of similar studies conducted on the different mutants.
3.4.1.1 Conformational equilibria of H, K and NRasWT(1-166)•Mg2+•GppNHp
The dynamics of the full-length H and KRasWT(1-188/189) were studied by 31P NMR in
section 3.1. Similar studies were also conducted herein for the wild type truncated variants
(1-166), including NRas in terms of 31P chemical shifts and equilibrium constants. The
obtained spectra are shown in Figure 3.38 and the fitted values are listed in Table 3.11.
There are obvious differences between the different isoforms: state 2(T) on g-phosphate is
shifted downfield in K and NRas as compared to HRas. The Dd differences are ca. 0.06
ppm and 0.09 ppm, respectively. The chemical shift values of the other phosphate groups
are very similar and their corresponding Dd values are always within ± 0.05 ppm in the three
proteins, a value close to the limits of the error for the measurements. The most striking
difference however, arises from the equilibrium populations. The obtained K12 for NRas is
2.57, about 1.7-fold higher than HRas (K12=1.57). The difference is rather surprising,
considering that the degree of homology between the three isoforms is more than 90% and
that their catalytic domain differs only in four residues (aa 151, 153, 165 and 166), none of
them located at the switch regions [251]. The obtained linewidths on g-phosphate for K and
NRas are in average numerically larger than the corresponding ones for HRas. The
obtained KD values for the dissociation of the Ras-Raf complex are 0.42 ± 0.1, 0.60 ± 0.06
and 0.18 ± 0.05 µM for H-, K- and NRas, respectively. From these interaction studies it
follows that the affinity of NRas towards Raf is 2.42-fold higher than the one of HRas and
3.45-fold higher than the one of KRas. These results are in agreement with the equilibrium
distribution observed for the different isoforms in the 31P NMR spectra, with NRas having
the highest K12, that is, being more populated in terms of state 2(T) (the effector recognition
state), followed by KRas and HRas in this respective order.
The signature plot for the three proteins is very similar (similar DG and DH and -TDS), with
the NRas-Raf association being slightly more entropically favourable than the other two
isoforms (-TDS = -38.6 kJ mol-1 vs -28.3 kJ mol-1 (HRas) and -22.3 kJ mol-1 (KRas)). The
enthalpies of binding, explicitly obtained from the measurements, are also identical (DH= -
8.10, -13.2 and -10.8 kJ mol-1 for H, K and NRas, respectively).
It is worth mentioning the comparison between the equilibrium distribution of the full length
(section 3.1.1, Figure 3.1) and the respective truncated H and KRas variants.

3. Results
141
Figure 3.38. Conformational equilibrium of RasWT(1-166)•Mg2+•GppNHp detected by 31P NMR spectroscopy and thermodynamics of association with Raf-RBD detected by ITC. The equilibrium between states 1(T) and 2(T) for the truncated H, K and NRas isoforms was compared in terms of 31P chemical shifts and equilibrium constants, K12, on g-phosphate. The three proteins with concentrations of 1.78, 1.10 and 0.62 mM, respectively were dissolved in buffer F (40 mM Tris/HCl pH 7.5, 10 mM MgCl2, 2 mM DTE) with additionally 0.2 mM DSS and 5 or 10% D2O. All the NMR measurements were performed at 278 K at 202.456 MHz (KRas (6000 scans, LB=15Hz), NRas (7000 scans, LB=15Hz)) or at 242.89 MHz (HRas, 1000 scans, LB= 8 Hz). The fitted chemical shift values, linewidths and K12 are listed in Table 3.11. The interaction with Raf-RBD was measured at 298 K. All the proteins were dissolved in the same buffer F with additionally 150 mM NaCl. The signature plots are presented alongside with the fitted thermodynamic values (blue: DG, green: DH, red: -TDS) and the respective isotherms.

3. Results
142
The former ones are slightly shifted towards state 2(T) as compared with the truncated
forms (K12= 1.9 vs 1.6 for FLHRas and cHRas, respectively and K12=2.0 vs 1.8 for FLKRas
vs cKRas, respectively). The observed differences, even if small, portend the importance of
the HVR in the modulation of the conformational equilibrium detected in the vicinity of the
nucleotide by 31P NMR.
3.4.1.2 Titration of HRasWT(1-166)•Mg2+•GppNHp with NF1 Followed by 31P NMR
The catalytic domain of the GAP protein NF1 (aa 1198-1531, 35 kDa) was added to
HRasWT(1-166) in a titration experiment followed by 31P NMR. The obtained data is shown
graphically in Figure 3.39 and numerically in Table 3.12. The results gathered herein can
be taken afterwards for a comparative analysis with similar titrations performed in different
Ras mutants. In the presence of NF1, the chemical environment of all the three phosphate
groups is affected, as it can be directly observed from their respective lineshapes on Figure
3.39. As usual, the most striking modifications are observed for the g-phosphate. The
interpretation can be done as follows: as NF1 is stepwise added to Ras the integrals of the
resonance lines corresponding to states 1(T) (red colour) and 2(T) (green colour) decrease
without any appreciable modification of their corresponding chemical shift values (Table
3.12), indicating that no major or dramatic structural rearrangements in the vicinity of the
nucleotide occur upon binding to NF1. At the same time, another resonance line located in
between states 1(T) and 2(T) becomes visible and its integral increases as the
concentration of NF1 increases. In the light of the proposed model, this line is ascribed to
Table 3.11. 31P NMR chemical shift values and linewidths for the truncated wild type isoforms of H, K and NRas in complex with Mg2+•GppNHp.
Protein
a-phosphate b-phosphate g-phosphate K12
b d1(T) [ppm]
d2(T) [ppm]
d1(T),2(T)a
[ppm] d1(T) [ppm]
d2(T) [ppm]
HRasWT -11.16 -11.68 -0.25 -2.56 -3.34 1.57 KRasWT -11.18 -11.70 -0.23 -2.58 -3.28 1.83 NRasWT -11.21 -11.72 -0.21 -2.53 -3.26 2.57
Dn1/2 1(T)
[Hz] Dn1/2 2(T)
[Hz] Dn1/2 1(T),2(T)
[Hz] Dn1/2 1(T)
[Hz] Dn1/2 2(T)
[Hz] --
HRasWT 92.74 84.34 47.06 64.76 51.43 KRasWT 57.29 102.28 48.19 69.04 55.30 NRasWT 66.52 94.29 43.15 72.76 47.80
All the values are fitted from the experimental spectra recorded at 278 K, pH 7.5. The estimated errors from the fitting procedure are less than ± 0.01 ppm in chemical shift values and ± 0.15 Hz in linewidths at the g-phosphate. An LB= 8 Hz was applied to the FID and subtracted afterwards from the final fitted linewidth values. a The b-phosphate was fitted as a single Lorentzian line because states 1(T) and 2(T) cannot be separated at the magnetic field used b The equilibrium constant, K12, was calculated using the population distribution on the g-phosphate. The associated error is ± 0.2.

3. Results
143
the conformational state that selectively recognizes GAP proteins and is named 3(T). The
fitted lines for the three states and their interplay during the titration can be observed in
Figure 3.39 for the g-phosphate in the third, fourth and fifth steps of the titration. As the
titration proceeds, the linewidths of states 1(T) and 2(T) (corresponding to unbound Ras)
do not change appreciable and the linewidth of state 3(T) increases concomitantly with the
increase of the molecular mass of the complex. Between the first spectrum and the last
titration step the theoretical size of the complex increases by a factor of 3.0, from 18 kDa
(Ras alone) to 54 kDa (note that state 3(T) seems to be only saturated in the last step, thus
the 1:2 ratio was taken as the most representative of a 1:1 binding). The experimentally
determined increase on the linewidth values for state 3(T) is also of the same magnitude
(from ca. 65 Hz to 206 Hz, Table 3.12). Note that the line broadening of 65 Hz measured
for state 2(T) in Ras alone (Table 3.12) is assumed to be also representative of state 3(T).
A very similar value is obtained when considering the linewidth of state 3(T) in the first
titration step (1:0.25 ratio, Dn1/2 3(T)= 105.44 Hz) to which the natural line broadening of 45
Hz for state 2(T) is subtracted (105.44-45= 61 Hz, Table 3.12). The natural line broadening
of Ras alone can be estimated from previous transverse relaxation experiments given the
relationship Dn1/2=1/T2.π (T2= 4.1 and 7.1 ms for states 1(T) and 2(T), respectively [116]).
Thus, the obtained linewidth at 1:1 binding matches nicely the increase in the theoretical
size of the complex, which is also indicative that there are no additional contributions from
exchange broadening process in the present titration. The interaction between Ras and
NF1 follows a slow exchange mechanism, i.e. |Dωτc| >> 1. From the peak separation, Dω,
between state 3(T) and the other states, one obtains a lower limit of the lifetime of the Ras-
NF1 complex equal to 8.93 ms in state 1(T) and 11.47 ms in state 2(T). Equivalent results
were previously obtained on the titration of Ras with the protein GAP334 by 31P NMR [117].
In principle, the a-phosphate should have a similar response to the presence of NF1 as the
one observed for the g-phosphate. However, the greater superposition of the NMR lines
associated with the rapidly decreasing spectral quality due to dilution of Ras rendered
impossible the proper fitting of the data in this case. Different approaches were attempted,
including fixing the chemical shift values and linewidths for states 1(T) and 2(T) but with no
success. Nevertheless, from the fitting of the last titration step, the obtained chemical shift
value for state 3(T) at the a-phosphate is -11.124 ± 0.07 ppm.
The analysis of the b-phosphate, on the other hand, shows that as the titration proceeds,
an additional signal arises at the left side of the original b-phosphate in the unbound Ras.
This new signal lies at ca. d= 0.07 ppm (Table 3.12) and its relative area increases with
increasing concentrations of the titrant.
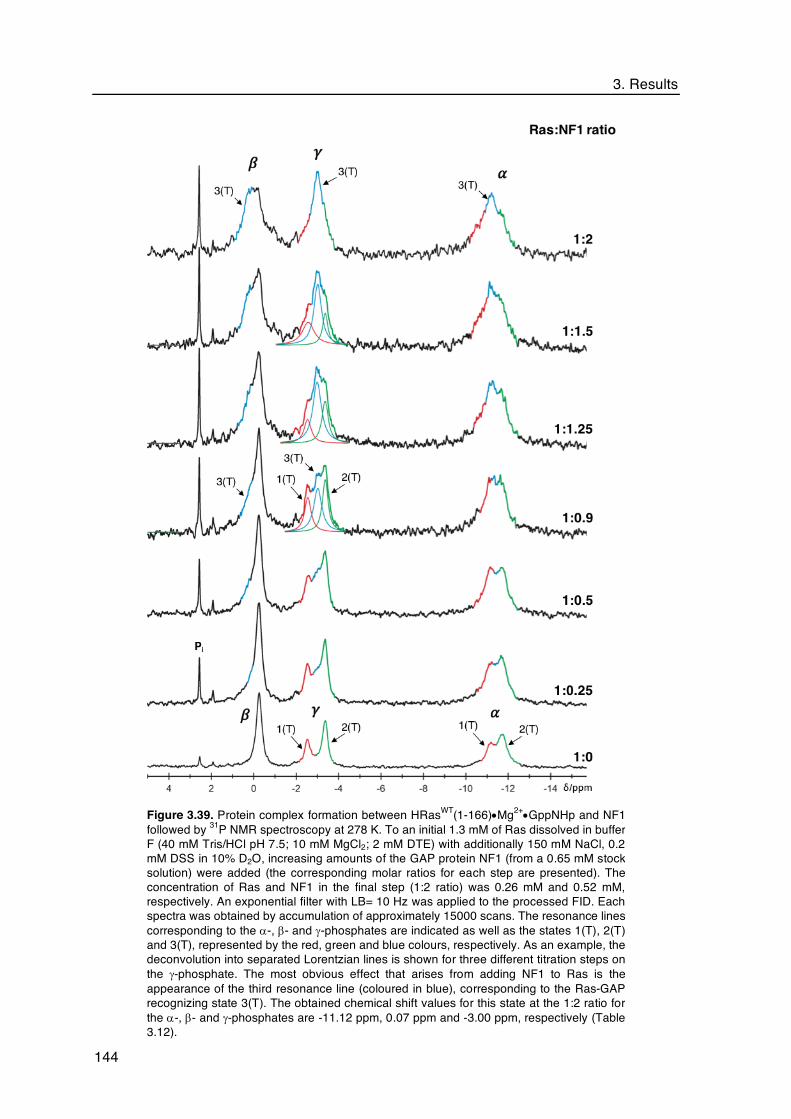
3. Results
144
Figure 3.39. Protein complex formation between HRasWT(1-166)•Mg2+•GppNHp and NF1 followed by 31P NMR spectroscopy at 278 K. To an initial 1.3 mM of Ras dissolved in buffer F (40 mM Tris/HCl pH 7.5; 10 mM MgCl2; 2 mM DTE) with additionally 150 mM NaCl, 0.2 mM DSS in 10% D2O, increasing amounts of the GAP protein NF1 (from a 0.65 mM stock solution) were added (the corresponding molar ratios for each step are presented). The concentration of Ras and NF1 in the final step (1:2 ratio) was 0.26 mM and 0.52 mM, respectively. An exponential filter with LB= 10 Hz was applied to the processed FID. Each spectra was obtained by accumulation of approximately 15000 scans. The resonance lines corresponding to the a-, b- and g-phosphates are indicated as well as the states 1(T), 2(T) and 3(T), represented by the red, green and blue colours, respectively. As an example, the deconvolution into separated Lorentzian lines is shown for three different titration steps on the g-phosphate. The most obvious effect that arises from adding NF1 to Ras is the appearance of the third resonance line (coloured in blue), corresponding to the Ras-GAP recognizing state 3(T). The obtained chemical shift values for this state at the 1:2 ratio for the a-, b- and g-phosphates are -11.12 ppm, 0.07 ppm and -3.00 ppm, respectively (Table 3.12).

3. Results
145
In the Ras-NF1 complex, the b-phosphate NMR signal is formed by these two lines that lie
very close to each other. A remarkable finding can be observed at a ratio of 1:2, were the
a- and g-phosphates appear saturated, with the equilibria shifted almost completely towards
state 3(T) and, by contrast, the b-phosphate becomes a very broad peak with an ill-defined
centre that seems to feature two distinct conformational states that lie very close to each
other. As result, It can be hypothesized that in the Ras-NF1 complex the b-phosphate is
characterized by two distinct conformational states and constitute the reason why saturation
was not achieved, even at a ratio of 1:2.
Table 3.12. 31P NMR chemical shift values and linewidths for the protein-protein complex HRasWT(1-166)•Mg2+•GppNHp•NF1.
Protein complex
Ras:NF1 ratio
a-phosphate b-phosphate g-phosphate d1(T) [ppm]
d3(T) [ppm]
d2(T) [ppm]
d1(T),2(T) [ppm]
d3(T) [ppm]
d1(T) [ppm]
d3(T) [ppm]
d2(T) [ppm]
HRasWT -- -11.16 -- -11.72 -0.25 -- -2.54 -- -3.36 a +NF1 1:0.25 -11.15 --b -11.71 -0.25 -- -2.53 -3.00 -3.36
1:0.5 -11.15 --b -11.73 -0.25d 0.17 -2.54 -3.03 -3.36 1:0.9 --c --c --c -0.25d 0.06 -2.54 -3.02 -3.37 1:1.25 --c --c --c -0.25d 0.07 -2.54 -3.01 -3.36 1:1.50 --e -11.12 --e -0.25d 0.05 -2.55 -3.02 -3.37 1:2.0 --e -11.12 --e -0.25d 0.07 -2.58 -3.00 -3.37 a-phosphate b-phosphate g-phosphate Dn1/2 1(T)
[Hz] Dn1/2 3(T)
[Hz] Dn1/2 2(T)
[Hz] Dn1/2
a
[Hz] Dn1/2 3(T)
[Hz] Dn1/2 1(T)
[Hz] Dn1/2 3(T)
[Hz] Dn1/2 2(T)
[Hz] HRasWT -- 116.74 -- 114.72 66.3 -- 81.47 -- 64.60
+NF1 1:0.25 -- --b -- 66.3 -- 80.71 105.44 60.01 1:0.5 --c --b --c 65.2d 172.0 96.57 113.3 58.47 1:0.9 --c --c --c 65.5d 227.6 82.24 111.44 68.55 1:1.25 --c --c --c 65.5d 213.7 89.32 109.22 78.70 1:1.50 --c --c --c --c --c 98.65 158.45 68.00 1:2.0 --c --c --c --c --c 91.98 206.19 91.98 All the values are fitted from the experimental spectra recorded at 278 K, pH 7.5. The estimated errors
from the fitting procedure are ± 0.02 ppm in chemical shift values and ± 0.25 Hz in linewidths for the g-phosphate. An LB= 10 Hz was applied to the processed FID and subtracted afterwards from the final fitted linewidth values. a States 1(T) and 2(T) of the b-phosphate in cannot be separated at the magnetic field used and were therefore fitted as a single Lorentzian line. b State 3(T) could not be appropriately fitted for the indicated titration step. c Fitting of the resonance lines with independent Lorentzian functions was not possible due to their extreme overlapping at the magnetic field used. d These values were fixed during the iteration routine. e The a-phosphate was fitted with a single resonance line centred in state 3(T).

3. Results
146
- This page was deliberately left blank -

3. Results
147
3.4.2 Site-Directed Mutagenesis
3.4.2.1 2(T)-to-1(T) Transition: N26K, H94D and A66T
Following the guidelines presented in section 3.4, the effect of mutating amino acid residues
involved in the conformational transition to the GEF recognizing state 1(T), was
investigated. For the purpose, three residues from the list presented in Table 3.10 were
selected. The amino acid chosen for the replacement was based in opposite physico-
chemical properties relative to the one being replaced. Thus, the uncharged Asn26 was
replaced by the positively charged Lys, the non-polar Ala66 was replaced by the polar Thr,
a bulky by a small, a positive by a negative, and so on. The effect of each mutation cannot
be truly predicted without a computational approach, but as the original amino acid residues
are involved in the 2(T)-to-1(T) transition, it is expected that their modification would affect
the population distribution of at least one of these states.
Figure 3.40. Localization on the RasWT•Mg2+•GppNHp surface of the amino acid residues Asn26, His94 and Ala66 that were subjected to SDM (experimental section 2.2.1.11). These residues sense the 2(T)-to-1(T) transition upon pressure perturbation and were mutated with the prospect of shifting the equilibrium between one of these states. A. Localization of the three residues (coloured in orange) in the structure with a surface and a cartoon representation. Switch 1 is coloured in green, switch 2 is coloured in red and the Mg2+ ion is coloured in magenta. Key features near each residue, including polar contacts, are shown for Asn26, B., His94, C. and Ala66, D. Important –NH and –OH moieties are coloured in blue and red, respectively. H2O molecules are coloured in light blue. pdb: 5p21.

3. Results
148
The localisation of the three residues on the surface of RasWT•Mg2+•GppNHp is depicted in
Figure 3.40. Asn26 belongs to the loop λ2 that connects the helix a1 to the b2 strand, just at
the beginning of switch 1. This residue is involved in two polar contacts between its main
chain NH group to the carboxyl groups of Ile21 and Gln22, both located in the a1 helix
(Figure 3.40B). His94 is in the middle of the helix a3, with the side chain protruding towards
helix a2 and establishing a polar contact with the side chain of Tyr137, Glu91 and Glu98
(C). Mutation to Asp would disrupt the H-bond with Tyr137 which could lead to an increase
of the distance between a2 and a3. Ala66 is located in the helix a2, at the end of the switch
2 and establishes a polar contact with Asp69 on the same helix and a H2O molecule (D).
Replacement to a Thr would introduce an additional polar group that would become oriented
towards the outward surface of the protein, which could induce in principle significant
structural modifications. From the three residues under investigation, only Asn26 is reported
to be an “hot spot” for being involved in a disease of the central nervous system when
mutated to Gly [252].
3.4.2.1.1 31P NMR GppNHp and GTP Spectra. Raf Interaction and GTPase Activity
Figures 3.41 and 3.42 show respectively the 31P NMR spectra of the GppNHp and the GTP-
bound protein complexes. The numerical values for the fitted chemical shifts and linewidths
are shown in Table 3.13 and the corresponding GDP-bound spectra are shown in Figure B
of the appendix section. From the obtained data it can be inferred that there are no
significant differences in terms of shift values and linewidths between the three mutants and
wild type Ras. The only exception to this statement is state 1(T) on g-phosphate of RasH94D,
whose linewidth is 20% smaller than the corresponding one in RasWT (Dn1/2 = 59 vs 74 Hz).
RasN26K shows an additional signal at d= 0.98 ppm, with a linewidth of Dn1/2= 19.2 Hz. The
signal is most likely due to a contamination during the nucleotide exchange reaction. This
is corroborated by the 1H spectrum that also shows additional unknown peaks.
The GTP-bound spectra of the three mutants are also identical to the one of wild type Ras
(Figure 3.42). The calculated equilibrium constants for RasN26K and RasA66T are respectively
9.30 and 10.4, somewhat smaller than K12= 11.3 obtained for RasWT. However, the
difference is not meaningful due to the large associated error (for all cases, including RasWT
the integration of state 1(T) lies within the baseline noise and is therefore very inaccurate).
The most interesting feature can be ascribed to the very broad peak (Dn1/2 = 67 Hz) located
at d= 3.36 ppm in the spectrum of RasH94D•Mg2+•GTP. This chemical shift usually
corresponds to the NMR line of free GMP (this was confirmed by spiking experiments using
the same protein sample). However, the peak is too broad to be associated with the free

3. Results
149
nucleotide in the present case.
Furthermore, it is also present
in RasH94D•Mg2+•GDP (d= 3.39
ppm, Dn1/2 = 73 Hz, Figure B,
appendix section), but absent
in the RasH94D•Mg2+•GppNHp
spectra, which indicates that
alkaline phosphatase (AP) is
capable of hydrolysing any
phosphate group(s) associated
with the signal. Within the
available data, it is unclear if
this peak corresponds to
phosphorylated Ras. Although
it is a possibility since neither
the 1H NMR spectra nor SDS-
PAGE showed sign of potential
contaminants on the sample.
From the obtained results, it
can be generally concluded
that the direct expectation of
observing a conformational
transition towards state 1(T)
upon mutating the specific
sensitive residues was not
achieved.
However, the same 31P
chemical shifts and population
distributions do not necessarily
mean that the mutants have the
same biochemical behaviour.
In an attempt to elucidate if this
is the case, the time-dependent
intrinsic hydrolysis rate of each mutant was evaluated using HPLC. In parallel, their affinity
towards Raf-RBD was also investigated by ITC. The results are shown in Figure 3.43 and
Figure 3.42. Conformational equilibria of the Ras•Mg2+•GTP selected mutants detected by 31P NMR at 278 K, 202.4 MHz and pH 7.5. The mutants were created by SDM upon choosing specific residues associated with the 2(T)-to-1(T) conformational transition. All proteins were dissolved in buffer F (see above) at a concentration of 1.7 mM (WT, 1200 scans), 0.95 mM (N26K, 2000 scans), 1.96 mM (H94 D, 700 scans) and 1.00 mM (A66T, 2000 scans). An EM filter with LB= 15Hz was used in all spectra.
Figure 3.41. Conformational equilibria of the Ras•Mg2+•GppNHp selected mutants detected by 31P NMR. The mutants were created by SDM upon choosing specific residues associated with the 2(T)-to-1(T) conformational transition. All the measurements were done at 278 K in a 202.4 MHz magnetic field (500 MHz spectrometer). The proteins were dissolved in buffer F (40 mM Tris/HCl pH 7.5, 10 mM MgCl2, 2 mM DTE) with additionally 0.2 mM DSS and 5% D2O at concentrations of 1.5 mM (WT, 1700 scans), 1.60 mM (N26K, 3000 scans), 0.9 mM (H94D, 1000 scans) and 1.44 mM (A66T, 3000 scans). An EM filter with LB=15 Hz was used in all spectra.

3. Results
150
Table 3.13. 31P NMR chemical shift values and linewidths obtained for the different mutants of HRas(1-166). The mutated residues are involved in the conformational transition 2(T)-to-1(T).
Protein complex
a-phosphate b-phosphate g-phosphate K12
b d1(T) [ppm]
d2(T) [ppm]
d1(T),2(T)a
[ppm] d1(T) [ppm]
d2(T) [ppm]
Mg2+•GDP WT -10.50 -1.97 -- --
N26K -10.15 -1.99 -- -- H94D -10.59 -1.99 -- -- A66T -10.51 -2.00 -- --
Mg2+•GppNHp WT -11.17 -11.68 -0.25 -2.57 -3.33 1.7
N26K -11.07 -11.63 -0.25 -2.53 -3.35 1.5 H94D -11.23 -11.68 -0.25 -2.55 -3.36 1.8 A66T -11.14 -11.67 -0.28 -2.56 -3.37 1.8
Mg2+•GTP WT -11.68 -14.87 -6.63 -7.98 11.3
N26K -11.63 -14.83 -6.64 -7.97 10.4 H94D -11.67 -14.83 -- -7.98 -- A66T -11.65 -14.83 -6.65 -7.96 9.30
a-phosphate b-phosphate g-phosphate
-- Dn1/2 1(T) [Hz]
Dn1/2 2(T) [Hz]
Dn1/2 1(T),2(T)a
[Hz]
Dn1/2 1(T) [Hz]
Dn1/2 2(T) [Hz]
Mg2+•GDP WT 46.89 30.02 --
N26K 46.77 29.87 -- H94D 48.71 30.15 -- A66T 55.57 30.00 --
Mg2+•GppNHp WT 105.39 75.15 45.84 74.47 55.07
N26K 120.31 87.69 55.00 75.04 57.00 H94D 121.21 58.26 46.23 59.05 57.04 A66T 104.00 82.01 46.12 74.03 55.11
Mg2+•GTP WT 54.74 45.66 20.33 35.44
N26K 49.46 39.31 78.87 H94D 43.66 36.54 -- 29.74 A66T 55.00 43.89 48.00 37.00 All the values are fitted from the experimental spectra recorded at 278 K and
pH 7.5. The maximum estimated errors are ± 0.07 ppm in chemical shift values and ± 0.4 Hz in linewidths for the g-phosphate. An LB= 15 Hz was applied to the FID and subtracted afterwards from the fitted linewidths. a States 1(T) and 2(T) of the b-phosphate in cannot be separated at the magnetic field used and were therefore fitted as a single Lorentzian line. b The equilibrium constant, K12, was calculated using the population distribution on the g-phosphate. The associated error is ± 0.2.
Table 3.14. In principle, if a mutation promotes a shift towards state 1(T), even if this shift
remains undetected by 31P NMR, biochemical properties such as the GTPase activity
should reflect the modification. In fact, it is known that state 2(T) (and probably also 3(T)) is
associated with faster hydrolysis rates compared with for example, partial loss-of-function
and oncogenic variants, that exist predominantly in state 1(T) such as RasT35S [67]. Figure

3. Results
151
3.43A shows that under single turnover
conditions all the three mutants have an
identical hydrolysis rate, close to the one
obtained for RasWT (kcat= 0.026 min-1)
and similar half-life’s (τ= 27-30 min.,
Table 3.14). Using the same
experimental conditions, the GTPase
activity was also tested for N26K, H94D
and A66T in the presence of Raf-RBD.
Since RasWT•Mg2+•GTP already exists
mainly in state 2(T), its intrinsic
hydrolysis is not (or it is only very
slightly) accelerated by addition of
effector (kcat= 0.029 min-1), contrary for
example to the state 1(T) RasT35S whose
GTPase activity becomes accelerated
more than 2.5-fold when Raf-RBD is
added [67]. The situation of RasA66T and
RasN26K is again similar to the one
observed for wild type: addition of Raf-
RBD does not change their hydrolysis
rates and the calculated kcat values are
virtually identical in the presence and
absence of the effector. In the case of
RasH94D, however, addition of effector
leads to a 1.7-fold increase in its
GTPase activity, which is significant
(kcat= 0.035 min-1 and τ= 19.56 min.,
Figure 3.43B). Most likely, state 2(T) is
further stabilised by Raf binding in H94D
comparably to N26K or A66T, which
accounts for the observed difference.
The obtained affinities of binding between wild type, N26K, H94D, A66T and Raf-RBD are
all very similar. They proceed with the same averaged DG of -36.5 kJ mol-1 and with similar
enthalpic and entropic contributions. The formation of the complex between RasWT and Raf
Figure 3.43. Determination of the intrinsic GTPase activity of HRas(1-166)•Mg2+•GTP by HPLC at 310 K. Typically 100 µM of protein were dissolved in buffer F. At specific time intervals, 50 µl were snap-frozen in liquid N2 to prevent a continuous hydrolysis reaction. The nucleotide concentration equals the protein concentration in absence of free nucleotide because Ras binds nucleotides in a ratio of 1:1. The HPLC system contains a pre-column, a C18 reversed phase column and a UV-detector measuring the nucleotide absorbance at λ= 254 nm. The protein precipitates in the mobile phase and is retained by the pre-column. At the same time the nucleotide is released and separated through the C18 column. Upon integration of the fluorescence signal from GTP, the percentage of Ras-GTP was plotted against time and the data fitted with a first order exponential decaying function. A. The measurements were conducted for the three mutants under study, N26K, H94D and A66T. B. The GTPase activity was also measured in the presence of Raf-RBD. From the three mutants, only H94D shows significant differences upon addition of two-fold excess of effector (kcat=0.035 min-1, τ= 19.56 min.).

3. Results
152
is only ever so slightly enthropically favourable (-TDS= -28.3 kJ mol-1) than the one observed
for the three mutants. The corresponding dissociation constant, KD, in the case of wild type
is 0.424 ± 0.12 µM. A similar value was obtained for RasH94D-Raf complex (KD= 0.436 ± 0.07
kJ mol-1) but a 1.75-fold lower value was obtained in the case of RasN26K and RasA66T, which
is per se indicative of their slightly higher affinity towards Raf (their KD is numerically more
similar to the one obtained for the full length RasWT-Raf complex than the one obtained in
the corresponding truncated Ras variant, Figure 3.2).
Table 3.14. Thermodynamics of interaction between HRas•Mg2+•GppNHp and Raf-RBD measured by ITC and intrinsic GTPase activities measured by HPLC on the HRas•Mg2+•GTP protein.
Protein T
K [Ras] µM
[Raf] µM
DG kJ mol-1
DH kJ mol-1
-TDS kJ mol-1
KD µM
T K
kcat min-1
τ min.
K HRasWT 298 60 778 -36.4 -8.10 ± 0.23 -28.3 0.424 ± 0.12 310 0.026 26.85 HRasN26K 298 40 454 -37.7 -16.10 ± 0.17 -21.7 0.248 ± 0.03 310 0.023 30.27 HRasH94D 298 45 627 -36.3 -11.8 ± 0.19 -24.5 0.436 ± 0.07 310 0.021 32.92 HRasA66T 298 52 546 -37.8 -14.0 ± 0.29 -23.9 0.239 ± 0.05 310 0.021 32.33
kcat represents the hydrolysis rate constant and is calculated as 1/t. τ represents the half-life for the GTP hydrolysis (τ=t*ln2). ITC experiments were done according to the experimental section 2.2.4. The experimentally obtained thermograms and signature plots are shown in Figure F of the appendix section. The N parameter (binding sites) was allowed to vary during the fitting procedure. The greatest deviation from a 1:1 ratio was obtained for RasH94D with N= 1.0 ± 0.22. The error on all the other measurements was always smaller than ± 0.2.

3. Results
153
3.4.2.2 2(T)-to-1(0) Transition: S39L and E3V
Ser39 and Glu3 are associated with the 2(T)-to-1(0) transition and show relatively high
pressure coefficients, with B1,2 ≥ σ0 (σ0 being the standard deviation) [171]. They are not
involved with any known rasopathy but both constitute the binding site of the small
compound Zn2+-BPA, as determined previously by paramagnetic relaxation enhancements
in 31P NMR and [1H-15N]-HSQC experiments [158]. Their location on the surface of HRasWT
is shown in Figure 3.44. Ser39 lies at the end of the switch 1 in the strand b2 and is involved
in the interaction with GAP-334 (H-bond to Glu950 [83]), Raf-RBD (H-bond to Arg67 and
Arg89, [64]) and RalGDS (H-bond to Met30 and Tyr31, [253]). Exchange towards the non-
polar amino acid leucine directly hinders some of these polar contacts due to the absence
of the side chain hydroxyl group on the mutant. Glu3 is located in the b1 strand and is not
involved in any interaction with GAP’s, GEF’s or effectors. In the protein, Glu3 establishes
solvent-mediated polar contacts with Glu76 from helix a2 (Figure 3.44B). Mutation towards
the non-polar valine very likely interrupts this interaction. Contrary to the other mutants
investigated so far, E3V is located far away from the catalytic centre. Any shift of the
equilibrium at the nucleotide-bound level would preclude an interesting result.
Figure 3.44. Localization on the HRasWT•Mg2+•GppNHp surface the amino acid residues Ser39 and Glu3 that were subjected to SDM. They are sensitive to the 2(T)-to-1(0) transition upon pressure perturbation and were mutated with the prospect of shifting the equilibrium in the same direction. A. The localization of both residues is shown in orange. Switch 1 is coloured in green, switch 2 is coloured in red and the Mg2+ ion is coloured in magenta. B. Key features near each residue, including polar contacts, are highlighted. pdb: 5p21.

3. Results
154
3.4.2.2.1 31P NMR GppNHp and GTP Spectra. Raf Interaction and GTPase Activity
Both mutants show notable differences when compared with RasWT in terms of their
equilibrium between states 1(T) and 2(T). This is directly observed from the GppNHp-bound 31P NMR spectra shown in Figure 3.45A. The equilibrium constants calculated at the g-
phosphate are 1.5 and 2.0 for RasS39L and RasE3V, respectively. Compared to RasWT (K12=
1.7), the first mutant is slightly shifted towards state 1(T) and the second one is significantly
shifted towards state 2(T).
The increased state 1(T) on
RasS39L can be observed not
only for the g- but also for the a-
phosphate and the averaged
peak linewidths are smaller
than the corresponding ones in
RasWT (Table 3.15). There are
no changes in the positions of
state 2(T), however when
compared with RasWT, state
1(T) is downfield shifted by a Dd
of 0.1 and 0.07 ppm at the a-
and g-phosphates,
respectively. A strong upfield
shift of ca. -0.1 ppm of the a-
phosphate is also observed in
the 31P NMR spectra of the
GDP-bound complex (Figure B,
appendix). The 31P NMR
spectra of RasS39L bound to
GTP is identical to the wild type
one (Figure 3.45B) in terms of
chemical shifts, linewidths and
equilibrium constants (K12=
11.8 and 11.3, respectively).
Pronounced effects are
observed in the case of RasE3V
if one has in consideration the
Figure 3.45. Effect of the mutated residues sensing the conformational transition 2(T)-to-1(0) in the equilibrium dynamics of the bound nucleotide A. Ras•Mg2+•GppNHp (S39L 1.0 mM, 3000 scans; E3V 1.8 mM, 3000 scans) and B. Ras•Mg2+•GTP (S39L 1.0 mM, 3000 scans; E3V 1.5 mM, 2000 scans). All the measurements were done at 278 K in a 202.4 MHz magnetic field (500MHz spectrometer). The proteins were dissolved in buffer F (40 mM Tris/HCl pH 7.5, 10 mM MgCl2, 2 mM DTE) with additionally 0.2 mM DSS and 5% D2O. A Lorentzian line broadening of 15 Hz was applied to the FID. The calculated shift values, linewidths and equilibrium constants are given in Table 3.15.

3. Results
155
distant localization of this residue with respect to the nucleotide. The mutation leads to a
18% increase in the population of state 2(T) of g-phosphate but has no effect on the a-
phosphate (Figure 3.45A). These effects are observed only in the GppNHp spectrum, with
the GTP-bound nucleotide being again virtually identical to the one of RasWT. The only
additional feature is an intense peak located at d= -5.5 ppm that can be ascribed most likely
to the presence of impurities during sample preparation (Figure 3.45B). Within the limits of
error the obtained chemical shifts and linewidths remain unperturbed by the mutation in
both cases.
Table 3.15. 31P NMR chemical shift values and linewidths obtained for the different mutants of HRas(1-166). The mutated residues were selectively chosen according to their involvement in the pressure modulated 2(T)-to-1(0) conformational transition.
Protein complex
a-phosphate b-phosphate g-phosphate K12
b d1(T) [ppm]
d2(T) [ppm]
d1(T),2(T)a
[ppm] d1(T) [ppm]
d2(T) [ppm]
Mg2+•GDP WT -10.50 -1.97 -- --
S39L -10.60 -2.03 -- -- E3V -10.47 -1.99 -- --
Mg2+•GppNHp WT -11.17 -11.68 -0.25 -2.57 -3.33 1.7
S39L -11.08 -11.67 -0.25 -2.50 -3.35 1.5 E3V -11.23 -11.68 -0.27 -2.59 -3.33 2.0
Mg2+•GTP WT -11.68 -14.87 -6.63 -7.98 11.3
S39L -11.65 -14.84 -6.54 -7.97 11.8 E3V -11.68 -14.85 -- -7.98 --
a-phosphate b-phosphate g-phosphate
-- Dn1/2 1(T) [Hz]
Dn1/2 2(T) [Hz]
Dn1/2 1(T),2(T)a
[Hz] Dn1/2 1(T)
[Hz] Dn1/2 2(T)
[Hz] Mg2+•GDP WT 46.89 30.02 --
S39L 51.39 35.00 -- E3V 29.54 33.00 --
Mg2+•GppNHp WT 105.39 75.15 45.84 74.47 55.07
S39L 98.05 62.88 42.55 48.95 50.82 E3V 122.22 67.33 54.39 78.74 53.00
Mg2+•GTP WT 54.74 45.66 20.33 35.44
S39L 53.36 37.95 41.55 32.43 E3V 61.71 47.12 -- 43.18 All the values are fitted from the experimental spectra recorded at 278 K and
pH 7.5. The maximum estimated errors are ± 0.07 ppm in chemical shift values and ± 0.4 Hz in linewidths for the g-phosphate. An LB=15 Hz was applied to the FID and subtracted afterwards from the final fitted linewidths. a States 1(T) and 2(T) of the b-phosphate in cannot be separated at the magnetic field used and were therefore fitted as a single Lorentzian line. b The equilibrium constant, K12, was calculated using the population distribution on the g-phosphate. The associated error is ± 0.2.

3. Results
156
The calculated kcat values (Table 3.16), as well as the associated half-lifes are virtually
identical. ITC measurements showed that RasS39L binds Raf-RBD with a 5.7-fold higher
affinity than RasWT (KD= 0.074 vs 0.424 µM). The interaction proceeds with a great enthalpic
contribution in the case of the mutant (DH= -24.0 vs -8.10 kJ mol-1). Regarding RasE3V, the
affinity towards Raf is identical to the one measured for wild type.
In the light of the present results, RasS39L and RasE3V have different and somewhat opposite
population distributions, despite the mutated residues being involved in the same
conformational transition (the former stabilises state 1(T) but shows an enhanced binding
affinity to Raf, the later stabilises state 2(T) and shows an unperturbed affinity to Raf).
A last set of experiments was conducted using the GppNHp-bound nucleotide RasS39L and
RasE3V with the aim of further characterise state 1(T). It was hypothesised that both could
have a hidden contribution from state 1(0), obscured by the overall similarity (same
chemical shifts, same linewidths) between the 31P NMR spectra of the mutants and the wild
type protein. To test if this was the case, they were titrated with the small compound Cu2+-
cyclen that binds near the g-phosphate only when Ras exists in state 1(T) and acts as a
selective sensor for its identification [254]. The results are shown graphically and
numerically in Figure C and Table I of the appendix section. The effect of Cu2+-cyclen in the
spectra RasS39L and RasE3V was the same: with increasing amounts of the drug the line
broadening of state 1(T) increases dramatically up to a point where it disappears beyond
detection. The effect is due to the paramagnetic influence of the Cu2+ ion that selectively
collapses the line of state 1(T). Since paramagnetic relaxation is a localized effect, the other
peaks of the spectra remain unperturbed. If the equilibrium was shifted in the 2(T)-to-1(0)
direction by the mutations, a close-by, small resonance line corresponding to state 1(0)
should be visible in the spectrum after collapsing state 1(T). However, the titration with Cu2+-
cyclen reveals no further spectral features.
Figure 3.16. Thermodynamics of interaction between HRas•Mg2+•GppNHp and Raf-RBD measured by ITC and intrinsic GTPase activities measured by HPLC in the HRas•Mg2+•GTP complex.
Protein T
K [Ras] µM
[Raf] µM
DG kJ mol-1
DH kJ mol-1
-TDS kJ mol-1
KD µM
T K
kcat min-1
Τ min.
HRasWT 298 60 778 -36.4 -8.10 ± 0.23 -28.3 0.424 ± 0.12 310 0.026 26.85 HRasS39L 298 30 258 -40.8 -24.0 ± 0.33 -16.8 0.074 ± 0.01 310 0.029 24.04 HRasE3V 298 28 486 -35.6 -19.4 ± 0.43 -16.2 0.603 ± 0.01 310 0.027 27.12
kcat represents the hydrolysis rate constant and is calculated as 1/t. τ represents the half-life for the GTP hydrolysis (τ=t*ln2). ITC experiments were done according to the experimental section 2.2.4. The experimentally obtained thermograms and signature plots are shown in Figure F of the appendix section. The N parameter (binding sites) was allowed to vary during the fitting procedure. The greatest deviation from a 1:1 ratio was obtained for RasE3V with N= 1.0 ± 0.22. The error on all the other measurements was always smaller than ± 0.2. The greatest deviation from a 1:1 ratio was obtained for RasS39L with N= 0.89 ± 0.12. The error on all the other measurements was always smaller.

3. Results
157
3.4.2.3 2(T)-to-3(T) Transition: H27E and D33K
Stabilising state 3(T) is a very attractive idea from a pharmaceutical point of view, especially
in the case of oncogenic Ras because promoting the transition would have two immediate
and assisted effects: the change in conformation would drive away the protein from the
permanently active state 2(T) and at the same time the high intrinsic GTPase activity of
state 3(T) would account for an unprecedented re-cycling of Ras towards the guanine
diphosphate state (from “(T)” to “(D)”). Contrary to the mutants studied above, the two
residues are located in the switch 1 region and account for the stabilisation of the H2O
bonding network around the active site. Their localisation on the surface of the protein is
shown in Figure 3.46, together with the structural details in their vicinity.
3.4.2.3.1 31P NMR GppNHp and GTP Spectra. Raf Interaction and GTPase Activity
The GppNHp spectrum of the mutant RasH27E has a significantly lower equilibrium constant
(K12=1.0) than the wild type counterpart (K12=1.7, Figure 3.47A and Table 3.17). The
mutation promotes a clear effect by increasing the population of state 1(T), which becomes
downfield shifted by d= 0.07 and d=0.34 ppm at the g- and a-phosphates, respectively, when
compared to RasWT A similar downfield shift of d= 0.06 ppm is also observed for the b-
phosphate alongside with a 55% broadening of its resonance line. The corresponding
RasH27E•GTP spectrum on the other hand, shows no significant differences from RasWT
(Figure 3.47B), albeit the K12 values are slightly different (10.0 vs 11.3). The GDP spectrum
Figure 3.46. Localization on the HRasWT•Mg2+•GppNHp surface the amino acid residues His27 and Asp33 that were subjected to SDM. They are sensitive to the 2(T)-to-3(T) transition upon pressure perturbation and were mutated with the prospect of shifting the equilibrium in the same direction. A. The localization of both residues is shown in orange. switch 1 is coloured in green, switch 2 is coloured in red and the Mg2+ ion is coloured in magenta. B. Key features such as polar contacts are highlighted near each residue. pdb: 5p21.

3. Results
158
of RasH27E (Figure B, appendix)
shows a large downfield shift of
the a-phosphate, with a Dd=
0.36 ppm (d= -10.50 ppm in
RasWT and d= -10.14 ppm in
RasH27E, Table 3.17).
The differences observed
between RasD33K and RasWT
regarding the GppNHp-bound
nucleotide are remarkable: the
population distribution at the g-
and a-phosphates is collapsed
and almost completely shifted
towards state 2(T). State 1(T)
exists as a residual line located
within the noise level. The
equilibrium constant is 11.3 and
closely resembles the one of
RasWT•Mg2+•GTP (Table 3.17).
At the a-phosphate, state 1(T),
if present, is not clearly
separated from the main
resonance line. Additional
differences between D33K and
wild type are observed in terms
of chemical shifts: the
calculated values for the g1(T)-
and g2(T)-phosphates in the
former are d= -2.47 and d= -
3.40 ppm, respectively and the corresponding ones in the latter are d= -2.57 and d= -3.33
ppm, respectively. The difference accounts for a Dd of 0.1 ppm for state 1(T) and 0.07 ppm
for state 2(T). The single resonance line of the a-phosphate lies at d= -11.46 ppm, exactly
in between the two states observed in RasWT. Contrary to the downfield shift of the a- and
g-lines, the b-phosphate is shifted upfield by a Dd of -0.06 ppm. The spectra of the state 1(T)
mutant RasT35S•Mg2+•GppNHp is also shown in Figure 3.47A for comparison of the relative
Figure 3.47. Effect of the mutated residues sensing the conformational transition 2(T)-to-3(T) in the equilibrium dynamics of the bound nucleotide A. Ras•Mg2+•GppNHp (H27E 1.57 mM, 2600 scans; D33K 3.0 mM, 800 scans, T35S 0.75 mM 2000 scans) and B. Ras•Mg2+•GTP (H27E 0.8 mM, 3000 scans; D33K 2.94 mM, 3000 scans). All the measurements were done at 278 K in a 202.456 MHz magnetic field (500 MHz spectrometer). The proteins were dissolved in buffer F (40 mM Tris/HCl pH 7.5, 10 mM MgCl2, 2 mM DTE) with additionally 0.2 mM DSS and 5% D2O. A Lorentzian line broadening of 15 Hz was applied to the FID. The calculated shift values, linewidths and equilibrium constants are given in Table 3.17.

3. Results
159
positions of the signals. No significant differences are observed between the GTP-bound
mutants and RasWT. Based on the GppNHp-bound spectra, RasD33K seems to be shifted
towards state 2(T). However, a significant contribution from state 3(T), which is coupled and
indistinguishable from state 2(T) by 31P NMR, can also be assumed at this point.
Table 3.17. 31P NMR chemical shift values and linewidths obtained for the different mutants of HRas(1-166). The mutated residues were selectively chosen according to their involvement in the pressure modulated 2(T)-to-3(T) conformational transition.
Protein
a-phosphate b-phosphate g-phosphate K12
b d1(T) [ppm]
d2(T) [ppm]
d1(T),2(T)a
[ppm] d1(T) [ppm]
d2(T) [ppm]
Mg2+•GDP WT -10.50 -1.97 -- --
H27E -10.14 -1.91 -- -- D33K -10.22 -2.20 -- --
Mg2+•GppNHp WT -11.17 -11.68 -0.25 -2.57 -3.33 1.7
H27E -10.83 -11.67 -0.19 -2.50 -3.25 1.0 D33K -11.46c -0.31 -2.47 -3.40 11.3
Mg2+•GTP WT -11.68 -14.87 -6.63 -7.98 11.3
H27E -11.65 -14.83 -6.35 -7.94 10.0 D33K -11.66 -14.92 -- -7.97 --
a-phosphate b-phosphate g-phosphate Dn1/2 1(T)
[Hz] Dn1/2 2(T)
[Hz] Dn1/2 1(T),2(T)
a
[Hz] Dn1/2 1(T)
[Hz] Dn1/2 2(T)
[Hz] --
Mg2+•GDP WT 46.89 30.02 --
H27E 50.32 32.00 -- D33K 65.55 31.03 --
Mg2+•GppNHp WT 105.39 75.15 45.84 74.47 55.07
H27E 91.12 120.31 70.00 61.82 56.72 D33K 77.31c 41.92 73.40 55.07
Mg2+•GTP WT 54.74 45.66 20.33 35.44
H27E 49.73 42.91 45.12 36.57 D33K 78.05 55.51 -- 49.79 All the values are fitted from the experimental spectra recorded at 278 K
and pH 7.5. The maximum estimated errors are ± 0.07 ppm in chemical shift values and ± 0.4 Hz in linewidths for the g-phosphate. An EM function with LB=15 Hz was used for processing the FID and subtracted afterwards. a States 1(T) and 2(T) of the b-phosphate in cannot be separated at the magnetic field used and were therefore fitted as a single Lorentzian line. b The equilibrium constant, K12, was calculated using the population distribution on the g-phosphate. The associated error is ± 0.2. c a-phosphate on RasD33K was fitted with a single Lorentzian line.

3. Results
160
The measurement of the intrinsic GTPase
activity shows that RasH27E hydrolyses GTP
at the same rate as RasWT (kcat= 0.025 min-
1, τ= 28.20 min., Figure 3.48, Table 3.18),
despite being considerably shifted towards
state 1(T). RasD33K is surprisingly 1.5 times
slower than RasWT (kcat= 0.017 vs 0.026
min-1, Table 3.18) yet the conformational
equilibria of this mutant is almost
completely shifted towards a state closely
resembling 2(T) in RasWT, which is normally
associated with a faster GTP hydrolysis.
Addition of Raf-RBD has no influence in the
catalytic activity of RasH27E (kcat= 0.025 min-
1, τ= 27.39 min.), but induces a slightly
faster hydrolysis in the case of RasD33K (kcat= 0.019 min-1, τ=36.37 min.), which is yet
considerably slower than the typical rate of conversion for RasWT alone.
RasH27E has a slightly higher affinity to the effector (KD= 0.225 ± 0.05 µM) than RasWT (KD=
0.424 ± 0.12 µM), although the difference is attenuated by the experimental errors of each
measurement. The associated enthalpy of binding is twice of the recorded for wild type
(DH= -16.9 ± 0.18 vs -8.10 ± 0.23 kJ mol-1), but both proceed with a similar Gibbs energy.
The strength of the interaction between RasD33K and Raf is remarkably 26–fold lower than
RasWT (KD= 10.4 µM). The binding proceeds still with positive enthalpic and entropic
contributions but the enthalpy variation is much lower than the one of RasWT (DH= -4.24 ±
0.25 kJ mol-1).
Table 3.18. Thermodynamics of interaction between HRas•Mg2+•GppNHp and Raf-RBD measured by ITC and intrinsic GTPase activities measured by HPLC in the HRas•Mg2+•GTP complex.
Protein T K
[Ras] mM
[Raf] mM
DG kJ mol-1
DH kJ mol-1
-TDS kJ mol-1
KD µM
T K
kcat min-1
τ min.
HRasWT 298 60 778 -36.4 -8.10 ± 0.23 -28.3 0.424 ± 0.12 310 0.026 26.85 HRasH27E 298 39.8 637 -38.0 -16.9 ± 0.18 -21.1 0.225 ± 0.05 310 0.025 28.20 HRasD33K 298 145 1680 -28.5 -4.24 ± 0.25 -24.2 10.4 ± 1.93 310 0.016 41.46
kcat represents the hydrolysis rate constant and is calculated as 1/t. τ represents the half-life for the GTP hydrolysis (τ=t*ln2). ITC experiments were done according to the experimental section 2.2.4. The experimentally obtained thermograms and signature plots are shown in Figure F of the appendix section. The N parameter (binding sites) was allowed to vary during the fitting procedure. The greatest deviation from a 1:1 ratio was obtained for RasH27E with N= 1.0 ± 0.18.
Figure 3.48. Determination of the intrinsic GTPase activity of the GTP-bound mutants RasH27E and RasD33K by HPLC at 310K. Upon integration of the fluorescence signal, the percentage of Ras-GTP was plotted against time and the data fitted with a first order exponential decaying function (see Figure 3.43 for details on the description of the method). The obtained rate constants are 0.026, 0.025 and 0.016 min-1 for WT, H27E and D33K, respectively (see also Table 3.18).

3. Results
161
3.4.3 Interaction Between HRasH27E•Mg2+•GppNHp and Raf-RBD
A 1.5 mM solution of RasH27E was titrated with increasing amounts of Raf as shown in Figure
3.49. The experiment shows that for an equimolar concentration of the two proteins, the
conformational equilibrium is completely shifted towards state 2*(T), characteristic of this
particular interaction and closely related with state 2(T) (see sections 3.1.1-3 for additional
details regarding the dynamics of state 2*(T)). This modification is also accompanied by the
typical upfield shift of the corresponding line by a Dd= -0.27 ppm and with state 2*(T) located
at d= -3.54 ppm. Similar shifts were found upon titration of wild type HRas and KRas (d2*(T)=
-3.6 and -3.51 ppm, respectively; Table 3.1 and [117]). The resonances of a- and b-
phosphates remain virtually unperturbed during the titration (Table 3.19). The molecular
mass of the Ras-Raf complex is 1.5-fold higher than Ras alone. This increase of size is
directly related with the increase of the spectral linewidths as it can be seen from the b-
phosphate, from Dn1/2= 67.5 Hz in Ras alone to Dn1/2 =102 Hz (1.5-fold) at a 1:1 ratio. This
direct relationship is however not valid in the case of the a- and the g-phosphates because
they are exchange broadened
by the presence of the distinct
conformational states 1(T) and
2(T). The apparent dissociation
constant can also be estimated
from the 31P NMR spectra given
the existence of the two distinct
resonance lines in a slow
exchange regime located at the
b-phosphate (blue coloured line
in Figure 3.49). Their integrals
were considered to be
proportional to the
concentration of free Ras
([Ras]free) and to the
concentration of the Ras-Ras
complex ([RR]) for a given
molar ratio. The value of [RR] is
given by the ratio of the areas
multiplied by [Ras]free. From this
assessment, an apparent KD of
Figure 3.49. 31P NMR spectroscopy on the titration of HRasH27E•Mg2+•GppNHp with the effector Raf-RBD measured at 278 K and pH 7.5. To an initial 1.5 mM solution of RasH27E dissolved in buffer F (40 mM Tris/HCl pH 7.5, 10 mM MgCl2, 2 mM DTE) with additionally 0.2 mM DSS, 150 mM NaCl and 5% D2O, increasing amounts of Raf-RBD from a highly concentrated 6.5 mM stock solution were added, up to a final ratio of 1:1. The evolution of state 2(T) into 2*(T) upon Raf binding is indicated. The integrated areas of the fitted Lorentzian lines at the b-phosphate, coloured in blue, are assumed to be directly proportional to the concentration of free Ras (Rasfree) and Ras-Raf (RR) complex and were used to calculate the apparent KD of the interaction. An EM function with LB= 15Hz was applied to the FID during the processing of the data. The chemical shifts and linewidths are shown in Table 3.19.

3. Results
162
ca. 100 µM was obtained which does not agree with the ITC measurements. It should be
mentioned that this method is intrinsically inaccurate because relies on concentrations in
the order of the mM range required in 31P NMR but typically considered too high for a
realistic determination of µM or sub-µM binding affinities.
Table 3.19. 31P NMR chemical shift values and linewidths for the protein-protein complex HRasH27E(1-166)•Mg2+•GppNHp•Raf-RBD.
Protein complex
Ras:Raf
a-phosphate b-phosphate g-phosphate d1(T) [ppm]
d2(T) [ppm]
d1(T),2(T)a
[ppm]
d1(T) [ppm]
d2(T) [ppm]
RasH27E -- -10.83 -11.67 -0.22 -2.52 -3.27 + Raf-RBD 1:0.6 -11.09 -11.72 -0.25 -2.55 -3.47 1:1 -- -11.65 -0.26 -- -3.54 a-phosphate b-phosphate g-phosphate Dn1/2 1(T)
[Hz] Dn1/2 2(T)
[Hz] Dn1/2 1(T),2(T)
a [Hz]
Dn1/2 1(T) [Hz]
Dn1/2 2(T) [Hz]
RasH27E -- 122 103.8 67.5 61.5 66.5 + Raf-RBD 1:0.6 194 112 74.6 86.5 106.1 1:1 -- 122.8 102 -- 60.5 All the values are fitted from the experimental spectra recorded at 278 K, pH 7.5. The maximum estimated errors from the fitting procedure are ± 0.02 ppm in chemical shift values and ± 0.12 Hz in linewidths for the g-phosphate. An LB= 15 Hz was applied to the FID and subtracted afterwards from the final fitted linewidths. a States 1(T) and 2(T) of the b-phosphate cannot be separated at the magnetic field used.
KD =[Ras] free.[Raf ] free
[RR][Ras]total = [Ras] free + [RR]

3. Results
163
3.4.4 Interaction Between HRasD33K•Mg2+•GppNHp and Raf-RBD
Due to its intriguing properties, RasD33K was subjected to an additional series of biophysical
studies, including the interaction with Raf-RBD. The results from the titration indicate that
the residual population of state 1(T) (red coloured line in Figure 3.50) rapidly disappears
upon addition of 0.5 molar equivalents of Raf. There is a direct response to the presence of
effector as this population is converted into state 2(T). The typical upfield shift of state 2(T)
is also observed as before upon titration of RasWT with the same protein (from d= -3.40 ppm
to d= -3.63 ppm at 1:2 ratio, Table 3.20). This indicates that the changes in the chemical
environment of the g-phosphate that accompany the process of binding are identical to the
ones observed for RasWT. However, the situation is different for the a- and b-phosphates:
the initial resonance observed at the a-phosphate in RasD33K alone (d= -11.46 ppm) seems
to split into another component as soon as Raf is added and remains with the same
configuration in all the subsequent steps of the titration (i.e. there is no additional change in
chemical shifts or linewidths as the concentration of Raf is increased). This behaviour is
markedly different from the titration of RasWT, where the a-phosphate is also converted into
state 2*(T) shifting upfield by a Dd of -0.15 ppm (Figure 3.1 and [117]. The formation of state
2*(T) is thus impaired in
RasD33K for the a-phosphate,
which might explain the low
affinity of binding for the
protein-protein complex (Table
3.18). The response of the b-
phosphate is characterised by
a severe increase of its line
broadening and by the
appearance of an additional
component that protrudes from
its right-side as a broad
shoulder. This shoulder seems
to be, in fact, formed by multiple
resonances that cannot be
resolved separately. An
unknown peak at ca. 1.04 ppm
can be found in all the spectra
of the series and increases in
Figure 3.50. 31P NMR spectroscopy on the titration of HRasD33K•Mg2+•GppNHp with the effector Raf-RBD measured at 278 K and pH 7.5. To an initial 2.94 mM solution of RasD33K dissolved in buffer F (40 mM Tris/HCl pH 7.5, 10 mM MgCl2, 2 mM DTE) with additionally 0.2 mM DSS, 150 mM NaCl and 5% D2O, increasing amounts of Raf-RBD from a highly concentrated 6.5 mM stock solution were added, up to a final ratio of 1:2. An EM function with LB= 15 Hz was applied to the FID during the processing of the data. The chemical shifts and linewidths are shown in Table 3.20.

3. Results
164
intensity as the concentration of Raf-RBD is increased (note that this peak is already
present in the spectrum of Ras alone). Within the available data It is not possible to ascertain
if this peak is just an impurity or a new feature characteristic of the mutant RasD33K.
In the light of these results, the previous classification of RasD33K as a state 2(T)/3(T) fits its
spectroscopic properties observed by 31P NMR but is not in line with the typical biochemical
characteristics of state 2(T) (higher affinity towards effectors, faster intrinsic and/or GAP-
mediated hydrolysis, affinity towards GAP’s).
Table 3.20. 31P NMR chemical shift values and linewidths for the protein-protein complex HRasD33K(1-166)•Mg2+•GppNHp•Raf-RBD.
Protein complex
Ras:Raf
a-phosphate b-phosphate g-phosphate d1(T) [ppm]
d2(T) [ppm]
d1(T) [ppm]
d2(T) [ppm]
d1(T) [ppm]
d2(T) [ppm]
RasD33K -- -11.46 -0.31 -2.47 -3.40 + Raf-RBD 1:0.5 -- -11.42 -- -0.34 -- -3.64 1:1 -- -11.37 -- -0.32 -- -3.62 1:2 -- -11.41 -- -0.33 -- -3.63 a-phosphate b-phosphate g-phosphate Dn1/2 1(T)
[Hz] Dn1/2 2(T)
[Hz] Dn1/2 1(T)
[Hz] Dn1/2 2(T)
[Hz] Dn1/2 1(T)
[Hz] Dn1/2 2(T)
[Hz] RasD33K -- 77.31 41.92 73.40 55.48 + Raf-RBD 1:0.5 -- 106.37 63.65 -- 60.95 1:1 -- 106.45 81.00 -- 60.25 1:2 -- 120.31 84.15 -- 63.85 All the values are fitted from the experimental spectra recorded at 278 K, pH 7.5. The maximum estimated errors from the fitting procedure are ± 0.02 ppm in chemical shift values and ± 0.12 Hz in linewidths for the g-phosphate. An LB= 15 Hz was used in the processing of the FID and subtracted afterwards from the final fitted linewidth values.

3. Results
165
3.4.5 Interaction Between HRasD33K•Mg2+•GppNHp and NF1
The features of the RasD33K•NF1 complex were also investigated herein and revealed to be
very distinct from the ones of its counterpart RasWT•NF1. The most obvious difference lies
in the fact that a resonance that unequivocally corresponds to state 3(T) cannot be identified
in the 31P NMR spectra. As seen in Figure 3.51, addition of NF1 leads to the appearance of
an extremely broad line at the g-phosphate that consists of multiple unresolved resonances
(the fitted component is shown in Figure 3.51 for the ratios 1:0.75 and 1:1 on the g-
phosphate). Even at a molar ratio of 1:2 its centre cannot be accurately located as in the
case of RasWT•NF1 (Figure 3.39). Furthermore, its centre lies around d= -2.80 ppm (Table
3.21), which differs by a Dd of 0.2 ppm from the typical state 3(T) located at d= -3.0 ppm in
the RasWT•NF1 complex (Table 3.12). The relative area of state 2(T) on the g-phosphate
(green line) does not decrease as the titration proceeds. In fact, its relative area in RasD33K
alone and in the 1:1.75 Ras-NF1 complex is 1.73 ± 0.17 and 1.83 ± 0.32, respectively (the
numbers have arbitrary units and were obtained as the integrals of the fitted lines). This
constitutes an indication that state 2(T) remains unperturbed and cannot effectively be
converted into state 3(T) by the presence of NF1.
The b-phosphate is also markedly different from the one in the wild type complex: with
addition of NF1 it moves upfield, from d= -0.35 ppm up to a maximum of d= -0.17 ppm (Dd=
-0.18 ppm). More importantly, the saturation behaviour observed in RasWT•NF1 (section
3.4.1.2) is not observed in the present case (even at a ratio of 1:2 its main component is
the original line found in RasD33K alone). Similar findings can be found at the a-phosphate:
at complex ratios of 1:1.75 and 1:2 its main component is still the one of RasD33K alone. The
resonance arising from the protein complex is again extremely broad and not well-defined.
As result, the chemical shift values given in Table 3.21 for the a3(T)-phosphate are only a
rough estimation since a proper fitting of the line is not possible. This result agrees with the
observations found for the g-phosphate and together they show that RasD33K cannot
undergo the necessary conformational modifications to achieve state 3(T) which renders it
incapable of binding NF1 either completely or partially.
The overall results indicate so far that RasD33K has an impaired affinity towards both, Raf-
RBD and NF1. Based on these data, RasD33K does not follow the characteristics of a typical
state 2(T) mutant, despite the apparent indications given by the shift of the equilibrium at
the g-phosphate of at the GppNHp-bound spectra level.

3. Results
166
Figure 3.51. Protein complex formation between RasD33K•Mg2+•GppNHp and NF1 followed by 31P NMR spectroscopy at 278 K. To an initial 1.3 mM of Ras dissolved in buffer F (40 mM Tris/HCl pH 7.5; 10 mM MgCl2; 2 mM DTE) with additionally 150 mM NaCl, 0.2 mM DSS in 10% D2O, increasing amounts of the GAP protein NF1 (from a 0.74 mM stock solution) were added (the corresponding molar ratios for each step are presented). The concentration of Ras and NF1 in the final step (1:2 ratio) was 0.35 mM and 0.7 mM, respectively. An exponential filter with LB=15 Hz was applied to the processed FID. Each spectra was obtained by accumulation of approximately 10000 scans. The resonance lines corresponding to the a-, b- and g-phosphates are indicated as well as the states 1(T) and 2(T), represented by the red and green colours, respectively. The dashed vertical lines mark the chemical shift position of the initial phosphate resonances observed in RasD33K alone. The new spectral features observed from the addition of NF1 to Ras are coloured in blue. As an example, the deconvolution into separated Lorentzian lines is shown for two different titration steps (1:0.75 and 1:1) on the g-phosphate.

3. Results
167
These results constitute perhaps the first evidence that the common correlation between
the different structural states 1(T) and 2(T) and their correspondingly different functional
and biochemical properties should be used with caution, especially when investigating
atypical mutants, as the correlations might be true for RasWT, partial loss-of-function or
oncogenic variants but might not apply in other cases [123]. RasD33K can undergo a
conformational change towards state 2(T)/2*(T) at the g-phosphate in the presence of
effector. However, the impaired Raf binding observed from ITC can be in part explained by
the inability of the b- and mostly the a-phosphate to undergo the necessary conformational
modifications. The interaction with NF1 is also disrupted comparatively to RasWT as the
binding seems to be severely impaired for all the three phosphate groups.
Table 3.21 31P NMR chemical shift values and linewidths for the protein-protein complex HRasWT(1-166)•Mg2+•GppNHp•NF1.
Protein complex
Ras:NF1 ratio
a-phosphate b-phosphate g-phosphate d3(T) [ppm]
d2(T) [ppm]
d1(T)2(T)
[ppm]b d3(T) [ppm]
d1(T) [ppm]
d3(T) [ppm]
d2(T) [ppm]
RasD33K -- -- -11.52 -0.35 -- -2.67 -- -3.45 +NF1 1:0.25 -11.17 -11.52 -0.31 0.46 -- -2.80 -3.43
1:0.5 -10.84 -11.49 -0.28 --a -- -2.78 -3.41 1:0.75 -10.92 -11.49 -0.27 --a -- -2.82 -3.41 1:1.0 -10.70 -11.46 -0.25 --a -- -2.76 -3.40 1:1.5 -10.79 -11.46 -0.21 --a -- -2.80 -3.39 1:1.75 -10.54 -11.45 -0.20 --a -- -2.82c -3.43c 1:2.0 -11.09 -11.51 -0.17 --a -- -2.80c -3.37c a-phosphate b-phosphate g-phosphate Dn1/2 3(T)
[Hz] Dn1/2 2(T)
[Hz] Dn1/2 [Hz]
Dn1/2 3(T) [Hz]
Dn1/2 1(T) [Hz]
Dn1/2 3(T
[Hz]) Dn1/2 2(T)
[Hz] RasD33K -- -- 87.38 51.50 -- 397 -- 59.86
-- +NF1 1:0.25 202.4 99.16 61.08 559 -- 176.8 62.42 1:0.5 162.0 105.7 104.1 --a -- 183.4 67.29 1:0.75 184.6 118.6 136.9 --a -- 177.5 67.76 1:1.0 184.9 131.9 167.4 --a -- 187.2 77.03 1:1.5 187.6 135.9 256.6 --a -- 172.2 81.02 1:1.75 174.6 197.4 237.4 --a -- 194.5c 67.05c 1:2.0 164.8 159.5 268.9 --a -- 151.7c 113.3c All the values are fitted from the experimental spectra recorded at 278 K, pH 7.5. The
estimated errors from the fitting procedure are ± 0.02 ppm in chemical shift values and ± 0.20 Hz in linewidths for the g-phosphate. An LB= 15 Hz was applied to the FID and subtracted afterwards to the final fitted linewidth values. a The resonance line could not be properly fitted b States 1(T) and 2(T) of the b-phosphate cannot be separated at the magnetic field used and were therefore fitted as a single Lorentzian line. c The given values are an approximation (error ±0.1 ppm and ±5.0 Hz) due to the very broad shape of the peaks.

3. Results
168
3.4.6 31P Longitudinal Relaxation Times of RasWT, RasT35A and RasD33K
The goal of this study was to evaluate the T1 spin-lattice relaxation for the GppNHp-bound
RasD33K and to assess how the values compare with RasWT and RasT35A. The experiments
were carried at 278 K in a spectrometer operating at a 31P frequency of 242.896 MHz (600
MHz spectrometer). The magnitude of the recorded transverse magnetisation is dependent
on the time given for the recovery after the initial 180º pulse. The plot of the relative signal
areas as a function of the τ time is given in Figure 3.52 and the corresponding fitted T1
values are shown in Table 3.22. Phosphorous relaxation times of nucleotides bound to
proteins are rarely described in literature. Due to the fact that the 31P atoms are isolated by
their shell of oxygen atoms from other spins of the lattice, rather long T1 times are to be
expected. Indeed, the shortest T1 presently recorded is within the range of 3 seconds. The
values show that for all the three proteins, the relaxation rate of the a-phosphate is in
average 1.5 times faster than the b- and g-phosphates. If one compares the three proteins
in terms of each phosphate group separately, the relaxation rates are very similar, i.e. the
state 1(T) RasT35A and the state 2(T) RasD33K are similar to each other and also similar to
RasWT whose 1(T)/2(T) T1 times were averaged. The only major difference is observed in
terms of M0: the amount of longitudinal relaxation when the nuclear spins are fully relaxed
is much lower in the case of RasD33K than in the other two proteins. The reason for this
difference is simply related with the use of relative units for the calculation of the integrated
areas and has no intrinsic biochemical meaning (in other words, all the plotted areas in the
y axis should have been divided by the area of the signals obtained at M0, in order to
normalise the y scale from -1 to +1). Comparable T1 measurements for RasWT and RasT35A
are available from previous work performed at our department [116], where a magnetic field
operating at a 31P frequency of 202.456 MHz (500 MHz spectrometer) was used. The rate
of relaxation depends on the magnetic field strength and therefore the two measurements
have different T1 times. Generally T1 tends to decrease as the field strength increases.
However, the comparison between the published data with the present one shows an
opposite effect: the 31P NMR T1 times of RasWT and RasT35A decrease as the magnetic field
increases from 202.4 to 242.8 MHz.
Normally T1 is the shortest when the correlation time τc is approximately equal to the Larmor
frequency. Molecules tumbling faster or slower are less efficient at spin-lattice relaxation,
having therefore longer T1 values. For atoms in highly mobile molecules (such as free
water), changing field strength (and hence the Larmor frequency) will not appreciably alter
the fraction of protons moving at this frequency. Thus, T1 is generally not much affected.
For atoms in molecules with intermediate or low mobility, however, shifting the magnetic

3. Results
169
field to a higher value may significantly decrease the fraction of these nuclei that are able
to interact at the new (higher) Larmor frequency.
Based on the multiple studies conducted so far on RasD33K, this mutant is considerably
different from RasWT. The present analysis is relevant since T1 times affect directly signal
sensitivity and integration accuracy in NMR experiments. However, they do not provide
additional clues about the biochemical nature of the protein. Nevertheless, the titration
experiments conducted in the above sections 3.4.4 and 3.4.5 for the interaction with Raf-
RBD and NF1 unequivocally elucidate important biochemical aspects.
Since the primary goal for investigating RasD33K was to promote a state 2(T)-to-3(T)
transition (section 3.4.2.3), one question remains: was the equilibrium shifted in the
expected direction? From the 31P NMR titration measurements it does not seem to be the
case. Nevertheless, a true binding affinity assay involving a GAP protein such as NF1 (not
only for RasD33K but for all other mutants studied herein) remains to be done. Several
attempts were made using ITC but in all the cases no obvious binding curves could be
Table 3.22. Phosphorous T1 relaxation times in the HRas(1-166)•Mg2+•GppNHp proteins. Protein T /K a-phosphate b-phosphate g-phosphate RasWT 278 3.10 ± 0.05 4.35 ± 0.07 4.81 ± 0.11 RasT35A 278 2.83 ± 0.07 4.32 ± 0.14 4.25 ± 0.10 RasD33K 278 2.98 ± 0.1 4.02 ± 0.15 4.93 ± 0.31 T1 is given in seconds. The data was obtained from a proton-decoupled inversion recovery
experiment at 242.896 MHz.
Figure 3.52. T1 relaxation times in HRas(1-166)•Mg2+•GppNHp. The integrals of the resonance lines of the a-, b- and g-phosphates were plotted as a function of time, t, in an inversion recovery experiment (eqn. 10, experimental section 2.2.5.4). The lines corresponding to the two conformational states were averaged and the time allowed for the recovery of the magnetization was varied between 0.01 and 21.0 s. Measurements were performed for RasWT (-=-), RasT35A (-�-) and RasD33K (-¿-) at 278 K in a spectrometer operating at a frequency of 242.896 MHz. All the protein samples were used at the same concentration of 1.0 mM and dissolved in buffer F (40 mM Tris/HCl pH 7.5; 10 mM MgCl2; 2 mM DTE) with additionally 0.2 mM DSS in 10% D2O. The relaxation times obtained from the fitting routine are shown in table 3.22.

3. Results
170
obtained due to severe artefacts in the heat signatures, supporting the idea that Ras-GAP
complex formation does not obey to a single step and/or to steady-state conditions [255,
256].
The assignment of RasD33K as being either predominantly shifted towards 1(T) or 2(T) is not
straightforward: this mutant is biochemically similar to a typical state 1(T) (such as T35S or
Y32R/W [123]) but its conformational equilibria is almost completely shifted towards state
2(T) from an NMR point of view. More importantly, it gives the first evidence that the
common correlation between the different structural states 1(T) and 2(T) and their
correspondingly different functional and biochemical properties should be used with
caution.
Indeed, not all known state 1(T) mutants show a decreased affinity to effector or GAP
proteins and/or a decreased GTPase activity (although being generally the case, there are
exceptions [51, 123]). As result, and based in the 31P NMR spectra of the GppNHp-bound
nucleotide (Figure 3.47), RasD33K is hereafter classified as a state 2(T) mutant. Additional
preliminary results from [1H-15N]-HSQC NMR (see section 3.4.9) support this conclusion:
just as the typical state 1(T) RasT35S shows additional cross-peaks (relative to wild type) that
are representative of state 1(T), also RasD33K shows additional cross-peaks that seem to be
representative of state 2(T) and that are not observable in RasT35S. A detailed investigation
of peak volumes between the three proteins (WT, T35S, D33K) is detrimental to understand
the exchange mechanisms between states 1(T) and 2(T). The analysis is being presently
conducted at our department. The importance of residue 33 in the modulation of the
dynamics of the equilibrium between the two states can also be further investigated in the
future by exploring the effect of replacement to other amino acids.

3. Results
171
3.4.7 31P HP NMR on HRas(1-166)D33K•Mg2+•GppNHp
RasD33K opens the possibility for investigating the equilibria starting from the point of view
of states 2(T) for the first time. In fact, to the best of the authors knowledge, this is the only
known mutant whose equilibria at ambient pressure almost does not contemplate the
contribution of state 1(T). Its conformational dynamics and unusual functionality constitutes
one of the most surprising findings among the body of work performed within this thesis.
A total of 21 steps were performed in the 31P HP NMR series of RasD33K, ranging from 0.1
up to 200 MPa. Figure 3.53 shows the 31P HP NMR series of 11 of these steps with intervals
of 20 MPa. The dependence of the chemical shifts as a function of pressure is shown
graphically in Figure 3.54 and numerically in Table 3.23.
The most obvious pressure-induced change is the repopulation of state 1(T) at the g-
phosphate given by the increase of its corresponding integrated area (red line Figure 3.53).
At the same time its resonance line shifts downfield by a Dd of 0.054 ppm, (between 80 and
200 MPa. Below 80 MPa this resonance could not be properly fitted due to its only residual
population). The downfield shift is accentuated upon correction (Dd= 0.156 ppm, from d= -
2.406 to d= -2.250, Figure 3.54, and Table J appendix section) because the g-phosphate of
free Mg2+•GppNHp moves in the opposite direction (i.e. upfield, Figure 3.26) than the g-
phosphate of the protein. The same behaviour is also observed for state 2(T). This signal
(represented by the orange coloured lines in Figure 3.54) shows a very large downfield shift
by a Dd= 0.47 ppm, from d= -3.40 ppm at 0.1 MPa to d= -2.93 MPa at 200 MPa.
The pressure dependence of the a-phosphate indicates that the re-population of state 1(T)
is not possible in this case. Between the first and the last pressure steps the signal broadens
slightly (ca. 8%) and moves downfield by Dd= 0.460 ppm (Dd= 0.480 ppm upon correction);
the signal seems to consist of at least two components at high pressures (180-220 MPa)
and has an ill-defined centre and a non-Lorentzian shape, with the components being too
close together to allow an independent fit. Regarding the b-phosphate, its pressure
dependency is similar to the one observed for RasWT and RasT35S, shifting upfield (Dd= -0.09
ppm) for the uncorrected shift values and downfield (Dd= 0.168 ppm) upon correction.
The fitting of a Taylor polynomial (eqn. nº15, experimental section 2.2.5.4) yielded again
small and mostly negative second order B2 coefficients which indicate a rather linear
pressure dependence of the bound nucleotide. Although some exceptions occur such as
the b-phosphate that shows a B2 value markedly higher than B1 (1.25 ppm GPa-2 vs -0.68
ppm GPa-1, Table 3.23). In most curves, the fitting of the DG and DV parameters was only
accomplished when fixing the initial and final chemical shift values, d1 and d2.

3. Results
172
Figure 3.53. Conformational equilibria of HRasD33K(1-166)•Mg2+•GppNHp as a function of pressure determined by 31P NMR at 278 K. The 4.45 mM protein dissolved in buffer F (40 mM Tris/HCl pH 7.5, 10 mM MgCl2, 2 mM DTE) with additionally 0.4 mM DSS and 20% D2O was subjected to increasing step-variations of pressure, up to a maximum of 200 MPa. Each spectrum was obtained by accumulation of 800 scans. The evolution of states 1(T) and 2(T) is represented by the red and green lines, respectively. The 31P resonances of the free nucleotide observed at higher pressures are also indicated. The last step corresponds to the reversibility test of the pressure-induced changes. The fitted chemical shift values for all the resonance lines are listed in Table J of the appendix section.

3. Results
173
Figure 3.54. Corrected pressure dependence of 31P chemical shifts of HRasD33K(1-166)•Mg2+•GppNHp recorded at 278 K. The Ddfreenuc fit values were applied as correction factors upon addition or subtraction to the dRas uncorrected values, depending on the direction of the observed shifts, leading to the final dcorrected values, represented here for each plot as orange lozenges (-¿-). The uncorrected shift values are also plotted as black circles (-●-). The second order polynomial fit of a Taylor expansion was applied for the determination of B1 and B2 and the values are presented on Table 3.23. The calculated chemical shift differences, Dd=d200MPa-d0.1MPa, are shown near each curve. In the case of the g1(T)-phosphate Dd=d200MPa-d80MPa. Note that the vertical scaling is different for each plot to allow a better visualisation of the details from the different curves.

3. Results
174
Within the limits of error the
values obtained for the a-, b-
and g2(T)-phosphates are very
similar, leading to a similar
pressure-dependent similar
type of transition for the three
phosphate groups. Their
averaged DG and DV values are
5.62 kJ mol-1 and 59.87 mL mol-
1, respectively for Ras
uncorrected, and 5.93 kJ mol-1
and 59.2 mL mol-1 for Ras
corrected. The application of
the correction does not change significantly the thermodynamics, contrary to the
observations for RasWT, where the correction seems to exert a greater influence (Table
3.23). In the case of the g1(T)-phosphate, considerably higher molar free energies and
volumes were obtained when compared with the other three phosphate groups, and again
within similar values between the corrected and uncorrected cases (DGcorrected= 14.3 ± 0.8
kJ mol-1 and DVcorrected= -105 mL mol-1), which is indicative that state 1(T) is most likely
related to a conformational modification that is different than the one sensed by the other
phosphates.
The fit of LnK12 as a function of pressure (Figure 3.55) leads to a DG12 of 3.40 kJ mol-1 and
DV12 of -16.72 mL mol-1, respectively. An identical volume variation was found in the case
of RasWT (DV= -18.63 mL mol-1, Figure 3.30), although the energy required for the
conformational transition to take place is two-fold higher in RasD33K. In practical terms the
mutant seems to be less pressure-responsive than the wild type (a higher energetic input
is necessary to shift the equilibria in the same pressure interval).
The conformational aspects that define the g-phosphate in RasD33K can be modulated by
pressure, and the initial population defined by a K12= 11.3 at 0.1 MPa can be brought back
to the original ratio observed for RasWT (K12= 1.7) around 150 MPa. One can envisage that
given enough pressure, the equilibria could be shifted even further. On the other hand, the
conformational aspects that define the a-phosphate are not as easily modulated and a
direct shift from state 2(T) towards state 1(T) is not possible in this case. Indeed, RasD33K
can be defined as being a state 2(T) mutant at the g-phosphate. There is no direct or obvious
indication from the present HP data that state 3(T) can be significantly populated.
Figure 3.55. Plot of LnK12 as a function of pressure in RasD33K•Mg2+•GppNHp (-¿-). The fit of the data gives a specific molar volume and Gibbs energy of DV= -16.72 ± 0.4 mL mol-1 and DG= 3.40 ± 0.01 kJ mol-1, respectively. The K12 values for each pressure point are shown in the table. The plot of RasWT (-●-). is also shown for comparison (DG= 1.53 kJ mol-1 and DV= -18.63 mL mol-1, see also Figure 3.30.
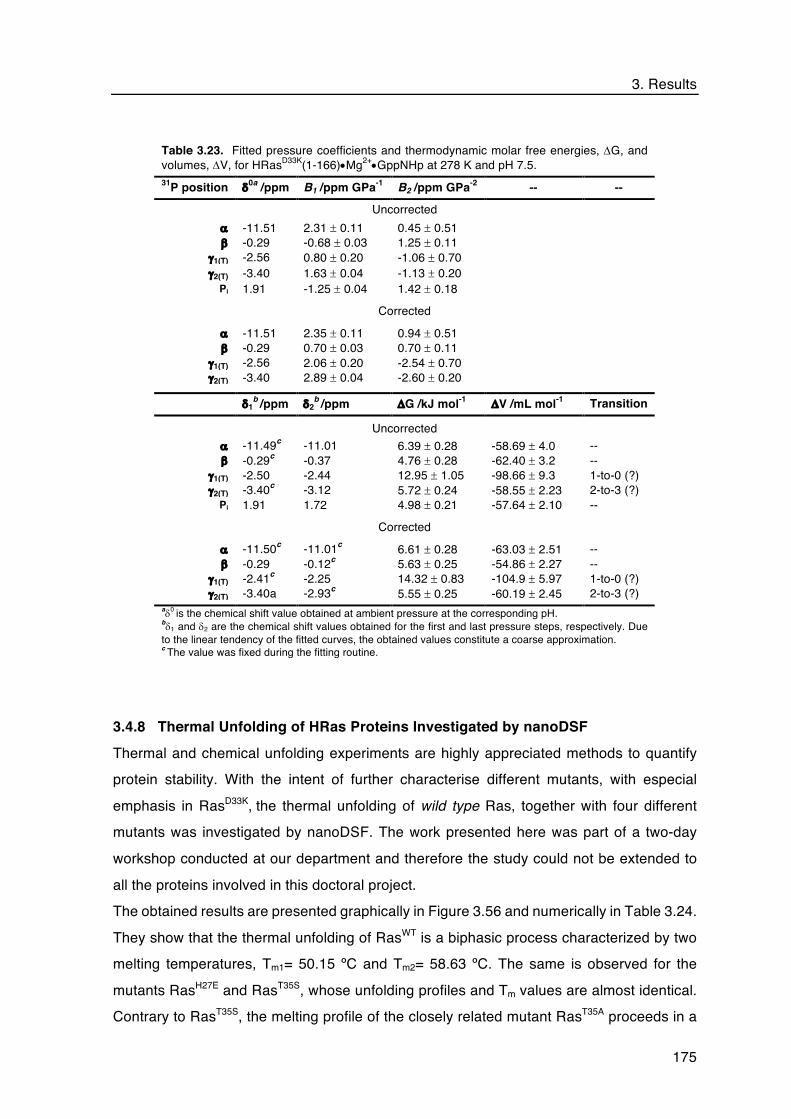
3. Results
175
3.4.8 Thermal Unfolding of HRas Proteins Investigated by nanoDSF
Thermal and chemical unfolding experiments are highly appreciated methods to quantify
protein stability. With the intent of further characterise different mutants, with especial
emphasis in RasD33K, the thermal unfolding of wild type Ras, together with four different
mutants was investigated by nanoDSF. The work presented here was part of a two-day
workshop conducted at our department and therefore the study could not be extended to
all the proteins involved in this doctoral project.
The obtained results are presented graphically in Figure 3.56 and numerically in Table 3.24.
They show that the thermal unfolding of RasWT is a biphasic process characterized by two
melting temperatures, Tm1= 50.15 ºC and Tm2= 58.63 ºC. The same is observed for the
mutants RasH27E and RasT35S, whose unfolding profiles and Tm values are almost identical.
Contrary to RasT35S, the melting profile of the closely related mutant RasT35A proceeds in a
Table 3.23. Fitted pressure coefficients and thermodynamic molar free energies, DG, and volumes, DV, for HRasD33K(1-166)•Mg2+•GppNHp at 278 K and pH 7.5. 31P position d0a /ppm B1 /ppm GPa-1 B2 /ppm GPa-2 -- -- Uncorrected a -11.51 2.31 ± 0.11 0.45 ± 0.51
b -0.29 -0.68 ± 0.03 1.25 ± 0.11 g1(T) -2.56 0.80 ± 0.20 -1.06 ± 0.70 g2(T) -3.40 1.63 ± 0.04 -1.13 ± 0.20
Pi 1.91 -1.25 ± 0.04 1.42 ± 0.18 Corrected a -11.51 2.35 ± 0.11 0.94 ± 0.51
b -0.29 0.70 ± 0.03 0.70 ± 0.11 g1(T) -2.56 2.06 ± 0.20 -2.54 ± 0.70 g2(T) -3.40 2.89 ± 0.04 -2.60 ± 0.20
d1
b /ppm d2
b /ppm DG /kJ mol-1 DV /mL mol-1 Transition
Uncorrected a -11.49c -11.01 6.39 ± 0.28 -58.69 ± 4.0 -- b -0.29c -0.37 4.76 ± 0.28 -62.40 ± 3.2 --
g1(T) -2.50 -2.44 12.95 ± 1.05 -98.66 ± 9.3 1-to-0 (?) g2(T) -3.40c -3.12 5.72 ± 0.24 -58.55 ± 2.23 2-to-3 (?)
Pi 1.91 1.72 4.98 ± 0.21 -57.64 ± 2.10 -- Corrected a -11.50c -11.01c 6.61 ± 0.28 -63.03 ± 2.51 --
b -0.29 -0.12c 5.63 ± 0.25 -54.86 ± 2.27 -- g1(T) -2.41c -2.25 14.32 ± 0.83 -104.9 ± 5.97 1-to-0 (?) g2(T) -3.40a -2.93c 5.55 ± 0.25 -60.19 ± 2.45 2-to-3 (?)
ad0 is the chemical shift value obtained at ambient pressure at the corresponding pH. bd1 and d2 are the chemical shift values obtained for the first and last pressure steps, respectively. Due to the linear tendency of the fitted curves, the obtained values constitute a coarse approximation. c The value was fixed during the fitting routine.

3. Results
176
single step with only one Tm of 59.11 ºC, numerically close to the Tm2 of the three proteins
above mentioned. Biochemically, RasT35A exists predominantly in state 1(T), just like
RasT35S. However, contrary to RasT35S that can still adopt a state 2(T) conformation in the
presence of effectors, RasT35A remains locked in state 1(T) [156]. These structural
differences might account for the strikingly different unfolding profiles. The case of RasD33K
is also interesting since only one Tm was observed for a mutant that exists predominantly in
the conformational state 2(T) (Tm2= 61.84 ºC, being 3.2 ºC higher than Tm2 of RasWT).
It is worth mentioning the robustness of nanoDSF as a technique: despite Ras having no
Trp amino acids in its sequence (there are only seven Tyr residues at positions 4, 32, 64,
71, 96, 137, 141), the melting profile of the protein could be measured within seconds, with
a good intensity fluorescent signal and with high degree of accuracy (StdDev ≤ 0.11, Table
3.24).
Table 3.24. Melting temperatures experimentally obtained for HRas(1-166)•Mg2+•GppNHp by nanoDSF.
Protein Tm1 /ºC StdDev (n=3) Tm2 /ºC StdDev (n=3) WT 50.15 0.07 58.63 0.11
H27E 50.23 0.06 59.25 0.13 T35S 49.61 0.07 57.19 0.03 T35A -- -- 58.11 0.04 D33K -- -- 61.84 0.03
Figure 3.56. nanoDSF performed for the wild type Ras•Mg2+•GppNHp protein and three selected mutants: D33K, T35A and T35S. All the proteins were dissolved in buffer F (40 mM Tris/HCl pH 7.5, 10 mM MgCl2 and 2 mM DTE) in concentrations ranging between 1.0 and 1.3 mM and measured directly. The melting scan is shown in the upper panel as a fluorescence ratio plotted over the recorded temperature interval (20-95 ºC). The vertical lines are placed at the transition point of each curve and correspond to their peak maxima. In the lower panel the first derivatives of the fluorescence traces are shown for each protein. This represents a more convenient way to directly discriminate between the obtained Tm values for the different proteins.

3. Results
177
3.4.9 [1H-15N]-HSQC Spectra of HRasWT and HRasD33K Bound to Mg2+•GppNHp
The differences in the conformational equilibrium detected at the a- and g-phosphates
between the 31P NMR spectra of RasWT and RasD33K prompted a more detailed investigation
of both proteins using high resolution 2D NMR techniques.
The [1H-15N]-HSQC spectrum of RasWT bound to GppNHp was previously published and
assigned at 303 K by Ito and co-workers [94]. From this and subsequent studies [171, 257]
it was found that 22 non-proline residues give no detectable 1H-15N cross-peaks (10-13, 21,
31-39, 57-64 and 71), contrary to the GDP-bound form, where all the residues can be
assigned. These peaks belonging to the P-loop and both switch regions, become
broadened beyond detection due to intermediate chemical exchange processes correlated
with the existence of the conformational states 1(T) and 2(T) [122]. In contrast, the state
1(T) mutant RasT35S•Mg2+•GppNHp is able to eradicate the exchange since state 2(T) is not
present at ambient pressure. Its HSQC spectrum is therefore a fingerprint for state 1(T)
(pdb: 2lcf) [95]. Likewise, RasD33K being the only known state 2(T) could be used to better
understand the dynamics of this state.
Based on these premises, the first concern was to obtain a correct and detailed assignment
of the 1H-15N cross-peaks for both proteins. This was accomplished by performing a HSQC
temperature series from 278 to 303 K. The overall spectra are shown in Figure 3.57. The
published assignment at 303 K [94] was automatically transferred to the RasWT spectra at
the same temperature and adjusted for the slight differences in pH and buffer. The
assignment at 278 K (shown in Figure 3.57) was obtained by following the temperature
dependence of the chemical shifts. The assignment for RasD33K was done based in the one
of RasWT.
It is important to note that the peak intensities and volumes of each protein are not directly
comparable. The series on RasWT was recorded using the sofast methodology based on
the Ernst angle [258], which allows for fast acquisition. The series on RasD33K were recorded
using a standard Bruker HSQC pulse sequence.
A preliminary analysis of the series shows a temperature-dependence for most cross peaks,
although some of them remain mostly unperturbed (G138, A146 in RasWT and G138, G15
in RasD33K). Several peaks are only visible at high temperatures (E99, Q153, H94) most
likely because they are in slow exchange at low temperatures, remaining undetectable. It is
worth mention that a few residues show double assignments in the spectra due to distinct
conformational reorientation of their side chains (A11*, D47* in RasD33K). With the
assignment obtained herein, the accurate comparison of the different peak intensities,
volumes and chemical shifts between the two proteins is now presently being investigated

3. Results
178

3. Results
179
at our department. The help of
Dr. Markus Bech Erlach and
Sebastian on the processing of
the spectra presented here is
gratefully acknowledged.
Figure 3.57. [1H-15N]-HSQC NMR
spectra of HRas(1-
166)•Mg2+•GppNHp proteins.
Left page: a temperature series was
recorded between 278 and 303 K for
the wild type protein (on the top) and
the D33K mutant (on the bottom). Both
proteins ranging between 1.0 and 1.3
mM were dissolved in buffer F (40 mM
Tris/HCl pH 7.5, 10 mM MgCl2, 2 mM
DTE) with additionally 10% D2O and
0.1 mM DSS. Five HSQC spectra were
recorded for each protein in a
spectrometer operating at a proton
frequency of 800 MHz. Both proteins
were extensively dialyzed against the
same buffer before acquisition. The
assignment for RasWT at 303 K was
directly transferred from the one
published by Ito et al [94] and manually
adjusted to the present conditions (pH,
type of buffer). The assignment shown
herein refers to 278 K and was
obtained by analysing the
temperature-dependent chemical shift
changes of each peak. Note that the
peak volumes or intensities between
both proteins are not directly
comparable: in the case of RasWT a
sofast HMQC pulse sequence was
used while RasD33K was measured using a standard HSQC method.
Right page: detail of the central region where several cross-peaks overlap. Some of these residues show a
marked difference in terms of peak volumes between the HP series of RasWT and RasD33K (currently under
analysis at our department), portending their involvement in conformational transitions that are specific for each
protein.

3. Results
180
3.4.10 31P NMR investigations of HRas(1-166)G12P and HRas(1-166)T35S/G12V
The reasons underlying the investigations on these two last mutants are not directly related
with the mutational analysis of Ras derived from the HP investigations, described in the
above sections. In fact, both mutants are already known by the scientific community and
have been characterised over the past years. Particularly, the crystal structure of RasG12P
was obtained under collaborative work pioneered by our department already in 1993 [259].
Both mutants are revisited within the framework of this thesis because their interesting
properties: RasG12P was found to be the only mutant from G12 with non-transforming
properties and RasG12V/T35S was found to be a partial gain-of-function mutant, capable of
activating some signal transduction pathways by interacting with specific effectors such as
Raf-RBD but not with others, such as Ral-GDF.
Contrary to the mutational studies presented in section 3.4.2, the two mutants were not
created de novo at our department, instead, the vectors containing the sequences were
kindly provided by the research group of Prof. Dr. Alfred Wittinghofer from Max-Planck
Institute for Molecular Physiology, Dortmund. Their conformational equilibria was never
investigated in terms of 31P NMR spectroscopy rendering them an interesting case of study,
especially RasG12V/T35S, which has a contribution of two opposing mutants (G12V, a gain-of-
function and T35S, a partial loss-of-function).
3.4.10.1 31P NMR GppNHp and GTP Spectra. Raf Interaction and GTPase Activity
The spectral features of RasG12P•Mg2+•GppNHp are very distinct from the wild type protein
as one can infer from Figure 3.58A: with exception of a2(T)-phosphate that remains
unaltered, all other resonances become upfield shifted by an average of d= -0.17 ppm, the
highest deviation being observed for the g2(T)-phosphate with a Dd= -0.35 ppm. A
concomitant overall line broadening is also observed, especially in the case of state 2(T),
(Table 3.25). The 31P NMR spectra of RasG12V was also investigated for comparison (the
mutation was created de novo by SDM. Note that this corresponds to the truncated variant
(aa 1-166). Again, pronounced shift differences are observed between the two proteins:
with exception of the g2(T)-phosphate, all the resonances in RasG12V become downfield
shifted by an average of Dd= 0.22 ppm compared with RasG12P. In this respect, the biggest
change is observed for the b-phosphate, with a Dd= 0.43 ppm. On the other hand, the g2(T)-
phosphate shifts upfield by a Dd of -0.41 ppm. Together, these differences constitute one of
the largest spectral modifications observed so far between two any point mutants and wild
type variant in the 31P NMR spectra of Ras proteins. Replacing Gly12 by a Pro leads to a
modification of the equilibrium constant, K12, from 1.70 to 1.16, respectively. Substitution to

3. Results
181
Val leads to a further decrease to K12= 0.84, as the population ratio is inverted and state
1(T) surpasses the population of state 2(T) (Table 3.25).
The 31P NMR spectra of the respective GTP-bound proteins is shown in Figure 3.58B. State
1(T) at the g-phosphate of RasG12P cannot be unequivocally identified, although it seems to
appear as a very broad shoulder very close to state 2(T) and slightly upfield shifted when
compared with RasWT (Dd= -0.05 ppm, from d= -2.57 to d= -2.62 ppm). However, the most
striking differences between RasG12P and RasWT are in terms of chemical shifts of the b- and
g2(T)-phosphate groups, the former being upfield shifted and the latter being downfield
shifted by Dd= -0.13 (from d= -0.25 ppm to d= -0.38 ppm) and a Dd= 0.12 ppm (from d= -
7.98 ppm to d= -7.86 ppm), respectively, Table 3.25. The GTP spectrum of RasG12V has
also distinct features from those of RasG12P: a general line broadening is again observed for
all resonance lines of the oncogenic mutant and all its three phosphate signals, a-, b- and
g2(T) become downfield shifted by a Dd= 0.13, 0.3 and 0.28 ppm, respectively, when
compared to RasG12P. This difference is particularly remarkable for the g2(T)-phosphate,
assigned at d= -7.58 ppm in RasG12V and d= -7.86 ppm in RasG12P. In addition, both g2(T)-
phosphates are downfield shifted when compared with RasWT (d= -7.98 ppm). It is also worth
mention that the yield of the nucleotide exchange reaction (calculated from the ratio of the
areas between GTP-bound and GDP-bound Ras choosing either the a- or b-phosphates)
is much higher in the case of RasG12V (ca. 92%) than in the case of RasG12P (ca. 65%), which
asserts for the different nature of these mutants. It is indeed common for oncogenic variants
such as G12V, G12D or G13R to undergo an almost complete (over 90%) exchange to
GTP, contrary to non-oncogenic ones, whose degree of exchange is normally much lower
(70-75%). This observation precludes the assessment that RasG12P, contrary to the other,
has characteristics of a non-transforming mutation.
To better characterise RasG12V/T35S, the point-mutant RasT35S was also investigated
separately. As it can be directly observed from Figure 3.58A, the GppNHp spectrum of the
double mutant resembles directly the one of RasT35S for whom state 2(T) is completely
abolished, in contrast to RasG12V, where the equilibria between states is still maintained
(K12= 0.84). Rather surprisingly, the chemical shift values of the double mutant are
numerically closer to the ones of RasG12V than RasT35S. For example, the b-phosphate in
RasG12V/T35S lies at d= 0.08 ppm. The same resonance is observed in RasG12V at d= 0.05
ppm and in RasT35S at d= -0.33 ppm. This corresponds to a Dd of 0.05 ppm in the first case
and -0.25 ppm in the second case. Based on the fitted values of Table 3.25 similar
considerations can be done for the a- and g-phosphates (both are closer to RasG12V than
RasT35S.

3. Results
182
Figure 3.58. Conformational dynamics of RasG12P, RasG12V, RasT35S and RasG12V/T35S investigated by 31P NMR spectroscopy at 278 K. The proteins were dissolved in buffer F (40 mM Tris/HCl pH 7.5, 10 mM MgCl2, 2 mM DTE) with additionally 0.2 mM DSS and 10% D2O, at a final concentration ranging between 0.92 and 1.63 mM. The measurements were done for A. Ras•Mg2+•GppNHp and B. Ras•Mg2+•GTP. All the spectra except RasG12P were obtained in a magnetic field operating at a 31P resonance of 242.896 MHz (600 MHz spectrometer). RasG21P was measured at a 31P frequency of 202.456 MHz (500 MHz spectrometer). An EM function with LB= 10 Hz was used during the processing of the FID’s. aGDP and bGDP represent the chemical shift of a- and b-phosphate groups of GDP-bound Ras, respectively.

3. Results
183
For example, the g1(T)-phosphate is located at d= -2.56 ppm in the serine mutant, d= -2.38
ppm in the oncogenic mutant and d= -2.40 ppm in G12V/T35S). The averaged linewidths in
RasG12V/T35S are numerically more similar to RasT35S due to the lack of exchange broadening
processes between states 1(T) and 2(T) in these two mutants, contrary to RasG12V (Table
3.25).
Similar results can be found when comparing the GTP-bound spectra (Figure 3.58B):
RasG12V/T35S is state 1(T)-driven, just like RasT35S and in opposition to RasG12V, which exists
predominantly in state 2(T). The respective equilibrium constants are 0.05, 0.13 and 9.38
(Table 3.23). Again, the chemical shift values for the double mutant are closer to the ones
of RasG12V than RasT35S. For example, the g1(T)-phosphate lies at d= -6.10 ppm in both,
G12V/T35S and in G12V and at d= -6.57 ppm in T35S. An interesting feature can be
observed in the spectrum of RasT35S located at d= -11.47 ppm as a shoulder on the a-
phosphate. The 31P NMR spectra of each protein in complex with Mg2+•GDP is shown in
Figure D of the appendix section. Typical chemical shift differences between a- and b-
phosphates of different proteins are observed and are in line with the above results for the
GppNHp and GTP-bound spectra.
Although biochemical properties of different Ras mutants can be presumed at some extent
from the spectral characteristics, general or unanimous correlations cannot be made since
conformation is not necessarily linked to a particular function (as seen in the previous case
of RasD33K, a state 2(T) mutant with impaired Raf affinity). In detriment of this idea, RasG12P
and RasG12V/T35S were investigated in terms of their affinity to Raf-RBD by ITC and in terms
of their ability to hydrolyse their natural ligand, GTP, by HPLC.
The obtained results show that RasG12P has a slightly higher rate of hydrolysis relative to
RasWT (kcat= 0.035 min-1 vs 0.026 min-1, respectively, Figure 3.59 and Table 3.26). Two
somewhat higher values (kcat= 0.043 and 0.055 min-1) were previously reported in the
literature [260, 261], although both values are in agreement within the limits of the error for
the present measurement. Addition of effector Raf-RBD does not change significantly the
obtained values (kcat= 0.039 min-1, τ= 17.78 min., data not shown). The intrinsic GTPase
activity of RasG12P remains unchanged compared with the wild type protein and contrary to
a typical oncogenic variant where the same reaction is severely impaired. The three
dimensional structure of RasG12P was found to be very similar to that of wild type (pdb entry:
1ago [259]), especially in the vicinity of the catalytic residue Gln61, which accounts for a
possible explanation of their similar rate constants. The thermodynamics of binding to Raf
shows that the association proceeds as usual with a greater entropic contribution (-TDS= -
21.2 kJ mol-1, DH= -14.4 ± 0.56 kJ mol-1, Table 3.26). The free energies of binding for RasWT

3. Results
184
and RasG12P re respectively DG= -36.4 and DG= -35.6 kJ mol-1 and the corresponding
dissociation constants are 0.42 ± 0.12 and 0.59 ± 0.12 µM (Table 3.26).
Table 3.25. 31P NMR chemical shift values and linewidths obtained for the different mutants of HRas(1-166).
Protein
a-phosphate b-phosphate g-phosphate K12
b d1(T) [ppm]
d2(T) [ppm]
d1(T),2(T)a
[ppm] d1(T) [ppm]
d2(T) [ppm]
Mg2+•GDP WT -10.50 -1.97 -- --
G12P -10.55 -1.95 -- -- G12V -10.61 -1.97 -- --
G12V/T35S -10.40 -1.82 -- -- T35S -10.53 -2.01 -- --
Mg2+•GppNHp WT -11.17 -11.68 -0.25 -2.57 -3.33 1.70
G12P -11.31 -11.69 -0.38 -2.62 -3.68 1.16 G12V -11.22 -11.57 0.05 -2.38 -4.09 0.84
G12V/T35S -11.19 -- 0.08 -2.40 -- -- T35S -10.97 -- -0.33 -2.56 -- --
Mg2+•GTP WT -11.68 -14.87 -6.63 -7.98 11.3
G12P -11.66 -15.00 -- -7.86 -- G12V -11.43 -14.70 -6.10 -7.58 9.38
G12V/T35S -11.33 -15.00 -6.10 -7.48 0.05 T35S -11.11 -15.14 -6.57 -8.0 0.13
a-phosphate b-phosphate g-phosphate Dn1/2 1(T)
[Hz] Dn1/2 2(T)
[Hz] Dn1/2 1(T)/2(T)
a
[Hz] Dn1/2 1(T)
[Hz] Dn1/2 2(T)
[Hz] Mg2+•GDP WT 46.89 30.02 --
G12P 47.21 35.13 -- G12V 58.08 32.73 --
G12V/T35S 89.62 40.84 -- T35S 69.52 43.70 --
Mg2+•GppNHp WT 105.39 75.15 45.84 74.47 55.07
G12P 71.44 88.43 35.66 62.54 91.96 G12V 122.2 98.84 75.66 91.70 143.3
G12V/T35S 81.94 -- 56.68 51.84 -- T35S 66.72 -- 53.55 40.94 --
Mg2+•GTP WT 54.74 45.66 20.33 35.44
G12P 58.04 38.70 -- 46.32 G12V 76.52 62.31 34.79 46.81
G12V/T35S 78.83 62.02 65.00 58.01 T35S 50.41 60.66 59.54 67.68 All the values are fitted from the experimental spectra recorded at 278 K and
pH 7.5. The maximum estimated errors are ± 0.02 ppm in chemical shift values and ± 0.15 Hz in linewidths for the g-phosphate. An EM function with LB= 10 Hz was used for processing the FID. a States 1(T) and 2(T) of the b-phosphate in cannot be separated at the magnetic field used and were therefore fitted as a single Lorentzian line. b The equilibrium constant, K12, was calculated using the population distribution on the g-phosphate. The associated error is ± 0.2.

3. Results
185
From the obtained values it can be
hypothesised that the Pro12
mutation does not greatly affect the
structural configuration of the
effector loop region (aa 32-40)
involved in the binding of Raf-RBD
since the binding proceeds with the
same energetics and affinity as the
one observed for RasWT.
The GTPase activity of the double
mutant is extremely slow, proceeding
with a kcat= 0.003 min-1 and a
surprising slow half-life of 208.5 min.
(ca. 3 hours). For a better
characterisation, the same
measurements were conducted in the single mutants RasG12V and RasT35S (Table 3.26). By
comparison it becomes evident that RasG12V/T35S follows closely the properties of the
oncogenic variant (kcat= 0.005 min-1, τ=136.1 min.), with RasT35S having a more than 2-fold
faster hydrolysis rate (kcat= 0.011 min-1, τ= 61.64 min.). kcat and k12 values have been
reported elsewhere in the literature for full length (1-188/189) RasG12V and RasT35S and are
comparable to the ones presently obtained for the truncated (1-166) forms [67, 262].
The affinity of RasG12VT35S towards Raf-RBD is more than 15 times lower than RasWT (kD=
13.52 ± 2.7 µM vs 0.42 ± 0.1 µM) and more than 2 times lower than RasT35S (KD= 6.45 ± 1.2
µM, Table 3.26). Both point-mutants separately have a lower affinity than the wild type
protein. However, their combination into the double mutant seems to have a synergistic
effect that leads to a further decreased affinity for the effector. The enthalpy variation, DH,
is -4.38 ± 0.2 kJ mol-1, a value three times lower than the one obtained for RasT35S and
RasG12V separately. The binding proceeds with a similar free energy variation for all proteins,
possibly due to an entropic compensation (the reader is advised for the fact that only DH is
explicitly calculated form the experimental data, therefore, the global DG values might not
reflect the energetic reality of the binding process; experimental section 2.2.4).
Figure 3.59. Determination of the intrinsic GTPase activity of RasG12P, RasG12V
, RasG12V/T35S and RasT35S by HPLC at 310 K. Upon integration of the fluorescence signal, the percentage of Ras-GTP was plotted against time and the data fitted with a first order exponential decaying function. The fitted rate constants and half-life times are shown in Table 3.26 (see Figure 3.43 for details on the description of the method).

3. Results
186
3.4.10.2 Interaction Between HRasG12P•Mg2+•GppNHp and Raf-RBD
As already revealed by ITC, the thermodynamics of binding between RasG12P and Raf-RBD
was found to be very similar to the wild type protein. The same interaction was investigated
by 31P NMR. As usual, addition of increasing amounts of effector leads to the modification
of the initial equilibria by promoting a conformational transition of the initial population
defined by the state 1(T) (red coloured lines) into state 2(T) (green coloured lines) and
subsequent formation of the Ras-Raf complex indicated by the typical upfield shift of state
2(T) that culminates with the formation of state 2*(T) at the g-phosphate (Figure 3.60). The
concomitant shift change is from d= -3.68 ppm (1:0 ratio) up to d= -3.90 ppm (Dd= -0.22
ppm, Table 3.27). The same spectral features and evolution of chemical shifts were found
during the titration of KRasWT and HRasH27E, (Figures 3.1 and 3.49) but not HRasD33K (Figure
3.50), whose association with the effector is lower than wild type. The b-phosphate was
fitted with a single Lorentzian line across the titration series although it would be probably
best characterised by a two-line fitting, as previously performed for RasH27E (Figure 3.49,
Table 3.19).
The linewidth of the b-phosphate increases from n1/2= 36.51 Hz to n1/2= 81.68 Hz at a protein
ratio of 1:1. This corresponds to a to a 2.25-fold increase, which is somewhat larger than
expected, according to the molecular mass of the protein-protein complex (from 1:0 to 1:1
ratio the increase of the molecular mass should be only 1.52-fold). Therefore, the b-
phosphate is further broadened by exchange processes which makes it difficult to
distinguish between the free and the bound Ras protein.
Table 3.26. Thermodynamics of interaction between HRas•Mg2+•GppNHp and Raf-RBD measured by ITC and intrinsic GTPase activities measured by HPLC for HRas•Mg2+•GTP.
Protein T K
[Ras] mM
[Raf] mM
DG kJ mol-1
DH kJ mol-1]
-TDS kJ mol-1
KD µM
T K
kcat min-1
τ min.
HRasWT 298 60 778 -36.4 -8.10 ± 0.23 -28.3 0.424 ± 0.12 310 0.026 26.85 HRasG12P 298 31 312 -35.6 -14.4 ± 0.56 -21.2 0.591 ± 0.12 310 0.035 20.01
HRasG12V/T35S 298 107 1730 -27.8 -4.38 ± 0.24 -23.4 13.52 ± 2.69 310 0.003 208.5 HRasT35S 298 51 850 -29.7 -13.3 ± 0.66 -16.3 6.45 ± 1.20 310 0.011 61.64
HRasG12V 298 85 836 -35.3 -13.5 ± 0.41 -21.9 0.66 ± 0.15 310 0.005 136.1 kcat represents the hydrolysis rate constant and is calculated as 1/t. τ represents the half-life for the GTP
hydrolysis (τ=t*ln2). ITC experiments were done according to the experimental section 2.2.4. The experimentally obtained thermograms and signature plots are shown in Figure F of the appendix section. The N parameter (binding sites) was allowed to vary during the fitting procedure. The greatest deviation from a 1:1 ratio was obtained for RasG12V/T35S with N= 1 ± 0.14. The error on all the other measurements was always smaller than ± 0.2.

3. Results
187
Table 3.27. 31P NMR chemical shift values and linewidths for the protein-protein complex HRasG12P(1-166)•Mg2+•GppNHp•Raf-RBD.
Protein Complex
ratio
a-phosphate b-phosphatea g-phosphate d1(T) [ppm]
d2(T) [ppm]
d1(T)/2(T) [ppm]
d1(T) [ppm]
d2(T) [ppm]
RasG12P -- -11.31 -11.69 -0.37 -2.62 -3.68 + Raf-RBD 1:0.5 -11.45 -11.77 -0.43 -2.64 -3.90 1:1 -11.55 -11.77 -0.47 -- -3.90 1:1.5 -- -11.77 -0.47 -- -3.90 a-phosphate b-phosphatea g-phosphate Dn1/2 1(T)
[Hz] Dn1/2 2(T)
[Hz] Dn1/21(T),2(T)
[Hz] Dn1/2 1(T)
[Hz] Dn1/2 2(T)
[Hz] RasG12P -- 80.46 73.60 36.51 67.12 81.58 + Raf-RBD 1:0.5 141.0 70.97 68.19 96.70 76.54 1:1 96.35 77.04 81.68 -- 52.13 1:1.5 -- 87.45 88.24 -- 53.51 All the values are fitted from the experimental spectra recorded at 278 K, pH 7.5. The maximum estimated errors from the fitting procedure are ± 0.02 ppm in chemical shift values and ± 0.16 Hz in linewidths for the g-phosphate. An EM function with LB=15 Hz was used in the processing of the FID and subtracted from the final linewidths.
Figure 3.60. 31P NMR spectroscopy on the titration of HRasG12P•Mg2+•GppNHp with the effector Raf-RBD measured at 278 K. To an initial 0.74 mM solution of RasG12P dissolved in buffer F (40 mM Tris/HCl pH 7.5, 10 mM MgCl2, 2 mM DTE) with additionally 0.2 mM DSS, 150 mM NaCl and 5% D2O, increasing amounts of Raf-RBD were added. The molar ratio is indicated for each titration step. The final concentrations of Ras and Raf (1:1.5 ratio) are 0.58 mM and 0.92 mM, respectively. All 31P resonances were recorded at a frequency of 202.456 MHz (500 MHz spectrometer). An EM function with LB= 15 Hz was applied during the processing of the FID.

3. Results
188
3.4.10.3 Interaction Between HRasG12P•Mg2+•GppNHp and NF1
The lack of oncogenicity of RasG12P is likely related to its normal GTPase activity. Kinetic
parameters reported in literature are very similar to RasWT in terms of kon, koff nucleotide rate
constants and effector and GAP association affinities [259]. The interaction of this mutant
with NF1 was investigated here by 31P NMR. Due to the larger chemical shift separation
between states 1(T) and 2(T) at the g-phosphate in RasG12P compared to RasWT (the
distance between both states, Dd= d2(T)-d1(T), is 2.52 ppm and 1.63 ppm, respectively, Figure
3.61 and Table 3.28), the characterization of state 3(T) by deconvolution of the partially
superimposed 31P NMR lines was easier to perform.
As expected, the overall titration series shown in Figure 3.61 is very similar to the one
obtained for the wild type protein: the new resonance line of state 3(T) appears as soon as
NF1 is added to the NMR tube and its integrated area increases as the Ras:NF1 ratio
increases. Its chemical shift position is independent of the concentration of NF1 and is
slightly upfield shifted (Dd= 0.22 ppm) when compared to the same state 3(T) in the titration
series of RasWT (d3(T) /G12P= -3.22 ppm vs d3(T) /WT= -3.00 ppm, section 3.4.1.2, Figure 3.39),
possibly due to the intrinsically different chemical environment of the g-phosphate prompted
by the presence of the P12 mutation. Between RasG12P free and the last titration step at 1:1
ratio, the increase of linewidth is only of 1.7-fold as measured at the g-phosphate (from a
Dn1/2= 92.32 to 117.8 Hz), which is only half of the expected increase in linewidth since the
molecular mass of the protein complex is 3-fold higher than Ras alone. Since the dynamics
of the g-phosphate in RasG12P is different than RasWT (different K12 and Dn1/2 values), it is
likely that state 3(T) in the RasG12P•NF1 is exchange broadened by states 1(T) and 2(T). It
is also observed that the chemical shift value of these states remains unperturbed over the
course of the titration (d1(T)≈ -2.62 ppm and d2(T)≈ -3.72 ppm, Table 3.28), indicating that the
interaction still follows a slow exchange mechanism in the NMR time scale.
The same dynamic features are observed in the case of the a-phosphate, although the
deconvolution of the third state is more difficult due to the closer proximity of the NMR lines.
Again, states 1(T) and 2(T) do not seem to shift significantly during the titration (Table 3.28,
note that the error in the chemical shift determination of sates 1(T) and 2(T) for the a-
phosphate is much larger than the one obtained for the g-phosphate, ±0.08 ppm vs ±0.01
ppm, respectively). The chemical shift position of state 3(T) could only be unequivocally
determined at the molar ratio of 1:1 and was found to be d= -11.15 ppm. A similar value of
d= -11.12 ppm was found in the titration of RasWT (Table 3.12). The binding of Ras to NF1
originates a severe perturbation in the chemical environment of the b-phosphate: as the

3. Results
189
main line (corresponding to [Ras]free) decreases, a new very broad line appears at the left
side, whose area increases as the concentration of NF1 increases (Figure 3.61). This new
line could be ascribed to the Ras-NF1 ([RNF1]) complex, although additional contributions
might be lying underneath its broad shape.
At a protein ratio of 1:1 almost completely saturation is achieved (Figure 3.61). This is
marked by three single broad peaks at the a- , b- and g-phosphates, respectively, and by
the disappearance of the former states 1(T) and 2(T). The very broad nature of the b-
Figure 3.61. Protein complex formation between RasG12P•Mg2+•GppNHp and NF1 followed by 31P NMR spectroscopy at 278 K. To an initial 0.82 mM of Ras dissolved in buffer F (40 mM Tris/HCl pH 7.5; 10 mM MgCl2; 2 mM DTE) with additionally 150 mM NaCl, 0.2 mM DSS in 10% D2O, increasing amounts of the GAP protein NF1 (from a 0.71 mM stock solution) were added (the corresponding molar ratios for each step are presented). The concentrations of Ras and NF1 in the final step (1:1 ratio) are 0.30 mM and 0.29 mM, respectively. An EM filter with LB=15 Hz was applied to the processed FID. The number of scans was increased over the course of the titration, from 3000 in the first step, to 11000 in the last step. The resonance lines corresponding to the a-, b- and g-phosphates are indicated as well as the states 1(T) and 2(T), represented by the red and green coloured lines, respectively. The new spectral features observed from the addition of NF1 to Ras are coloured in blue. As an example, the deconvolution into separated Lorentzian lines is shown for two different titration steps (1:0.25 and 1:0.5) on the g-phosphate.

3. Results
190
phosphate (Dn1/2= 196.7 Hz) indicates that at least two different conformations with distinct
chemical environments in its vicinity might be present when the Ras-NF1 complex is
formed, as already observed in the case of the RasWT-NF1 complex.
3.4.10.4 Interaction Between HRasG12V/T35S•Mg2+•GppNHp and Raf-RBD
The interaction between RasG12V/T35S and Raf-RBD was already surveyed by ITC within the
framework of this thesis. The obtained KD value of 13.52 µM (Table 3.26) led to the
conclusion that this mutant binds the effector with much lower affinity than the wild type
protein. Due to its interesting nature, a 31P NMR titration using the same effector was
envisaged. The spectral series are shown in Figure 3.62 and can be interpreted as follows:
as Raf is added to Ras, the population of the initially predominant state 1(T) is converted
into the effector recognizing state 2(T). The process can be identified by the decrease of
the integrated area of state 1(T) and concomitant increase in the area of the new state 2(T),
both being directly dependent of the concentration of Raf added at each step. An upfield
shift of state 1(T) is observed from, d= -2.37 ppm to ca. d= -2.60 ppm (Dd= -0.23 ppm, note
that in the final titration steps, its centre is not well defined due to its broad nature and the
chemical shift values listed in Table 3.29 are just an approximation). A shift in the same
Table 3.28. 31P NMR chemical shift values and linewidths for the protein-protein complex HRasG12P(1-166)•Mg2+•GppNHp•NF1.
Protein complex
Ras:NF1 ratio
a-phosphate b-phosphate g-phosphate d1(T) [ppm]
d3(T) [ppm]
d2(T) [ppm]
da [ppm]
d3(T) [ppm]
d1(T) [ppm]
d3(T) [ppm]
d2(T) [ppm]
HRasG12P -- -11.32 -- -11.73 -0.37 -- -2.60 -- -3.70 +NF1 1:0.25 -11.31 --b -11.73 -0.39 0.31 -2.62 -3.24 -3.73
1:0.5 -11.25 --b -11.71 -0.39 0.31 -2.64 -3.24 -3.72 1:1 -- -11.15 -- -0.40 0.31 -- -3.22 a-phosphate b-phosphate g-phosphate Dn1/2,1(T)
[Hz] Dn1/2,3(T)
[Hz] Dn1/2 2(T)
[Hz] Dn1/2
a
[Hz] Dn1/2,3(T)
[Hz] Dn1/2 1(T)
[Hz] Dn1/2,3(T)
[Hz] Dn1/2,2(T)
[Hz] HRasG12P -- 76.80 -- 115.0 50.20 -- 76.22 -- 92.32
+NF1 1:0.25 101.3 --b 164.4 61.32 87.47 61.80 133.4 110.7 1:0.5 79.11 --b 183.1 65.64 186.1 74.81 109.8 131.0 1:1 -- 204.5 -- -- 196.7 -- 117.8 -- All the values are fitted from the experimental spectra recorded at 278 K, pH 7.5. The maximum
estimated errors from the fitting procedure are ± 0.02 ppm in chemical shift values and ± 0.11 Hz in linewidths for the g-phosphate. 31P data were recorded at a frequency of 242.896 MHz. An EM function with LB= 15 Hz was used in the processing of the FID and subtracted afterwards from the final fitted linewidth values. a States 1(T) and 2(T) of the b-phosphate cannot be separated at the magnetic field used and were therefore fitted as a single Lorentzian line. b State 3(T) of a-phosphate could not be fitted independently of states 1(T) and 2(T) at the indicated molar ratio.

3. Results
191
direction is also observed for the a1(T) and b1(T)-phosphates, albeit less pronounced (Dd≈ -
0.05 ppm). The chemical shift of state 2(T) at the g-phosphate is d= -4.18 ppm and
independent of the concentration of Raf added.The corresponding chemical shift values in
the titration of RasWT and RasH27E are d= -3.60 ppm [117] and d= -3.54 ppm (Table 3.19),
respectively. In the case of RasG12V/T35S the initial state 2(T) is not defined and therefore it is
assumed that the observed state 2(T) represented by the green coloured line that rises
along the titration in Figure 3.62 is in fact state 2*(T). Based on this assumption, both, the
red and green coloured resonance lines at the g-phosphate represent respectively the Ras-
free and the Ras-bound complexes. From their integrated areas it is possible to obtain the
dissociation constant for the complex at any given ratio. The calculations led to an averaged
apparent KD of 0.1 mM, which is one order of magnitude higher than the value obtained
from ITC (13.52 µM). The mismatch in the obtained values between both techniques is
expected as the concentrations used in NMR are much higher than the typical KD interval
for the interaction (low hundreds in the nM range).
Table 3.29. 31P NMR chemical shift values and linewidths for the protein-protein complex HRasG12V/T35S(1-166)•Mg2+•GppNHp•Raf-RBD.
Protein complex ratio
a-phosphate b-phosphate g-phosphate d1(T) [ppm]
d2(T) [ppm]
d1(T) [ppm]
d2(T) [ppm]
d1(T) [ppm]
d2(T) [ppm]
RasG12V/T35S -11.13 -- 0.12 -2.37 -- + Raf-RBD 1:0.25 -11.12 -11.72 0.12a -2.36 -4.17 1:0.5 -11.12 -11.58 0.12 -0.20 -2.40 -4.17 1:1 -11.14 -11.57 0.07 -0.26 -2.50 -4.17 1:1.25 -11.16b -11.58 0.08 -0.23 -2.60b -4.17 1:1.5 -11.16b -11.58 0.08 -0.23 -2.66b -4.18 a-phosphate b-phosphate g-phosphate Dn1/2 1(T)
[Hz] Dn1/2 2(T)
[Hz] Dn1/2 1(T)
[Hz] Dn1/2 2(T)
[Hz] Dn1/2 1(T)
[Hz] Dn1/2 2(T)
[Hz] RasG12V/T35S 73.82 -- 53.44 47.49 -- + Raf-RBD 1:0.25 90.46 111.5 67.23a 53.00 113.6 1:0.5 117.4 109.0 67.29 109.0 57.43 121.1 1:1 169.5 179.4 91.82 152.7 131.3 126.2 1:1.25 128.2 129.8 91.55 107.2 198.0 118.9 1:1.5 115.9 149.1 73.07 123.3 253.1 138.6 All the values are fitted from the experimental spectra recorded at 278 K, pH 7.5. The maximum estimated errors from the fitting procedure are ± 0.02 ppm in chemical shift values and ± 0.16 Hz in linewidths for the g-phosphate. An EM function with LB= 10 Hz was used in the processing of the FID. Data were recorded at 242.896 MHz. a States 1(T) and 2(T) of the b-phosphate cannot be separated at the magnetic field used and were therefore fitted as a single Lorentzian line. bThe centre of the peak is not well defined enough to allow an accurate fitting. The listed value is a very rough estimation.

3. Results
192
Figure 3.62. 31P NMR spectroscopy on the titration of HRasG12V/T35S•Mg2+•GppNHp with the effector Raf-RBD measured at 278 K. To an initial 1.09 mM solution of RasG12V/T35S dissolved in buffer F (40 mM Tris/HCl pH 7.5, 10 mM MgCl2, 2 mM DTE) with additionally 0.2 mM DSS, 150 mM NaCl and 10% D2O, increasing amounts of Raf-RBD were added. The molar ratio is indicated for each titration step. The final concentrations of Ras and Raf (1:1.5 ratio) are 0.75 mM and 1.5 mM, respectively. All 31P resonances were recorded at a frequency of 242.896 MHz (600 MHz spectrometer). The number of scans was increased from 2000 (first step) up to 16000 (last step). An EM window with LB= 10 Hz was applied during the processing of the FID.

3. Results
193
3.5 High Pressure Macromolecular Crystallography (HPMX)
The crystallographic work presented herein is a collaboration with Nathalie Colloc’h, Eric
Girard, Anne-Claire Dhaussy and Thierry Prangé. The individual contribution from the
author of the present thesis to the project relied in protein crystallisation and data
acquisition. All structure refinements, b-factor calculations and compressibility curves that
originated the final results were kindly provided and analysed according to the expertise of
the team of crystallographers.
3.5.1 Crystal Structure of RasWT(1-166)•Mg2+•GppNHp at Ambient Pressure
There are many crystal structures of RasWT deposited on the pdb database solved at low (~
278 K) or at cryogenic temperatures (most of them at 100 K or bellow). However, since all
the HPMX data were collected at RT, the structure of RasWT was firstly determined in the
same conditions and sample environment (loading into the DAC, beam alignment, etc.).
The final refined structure was obtained at a resolution of 1.8 Å and serves as a control
experiment necessary to provide meaningful relationships and to minimise any instrumental
discrepancies between conventional and HP crystallography.
The ambient pressure (corresponding to 0.1 MPa, abbreviated as pamb), RT structure is
shown in Figure 3.63 (coloured in cyan), and a comparison with the representative structure
of GppNHp-bound Ras from Pai et al. is made (coloured in grey, pdb: 5p21, [12]). 5p21 was
obtained at 277 K, whereas this one was obtained in the 293-298 K interval. Both crystallise
under the same trigonal space group P3221 and are essentially identical, with a perfect
superposition for all the helixes and b-sheets that are in a distal position relative to the
nucleotide (a5, b1, b2, b3). Some residues shown at the surface and nearby the C-terminal
region have slightly different rotation angles (Figure 3.63A, R128, R135 and H166). The
only noticeable differences occur always in loops and at the helix a2 (aa 66-74). As can be
seen from Figure 3.63B and C (left side), helix a2 from 5p21 is spatially closer to helix a3
than the corresponding one in the structure obtained at RT. In the latter, the helix a2 is
pushed upward (indicated by the arrow in Figure 3.63C) and becomes slightly displaced
away from helix a3. The maximum separation between the two a2 helixes on the two
structures measured at any two corresponding Ca’s is ca. 2.0 Å.
The remaining residues that comprise switch 2 and switch 1 align very well respective to
their counterparts, with only minor deviations that can be assigned to a different spatial
orientation of specific residues resulting from their multiple rotational degrees of freedom.

3. Results
194
Figure 3.63. Refined crystal structure of HRasWT(1-166)•Mg2+•GppNHp obtained at ambient pressure and room temperature (coloured in cyan) and comparison with one of the representative structures from Pai et al [12], pdb: 5p21, recorded at 277 K (coloured in grey). Both structures are superimposed. A. Surface representation evidencing some residues at the C-terminal that show different orientations due to rotational movement (R128, S136, Q165). B. Structural details around the nucleotide binding site. The residues that show a significantly different degree of rotation between both structures are represented as thin lines (D30, E31, Y32 in switch 1 and Q61, E62, E63, Y64, M67 in switch 2). C. The small but significant upward movement of the helix a2 of switch 2 in the RT structure obtained in this work compared to 5p21 is evidenced (left side). At the right side, details of the catalytic waters are evidenced: the catalytic water (w175) and the nearby w189, from 5p21 are shown as small spheres. In comparison, no equivalent waters could be found in the electron density map of the RT structure. Instead, their role is replaced by the terminal extremity of Q61 that moves closer to the g-phosphate. As consequence, the H-bonding network between both structures is slightly different.

3. Results
195
This effect can be observed for D30 and E31 in switch 1 and for Q61, E62, E63, Y64 and
M67 in switch 2.
The two structures show also differences in terms of trapped waters at the catalytic centre:
the catalytic water, known for initiating the nucleophilic attack to the g-phosphate during the
GTPase reaction is named w175 in the 5p21 structure and is coordinated to the g-
phosphate, T35, G60 and to another nearby water named w189 in a tetragonal geometry
(Figure 3.63C right side). None of them could be found in the RT structure. As result, the
H-bond network is slightly different and leads to the movement of Q61 closer to the g-
phosphate, allowing the NH side chain of this residue to be at a distance of 3.0 Å from the
g-phosphate (the corresponding residue is more than 8 Å away in 5p21), establishing
therefore a direct contact with it. An identical orientation of Q61 is observed in both, the
Ras-GAP (pdb: 1wq1 [83]) and the Ras-SOS (pdb: 1nvw, [45]) complexes, where none of
the two crucial waters (w175 and w189) can be found. These differences in the number of
waters can also be extended to the complete unit cell: the RT crystal has much less
crystallographic waters than 5p21. A possible reason can be related with different degrees
of hydration due to different contents of PEG in the crystals (32% in the present work. The
PEG content of 5p21 is not expressly mentioned in the published paper).

3. Results
196
- This page was deliberately left blank -

3. Results
197
3.5.2 Crystal Structure of RasWT(1-166)•Mg2+•GppNHp at High Pressure
A total of four datasets were obtained:
• 200 MPa, resolution of 1.9 Å
• 270 MPa, resolution of 2.0 Å
• 490 MPa, resolution of 1.85 Å
• 650 MPa, resolution of 1.70 Å
During the experimental elaboration of this work it was directly verified that an important
factor regarding the pressure response of the crystals was the incubation time at certain
pressure values. When a continuously ramping was performed from 0.1 MPa up to above
270 MPa, with no waiting time for the accommodation of the crystal to high pressures,
diffraction was completely lost. In fact, good Bragg reflections at the two last recorded points
(490 MPa and 650 MPa) could only be gathered upon an overnight incubation around 200
MPa. From these results, it was possible to conclude that a slow adaptation to high pressure
was necessary, suggesting the existence of a slow conformational modification taking place
in the range of 200-270 MPa.
3.5.2.1 Analysis of the Compressibility Curve
A transition to a new conformation was also verified by the analysis of the compressibility
curve (the metric dependency of the crystal cell parameters with the applied thrust) [180]
and indicated that the unit cell volume decreases linearly with pressure, down to 3.6%,
measured at 270 MPa relative to ambient pressure (Figure 3.64). Above this point an
unusual expansion of 0.6% was observed, from 270 MPa to 490 MPa. At the maximum
pressure recorded of 650 MPa, for which a complete crystallographic dataset was obtained,
the calculated increase in
volume relative to 270 MPa
was 0.75%. At even higher
pressures, the volume of the
cell was reduced again and
diffraction degraded rapidly
(resolution of 3.6 Å at 850
MPa), rendering impossible the
obtention of a full dataset. At
low pressure (between 20 and
150 MPa) it was decided to
collect only a few reflections,
Figure 3.64. Compressibility curve obtained for the HP series on HRasWT(1-166)•Mg2+•GppNHp at RT. The volume of the unit cell (shown in Å3) is plotted as a function of pressure. Only four complete data sets were recorded at 200, 270, 490 and 650 MPa. For the lower pressure points it was chosen to collect only a few frames. At 850 MPa the crystal degraded very rapidly.

3. Results
198
enough to characterise the unit cell, but not complete datasets due to user time limitations
at the synchrotron beamlines. Data acquisition in this range was also avoided because the
accurate measurement of the pressure in the DAC is difficult at low pressures (between a
few tens of MPa, up to ca. 120 MPa). The pressure uncertainty of a crystal mounted at 100
MPa is ± 20 MPa. Pressure increases in the DAC as the thickness of the metallic gasket (a
thin foil) decreases. For an increase of 100 MPa, this reduction is typically less than 10 µm
and difficult to measure precisely by the separation of the Fluoresceence emission lines of
a Ruby chip [178, 240]. The movement of the piston located on the DAC through which
thrust is transmitted is also non-linear due to mechanical constrains and aggravates further
this uncertainty [178, 229]. The problem is alleviated at higher pressures, especially above
200 MPa, where the thrust can be steadily maintained with minimal oscillations (after
overnight incubation at 250 MPa, the oscillation was typically ±15 MPa).
From Figure 3.64 it can be taken that the transition zone for the conformational modification
occurs slightly above 270 MPa, probably around 300-400 MPa. This is also concluded by
the increase in the quality of the diffraction, as revealed by the resolution limits which are
1.75 Å at 0.1 MPa, 1.9 Å at 200 MPa, 2.0 Å at 270 MPa and increase afterwards to 1.85 Å
and 1.70 Å at 490 and 650 MPa, respectively. The number of visible waters in the electron
density maps follows the same trend, with 112, 85, 58, 108 and 167 molecules at 0.1, 200,
270, 490 and 650 MPa, respectively.
3.5.2.2 Analysis of rmsd and b-factor Values
Global Differences
The crystal structures refined at HP are shown in Figure 3.65. Additional details of the Mg2+
ion coordination environment are shown in Figure G of the appendix section. By doing a
sequence alignment followed by a structural superposition using the Pymol® software, it was
found that only minor changes are observed in terms of reorientation of the protein
backbone at different pressures. The helixes a1, a3 and a4 are perfectly aligned. The most
noticeable differences occur at the loops λ5 and λ7, at the switch regions, including the helix
a2 and at the b2 and b3 strands for which the highest deviation (relative to the pamb
structure, coloured in grey) is seen at 490 MPa (coloured in orange) and 650 MPa (coloured
in blue, Figure 3.65A left). The residues of all five structural motifs are presented in Figure
3.65B. It is noticeable that the switch 1 (aa 30-40) is less affected by pressure effects
comparatively with switch 2 (aa 60-76), given by the higher disorder of the latter relative to
the former (shown by different torsional and rotational orientation of almost all residues from
the helix a2 at different pressures, compared with the more structured switch 1). The three

3. Results
199
other motifs (P-loop, G4 and G5) remain almost unperturbed in the tested pressure range.
This result is expected given that they are detrimental for the tight binding of the a- and b-
phosphate groups and confer specificity for the guanine nucleotide. The switch regions are
shown in more detail in Figure 3.65C (switch 1) and D (switch 2). Again, with exception of
some residues such as E31, D30 and E37, there are no pronounced modifications at switch
1, contrary to switch 2.
A more quantitative analysis of the data can be given by looking to the b-factors (determined
at the alpha carbons to avoid the problem of multiple positions of the side chains), whose
interpretation can provide an insight into the functional relevance of possible excited states
existing at high pressure [179]. The averaged factors increase from 20.0 Å2 at 0.1 MPa to
29.2 Å2 at 200 MPa and to 33.6 Å2 at 270 MPa. However, they decrease significantly to 17.0
Å2 at 490 MPa and to 13.5 Å2 at 650 MPa, leading to the reasoning that that the two last
structures are further stabilised comparatively to the 200 and 270 MPa ones.
The rmsd values between the different HP structures were calculated and shown in Figures
3.65-3.67. A rather small averaged deviation of 0.17 ± 0.12 Å was obtained between the
0.1 and the 200 MPa structures. A similar value of 0.23 ± 0.15 Å was obtained for the pair
pamb-p270 (Figure 3.66A). However, after the transition state, a deviation of 0.47 ± 0.23 Å
was obtained for p270-p490 (Figure 3.67A). A smaller rmsd of 0.28 Å was obtained for the
pair pamb-p650 (Figure 3.68A). Together these values indicate again the existence of a
relevant structural rearrangement around 490 MPa.
Specific Differences
3.5.2.2.1 Structure at 270 MPa
Since the 200 MPa structure is quite similar to the 270 MPa one (average rmsd of 0.13 Å,
Figure 3.66A black line), only the comparison between pamb and p270 will be presented
(Figure 3.66A yellow line). The two structures are very similar in the switch 1 region, with
only slight differences in the orientation of E37, E31 and D30. The most pronounced ones
are observed in the middle of the helix a2 for R68 and D69 (Figure 3.66C). The b-factors
increase in average 13 Å2 and more than 20 Å2 around switch 2 (Q61-Q70, M72, R73) and
in the loop λ7, comprised between the helix a3 and the sheet b5 (residues K105-D108, Figure
3.66B). A similar averaged value of 10 Å2 was found between pamb-p200 and almost no
isotropic displacement was found between p200 and p270. The latter structure seems to
be less stable than the one at ambient pressure, given the observed increase of the b-
factors. Overall, the most noticeable pressure-induced modification between 270 and 0.1

3. Results
200
MPa was the destabilisation of switch 2, especially the a2 helix that became slightly pushed
towards the loop λ7. Since no considerable differences are observed between the p200 and
the p270, they are assumed to represent the same high-energy sub-state.
3.5.2.2.2 Structure at 490 MPa
The collection of high completeness data at 490 MPa was only possible when the crystal
as left at 250 MPa overnight and subsequently ramped up to 450 MPa prior to data
acquisition. The mean rmsd between p490 and 0.1 MPa is 0.56 ± 0.40 Å, with several local
values being higher than 0.7 Å (Figure 3.67A, orange line). The most pronounced effects
were detected at the beginning of the N-terminal extremity (M1, T2), at the b2 and b3 strands,
comprising the residues from Q43 to L52 and at the switch 2, especially in the S65-M72
sequence (Figure 3.67C). A concerted shift is observed for the b2-b3 strands and the first N-
terminal residues, all moving towards the helix a5 comparatively to the 0.1 MPa structure.
The switch 2 becomes also largely shifted towards the helix a3 and the loop λ7 located close
to the C-terminal. Concomitantly, the segment that precedes switch 1 (T20-E31) becomes
slightly shifted towards the nucleotide (Figure 3.67D). Remarkably, the average main chain
b-factors from the structure at 490 MPa are 16 Å2 smaller than the corresponding ones at
270 MPa (Figure 3.67B). They are also 3.5 Å2 lower than the obtained ones at 0.1 MPa.
However, different areas on the protein are affected differently. For example, switch 2
becomes destabilised by pressure (having higher b-factors than the corresponding region
at ambient pressure). At the same time, the b2-b3 region becomes greatly stabilised, with all
the local b-factors differing by more than -6 Å2 relative to pamb.
3.5.2.2.3 Structure at 650 MPa
The refined structure at 650 MPa closely resembles the one obtained at 490 MPa but it
seems to be further stabilised (less disordered) by pressure as indicated by the temperature
factors. The averaged rmsd between both is small and equal to 0.28 ± 0.39 Å (Figure 3.68A,
blue line. A higher value of 0.61 ± 0.45 Å was obtained relative to 0.1 MPa, black line). The
structural differences between p650 and pamb are similar to the ones already reported
between p490 and pamb, with most of them involving the residues at the beginning of switch
1 (I24-N26), the N-terminal (M1-Y4), and the Q43-D54 sequence, comprising the strands
b2 and b3 (Figures. 3.67C and D).
The comparison of p650 with p490 shows that all main chain b-factors are lower in the
former structure relatively to the latter, with exception of the sequence E62-A66 (Figure
3.68B). The beginning and the end of the switch 2 is further stabilised at 650 MPa, as

3. Results
201
observed again by the large decrease of the b-factors (more than -5 Å2 relative to p490) for
the T58-Q61 and R68-Y71 regions. A similar decrease is observed for some areas
comprising switch 1 (F28-D33, D33, I36-S39), the helix a3 (E91, Q99-V103) and the loop
λ10 that connects the b6 strand to the helix a5 (T148-G151). The calculated b-factors for the
nucleotide and for the Mg2+ ion are also significantly decreased.
Despite the structural similarity between the p650 and p490 structures, several local
differences can be found (rmsd < 0.8 Å) comprising the residues Q61-A66, R68, Q70-M72.
Their different reorientation comparatively to p490 leads to a simultaneous displacement of
the helix a2 towards of the loop λ4 and towards the bulk (Figure 3.68E, bottom). One of the
most dramatic displacements is observed for Gln61. This residue is normally positioned
almost in-plane with the g-phosphate as it establishes an H-bond with it in all the refined
structures except at 650 MPa, where it assumes a perpendicular position and points
upwards and towards the bulk. In this new position, Gln61 becomes stabilised by an H-bond
between its side chain and one of the oxygen atoms of the g-phosphate from the adjacent
molecule in the unit cell. The b-factor of the nitrogen atom engaged in the H-bond shows a
large decrease when compared with the other structures (37 Å2 at pamb, 46 Å2 at p490 and
25 Å2 at p650), indicating that the new position for Gln61 at 650 MPa is a very stable one
(Figure 3.68E, top).

3. Results
202
Figure 3.65. HP series on HRasWT(1-166)•Mg2+•GppNHp at RT. A. General overview of the superimposed structures evidencing differences in the relative orientation of the a-helixes and b-sheets. B. An overview of the pressure-induced effects on the motifs of the G domain surrounding the catalytic centre is given (switch 1, aa 30-40; switch 2, aa 60-76; P-loop, aa 10-17; G4, aa 116-119; G5, aa 145-147). The Mg2+ ion is represented as a sphere located nearby the g-phosphate C. Details at switch 1 evidencing the re-orientation of the side chains for some residues. D. Details at switch 2.

3. Results
203
Figure 3.66. Structural details of RasWT(1-166)•Mg2+•GppNHp obtained at 270 MPa (coloured in yellow) and comparison with pamb (coloured in grey) and the 200 MPa structure (coloured in green). A. Rmsd plot of p200 against pamb (green line), p270 against p200 (black line) and p260 against pamb (yellow line). B. Plot of the b-factors for pamb, p200 and p270. C. Local details evidencing the regions where the most pronounced structural differences between p270 and pamb were detected (around helix a2 and loop λ7).
Figure 3.67. Structural details of RasWT(1-166)•Mg2+•GppNHp obtained at 490 MPa (coloured in orange) and comparison with pamb (coloured in grey) and the 270 MPa structure (coloured in yellow). A. rmsd plot of p490 against p270 (black line) and p490 against pamb (orange line). B. Plot of the b-factors for pamb, p270 and p490. C. Local details evidencing the regions where the most pronounced structural differences between p490 and pamb were detected (at helix a2, Y64-M72 and at the N-terminal, including M1-Y4 and b2-b3 strands, Q43-L52. Additional modifications were detected at the helix a5 (rmsd > 0.7 Å) involving F146, Y157, R161, E162 and Q165. D. General overview of the structural changes observed between pamb, p270 and p490 at the N-terminal (dashed circle) and at the switch 2 region, marked by the upward arrow and by the movement of a2 towards a3, located behind it.

3. Results
204
Figure 3.68. Structural details of RasWT(1-166)•Mg2+•GppNHp obtained at 650 MPa (coloured in blue) and comparison with pamb (coloured in grey) and with the 490 MPa structure (coloured in orange). A. rmsd plot of p650 against p490 (blue line) and p650 against pamb (black line). B. Plot of the b-factors for p490 and p650. C. Plot of the b-factors for p650 and pamb. D. Local details evidencing the structural differences for which the rmsd values are higher than 1.0 Å, between p650 (blue) and pamb (grey). In the upper Figure the N-terminal region is highlighted (M1-Y4) together with the residues comprising the beginning of the helix 𝛼1 (I24-N26). The observed differences in the strands b2 and b3 are highlighted in the lower Figure for the residues Q43-D54. Other significant changes, not depicted here, were also found again at the helix 𝛼2 (Q62-D69, Y71, M72) and for E162 located at the helix helix 𝛼5. E. Details of the structural modifications (rmsd > 1.0 Å) between p490 (blue and p650 (orange). The pamb structure is also shown (grey). In the upper Figure, the different orientation of Q61 in p650 is evidenced. The switch 1 is almost identical for all the three proteins but remarkable differences are observed again at the switch 2, namely at the helix 𝛼2, represented in the lower picture.

3. Results
205
3.5.3 Crystal Structure of RasD33K(1-166)•Mg2+•GppNHp at Ambient Pressure
RasD33K was solved with a resolution of 1.95 Å at RT and ambient pressure. The structure
is very similar to RasWT, with the total averaged rmsd value between both being only 0.13
Å. Their similarity can be inferred from the perfect superposition of their crystal structures,
shown in Figure 3.69A (RasWT is coloured in grey and RasD33K is coloured in green). The
refined electron density in the vicinity of Lys33 is shown in Figure 3.69B. The side chains of
Lys33 and Asp33 point in the same outward direction, towards the surface of the proteins,
and the switch 1 is almost identical for both. The only noticeable differences are the distinct
rotational orientations of Asp30 and Glu37, together with the formation of an H-bond
between Lys33 and Glu31. The switch 2 is only slightly different for residues Q61-Y64 and
R68-Q70, with an rmsd > 0.3 Å. The obtained b-factors are also very similar in the two
structures (20 Å2 for RasWT and 21 Å2 for RasD33K).
Figure 3.68. Refined crystal structure of HRasD33K(1-166)•Mg2+•GppNHp obtained at ambient pressure and RT (coloured in green) and comparison with the wild type protein obtained in the same conditions (coloured in grey). A. Cartoon representation of the superimposed structures. The nucleotide from RasWT is coloured in dark orange and the nucleotide from RasD33K is coloured in light orange. B. View of the electron density map of RasD33K around the mutated residue. The neighboring amino acids are also shown. C. Comparison of the structural details between both proteins at the switch 1 region. D. Comparison at the switch 2 region. The residues showing different degrees of rotation are represented as thin lines. The small dark blue coloured spheres refer to the solvent waters of RasD33K and the light blue coloured ones refer to those of RasWT.

3. Results
206
- This page was deliberately left blank -

3. Results
207
3.5.4 Crystal Structure of RasD33K(1-166)•Mg2+•GppNHp Under High Pressure
3.5.4.1 Analysis of the Compressibility Curve
Two complete HP datasets were collected for RasD33K under pressure
• 200 MPa, resolution of 2.1 Å
• 880 MPa, resolution of 1.65 Å
In the first one, pressure was continuously ramped from 0.1 MPa with no waiting period for
pressure accommodation. In the second one, again an overnight incubation at 550 MPa
revealed to be necessary to achieve very high pressure, otherwise diffraction was
completely lost. A third dataset was recorded at 500 MPa after previous incubation at 200
MPa for ca. 2 hours. Although, perhaps due to the short incubation period, diffraction was
quickly lost, rendering impossible the acquisition of a full-refined structure. Figure 3.70
shows that the unit cell volume decreases 1.7% from 0.1 to 500 MPa and 4.6% from 0.1 to
880 MPa. The decrease between 200 and 880 MPa is of 2.9%. These results indicate that
the transition zone for RasD33K occurs at a higher pressure (ca. 500 MPa) comparatively to
RasWT (300-400 MPa).
The quality of the diffraction also improves with pressure, as observed from the obtained
resolution limits (1.95 Å at 0.1 MPa, 2,1 Å at 200 MPa, 1,65 Å at 500 MPa and 1.8 Å at 880
MPa). The same trend can be observed by the number of crystallographic waters which
increases from 80 (pamb) to 82 (p200) and 237 (p880). The same assessment can be
followed by considering the averaged values of the b-factors, which decrease from 21 Å2 at
0.1 MPa to 16.8 Å2 at 880 MPa. The rmsd value between ambient pressure and 200 MPa
is 0.17 Å and 0,64 Å between 200 and 880 MPa. Together these results suggest again a
Figure 3.70. A. Compressibility curve obtained for the HP series on HRasD33K(1-166)•Mg2+•GppNHp at RT. The volume of the unit cell (shown in Å3) is plotted as a function of pressure. B. Photography of a RasD33K crystal at 880 MPa. The crystal occupies the full length of the DAC (400 nm). Several cracks are noticeable at one of the edges due to the extreme pressure. The tiny circle in the bottom of the cavity is a ruby sphere used for an online measurement of the pressure. Due to its rather flat shape, the crystal needed to be reoriented using a diamond splinter (dark figure on the top). This process helps the acquisition of high completeness data. Surrounding the cavity is the metallic gasket that was carefully machined and positioned between the culets of the two diamond anvils.

3. Results
208
structural rearrangement between 200 and 880 MPa and possibly the existence of a new
conformation at very high pressure.
3.5.4.2. Analysis of rmsd and b-factor Values
Global Differences
A general overview of the RasD33K HP series is given in Figure 3.71. As already observed
in the case of RasWT, there are no dramatic changes on the protein structure such as a
complete unwinding of an helix or a broad displacement of a loop comparatively the 0.1
MPa structure. The superimposed structures shown in Figure 3.71A indicate that the helixes
a3, a4 and a5 remain unaltered, being the only affected regions switch 1, the helix a2 and
the C-terminal of the protein. A closer look to the five fingerprint motifs of the G domain
(Figure 3.71B) evidences again the greater mobility of switch 2 with pressure relative to
switch 1 and an almost unperturbed behaviour for the P-loop, G4 and G5.
Specific Differences
3.5.4.2.1 Structure at 200 MPa
The 200 MPa structure is quite similar to the one solved at ambient pressure, with an
averaged rmsd of 0.17 ± 0.09 Å (Figure 3.72A). The switch 1 is virtually identical in both
proteins and only significant changes are observed in switch 2, for which an rmsd > 0.5 Å
was obtained at Glu63 and Arg68 (Figure 3.72A). The global behaviour of RasD33K between
these two pressure points seems to be similar to the one of RasWT between ambient
pressure and 270 MPa. However, there is almost no change in the b-factors in the case of
the mutant (ca. 1.2 Å2, Figure 3.72B vs 13 Å2, Figure 3.66B, respectively). High local b-
factors (> 6 Å2) could only be found in the switch 2 (Q62, E63-D69, Y71) and for S39 in
switch 1, G151 in the helix a5 along with the Mg2+ ion. Given these results it can be inferred
that RasD33K seems to be less prone to pressure-induced conformational rearrangements
comparatively to RasWT (both show a small difference in the rmsd values and almost no
difference in the temperature factors).

3. Results
209
3.5.4.2.2 Structure at 880 MPa
The 880 MPa structure, however, is remarkably different from the other two. The obtained
average rmsd values are 0.71 ± 0.5 Å and 0,64 ± 0.5 Å relatively to 0.1 MPa and 200 MPa
(Figure 3.73A). Furthermore, the closest pressure point in the wild type series is 650 MPa.
Comparing both, a relatively high rmsd is also obtained (0.32 Å).
The main differences between RasD33K at 0.1 MPa and at 880 MPa (rmsd >1.0 Å) lie at the
very beginning of the N terminal (M1, T2), at the helix a1 (I24-H27) at the beginning of switch
1 (V29-Y32), the b2 and b3 strands (R41-D54), the switch 2 (Q61 – M67, Y71 – T74), and
residues A122 ,R128 (helix a4), and E162 (helix a5). At 880 MPa, the segment I24-Y32
becomes shifted by more than 1.0 Å towards the nucleotide and the residues E31, E37,
S39 and R41 point in different directions. Furthermore, in the switch 2, the loop λ4 (Q61 –
Y64) becomes shifted by more than 2.0 Å towards helix a5. Finally, the a2 helix (S65 – T74)
becomes shifted by 1.0 Å towards the loop λ4, with all residues pointing in different
directions (Figure 3.73C). Particularly, the crucial Gln61 becomes H-bonded to NH side
chain of Tyr64, pointing away from the nucleotide g-phosphate, as already observed in
RasWT at 650 MPa (Figure 3.73D, top). The b-factors decrease in average 4.5 Å between
p880 and pamb (Figure 3.73B). However, a local increase is observed at the end of P-loop
(K16-L19), switch 1 (Y32-I36), switch 2 (A59-M67, Y71), at the Mg2+ ion together with two
H2O molecules coordinating it.
3.5.4.2.3 RasD33K at 880 MPa vs RasWT at 650 MPa
When comparing the p880 RasD33K with p650 RasWT significant differences can be found in
switch 1 (V29-Y32) and the switch 2 (Q61-T74, Figure 3.72C). The obtained rmsd values
in these regions are always higher than 0.7 Å. In RasD33K at 880 MPa switch 1 shifts more
with pressure than the corresponding region in RasWT at 650 MPa (increased b-factors in
the segment Y32-I36). It is not possible to conclude if this happens because of the presence
of the mutation or because of a higher pressure (880 MPa instead of 650 MPa).

3. Results
210
Figure 3.71. HPMX on HRasD33K(1-166)•Mg2+•GppNHp at RT. A. General overview of the superimposed structures evidencing differences in the relative orientation of the a-helixes and b-sheets. B. An overview of the pressure-induced effects on the residues surrounding the catalytic centre is given (switch 1, aa 30-40; switch 2, aa 60-76; P-loop, aa 10-17; G4, aa 116-119; G5, aa 145-147). C. Details at the switch 1. D. Details at the switch 2.

3. Results
211
Figure 3.72. HP X-ray crystallography on RasD33K(1-166)•Mg2+•GppNHp. A. Rmsd plot of p200 against pamb (orange line) and comparison with RasWT p200 against RasWT pamb (green line). B. Plot of the b-factors for D33K pamb and D33K p200 C. Structural details evidencing the detected differences (rmsd > 1 Å) at switch 1 (top) and switch 2 (bottom) between RasD33K at 880 MPa (blue coloured) and RasWT at 650 MPa (pink coloured).
Figure 3.73. HP X-ray crystallography on RasD33K(1-166)•Mg2+•GppNHp. A. rmsd plot of p200 against pamb (orange line), p880 against p200 (black line) and p880 against pamb (blue line). B. Plot of the b-factors for pamb and p880. C. Structural details evidencing the observed small deviations (rmsd > 0.5 Å) at switch 2 between RasD33K at pamb and at 200 MPa. D. Similar comparison between pamb and p880. Significant differences were found at the beginning of switch 1 (top) and especially at the N-terminal region (rmsd > 1.0 Å), involving the residues from the b2 and b3 sheets (bottom).

3. Results
212
- This page was deliberately left blank -

3. Results
213
3.5.5 Crystal Structure of HRasWT(1-166)•Mg2+•GppNHp Soaked with Zn2+-cyclen
3.5.5.1 Analysis of the Compressibility Curve
For the purpose of these investigations, the previously grown Ras crystals were soaked
with 10-12 mM of Zn2+-cyclen from a highly concentrated stock solution (> 20 mM) at least
10 hours before data acquisition. Four complete datasets were obtained, all within the same
trigonal P3221 space group:
• 0.1 MPa, resolution 1.8 Å
• 180 MPa, resolution 2.05 Å
• 240 MPa, resolution 2.80 Å
• 520 MPa, resolution 2.70 Å
The analysis of the compressibility curve shows that the unit cell volume decreases linearly
with pressure, down to 5% at 520 MPa (Figure 3.74, orange line; only a few frames were
collected at 100 MPa). The decreasing is continuous, contrary to the behaviour of the Apo
structure (black line), whose volume increases between 270 and 490 MPa. It can be
observed that at any given pressure the cell volume of the protein soaked with the drug is
always smaller than the Apo structure, indicating that the inhibitor is diffusing and interacting
with Ras in the crystal (either specifically or unspecifically). In this series, incubation was
only performed for the last point at 200 MPa overnight. Afterwards, thrust was continuously
applied up to 520 MPa followed by data acquisition. Contrary to the observations for the
Apo structure, the quality of the diffraction does not improve with the increase of pressure.
The resolution limits are around 2.0 Å at low pressures and 2.8 Å at high pressures. The
number of visible waters also decreases with pressure, again as opposed to the Apo
protein, from 95 at pamb to 62, 69, 10 and 34 at p100, p180, p240 and p520 MPa,
respectively.
Figure 3.74. Compressibility curve obtained for the HP series on HRasWT(1-166)•Mg2+•GppNHp crystals soaked with 10-12 mM Zn2+-cyclen at RT (orange coloured line). The compressibility of RasWT alone, named here as Apo, is also shown for comparison (black coloured line).

3. Results
214
3.5.5.2. Analysis of rmsd and b-factor Values
The averaged main chain b-factors increased with pressure, from 22 Å2 at ambient pressure
to 31 Å2 at 100 MPa, 29 Å2 at 180 MPa, 43 Å2 at 240 MPa, decreasing subsequently to 30
Å2 at 520 MPa. It is worth mention that the structure at 240 MPa was collected on the same
crystal used at 100 MPa. This can partially explain the degradation of the diffraction at 240
MPa (very small number of crystallographic waters, high b-factors). The averaged rmsd
values between RasWT•Zn2+-cyclen at ambient pressure and p100, p180, p240 and p520
MPa are 0.17, 0.19, 0.36 and 0.87 Å, respectively.
Rather surprisingly, no Zn2+-cyclen molecules are visible in the electron density maps of the
crystal structures at 100, 180 and 240 MPa.
3.5.5.2.1 Ras Apo vs Ras•Zn2+-cyclen at Ambient Pressure
No significant differences were observed between RasWT Apo and in complex with Zn2+-
cyclen at 0.1 MPa. The average rmsd between both is 0.13 Å. The highest local deviations
(rmsd > 0.3 Å) were found for D110 and V111 at the loop λ7. No differences were detected
near the C-terminal H166 or at Q61. Both the Mg2+ ion and GppNHp lie at the exact same
position. Similar results were found when comparing Ras•Zn2+-cyclen at ambient pressure
with the structures resolved at 100 and 180 MPa.
3.5.5.2.2 Structure at 240 MPa
The structure obtained at 240 MPa is not drastically different from the one at 0.1 MPa,
however high local main-chain rmsd values were found between both involving the helix a1
and the remaining switch 1 region (rmsd > 0.5 Å for L23, N26, H27, D30-T35 and D38).
Particularly, T35, D33 and G48 showed an rmsd > 1.0 Å. These overall modifications led to
the shift of switch 1 away from the nucleotide and from the Mg2+ ion comparatively with its
corresponding position at 0.1 MPa. Additional differences were found in switch 2 that also
shifts away from the nucleotide: L56, D57-E63, R68, D69 were all found to have a rmsd >
0.5 Å relative to 0.1 MPa. For Q61-Q63 the deviation is greater than 1.0 Å. The Mg2+ ion is
itself shifted by 0.71 Å towards the bulk relative to the ambient pressure structure. More
importantly, Zn2+ is observed in the electron density map between the O1 of the g-phosphate
(distance of 2.5 Å), the side chain of Y32 (distance of 2.6 Å) and the side chain of P34 from
the adjacent molecule in the unit cell (distance of 2.9 Å). However, the cyclen moiety that
should surround the metal is not visible. Given these results alone, it is difficult to conclude
whether if cyclen is too disordered to be localized or not present at all.

3. Results
215
3.5.5.2.3 Structure at 520 MPa
The 520 MPa structure is considerably different from the one at ambient pressure. Both are
superimposed in Figure 3.75. The average rmsd value is 0.8 Å with localised differences
accounting for a rmsd > 1.5 Å (Figure 3.76A). These occur mainly in switch 1 and in the
loop λ7 that connects the strands b2 and b3 (rmsd of 1.6 Å for V44-C51). This last region
shifts towards the bulk relative to the ambient pressure structure (Figure 3.75B).
Structural differences were also found at switch 2, particularly for Q61, E63 and the segment
S65-Y71, all with an rmsd > 1.0 Å relative to the 0.1 MPa structure (Figure 3.75C). It is also
worth mention that switch 2 in the Ras•Zn2+-cyclen at 520 MPa is structurally more similar
to Ras Apo at p490 than Ras Apo at p650. With the exception of switch 1, both structures
(Ras•Zn2+-cyclen p520 and Apo p490) can be considered identical. The analysis of the
temperature factors shows that these are increased by pressure in average 8.0 Å2 and more
than 20 Å2 in both switch regions (D33-D38, E62-Y64, D69-Y71, Figure 3.76B) at 520 MPa.
Similarly to the p280 structure, a Zn2+ ion has been visualized in the electron density map
of p520, located close to the nucleotide and at a distance of 2.0 Å from O1 of the g-
phosphate. This ion lies very close to its symmetrical counterpart, with the distance between
them being 4.2 Å (Figure 3.76D); it shows a full occupancy, a high temperature factor (ca.
70 Å2) and is further coordinated by three H2O molecules (at a distance of 2.01, 2.56 and
2.78 Å). However, as for p280, no cyclen was detected around it.
The most important difference between the structure solved at 520 MPa and the one at
ambient pressure lies in the switch 1 (Figures 3.75B and 3.76C): at 520 MPa the segment
comprising S17-S39 shows a rmsd > 0.5 Å, with I24-H27 having a deviation higher than 1.0
Å. At the same time, D30-D38 became shifted towards the bulk by almost 5.0 Å. Due to
such a large movement, the side chain of T35, that normally coordinates the Mg2+ ion, is
now more than 4.0 Å away from it, as shown in Figure 3.76C. At the otherwise normal
position of the side chain OH group from T35 lies now a water molecule coordinating the
Mg2+ ion.
The 520 MPa structure is considerably different than he one at 240 MPa. The average rmsd
between both is 0.79 Å, with the residues E31-E37 showing a deviation higher than 5.0 Å.
Marked differences are also found at the segment b2-b3 (V44-T50, rmsd > 1.0 Å) and at
switch 2 (Q61-Q63, S65-M67, Q70, Y71, rmsd > 1.0 Å). Other major differences involve the
position of both metal ions, with Mg2+ and Zn2+ being displaced towards switch 2 in p520 by
1.69 and 2.26 Å, respectively.

3. Results
216
Figure 3.75. HPMX on HRasWT(1-166)•Mg2+•GppNHp at RT complexed with the small inhibitor Zn2+-cyclen. The refined structure at 520 MPa (coloured in green with the nucleotide in dark grey) is shown superimposed with the one at ambient pressure (coloured in violet with the nucleotide in orange). Both crystals were soaked for at least 10 hours with 12 mM Zn2+-cyclen A. General overview evidencing the overall differences between both. B. Structural details of switch 1 (aa 30-40). C. Structural details of switch 2 (aa 60-70). For both structures, no Zn2+-cyclen was detected in the electron density maps. However, Zn2+ alone (coloured in blue) was detected in the 520 MPa structure close to the g-phosphate. The cyclen group could not be found, although due to the large movement of switch 1 there is enough space to accommodate it.

3. Results
217
Figure 3.76. HP X-ray crystallography on RasWT(1-166)•Mg2+•GppNHp complexed with Zn2+-cyclen. A. rmsd plot of p520 against pamb (violet line) and RasWT Apo p490 against Ras•Zn2+-cyclen p520. B. Plot of the b-factors for Ras•Zn2+-cyclen at pamb (violet line) and p520 (green line). C. Details around the Zn2+ coordination site. This ion is stabilised by contacting the g-phosphate and the side chain of Q61. The movement of switch 2 relative to the original position at pamb (violet ribbon) leads to the displacement of T35 and Y32 outwards. At 520 MPa these residues can no longer establish polar contacts with the nucleotide. D. Details evidencing the spatial symmetry of the Zn2+ ion. The distance between its symmetric counterpart is 4.2 Å.

3. Results
218
- This page was deliberately left blank -

4. Discussion
“If you’re not part of the solution, you’re part of the precipitate”
Henry J. Tillman


4. Discussion
221
4.1 Full-Length H and KRas. Conformational Equilibria and Inhibition by Zn2+-cyclen
Due to the renovated interest in KRas it was presently investigated if the body of work
previously conducted in HRas in terms of 31P NMR could be transferred to KRas [67, 116,
155].
4.1.1 Interaction of KRasWT(1-188)•Mg2+•GppNHp with Raf-RBD
The results showed that the equilibrium population distribution is almost identical in HRasWT
and KRas4bWT: two conformational states dominate the GppNHp spectrum with a K12= 2.0
in both proteins (section 3.1.1, Figure 3.1). The interaction of KRasWT with the effector Raf-
RBD was tested by 31P NMR and showed that complex formation is characterised by a
significant upfield shift of state 2(T) (Dd= -0.21 ppm, from d= -3.30 ppm to d= -3.51 ppm,
Table 3.1). The difference indicates the state 2(T) is modified in the Ras-Raf complex by
small conformational changes that are generally termed as an induced fit model of binding
[263]. In order to distinguish these small but significant differences the notion of state 2*(T)
was presently introduced. Additional studies reported by our department, involving the
partial-loss-of-function mutants RasT35A and RasT35S led to the same conclusion regarding
the weak-effector bound state 1(T): also in this case, state 1(T) isomerises into state 1*(T)
upon effector binding [156] The upfield shift resulting from the general isomerisation process
observed in the 31P NMR spectra can be used in other studies as a fingerprint to discriminate
between Ras mutants that can bind to Raf from non-binding ones.
The affinity of full length HRasWT and KRasWT towards Raf was also tested by ITC. The
obtained KD values of 0.24 µM and 0.72 µM, respectively, indicate that the former binds with
a 3-fold greater affinity to the effector than the latter (Figure 3.2). Previous measurements
reported in the literature indicate a KD= 0.084 µM for the HRasWT-Raf complex (measured
at the same temperature and in 50 mM Tris/HCl pH 7.4, 5 mM MgCl2 with 100 mM NaCl)
[33, 244, 264], which corresponds to a 3-fold higher affinity compared with the presently
obtained value. This difference can be due to the differences in buffer composition. No
affinity data measured by ITC was found in the literature for the KRas•Raf complex.
The experimental DH, DG and -TDS values obtained here for HRasWT•Raf are -13.1, -37.7
and -24.6 kJ mol-1, respectively, and the corresponding published ones from the same study
are -21.7, -40.6 and -18.8 kJ mol-1, respectively [33]. The interaction has a very similar
associated Gibbs free energy in both cases. The main difference lies on the different
contributions: the published data has a greater enthalpic contribution and the present
measurements show a greater entropic contribution.

4. Discussion
222
In the case of the four Ras isoforms, all known effectors contact the protein surface in a
similar way by establishing an intermolecular b-strand comprised of Ras-b2 and b3, and
RBD-b1 and b2 elements [243]. Based on these structural similarities the 3-fold difference
in the measured affinity might be due to the simple uncertainty of the measurements but
can also be due to the influence of the hypervariable region (HVR) which is structurally
different in both, H- and KRas isoforms.
4.1.2 Stabilization of State 1(T) by Zn2+-cyclen Studied by 31P NMR
The direct modulation of the conformational equilibrium by stabilising state 1(T) upon
interaction with Zn2+-cyclen was also addressed in this work in section 3.1.2. The obtained
titration curves (Figure 3.3) show that this small compound binds to both isoforms in a
cooperative manner (n=2) and their sigmoidal behaviour is indicative of at least two binding
sites. The same conclusion was obtained when previous 31P NMR spectroscopic studies
conducted by our group revealed that HRasWT•Mg2+•GppNHp shifts towards the weak
binding state 1(T) upon binding of Zn2+ or Cu2+-cyclens [157, 254]. This result also
corroborates the finding of two different binding sites for Zn2+-cyclen on the surface of the
protein [157].
By fitting the plot of the chemical shift difference (Dd) of state 1(T) over the course of the
titration as a function of Zn2+-cyclen concentration to the Hill equation, a numerical value for
the dissociation constant was found to be equal to 9.9 ± 0.2 mM (Figure 3.3), for both Ras
isoforms. In parallel with this data, additional experiments reported by our group involving
the titration of RasT35S led to the calculation of an IC50 =18 mM for this drug [156].Taken
together, these values clearly show that the affinity of Zn2+-cyclen for Ras is too low for in
vivo investigations. However, its mode of action on Ras, and possibly on other GTPases
renders it a lead compound for the
allosteric inhibition of effector
interaction. Its direct localization
at the active centre of Ras can be
exploited to derive more selective
compounds, especially for
oncogenic variants. Despite its
low affinity, studies performed by
stopped-flow kinetics were able to
show that it has a clear inhibitory
effect on the Ras-Raf interaction.
Figure 4.1. Typical mode of action of Zn2+-cyclen and other state 1(T) inhibitors. Upon interaction with Raf, state 2(T) of Ras isomerises into state 2*(T). Zn2+ cyclen perturbs this process by stabilising state 1(T), decreasing the population of state 2(T) and preventing the transition into state 2*(T). Taken from [156].

4. Discussion
223
The reported association rate constant, kon, for the complex formation in its absence and in
its presence is 19.0 µM-1 s-1 and 2.2 µM-1 s-1, respectively [156]. Figure 4.1 shows
schematically its mode of action.
The studies on the inhibition of Ras by Zn2+-cyclen were further complemented by
investigating the displacement of this drug from full-length HRasWT and KRasG12D upon
addition of increasing amounts of Raf-RBD (Figures 3.4 and 3.6, respectively). It was
demonstrated that both, Raf and Zn2+-cyclen compete for binding to Ras and that the
original equilibrium observed at the g-phosphate for the Ras-Raf complex can be fully
restored when a 2-fold excess of effector is added to the original Ras•Zn2+-cyclen complex.
These results were further complemented by fluorescence titration experiments reported in
the published paper [156]. They further indicated that the interaction between the
conformational state 1(T) and Zn2+-cyclen prevents the formation of a trimeric complex
Ras•Zn2+-cyclen•Raf in significant concentrations.
4.1.3 Conformational Equilibria of KRasG12D•GTP and KRasG12V•GTP
The conformational equilibria for the full-length oncogenic variants KRasG12D and KRasG12V
bound to Mg2+•GTP was also investigated by 31P NMR (section 3.1.4, Figure 3.5 and Table
3.6). From the obtained spectra, state 1(T) at the g-phosphate can be directly observed for
G12V but not for G12D or the wild type proteins. This indicates that the P-loop mutation
form Gly12 to Val12 leads to a significant perturbation of the chemical environment on the
g-phosphate. However, the mutation to Asp has virtually no significant influence based on
the spectra of KRasWT. Structural relationships that might explain these differences are
difficult to assess, especially because there are no crystal structures of the GTP-bound
mutants. The observation of the corresponding crystal structures of HRasG12D(1-
166)•Mg2+•GppNHp (pdb: 1agp) and HRasG12V(1-166)•Mg2+•GppNHp (pdb: 4efm) shows
that the arrangement of Gln61, Tyr32 and Pro34 differs markedly between the two mutants.
In the case of HRasG12D the Asp12 side chain establishes an H-bond to the side chains of
Gln61 and Tyr32, that becomes very close (2.65 Å) to the g-phosphate and pulled towards
the interior of the molecule. Gln61 is also pulled towards the g-phosphate and Pro34 is fully
exposed at the surface. In the case of HRasG12V Tyr32 points away from the molecular
surface, being more than 4 Å distant the g-phosphate [265]. These differences account for
the different 31P NMR spectral features of the GTP-bound proteins, especially the different
movement of Tyr32, and for their different GTPase activity (G12D being 70% faster than
G12V) [266, 267].

4. Discussion
224
- This page was deliberately left blank -

4. Discussion
225
4.2 Modulation of the Conformational Equilibrium of KRasG12D(1-188)•Mg2+•GppNHp
by Small Compounds
4.2.1 General Considerations
The effect of different 15 small compounds in the conformational equilibrium of KRasG12D
bound to Mg2+•GppNHp was investigated by 31P NMR (section 3.2). Six of them (#643,
#098, #703, #449, #071, #109) have no pronounced effects, contrary to the remaining nine
(#727, #755, #757, #612, #613, #624, #307, #308, #616) that lead to a decrease of the K12
values relative to Ras alone. The highest effects are observed for the Fesik compounds
#755 and #757 [145] as well as (but at a smaller extent) the Sulindac analogues #307 and
#308 [147, 148]. A global overview is given in Figure 4.2 were the equilibrium constants are
plotted for the tested concentrations of 1.5 mM (grey) and 3.0 mM (orange). Under the
present conditions, the equilibrium could not be shifted completely. This may be due to an
inherent property of these inhibitors or simply because the 3.0 mM maximum concentration
is not sufficient.
Most of the compounds are intrinsic allosteric inhibitors of Ras that act by stabilising state
1(T) leading to a decreased SOS-mediated exchange activity; although their main function
is assumed to focus on the GDP-bound state (as state 1(D) stabilisers), their action can be
extended to GppNHp-bound Ras as proven here, and most certainly also to GTP-bound
Figure 4.2. Comparative plot of the obtained equilibrium constants, K12=Astate2(T)/Astate1(T), for the g-phosphate of KRasG12D•Mg2+•GppNHp in the presence of the tested compounds at 1.5 mM (grey colour) and 3.0 mM (orange colour). The first bar, noted as, ‘KRasG12D’, refers to the control experiment were the influence on K12 was measured in the absence (grey) and in the presence (orange) of 6% DMSO. The six compounds published by the Fesik group and their structural differences are indicated together with DCAI from Genentech.

4. Discussion
226
Ras. This series of experiments also shows that 31P NMR spectroscopy can be used to
quickly select and score potential drug candidates from large libraries. This is extremely
useful in the field of Ras inhibition and can be potentially extended to any other GNBP from
the Ras superfamily.
The inhibitory effect of the two Fesik compounds and DCAI is discussed in more detail in
the following sections.
4.2.2 Inhibition of Ras-Raf Interaction by #755 and #757 Followed by ITC
Both compounds impair the protein complex formation, with #757 having the highest
inhibitory effect (sections 3.2.9 and 3.2.10). The measured KD for the Ras-Raf binding
increases from 0.37 µM to 0.62 µM in the presence of 300 µM of #755 and from 0.37 µM to
3.54 µM in the presence of an equal concentration of #757. Both differ only in the
substituents at their benzimidazole group, with #755 having an methylbuthanamide moiety
and #757 having a bulkier, proline-like, moiety (Figures 3.15 and 3.17) [133, 145]. The
bigger size of the proline substituent of #757 allows the molecule to expand further into the
binding cleft (Figure 3.17) and accounts for the enhanced disruption of Ras-Raf mediated
interaction [145]. As #757 is bulkier, its binding on the Ras surface leads to a more
pronounced rigidity of the protein around the binding site compared to #755, which implies
a greater effort in performing a conformational modification to achieve Raf binding. This
interpretation explains the negative entropic contribution (positive -TDS, Figure 3.18) of the
process in the presence of #757, contrary to #755, where the more hydrophilic
methylbuthanamide would favour an extended water network in the vicinity of the binding
cleft, responsible for the positive enthalpic and entropic contributions (Figure 3.16).
The positive increase in entropy from the Ras-Raf complex alone comparatively with the
same complex in the presence of #755 (-TDS= -13.3 kJ mol-1 vs -25 kJ mol-1, Figure 3.16)
could be unrelated with the characteristics of complex formation but instead due only to
unspecific effects (such as decreased solubility of the ligand in solution). A direct
contribution for the increase in entropy can be related with the binding of #755 to Ras and
the associated release of hydration waters from the contact surface of the protein [268].
The true contributions, however, are difficult to rationalize due to the likely existence of
enthalpy-entropy compensation mechanisms where a ligand modification that results in a
change in the enthalpic contribution to binding DDH≡DHRas/drug-Raf−DHRas-Raf can be partially
or fully offset by a similar change in the entropic component of binding, DDTS≡DTSRas/drug-
Raf−DTSRas-Raf [244, 269]. When enthalpy-entropy compensation occurs, normally DDH and
DDTS share the same and that DDG≈0. This is presently the case for #757: comparing the

4. Discussion
227
titration in the presence of 150 µM of #757 (Figure 3.18B) with the Ras-Raf interaction alone
(Figure 3.18A) it follows that DDH= -28 kJ mol-1 and DDTS= -32 kJ mol-1. The changes in
the Gibbs energy, DDG, are only 4 kJ mol-1. Similar values are obtained for the binding of
the two proteins measured in the presence of 300 µM of the drug [270, 271].
4.2.3 Inhibition of Ras-Raf Interaction by #616 (DCAI) Followed by ITC
DCAI from Genentech [18] represents an interesting case since it inhibits Raf binding by a
factor of 10 (KD= 3.53 µM at 300 µM of #616 vs 0.37 µM in Ras alone) but shifts the
equilibrium in the opposite direction, favouring state 2(T) (K12 increases from 0.7 in Ras in
6% DMSO to 1.02 at 3.0 mM, section 3.2.16, Table 3.3). In vivo Ras-Raf inhibition in its
presence was also reported and further supports the present ITC data [18]. How can a
compound stabilise the effector recognising state and at the same time inhibit the interaction
with Raf? Within the conformational model of Ras it can be speculated that #616 stabilises
state 3(T) that is adjacent to state 2(T) in the 31P NMR spectrum (see [171] and section
3.4.1.2). The chemical shift of state 2(T) shifts downfield, from d= -3.49 ppm in Ras in 6%
DMSO to d= -3.40 ppm at 3.0 mM of the drug (Table 3.2) and the chemical shift of state
3(T) in the Ras-NF1 complex is d= -3.0 ppm. A Dd of 0.4 ppm is observed. It is not possible
to unequivocally ascertain if the drug stabilises indeed state 3(T) despite leading to the
same downfield shift of state 2(T) and to an increase of its relative area. If this is the case,
DCAI would have a double effect as an inhibitory drug, since it could also stimulate the
GTPase reaction. A straightforward way to prove this hypothesis would rely in the
comparison of the intrinsic and GAP stimulated GTPase reaction in its absence and in its
presence.

4. Discussion
228
- This page was deliberately left blank -

4. Discussion
229
4.3 High Pressure 31P NMR Spectroscopy
4.3.1 High Pressure 31P NMR on GppNHp
Reported studies have shown that pressure coefficients of model peptides are significantly
influenced by pH when the side chain pKa value is close to the pH value at which the
experiment is being performed [272]. Assuming that this finding is applicable to other
molecules, including nucleotides, the pH-dependent chemical shift changes of GppNHp
were presently avoided by working at a pH value of 2-3 units above the pKa for the
deprotonation of the third phosphate group [116]. This corresponds to a pH of 9.0 and 11.5
in the presence and in the absence of Mg2+, respectively.
Following the pressure-dependent resonance lines in Figure 3.26, section 3.3.1, it is
possible to observe that all the chemical shifts decrease with pressure (they become more
negative, corresponding to an upfield shift in the spectra, see also Figure A, appendix). If
this would be due to a pressure induced pH-change (and not to a pressure effect), then the
pH of the sample would drop by more than 2 units (or the intrinsic pKa should increase).
This possible variation in pH was followed by measuring any shift changes of the 1H
resonance spectra from the Tris buffer, which works as a pH sensor. A maximum shift of -
0.006 ppm at pH 9.0 (in the presence of Mg2+) and -0.0012 ppm (in the absence of Mg2+)
was found [226]. This corresponds to a slight increase in the pH smaller than 0.2 units
(which is on itself difficult to detect by NMR) and would lead to a small downfield shift of the
phosphate resonances, partially compensating the pressure-induced upfield shifts. The pKa
value of the nucleotide should decrease since pressure usually leads to a dissociation of
protons. Therefore, the obtained pressure shifts cannot be explained by a pH or a pKa effect
and are therefore a true consequence of intrinsic pressure-induced structural modifications
on GppNHp [226, 249].
4.3.1.1 Pressure Effects in the Presence and in the Absence of Mg2+
All calculated second order coefficients are higher for GppNHp than Mg2+•GppNHp (Table
3.5), indicating that Mg2+ has the effect of stabilising the ground-state conformation(s) of the
nucleotide, rendering it more insensitive modulation by pressure.
In the presence of this ion (Figure 3.26A), the a-phosphate shows the smallest pressure
dependence, with a Dd of -0.028 ppm between 0.1 and 200 MPa. The b- and g-phosphates
are prone to considerably larger effects, with Dd values of -0.25 and -0.2 ppm, respectively.
The same behaviour is also observed in the absence of Mg2+ (Figure 3.26B): the a-
phosphate is always the least pressure dependent. Comparing the intensity of the shift
changes with and without Mg2+, it becomes clear that the Dd values are considerably higher

4. Discussion
230
in the latter case. Considering g-phosphate as an example, Dd= -0.2 ppm in the presence
and Dd=-0.40 in the absence of Mg2+.
All phosphorous resonances, including inorganic phosphate (Pi), are characterized by
negative B1 values. This is indicative of an initial upfield shift of the resonance lines, as the
pressure is increased. The conclusion is valid for both, with and without Mg2+.
Analysing now the differences between the two separately, in the absence of Mg2+ all
phosphate resonances are characterized by positive B2 coefficients, indicating a
“saturation” like behaviour at high pressures (i.e. the pressure induced chemical shift
changes become smaller at higher pressures, which is noticeable by the plateau-like shape
of the curves in Figure 3.27, and this can be associated with B2 > 0). The same is observed,
in fact, in the presence of Mg2+, except for the a-phosphate that has a negative B2.
Published results by our group have shown that at higher pressures there is a general
tendency for the adenine and guanine nucleotides to dissociate from the metal ion. This is
generally accompanied by a downfield shift of the resonance lines [226, 249]. Although, no
downfield shift is presently observed for any of the Mg2+•GppNHp phosphates. The same
effect could also be used in a tentative way to explain the “saturation”-like behaviour of the
curves. However, the same behaviour is observed for GppNHp in the absence of Mg2+
(Figure 3.26) which leads to the conclusion that the small chemical shift changes at higher
pressure are not a specific effect arising from the release of Mg2+ but due to a true pressure-
dependent mechanism that is correlated with the structural dynamics of GppNHp in solution
[226, 249].
Although HP NMR in nucleotide binding proteins is not a widely pursued topic by the
scientific community, the knowledge gathered about the behaviour of isolated GppNHp and
other nucleotides under pressure is detrimental to understand the true mechanistic pressure
effects on the conformation and equilibrium of Ras and other nucleotide binding proteins
[273].
The 31P NMR chemical shifts of nucleotides can be mainly ascribed to two factors:
conformational strain of bonds and electric field effects that lead to the polarization of the
oxygens in the phosphate groups. Bond polarization by hydrogen bonding or nearby electric
charges that can cause small shifts in the protonation/deprotonation equilibrium may be the
dominant factors [274]. Additional effects might be caused by magnetic anisotropy of the
guanine ring that assumes different averaged positions relative to the phosphate groups in
a syn/anti equilibrium [275]. The average position and average orientation of the ring is
influenced by pressure, which leads to the observed chemical shift dependencies at the
phosphate groups.

4. Discussion
231
4.3.2 High Pressure 31P NMR on Ras Proteins
4.3.2.1 HP 31P NMR on HRasWT(1-166)•Mg2+•GppNHp
Measurements at 278 K
For all proteins investigated, the processing of the experimental data with an appropriate
Gaussian function revealed to be better than a Lorentzian function in retrieving accurate
chemical shift values (section 3.3.2.1, Figure 3.28).
As the pressure increases, the integrals corresponding to state 2(T) decrease,
concomitantly with the increase of the integrals corresponding to state 1(T) (Figure 3.27,
green line). At 250 MPa, state 1(T) dominates over 2(T), given by the decrease in the
equilibrium constant from 1.7 at 0.1 MPa to 0.24 at 250 MPa. This entails a direct evidence
for the pressure-induced 2(T)-to-1(T) transition. The calculated difference of the free
energy, DG12 and partial molar volume, DV12, is 1.53 kJ mol-1 and -18.60 mL mol-1,
respectively (Figure 3.30). Similar values were found in previous studies on the full-length
variant [125]. it is thus possible to conclude that the dependence of LnK12 with pressure is
not linear. A closer look to the distribution plot indicates a slight but continuous deviation
from linearity over the tested pressure interval. This is a direct evidence for the fact that 1(T)
and 2(T) do not represent pure states but have additional (or ‘hidden’) contributions from
states 3(T) and 1(0) [171, 276].
Since in state 1(0) the affinity of Ras towards the nucleotide is much lower comparatively
with state 1(T), the release of nucleotide from the protein should be observed at high
pressures [67]. This is indeed detected, especially at 220 and 240 MPa by the presence of
the small additional peaks at d= -1.33, -6.0 and -10.15 ppm, corresponding to the free a, b
and g-phosphates, respectively (Figure 3.27). This finding, together with previous
denaturing studies involving GdmCl [125] leads to the conclusion that state 1(0) is coupled
with state 1(T) and by application of pressure, the equilibrium can be shifted in the 1(T)-to-
1(0) direction. It is expected that such a conformational transition involves a great
readjustment of the Ras surface and should be therefore governed by a slow exchange
mechanism, which is marked by a change in the 31P NMR peak areas of the g1(T)-phosphate
but not in chemical shifts. This is verified when considering the uncorrected values for the
g1(T)-phosphate: the variation of the pressure-induced shift, Dd, is only 0.015 ppm (Figure
3.29 and Table F, appendix section) corresponding to a very small change that lies in the
limits of the error of the measurement. However, the corrected value shifts downfield by a
Dd of 0.241 ppm (blue line in Figure 3.29). In this case the transition 1(T)-to-1(0) becomes
governed by a fast exchange process.

4. Discussion
232
If the transition to the nucleotide free state 1(0) is coupled with state 1(T), then by exclusion,
the transition towards the GAP recognition state is coupled with state 2(T). This is directly
observed from the Ras-GAP titration experiments (Figure 3.39 and [117]). Following the 31P
pressure dependence of the g2(T)-phosphate (Figure 3.27 and Table F appendix section)
one can observe that this signal shifts from d= -3.33 ppm at 0.1 MPa, to d= -3.00 ppm at
110 MPa, down to d= -2.68 ppm at 250 MPa (these refer to the corrected pressure values).
Such continuous downfield shift is indicative that this state is in fast exchange with another
state, namely 3(T), that becomes prominent at high pressures. Previous HP [1H-15N]-HSQC
NMR investigations have shown that 3(T) is most populated around 110-130 MPa (Figure
1.13, section 1.3.2 [171]) and the presently obtained HP 31P chemical shifts nicely agree
with this result (the corrected d values obtained at 110 and 130 MPa are -3.0 and -2.96
ppm, respectively).
4.3.2.1.1 Analysis of Pressure Coefficients, Energy and Volume Changes
The necessity for subtracting the pressure-dependent chemical shifts of free Mg2+•GppNHp
from the chemical shifts of the protein is supported by the observation that the 31P NMR
signals of the free nucleotide and the nucleotide-bound protein shift in opposite directions
(the a- and g-phosphates shift upfield in the former and downfield in the latter. The b-
phosphate shifts in the same direction, Figures 3.26 and 3.29). Upon correction, all
phosphate groups of the nucleotide-bound protein shift further downfield relative to the
uncorrected case, as indicated by the absolute increase of the B1 values. The most linear
pressure-dependence was found for the g1(T)-phosphate, whose B2 decreases from 1.90 to
0.4 ppm GPa-1 upon correction and the most non-linear dependence was found for a1(T) and
a2(T)-phosphates, with a B2(corrected)= -2.40 and -1.46 ppm GPa-1, respectively (Table 3.6).
The obtained DG and DV values are largely dependent of the initial values given as input
for the iteration process (experimental section 2.2.5.4, eqn. nº17). Nevertheless, the fitting
led to some interesting results: It is valid to assume in a first approach that state 2(T) on
both, the a- and g-phosphates is prone to the same type of transition. However, the obtained
DG and DV values are considerable different (Table 3.6). For example, DGa2(T)corrected= 8.17
kJ mol-1 and DGg2(T)corrected= 3.44 kJ mol-1. The corresponding DV values are -85.19 and -
37.31 mL mol-1. The difference can be due to the intrinsic difficulty of the fitting routine or
due to a more complex profile of the conformational equilibria, with the a2(T)- and g2(T)-
phosphates effectively sensing different transitions. The same kind of assessment can be
made regarding state 1(T). The averaged DGcorrected value for the 2(T)-to-3(T) transition is
5.81 kJ mol-1 which is in good agreement with the reported value of 5.2 kJ mol-1 from

4. Discussion
233
previous experiments [171]. A slightly greater difference is found in terms of DV values (-
61.25 vs -81.0 mL mol-1, respectively). Regarding the 1(T)-to-1(0) transition greater
discrepancies between both measurements were found with the averaged DGcorrected.= 3.68
kJ mol-1 obtained from the present 31P HP data and the reported one being 12.4 kJ mol-1.
Measurements at 303 K
When the temperature is increased from 278 to 303 K (Figures 3.31 and 3.32), the two
conformational states coalesce into a single resonance line. The 31P NMR series becomes
represented by the chemical shift evolution of the three phosphate groups, with their
populations being a weighted average of the ones detected at 278 K. The obtained DG and
DV values for the a-, b- and g-phosphates are numerically very similar to each other (DG=
6.39, 5.50 and 5.65 kJ mol-1, respectively and DV= -43.92, -43.17 -54.78 mL mol-1,
respectively, Table 3.7), Their similarity is a direct indication that the three phosphate
groups are experiencing the same type of transition at this temperature.
In summary, the 31P HP NMR series presently investigated provide a much more
comprehensive survey for the dynamics of the protein at the nucleotide bound level than
the previously published HP series (Figure 1.12A, [125]).
4.3.2.2 HP 31P NMR on RasT35S(1-166)•Mg2+•GppNHp
From the series shown in Figure 3.33 (section 3.3.3), increasing the pressure has no effect
on the dynamics of state 2(T). This means that this state cannot be repopulated, even at
high pressures. For such reason, the only possible conformational transition that can be
assigned to the system is the 1(T)-to-1(0).
The response of RasT35S to pressure is generally smaller and more linear than RasWT (Figure
3.33). One exception is the a-phosphate of the mutant that shows a large second order
coefficient (B2(corrected)= -2.27 ppm GPa-2, Table 3.8).
The obtained thermodynamic values for each phosphate group are numerically similar,
indicating that all are involved in the same transition even at 278 K (DG= 3.49, 4.55, and
5.15 kJ mol-1 and DV= -70.7, -51.0 and -57.0 mL mol-1 for the a-, b- and g-phosphates,
respectively, Table 3.8). One would expect that at high pressure a large amount of bound
nucleotide would be released by the protein, as state 1(0) becomes populated. However,
no free Mg2+•GppNHp can be observed in this series (Figure 3.33), contrary to RasWT
(Figure 3.27). This apparent contradiction has no straightforward explanation. One can
argue that most likely the ‘true’ nucleotide-releasing state occurs at much higher pressures
than 200 MPa and that the population distribution of state 1(0) obtained from a

4. Discussion
234
thermodynamic model previously reported in other studies is greatly overestimated (i.e. at
ca. 200 MPa, the population of state 1(0) is probably much lower than predicted) [171]).
Another explanation can be related with the existence of residual amounts of alkaline
phosphatase (AP) inside the NMR tube. The presence of this enzyme would exert a
sequential hydrolytic activity in the nucleotide that would be released, and given enough
time, all of it would be converted to Pi. Indeed the Pi resonance line, located at d= 3.37 ppm
(Figure 3.33) increases in its relative area over time. Nucleotide exchange using an
immobilised AP column procedure instead of the ‘classical’ approach (experimental section
2.2.2.4) was precisely devised and performed for all Ras samples used in HP experiments
in order to alleviate this problem.
Two obtained crystal isoforms of RasT35S•Mg2+•GppNHp (pdb: 3kkn, form 1 and 3kkm form
2) constituted the first evidence for the occurrence of regional polysterism on state 1(T):
both forms are a structural manifestation of this state [242]. From an NMR point-of-view,
this type of polysterism would be characterised by the existence of more than one signal for
a specific phosphate group(s), just like in the wild type case. However, no additional signals
are detectable during the pressure series close to state 1(T), probably due to the too small
modifications of the chemical environment around the nucleotide and to an intermediate or
fast exchange regime for the interconversion between such conformations.
4.3.2.3 HP 31P NMR on KRasG12V(1-188)•Mg2+•GTP
There are two remarkable features that deserve to be addressed: the first one is the direct
observation of two distinct conformational states, 1(T) and 2(T), on the b-phosphate and
their interplay as the pressure is increased from 0.1 up to 195 MPa (section 3.3.4, Figure
3.35. These states cannot be separated at the corresponding b-phosphate on the HP series
of RasWT bound to GppNHp as they lie very close to each other (Figure 3.27 and [125]).
The second feature is related with the different response to pressure of GTP and GppNHp-
bound Ras. From the higher B2 values and the more pronounced curvature of the chemical
shift dependencies (Figure 3.36 and Table 3.9) it can be concluded that GTP-bound Ras is
more sensitive to pressure than GppNHp-bound Ras. This is a reasonable finding since one
can envisage that the additional imido group from GppNHp is capable of establishing
additional polar contacts with the protein backbone (Figure 1.2), leading to a more
conformational stiffing in its vicinity [124]. The considerations for the specific transitions
made for RasWT and RasT35S are the same in the case of RasG12V, with state 2(T) being
directly coupled to state 3(T) and state 1(T) being coupled with 1(0). The obtained DG and

4. Discussion
235
DV values are in this case is particularly inaccurate due to the small number of pressure
points collected and the high signal-to-noise ratio of the experimental data.
4.3.2.4 HP 31P NMR on HRasD33K(1-166)•Mg2+•GppNHp
The 31P pressure-dependence of a novel mutant RasD33K•Mg2+•GppNHp was also
investigated in this thesis in section 3.4.7. Contrary to RasT35S that exists in state 1(T),
RasD33K is almost completely shifted towards state 2(T) and shows only a residual
population of state 1(T) at 0.1 MPa (Figure 3.53). Pressure leads to the direct effect of
repopulating state 1(T) at the g-phosphate but not at the a-phosphate which remains locked
in the initial conformation and shifts only by a Dd of 0.054 ppm (Figure 3.54, Table 3.23).
Although the characteristic downfield shift of the chemical shift values is observed for all the
phosphate groups, the calculated thermodynamic parameters are rather different from
RasWT. For example, DGg1(T)corrected is equal to 14.32 kJ mol-1 and 5.54 kJ mol-1 in RasD33K
and RasWT, respectively. This envisages the conclusion that the conformational transitions
induced by pressure on RasD33K are not identical to the ones observed for RasWT.
4.3.2.5 General Considerations
The HP investigations on the different Ras proteins revealed that the observed
conformational transitions have a more complex thermodynamics than the initial model
proposed by us [125, 171]. The experiments prove unequivocally the existence of several
discrete conformations that can be assessed by pressure perturbation [159, 165], with
almost all phosphate groups showing indeed a non-linear response. Nevertheless, the
accurate characterization of high energy states revealed to be difficult because the
conformational readjustments can be
easily missed when the associated
chemical shift changes are not very
strong as in the case of 31P NMR. The
fitting of the broad Lorentzian lines with
very often ill-defined centres is difficult
and subtle but important aspects are
impossible to detect, accounting for the
also rather linear pressure dependency
of most phosphate groups. Additional
pH-dependent shift changes can
obscure the true effects of pressure
Figure 4.3. 31P chemical shift variation of Pi plotted as a function of pressure for Mg2+•GppNHp (black), RasWT (blue) and RasT35S (green). The dashed line indicates the pressure point of 70 MPa, for which the direction of the chemical shifts are reversed (from upfield to downfield).

4. Discussion
236
[226]. To test if this is the case the
analysis of the shift changes of free
inorganic phosphate (Pi) was
performed. Its resonance moves
initially downfield by a Dd of 0.023 ppm
(between 0.1 and 80 MPa) in RasWT
and RasT35S (Figure 4.3) and then
upfield, with a Dd of -0.054 ppm
between 80 and 250 MPa. The total
variation in the complete interval is
only -0.033 ppm to which corresponds
an insignificant change in pH over the
course of the pressure series. Similar
results were obtained by the analysis
of the Tris signal in the 1H NMR spectra
(data not shown) [116, 249, 273],
proving that the pH does not change
considerably.
The 31P chemical shift changes of
RasWT, RasT35S and RasD33K are plotted
together in Figure 4.4, allowing a
general overview of the results: at the
a-phosphate (top graph), the highest
variation is observed for RasD33K,
where the range of the Dd values (from
-11.49 to -11.0 ppm) occurs
somewhere in between the values
determined for states 1(T) and 2(T) of
RasWT. The a-phosphate of RasT35S
shows the less pronounced pressure
dependence, with a Dd of 0.090 ppm
between 0.1 and 190 MPa. In all
cases, the corrected and uncorrected
shifts are close related and follow the same downfield direction.
The chemical shift of the b-phosphate on RasD33K at 0.1 MPa lies somewhere in between
Figure 4.4. 31P pressure-dependent chemical shift changes of RasWT and RasT35S and RasD33K in complex with Mg2+•GppNHp recorded at 278 K, pH 7.5. Each plot shows the uncorrected and corrected changes for the a- (top), b- (middle) and g-phosphates (bottom). Another version of this plot is shown in Figure E of the appendix where, instead the absolute chemical shifts, d, shown here, the Dd’s= dlast pressure point-d0.1MPa are plotted as a function of pressure.

4. Discussion
237
the one of RasWT and RasT35S. The magnitude of its pressure-induced shift is more or less
identical for the three proteins (middle graph). In the case of g-phosphate (bottom graph),
the chemical shifts can be separated into two groups corresponding to state 1(T) and state
2(T), with the magnitude the former being smaller than the latter.
4.4 31P NMR Spectra of H, K and NRasWT(1-166)•Mg2+•GppNHp
It was shown herein that NRas, is the isoform with the highest K12 value (2.57 vs 1,57 for
HRas and 1.83 for KRas) and with the lowest apparent KD for Raf binding (0.18 µM vs 0.60
µM for KRas and 0.42 µM for HRas, section 3.4.1.1, Figure 3.38, Table 3.11). These results
are in good agreement with each other as NRas is the variant with a higher state 2(T)
population and concomitantly higher Raf-affinity.In this respect, contradictory results are
published in a recent study reporting the first crystal structure of NRasWT, where it is shown
that the affinity of NRas to Raf is lower than the two other isoforms (the measured KD values
at 308 K for H, K and NRas are 0.094, 0.098 and 0.206 µM, respectively) [277].
4.5 Interaction of RasWT, RasG12P and RasD33K with NF1 Followed by 31P NMR
4.5.1 RasWT(1-166)•Mg2+•GppNHp•NF1
The titration allowed the unequivocal assignment of state 3(T) for the a-, b- and g-
phosphates at -11.12, 0.07 and -3.00 ppm, respectively (Section 3.4.1.2, Table 3.12). A
similar value was found in previous studies published by our group for the Ras-GAP333
complex [117]. In saturating amounts of NF1 (ratio 1:2, Figure 3.39), the a- and g-
phosphates are defined by a single resonance whose linewidth at half-height increases by
a 3-fold factor (from 64 to 205 Hz), nicely reflecting 3-fold increase in size on the molecular
mass of the complex (from 18 to 54 kDa).
The ill-defined, asymmetric centre of the b-phosphate above a 1:1 ratio is indicative of the
existence of at least two different local conformational states. Keeping in mind the functional
cycle of Ras, they can be explained on the basis that the GAP mechanism involves not only
the isomerisation process, where Ras changes conformation to bind GAP, but also a
transition state conformation that becomes stabilised by the arginine finger provided from
GAP and is spatially oriented close to the b-phosphate (Figure 1.4) [23, 83]. The existence
of different conformations at the nucleotide level in the Ras-GAP complex was also proved
in recent studies involving FTIR spectroscopy and QM simulations [84]. The authors have
shown that the geometry of Mg2+•GTP changes from a staggered position of the non-

4. Discussion
238
bridging oxygen atoms of the b- and g-phosphates to an eclipsed conformation, defined by
different torsional and dihedral angles. This is caused by a change in the coordination to
the Mg2+ ion from tridentate to bidentate forced by Ras and helped by the Arg finger from
the GAP protein. These observations are in agreement with the profile of the present 31P
NMR titration.
4.5.2 RasG12P(1-166)•Mg2+•GppNHp•NF1
Due to the greater separation between states 1(T) and 2(T) (Dd= 2.52 ppm, section 3.4.10.3,
Figure 3.61 vs Dd= 1.63 ppm in RasWT) at the g-phosphate, state 3(T) is better defined in
this complex. Its resonance becomes upfield shifted by a Dd of 0.22 ppm relative to its
counterpart in the wild type protein (section 3.4.1.2, Figure 3.39 and [259]). Similar features
are observed at the b-phosphate (at a 1:1 ratio, d3(T)= 0.31 ppm and d2(T),1(T)= 0.40 ppm,
Table 3.28). Due to the identical profile of the titration relative to RasWT, the binding affinity
of both proteins can be assumed as identical. Previous studies showed that this is indeed
the case by using RasG12P to inhibit the GAP-mediated GTPase reaction of RasY32W, whose
GAP affinity is equal to RasWT but shows a large fluorescent change upon GTP hydrolysis
that can be easily quantified [259]. The measurements have shown that the affinity of
RasG12P to p120-GAP is slightly decreased (ca. 2.8-fold lower) compared to RasWT. A similar
decrease was found in the case of RasG12V but not for RasG12D, which still retains the affinity
to GAP [265, 278].
4.5.3 RasD33K(1-166)•Mg2+•GppNHp•NF1
RasD33K has a lower affinity towards NF1 (section 3.4.5, Figure 3.51 and Table 3.21). Even
at a Ras:NF1 ratio of 1:2, the line corresponding to state 3(T) could not be detected,
indicating that complex formation is impaired, although a quantitative measurement for the
interaction is not possible to obtain directly from the 31P NMR titration.
The structural basis for the loss of affinity is so not clear since the contact surface with GAP
is much more extensive than Raf and not only subjected to the effector-loop region [31, 38].
From the published Ras-GAP complex (pdb: 1wq1 [83]), D33 interacts with the positively
charged N942 and K949 residues. Since both are also present in the structure of NF1, the
lower affinity of RasD33K to NF1 can be explained by the same reasoning used for the
RasD33K-Raf complex, based on the steric and electrostatic clashes between the two Lys
residues (K33 and K949, see discussion section 4.7).
The measurement of the affinity between Ras and NF1 was attempted by ITC but in all
cases no obvious binding curves could be obtained due to severe artefacts in the heat

4. Discussion
239
signatures, corroborating the idea that the Ras-GAP complex formation does not obey to a
single step and/or to steady-state conditions [255, 256]. Other methods such as
fluorescence spectroscopy and thermophoresis could be used in the future to measure the
affinity, complementing the present 31P NMR data [77, 108, 255].
4.6 Mutational Studies on HRasWT(1-166)
4.6.4 General Considerations
Figure 4.5 summarises the
features of the GppNHp-bound 31P
NMR spectra obtained upon site-
directed mutagenesis on Ras.
From the seven investigated
mutants, four of them (H27E,
S39L, E3V and D33K) show novel
structural properties, with RasE3V
and RasD33K, being the most
notable ones by dramatically
affecting the dynamics of the
bound nucleotide (D33K) and by
exerting a clear allosteric
interference that can be
propagated from a distant
localisation in the surface of the
protein (E3V) and still affect the
catalytic centre. This mutational
investigation was performed with
the expectation of shifting the
conformational equilibrium at the
nucleotide-bound level in the
same direction previously
predicted by HP NMR [125, 171].
The overall results show that in the
light of the proposed 4-state
model, the absence of a direct
Figure 4.5. 31P NMR spectra of the different Ras mutants bound to Mg2+•GppNHp, created by SDM for the study of the conformational dynamics of Ras. The respective mutation, together with the calculated equilibrium constant, K12=Area2(T)/Area1(T) at the g-phosphate is indicated. All the spectra were recorded at 278 K, pH 7.5 in a magnetic field operating at a 31P frequency of 202.456 MHz (500 MHz spectrometer).

4. Discussion
240
modification in the chemical shifts or integrated areas on the phosphate resonances of
states 1(T) and 2(T) does not necessarily mean that the global equilibria is not affected.
Any mutation can change both parameters for the conformational states 1(0) and/or 3(T)
that are intrinsically hidden in the 31P NMR spectra since they are low populated at ambient
pressure (0.4 and 7.7%, respectively [166, 171]). To this respect, the directly observable 31P NMR spectral lines can remain inalterable relative to RasWT but the equilibria can still
be shifted by the mutation. For example, if state 1(T) increases at expense of state 2(T) but
if this is compensated by an increase of state 3(T) at expense of state 1(0), the equilibrium
would still be shifted towards state 1(T) and there would be no noticeably modification
relative to RasWT (K12= 1.7). This could be the case of RasN26K, RasH94D and RasA66T, all with
a K12 value close to 1.7.
Figure 4.6 is a schematic representation of how the equilibrium can be modulated by the
interplay of the four conformational states. RasWT, RasT35S, RasH27E and RasD33K are given
as examples. For each one, the four states are indicated and arranged by their increasing
order of energy. Possible conformational transitions from the most populated, lowest energy
states 1(T) and 2(T) are indicated by the dashed arrows. Note that additional transitions
exist and that different arrangements of the four states for the same protein are also
possible. For example, state 1(T) on RasT35S can become populated by decreasing the
energy for this state and/or by increasing the energy of state 2(T). State 1(T) in RasH27E can
become populated by decreasing the energy of state 1(0) and state 2(T) in RasD33K can
become populated by decreasing the energy of state 3(T) or increasing the energy of state
Figure 4.6. Interplay between the four different conformational states of Ras proteins. States 1(T) to 4(T) are coloured in red, green, blue and black, respectively and shown by their increasing order of energy Ras wild type, T35S, H27E and D33K are given as examples. The respective 31P NMR resonance at the g-phosphate is also shown. The dashed lines represent conformational transitions starting from states 1(T) and 2(T). Note that other possibilities exist.

4. Discussion
241
1(T)/1(0). The energy difference between them can be modulated by pressure, as
discussed in section 4.3.2 [123, 125, 171].
In summary, the study of the different Ras mutants shows the complex dynamics of this
protein but also the limitations of 31P NMR in uncovering all of its conformational states [16,
123, 125, 163]. A discussion of the spectroscopic and biochemical properties of each
mutant is given in the following sections.
4.6.2 2(T)-to-1(T) Transition: N26K, A66T and H94D
In the light of the results obtained none of the three individual mutants led to a directly
observable shift of the conformational equilibria in the direction of state 1(T). Their
investigated properties are not different from the wild type protein. No chemical shift or
linewidth differences were detected between them and RasWT (section 3.4.2.1, Figures 3.41
and 3.42, Table 3.13) despite N26K and A66T being located in the vicinity of the nucleotide
at the beginning of switch 1 and middle of switch 2, respectively (Figure 3.40, [16]). A 1.7-
fold increase in of the intrinsic hydrolysis rate for RasH94D in presence of Raf-RBD was
however detected (kcat= 0.035 min-1 vs 0.021 min-1 in RasH94D alone, Figure 3.43B and Table
3.14). The dissociation constant for the Raf binding obtained for the three mutants is also
similar to RasWT. An averaged increase of -8 kJ mol-1 in the enthalpy of binding was however
found for all of them relatively to RasWT. With exception of D94, the other two mutants are
involved in polar contacts with the surface of Raf [33].
4.6.3 2(T)-to-1(0) Transition: E3V and S39L
Larger effects were found in the case of RasE3V and RasS39L. Both mutations led to a
meaningful modification of the conformational dynamics, independent of the expected
direction of the underlying transition (section 3.4.2.2).
RasS39L shows a significant perturbation of state 1(T) at the a- and g-phosphates, both
becoming downfield shifted by 0.1 ppm relative to RasWT (d= -11.08 and -2.50 ppm,
respectively vs d= -11.17 and -2.57 ppm in RasWT, Table 3.15), and with a decrease in the
equilibrium constant from 1.7 to 1.5 favouring state 1(T). The rates of exchange for this
state are also slightly faster comparatively to RasWT as given the average 1.4-fold decrease
of their line broadening. Rather interestingly, the affinity of RasS39L to Raf increases by more
than 5-fold, despite the shift towards the weak effector interacting state (KD= 0.0074 vs
0.424 µM, Table 3.16).
RasE3V, on the other hand, shifts in the opposite direction, showing a 20% increase in the
integrated area of state 2(T) at the g-phosphate (Figure 3.45). The equilibrium constant

4. Discussion
242
increases from 1.7 to 2.0. However, the affinity to Raf remains unperturbed (KD= 0.603 µM),
as well as the GTPase activity (kcat= 0.027 min-1, τ= 27.12 min.). The effects of the mutation
are remarkable considering that it lies at the beginning of the N-terminal, more than 20 Å
away from the g-phosphate. The modulation of the dynamics of the nucleotide happens by
a true allosteric mechanism in this case. It is possible that the same mechanism is
responsible by the action of the state 1(T) inhibitor Zn2+-BPA whose binding site is located
in the same region [158].
The two mutants investigated herein show antagonistic effects as both shift the equilibrium
in different directions, with S39L affecting state 1(T) and E3V affecting state 2(T), but both
residues were found to be involved in the same type of transition, towards state 1(0). In this
respect it is worth mention that effect of a specific mutation on the dynamics of a protein
depends on many factors including the amino acid that is chosen for replacement and it is
only predictable at some extent by computational methods [279]. Furthermore, as
discussed above in section 4.6.1, the 31P NMR chemical shifts and peak areas are only
surrogate markers for changes in the dynamics of the protein because states 3(T) and 1(0)
are not immediately accessible for scrutiny. For example, the mutation E3V can still promote
an increase on the population of state 1(0) at expense of state 1(T). In this case, the
equilibrium would still be shifted towards state 2(T) as observed in Figure 3.45.
4.6.4 2(T)-to-3(T) Transition: H27E and D33K
Only D33K is located in the effector-loop region of the protein (aa 30-40), although both
mutations affect pronouncedly the dynamics of the GppNHp-bound nucleotide (section
3.4.2.3).
Replacement of His27 to Glu changed the population towards state 1(T), leading to a
decrease of the equilibrium constant from 1.7 to 1.0. The three phosphate groups become
downfield shifted by an average Dd of 0.07 ppm for the b- and g-phosphates and more than
0.3 ppm for the a-phosphate (Figure 3.47, Table 3.17). His27 is located at the beginning of
switch 1 and more than 14 Å away from the g-phosphate, indicating that the interference
detected at the phosphate groups has an allosteric basis. It is likely that its substitution to a
negatively charged Glu causes a reorientation of the neighbouring Phe28 that lies
perpendicular to the centre of the nitrogen base in the wild type structure [14, 117, 242].
The reorientation of the aromatic ring due to the presence of the negative charge would
alter the magnetic anisotropy at the guanine base (for example, if the Phe ring moves from
a perpendicular to a more parallel position relative to guanine, the nuclei from the guanine
base would become more shielded to the external field B0), which would be transmitted

4. Discussion
243
through the nucleotide system and lead ultimately to a modification of the magnetic
susceptibility at the phosphate groups [116, 275]. Biochemically it was verified that the
intrinsic GTPase reaction of RasH27E is no different than RasWT (kcat= 0.025 min-1, τ= 27.39
min. vs kcat= 0.026 min-1, τ= 26.85 min., Figure 3.48) and that its affinity towards Raf-RBD
is increased by a 2-fold factor (KD= 0.23 for RasH27E and KD= 0.42 for RasWT), leading to the
idea that the mutation could have endorsed not only a conformational shift towards state
1(T) but also a functional modification on the remaining state 2(T) population by slightly
increasing their affinity towards effectors. The energetics of the binding proceeds with a
greater enthalpic contribution in the case of RasH27E comparatively to the wild type protein
(DH= -16.9 vs -8.10 kJ mol-1, respectively, Table 3.18), meaning that the mechanism of the
interaction is essentially different in terms of network of H-bonding at the binding interface
of the two proteins.
Mutation of the negatively charged Asp33 to a positively charged Lys in RasD33K led to a
drastic increase in the equilibrium constant, from 1.7 to 11.3, with state 2(T) being the most
preponderant and state 1(T) collapsing to the level of the baseline noise (Figure 3.47 and
Table 3.17). An upfield shift of -0.07 ppm was observed for state 2(T), with the new
resonance line located at d= -3.40 ppm (vs d= -3.33 in RasWT). The resonance of state 2*(T)
in the Ras-Raf complex is located at d= -3.51 ppm for full-length KRasWT (Table 3.1), d= -
3.60 ppm for the truncated variant [117] and at d= -3.54 ppm for RasH27E (Table 3.17), all
values being slightly upfield shifted relatively to g2(T) in RasD33K alone, excluding the
assignment of the g2(T)-phosphate as a 2*(T) state. It was in fact verified that the g2(T)-
phosphate of RasD33K can still undergo a further upfield shift, towards state 2*(T), in the
presence of Raf-RBD (d2*(T)= -3.63 ppm, Figure 3.50, Table 3.20), leading to the conclusion
that this mutant can still isomerise into the Raf-recognition state as in the case of RasWT
(Figure 3.1), although with a much lower affinity (see section 4.7).
To the best of our knowledge, RasD33K is the only known Ras mutant that is almost
completely shifted towards state 2(T). This finding is particularly interesting if one considers
that other known mutants from the switch 1 region such as T35A, T35S, Y40C, Y32W,
Y40C, among others, are all typically state 1(T)-driven, whose state 2(T) is either residual
or completely undetectable as in the case of T35S (Figure 3.47A) or T35A [123]. Direct
experimental evidence also indicates that typically all switch 1 mutants have impaired
affinity to Raf-RBD and impaired intrinsic GTPase activity [67, 123]. These biochemical
properties correlate well with RasD33K, which also shows impaired affinity to Raf (KD= 10.4
µM vs 0.42 µM relative to RasWT) and a slightly lowered GTPase activity (kcat= 0.016 min-1
vs 0.026 min-1, Table 3.18).

4. Discussion
244
- This page was deliberately left blank -

4. Discussion
245
4.7 Interaction Between RasD33K and Raf-RBD Followed by 31P NMR. Structural Basis
for the Loss of Affinity
The binding of RasD33K to Raf was investigated by ITC and 31P NMR in section 3.4.4 (Figure
3.50, Tables 3.18 and 3.20). The apparent KD of 10.4 µM taken from the ITC measurements
shows that this point mutation located in the middle of the effector-loop region drastically
reduces the affinity towards Raf. A lower affinity was previously reported in the only
available study, where it was shown that the binding of Raf to RasD33A was greatly reduced
and completely abolished in the case of RasD33K [63]. it is possible that the presently
obtained KD of 10.4 µM might be slightly underestimated. From the data retrieved by ITC, it
is clear that the binding to Raf still proceeds with favourable enthalpic and entropic
contributions but the enthalpy variation is much lower comparatively to RasWT (DH= -4.24 ±
0.25 kJ mol-1 for RasD33K vs -8.10 ± 0.23 kJ mol-1 for RasWT). This enthalpy decrease
correlates very well with the disruption of an important H-bonding network that can be found
in the RasWT-Raf complex but that is most likely abolished in the case of the RasD33K-Raf
complex.
The crystal structure of the RasWT•Mg2+•GppNHp•Raf-RBD complex is shown in Figure 4.7,
with RasWT coloured in light brown and Raf coloured in light purple (pdb: 1g0n [64]). The
contact interface between the two proteins involves mainly the antiparallel arrangement
between a b-sheet from Raf and b3 from Ras and the effector-loop region comprising mainly
switch 1 and an a-helix from Raf (Figure 4.7B). The negatively charged residues E31 and
D33 from RasWT are crucial for establishing polar contacts with the positive ones, K84 and
R73, from Raf, each pair acting like a clamp, holding the proteins together. The disruption
of this clamping effect can be seen when the crystal structure of RasD33K obtained in the
present work (section 3.5.3) is superimposed (coloured in light green in Figure 4.7): there
is an obvious clash between K33 from RasD33K and K84 from Raf, which in fact is not only
a steric clash but also an electrostatic one, as both residues have the same charge and
repel each other.
This local hindrance has more profound consequences evidenced in Figure 4.7C: as K84
is held tightly by D33 and E81 in RasWT, its side chain -NH group becomes perfectly aligned
to initiate a series of long-range H-bonding networks, that culminate with the establishment
of polar contacts between crystallographic waters (represented as light purple spheres in
Figure 4.7C) and the a-phosphate of the bound GppNHp. The same effect cannot happen
in the case of RasD33K because K84 cannot approach the effector-loop region and initiate
the process. It is likely that disruption of the water network leads to a more profound effect
in the modification of the chemical environment in the vicinity of the nucleotide (by changing

4. Discussion
246
Figure 4.7. Structural basis for the interaction of RasWT and RasD33K with Raf-RBD. A. The surface of the crystal structure of the protein-protein complex HRasWT(1-166)•Mg2+•GppNHp•Raf-RBD is shown (pdb: 4g0n). RasWT is coloured in light brown and the RBD domain of Raf is coloured in light purple. Into this structure, the presently obtained x-ray structure of HRasD33K•Mg2+•GppNHp at pamb was superimposed (coloured in light green). The Ras-Raf interface region marked by the dashed rectangle is shown in detail in B. Important residues at the interface are represented as sticks and polar contacts between RasWT and Raf are represented by the dashed lines. Note how K33 from the superimposed RasD33K structure clashes in space with K84 from Raf and also in terms of electronic charge (both being positive). The disruption of the interface in RasD33K has more profound consequences evidenced in C. In the wild type complex, K84 from Raf is held in place by E31 and D33 (both light brown coloured) and establishes long range polar contacts mediated by crystallographic waters (represented by the small light purple spheres) that culminate with the direct stabilisation of the a-phosphate. In the case of RasD33K, K84 is unable to take part in these interactions. Note that the GppNHp nucleotide from both structures is superimposed. Additional important polar contacts between RasWT and Raf are evidenced in the background.

4. Discussion
247
the polarisation of the P-O bonds, for example) than the point mutation on itself. In fact,
RasD33K shows a lower content of crystallographic waters at the nucleotide binding site
compared to RasWT (pdb: 5p21), with Gln61 assuming the same position as in the Ras-GAP
complex (pdb: 1wq1, [83]) by binding directly to the g-phosphate (see section 4.10.2).
4.8 Thermal Unfolding of Ras Followed by nanoDSF
A series of interesting conclusions can be taken directly from the thermal unfolding studies
(section 3.4.8). From the obtained values (Figure 3.56, Table 3.24) It can be concluded that
Ras has two sequential melting temperatures (Tm), the first one around 50 ºC, that
corresponds to the melting of state 1(T), and the second one around 58 ºC, that corresponds
to the melting of state 2(T). The latter being slightly more energetically stable than the
former is the last to unfold. This was observed for RasWT and RasH27E, for whom K12= 1.7
and 1.0, respectively. Rather surprisingly, two Tm values were also found for the state 1(T)
mutant RasT35S, but only one for RasT35A (Tm= 58.11 ºC). This apparent contradiction can be
explained considering that although being both state 1(T)-driven, the former, contrary to the
latter, can readily isomerise into state 2(T) in the presence of effectors [156]. As the thermal
unfolding is a sequential process, RasT35S can undergo the two thermal transitions, but not
RasT35A for which a direct conversion from state 1(T) to 2(T) is not possible. A different
unfolding pathway needs to occur in this case. This result is in good agreement with
previous experiments where GdmCl was used to induce the chemical denaturation of RasWT
and RasT35S, followed by 31P NMR [125].
RasD33K shows a single Tm of 61.84 ºC (Table 3.24). In this case, state 2(T) has a higher
population than its counterpart in RasWT (K12= 11.3 vs 1.7), being more energetically stable,
which accounts for the 3ºC higher Tm than the averaged Tm2 values. As state 1(T) is not
significantly populated, its thermal unfolding remains undetected.
4.9 Conformational Dynamics of RasG12P and RasG12V/T35S Followed by 31P NMR
4.9.1 Considerations About RasG12P
RasG12P was previously found to be the only mutant of Gly12 that has non-transforming
properties in cells and leads to a normal phenotype [280], although there are no relevant
structural and/or thermodynamic studies available in the literature and the exact mechanism
that renders it non-transforming is still unknown. In terms of equilibrium populations, the 31P
NMR spectrum of RasG12P•Mg2+•GppNHp is more similar to RasG12V than to RasWT (Figure

4. Discussion
248
3.58A). However, the biochemical properties of the former are in fact more similar to the
ones of RasWT: both show similar rates of GTP hydrolysis (kcat= 0.035 min-1 and kcat= 0.026
min-1, respectively) and similar affinities towards Raf-RBD (KD= 0.59 µM vs KD= 0.42 µM,
respectively, Table 3.26). Such findings further support the classification of RasG12P as non-
transforming [259, 261]. On the other hand, the typical oncogene RasG12V has a normal
affinity to Raf but an extremely slow hydrolysis rate (kcat= 0.005 min-1, Table 3.26). The wild
type-like affinity of RasG12P to effectors was further confirmed by following its titration with
Raf-RBD by 31P NMR (section 3.4.10.2). The structural basis for the non-transforming
properties of RasG12P is most likely related with differences in the orientation of Gln61
located in switch 2: in the case of RasWT and RasG12P, this residue is positioned in its catalytic
conformation by making an H-bond with the catalytic water, ready to initiate the nucleophilic
attack. In the case of RasG12V the corresponding water molecule is not present in the crystal
structure and Gln61 points towards the helix a3, in the opposite direction of the g-phosphate,
due to the steric hindrance promoted by the presence of Val12 [259, 281]. In other cases
as in RasG12D, Gln61 is oriented in the right direction but involved in a H-bond with D12 and
unable to coordinate the catalytic water.
4.9.2 Considerations About RasG12V/T35S
The mutant has been used extensively in a wide range of cellular-based assays after it was
found that it could retain the interaction with the effectors Raf and CDC25, among others
but not with PiK3 or Ral-GDS, leading to the activation of only specific signalling cascades
such as Ras/Raf/MEK/ERK but not EGF/EGFR or the Pi3K/AKT/mTOR pathways [110].
Although there is substantial evidence that it can activate the ERK pathway through Raf
recognition and binding, the exact mechanism is also not known. Furthermore, the extent
and duration of the activation seems to be largely dependent on the type of cell line [282].
In the scope of the work presented herein, the main question was if the nature of the double-
mutant could be governed by one of the mutants alone, and if so, what would be the
preponderant contribution. From the 31P NMR investigations it was demonstrated that
RasG12V/T35S has a greater contribution from RasT35S, whose properties dominate the
GppNHp and the GTP spectra, with both being a state 1(T) mutant, contrary to RasG12V for
which a K12= 1.16 (at the g-phosphate of bound-GppNHp) was obtained (section 3.4.10,
Table 3.25). Although spectroscopically similar to RasT35S, the intrinsic GTPase and the
affinity to Raf-RBD of RasG12V/T35S is much lower than the corresponding values obtained for
the isolated mutants (RasG12V and RasT35S, Figure 3.62). Thus, the apparent KD for

4. Discussion
249
dissociation from Raf was found to be 13.52 µM against 0.66 µM and 6.45 µM, respectively.
In summary, the low affinity measured between RasG12V/T35S and Raf-RBD is in slight
disagreement with the idea that the mutant can readily activate the Ras/Raf/MEK/ERK
pathway upon association with Raf-RBD in living cells. It is plausible that the pathway can
still be activated but the extent of and the potency of the downstream relayed signals is
certainly much lower than the one observed in the case of RasWT or RasG12V alone. The
experimental evidence for such difference reported in the literature is not unanimous: some
investigations suggest that RasG12V/T35S retains a full-fledged binding activity, just like
RasG12V [61, 111] while others suggest, in line with the presently obtained data, that the
activation occurs but is greatly decreased [110]. One can envisage the activation of Raf-
dependent pathways taking place through a bypass mechanism that does not necessarily
require Raf as initiator. Nevertheless, in the light of the present data that the double mutant
does not have the same degree of affinity to the effector as the oncogene RasG12V. This fact
should be taken into consideration when devising cell-based assays.
4.10 High Pressure Macromolecular Crystallography (HPMX)
4.10.1 HRasWT(1-166)•Mg2+•GppNHp
Crystal structure at Ambient Pressure
The presently obtained RT crystal structure of RasWT is similar to the representative 5p21
one, obtained at 277 K (section 3.5.1, Figure 3.63). There are however several local
distinctions comprising the switch 2, all marked by the different re-orientation of the side
chains of specific residues relative to the protein backbone. These differences are more
related with the commonly known intrinsic disorder of switch 2 than with the actual
difference in temperature of the two structures [28, 94, 95]. The absence of the nucleophilic
waters at RT is responsible for the different orientation of Gln61 relative to the same residue
in 5p21 [12], envisaging the delicate balance between the spatial arrangement of these
highly mobile regions and the nature of the macromolecular crystal (type of symmetry,
degree of hydration, type of buffer, etc.).
Crystal Structures at High Pressure
The compressibility of the unit cell shows unequivocally the existence of a transition sate
around 300 MPa (section 3.5.2.1, Figure 3.64). Two high energy conformers were solved
above this point, the first at 490 and the second one at 650 MPa. Both differ from the
structure at 0.1 MPa by an averaged rmsd value of 0.47 and 0.28 Å, respectively.

4. Discussion
250
The overall observed structural changes indicate that a new conformation of the protein was
trapped at 490 MPa given by the direct increase in resolution from 2.0 Å before the transition
zone to 1.8 Å at 490 MPa and 1.7 Å at 650 MPa (Figure 3.67). The regions where the
highest rmsd values between p650 and p490 are obtained correspond simultaneously to
the regions in the p650 structure with the lowest thermal b-factors (Figure 3.68A and B).
This interesting correlation indicates that the conformational state trapped at 650 MPa could
either correspond to a further stabilization of the same excited state observed at 490 MPa
or could correspond to a new state. In one hand, their very similar structures might indicate
that the conformer is only further stabilised at 650 MPa. On the other hand, the observed
differences at switch 2, especially at Q61 (Figure 3.68E), could indicate a glimpse of a new
high energy conformer, whose structural features cannot be completely uncovered at his
pressure and therefore would require a jump to higher pressures. The results obtained from
RasD33K at 880 MPa (section 3.5.4.2) indicate that this structure represents a new conformer
relative to the 650 MPa one of RasWT (Figure 3.72C), supporting the first assumption.
Attempting to correlate the HPMX features with the HP NMR data is difficult. At 250 MPa in
solution, states 1(T)/1(0) prevail. and are marked by an open conformation in which the
entire switch 1 moves away from the nucleotide assuming a position similar to the one found
in the nucleotide-free Ras•SOS complex (Figure 1.5) [44, 95, 242]. However, such large
rearrangement could not be found in any of the presently solved structures, not even at 650
MPa. The overall changes in the crystal are therefore less pronounced.
It is known from NMR and X-ray studies that not only switch 2 but also switch 1 is highly
mobile due to the transient binding of Tyr32 to the g-phosphate [51, 123]. However, many
crystal structures of RasWT•Mg2+•GppNHp show a very well defined electron density for
switch 1, with Tyr32 always contacting the g-phosphate. When this residue is found to be
distant from it (especially in structures crystallised under the P3221 space group, as 5p21),
it seems to be only because of the crystal packing constrains that force it to interact with
the g-phosphate of a symmetry-related molecule (Figure G, appendix). The same constrains
are probably also responsible for the well defined electron density of the whole switch 1,
that has therefore no spatial freedom to fluctuate. The analysis of all the refined HP
structures obtained in the present work either for RasWT and RasD33K also show the
existence of these forces between the molecules that constitute the unit cell of the crystal
(Figure G). Since hydrostatic pressure is transmitted homogeneously to the whole, infinite
and three-dimensional, crystalline system [175, 183], even a pressure as high as 650 MPa
is not enough to overcome them. The only possibility to alleviate their influence would be
the transition of the P3221 symmetry into another space group. This can indeed occur given

4. Discussion
251
that the crystal is kept under pressure during a long enough time. This relationship is an
interesting topic worth pursuing on its own in the future. Another, and perhaps easier,
possibility of approaching the problem is to attempt the direct crystallisation of Ras into a
space group different than P3221. As example, several structures were reported to
crystallise under the R32 space group, for which the movement of Tyr32 is not hindered by
the crystal packing (neither the rest of the switch regions) [60, 283]. In one of these studies
[241] the obtained crystals, still representative of a typical state 2(T) (pdb: 5b2z), were
subsequently subjected to the Humid Air and Glue-coating (HAG) crystallisation method
[284] which induced a direct transition of the lattice from state 2(T) to state 1(T) (pdb: 5b30).
In 5b30, the loss of the Thr35 and Tyr32 interaction with the g-phosphate caused a marked
deviation of switch 1 away from GppNHp which resulted in the expansion of the accessible
surface area comparatively with 5b2z. Neither the 490 nor the 650 MPa structures presently
obtained show such large movement for their switch regions.
It is important to clarify that, independent of the possible hindrances caused by crystal
packing, only subtle pressure-induced conformational changes are indeed expected in the
crystal or at least they are considered to be within our model, the true representation for
behaviour of the protein in solution. This observation is in agreement with previous studies
where a slight change in the O-P-O dihedral and torsional angles of the bound nucleotide
is sufficient to promote a conformational shift of the equilibrium given by the transient
binding of Y32 and T35 to the g-phosphate [84, 117]. To this respect, the 5b2z and 5b30
structures are very likely an extreme example for the conformational transition between
states 1(T) and 2(T) represented by a dramatic movement of the switch regions. In solution,
the protein needs to rapidly discriminate between the different partners (GEF’s, GAP’s,
effectors) and therefore both states need to be closer to each other in the conformational
landscape. In the light of this model and given the present HPMX results, the structures
refined at 490 and 650 MPa are considered to be a representation of state 1(T), contrary to
the ambient and low pressure (< 200 MPa) ones. This conclusion is obviously not definitive
and needs further evidence by solving structures at even higher pressures or by using
complementary techniques such as cryo-EM that allow the possibility of trapping the
multiple conformational states of Ras.
it is worth mention the inherent difficulties of retrieving meaningful real space refined
diffraction data of low populated conformational states. Almost all crystal structures are built
by interpreting density maps at 1σ greater than the mean electron density of the unit cell,
which is the approximate boundary between the signal from the molecule and the noise

4. Discussion
252
from the density map. The temperature factors represent a Gaussian decay of the electron
density of the modelled atoms and because they combine contributions from motions, static
disorder and model errors, their interpretation can disguise discretely disordered alternative
side-chain and main-chain conformations [285, 286]. This is especially pertinent for systems
like Ras, where rare conformational states can be easily missed. Several recently
developed methods seem to be able to tackle the problem by building many structural
models simultaneously into the electron density [99, 287, 288]. They are certainly worth to
explore in future investigations coupled to HPMX on Ras.
4.10.2 HRasD33K (1-166)•Mg2+•GppNHp
Crystal structure at Ambient Pressure
The crystal structure of RasD33K at 0.1 MPa and RT is almost identical to RasWT (section
3.5.3, Figure 3.69). The result is not altogether surprising given that the 2-state equilibria
observed in solution for RasWT is abolished in the crystal, being the typical X-ray structure
also exclusively representative of state 2(T) [28, 241, 281]. The substitution of Asp33 to Lys
did not led to drastic modifications of switch 1, which still overlays perfectly with its
counterpart in RasWT. As expected, the only significant differences lie at the intrinsically
disordered switch 2 moiety, for which the calculated b-factors are around 20 Å2 in both
proteins.
Crystal structures at High Pressure
The major features discussed in the above section 4.10.1 for RasWT are also representative
of the series on RasD33K. Unequivocal structural modifications were observed at high
pressure, especially above 500 MPa, for which a transition state of RasD33K takes place
(section 3.5.4.1). The decrease in temperature factors at 880 MPa relative to 200 and 0.1
MPa supports the conclusion that the obtained structure is indeed a higher energy
conformational and functional state of Ras (Figure 3.71). This structure could represent Ras
in state 1(T) or a transition structure through a conformational pathway that culminates with
the stabilisation of this state.
There is no direct evidence for a strict correlation between the crystal and the solution
structures [119, 120, 183]. Therefore, the 880 MPa structure could represent state 1(T) on
its own right. Additional experiments at higher pressures and the careful investigation of the
compressibility of the unit cell using short pressure intervals around the 880 MPa value
would provide an unequivocal answer about the nature of this state.

4. Discussion
253
The fact that the transition point for RasD33K occurs at higher pressures (around 500 MPa)
than RasWT (around 350 MPa) indicates that the mutant is more resistant to pressure-
modulation than the wild type variant (Figure 3.70). Indeed, the nucleotide binding pocket
of RasD33K seems to be more closed than the wild type counterpart, which might account for
the difference.
The 880 MPa structure of RasD33K also helps to further understand the functional aspects
of the conformation detected at 650 MPa for RasWT: both represent most likely the same
high energy conformer that is structurally different than the one detected at 490 MPa for the
wild type protein (Figure 3.72C). Although possible, it is very unlikely that the difference
between RasWT at p650 and RasD33K at p880 is due to the presence of the K33 mutation,
but instead due to the 230 MPa difference in pressure between both (if the mutation alone
would account for the different structural changes, these would have been also observed at
intermediate and low pressures, which is not the case).
In summary, the use of a novel Ras mutant coupled to state-of-the-art HPMX technologies
represents an unprecedented approach to tackle the rather complex dynamics of a protein
that is of capital importance to both, normal and the aberrant cellular functions. Its unique
biochemical properties and structural topography were glimpsed herein and will hopefully
help the scientific community to derive meaningful relationships and to better understand
its role as a master switch of the cell.
4.10.3 HRasWT(1-166)•Mg2+•GppNHp in Complex with Zn2+-cyclen
The volume of the unit cell at 0.1 MPa of RasWT soaked with 10 mM Zn2+-cyclen is similar
to the Apo protein at ~200-300 MPa (section 3.5.5.1, Figure 3.74). A similar relationship
can be inferred from 31P NMR since Zn2+-cyclen leads to the stabilisation of state 1(T)
(Figure 3.3) at expense of state 2(T). A shift in the same direction is obtained by 31P HP
NMR, with an associated decrease in the partial molar volume of the protein in solution
(DV= -18.60 mL mol-1, section 3.3.2.1, Figure 3.27). These relationships are only qualitative
but they are nevertheless in line with the mode of action of this drug.
Furthermore, the HP studies performed for RasWT in the presence of Zn2+-cyclen are able
to corroborate the results gathered from the HP series on the Apo protein. They show that
pressure leads unequivocally to a modification of switch 2 and the segment b2-b3 comprising
loop λ7, both being independent of the presence of Zn2+-cyclen (Figure 3.75). On the other
hand, the effect of pressure alone is not capable of inducing relevant modifications on switch
1. The same is true for Zn2+-cyclen alone, since the structures at ambient pressure in both

4. Discussion
254
series are almost identical. However, a synergistic effect seems to be achieved when both
are used at the same time: at 520 MPa a large shift of switch 1 is indeed observed and
despite cyclen not being detected, there is enough space for it around the Zn2+ ion in the
electron density map (Figure 3.76). In the light of these data, it can be assumed that the
Ras•Zn2+-cyclen complex at 520 MPa is indeed a representative structure of the
conformational state 1(T) observed in solution [125, 171].
The absence of assignable electron density for the cyclen moiety can be due to different
reasons: it can be highly mobile and therefore disordered, it can be partially obscured by
the intense scattering of the metal ion or, under very high pressures, it can dissociate from
it. In principle, the coordination to Zn2+ is very stable at ambient pressure [289]. The stability
under pressure was also confirmed by HP 31P NMR up to 200 MPa (unpublished results),
although no studies are available in the 500 MPa pressure range.
It is worth mention that no Zn2+-cyclen was observed at the second binding site coordinated
to H166 near the C-terminal region, contrary to the previous structure reported by us at
ambient pressure (pdb: 3l8y, Figure 1.10 [157]). This 2.05 Å structure was crystallised in
the H32 space group and contained 142 water molecules. The different space group (P3221
in the present case) can account for an additional difficulty for the drug to diffuse through
the crystal and bind specifically to Ras. The lower number of waters has also a direct
influence in the degree of hydration and thus in the number of solvent-accessible channels,
essential for the communication with the surrounding environment in which the crystal is
grown and through which pressure is transmitted.

5. Appendix
“The important thing in science is not so much to
obtain new facts as to discover new ways of thinking about them”
William Laurence Bragg


5. Appendix
257
5.1 Figures
Figure A. Pressure dependence of GppNHp followed by 31P NMR spectroscopy. All measurements were done at 278 K, using a Bruker Avance 600 MHz spectrometer operating at a magnetic field of 242.9 MHz. The pressure-induced chemical shift changes for a-, b- and g-phosphates, together with inorganic phosphate (Pi) were plotted as a function of pressure. In each plot the dependence for the same phosphate signal in the presence (squares) and in the absence (triangles) of Mg2+ is shown. A general trend arises from the comparison of the two situations: the magnitude of the chemical shift changes, i.e. the Dd, is always larger for the experiments done in the absence of the metal ion (see Figure 3.26 and Tables D and E). Samples were prepared by dissolving 5 mM of GppNHp in 40 mM Tris/HCl, 0.1 mM DSS, 10% D2O, with pH 9.0 and 15 mM MgCl2 (in the presence of Mg2+) or pH 11.5 and 0.5 mM EDTA (in the absence). The data points were fitted with a second order Taylor expansion.

5. Appendix
258
Figure B. Conformational equilibria of the Ras(1-166)•Mg2+•GDP selected mutants detected by 31P NMR. The mutants were created by SDM upon choosing specific residues associated with the conformational transitions derived from HP investigations. All the measurements were done at 278 K in a 202.4 MHz magnetic field (500 MHz spectrometer). The proteins were dissolved in buffer F (40 mM Tris/HCl pH 7.5, 10 mM MgCl2, 2 mM DTE) with additionally 0.2 mM DSS and 5% D2O at concentrations ranging between 0.6 and 1.5 mM.

5. Appendix
259
Figure C. Impact of Cu2+-cyclen binding to HRas(1-166)•Mg2+•GppNHp followed by 31P NMR spectroscopy. Two mutants, A. RasS39L and B. RasE3V were titrated with increasing amounts of the drug. The measurements were performed at 278 K in a 202.456 MHz magnetic field (500 MHz spectrometer) and in buffer F at pH 7.5. The initial concentrations of RasS39L and RasE3V were 1.0 and 1.86 mM, respectively. To each protein Cu2+-cyclen was added from a highly concentrated stock solution. The concentration of the drug for each step is indicated. Cu2+-cyclen binds near the g-phosphate when Ras exists only in the conformational state 1(T) and can be used as a probe to recognize this specific state, being especially useful in novel mutants where the assignment of specific states from the chemical shifts can be difficult. The state 1(T) resonance on g-phosphate becomes broadened beyond detection upon addition of low milimolar concentrations (1-4 mM), which proves its unequivocally assignment. This method is independent of mutations or the nature of the GTP analogue used. The fitted chemical shift values and linewidths are given in Table I.

5. Appendix
260
Figure D. Conformational equilibria of HRas(1-166)•Mg2+•GDP detected by 31P NMR at 278 K. All protein complexes were dissolved in buffer F (40 mM Tris/HCl pH 7.5, 10 mM MgCl2, 2 mM DTE) with additionally 0.2 mM DSS and 5-10% D2O. The final concentrations were in the range of 0.4 and 1.9 mM. 31P resonances were recorded in a magnetic field operating at a frequency of 242.896 MHz (600 MHz spectrometer) except for RasG12P, where a 202.456 MHz (500 MHz spectrometer) was used. The chemical shifts corresponding to the a- and b-phosphates of bound GDP are indicated, as well as the unbound or free (afree , bfree) nucleotide. The presence of free nucleotide results from practical aspects of the purification process, were free GDP is added to buffer D, used during last step of the purification. The presence of Pi and GMP is observed in some cases and results most likely from the time-dependent degradation of free GDP. An exponential lorentizan line broadening of 15 Hz was applied to the FID during data processing. The obtained shift values and linewidths are shown in Table 3.25, section 3.4.10.1.

5. Appendix
261
Figure E. Plot of the variation of the pressure-dependent chemical shift changes, Dd=dlast pressure
point-d0.1MPa of RasWT, RasT35S and RasD33K in complex with Mg2+•GppNHp at 278 K and pH 7.5. Each plot shows the uncorrected and corrected changes for the a- (top), b- (middle) and g-phosphates (bottom).

5. Appendix
262
Figure F. Thermodynamics of the interaction between different mutants of HRas(1-166)•Mg2+•GppNHp and the Ras binding domain of the effector protein Raf measured by ITC. All experiments were performed at 298 K in buffer F (40 mM Tris/HCl pH 7.5, 10 mM MgCl2, 2 mM DTE) with additionally 150 mM NaCl. All proteins were extensively dialyzed against this buffer. Ras was always placed in the cell of the calorimeter and Raf was always placed in the syringe. All the experiments were performed according to the default setting of the device used with a referential power of 10 µcal s-1 and a spacing between injections of 150 s or longer with a injection time of 2 s and stirring speed of 750 rpm. A total of either 19 or 31 injections of 2 µl each were applied in the determination of KD values. For each mutant tested, the raw heat of the reaction is plotted in the upper graph and the integrated heat per Ras:Raf ratio is shown in the lower graph. The signature plot is also shown with the following colour code: blue: DG, green: DH, red: -TDS. The thermograms shown here correspond to the best fitted data from a duplicate or sometimes a triplicate series of experiments, conducted for each mutant. All the data was corrected for the intrinsic heat of mixing given by buffer-in-buffer and buffer-in-protein injections (in the case of the different Ras mutants, the calibration used was relative to the heat of buffer-in-RasWT). For details see 2.2.4

5. Appendix
263
Figure F - Continuation from the previous page. Thermodynamics of the interaction between different mutants of HRas(1-166)•Mg2+•GppNHp and the Ras binding domain of the effector protein Raf measured by ITC. All experiments were performed at 298 K in buffer F (40 mM Tris/HCl pH 7.5, 10 mM MgCl2, 2 mM DTE) with additionally 150 mM NaCl. All proteins were extensively dialyzed against this buffer. Ras was always placed in the cell of the calorimeter and Raf was always placed in the syringe. All the experiments were performed according to the default setting of the device used with a referential power of 10 µcal s-1 and a spacing between injections of 150 s or longer with a injection time of 2 s and stirring speed of 750 rpm. A total of either 19 or 31 injections of 2 µl each were applied in the determination of KD values. For each mutant tested, the raw heat of the reaction is plotted in the upper graph and the integrated heat per Ras:Raf ratio is shown in the lower graph. The signature plot is also shown with the following colour code: blue: DG, green: DH, red: -TDS. The thermograms shown here correspond to the best fitted data from a duplicate or sometimes a triplicate series of experiments, conducted for each mutant. All the data was corrected for the intrinsic heat of mixing given by buffer-in-buffer and buffer-in-protein injections (in the case of the different Ras mutants, the calibration used was relative to the heat of buffer-in-RasWT). For details see experimental section 2.2.4.

5. Appendix
264
Figure G. High pressure macromolecular crystallography on HRasWT(1-166)•Mg2+•GppNHp. A. Details evidencing the coordination to the Mg2+ ion. The structures refined at pamb, 270, 490 and 650 MPa are superimposed and coloured in grey, yellow, orange and blue, respectively. The Mg2+ ion is coordinated by six atoms: S17, O1g, T35, O1b, w200 and w201. The coordination profile is virtually identical for all the recorded pressure points. The same coordination is also found in the case of the HPMX series of RasD33K. w200 is surrounded by six atoms: Mg2+, S17-OH, Og, T35-OH, D33-OH, Oa and w201 is surrounded by five atoms: Mg2+, D33-NH, Y32-OH, Ob and Og. Note that Y32, shown in the background, is establishing a polar contact with one oxygen atom from the g-phosphate of an adjacent nucleotide molecule. B. In fact, not only Y32 but most residues from the switch regions (particularly switch 1) are packed in the asymmetric unit against the neighbouring molecules. This tight packing seems to be a fundamental property of the crystallisation under the P3221 space group and is observed at all investigated pressure points. Within the obtained data, it is considered that the tight packing hinders the pressure-induced movement of the switch regions, preventing the observation of a ‘true’ open conformation, even at 650 MPa.

5. Appendix
265
Figure H. Structural comparison between crystal forms of HRasWT(1-166)•Mg2+•GppNHp obtained by conventional X-ray at 77 K obtained for states 2(T) (coloured in grey, pdb: 5b2z) and 1(T) (coloured in teal, pdb: 5b30) seemingly obtained by Shima et al. [238] with the presently refined structures at 490 MPa (red coloured) and 650 MPa )light purple). All the proteins are aligned and superimposed A. Details of the switch 1 region. Note how both HP structures are better related to 5b2z than 5b30. The specific orientation in space of important residues is evidenced (F28,Y32, D33, P34, T35, I36). B. Details of the intrinsically disordered switch 2 region, showing the different orientation of Q61 and Y64 (top). A global overview is given in the bottom (aa 60-70).

5. Appendix
266
Figure I. Structural comparison between the refined crystal structure of RasWT in the Apo form, obtained at pamb and RT (grey colour) with the one obtained from the crystals soaked with 12 mM Zn2+-cyclen (violet colour). No Zn2+ ions or the Zn2+-cyclen were observed in the electron density map of the latter structure. Details regarding the orientation of the residues comprising switch 1 and switch 2 are given in A. and B., respectively. Note how the two structures superimpose perfectly, even at the highly mobile switch 2 region. C. Structural details of Q61 and the surrounding trapped waters. In both cases Q61 binds directly to the nucleotide and no equivalent nucleophilic waters, with respect to 5p21 (w175 and w189), could be found in the density maps.

5. Appendix
267
5.2 Tables
Table A. 31P NMR chemical shift values for HRas and KRas4b•Mg2+•GppNHp proteins and their titration with the state 1(T) inhibitor Zn2+-cyclena
Protein complex p:l
a-phosphate b-phosphate g-phosphate K12
c d1(T) [ppm]
d2(T) [ppm]
d1(T) [ppm]
d2(T) [ppm]
d1(T) [ppm]
d2(T) [ppm]
FLHRasWTd -- -11.25 -11.71 -0.26 -0.16 -2.54 -3.24 1.90
+ Zn2+-cyc 1:1.7 -11.18 -11.68 -0.23b -2.55 -3.30 2.23 1:3.4 -11.17 -11.67 -0.25b -2.47 -3.35 2.02 1:7 -11.18 -11.65 -0.46 -0.22 -2.18 -3.38 1.42 1:11 -11.08 -11.63 -0.64 -0.23 -2.00 -3.48 1.17 1:15 -10.96 -11.49 -0.77 -0.22 -1.88 -3.52 0.74 1:23 -10.92 -11.58 -0.94 -0.19 -1.71 -3.56 0.42 1:30 -10.81 -11.51 -1.04 -0.05 -1.64 -3.58 0.17
FLKRasWT -- -11.27 -11.73 -0.32 -0.21 -2.58 -3.30 2.01
+ Zn2+-cyc 1:1.7 -11.21 -11.72 -0.21b -2.53 -3.29 2.28 1:3.4 -11.17 -11.67 -0.25b -2.44 -3.30 1.55 1:7 -11.08 -11.63 -0.32b -2.18 -3.35 1.09 1:11 -11.00 -11.64 -0.66 -0.22 -1.98 -3.39 0.78 1:15 -10.93 -11.59 -0.79 -0.21 -1.83 -3.43 0.57 1:23 -10.84 -11.56 -0.97 -0.23 -1.69 -3.47 0.25 1:30 -10.74 -11.46 -1.06 -0.29 -1.61 -3.51 0.21 aAll the values are presented in ppm and fitted from the experimental spectra recorded at 278 K, pH 7.5 with 10 mM MgCl2 and 2 mM DTE. The protein:ligand (p:l) equivalents from the titration steps are shown. The estimated errors from the fitting procedure are less than ± 0.05 ppm in chemical shift values. An LB= 15 Hz was applied to the FID and subtracted afterwards to the calculated linewidth values. bThe b-phosphate was fitted as a single Lorentzian line because states 1 and 2 cannot be separated. cThe equilibrium constant, K12, calculated using the population distribution on the g-phosphate, is defined as the ratio between the relative areas of state 2 and state 1: K12=[Astate 2]/[Astate 1]. The error associated with this calculation is ± 0.2 due to the partial overlapping of the resonance lines.
Table B. 31P NMR chemical shift values and linewidths for the protein-drug complex HRasWT(1-189)•Mg2+•GppNHp•Zn2+-cyclen and the displacement upon Raf-RBD titration.
Protein complex
p:l a-phosphate b-phosphate g-phosphate
d1(T) d2(T) d1(T) d2(T) d1(T) d2(T) HRasWT -11.27 -11.73 -0.26 -0.16 -2.60 -3.30 + Zn2+-cyc 1:32 -10.92 -11.56 -1.01 -0.03 -1.64 -3.59 + Raf-RBD 1:0.4 -10.92 -11.60 -0.86 -0.16 -1.79 -3.54 1:0.8 -10.93 -11.61 -0.89 -0.19 -1.80 -3.57 1:1.2 -10.96 -11.62 -0.89 -0.17 -1.76 -3.56 1:1.5 -- -11.61 -- -0.19 -- -3.56 a-phosphate b-phosphate g-phosphate Dn1/2 (1) Dn1/2 (2) Dn1/2 (1) Dn1/2 (2) Dn1/2 (1) Dn1/2 (2) HRasWT 136.4 80.5 40.9 56.2 94.6 58.5 + Zn2+-cyc 1:32 107.1 105.2 71.4 75.3 54.5 73.3 + Raf-RBD 1:0.4 105.4 81.6 72.4 83.7 56.4 65.5 1:0.8 121.0 114.3 69.3 79.8 57.2 64.2 1:1.2 112.4 110.0 78.0 89.3 51.8 60.8 1:1.5 -- 127.3 -- 62.5 -- 43.4 All values are determined from the spectra recorded at 278 K and pH 7.5 upon proper deconvolution of the spectral lines. The estimated error for the chemical shifts and linewidths is is ± 0.015 ppm and 0.18 Hz, respectively.

5. Appendix
268
Table C. 31P NMR chemical shift values and linewidths for the protein-drug complex KRasG12D•Mg2+•GppNHp•Zn2+-cyclen and the displacement upon Raf-RBD titration. Protein Complex p:l
a-phosphate b-phosphate g-phosphate K12 d1(T)
[ppm] d2(T) [ppm]
d1(T) [ppm]
d2(T) [ppm]
d1(T) [ppm]
d2(T) [ppm]
KRasG12D -11.41 -11.71 -0.38 -2.48 -3.54 0.70 + Zn2+-cyc 1:0.5 -11.37 -11.65 -0.39 -2.45 -3.53 0.71 1:1.5 -11.37 -11.68 -0.37 -2.40 -3.51 0.69 1:5.0 -11.22 -11.50 -0.44 -2.12 -3.60 0.51 1:9.0 -11.24 -11.62 -0.45 -1.70 -3.62 0.36 a-phosphate b-phosphate g-phosphate Dn1/2 1(T)
[Hz] Dn1/2 2(T)
[Hz] Dn1/2 1(T)
[Hz] Dn1/2 2(T)
[Hz] Dn1/2 1(T)
[Hz] Dn1/2 2(T)
[Hz]
KRasG12D 82.6 87.1 72.6 160.3 78.0 + Zn2+-cyc 1:0.5 92.2 89.7 67.8 145.9 68.6 1:1.5 72.8 86.8 74.8 158.5 77.1 1:5.0 60.5 127.6 66.4 196.0 88.7 1:9.0 86.4 80.0 82.6 190.2 79.0 All values are determined from the spectra recorded at 278 K and pH 7.5 upon proper deconvolution of the spectral lines. The estimated error for the chemical shifts and linewidths is is ± 0.015 ppm and 0.18 Hz, respectively. An LB= 15 Hz was applied to the FID and subtracted afterwards to the calculated linewidth values.
Table D. 31P pressure-dependent chemical shift values and linewidths of the Mg2+•GppNHp nucleotide. Pressure
[MPa] a-phosphate b-phosphate g-phosphate Pi d
[ppm] Dn1/2 [Hz]
d [ppm]
Dn1/2 [Hz]
d [ppm]
Dn1/2 [Hz]
d [ppm]
Dn1/2 [Hz]
0.1 -10.091 29.63 -5.602 54.25 -1.082 24.56 2.554 6.16 10 -10.096 29.97 -5.617 53.52 -1.093 24.87 2.551 9.35 20 -10.096 29.98 -5.631 53.05 -1.105 24.94 2.546 6.98 30 -10.096 29.78 -5.638 55.19 -1.114 25.10 2.540 4.60 40 -10.092 30.06 -5.648 54.11 -1.125 24.78 2.539 4.83 50 -10.096 30.11 -5.665 55.36 -1.138 24.82 2.535 5.25 60 -10.096 30.47 -5.678 55.25 -1.149 24.57 2.531 4.46 70 -10.098 30.31 -5.688 54.48 -1.157 23.83 2.527 5.95 80 -10.097 30.39 -5.703 57.59 -1.170 24.58 2.521 6.55 90 -10.099 30.55 -5.713 54.15 -1.179 24.14 2.520 4.48 100 -10.100 30.64 -5.732 55.57 -1.189 24.17 2.517 6.09 110 -10.104 30.71 -5.748 54.53 -1.202 23.36 2.512 4.57 120 -10.099 30.68 -5.753 55.81 -1.208 22.93 2.509 3.42 130 -10.107 30.86 -5.774 56.08 -1.218 22.90 2.506 3.59 140 -10.116 30.85 -5.793 53.89 -1.230 22.84 2.504 4.19 150 -10.106 30.85 -5.795 54.71 -1.236 22.92 2.502 3.74 160 -10.109 30.61 -5.811 56.57 -1.246 22.37 2.500 4.95 170 -10.114 31.02 -5.826 54.66 -1.255 22.32 2.499 3.46 180 -10.111 31.50 -5.829 56.60 -1.260 22.30 2.499 4.33 190 -10.116 31.22 -5.834 56.86 -1.260 22.04 2.500 3.95 200 -10.119 31.50 -5.848 56.86 -1.268 21.91 2.496 3.38 0.1 -10.090 29.52 -5.600 54.28 -1.081 25.79 2.551 7.97 All values are determined from the spectra recorded at 278 K and pH 9.0. The artificial Lorentzian broadening of 4 Hz applied to the FID was subtracted from the final linewidth values presented here. An LB= 4 Hz was applied to the FID and subtracted afterwards to the calculated linewidth values.

5. Appendix
269
Table E. 31P pressure-dependent chemical shift values of the GppNHp nucleotide in the absence of Mg2+.
Pressure a-phosphate b-phosphate g-phosphate Pi [MPa] d /ppm d /ppm d /ppm d
0.1 -10.44 -7.56 -0.68 4.28 10 -10.45 -7.59 -0.71 4.27 20 -10.46 -7.61 -0.74 4.27 30 -10.47 -7.63 -0.77 4.26 40 -10.47 -7.65 -0.80 4.26 50 -10.48 -7.67 -0.82 4.25 60 -10.49 -7.69 -0.84 4.25 70 -10.49 -7.71 -0.87 4.24 80 -10.50 -7.72 -0.89 4.24 90 -10.50 -7.73 -0.91 4.24 100 -10.50 -7.75 -0.93 4.24 110 -10.51 -7.76 -0.95 4.24 120 -10.51 -7.77 -0.96 4.24 130 -10.51 -7.78 -0.98 4.23 140 -10.51 -7.79 -0.99 4.23 150 -10.52 -7.79 -1.01 4.23 160 -10.52 -7.80 -1.02 4.23 170 -10.52 -7.81 -1.03 4.23 180 -10.52 -7.81 -1.05 4.23 190 -10.52 -7.82 -1.06 4.23 200 -10.52 -7.82 -1.07 4.23 210 -10.52 -7.83 -1.08 4.23 0.1 -10.44 -7.56 -0.68 4.28 All values are determined from the spectra recorded at 278 K and pH 11.5.
Table G. Uncorrected and corrected 31P NMR pressure-dependent chemical shift values of HRasT35S(1-166)•Mg2+•GppNHp recorded at 278 K and pH 7.5.
Pressure
[MPa]
a-phosphate b-phosphate g-phosphate Pi d [ppm]
uncorrected d [ppm]
corrected d [ppm]
uncorrected d [ppm]
corrected d [ppm]
uncorrected d [ppm]
corrected d
[ppm] 0.1 -10,971 -10,971 -0,324 -0,324 -2,540 -2,540 2,388
10 -10,960 -10,960 -0,330 -0,316 -2,542 -2,530 2,392 25 -10,952 -10,951 -0,332 -0,298 -2,545 -2,515 -- 40 -10,944 -10,942 -0,337 -0,283 -2,550 -2,502 2,397 50 -10,936 -10,933 -0,340 -0,273 -2,554 -2,495 2,397 60 -10,927 -10,923 -0,345 -0,264 -2,557 -2,487 2,397 70 -10,923 -10,918 -0,347 -0,254 -2,559 -2,478 2,395 80 -10,919 -10,913 -0,349 -0,242 -2,560 -2,469 2,395 90 -10,914 -10,907 -0,353 -0,233 -2,561 -2,459 2,392
100 -10,912 -10,904 -0,355 -0,223 -2,561 -2,450 2,388 110 -10,909 -10,900 -0,360 -0,215 -2,560 -2,440 2,386 120 -10,907 -10,896 -0,362 -0,204 -2,560 -2,430 2,382 130 -10,906 -10,893 -0,365 -0,195 -2,559 -2,420 2,379 140 -10,905 -10,891 -0,368 -0,186 -2,558 -2,410 2,376 150 -10,904 -10,889 -0,371 -0,177 -2,558 -2,402 2,371 160 -10,906 -10,888 -0,373 -0,167 -2,557 -2,393 2,368 170 -10,906 -10,886 -0,377 -0,159 -2,556 -2,384 2,364 180 -10,905 -10,883 -0,383 -0,152 -2,554 -2,375 2,360 190 -10,905 -10,881 -0,387 -0,145 -2,552 -2,366 2,356 0.1 -10.969 -10.969 -0.317 -0.3224 -2.536 -2.540 2.305
All the uncorrected values were determined by processing the FID with a proper Gaussian function. The corrected values were obtained by simple addition or subtraction of Ddfreenuc fit to the duncorrected from the protein.

5. Appendix
270
Table F. Uncorrected and corrected 31P NMR pressure-dependent chemical shift values of HRasWT(1-166)•Mg2+•GppNHp recorded at 278 K and pH 7.5.
Pressure
[MPa]
a-phosphate b-phosphate g-phosphate Pi
[ppm] d1(T) [ppm]
d2(T) [ppm]
d [ppm]
d1(T) [ppm]
d2(T [ppm])
Uncorrected 0.1 -11.195 -11.641 -0.238 -2.517 -3.326 2.359
10 -11.157 -11.646 -0.247 -2.520 -3.309 2.370 20 -11.120 -11.652 -0.254 -2.525 -3.292 2.363 30 -11.109 -11.648 -0.257 -2.530 -3.272 2.370 40 -11.085 -11.640 -0.262 -2.538 -3.252 2.374 50 -11.072 -11.628 -0.272 -2.540 -3.238 2.376 60 -11.057 -11.625 -0.277 -2.541 -3.219 2.380 70 -11.028 -11.619 -0.286 -2.540 -3.197 2.380 80 -11.010 -11.612 -0.290 -2.541 -3.183 2.380 90 -11.005 -11.599 -0.291 -2.540 -3.167 2.382
100 -10.986 -11.592 -0.296 -2.539 -3.146 2.380 110 -10.984 -11.583 -0.306 -2.539 -3.130 2.379 120 -10.971 -11.589 -0.315 -2.539 -3.105 2.380 130 -10.954 -11.584 -0.321 -2.538 -3.099 2.376 140 -10.942 -11.581 -0.327 -2.536 -3.074 2.372 150 -10.927 -11.576 -0.335 -2.535 -3.061 2.370 160 -10.927 -11.571 -0.345 -2.532 -3.052 2.365 170 -10.904 -11.573 -0.349 -2.528 -3.035 2.363 180 -10.904 -11.579 -0.359 -2.525 -3.009 2.358 190 -10.891 -11.578 -0.363 -2.522 -2.998 2.355 200 -10.886 -11.576 -0.372 -2.519 -2.981 2.350 210 -10.877 -11.580 -0.379 -2.516 -2.957 2.345 220 -10.860 -- -0.388 -2.512 -2.961 2.342 230 -10.854 -- -0.392 -2.509 -2.942 2.336 240 -10.844 -- -0.403 -2.505 -2.931 2.330 250 -10.845 -- -0.420 -2.502 -2.908 2.326 0.1 -11.142 -11.638 -0.248 -2.514 -3.325 2.322
Pressure a-phosphate b-phosphate g-phosphate
MPa d1(T) [ppm]
d2(T) [ppm]
d [ppm]
d1(T) [ppm]
d2(T) [ppm] --
Corrected 0.1 -11,195 -11,641 -0,238 -2,517 -3,326
10 -11,156 -11,645 -0,233 -2,508 -3,297 20 -11,119 -11,651 -0,226 -2,500 -3,268 30 -11,108 -11,647 -0,216 -2,494 -3,236 40 -11,083 -11,638 -0,207 -2,490 -3,204 50 -11,069 -11,626 -0,204 -2,481 -3,179 60 -11,053 -11,621 -0,197 -2,471 -3,149 70 -11,024 -11,614 -0,192 -2,459 -3,116 80 -11,004 -11,607 -0,183 -2,450 -3,091 90 -10,998 -11,592 -0,172 -2,439 -3,065
100 -10,977 -11,584 -0,163 -2,427 -3,034 110 -10,974 -11,573 -0,161 -2,418 -3,010 120 -10,961 -11,578 -0,157 -2,409 -2,975 130 -10,941 -11,572 -0,151 -2,399 -2,960 140 -10,928 -11,567 -0,145 -2,389 -2,926 150 -10,911 -11,561 -0,140 -2,380 -2,906 160 -10,909 -11,553 -0,138 -2,368 -2,888 170 -10,885 -11,554 -0,130 -2,357 -2,863 180 -10,882 -11,557 -0,128 -2,346 -2,830 190 -10,868 -11,554 -0,121 -2,336 -2,812 200 -10,860 -11,550 -0,119 -2,326 -2,787 210 -10,849 -11,551 -0,113 -2,316 -2,757 220 -10,829 -0,111 -2,306 -2,755 230 -10,821 -0,104 -2,297 -2,730 240 -10,808 -0,104 -2,287 -2,713 250 -10,806 -0,110 -2,279 -2,684 0.1 -11,195 -0,238 -2,517 -3,326
All the uncorrected values were determined by processing the FID with a proper Gaussian function. The corrected values were obtained by simple addition or subtraction of Ddfreenuc fit to the duncorrected from the protein.

5. Appendix
271
Table H. Uncorrected and corrected 31P NMR pressure-dependent chemical shift values of KRasG12V(1-189)•Mg2+•GTP recorded at 278 K and pH 7.5.
Pressure [MPa]
a-phosphate b-phosphate g-phosphate Pi
[ppm] d1(T) [ppm]
d2(T) [ppm]
d1(T) [ppm]
d2(T) [ppm]
d1(T) [ppm]
d2(T) [ppm]
Uncorrected 1.0 -- -11,532 -- -14,699 -6,004 -7,471 --
50 -- -11,513 -15,102 -14,739 -6,100 -7,453 2,365 70 -- -11,498 -15,152 -14,754 -6,130 -7,426 2,374
100 -- -11,466 -15,191 -14,779 -6,199 -7,384 2,354 125 -- -11,457 -15,251 -14,786 -6,248 -7,358 2,350 132 -11,150 -11,443 -15,256 -14,793 -6,260 -7,341 2,355 150 -11,142 -11,449 -15,301 -14,807 -6,280 -7,321 2,347 160 -11,101 -11,443 -15,310 -14,819 -6,309 -7,299 2,347 172 -11,116 -11,425 -15,307 -14,823 -6,330 -7,257 2,337 185 -11,101 -11,433 -15,311 -14,842 -6,347 -7,220 2,325 195 -11,047 -11,416 -15,318 -14,850 -6,371 -7,176 -- 1.0 -- -11.539 -- -14.712 -5.989 -7.422 --
a-phosphate b-phosphate g-phosphate d1(T)
[ppm] d2(T) [ppm]
d1(T) [ppm]
d2(T) [ppm]
d1(T) [ppm]
d2(T) [ppm]
--
Corrected 1.0 -- -11,532 -- -14,695 -6,002 -7,473
50 -- -11,488 -14,880 -14,517 -5,999 -7,554 70 -- -11,464 -14,851 -14,454 -5,993 -7,562
100 -- -11,418 -14,782 -14,370 -6,013 -7,570 125 -- -11,399 -14,762 -14,297 -6,026 -7,581 132 -11,089 -11,382 -14,746 -14,284 -6,028 -7,573 150 -11,074 -11,380 -14,741 -14,247 -6,025 -7,576 160 -11,029 -11,371 -14,724 -14,233 -6,043 -7,566 172 -11,040 -11,348 -14,692 -14,208 -6,050 -7,537 185 -11,020 -11,353 -14,666 -14,198 -6,053 -7,514 195 -10,963 -11,331 -14,652 -14,184 -6,068 -7,480 1.0 -- -11.532 -- -14.695 -6.068 -7.480
All the uncorrected values were determined by processing the FID with a proper Gaussian function. The corrected values were obtained by simple addition or subtraction of Ddfreenuc fit to the duncorrected from the protein.

5. Appendix
272
Table I. 31P NMR chemical shift values and linewidths for the protein-drug interaction HRasS39L•Mg2+•GppNHp and HRasE3V•Mg2+•GppNHp with Cu2+-cyclena.
Protein complex p:l
a-phosphate b-phosphate g-phosphate K12
c d1(T) [ppm]
d2(T) [ppm]
d1(T),2(T) [ppm]
d1(T) [ppm]
d2(T) [ppm]
HRasS39L -- -11.08 -11.67 -0.25 -2.50 -3.35 1.5 + Cu2+-cyc 1:2 -11.01 -11.66 -0.27 -2.94 -3.36 1.9 1:4 -11.07 -11.67 -0.28 -- -3.35 -- HRasE3V -- -11.23 -11.68 -0.27 -2.59 -3.33 2.0 + Cu2+-cyc 1:0.5 -11.18 -11.66 -0.28 -3.01 -3.33 -- 1:1 -11.18 -11.67 -0.29 -- -3.36 -- 1.2 -11.17 -11.67 -0.29 -- -3.37 -- a-phosphate b-phosphate g-phosphate Dn1/2 1(T)
[Hz] Dn1/2 2(T)
[Hz] Dn1/2 1(T),2(T)
[Hz] Dn1/2 1(T)
[Hz] Dn1/2 2(T)
[Hz] --
HRasS39L -- 98.05 62.88 42.55 48.95 50.82 + Cu2+-cyc 1:2 87.36 61.37 48.47 163.72 47.21 1:4 122.88 45.45 58.38 -- 78.83 HRasE3V -- 122.22 67.33 54.39 78.74 53.00 + Cu2+-cyc 1:0.5 122.82 60.23 56.97 250 44.95 1:1 118.73 67.05 61.55 -- 61.55 1:2 117.31 74.55 70.00 -- 62.18 aAll the values fitted from the experimental spectra recorded at 278 K, with 40 mM Tris/HCl pH 7.5, 10 mM MgCl2, 2 mM DTE, 0.2 mM DSS and 5% D2O. The protein:ligand (p:l) equivalents from the titration steps are shown. The estimated errors from the fitting procedure are less than ± 0.02 ppm in chemical shift values for the g-phosphate. bThe b-phosphate was fitted as a single Lorentzian line because states 1 and 2 cannot be separated. An LB= 15 Hz was applied to the FID and subtracted afterwards from the final fitted linewidth values. cThe equilibrium constant, K12, calculated using the population distribution on the g-phosphate, is defined as the ratio between the relative areas of state 2 and state 1: K12=[Astate 2]/[Astate 1]. The error associated with this calculation is ± 0.2 due to the partial overlapping of the resonance lines.

5. Appendix
273
Table J. Uncorrected and corrected 31P NMR pressure-dependent chemical shift values (in ppm) of HRasD33K(1-166)•Mg2+•GppNHp recorded at 278 K and pH 7.5.
Pressure [MPa]
a-phosphate b-phosphate g-phosphate Pi [ppm] d1(T)/2(T)
[ppm] d1(T),2(T)
[ppm] d1(T) [ppm]
d2(T) [ppm]
Uncorrected 0.1 -11.496 -0.285 -- -3.397 --
10 -11.490 -0.291 -- -3.386 -- 20 -11.460 -0.301 -- -3.369 1.884 30 -11.444 -0.308 -- -3.356 1.870 40 -11.435 -0.312 -- -3.345 1.859 50 -11.401 -0.318 -- -3.331 1.844 60 -11.367 -0.321 -- -3.310 1.838 70 -11.352 -0.325 -- -3.295 1.826 80 -11.324 -0.331 -2.497 -3.277 1.818 90 -11.308 -0.336 -2.498 -3.265 1.809
100 -11.270 -0.343 -2.494 -3.252 1.797 110 -11.246 -0.347 -2.484 -3.237 1.785 120 -11.221 -0.347 -2.480 -3.221 1.779 130 -11.200 -0.351 -2.477 -3.211 1.771 140 -11.171 -0.356 -2.468 -3.193 1.759 150 -11.148 -0.360 -2.459 -3.180 1.750 160 -11.130 -0.364 -2.455 -3.171 1.741 170 -11.104 -0.367 -2.454 -3.161 1.734 180 -11.074 -0.366 -2.450 -3.147 1.725 190 -11.064 -0.368 -2.448 -3.137 1.724 200 -11.036 -0.371 -2.443 -3.123 1.716 0.1 -11.498 -0.285 -- -3.396 --
Pressure
[MPa] a-phosphate b-phosphate g-phosphate d1(T) [ppm]
d2(T) [ppm]
d [ppm]
d1(T) [ppm]
d2(T) [ppm]
--
Corrected 0.1 -11.496 -0.285 -- -3.397
10 -11.490 -0.278 -- -3.373 20 -11.460 -0.274 -- -3.345 30 -11.443 -0.267 -- -3.319 40 -11.433 -0.258 -- -3.297 50 -11.398 -0.250 -- -3.271 60 -11.364 -0.240 -- -3.240 70 -11.348 -0.231 -- -3.214 80 -11.319 -0.224 -2.406 -3.186 90 -11.301 -0.216 -2.396 -3.164
100 -11.262 -0.211 -2.383 -3.141 110 -11.237 -0.202 -2.363 -3.116 120 -11.210 -0.189 -2.350 -3.091 130 -11.188 -0.181 -2.338 -3.072 140 -11.156 -0.174 -2.321 -3.045 150 -11.132 -0.165 -2.303 -3.025 160 -11.112 -0.158 -2.291 -3.007 170 -11.085 -0.149 -2.283 -2.989 180 -11.052 -0.136 -2.271 -2.968 190 -11.040 -0.126 -2.262 -2.951 200 -11.010 -0.117 -2.250 -2.930 0.1 -11.496 -0.285 -- -3.397
All the uncorrected values were determined by processing the FID with a proper Gaussian function. The corrected values were obtained by simple addition or subtraction of Ddfreenuc fit to the duncorrected from the protein.

5. Appendix
274
5.3 List of Figures
1. Introduction Figure 1.1. Topology of the G Domain .............................................................................................. 5 Figure 1.2. HRas•Mg2+•GppNHp as the prototype of the G domain ................................................. 6 Figure 1.3. The switch mechanism in three dimensions .................................................................... 7 Figure 1.4. Schematics of the main Ras signaling pathways ............................................................ 8 Figure 1.5. Structural insights on the Ras•SOS complex (pdb: 1bkd) ............................................. 10 Figure 1.6. General architecture of effector proteins ....................................................................... 12 Figure 1.7. Molecular mechanism of the phosphoryl transfer reaction ............................................ 15 Figure 1.8. Dynamics of the switch regions ..................................................................................... 16 Figure 1.9. 31P NMR spectroscopy on HRas•Mg2+•GppNHp proteins ............................................ 19 Figure 1.10. Electron density map showing the coordination of Zn2+-cyclen at the C-terminus of RasWT (pdb: 3l8y) ............................................................................................................................. 23 Figure 1.11. Physics of high pressure applied to biomolecules ....................................................... 24 Figure 1.12. 31P HP NMR spectroscopy. Acquisition and instrumentation ...................................... 25 Figure 1.13. Pressure dependence of the conformational transitions ............................................. 26 Figure 1.14. Instrumentation for HPMX ........................................................................................... 28
2. Methods Figure 2.1. Overview of the PCR reaction used for the creation of Ras mutants ............................ 48 Figure 2.2. Schematics of the experimental setup for the purification of Ras proteins from a 10 L cell culture ............................................................................................................................................... 55 Figure 2.3. Representative Ras elution profile from IEX using a NaCl step gradient with volume fractionation ...................................................................................................................................... 56 Figure 2.4. General schematics of the AKTA FPLC system ............................................................ 57 Figure 2.5. Terminal structure of Glutathione Sepharose. ............................................................... 59 Figure 2.6. ITC as a method to probe molecular interactions .......................................................... 70

5. Appendix
275
3. Results Figure 3.1. Conformational equilibria of human H and KRas proteins detected by 31P NMR spectroscopy .................................................................................................................................... 86 Figure 3.2. Interaction between RasWT•Mg2+•GppNHp and the effector kinase Raf-RBD studied by ITC .................................................................................................................................................... 88 Figure 3.3. Titration of RasWT•Mg2+•GppNHp with Zn2+-cyclen followed by 31P NMR spectroscopy .................................................................................................................................... 90 Figure 3.4. Displacement of Zn2+-cyclen from HRasWT upon titration with Raf-RBD followed by 31P NMR spectroscopy ........................................................................................................................... 92 Figure 3.5. Comparison between the 31P NMR spectra of GTP-bound FLKRasWT, KRasG12D and KRasG12V ........................................................................................................................................... 93 Figure 3.6. Titration of KRasG12D(1-188)•Mg2+•GppNHp with Zn2+-cyclen followed by 31P NMR at 278 K ....................................................................................................................................................... 95 Figure 3.7. Influence of 6% DMSO on the conformational equilibria of KRasG12D•Mg2+•GppNHp .. 98 Figure 3.8. Titration of KRasG12D•Mg2+•GppNHp with compound #643 .......................................... 99 Figure 3.9. Titration of KRasG12D•Mg2+•GppNHp with compound #098 .......................................... 99 Figure 3.10. Titration of KRasG12D•Mg2+•GppNHp with compound #727 ...................................... 100 Figure 3.11. Titration of KRasG12D•Mg2+•GppNHp with compound #703 ...................................... 101 Figure 3.12. Titration of KRasG12D•Mg2+•GppNHp with compound #449 ...................................... 101 Figure 3.13. Titration of KRasG12D•Mg2+•GppNHp with compound #701 ...................................... 102 Figure 3.14. Titration of KRasG12D•Mg2+•GppNHp with compound #109 ...................................... 103 Figure 3.15. Titration of KRasG12D•Mg2+•GppNHp with compound #755 ...................................... 103 Figure 3.16. Titration of KRasG12D•Mg2+•GppNHp with the effector Raf-RBD in the presence of the compound #755 followed by ITC .................................................................................................... 105 Figure 3.17. Titration of KRasG12D•Mg2+•GppNHp with compound #757 ...................................... 106 Figure 3.18. Titration of KRasG12D•Mg2+•GppNHp with Raf-RBD in the presence of the compound #757 followed by ITC ...................................................................................................................... 107 Figure 3.19. Titration of KRasG12D•Mg2+•GppNHp with compound #307 ...................................... 108 Figure 3.20. Titration of KRasG12D•Mg2+•GppNHp with compound #308 ...................................... 108 Figure 3.21. Titration of KRasG12D•Mg2+•GppNHp with compound #612 ...................................... 109 Figure 3.22. Titration of KRasG12D•Mg2+•GppNHp with compound #613 ...................................... 110 Figure 3.23. Titration of KRasG12D•Mg2+•GppNHp with compound #623 ...................................... 111 Figure 3.24. Titration of KRasG12D•Mg2+•GppNHp with compound #616 ...................................... 112

5. Appendix
276
Figure 3.25. Titration of KRasG12D•Mg2+•GppNHp with Raf-RBD in the presence of the compound #616 followed by ITC ...................................................................................................................... 112 Figure 3.26. Pressure dependence of GppNHp in the presence (A) and in the absence (B) of Mg2+ followed by 31P NMR spectroscopy ................................................................................................ 116 Figure 3.27. Conformational equilibria of HRasWT(1-166)•Mg2+•GppNHp as a function of pressure determined by 31P NMR ................................................................................................................. 119 Figure 3.28. Correlation of the chemical shift values obtained upon fitting with an exponential filter (LB= 10 Hz) and with a Gaussian filter (selected LB and GB depending on the 31P signals) ........ 120 Figure 3.29. Corrected pressure dependence of 31P chemical shifts of HRasWT(1-166)•Mg2+•GppNHp recorded at 278 K .......................................................................................... 122 Figure 3.30. Plot of LnK12=Astate2(T)/Astate1(T) as a function of pressure for RasWT•Mg2+•GppNHp .. 124 Figure 3.31. Conformational equilibria of HRasWT(1-166)•Mg2+•GppNHp as a function of pressure determined by 31P NMR at 303 K ................................................................................................... 125 Figure 3.32. 31P NMR uncorrected chemical shift changes of HRasWT(1-166)•Mg2+•GppNHp as a function of pressure at 303 K ......................................................................................................... 126 Figure 3.33. Conformational equilibria of HRasT35S(1-166)•Mg2+•GppNHp as a function of pressure determined by 31P NMR at 278 K ................................................................................................... 128 Figure 3.34. 31P NMR corrected and uncorrected chemical shift changes of HRasT35S(1-166)•Mg2+•GppNHp as a function of pressure recorded at 278 K ................................................. 129 Figure 3.35. Conformational equilibria of KRasG12V(1-188)•Mg2+•GTP as a function of pressure determined by 31P NMR at 278 K ................................................................................................... 133 Figure 3.36. Corrected and uncorrected pressure dependence of 31P chemical shifts for KRasG12V(1-188)•Mg2+•GTP recorded at 278 K ................................................................................................ 135 Figure 3.37. Plot of LnK12 as a function of pressure for KRasG12V(1-188)•Mg2+•GTP ................... 136 Figure 3.38. Conformational equilibria of RasWT(1-166)•Mg2+•GppNHp detected by 31P NMR spectroscopy and thermodynamics of association with Raf-RBD detected by ITC ........................ 141 Figure 3.39. Protein complex formation between HRasWT(1-166)•Mg2+•GppNHp and NF1 followed by 31P NMR spectroscopy at 278 K ................................................................................................ 144 Figure 3.40. Localization on the RasWT•Mg2+•GppNHp surface of the amino acid residues Asn26, His94 and Ala66 that were subjected to SDM ................................................................................ 147 Figure 3.41. Conformational equilibria of the Ras•Mg2+•GppNHp selected mutants H94D, A66T and N26K detected by 31P NMR at 278 K, 202.4 MHz and pH 7.5 ....................................................... 149 Figure 3.42. Conformational equilibria of the Ras•Mg2+•GTP selected mutants H94D, A66T and N26K detected by 31P NMR at 278 K, 202.4 MHz and pH 7.5 ....................................................... 149 Figure 3.43. Determination of the intrinsic GTPase activity of HRas(1-166)•Mg2+•GTP by HPLC at 310 K .............................................................................................................................................. 151 Figure 3.44. Localization on the HRasWT•Mg2+•GppNHp surface the amino acid residues Ser39 and Glu3 that were subjected to SDM ................................................................................................... 153

5. Appendix
277
Figure 3.45. Effect of the mutated residues sensing the conformational transition 2(T)-to-1(0) in the equilibrium dynamics of the bound nucleotide A. Ras•Mg2+•GppNHp (S39L 1.0 mM, 3000 scans; E3V 1.8 mM, 3000 scans) and B. Ras•Mg2+•GTP (S39L 1.0 mM, 3000 scans; E3V 1.5 mM, 2000 scans) ............................................................................................................................................. 154 Figure 3.46. Localization on the HRasWT•Mg2+•GppNHp surface the amino acid residues His27 and Asp33 that were subjected to SDM ................................................................................................ 157 Figure 3.47. Effect of the mutated residues sensing the conformational transition 2(T)-to-3(T) in the equilibrium dynamics of the bound nucleotide A. Ras•Mg2+•GppNHp (H27E 1.57 mM, 2600 scans; D33K 3.0 mM, 800 scans, T35S 0.75 mM 2000 scans) and B. Ras•Mg2+•GTP (H27E 0.8 mM, 3000 scans; D33K 2.94 mM, 3000 scans) .............................................................................................. 158 Figure 3.48. Determination of the intrinsic GTPase activity of the GTP-bound mutants RasH27E and RasD33K by HPLC at 310K .............................................................................................................. 160 Figure 3.49. 31P NMR spectroscopy on the titration of HRasH27E•Mg2+•GppNHp with the effector Raf-RBD measured at 278 K and pH 7.5 .............................................................................................. 161 Figure 3.50. 31P NMR spectroscopy on the titration of HRasD33K•Mg2+•GppNHp with the effector Raf-RBD measured at 278 K and pH 7.5 .............................................................................................. 163 Figure 3.51. Protein complex formation between RasD33K•Mg2+•GppNHp and NF1 followed by 31P NMR spectroscopy at 278 K ........................................................................................................... 166 Figure 3.52. T1 relaxation times in HRas(1-166)•Mg2+•GppNHp measured at 278 K ................... 169 Figure 3.53. Conformational equilibria of HRasD33K(1-166)•Mg2+•GppNHp as a function of pressure determined by 31P NMR at 278 K ................................................................................................... 172 Figure 3.54. Corrected and uncorrected pressure dependence of 31P chemical shifts of HRasD33K(1-166)•Mg2+•GppNHp recorded at 278 K .......................................................................................... 173 Figure 3.55. Plot of LnK12 as a function of pressure in RasD33K•Mg2+•GppNHp (-¿-) ................... 174 Figure 3.56. Nano differential scanning fluorimetry (nanoDSF) performed for the wild type Ras•Mg2+•GppNHp protein and three selected mutants: D33K, T35A and T35S ......................... 176 Figure 3.57. [1H-15N]-HSQC temperature series on HRas(1-166)•Mg2+•GppNHp ........................ 179 Figure 3.58. Conformational dynamics of RasG12P, RasG12V, RasT35S and RasG12V/T35S investigated by 31P NMR spectroscopy at 278 K ..................................................................................................... 182 Figure 3.59. Determination of the intrinsic GTPase activity of RasG12P, RasG12V
, RasG12V/T35S and RasT35S by HPLC at 310 K .............................................................................................................. 185 Figure 3.59. 31P NMR spectroscopy on the titration of HRasG12P•Mg2+•GppNHp with the effector Raf-RBD measured at 278 K ................................................................................................................ 187 Figure 3.61. Protein complex formation between RasG12P•Mg2+•GppNHp and NF1 followed by 31P NMR spectroscopy at 278 K ........................................................................................................... 189 Figure 3.62. 31P NMR spectroscopy on the titration of HRasG12V/T35S•Mg2+•GppNHp with the effector Raf-RBD measured at 278 K .......................................................................................................... 192
5. Appendix
278
Figure 3.63. Refined crystal structure of HRasWT(1-166)•Mg2+•GppNHp obtained at ambient pressure and room temperature (coloured in cyan) and comparison with one of the representative structures from Pai et al [12], pdb: 5p21, recorded at 277 K (coloured in grey) ............................. 194 Figure 3.64. Compressibility curve obtained for the HP series on HRasWT(1-166)•Mg2+•GppNHp at RT ................................................................................................................................................... 197 Figure 3.65. HPMX on HRasWT(1-166)•Mg2+•GppNHp at RT ....................................................... 202 Figure 3.66. Structural details of RasWT(1-166)•Mg2+•GppNHp obtained at 270 MPa (coloured in yellow) and comparison with pamb (coloured in grey) and the 200 MPa structure (coloured in green)........................................................................................................................................................ 203 Figure 3.67. Structural details of RasWT(1-166)•Mg2+•GppNHp obtained at 490 MPa (coloured in orange) and comparison with pamb (coloured in grey) and the 270 MPa structure (coloured in yellow)........................................................................................................................................................ 203 Figure 3.68. Structural details of RasWT(1-166)•Mg2+•GppNHp obtained at 650 MPa (coloured in blue) and comparison with pamb (coloured in grey) and with the 490 MPa structure (coloured in orange) ........................................................................................................................................... 204 Figure 3.69. Refined crystal structure of HRasD33K(1-166)•Mg2+•GppNHp obtained at pamb and RT (coloured in green) and comparison with the wild type protein obtained in the same conditions (coloured in grey) ........................................................................................................................... 205 Figure 3.70. A. Compressibility curve obtained for the HP series on HRasD33K(1-166)•Mg2+•GppNHp at RT ............................................................................................................................................... 207 Figure 3.71. HPMX on HRasD33K(1-166)•Mg2+•GppNHp at RT ..................................................... 210 Figure 3.72. HP X-ray crystallography on RasD33K(1-166)•Mg2+•GppNHp .................................... 211 Figure 3.73. HP X-ray crystallography on RasD33K(1-166)•Mg2+•GppNHp. A. rmsd plot of p200 against pamb (orange line), p880 against p200 (black line) and p880 against pamb (blue line). B. Plot of the b-factors for pamb and p880 ......................................................................................... 211 Figure 3.74. Compressibility curve obtained for the HP series on HRasWT(1-166)•Mg2+•GppNHp crystals soaked with 10-12 mM Zn2+-cyclen at RT (orange coloured line) ..................................... 213 Figure 3.75. HPMX on HRasWT(1-166)•Mg2+•GppNHp at RT complexed with the small inhibitor Zn2+-cyclen ............................................................................................................................................. 216 Figure 3.76. HP X-ray crystallography on RasWT(1-166)•Mg2+•GppNHp complexed with Zn2+-cyclen. Rmsd and b-factor plots for the pamb and p520 structures ........................................................... 217
4. Discussion Figure 4.1. Typical mode of action of Zn2+-cyclen and other state 1(T) inhibitors ......................... 222 Figure 4.2. Comparative plot of the obtained equilibrium constants, K12=Astate2(T)/Astate1(T), for the g-phosphate of KRasG12D•Mg2+•GppNHp in the presence of 15 compounds at 1.5 mM (grey colour) and 3.0 mM (orange colour) ........................................................................................................... 225 Figure 4.3. 31P chemical shift variation of Pi plotted as a function of pressure for Mg2+•GppNHp (black), RasWT (blue) and RasT35S (green) ...................................................................................... 235

5. Appendix
279
Figure 4.4. 31P pressure-dependent chemical shift changes of RasWT and RasT35S and RasD33K in complex with Mg2+•GppNHp recorded at 278 K, pH 7.5 ................................................................ 236 Figure 4.5. 31P NMR spectra of the different Ras mutants bound to Mg2+•GppNHp, created by SDM for the study of the conformational dynamics of Ras ..................................................................... 239 Figure 4.6. Interplay between the four different conformational states of Ras proteins ................ 240 Figure 4.7. Structural basis for the interaction of RasWT and RasD33K with Raf-RBD ..................... 246
5. Appendix Figure A. Pressure dependence of GppNHp followed by 31P NMR spectroscopy ........................ 257 Figure B. Conformational equilibria of the Ras(1-166)•Mg2+•GDP selected mutants detected by 31P NMR ............................................................................................................................................... 258 Figure C. Impact of Cu2+-cyclen binding to HRas(1-166)•Mg2+•GppNHp followed by 31P NMR spectroscopy. Two mutants, A. RasS39L and B. RasE3V were titrated with increasing amounts of the drug ................................................................................................................................................ 259 Figure D. Conformational equilibria of HRas(1-166)•Mg2+•GDP detected by 31P NMR at 278 K . 260 Figure E. Plot of the variation of the pressure-dependent chemical shift changes, Dd=dlast pressure point-d0.1MPa of RasWT, RasT35S and RasD33K in complex with Mg2+•GppNHp at 278 K and pH 7.5 ......... 261 Figure F. Thermodynamics of the interaction between different mutants of HRas(1-166)•Mg2+•GppNHp and the Ras binding domain of the effector protein Raf measured by ITC. .. 262 Figure G. High pressure macromolecular crystallography on HRasWT(1-166)•Mg2+•GppNHp ..... 264 Figure H. Structural comparison between crystal forms of HRasWT•Mg2+•GppNHp obtained by conventional X-ray at 77 K obtained for states 2(T) (coloured in grey, pdb: 5b2z) and 1(T) (coloured in teal, pdb: 5b30) seemingly obtained by Shima et al. [238] with the presently refined structures at 490 MPa (red coloured) and 650 MPa) light purple) ...................................................................... 265 Figure I. Structural comparison between the refined crystal structure of RasWT in the Apo form, obtained at pamb and RT (grey colour) with the one obtained from the crystals soaked with 10-12 mM Zn2+-cyclen (violet colour) ........................................................................................................ 266

5. Appendix
280
6.4 List of Tables
2. Methods Table 2.1. Primers used in site-directed-mutagenesis to obtain the respective mutants ................. 34 Table 2.2. List of the enzymes used ................................................................................................ 38 Table 2.3. List of protein and DNA ladders used ............................................................................. 38 Table 2.4. Commonly used buffer solutions ..................................................................................... 38 Table 2.5. List of commonly used expendable materials ................................................................. 38 Table 2.6. Most often used chromatography columns ..................................................................... 39 Table 2.7. Main instrumentation used in this thesis ......................................................................... 39 Table 2.8. Most commonly used software ....................................................................................... 40
3. Results
Table 3.1. 31P chemical shift values and linewidths for RasWT(1-188/189)•Mg2+•GppNHp complexes and their titration with the effector Raf-RBD ..................................................................................... 87 Table 3.2. 31P NMR chemical shift values and linewidths of the full length (1-188/189) Mg2+•GTP-bound protein complexes KRasWT, KRasG12D and KRasG12V ............................................................ 94 Table 3.3. 31P NMR chemical shift values for KRasG12D(1-188)•Mg2+•GppNHp in 6% DMSO and in complex with a library of 15 different inhibitors .............................................................................. 113 Table 3.4. 31P NMR linewidths for KRasG12D(1-188)•Mg2+•GppNHp in 6% DMSO and in complex with a library of 15 different inhibitors .................................................................................................... 114 Table 3.5. Pressure dependence of 31P chemical shifts of GppNHp in the presence and in the absence of Mg2+ and respective pressure coefficients ................................................................... 117 Table 3.6. Fitted pressure coefficients and thermodynamic molar free energies, DG, and volumes, DV, for HRasWT(1-166)•Mg2+•GppNHp at 278 K and pH 7.5 ......................................................... 123 Table 3.7. Fitted pressure coefficients and thermodynamic molar free energies, DG, and volumes, DV, for HRasWT(1-166)•Mg2+•GppNHp at 303 K and pH 7.5 ......................................................... 126 Table 3.8. Fitted pressure coefficients and thermodynamic molar free energies, DG, and volumes, DV, for HRasT35S(1-166)•Mg2+•GppNHp at 278 K and pH 7.5 ........................................................ 131 Table 3.9. Fitted pressure coefficients and thermodynamic molar free energies, DG, and volumes, DV, for KRasG12V(1-188)•Mg2+•GTP at 278 K and pH 7.5 .............................................................. 137 Table 3.10. List of amino acid residues according to the associated conformational transition as determined by HP NMR and the ones chosen for SDM ................................................................. 139 Table 3.11. 31P NMR chemical shift values and linewidths for the truncated wild type isoforms of H, K and NRas in complex with Mg2+•GppNHp .................................................................................. 142

5. Appendix
281
Table 3.12. 31P NMR chemical shift values (in ppm) and linewidths (in Hz) for the protein-protein complex HRasWT(1-166)•Mg2+•GppNHp•NF1 ............................................................................... 145 Table 3.13. 31P NMR chemical shift values and linewidths obtained for the different mutants of HRas(1-166). The mutated residues are involved in the conformational transition 2(T)-to-1(T) .... 150 Table 3.14. Thermodynamics of interaction between HRas•Mg2+•GppNHp and Raf-RBD measured by ITC and intrinsic GTPase activities measured by HPLC on the HRas•Mg2+•GTP complex ..... 152 Table 3.15. 31P NMR chemical shift values and linewidths obtained for the different mutants of HRas(1-166). The mutated residues were selectively chosen according to their involvement in the pressure modulated 2(T)-to-1(0) conformational transition ............................................................ 155 Table 3.16. Thermodynamics of interaction between HRas•Mg2+•GppNHp and Raf-RBD measured by ITC and intrinsic GTPase activities measured by HPLC in the HRas•Mg2+•GTP complex ....... 156 Table 3.17. 31P NMR chemical shift values and linewidths obtained for the different mutants of HRas(1-166). The mutated residues were selectively chosen according to their involvement in the pressure modulated 2(T)-to-3(T) conformational transition ............................................................ 159 Table 3.18. Thermodynamics of interaction between HRas•Mg2+•GppNHp and Raf-RBD measured by ITC and intrinsic GTPase activities measured by HPLC in the HRas•Mg2+•GTP complex ....... 160 Table 3.19. 31P NMR chemical shift values and linewidths for the protein-protein complex HRasH27E(1-166)•Mg2+•GppNHp•Raf-RBD .................................................................................... 162 Table 3.20. 31P NMR chemical shift values and linewidths for the protein-protein complex HRasD33K(1-166)•Mg2+•GppNHp•Raf-RBD .................................................................................... 164 Table 3.21. 31P NMR chemical shift values and linewidths for the protein-protein complex HRasWT(1-166)•Mg2+•GppNHp•NF1 ............................................................................................................... 167 Table 3.22. Phosphorous T1 relaxation times in the HRas(1-166)•Mg2+•GppNHp complexes ...... 169 Table 3.23. Fitted pressure coefficients and thermodynamic molar free energies, DG, and volumes, DV, for HRasD33K(1-166)•Mg2+•GppNHp at 278 K and pH 7.5 ....................................................... 175 Table 3.24. Melting temperatures experimentally obtained for HRas(1-166)•Mg2+•GppNHp by nanoDSF ........................................................................................................................................ 176 Table 3.25. 31P NMR chemical shift values and linewidths obtained for the different mutants of HRas(1-166) ................................................................................................................................... 184 Table 3.26. Thermodynamics of interaction between HRas•Mg2+•GppNHp and Raf-RBD measured by ITC and intrinsic GTPase activities measured by HPLC in the HRas•Mg2+•GTP complex ....... 186 Table 3.27. 31P NMR chemical shift values and linewidths for the protein-protein complex HRasG12P(1-166)•Mg2+•GppNHp•Raf-RBD .................................................................................... 187 Table 3.28. 31P NMR chemical shift values and linewidths for the protein-protein complex HRasG12P(1-166)•Mg2+•GppNHp•NF1 ........................................................................................... 190 Table 3.29. 31P NMR chemical shift values and linewidths for the protein-protein complex HRasG12V/T35S(1-166)•Mg2+•GppNHp•Raf-RBD .............................................................................. 191

5. Appendix
282
5. Appendix Table A. 31P NMR chemical shift values for HRas and KRas4b•Mg2+•GppNHp complexes and their titration with the state 1(T) inhibitor Zn2+-cyclen ............................................................................. 267 Table B. 31P NMR chemical shift values (in ppm) and linewidths (in Hz) for the protein-drug complex HRasWT(1-189)•Mg2+•GppNHp•Zn2+-cyclen and the displacement upon Raf-RBD titration .......... 267 Table C. 31P NMR chemical shift values (in ppm) and linewidths (in Hz) for the protein-drug complex KRasG12D•Mg2+•GppNHp•Zn2+-cyclen and the displacement upon Raf-RBD titration ................... 268 Table D. 31P pressure-dependent chemical shift values (in ppm) and linewidths (in Hz) of the Mg2+•GppNHp nucleotide ............................................................................................................... 268 Table E. 31P pressure-dependent chemical shift values (in ppm) GppNHp nucleotide in the absence of Mg2+ ............................................................................................................................................ 269 Table F. Uncorrected and corrected 31P NMR pressure-dependent chemical shift values (in ppm) of HRasWT(1-166)•Mg2+•GppNHp recorded at 278 K and pH 7.5 ...................................................... 270 Table G. Uncorrected and corrected 31P NMR pressure-dependent chemical shift values (in ppm) of HRasT35S(1-166)•Mg2+•GppNHp recorded at 278 K and pH= 7.5 .................................................. 269 Table H. Uncorrected and corrected 31P NMR pressure-dependent chemical shift values (in ppm) of KRasG12V(1-189)•Mg2+•GTP recorded at 278 K and pH 7.5 ........................................................... 271 Table I. 31P NMR chemical shift values (in ppm) and linewidths (in Hz) for the protein-drug interaction HRasS39L•Mg2+•GppNHp and HRasE3V•Mg2+•GppNHp with Cu2+-cyclen ....................................... 272 Table J. Uncorrected and corrected 31P NMR pressure-dependent chemical shift values (in ppm) of HRasD33K(1-166)•Mg2+•GppNHp recorded at 278 K and pH 7.5 .................................................... 272

5. Appendix
283
5.5 List of Abbreviations AP alkaline phosphatase APS ammonium persulfate Arf ADP ribosilation factor bp base pair BSA bovine serum albumin c truncated ca. circa CCD charge coupled device Cdc25 cell division cycle 25 CFC cardio-facio-cutaneous CM carboxymethyl CS costello syndrome Cu2+-cyclen copper cyclen CV column volume DAC diamond anvil cell DEAE diethylaminoethanol DACH diacylglycerol DFT density Functional Theory DMSO dimethyl Sulfoxide DNA desoxyribonucleic acid DTE dithioerithrol DSS 4,4-dimethyl-4-silapentane-1-sulfonic acid E. coli. Escherichia coli EDTA ethylenediaminetetracetic acid e.g. exempli gratia EM exponential Multiplication ERK extracellular signal-regulated kinase ESRF European Synchrotron Radiation Facility EtBr ethidium bromide EtOH ethanol eV electron volt FID free induction decay FL full length FPLC fast protein liquid chromatography FTI farnesyl transferase inhibitor G Gibbs free Energy (the variation is denoted DG) GAP GTPase Activating Protein GB Gaussian broadening GDP guanosine diphosphate GdmCl guanidinium hydrochloride GEF guanine Exchange Factor GM Gaussian multiplication GNBP guanine nucleotide binding protein GPa giga pascal GppNHp 5'-Guanylyl imidodiphosphate Grb2 growth factor receptor-bound protein 2 GSK3b glycogen synthase kinase 3b GSH reduced glutathione GST glutathione S-transferase GTP guanosine triphosphate H enthalpy (the variation is denoted DH) HP high pressure HPLC high performance liquid chromatography HPMX high pressure macromolecular crystallography HSQC heteronuclear single quantum coherence HVR hypervariable region

5. Appendix
284
IC inhibitory concentration ie. id est IEX ion exchange chromatography IPTG isopropyl b-d-1-thiogalactopyranoside ITC isothermal titration calorimetry J joule K kelvin kcal kilocalorie kDa kilo Dalton kJ kilo joule L litre LB lysogeny Broth LCMS liquid chromatography Mass spectrometry M molar MAPK mitogen activated protein kinase MD molecular dynamics MeOH methanol MHz mega Hertz min minute MLV murine leukemia virus mM milimolar MM minimal medium MPa mega pascal MR molecular replacement MST microscale thermophoresis NAG N-acetyl glucosamine NAM N-acetyl muramic acid NF1 neurofibromatin 1 ng nanogram NMM new minimal medium NMR nuclear Magnetic Resonance NTA nitrilotriacetic acid OD optical density Pa pascal pamb ambient pressure PCR polymerase chain reaction Pdb protein data bank PEG polyethylene glycol PET polyethylene terephthalate Pi inorganic phosphate PI3K phosphoinositide 3 kinase pM picomolar PMSF phenylmethanesulphonylfluoride ppm parts per million QCM quartz crystal microbalance QM quantum mechanics Rab ras in the brain Raf-RBD rapidly accelerated fibrosarcoma Ras binding domain RalGDF ras-like protein Ran ras in the nucleus Rap receptor associated protein Rho ras homologous Rmsd root mean square deviation RPLC reversed phase liquid chromatography rpm rotations per minute RT room temperature RTK receptor tyrosine kinase S entropy (the variation is denoted DS)

5. Appendix
285
s second SAM S-adenosyl methionine SDM site directed mutagenesis SDS-PAGE sodium dodecyl sulphate Polyacrylamide Gel Electrophoresis SEC size exclusion chromatography Shc src homology SOC super optimal broth with catabolite repression SOS Son of Sevenless SP sulphopropyl SPR surface Plasmon Resonance sw1 switch 1 sw2 switch 2 T temperature (the variation is denoted DT) T1 longitudinal relaxation TAE tris-acetate-EDTA TB terrific broth TBE tris-borate-EDTA TEMED tetramethylethylinediamine TFB transformation buffer Tris tris(hydroxymethil)aminomethane TROSY transverse relaxation optimized spectroscopy µM micromolar WT wild type Zn2+-BPA zinc-bisphenol acid Zn2+-cyclen zinc-cyclen Conventions: throughout this thesis, all the amino acid names are abbreviated either by their three letter code (e.g. Asp33) or by their single letter (D33). Both are often used interchangeably. The commonly used abbreviation for the switch 1 and switch 2 regions is switch 1 and switch 2, respectively. However, the equivalent abbreviations SW I and SW II were sometimes used in the captions of several Figures.

5. Appendix
286
5.6 List of Publications
M Spoerner, M Karl, P Lopes, M Hoering, K Loeffel, A Nuehs, J Adelsberger, W Kremer
and H Kalbitzer. High pressure 31P NMR spectroscopy on guanine nucleotides. J Biomol
NMR. 2017 61(1), pp 1-13.
M Marques, D Gianolio, G Cibin, J Tomkinson, S Parker, R. Valero, P Lopes and L.
Carvalho. A molecular view of cisplatin's mode of action: interplay with DNA bases and
acquired resistance. Phys Chem Chem Phys. 2015 17(14), pp 5155-5171.
I Rosnizeck, D Filchtinski, P Lopes, B Kieninger, C Herrmann, H Kalbitzer and M Spoerner.
Elucidating the Mode of Action of a Typical Ras State 1(T) Inhibitor. Biochem. 2014 53(24),
pp 3867-3878.
P Lopes, M Marques, R Valero, J Tomkinson and L. Carvalho. Guanine: A Combined Study
Using Vibrational Spectroscopy and Theoretical Methods. Spectrosc-INT J. 2012 5(27), pp
273-292.
C. Matos, L. Carvalho, P. Lopes and M Marques. New Strategies Against Prostate Cancer
– Pt(II)-Based Chemotherapy. Curr Med Chem. 2012 19(27), pp 4678-4687.
P Lopes, R Valero, J Tomkinson, M Marques and L Batista de Carvalho. Applying
vibrational spectroscopy to the study of nucleobases – adenine as a case study. New J
Chem. 2013 37(9), pp 2691-2699.

6. References
“It takes a long time to understand nothiing”
Edward Dahlberg


6. References
289
1. Harvey, J.J., An Unidentified Virus which causes the Rapid Production of Tumours in Mice. Nature, 1964. 204(4963): p. 1104-1105.
2. Kirsten, W.H. and L.A. Mayer, Morphologic Responses to a Murine Erythroblastosis Virus2. JNCI: Journal of the National Cancer Institute, 1967. 39(2): p. 311-335.
3. Shimizu, K., et al., Isolation and Preliminary Characterization of the Transforming Gene of a Human Neuroblastoma Cell Line. Proceedings of the National Academy of Sciences of the United States of America, 1983. 80(2): p. 383-387.
4. Milroy, L.-G. and C. Ottmann, The Renaissance of Ras. ACS Chemical Biology, 2014. 9(11): p. 2447-2458.
5. Wittinghofer, A., Ras Superfamily Small G Proteins: Biology and Mechanisms 1: General Features, Signaling. 2014: Springer Vienna.
6. Willumsen, B.M., et al., The p21 ras C-terminus is required for transformation and membrane association. Nature, 1984. 310(5978): p. 583-586.
7. Ahearn, I.M., et al., Regulating the regulator: post-translational modification of RAS. Nat Rev Mol Cell Biol, 2012. 13(1): p. 39-51.
8. Wang, M. and P.J. Casey, Protein prenylation: unique fats make their mark on biology. Nat Rev Mol Cell Biol, 2016. 17(2): p. 110-122.
9. Shen, M., et al., Farnesyltransferase and geranylgeranyltransferase I: structures, mechanism, inhibitors and molecular modeling. Drug Discovery Today, 2015. 20(2): p. 267-276.
10. de Vos, A.M., et al., Three-dimensional structure of an oncogene protein: catalytic domain of human c-H-ras p21. Science, 1988. 239(4842): p. 888.
11. Pai, E.F., et al., Structure of the guanine-nucleotide-binding domain of the Ha-ras oncogene product p21 in the triphosphate conformation. Nature, 1989. 341(6239): p. 209-214.
12. Pai, E., et al., Refined crystal structure of the triphosphate conformation of H-ras p21 at 1.35 A resolution: implications for the mechanism of GTP hydrolysis. Vol. 8. 1990.
13. Saraste, M., P.R. Sibbald, and A. Wittinghofer, The P-loop: a common motif in ATP- and GTP-binding proteins. Trends in Biochemical Sciences, 1990. 15(11): p. 430-434.
14. Vetter, I.R. and A. Wittinghofer, The Guanine Nucleotide-Binding Switch in Three Dimensions. Science, 2001. 294(5545): p. 1299.
15. Wittinghofer, A. and H. Waldmann, Ras—A Molecular Switch Involved in Tumor Formation. Angewandte Chemie International Edition, 2000. 39(23): p. 4192-4214.
16. Wittinghofer, A. and I.R. Vetter, Structure-Function Relationships of the G Domain, a Canonical Switch Motif. Annual Review of Biochemistry, 2011. 80(1): p. 943-971.

6. References
290
17. Lu, S., et al., Drugging Ras GTPase: a comprehensive mechanistic and signaling structural view. Chemical Society Reviews, 2016. 45(18): p. 4929-4952.
18. Maurer, T., et al., Small-molecule ligands bind to a distinct pocket in Ras and inhibit SOS-mediated nucleotide exchange activity. Proceedings of the National Academy of Sciences, 2012. 109(14): p. 5299-5304.
19. Banerjee, A., et al., The disordered hypervariable region and the folded catalytic domain of oncogenic K-Ras4B partner in phospholipid binding. Current Opinion in Structural Biology, 2016. 36(Supplement C): p. 10-17.
20. Chavan, Tanmay S., et al., High-Affinity Interaction of the K-Ras4B Hypervariable Region with the Ras Active Site. Biophysical Journal. 109(12): p. 2602-2613.
21. Castellano, E. and E. Santos, Functional Specificity of Ras Isoforms: So Similar but So Different. Genes & Cancer, 2011. 2(3): p. 216-231.
22. Hu, J.-S. and A.G. Redfield, Conformational and Dynamic Differences between N-ras P21 Bound to GTPγS and to GMPPNP as Studied by NMR. Biochemistry, 1997. 36(16): p. 5045-5052.
23. Scheidig, A.J., C. Burmester, and R.S. Goody, The pre-hydrolysis state of p21ras in complex with GTP: new insights into the role of water molecules in the GTP hydrolysis reaction of ras-like proteins. Structure, 1999. 7(11): p. 1311-S2.
24. Farnsworth, C.L. and L.A. Feig, Dominant inhibitory mutations in the Mg(2+)-binding site of RasH prevent its activation by GTP. Molecular and Cellular Biology, 1991. 11(10): p. 4822-4829.
25. Farrar, C.T., C.J. Halkides, and D.J. Singel, The frozen solution structure of p21 ras determined by ESEEM spectroscopy reveals weak coordination of Thr35 to the active site metal ion. Structure, 1997. 5(8): p. 1055-1066.
26. Schweins, T., et al., The role of the metal ion in the p21ras catalysed GTP-hydrolysis: Mn2+ versus Mg2+11Edited by K. Nagai. Journal of Molecular Biology, 1997. 266(4): p. 847-856.
27. Rudack, T., et al., The Role of Magnesium for Geometry and Charge in GTP Hydrolysis, Revealed by Quantum Mechanics/Molecular Mechanics Simulations. Biophysical Journal, 2011. 103(2): p. 293-302.
28. Lu, S., et al., Ras Conformational Ensembles, Allostery, and Signaling. Chemical Reviews, 2016. 116(11): p. 6607-6665.
29. Wittinghofer, A. and E.F. Pal, The structure of Ras protein: a model for a universal molecular switch. Trends in Biochemical Sciences, 1991. 16(Supplement C): p. 382-387.
30. Milburn, M.V., et al., Molecular switch for signal transduction: structural differences between active and inactive forms of protooncogenic ras proteins. Science, 1990. 247(4945): p. 939.
31. Bos, J.L., H. Rehmann, and A. Wittinghofer, GEFs and GAPs: Critical Elements in the Control of Small G Proteins. Cell, 2007. 129(5): p. 865-877.

6. References
291
32. Rajalingam, K., et al., Ras oncogenes and their downstream targets. Biochimica et Biophysica Acta (BBA) - Molecular Cell Research, 2007. 1773(8): p. 1177-1195.
33. Nakhaeizadeh, H., et al., The RAS-Effector Interface: Isoform-Specific Differences in the Effector Binding Regions. PLOS ONE, 2016. 11(12): p. e0167145.
34. Takashima, A. and D.V. Faller, Targeting the RAS oncogene. Expert Opinion on Therapeutic Targets, 2013. 17(5): p. 507-531.
35. Kolch, W., Meaningful relationships: the regulation of the Ras/Raf/MEK/ERK pathway by protein interactions. Biochemical Journal, 2000. 351(2): p. 289.
36. Lenzen, C., et al., Kinetic Analysis by Fluorescence of the Interaction between Ras and the Catalytic Domain of the Guanine Nucleotide Exchange Factor Cdc25Mm Biochemistry, 1998. 37(20): p. 7420-7430.
37. Cherfils, J. and M. Zeghouf, Regulation of Small GTPases by GEFs, GAPs, and GDIs. Physiological Reviews, 2013. 93(1): p. 269.
38. Hennig, A., et al., Ras activation revisited: role of GEF and GAP systems, in Biological Chemistry. 2015. p. 831.
39. Cherfils, J. and P. Chardin, GEFs: structural basis for their activation of small GTP-binding proteins. Trends in Biochemical Sciences, 1999. 24(8): p. 306-311.
40. Chardin, P., et al., Human Sos1: a guanine nucleotide exchange factor for Ras that binds to GRB2. Science, 1993. 260(5112): p. 1338.
41. Vo, U., et al., Monitoring Ras Interactions with the Nucleotide Exchange Factor Son of Sevenless (Sos) Using Site-specific NMR Reporter Signals and Intrinsic Fluorescence. Journal of Biological Chemistry, 2016. 291(4): p. 1703-1718.
42. Li, N., et al., Guanine-nucleotide-releasing factor hSos1 binds to Grb2 and links receptor tyrosine kinases to Ras signalling. Nature, 1993. 363(6424): p. 85-88.
43. Fam, N.P., et al., Cloning and characterization of Ras-GRF2, a novel guanine nucleotide exchange factor for Ras. Molecular and Cellular Biology, 1997. 17(3): p. 1396-1406.
44. Boriack-Sjodin, P.A., et al., The structural basis of the activation of Ras by Sos. Nature, 1998. 394(6691): p. 337-343.
45. Margarit, S.M., et al., Structural Evidence for Feedback Activation by Ras·GTP of the Ras-Specific Nucleotide Exchange Factor SOS. Cell, 2003. 112(5): p. 685-695.
46. Hall, B.E., et al., Structure-based Mutagenesis Reveals Distinct Functions for Ras Switch 1 and Switch 2 in Sos-catalyzed Guanine Nucleotide Exchange. Journal of Biological Chemistry, 2001. 276(29): p. 27629-27637.
47. Marshall, C.J., Ras effectors. Current Opinion in Cell Biology, 1996. 8(2): p. 197-204.
48. McCormick, F. and A. Wittinghofer, Interactions between Ras proteins and their effectors. Current Opinion in Biotechnology, 1996. 7(4): p. 449-456.

6. References
292
49. Vigil, D., et al., Ras superfamily GEFs and GAPs: validated and tractable targets for cancer therapy? Nat Rev Cancer, 2010. 10(12): p. 842-857.
50. Koide, H., et al., GTP-dependent association of Raf-1 with Ha-Ras: identification of Raf as a target downstream of Ras in mammalian cells. Proceedings of the National Academy of Sciences, 1993. 90(18): p. 8683-8686.
51. Spoerner, M., et al., Dynamic properties of the Ras switch I region and its importance for binding to effectors. Proceedings of the National Academy of Sciences, 2001. 98(9): p. 4944-4949.
52. Herrmann, C., G.A. Martin, and A. Wittinghofer, Quantitative Analysis of the Complex between p21 and the Ras-binding Domain of the Human Raf-1 Protein Kinase. Journal of Biological Chemistry, 1995. 270(7): p. 2901-2905.
53. Cutler, R.E., et al., Autoregulation of the Raf-1 serine/threonine kinase. Proceedings of the National Academy of Sciences of the United States of America, 1998. 95(16): p. 9214-9219.
54. Hmitou, I., et al., Differential Regulation of B-Raf Isoforms by Phosphorylation and Autoinhibitory Mechanisms. Molecular and Cellular Biology, 2007. 27(1): p. 31-43.
55. Roskoski, R., RAF protein-serine/threonine kinases: Structure and regulation. Biochemical and Biophysical Research Communications, 2010. 399(3): p. 313-317.
56. Fischer, A., et al., B- and C-RAF Display Essential Differences in Their Binding to Ras: The Isotope Specific N Terminus OF B-RAF Facilitates Ras Binding. Journal of Biological Chemistry, 2007. 282(36): p. 26503-26516.
57. Matallanas, D., et al., Raf Family Kinases: Old Dogs Have Learned New Tricks. Genes & Cancer, 2011. 2(3): p. 232-260.
58. Filchtinski, D., et al., What Makes Ras an Efficient Molecular Switch: A Computational, Biophysical, and Structural Study of Ras-GDP Interactions with Mutants of Raf. Journal of Molecular Biology, 2010. 399(3): p. 422-435.
59. Huang, L., et al., Three-dimensional structure of the Ras-interacting domain of RalGDS. Nat Struct Mol Biol, 1997. 4(8): p. 609-615.
60. Nassar, N., et al., The 2.2 A crystal structure of the Ras-binding domain of the serine/threonine kinase c-Raf1 in complex with RaplA and a GTP analogue. Nature, 1995. 375(6532): p. 554-560.
61. Akasaka, K., et al., Differential Structural Requirements for Interaction of Ras Protein with Its Distinct Downstream Effectors. Journal of Biological Chemistry, 1996. 271(10): p. 5353-5360.
62. Winkler, D.G., et al., Identification and Characterization of Mutations in Ha-Ras That Selectively Decrease Binding to cRaf-1. Journal of Biological Chemistry, 1997. 272(39): p. 24402-24409.
63. Terada, T., et al., Nuclear magnetic resonance and molecular dynamics studies on the interactions of the ras-binding domain of raf-1 with wild-type and mutant ras

6. References
293
proteins 11Edited by A. R. Fersht. Journal of Molecular Biology, 1999. 286(1): p. 219-232.
64. Fetics, Susan K., et al., Allosteric Effects of the Oncogenic RasQ61L Mutant on Raf-RBD. Structure, 2015. 23(3): p. 505-516.
65. Gohlke, H., L.A. Kuhn, and D.A. Case, Change in protein flexibility upon complex formation: Analysis of Ras-Raf using molecular dynamics and a molecular framework approach. Proteins: Structure, Function, and Bioinformatics, 2004. 56(2): p. 322-337.
66. Gohlke, H., C. Kiel, and D.A. Case, Insights into Protein–Protein Binding by Binding Free Energy Calculation and Free Energy Decomposition for the Ras–Raf and Ras–RalGDS Complexes. Journal of Molecular Biology, 2003. 330(4): p. 891-913.
67. Spoerner, M., et al., Conformational States of Human Rat Sarcoma (Ras) Protein Complexed with Its Natural Ligand GTP and Their Role for Effector Interaction and GTP Hydrolysis. Journal of Biological Chemistry, 2010. 285(51): p. 39768-39778.
68. Gorman, C., et al., Equilibrium and Kinetic Measurements Reveal Rapidly Reversible Binding of Ras to Raf. Journal of Biological Chemistry, 1996. 271(12): p. 6713-6719.
69. Sydor, J.R., et al., Transient Kinetic Studies on the Interaction of Ras and the Ras-Binding Domain of c-Raf-1 Reveal Rapid Equilibration of the Complex. Biochemistry, 1998. 37(40): p. 14292-14299.
70. Goldfinger, L.E., Choose your own path: specificity in Ras GTPase signaling. Molecular BioSystems, 2008. 4(4): p. 293-299.
71. Hekman, M., et al., Novel C-Raf phosphorylation sites: serine 296 and 301 participate in Raf regulation. FEBS Letters, 2005. 579(2): p. 464-468.
72. Schweins, T., et al., Substrate-assisted catalysis as a mechanism for GTP hydrolysis of p21ras and other GTP-binding proteins. Nat Struct Mol Biol, 1995. 2(1): p. 36-44.
73. Wittinghofer, A., K. Scheffzek, and M.R. Ahmadian, The interaction of Ras with GTPase-activating proteins. FEBS Letters, 1997. 410(1): p. 63-67.
74. Matte, A., L.W. Tari, and L.T.J. Delbaere, How do kinases transfer phosphoryl groups? Structure, 1998. 6(4): p. 413-419.
75. Wittinghofer, A., Phosphoryl transfer in Ras proteins, conclusive or elusive? Trends in Biochemical Sciences, 2006. 31(1): p. 20-23.
76. Lassila, J.K., J.G. Zalatan, and D. Herschlag, Biological Phosphoryl-Transfer Reactions: Understanding Mechanism and Catalysis. Annual Review of Biochemistry, 2011. 80(1): p. 669-702.
77. Maegley, K.A., S.J. Admiraal, and D. Herschlag, Ras-catalyzed hydrolysis of GTP: a new perspective from model studies. Proceedings of the National Academy of Sciences of the United States of America, 1996. 93(16): p. 8160-8166.

6. References
294
78. Shutes, A. and C.J. Der, Real‐Time In Vitro Measurement of Intrinsic and Ras GAP‐Mediated GTP Hydrolysis, in Methods in Enzymology. 2006, Academic Press. p. 9-22.
79. Rensland, H., et al., Is there a rate-limiting step before GTP cleavage by H-ras p21? Biochemistry, 1991. 30(46): p. 11181-11185.
80. Wittinghofer, A., Signaling mechanistics: Aluminum fluoride for molecule of the year. Current Biology, 1997. 7(11): p. R682-R685.
81. Sternweis, P.C. and A.G. Gilman, Aluminum: a requirement for activation of the regulatory component of adenylate cyclase by fluoride. Proceedings of the National Academy of Sciences of the United States of America, 1982. 79(16): p. 4888-4891.
82. Graham, D.L., et al., MgF3− as a Transition State Analog of Phosphoryl Transfer. Chemistry & Biology, 2002. 9(3): p. 375-381.
83. Scheffzek, K., et al., The Ras-RasGAP Complex: Structural Basis for GTPase Activation and Its Loss in Oncogenic Ras Mutants. Science, 1997. 277(5324): p. 333.
84. Rudack, T., et al., Ras and GTPase-activating protein (GAP) drive GTP into a precatalytic state as revealed by combining FTIR and biomolecular simulations. Proceedings of the National Academy of Sciences, 2012. 109(38): p. 15295-15300.
85. Kötting, C., et al., The GAP arginine finger movement into the catalytic site of Ras increases the activation entropy. Proceedings of the National Academy of Sciences of the United States of America, 2008. 105(17): p. 6260-6265.
86. Miao, W., et al., p120 Ras GTPase-activating Protein Interacts with Ras-GTP through Specific Conserved Residues. Journal of Biological Chemistry, 1996. 271(26): p. 15322-15329.
87. Glennon, T.M., J. Villà, and A. Warshel, How Does GAP Catalyze the GTPase Reaction of Ras?: A Computer Simulation Study. Biochemistry, 2000. 39(32): p. 9641-9651.
88. Sharma, N., U. Sonavane, and R. Joshi, Probing the wild-type HRas activation mechanism using steered molecular dynamics, understanding the energy barrier and role of water in the activation. European Biophysics Journal, 2014. 43(2): p. 81-95.
89. Lu, S., et al., The Structural Basis of Oncogenic Mutations G12, G13 and Q61 in Small GTPase K-Ras4B. 2016. 6: p. 21949.
90. Scrima, A., et al., The Rap–RapGAP complex: GTP hydrolysis without catalytic glutamine and arginine residues. The EMBO Journal, 2008. 27(7): p. 1145-1153.
91. Seewald, M.J., et al., RanGAP mediates GTP hydrolysis without an arginine finger. Nature, 2002. 415(6872): p. 662-666.
92. Kraulis, P.J., et al., Solution Structure and Dynamics of Ras p21.cntdot.GDP Determined by Heteronuclear Three- and Four-Dimensional NMR Spectroscopy. Biochemistry, 1994. 33(12): p. 3515-3531.

6. References
295
93. Trahey, M. and F. McCormick, A cytoplasmic protein stimulates normal N-ras p21 GTPase, but does not affect oncogenic mutants. Science, 1987. 238(4826): p. 542.
94. Ito, Y., et al., Regional Polysterism in the GTP-Bound Form of the Human c-Ha-Ras Protein. Biochemistry, 1997. 36(30): p. 9109-9119.
95. Araki, M., et al., Solution Structure of the State 1 Conformer of GTP-bound H-Ras Protein and Distinct Dynamic Properties between the State 1 and State 2 Conformers. Journal of Biological Chemistry, 2011. 286(45): p. 39644-39653.
96. Acharya, K.R. and M.D. Lloyd, The advantages and limitations of protein crystal structures. Trends in Pharmacological Sciences, 2005. 26(1): p. 10-14.
97. Kigawa, T., et al., Selenomethionine incorporation into a protein by cell-free synthesis. Journal of Structural and Functional Genomics, 2002. 2(1): p. 29-35.
98. Wenye, Z., et al., Direct Targeting of the Ras GTPase Superfamily Through Structure- Based Design. Current Topics in Medicinal Chemistry, 2017. 17(1): p. 16-29.
99. Lang, P.T., et al., Automated electron-density sampling reveals widespread conformational polymorphism in proteins. Protein Science, 2010. 19(7): p. 1420-1431.
100. Prior, I.A., P.D. Lewis, and C. Mattos, A comprehensive survey of Ras mutations in cancer. Cancer Research, 2012. 72(10): p. 2457-2467.
101. Forbes, S.A., et al., COSMIC: mining complete cancer genomes in the Catalogue of Somatic Mutations in Cancer. Nucleic Acids Research, 2011. 39(suppl_1): p. D945-D950.
102. Karnoub, A.E. and R.A. Weinberg, Ras oncogenes: split personalities. Nat Rev Mol Cell Biol, 2008. 9(7): p. 517-531.
103. Almoguera, C., et al., Most human carcinomas of the exocrine pancreas contain mutant c-K-RAS genes. Vol. 53. 1988. 549-54.
104. Burmer, G.C. and L.A. Loeb, Mutations in the KRAS2 oncogene during progressive stages of human colon carcinoma. Proceedings of the National Academy of Sciences, 1989. 86(7): p. 2403-2407.
105. Enomoto, T., et al., K-ras activation in neoplasms of the human female reproductive Tract. Cancer Research, 1990. 50(19): p. 6139.
106. Zhou, B., C.J. Der, and A.D. Cox, The role of wild type RAS isoforms in cancer. Seminars in Cell & Developmental Biology, 2016. 58(Supplement C): p. 60-69.
107. Kiel, C. and L. Serrano, Structure‐energy‐based predictions and network modelling of RASopathy and cancer missense mutations. Molecular Systems Biology, 2014. 10(5): p. 727.
108. Eccleston, J.F., et al., Kinetics of interaction between normal and proline 12 Ras and the GTPase-activating proteins, p120-GAP and neurofibromin. The significance

6. References
296
of the intrinsic GTPase rate in determining the transforming ability of ras. Journal of Biological Chemistry, 1993. 268(36): p. 27012-27019.
109. Gremer, L., et al., Fluoride complexes of oncogenic Ras mutants to study the Ras-RasGAP interaction, in Biological Chemistry. 2008. p. 1163.
110. White, M.A., et al., Multiple ras functions can contribute to mammalian cell transformation. Cell, 1995. 80(4): p. 533-541.
111. Khosravi-Far, R., et al., Oncogenic Ras activation of Raf/mitogen-activated protein kinase-independent pathways is sufficient to cause tumorigenic transformation. Molecular and Cellular Biology, 1996. 16(7): p. 3923-3933.
112. Joneson, T., et al., Stimulation of Membrane Ruffling and MAP Kinase Activation by Distinct Effectors of RAS. Science, 1996. 271(5250): p. 810.
113. Fiordalisi, J.J., et al., A distinct class of dominant negative Ras mutants: cytosolic GTP-bound Ras effector domain mutants that inhibit Ras signaling and transformation and enhance cell adhesion. Journal of Biological Chemistry, 2002. 277(13): p. 10813-10823.
114. Jacobsen, N.E., Interpretation of Proton (1H) NMR Spectra, in NMR Spectroscopy Explained. 2007, John Wiley & Sons, Inc. p. 39-73.
115. Jacobsen, N.E., Fundamentals of NMR Spectroscopy in Liquids, in NMR Spectroscopy Explained. 2007, John Wiley & Sons, Inc. p. 1-38.
116. Spoerner, M., et al., Conformational States of Ras Complexed with the GTP Analogue GppNHp or GppCH2p: Implications for the Interaction with Effector Proteins. Biochemistry, 2005. 44(6): p. 2225-2236.
117. Geyer, M., et al., Conformational Transitions in p21ras and in Its Complexes with the Effector Protein Raf-RBD and the GTPase Activating Protein GAP. Biochemistry, 1996. 35(32): p. 10308-10320.
118. Stumber, M., et al., Observation of Slow Dynamic Exchange Processes in Ras Protein Crystals by 31P Solid State NMR Spectroscopy. Journal of Molecular Biology, 2002. 323(5): p. 899-907.
119. Iuga, A., et al., Solid-state 31P NMR Spectroscopy of Microcrystals of the Ras Protein and its Effector Loop Mutants: Comparison Between Crystalline and Solution State. Journal of Molecular Biology, 2004. 342(3): p. 1033-1040.
120. Ader, C., et al., Solid-State 31P NMR Spectroscopy of Precipitated Guanine Nucleotide-Binding Protein Ras in Complexes with Its Effector Molecules Raf Kinase and RalGDS. The Journal of Physical Chemistry B, 2007. 111(10): p. 2752-2757.
121. Geyer, M., et al., Structure of the Ras-binding domain of RalGEF and implications for Ras binding and signalling. Nat Struct Mol Biol, 1997. 4(9): p. 694-699.
122. Spoerner, M., et al., Conformational states of human H-Ras detected by high-field EPR, ENDOR, and 31P NMR spectroscopy. Magnetic Resonance in Chemistry, 2005. 43(S1): p. S74-S83.

6. References
297
123. Spoerner, M., A. Wittinghofer, and H.R. Kalbitzer, Perturbation of the conformational equilibria in Ras by selective mutations as studied by 31P NMR spectroscopy. FEBS Letters, 2004. 578(3): p. 305-310.
124. Spoerner, M., et al., Slow conformational dynamics of the guanine nucleotide-binding protein Ras complexed with the GTP analogue GTPγS. FEBS Journal, 2007. 274(6): p. 1419-1433.
125. Kalbitzer, H.R., et al., Fundamental Link between Folding States and Functional States of Proteins. Journal of the American Chemical Society, 2009. 131(46): p. 16714-16719.
126. Digilio, M.C., et al., RASopathies: Clinical Diagnosis in the First Year of Life. Molecular Syndromology, 2011. 1(6): p. 282-289.
127. Gremer, L., et al., Germline KRAS Mutations Cause Aberrant Biochemical and Physical Properties Leading to Developmental Disorders. Human mutation, 2011. 32(1): p. 33-43.
128. Tartaglia, M., G. Zampino, and B.D. Gelb, Noonan Syndrome: Clinical Aspects and Molecular Pathogenesis. Molecular Syndromology, 2010. 1(1): p. 2-26.
129. Tidyman, W.E. and K.A. Rauen, The RASopathies: developmental syndromes of Ras/MAPK pathway dysregulation. Current Opinion in Genetics & Development, 2009. 19(3): p. 230-236.
130. Tidyman, W.E. and K.A. Rauen, Noonan, Costello and cardio–facio–cutaneous syndromes: dysregulation of the Ras–MAPK pathway. Expert Reviews in Molecular Medicine, 2008. 10.
131. Fernández-Medarde, A. and E. Santos, Ras in Cancer and Developmental Diseases. Genes & Cancer, 2011. 2(3): p. 344-358.
132. Schubbert, S., K. Shannon, and G. Bollag, Hyperactive Ras in developmental disorders and cancer. 2007. 7: p. 295.
133. Cox, A.D., et al., Drugging the undruggable RAS: Mission Possible? 2014. 13: p. 828.
134. Zhang, F. and J.K. Cheong, The renewed battle against RAS-mutant cancers. Cellular and Molecular Life Sciences, 2016. 73(9): p. 1845-1858.
135. Brock, E.J., et al., How to Target Activated Ras Proteins: Direct Inhibition vs. Induced Mislocalization. Mini reviews in medicinal chemistry, 2016. 16(5): p. 358-369.
136. Wang, W., G. Fang, and J. Rudolph, Ras inhibition via direct Ras binding—is there a path forward? Bioorganic & Medicinal Chemistry Letters, 2012. 22(18): p. 5766-5776.
137. Cromm, P.M., et al., Direct Modulation of Small GTPase Activity and Function. Angewandte Chemie International Edition, 2015. 54(46): p. 13516-13537.

6. References
298
138. Liu, M., et al., Antitumor Activity of SCH 66336, an Orally Bioavailable Tricyclic Inhibitor of Farnesyl Protein Transferase, in Human Tumor Xenograft Models and Transgenic Mice. Cancer Research, 1998. 58(21): p. 4947.
139. End, D.W., et al., Characterization of the Antitumor Effects of the Selective Farnesyl Protein Transferase Inhibitor R115777 <em>in Vivo</em> and <em>in Vitro</em>. Cancer Research, 2001. 61(1): p. 131.
140. Rotblat, B., et al., The Ras Inhibitor Farnesylthiosalicylic Acid (Salirasib) Disrupts The Spatiotemporal Localization Of Active Ras: A Potential Treatment For Cancer, in Methods in Enzymology. 2008, Academic Press. p. 467-489.
141. Laheru, D., et al., Integrated preclinical and clinical development of S-trans, trans-farnesylthiosalicylic acid (FTS, Salirasib) in pancreatic cancer. Investigational New Drugs, 2012. 30(6): p. 2391-2399.
142. Berndt, N., A.D. Hamilton, and S.M. Sebti, Targeting protein prenylation for cancer therapy. 2011. 11: p. 775.
143. James, G.L., J.L. Goldstein, and M.S. Brown, Polylysine and CVIM Sequences of K-RasB Dictate Specificity of Prenylation and Confer Resistance to Benzodiazepine Peptidomimetic in Vitro. Journal of Biological Chemistry, 1995. 270(11): p. 6221-6226.
144. Patgiri, A., et al., An Orthosteric Inhibitor of the Ras-Sos Interaction. Nature chemical biology, 2011. 7(9): p. 585-587.
145. Sun, Q., et al., Discovery of Small Molecules that Bind to K-Ras and Inhibit Sos-Mediated Activation. Angewandte Chemie, 2012. 124(25): p. 6244-6247.
146. Herrmann, C., et al., Sulindac Sulfide inhibits Ras signaling. Vol. 17. 1998. 1769-76.
147. Waldmann, H., et al., Sulindac-Derived Ras Pathway Inhibitors Target the Ras–Raf Interaction and Downstream Effectors in the Ras Pathway. Angewandte Chemie International Edition, 2004. 43(4): p. 454-458.
148. Karaguni, I.-M., et al., The New Sulindac Derivative IND 12 Reverses Ras-induced Cell Transformation. Cancer Research, 2002. 62(6): p. 1718.
149. Ostrem, J.M., et al., K-Ras(G12C) inhibitors allosterically control GTP affinity and effector interactions. Nature, 2013. 503(7477): p. 548-551.
150. Lim, S.M., et al., Therapeutic Targeting of Oncogenic K-Ras by a Covalent Catalytic Site Inhibitor. Angewandte Chemie (International ed. in English), 2014. 53(1): p. 199-204.
151. Hunter, J.C., et al., In situ selectivity profiling and crystal structure of SML-8-73-1, an active site inhibitor of oncogenic K-Ras G12C. Proceedings of the National Academy of Sciences, 2014. 111(24): p. 8895-8900.
152. Herrero, A., et al., Small Molecule Inhibition of ERK Dimerization Prevents Tumorigenesis by RAS-ERK Pathway Oncogenes. Cancer Cell, 2015. 28(2): p. 170-182.

6. References
299
153. Freeman, Alyson K., Daniel A. Ritt, and Deborah K. Morrison, Effects of Raf Dimerization and Its Inhibition on Normal and Disease-Associated Raf Signaling. Molecular Cell. 49(4): p. 751-758.
154. Yao, Z., et al., BRAF Mutants Evade ERK-Dependent Feedback by Different Mechanisms that Determine Their Sensitivity to Pharmacologic Inhibition. Cancer Cell, 2015. 28(3): p. 370-383.
155. Spoerner, M., et al., A novel mechanism for the modulation of the Ras-effector interaction by small molecules. Biochemical and Biophysical Research Communications, 2005. 334(2): p. 709-713.
156. Rosnizeck, I.C., et al., Elucidating the Mode of Action of a Typical Ras State 1(T) Inhibitor. Biochemistry, 2014. 53(24): p. 3867-3878.
157. Rosnizeck, I.C., et al., Stabilizing a Weak Binding State for Effectors in the Human Ras Protein by Cyclen Complexes. Angewandte Chemie International Edition, 2010. 49(22): p. 3830-3833.
158. Rosnizeck, I.C., et al., Metal–Bis(2-picolyl)amine Complexes as State 1(T) Inhibitors of Activated Ras Protein. Angewandte Chemie International Edition, 2012. 51(42): p. 10647-10651.
159. Silva, J.L., et al., High-Pressure Chemical Biology and Biotechnology. Chemical Reviews, 2014. 114(14): p. 7239-7267.
160. Onuchic, J.N., Z. Luthey-Schulten, and P.G. Wolynes, Theory of Protein Folding: The Energy Landscape Perspective. Annual Review of Physical Chemistry, 1997. 48(1): p. 545-600.
161. Frauenfelder, H. and P.G. Wolynes, Rate theories and puzzles of hemeprotein kinetics. Science, 1985. 229(4711): p. 337.
162. Monod, J., J. Wyman, and J.-P. Changeux, On the nature of allosteric transitions: A plausible model. Journal of Molecular Biology, 1965. 12(1): p. 88-118.
163. Akasaka, K., Probing Conformational Fluctuation of Proteins by Pressure Perturbation. Chemical Reviews, 2006. 106(5): p. 1814-1835.
164. de Oliveira, G.A.P. and J.L. Silva, A hypothesis to reconcile the physical and chemical unfolding of proteins. Proceedings of the National Academy of Sciences, 2015. 112(21): p. E2775-E2784.
165. Kitahara, R., et al., Pressure-induced chemical shifts as probes for conformational fluctuations in proteins. Progress in Nuclear Magnetic Resonance Spectroscopy, 2013. 71(Supplement C): p. 35-58.
166. Akasaka, K., High Pressure Bioscience – Basic Concepts, Applications and Frontiers. 2015.
167. Akasaka, K., Exploring the entire conformational space of proteins by high-pressure NMR, in Pure and Applied Chemistry. 2003. p. 927.

6. References
300
168. Munte, C.E., et al., Distinct Conformational States of the Alzheimer β-Amyloid Peptide Can Be Detected by High-Pressure NMR Spectroscopy. Angewandte Chemie International Edition, 2013. 52(34): p. 8943-8947.
169. Kalbitzer, H.R., et al., 15N and 1H NMR study of histidine containing protein (HPr) from Staphylococcus carnosus at high pressure. Protein Science : A Publication of the Protein Society, 2000. 9(4): p. 693-703.
170. Kachel, N., et al., Observation of intermediate states of the human prion protein by high pressure NMR spectroscopy. BMC Structural Biology, 2006. 6(1): p. 16.
171. Kalbitzer, H.R., et al., Intrinsic Allosteric Inhibition of Signaling Proteins by Targeting Rare Interaction States Detected by High-Pressure NMR Spectroscopy. Angewandte Chemie International Edition, 2013. 52(52): p. 14242-14246.
172. Kremer, W., et al., Pulsed Pressure Perturbations, an Extra Dimension in NMR Spectroscopy of Proteins. Journal of the American Chemical Society, 2011. 133(34): p. 13646-13651.
173. Itié, J.P., et al., Crystallography under high pressure using synchrotron radiation. Journal of Physics D: Applied Physics, 2015. 48(50): p. 504007.
174. Jannasch, H.W. and C.D. Taylor, Deep-Sea Microbiology. Annual Review of Microbiology, 1984. 38(1): p. 487-487.
175. Fourme, R., et al., Advances in High-Pressure Biophysics: Status and Prospects of Macromolecular Crystallography. Annual Review of Biophysics, 2009. 38(1): p. 153-171.
176. Kundrot, C.E. and F.M. Richards, Collection and processing of X-ray diffraction data from protein crystals at high pressure. Journal of Applied Crystallography, 1986. 19(4): p. 208-213.
177. Katrusiak, A. and Z. Dauter, Compressibility of lysozyme protein crystals by X-ray diffraction. Acta Crystallographica Section D, 1996. 52(3): p. 607-608.
178. Girard, E., et al., Macromolecular crystallography at high pressure with pneumatic diamond anvil cells handled by a six-axis robotic arm. Journal of Applied Crystallography, 2010. 43(4): p. 762-768.
179. Girard, E., et al., The First Crystal Structure of a Macromolecular Assembly under High Pressure: CpMV at 330 MPa. Biophysical Journal, 2005. 88(5): p. 3562-3571.
180. Girard, E., et al., Structure-Function Perturbation and Dissociation of Tetrameric Urate Oxidase by High Hydrostatic Pressure. Biophysical Journal, 2010. 98(10): p. 2365-2373.
181. Kurpiewska, K., et al., Structural investigation of ribonuclease A conformational preferences using high pressure protein crystallography. Chemical Physics, 2016. 468(Supplement C): p. 53-62.
182. Girard, E., et al., Toward fully fledged high-pressure macromolecular crystallography. Journal of Applied Crystallography, 2007. 40(5): p. 912-918.

6. References
301
183. Collins, M.D., C.U. Kim, and S.M. Gruner, High-Pressure Protein Crystallography and NMR to Explore Protein Conformations. Annual Review of Biophysics, 2011. 40(1): p. 81-98.
184. Fourme, R., et al., Using a quasi-parallel X-ray beam of ultrashort wavelength for high-pressure virus crystallography: implications for standard macromolecular crystallography. Acta Crystallographica Section D, 2003. 59(10): p. 1767-1772.
185. Fourme, R., et al., High-Pressure Macromolecular Crystallography (HPMX): Status and prospects. Biochimica et Biophysica Acta (BBA) - Proteins and Proteomics, 2006. 1764(3): p. 384-390.
186. Losen, M., et al., Effect of Oxygen Limitation and Medium Composition on Escherichia coli Fermentation in Shake-Flask Cultures. Biotechnology Progress, 2004. 20(4): p. 1062-1068.
187. Ehrenberg, M., H. Bremer, and P.P. Dennis, Medium-dependent control of the bacterial growth rate. Biochimie, 2013. 95(4): p. 643-658.
188. Egli, T., Microbial growth and physiology: a call for better craftsmanship. Frontiers in Microbiology, 2015. 6: p. 287.
189. Tao, H., et al., Functional Genomics: Expression Analysis of Escherichia coli Growing on Minimal and Rich Media. Journal of Bacteriology, 1999. 181(20): p. 6425-6440.
190. Madigan, M.T., Brock biology of microorganisms. 2012.
191. Dagert, M. and S.D. Ehrlich, Prolonged incubation in calcium chloride improves the competence of Escherichia coli cells. Gene, 1979. 6(1): p. 23-28.
192. Hanahan, D., Studies on transformation of Escherichia coli with plasmids. Journal of Molecular Biology, 1983. 166(4): p. 557-580.
193. Promega Miniprep Quick Protocol. 2017 [cited 2017 20 September]; Available from: https://www.promega.com/-/media/files/resources/protcards/pureyield-plasmid-miniprep-system-quick-protocol.pdf.
194. Promega Midiprep Quick Protocol. 2017 [cited 2017 20 June]; Available from: https://www.promega.com/-/media/files/resources/protcards/pureyield-plasmid-midiprep-system-quick-protocol.pdf.
195. Tucker, J., et al., Expression of p21 proteins in Escherichia coli and stereochemistry of the nucleotide-binding site. The EMBO Journal, 1986. 5(6): p. 1351-1358.
196. McCracken, G.H., J.D. Nelson, and M.L. Thomas, Discrepancy Between Carbenicillin and Ampicillin Activities Against Enterococci and Listeria. Antimicrobial Agents and Chemotherapy, 1973. 3(3): p. 343-349.
197. Jacobsen, N.E., NMR spectroscopy explained : simplified theory, applications and examples for organic chemistry and structural biology. 2007, Hoboken, N.J.: Wiley-Interscience.

6. References
302
198. Sivashanmugam, A., et al., Practical protocols for production of very high yields of recombinant proteins using Escherichia coli. Protein Science, 2009. 18(5): p. 936-948.
199. Invitrogen. GENEART Site-Directed Mutagenesis User Guide. 2017 [cited 2017 2 Jully]; Available from: https://tools.thermofisher.com/content/sfs/manuals/geneart_site_directed_mutagenesis_man.pdf.
200. Alcalde, M., Mutagenesis Protocols in Saccharomyces cerevisiae by In Vivo Overlap Extension, in In Vitro Mutagenesis Protocols: Third Edition, J. Braman, Editor. 2010, Humana Press: Totowa, NJ. p. 3-14.
201. Singh, A., et al., Protein recovery from inclusion bodies of Escherichia coli using mild solubilization process. Microbial Cell Factories, 2015. 14: p. 41.
202. James, G.T., Inactivation of the protease inhibitor phenylmethylsulfonyl fluoride in buffers. Analytical Biochemistry, 1978. 86(2): p. 574-579.
203. Cleland, W.W., Dithiothreitol, a New Protective Reagent for SH Groups*. Biochemistry, 1964. 3(4): p. 480-482.
204. Repaske, R., Lysis of gram-negative bacteria by lysozyme. Biochimica et Biophysica Acta, 1956. 22(1): p. 189-191.
205. Linke, D., Chapter 34 Detergents: An Overview. Methods in Enzymology, 2009. 463: p. 603-617.
206. Ninfa, A.J., D.P. Ballou, and M. Benore, Fundamental Laboratory Approaches for Biochemistry and Biotechnology. 2009: Wiley.
207. Arakawa, T. and S.N. Timasheff, Mechanism of protein salting in and salting out by divalent cation salts: balance between hydration and salt binding. Biochemistry, 1984. 23(25): p. 5912-5923.
208. Wingfield, P.T., Protein Precipitation Using Ammonium Sulfate. Current protocols in protein science / editorial board, John E. Coligan ... [et al.], 2001. APPENDIX 3: p. Appendix-3F.
209. Zhang, Y. and P.S. Cremer, Interactions between macromolecules and ions: the Hofmeister series. Current Opinion in Chemical Biology, 2006. 10(6): p. 658-663.
210. Nes, W.D., Protein Purification: Principles, High-Resolution Methods, and Applications. Second Edition Edited by Jan-Christer Janson and Lars Rydén (Uppsala University). John Wiley & Sons: New York. 1988. 695 pp. ISBN 0-471-18626-0. Journal of the American Chemical Society, 1999. 121(7): p. 1625-1625.
211. Boardman, N.K. and S.M. Partridge, Separation of neutral proteins on ion-exchange resins. Biochemical Journal, 1955. 59(4): p. 543.
212. Healthcare, G. 2017 [cited 2017 27 June]; Available from: http://www.gelifesciences.com/webapp/wcs/stores/servlet/catalog/en/GELifeSciences-de/products/AlternativeProductStructure_17442/.

6. References
303
213. Scheffzek, K., et al., Crystal structure of the GTPase-activating domain of human p120GAP and implications for the interaction with Ras. Nature, 1996. 384(6609): p. 591-596.
214. Laemmli, U.K., Cleavage of Structural Proteins during the Assembly of the Head of Bacteriophage T4. Nature, 1970. 227(5259): p. 680-685.
215. Schägger, H. and G. von Jagow, Tricine-sodium dodecyl sulfate-polyacrylamide gel electrophoresis for the separation of proteins in the range from 1 to 100 kDa. Analytical Biochemistry, 1987. 166(2): p. 368-379.
216. Gasteiger, E., et al., Protein Identification and Analysis Tools on the ExPASy Server, in The Proteomics Protocols Handbook, J.M. Walker, Editor. 2005, Humana Press: Totowa, NJ. p. 571-607.
217. Hoffman, N.E. and J.C. Liao, Reversed phase high performance liquid chromatographic separations of nucleotides in the presence of solvophobic ions. Analytical Chemistry, 1977. 49(14): p. 2231-2234.
218. Martin L, Schwarz S, and Breitsprecher D, Analyzing Thermal Unfolding of Proteins: The Prometheus NT.48. Application Note NT-PR-001, N. Technologies, Editor. 2014.
219. Martin, L., M. Maschberger, and D. Breitsprecher, Thermal Unfolding of Antibodies with the Prometheus NT.48, N. Technologies, Editor. 2015. p. 1.
220. Senisterra, G., I. Chau, and M. Vedadi, Thermal Denaturation Assays in Chemical Biology. ASSAY and Drug Development Technologies, 2011. 10(2): p. 128-136.
221. Jerabek-Willemsen, M., et al., Molecular Interaction Studies Using Microscale Thermophoresis. Assay and Drug Development Technologies, 2011. 9(4): p. 342-353.
222. Renaud, J.-P., et al., Biophysics in drug discovery: impact, challenges and opportunities. Nat Rev Drug Discov, 2016. 15(10): p. 679-698.
223. Falconer, R.J., Applications of isothermal titration calorimetry – the research and technical developments from 2011 to 2015. Journal of Molecular Recognition, 2016. 29(10): p. 504-515.
224. Khalef, N., O. Campanella, and A. Bakri, Isothermal calorimetry: methods and applications in food and pharmaceutical fields. Current Opinion in Food Science, 2016. 9(Supplement C): p. 70-76.
225. Freyer, M.W. and E.A. Lewis, Isothermal Titration Calorimetry: Experimental Design, Data Analysis, and Probing Macromolecule/Ligand Binding and Kinetic Interactions. Methods in Cell Biology, 2008. 84: p. 79-113.
226. Spoerner, M., et al., High pressure 31P NMR spectroscopy on guanine nucleotides. Journal of Biomolecular NMR, 2016: p. 1-13.
227. Raiford, D.S., C.L. Fisk, and E.D. Becker, Calibration of methanol and ethylene glycol nuclear magnetic resonance thermometers. Analytical Chemistry, 1979. 51(12): p. 2050-2051.

6. References
304
228. Shaka, A.J., P.B. Barker, and R. Freeman, Computer-optimized decoupling scheme for wideband applications and low-level operation. Journal of Magnetic Resonance (1969), 1985. 64(3): p. 547-552.
229. Erlach, M.B., et al., Ceramic cells for high pressure NMR spectroscopy of proteins. Journal of Magnetic Resonance, 2010. 204(2): p. 196-199.
230. Wishart, D.S., et al., 1H, 13C and 15N chemical shift referencing in biomolecular NMR. Journal of Biomolecular NMR, 1995. 6(2): p. 135-140.
231. Baskaran, K., et al., Chemical shift optimization in multidimensional NMR spectra by AUREMOL-SHIFTOPT. Journal of Biomolecular NMR, 2009. 43(4): p. 197-210.
232. Maurer, T. and H.R. Kalbitzer, Indirect Referencing of31P and19F NMR Spectra. Journal of Magnetic Resonance, Series B, 1996. 113(2): p. 177-178.
233. Levenberg, K., A method for the solution of certain non-linear problems in least squares. Quarterly of Applied Mathematics, 1944. 2(2): p. 164-168.
234. Marquardt, D., An Algorithm for Least-Squares Estimation of Nonlinear Parameters. Journal of the Society for Industrial and Applied Mathematics, 1963. 11(2): p. 431-441.
235. Hausser, K.H. and H.R. Kalbitzer, NMR in medicine and biology: structure determination, tomography, in vivo spectroscopy. Physics in life sciences. 1991: Springer-Verlag.
236. Hill, A.V., The possible effects of the aggregation of the molecules of hemoglobin on its dissociation curves. The Journal of Physiology\, 1910. 40}: p. i--vii\.
237. Goutelle, S., et al., The Hill equation: a review of its capabilities in pharmacological modelling. Fundamental & Clinical Pharmacology, 2008. 22(6): p. 633-648.
238. Fourme, R., et al., High-pressure protein crystallography (HPPX): instrumentation, methodology and results on lysozyme crystals. Journal of Synchrotron Radiation, 2001. 8(5): p. 1149-1156.
239. Katrusiak, A., High-pressure crystallography. Acta Crystallographica Section A, 2008. 64(1): p. 135-148.
240. Forman, R.A., et al., Pressure Measurement Made by the Utilization of Ruby Sharp-Line Luminescence. Science, 1972. 176(4032): p. 284.
241. Matsumoto, S., et al., Molecular Mechanism for Conformational Dynamics of Ras·GTP Elucidated from In-Situ Structural Transition in Crystal. Scientific Reports, 2016. 6: p. 25931.
242. Shima, F., et al., Structural Basis for Conformational Dynamics of GTP-bound Ras Protein. Journal of Biological Chemistry, 2010. 285(29): p. 22696-22705.
243. Kiel, C., L. Serrano, and C. Herrmann, A Detailed Thermodynamic Analysis of Ras/Effector Complex Interfaces. Journal of Molecular Biology, 2004. 340(5): p. 1039-1058.

6. References
305
244. Wohlgemuth, S., et al., Recognizing and Defining True Ras Binding Domains I: Biochemical Analysis. Journal of Molecular Biology, 2005. 348(3): p. 741-758.
245. Kiel, C., A. referee: Wittinghofer, and C. referee: Herrmann, Untersuchung von Ras/Effektor-Komplexen mit gezielt veränderten elektrostatischen Eigenschaften. 2003, Ruhr-Universität Bochum: Bochum. p. pp. 175.
246. Wu, X., et al., Inhibition of Ras-effector interactions by cyclic peptides. MedChemComm, 2013. 4(2): p. 378-382.
247. Upadhyaya, P., et al., Inhibition of Ras Signaling by Blocking Ras–Effector Interactions with Cyclic Peptides. Angewandte Chemie International Edition, 2015. 54(26): p. 7602-7606.
248. Szabó, Z., Multinuclear NMR studies of the interaction of metal ions with adenine-nucleotides. Coordination Chemistry Reviews, 2008. 252(21): p. 2362-2380.
249. Karl, M., et al., Pressure response of 31P chemical shifts of adenine nucleotides. Biophysical Chemistry, 2017.
250. Ting, P.Y., et al., Tyrosine phosphorylation of RAS by ABL allosterically enhances effector binding. The FASEB Journal, 2015. 29(9): p. 3750-3761.
251. Nussinov, R., et al., K-Ras4B/calmodulin/PI3Kα: A promising new adenocarcinoma-specific drug target? Expert Opinion on Therapeutic Targets, 2016. 20(7): p. 831-842.
252. Song, C., et al., Regulation of a Novel Human Phospholipase C, PLCε, through Membrane Targeting by Ras. Journal of Biological Chemistry, 2001. 276(4): p. 2752-2757.
253. Huang, L., et al., Structural basis for the interaction of Ras with RaIGDS. Nat Struct Mol Biol, 1998. 5(6): p. 422-426.
254. Meierhofer, T., et al., Cu2+-cyclen as Probe to Identify Conformational States in Guanine Nucleotide Binding Proteins. Journal of the American Chemical Society, 2011. 133(7): p. 2048-2051.
255. Nixon, A.E., et al., Kinetics of Inorganic Phosphate Release during the Interaction of p21ras with the GTPase-Activating Proteins, p120-GAP and Neurofibromin. Biochemistry, 1995. 34(47): p. 15592-15598.
256. Ahmadian, M.R., et al., Individual Rate Constants for the Interaction of Ras Proteins with GTPase-Activating Proteins Determined by Fluorescence Spectroscopy. Biochemistry, 1997. 36(15): p. 4535-4541.
257. Liao, J., et al., Two conformational states of Ras GTPase exhibit differential GTP-binding kinetics. Biochemical and Biophysical Research Communications, 2008. 369(2): p. 327-332.
258. Ernst, R.R. and W.A. Anderson, Application of Fourier Transform Spectroscopy to Magnetic Resonance. Review of Scientific Instruments, 1966. 37(1): p. 93-102.

6. References
306
259. Franken, S.M., et al., Three-dimensional structures and properties of a transforming and a nontransforming glycine-12 mutant of p21H-ras. Biochemistry, 1993. 32(33): p. 8411-8420.
260. Ahmadian, M.R., et al., Guanosine triphosphatase stimulation of oncogenic Ras mutants. Proceedings of the National Academy of Sciences, 1999. 96(12): p. 7065-7070.
261. Frech, M., et al., Role of Glutamine-61 in the Hydrolysis of GTP by p21H-ras: An Experimental and Theoretical Study. Biochemistry, 1994. 33(11): p. 3237-3244.
262. Kalbitzer, H.R. and M. Spoerner, Chapter Four - State 1(T) Inhibitors of Activated Ras, in The Enzymes, F. Tamanoi, Editor. 2013, Academic Press. p. 69-94.
263. Weikl, T.R. and C. von Deuster, Selected-fit versus induced-fit protein binding: Kinetic differences and mutational analysis. Proteins: Structure, Function, and Bioinformatics, 2009. 75(1): p. 104-110.
264. Rudolph, M.G., et al., Thermodynamics of Ras/Effector and Cdc42/Effector Interactions Probed by Isothermal Titration Calorimetry. Journal of Biological Chemistry, 2001. 276(26): p. 23914-23921.
265. Al-Mulla, F., et al., Structural differences between valine-12 and aspartate-12 Ras proteins may modify carcinoma aggression. The Journal of Pathology, 1999. 187(4): p. 433-438.
266. John, J., et al., C-terminal truncation of p21H preserves crucial kinetic and structural properties. Journal of Biological Chemistry, 1989. 264(22): p. 13086-13092.
267. John, J., M. Frech, and A. Wittinghofer, Biochemical properties of Ha-ras encoded p21 mutants and mechanism of the autophosphorylation reaction. Journal of Biological Chemistry, 1988. 263(24): p. 11792-11799.
268. Klebe, G., Applying thermodynamic profiling in lead finding and optimization. Nat Rev Drug Discov, 2015. 14(2): p. 95-110.
269. Kiel, C., et al., Recognizing and Defining True Ras Binding Domains II: In Silico Prediction Based on Homology Modelling and Energy Calculations. Journal of Molecular Biology, 2005. 348(3): p. 759-775.
270. Jelesarov, I. and H.R. Bosshard, Isothermal titration calorimetry and differential scanning calorimetry as complementary tools to investigate the energetics of biomolecular recognition. Journal of Molecular Recognition, 1999. 12(1): p. 3-18.
271. Chodera, J.D. and D.L. Mobley, Entropy-enthalpy compensation: role and ramifications in biomolecular ligand recognition and design. Annual review of biophysics, 2013. 42: p. 121-142.
272. Koehler, J., et al., Pressure Dependence of 15N Chemical Shifts in Model Peptides Ac-Gly-Gly-X-Ala-NH2. Materials\, 2012. 5\: p. 1774-1786\.
273. Spoerner, M., et al., High pressure 31P NMR spectroscopy on guanine nucleotides. Journal of Biomolecular NMR, 2017. 67(1): p. 1-13.

6. References
307
274. Moedritzer, K., pH dependence of phosphorus-31 chemical shifts and coupling constants of some oxyacids of phosphorus. Inorganic Chemistry, 1967. 6(5): p. 936-939.
275. Cozzone, P.J. and O. Jardetzky, Phosphorus-31 Fourier transform nuclear magnetic resonance study of mononucleotides and dinucleotides. 1. Chemical shifts. Biochemistry, 1976. 15(22): p. 4853-4859.
276. Ford, B., et al., Structure of the G60A Mutant of Ras: Implications for the Dominant Negative Effect. Journal of Biological Chemistry, 2005. 280(27): p. 25697-25705.
277. Johnson, C.W., et al., The small GTPases K-Ras, N-Ras, and H-Ras have distinct biochemical properties determined by allosteric effects. Journal of Biological Chemistry, 2017. 292(31): p. 12981-12993.
278. Krengel, U., et al., Three-dimensional structures of H-ras p21 mutants: Molecular basis for their inability to function as signal switch molecules. Cell. 62(3): p. 539-548.
279. Betts, M.J. and R.B. Russell, Amino Acid Properties and Consequences of Substitutions, in Bioinformatics for Geneticists. 2003, John Wiley & Sons, Ltd. p. 289-316.
280. Seeburg, P.H., et al., Biological properties of human c-Ha-ras1 genes mutated at codon 12. Nature, 1984. 312(5989): p. 71-75.
281. Muraoka, S., et al., Crystal structures of the state 1 conformations of the GTP-bound H-Ras protein and its oncogenic G12V and Q61L mutants. FEBS Letters, 2012. 586(12): p. 1715-1718.
282. Kinoshita, T., et al., Raf/MAPK and rapamycin-sensitive pathways mediate the anti-apoptotic function of p21Ras in IL-3-dependent hematopoietic cells. Oncogene, 1997. 15(6): p. 8.
283. Buhrman, G., G. Wink, and C. Mattos, Transformation Efficiency of RasQ61 Mutants Linked to Structural Features of the Switch Regions in the Presence of Raf. Structure, 2007. 15(12): p. 1618-1629.
284. Baba, S., et al., Humidity control and hydrophilic glue coating applied to mounted protein crystals improves X-ray diffraction experiments. Acta Crystallographica Section D: Biological Crystallography, 2013. 69(Pt 9): p. 1839-1849.
285. Davis, I.W., et al., The Backrub Motion: How Protein Backbone Shrugs When a Sidechain Dances. Structure. 14(2): p. 265-274.
286. Shapovalov, M.V. and R.L. Dunbrack, Statistical and conformational analysis of the electron density of protein side chains. Proteins: Structure, Function, and Bioinformatics, 2007. 66(2): p. 279-303.
287. Pearce, N.M., et al., A multi-crystal method for extracting obscured crystallographic states from conventionally uninterpretable electron density. Nature Communications, 2017. 8: p. 15123.

6. References
308
288. Fraser, J.S., et al., Hidden alternative structures of proline isomerase essential for catalysis. Nature, 2009. 462: p. 669.
289. Reichenbach-Klinke, R., M. Zabel, and B. Konig, Synthesis and structure of cyclen hydroxylamine ligands and their zinc(ii) complexes. Dalton Transactions, 2003(1): p. 141-145.
Related Documents