Confocal XANES and the Attic Black Glaze: The Three-Stage Firing Process through Modern Reproduction Lars Lü hl,* ,†,¶,⊥ Bernhard Hesse, †,∥ Ioanna Mantouvalou, † Max Wilke, ‡ Sammia Mahlkow, † Eleni Aloupi-Siotis, §,⊥ and Birgit Kanngiesser † † Technische Universitä t Berlin, Hardenbergstrasse 36, 10623 Berlin, Germany ‡ Deutsches Geoforschungszentrum, Telegrafenberg, 14473 Potsdam, Germany § Thetis Authentics Ltd., 4 Diagoras, GR-116 36 Athens, Greece * S Supporting Information ABSTRACT: The decorated black- and red-figured Athenian vases (sixth and fifth century BC) and the plain black-glazed ware represent a milestone in our material culture due to their aesthetic and technological value; the Attic black glaze is of particular interest since it is a highly resistant potash− alumino−silicate glass, colored by magnetite nanocrystals (<200 nm). This study presents a new methodological approach for correlating the iron oxidation state in the black glaze layer with the manufacturing process by means of conventional and confocal X-ray absorption near edge spectroscopy (XANES). The enhanced surface sensitivity of confocal XANES is combined with conventional XANES resulting in higher counting rates to reliably evaluate the iron oxidation state (Fe 3+ /ΣFe) of the surface layer. A detailed description of the new evaluation procedure is presented. The three-stage firing process was retraced by correlating selected attic black-glazed (BG) specimens from different periods (Archaic, Classical, Hellenistic) with laboratory reproductions. The modern BG specimens serving as reference samples were produced by following the three-stage firing process (i.e., under oxidizing−reducing−oxidizing (ORO) conditions) at different top temperatures, using clay suspensions of different particle size produced with treatment of raw illitic clays from Attica. X-ray absorption near edge spectroscopy (XANES) has proven to be a useful tool for the nondestructive investigation of the oxidation state of elements during the last decades. In particular the shape of the pre-edge structure 1 in K-edge XANES spectra shows a high sensitivity to oxidation state and coordination. Wilke et al. developed in their work a methodology for determining the iron oxidation state in minerals and glass focusing on the pre-edge of Fe K-edge XANES spectra that was obtained by analysis of an extensive set of reference samples. 2,3 In the work of Berry et al. 4 on XANES calibrations for the oxidation state of iron in silicate glasses, advantages of the technique over Mö ssbauer spectroscopy (analysis of bulk materials only), EELS using TEM (nanoscale analysis, limitations due to melt inclusions, invasive sample preparation), and XPS (complicated by surface sensitivity and the need for ultrahigh vacuum techniques) were discussed. The present study relies on the methodology developed by Wilke et al., 2,3 while taking into account previous qualitative data on the application of Fe L- and K-edge XAS on black-glazed ware from Northern Etruria 5 and the nondestructive synchrotron radiation-XAS on decorated Attic pottery from the south of Italy and Sicily 6 that compares well with previous data obtained by Mö ssbauer spectroscopy. 7,8 Attic black- and red-figure vases and plain black-glazed ware form a milestone in the evolution of material culture due to their special manufacturing process and technological features (see Figure 1a) beyond their aesthetic appeal and historical value. Attic pottery consists of a porous ceramic body with a reddish-brown color and a glassy black layer on top (see Figure 1b), both containing iron. 9−16 The black glaze is produced with the use of a special clay paint 17,18 which is applied on the surface of the clay vase. Following a three-stage firing process under oxidizing−reducing−reoxidizing (ORO) conditions, it turns to a vitrified black layer (see Figure 1c) well adhered to the reddish-brown ceramic body. This technique known as the “iron reduction technique’ reached perfection during the classical times in Attica though it was also practiced in other production centers in the mainland Greece (Boeotia, Euboea, Laconia, and Thessaly) and the Greek colonies (especially in southern Italy). The aim of the present study was to correlate the oxidation state of iron in the black glaze of the pottery to the degree of refinement of the used clay suspension and firing conditions by investigating modern reproductions prepared under controlled conditions at the THETIS’ production workshop (Athens). 18 The results are correlated with those received from the analysis of selected ancient specimens from recent excavations in the Received: February 23, 2014 Accepted: June 3, 2014 Published: June 6, 2014 Article pubs.acs.org/ac © 2014 undefined 6924 dx.doi.org/10.1021/ac500990k | Anal. Chem. 2014, 86, 6924−6930

Welcome message from author
This document is posted to help you gain knowledge. Please leave a comment to let me know what you think about it! Share it to your friends and learn new things together.
Transcript
Confocal XANES and the Attic Black Glaze: The Three-Stage FiringProcess through Modern ReproductionLars Luhl,*,†,¶,⊥ Bernhard Hesse,†,∥ Ioanna Mantouvalou,† Max Wilke,‡ Sammia Mahlkow,†
Eleni Aloupi-Siotis,§,⊥ and Birgit Kanngiesser†
†Technische Universitat Berlin, Hardenbergstrasse 36, 10623 Berlin, Germany‡Deutsches Geoforschungszentrum, Telegrafenberg, 14473 Potsdam, Germany§Thetis Authentics Ltd., 4 Diagoras, GR-116 36 Athens, Greece
*S Supporting Information
ABSTRACT: The decorated black- and red-figured Athenianvases (sixth and fifth century BC) and the plain black-glazedware represent a milestone in our material culture due to theiraesthetic and technological value; the Attic black glaze is ofparticular interest since it is a highly resistant potash−alumino−silicate glass, colored by magnetite nanocrystals(<200 nm). This study presents a new methodologicalapproach for correlating the iron oxidation state in the blackglaze layer with the manufacturing process by means of conventional and confocal X-ray absorption near edge spectroscopy(XANES). The enhanced surface sensitivity of confocal XANES is combined with conventional XANES resulting in highercounting rates to reliably evaluate the iron oxidation state (Fe3+/ΣFe) of the surface layer. A detailed description of the newevaluation procedure is presented. The three-stage firing process was retraced by correlating selected attic black-glazed (BG)specimens from different periods (Archaic, Classical, Hellenistic) with laboratory reproductions. The modern BG specimensserving as reference samples were produced by following the three-stage firing process (i.e., under oxidizing−reducing−oxidizing(ORO) conditions) at different top temperatures, using clay suspensions of different particle size produced with treatment of rawillitic clays from Attica.
X-ray absorption near edge spectroscopy (XANES) has provento be a useful tool for the nondestructive investigation of theoxidation state of elements during the last decades. In particularthe shape of the pre-edge structure1 in K-edge XANES spectrashows a high sensitivity to oxidation state and coordination.Wilke et al. developed in their work a methodology fordetermining the iron oxidation state in minerals and glassfocusing on the pre-edge of Fe K-edge XANES spectra that wasobtained by analysis of an extensive set of reference samples.2,3
In the work of Berry et al.4 on XANES calibrations for theoxidation state of iron in silicate glasses, advantages of thetechnique over Mossbauer spectroscopy (analysis of bulkmaterials only), EELS using TEM (nanoscale analysis,limitations due to melt inclusions, invasive sample preparation),and XPS (complicated by surface sensitivity and the need forultrahigh vacuum techniques) were discussed. The presentstudy relies on the methodology developed by Wilke et al.,2,3
while taking into account previous qualitative data on theapplication of Fe L- and K-edge XAS on black-glazed ware fromNorthern Etruria5 and the nondestructive synchrotronradiation-XAS on decorated Attic pottery from the south ofItaly and Sicily6 that compares well with previous data obtainedby Mossbauer spectroscopy.7,8
Attic black- and red-figure vases and plain black-glazed wareform a milestone in the evolution of material culture due totheir special manufacturing process and technological features
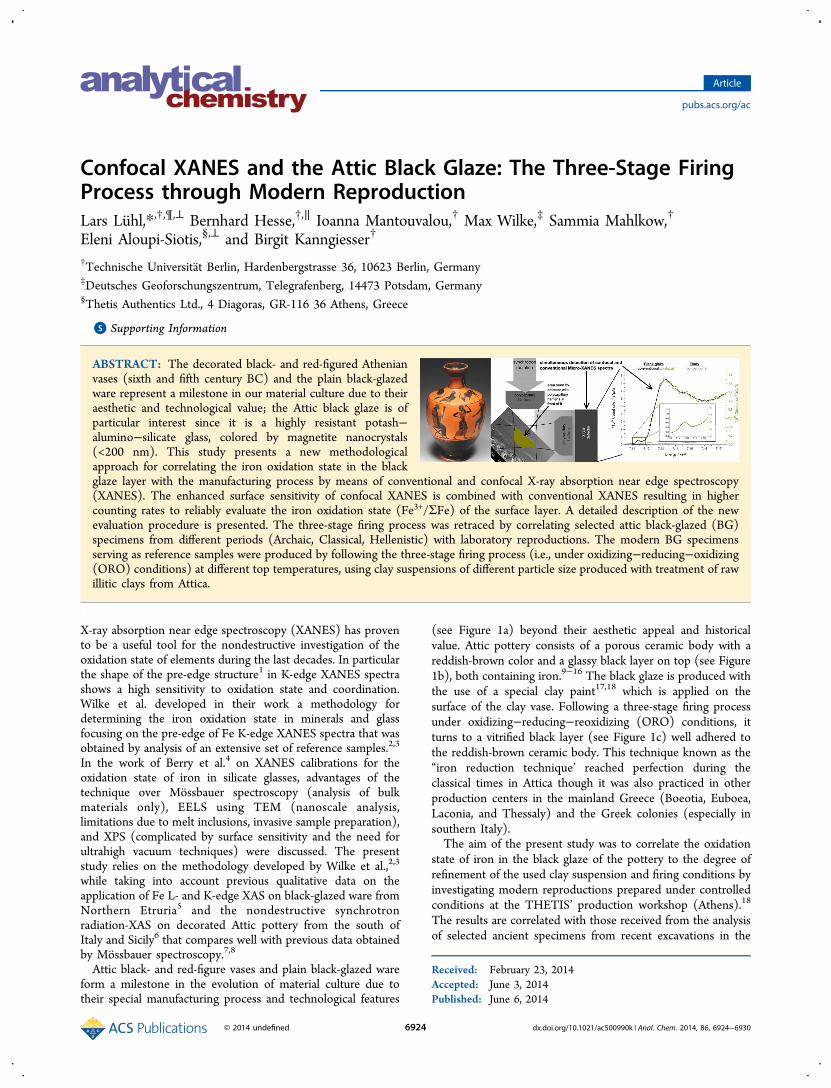
(see Figure 1a) beyond their aesthetic appeal and historicalvalue. Attic pottery consists of a porous ceramic body with areddish-brown color and a glassy black layer on top (see Figure1b), both containing iron.9−16 The black glaze is produced withthe use of a special clay paint17,18 which is applied on thesurface of the clay vase. Following a three-stage firing processunder oxidizing−reducing−reoxidizing (ORO) conditions, itturns to a vitrified black layer (see Figure 1c) well adhered tothe reddish-brown ceramic body. This technique known as the“iron reduction technique’ reached perfection during theclassical times in Attica though it was also practiced in otherproduction centers in the mainland Greece (Boeotia, Euboea,Laconia, and Thessaly) and the Greek colonies (especially insouthern Italy).The aim of the present study was to correlate the oxidation
state of iron in the black glaze of the pottery to the degree ofrefinement of the used clay suspension and firing conditions byinvestigating modern reproductions prepared under controlledconditions at the THETIS’ production workshop (Athens).18
The results are correlated with those received from the analysisof selected ancient specimens from recent excavations in the
Received: February 23, 2014Accepted: June 3, 2014Published: June 6, 2014
Article
pubs.acs.org/ac
© 2014 undefined 6924 dx.doi.org/10.1021/ac500990k | Anal. Chem. 2014, 86, 6924−6930
center of Athens (New Acropolis Museum and Kerameikosarea). This research work is the first step to further investigatethe development of the attic pottery production over time,from subgeometric (9th century BC) to late Hellenistic period(2nd century BC) by analyzing a large number of well-documented sherds from Attica.For the XANES measurements a novel measurement strategy
adapted to the peculiarities of the specimens had to bedeveloped. The impact of the ceramic body on thedetermination of the iron oxidation state of the black glazehad to be excluded, and absorption effects to be taken intoaccount.The Attic Black Glaze and the Three-Stage Firing. In
modern physicochemical terms the Attic black glaze (BG) canbe described as a potassium−aluminosilicate glass colored bymagnetite nanocrystals (particle size <200 nm) synthesized insitu during the three-stage ORO firing of a colloidal suspensionof a ferruginous illitic clay with low CaO content (<1%). Theaverage composition of the glaze in wt % as determined by 26samples is SiO2 46, 2 (±1, 3); Al2O3 30, 0 (±1, 1); FeO 14, 5(±1, 6); K2O 5, 4 (±1, 1) ; Na2O 0, 7 (±0, 2); MgO 1, 9 (±0,3); CaO 0, 8 (±0, 3); TiO2 0, 6 (±0, 3).16−18 The ironoxidation state is an indicator for the three-stage firing processdetailed as follows: during the first stage, involving atemperature increase to a Tmax of 870−950 °C under oxidationconditions, the iron oxides and/or hydroxides contained inboth the clay body and the paint layer turn into Fe(III) oxide,hematite Fe2O3. At Tmax the kiln slits are closed, and greenwood, which burns incompletely providing a reducingatmosphere, is placed inside. Under reducing conditions partialreduction of hematite occurs forming Fe2+ compounds, i.e.,magnetite (FeO·Fe2O3), hercynite (FeO·Al2O3), and wustite(FeO), and thus the glossy black glaze is formed. At this stagethe temperature decreases17,18 due to incomplete combustionof the burning material. In the third stage, by opening the slitsof the kiln again the oxygen penetrates the porous ceramicbody, and hematite is formed again while the glaze layerremains black since it is impermeable to oxygen. The exactnature of the Attic BG has become the subject of several studiesespecially in view of its degree of vitrification; as shown in
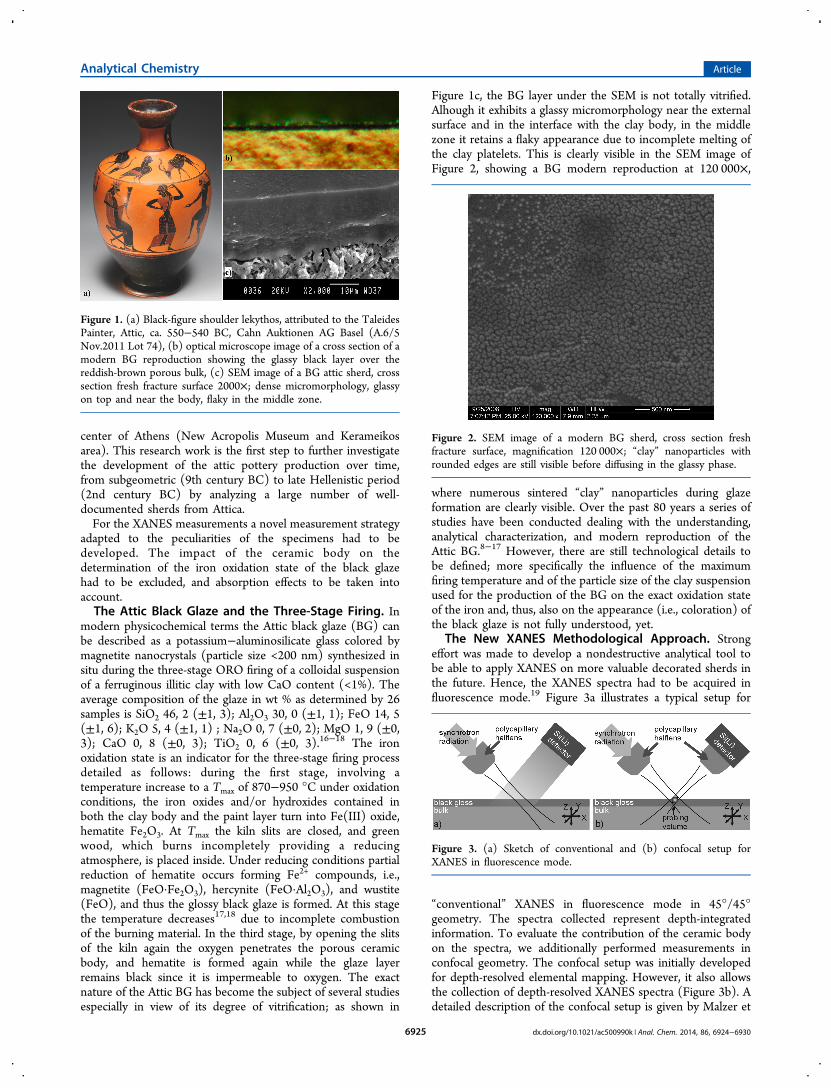
Figure 1c, the BG layer under the SEM is not totally vitrified.Alhough it exhibits a glassy micromorphology near the externalsurface and in the interface with the clay body, in the middlezone it retains a flaky appearance due to incomplete melting ofthe clay platelets. This is clearly visible in the SEM image ofFigure 2, showing a BG modern reproduction at 120 000×,
where numerous sintered “clay” nanoparticles during glazeformation are clearly visible. Over the past 80 years a series ofstudies have been conducted dealing with the understanding,analytical characterization, and modern reproduction of theAttic BG.8−17 However, there are still technological details tobe defined; more specifically the influence of the maximumfiring temperature and of the particle size of the clay suspensionused for the production of the BG on the exact oxidation stateof the iron and, thus, also on the appearance (i.e., coloration) ofthe black glaze is not fully understood, yet.
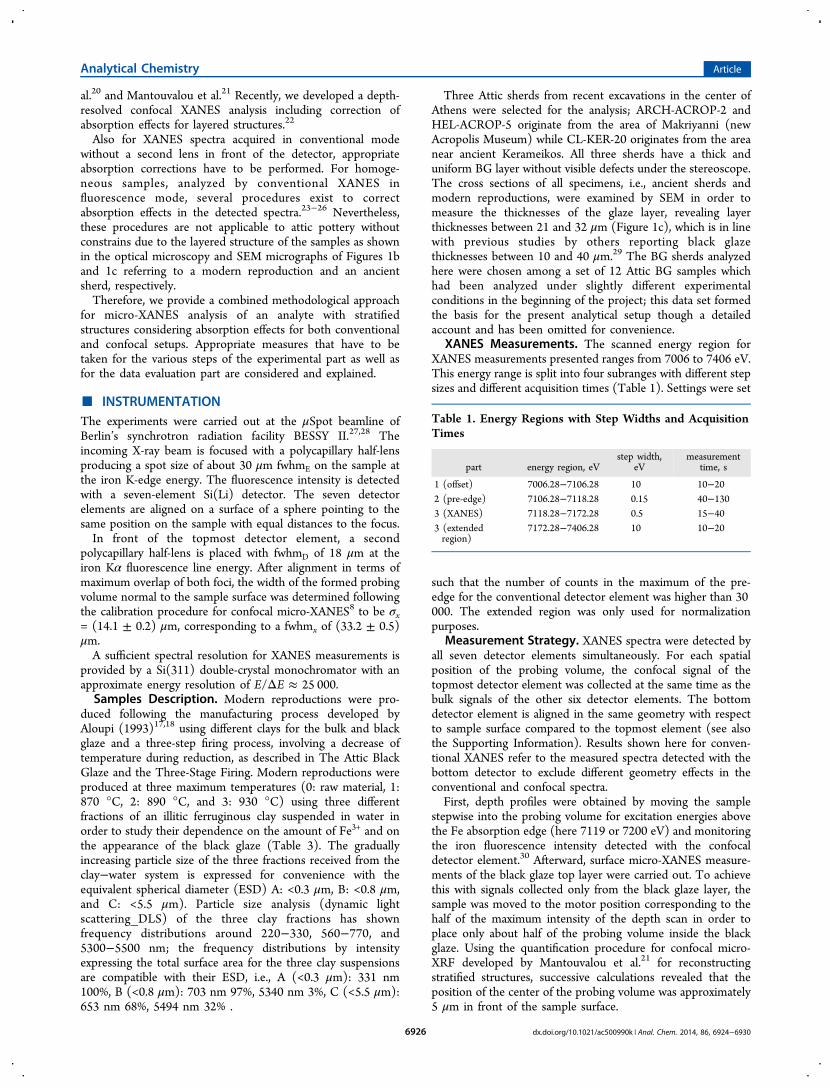
The New XANES Methodological Approach. Strongeffort was made to develop a nondestructive analytical tool tobe able to apply XANES on more valuable decorated sherds inthe future. Hence, the XANES spectra had to be acquired influorescence mode.19 Figure 3a illustrates a typical setup for
“conventional” XANES in fluorescence mode in 45°/45°geometry. The spectra collected represent depth-integratedinformation. To evaluate the contribution of the ceramic bodyon the spectra, we additionally performed measurements inconfocal geometry. The confocal setup was initially developedfor depth-resolved elemental mapping. However, it also allowsthe collection of depth-resolved XANES spectra (Figure 3b). Adetailed description of the confocal setup is given by Malzer et
Figure 1. (a) Black-figure shoulder lekythos, attributed to the TaleidesPainter, Attic, ca. 550−540 BC, Cahn Auktionen AG Basel (A.6/5Nov.2011 Lot 74), (b) optical microscope image of a cross section of amodern BG reproduction showing the glassy black layer over thereddish-brown porous bulk, (c) SEM image of a BG attic sherd, crosssection fresh fracture surface 2000×; dense micromorphology, glassyon top and near the body, flaky in the middle zone.
Figure 2. SEM image of a modern BG sherd, cross section freshfracture surface, magnification 120 000×; “clay” nanoparticles withrounded edges are still visible before diffusing in the glassy phase.
Figure 3. (a) Sketch of conventional and (b) confocal setup forXANES in fluorescence mode.
Analytical Chemistry Article
dx.doi.org/10.1021/ac500990k | Anal. Chem. 2014, 86, 6924−69306925
al.20 and Mantouvalou et al.21 Recently, we developed a depth-resolved confocal XANES analysis including correction ofabsorption effects for layered structures.22
Also for XANES spectra acquired in conventional modewithout a second lens in front of the detector, appropriateabsorption corrections have to be performed. For homoge-neous samples, analyzed by conventional XANES influorescence mode, several procedures exist to correctabsorption effects in the detected spectra.23−26 Nevertheless,these procedures are not applicable to attic pottery withoutconstrains due to the layered structure of the samples as shownin the optical microscopy and SEM micrographs of Figures 1band 1c referring to a modern reproduction and an ancientsherd, respectively.Therefore, we provide a combined methodological approach
for micro-XANES analysis of an analyte with stratifiedstructures considering absorption effects for both conventionaland confocal setups. Appropriate measures that have to betaken for the various steps of the experimental part as well asfor the data evaluation part are considered and explained.
■ INSTRUMENTATIONThe experiments were carried out at the μSpot beamline ofBerlin’s synchrotron radiation facility BESSY II.27,28 Theincoming X-ray beam is focused with a polycapillary half-lensproducing a spot size of about 30 μm fwhmE on the sample atthe iron K-edge energy. The fluorescence intensity is detectedwith a seven-element Si(Li) detector. The seven detectorelements are aligned on a surface of a sphere pointing to thesame position on the sample with equal distances to the focus.In front of the topmost detector element, a second
polycapillary half-lens is placed with fwhmD of 18 μm at theiron Kα fluorescence line energy. After alignment in terms ofmaximum overlap of both foci, the width of the formed probingvolume normal to the sample surface was determined followingthe calibration procedure for confocal micro-XANES8 to be σx= (14.1 ± 0.2) μm, corresponding to a fwhmx of (33.2 ± 0.5)μm.A sufficient spectral resolution for XANES measurements is
provided by a Si(311) double-crystal monochromator with anapproximate energy resolution of E/ΔE ≈ 25 000.Samples Description. Modern reproductions were pro-
duced following the manufacturing process developed byAloupi (1993)17,18 using different clays for the bulk and blackglaze and a three-step firing process, involving a decrease oftemperature during reduction, as described in The Attic BlackGlaze and the Three-Stage Firing. Modern reproductions wereproduced at three maximum temperatures (0: raw material, 1:870 °C, 2: 890 °C, and 3: 930 °C) using three differentfractions of an illitic ferruginous clay suspended in water inorder to study their dependence on the amount of Fe3+ and onthe appearance of the black glaze (Table 3). The graduallyincreasing particle size of the three fractions received from theclay−water system is expressed for convenience with theequivalent spherical diameter (ESD) A: <0.3 μm, B: <0.8 μm,and C: <5.5 μm). Particle size analysis (dynamic lightscattering_DLS) of the three clay fractions has shownfrequency distributions around 220−330, 560−770, and5300−5500 nm; the frequency distributions by intensityexpressing the total surface area for the three clay suspensionsare compatible with their ESD, i.e., A (<0.3 μm): 331 nm100%, B (<0.8 μm): 703 nm 97%, 5340 nm 3%, C (<5.5 μm):653 nm 68%, 5494 nm 32% .
Three Attic sherds from recent excavations in the center ofAthens were selected for the analysis; ARCH-ACROP-2 andHEL-ACROP-5 originate from the area of Makriyanni (newAcropolis Museum) while CL-KER-20 originates from the areanear ancient Kerameikos. All three sherds have a thick anduniform BG layer without visible defects under the stereoscope.The cross sections of all specimens, i.e., ancient sherds andmodern reproductions, were examined by SEM in order tomeasure the thicknesses of the glaze layer, revealing layerthicknesses between 21 and 32 μm (Figure 1c), which is in linewith previous studies by others reporting black glazethicknesses between 10 and 40 μm.29 The BG sherds analyzedhere were chosen among a set of 12 Attic BG samples whichhad been analyzed under slightly different experimentalconditions in the beginning of the project; this data set formedthe basis for the present analytical setup though a detailedaccount and has been omitted for convenience.
XANES Measurements. The scanned energy region forXANES measurements presented ranges from 7006 to 7406 eV.This energy range is split into four subranges with different stepsizes and different acquisition times (Table 1). Settings were set
such that the number of counts in the maximum of the pre-edge for the conventional detector element was higher than 30000. The extended region was only used for normalizationpurposes.
Measurement Strategy. XANES spectra were detected byall seven detector elements simultaneously. For each spatialposition of the probing volume, the confocal signal of thetopmost detector element was collected at the same time as thebulk signals of the other six detector elements. The bottomdetector element is aligned in the same geometry with respectto sample surface compared to the topmost element (see alsothe Supporting Information). Results shown here for conven-tional XANES refer to the measured spectra detected with thebottom detector to exclude different geometry effects in theconventional and confocal spectra.First, depth profiles were obtained by moving the sample
stepwise into the probing volume for excitation energies abovethe Fe absorption edge (here 7119 or 7200 eV) and monitoringthe iron fluorescence intensity detected with the confocaldetector element.30 Afterward, surface micro-XANES measure-ments of the black glaze top layer were carried out. To achievethis with signals collected only from the black glaze layer, thesample was moved to the motor position corresponding to thehalf of the maximum intensity of the depth scan in order toplace only about half of the probing volume inside the blackglaze. Using the quantification procedure for confocal micro-XRF developed by Mantouvalou et al.21 for reconstructingstratified structures, successive calculations revealed that theposition of the center of the probing volume was approximately5 μm in front of the sample surface.
Table 1. Energy Regions with Step Widths and AcquisitionTimes
part energy region, eVstep width,
eVmeasurement
time, s
1 (offset) 7006.28−7106.28 10 10−202 (pre-edge) 7106.28−7118.28 0.15 40−1303 (XANES) 7118.28−7172.28 0.5 15−403 (extendedregion)
7172.28−7406.28 10 10−20
Analytical Chemistry Article
dx.doi.org/10.1021/ac500990k | Anal. Chem. 2014, 86, 6924−69306926
Defining the extension of the whole probing volume inscanning direction to be at least 95% of the Gaussiandistribution (4*σx)
22 results in a probing volume of 56 μm.Thus, for measurement positions at half of the maximumintensity of the depth profile, the probing volume intrudesapproximately 23 μm ((56 μm)/2−5 μm) into the samples.Because the black glaze thickness of our samples is at
minimum 21 μm, surface measurements guarantee that onlysignal originating from the black glaze is detected in confocalmicro-XANES spectra excluding interference of the ceramicbody. Considerations about measurements of the black glazewith thicknesses in the range of 10 μm are discussed later.In comparison to confocal micro-XANES, conventional
micro-XANES yields integrated information from the surfaceas well as from the depth but with considerably higher countingrates. This is due to the restricted transmission of the secondlens in the confocal mode, which reduces the confocal signal.31
Furthermore, the size of the probing volume and its overlapwith the sample is limited resulting in reduced detectedfluorescence intensity.In case of identical spectra, the higher count rates of
conventional XANES spectra can be used for furthercalculations but different absorption effects have to be takeninto account, which will be elaborated in the following section.
■ QUANTIFICATION
Quantitative determination of the Fe3+/Fe ratio, whether fromconventional or confocal micro-XANES, is based on thedetailed analysis of the pre-edge region. The spectral evaluationis very sensitive to the normalization and backgroundsubtraction which is therefore described in the SupportingInformation in detail.After background subtraction the pre-edges are fitted with
two Gaussian functions. Each Gaussian function (i) is describedby its width (σi), its centroid position (Ci), and its area (Ai).The overall centroid position (C) and integrated intensity (A)are then determined by
∑=∑ ·
=CC AA
A A,i ii (1)
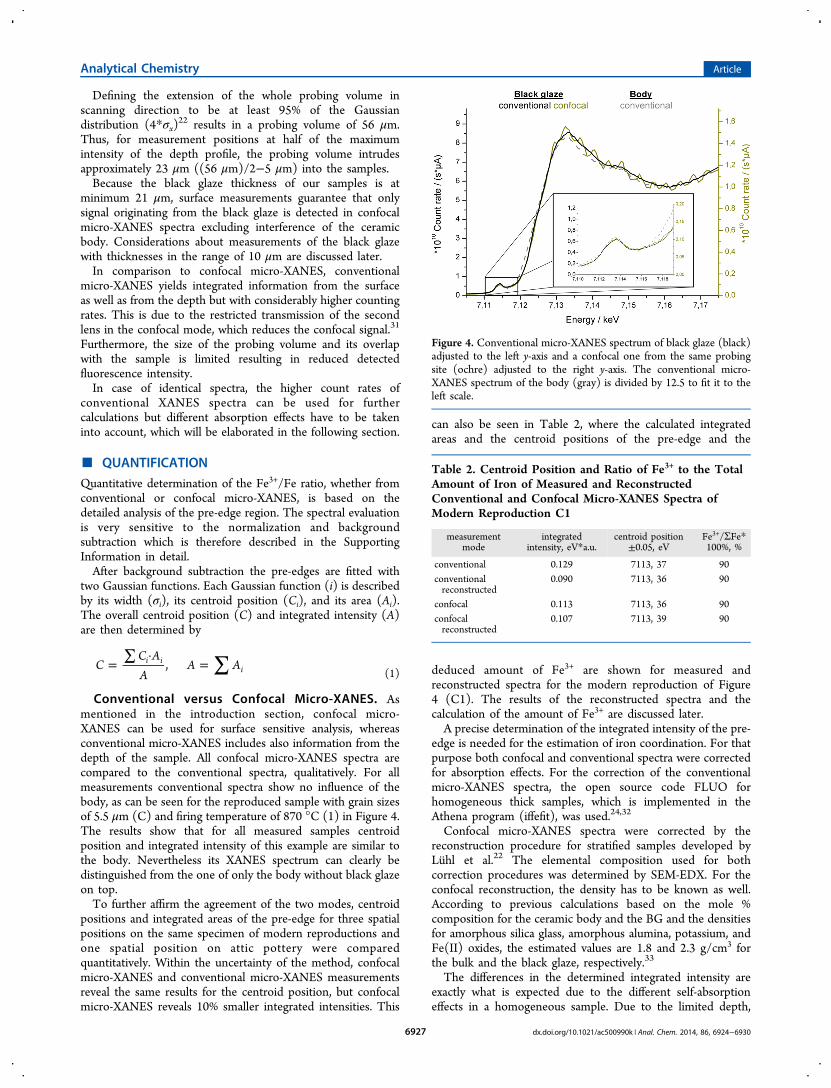
Conventional versus Confocal Micro-XANES. Asmentioned in the introduction section, confocal micro-XANES can be used for surface sensitive analysis, whereasconventional micro-XANES includes also information from thedepth of the sample. All confocal micro-XANES spectra arecompared to the conventional spectra, qualitatively. For allmeasurements conventional spectra show no influence of thebody, as can be seen for the reproduced sample with grain sizesof 5.5 μm (C) and firing temperature of 870 °C (1) in Figure 4.The results show that for all measured samples centroidposition and integrated intensity of this example are similar tothe body. Nevertheless its XANES spectrum can clearly bedistinguished from the one of only the body without black glazeon top.To further affirm the agreement of the two modes, centroid
positions and integrated areas of the pre-edge for three spatialpositions on the same specimen of modern reproductions andone spatial position on attic pottery were comparedquantitatively. Within the uncertainty of the method, confocalmicro-XANES and conventional micro-XANES measurementsreveal the same results for the centroid position, but confocalmicro-XANES reveals 10% smaller integrated intensities. This
can also be seen in Table 2, where the calculated integratedareas and the centroid positions of the pre-edge and the
deduced amount of Fe3+ are shown for measured andreconstructed spectra for the modern reproduction of Figure4 (C1). The results of the reconstructed spectra and thecalculation of the amount of Fe3+ are discussed later.A precise determination of the integrated intensity of the pre-
edge is needed for the estimation of iron coordination. For thatpurpose both confocal and conventional spectra were correctedfor absorption effects. For the correction of the conventionalmicro-XANES spectra, the open source code FLUO forhomogeneous thick samples, which is implemented in theAthena program (iffefit), was used.24,32
Confocal micro-XANES spectra were corrected by thereconstruction procedure for stratified samples developed byLuhl et al.22 The elemental composition used for bothcorrection procedures was determined by SEM-EDX. For theconfocal reconstruction, the density has to be known as well.According to previous calculations based on the mole %composition for the ceramic body and the BG and the densitiesfor amorphous silica glass, amorphous alumina, potassium, andFe(II) oxides, the estimated values are 1.8 and 2.3 g/cm3 forthe bulk and the black glaze, respectively.33
The differences in the determined integrated intensity areexactly what is expected due to the different self-absorptioneffects in a homogeneous sample. Due to the limited depth,
Figure 4. Conventional micro-XANES spectrum of black glaze (black)adjusted to the left y-axis and a confocal one from the same probingsite (ochre) adjusted to the right y-axis. The conventional micro-XANES spectrum of the body (gray) is divided by 12.5 to fit it to theleft scale.
Table 2. Centroid Position and Ratio of Fe3+ to the TotalAmount of Iron of Measured and ReconstructedConventional and Confocal Micro-XANES Spectra ofModern Reproduction C1
measurementmode
integratedintensity, eV*a.u.
centroid position±0.05, eV
Fe3+/ΣFe*100%, %
conventional 0.129 7113, 37 90conventionalreconstructed
0.090 7113, 36 90
confocal 0.113 7113, 36 90confocalreconstructed
0.107 7113, 39 90
Analytical Chemistry Article
dx.doi.org/10.1021/ac500990k | Anal. Chem. 2014, 86, 6924−69306927
confocal micro-XANES spectra exhibit less self-absorptioneffects. In the pre-edge region self-absorption effects causehigher detected intensities in edge-jump normalized spectra. Incontrast, the energetic positions of structures are expected to beinfluenced just to a negligible extend. That means higher self-absorption effects in conventional micro-XANES result inhigher integrated intensities but in the same centroid positionsas calculated for the example given in Table 2. Hence, formeasurements for which the shapes of conventional andconfocal micro-XANES spectra are identical, the conventionalmicro-XANES spectra can be used to determine centroidpositions, which simplify the measurement owing to bettercounting statistics.Nevertheless, a careful comparison has to be done, especially
when measurements have been carried out at positions wherethe thickness of the black glaze is in the range of 10 μm (lowerlimit14). In such a case differences between conventional andconfocal spectra are expected. For confocal spectra more than67% of the Gaussian distribution is within the black glaze (σx −5 μm = 9.1 μm). Due to absorption, the contribution of theblack glaze to the detected spectrum is even higher. Forconventionally detected spectra, calculations based on theSherman equation reveal a contribution of less than 30% for thefirst 10 μm. In that case the ceramic body has a much highercontribution to the spectra in comparison to the ones detectedin confocal mode.In Table 2 the extracted integrated intensity, centroid
position, and determined amount of Fe3+ are given for bothcorrection procedures. The centroid position does not changeand the integrated intensity decreases in comparison to the oneof the measured spectra. In comparison to the conventionalabsorption correction procedure the confocal reconstructionprocedure is less sensitive to variations in elementalcomposition.34 This results in a higher reliability in thedetermined integrated intensities for confocal measurements.For all four samples, for which the correction was carried out,the integrated intensity of the reconstructed confocal spectra isabout 20% less than for measured conventional spectra.Determination of Fe3+ Content. Wilke et al. determined
centroid positions and integrated intensities for iron inminerals2 and in glass3 for a large number of reference samplesand determined equations to calculate the Fe3+ content. For thebulk as well as for the raw material, BG clay paint in modernreproductions iron is expected to be in a mineral phase,whereas for the black glaze of fired ceramics Fe is expected tobe present in a mixture of glass and mineral due to the fact thatthe annealing temperature is substantially lower than theliquidus temperature expected for the reported composition.Thus, both methods for calibration of the pre-edge centroid todetermine the Fe3+ content for the fired black glaze wereapplied, and the results compared afterward. Both proceduresare briefly introduced below.For iron in minerals several combinations of coordination
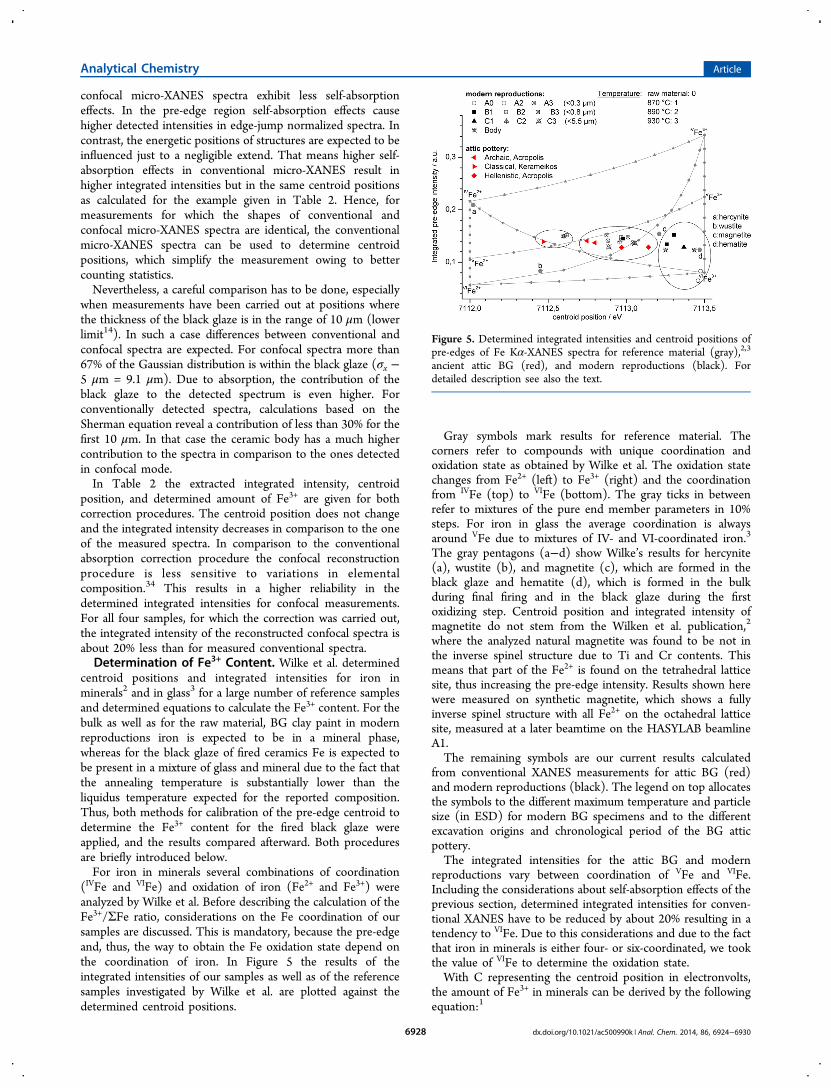
(IVFe and VIFe) and oxidation of iron (Fe2+ and Fe3+) wereanalyzed by Wilke et al. Before describing the calculation of theFe3+/ΣFe ratio, considerations on the Fe coordination of oursamples are discussed. This is mandatory, because the pre-edgeand, thus, the way to obtain the Fe oxidation state depend onthe coordination of iron. In Figure 5 the results of theintegrated intensities of our samples as well as of the referencesamples investigated by Wilke et al. are plotted against thedetermined centroid positions.
Gray symbols mark results for reference material. Thecorners refer to compounds with unique coordination andoxidation state as obtained by Wilke et al. The oxidation statechanges from Fe2+ (left) to Fe3+ (right) and the coordinationfrom IVFe (top) to VIFe (bottom). The gray ticks in betweenrefer to mixtures of the pure end member parameters in 10%steps. For iron in glass the average coordination is alwaysaround VFe due to mixtures of IV- and VI-coordinated iron.3
The gray pentagons (a−d) show Wilke’s results for hercynite(a), wustite (b), and magnetite (c), which are formed in theblack glaze and hematite (d), which is formed in the bulkduring final firing and in the black glaze during the firstoxidizing step. Centroid position and integrated intensity ofmagnetite do not stem from the Wilken et al. publication,2
where the analyzed natural magnetite was found to be not inthe inverse spinel structure due to Ti and Cr contents. Thismeans that part of the Fe2+ is found on the tetrahedral latticesite, thus increasing the pre-edge intensity. Results shown herewere measured on synthetic magnetite, which shows a fullyinverse spinel structure with all Fe2+ on the octahedral latticesite, measured at a later beamtime on the HASYLAB beamlineA1.The remaining symbols are our current results calculated
from conventional XANES measurements for attic BG (red)and modern reproductions (black). The legend on top allocatesthe symbols to the different maximum temperature and particlesize (in ESD) for modern BG specimens and to the differentexcavation origins and chronological period of the BG atticpottery.The integrated intensities for the attic BG and modern
reproductions vary between coordination of VFe and VIFe.Including the considerations about self-absorption effects of theprevious section, determined integrated intensities for conven-tional XANES have to be reduced by about 20% resulting in atendency to VIFe. Due to this considerations and due to the factthat iron in minerals is either four- or six-coordinated, we tookthe value of VIFe to determine the oxidation state.With C representing the centroid position in electronvolts,
the amount of Fe3+ in minerals can be derived by the followingequation:1
Figure 5. Determined integrated intensities and centroid positions ofpre-edges of Fe Kα-XANES spectra for reference material (gray),2,3
ancient attic BG (red), and modern reproductions (black). Fordetailed description see also the text.
Analytical Chemistry Article
dx.doi.org/10.1021/ac500990k | Anal. Chem. 2014, 86, 6924−69306928
∑ * = * ‐+ CFe / Fe 100% 66.7 ( 7112)3(2)
Wilke et al. calibrated the characteristics of the pre-edge of FeK-XANES to Fe3+ amounts of synthetic, slightly simplifiedbasaltic glass systems determined by Mossbauer spectroscopyusing the centroid position C (in eV) of the pre-edge:
∑ *
= − + + * −
−
+
C
Fe / Fe 100%
[ 0.0028 (0.000784 0.00052 (7112 )) ]
/ 0.00026
3
0.5
(3)
■ FE OXIDATION STATE OF ATTIC BLACK GLAZEPOTTERY
The results of the analysis in terms of centroid position andintegrated intensity of the pre-edge for most reduced attic BGpottery and modern reproductions (centroid positions from7112.4 and 7112.6 eV) are allocated within the triangle formedby wustite, magnetite, and hercynite as can be seen by the datapoints located in left ellipse (Figure 5), whereas results for rawmaterial samples, the ceramic bulk, and most of the modernreproductions fired at the lowest temperature Tmax (1: 870 °C)arrange near hematite as indicated by the right ellipse (centroidpositions from 7113.3 to 7113.5 eV, see Figure 5).The calculated contents of Fe3+ in different modern
specimens are shown in Table 3. For each average ESD (A:<0.3 μm, B: <0.8 μm, and C: <5.5 μm) and maximum firingtemperature (0: raw material, 1: 870 °C, 2: 890 °C, and 3: 930°C) the calculated Fe3+ content for both iron in minerals and inglasses is given in percentage values. For the raw unfired BGsamples and for the ceramic body, the reference values for ironin glass are not applicable and the corresponding values are
marked in italic and were not taken into account for the resultsin the right column. The results are rounded to 10% values,since the accuracy of the method and the inhomogeneity of theglaze layer down to a microscopic level do not allow for moreprecise results. Moreover, since the Fe3+ content of the blackglaze can vary considerably from spot to spot it isrecommended to analyze each sample on several spots.To conclude, a dependence of the Fe3+ amount on the firing
temperature can be reported: By raising the maximum firingtemperature up to 890 °C, the amount of Fe3+ decreases. Ateven higher temperatures (Tmax 930 °C) the Fe3+ amountincreases again. Smaller grain sizes lead to lower amounts ofFe3+ except for the maximum firing temperature of 930 °Cwhere the Fe3+ amount is the same for all ESD values due toincomplete reduction and/or reoxidation at slightly highertemperature.In Table 4 the results of Fe3+ contents from the attic BG are
summarized. The most reduced black glaze in this study
corresponds to the classical BG sherd (Kerameikos, classicalperiod) presenting high-quality BG with a characteristic bluish-black color. This lowest Fe3+ value correlates with the modernBG produced from the finest clay paint (ESD < 0, 3 μm) whenfired at Tmax 890 °C ORO conditions. The results supportempirical observations on the quality tests of modern BGpottery produced at THETIS’ workshop over a period of 10years (i.e., since 2003).
■ CONCLUSIONIn the present study we showed and discussed the correlationof the manufacturing technique and the appearance of the blackglaze with the amount of Fe3+. We compared the surfacesensitivity of confocal XANES with higher count rates ofconventional XANES. A comparison of spectra of both setupsfor each measurement position assured that the layer thicknessof the black glaze is appropriate for the analysis. This had to bedone due to the inhomogeneous nature of the investigatedsamples. A calculation of the Fe3+ amount was done throughthe analysis of extracted centroid positions of the Fe pre-edgeaccording to methods previously presented for iron in glass andmineral phases. For the calculation of the Fe3+ amount for ironin glass, an estimation of the iron coordination was done bymeans of four reconstructed confocal XANES spectra.It was verified that the best quality Attic black glaze with the
lowest amount of Fe3+ results from colloidal clay suspension inwater using specific ferruginous illitic clays with grain sizes <0.8μm and annealing at Tmax 890−910 °C under ORO conditions.These very narrow criteria for the optimal maximum firingtemperature may explain the observed inhomogeneousvitrification of the BG layer since it requires very accuratecontrol of the kiln conditions. The combination of conventional
Table 3. Amount of Fe3+ in Modern BG Specimensa
method: iron in
resultminerals glass
BG Sherd Fe(III)/% Fe(III)/% Fe(III)/%
A (<0.3 μm) raw material 96 88 10098 92
890 °C 32 24 20−30930 °C 50 38 40−60
60 46B (<0.8 μm) 870 °C 79 64 40−80
83 6857 44
890 °C 31 24 20−6033 2556 43
930 °C 62 48 40−6050 38
C (<5.5 μm) 870 °C 88 75 80−100100 99
890 °C 56 43 40−6055 42
930 °C 51 39 40−6063 49
body 94 84 80−9078 63
aItalicized values were not considered in the calculation of the results(see text).
Table 4. Amount of Fe3+ for the Attic Pottery
method: iron in
resultminerals glass
age origin Fe(III)/% Fe(III)/% Fe(III)/%
Archaic (6th c. BC) Acropolis 41 31 30−5045 34
Classical (5th c. BC) Kerameikos 24 18 20Hellenistic (4th c. BC) Acropolis 57 43 40−70
70 55
Analytical Chemistry Article
dx.doi.org/10.1021/ac500990k | Anal. Chem. 2014, 86, 6924−69306929
and confocal micro-XANES enabled the semiquantification ofthe oxidation state of the iron in the black glaze layer only,avoiding any contribution from the bulk substrate, i.e., theceramic body. This new approach provides the basis for a large-scale analysis involving a wide range of ancient decoratedspecimens in order to study the development of the ancientmanufacturing process in Attica and in other productioncenters over time.
■ ASSOCIATED CONTENT*S Supporting InformationDetailed description of the normalization and backgroundcorrection of the XANES spectra and additional informationabout the setup. This material is available free of charge via theInternet at http://pubs.acs.org/
■ AUTHOR INFORMATIONCorresponding Author*E-mail: [email protected] Addresses¶ElettraSincrotrone Trieste, Italy.∥ESRF, Grenoble, France.Author Contributions⊥These authors contributed equally.NotesThe authors declare no competing financial interest.
■ ACKNOWLEDGMENTSThe research work presented in this paper was initiated duringa first experiment that took place at BESSY II in Nov 2008, inthe frame of a collaborative work on “Elemental and structuralcharacterization of ancient Greek glassy nano-materials”,between NCSR Demokritos and TU Berlin. The authorsacknowledge the support by a number of people in their homeinstitutions; Dr. Ivo Zizak from the μSpot beamline of BESSYII offered valuable technical support during all experiments;Iphigenia Ed. Nalbani from THETIS authentics LTD wasresponsible for the manufacturing of laboratory specimens. Dr.A.G. Karydas, Dr. D. Sokaras, and Mrs. V. Kantarellou fromNCSR Demokritos contributed during the first experimentalrun.
■ REFERENCES(1) Waychunas, G. A.; Apted, M. J.; Brown, G. E., Jr. Phys. Chem.Miner. 1983, 10, 1−9.(2) Wilke, M.; Farges, F.; Petit, P. E.; Brown, G. E., Jr.; Martin, F. Am.Mineral. 2001, 86, 714−730.(3) Wilke, M.; Partzsch, G. M.; Bernhardt, R.; Lattard, D. Chem. Geol.2005, 220, 143−161.(4) Berry, A. J.; O’Neill, H. St. C.; Jayasuriya, K. D.; Campbell, S. J.;Foran, G. J. Am. Mineral. 2003, 88, 967−977.(5) Gliozzo, E.; Kirkman, I. W.; Pantos, E.; Turbanti, I. M.Archaeometry 2004, 46 (2), 227−246.(6) Bardelli, F.; Barone, G.; Crupi, V.; Longo, F.; Maisano, G.;Majolino, D.; Mazzoleni, P.; Venuti, V. J. Synchrotron Rad. 2012, 19,661−674.(7) Oberlies, F. Naturwissenschaften 1968, 55 (6), 277−281.(8) Longworth, G.; Warren, S. E. Nature 1975, 255, 625−7.(9) Schumann, T. Ber. Dtsch. Keram. Ges. 1942, 23, 408−27.(10) Hofmann, U.; Theisen, R. Z. Anorg. Allg. Chem. 1965, 341 (3−4), 207−216.(11) Winter, A. Technische Beitra ge zur Archa ologie 1; Romisches-Germanisches Zentralmuseum Mainz: Mainz, Germany , 1959.(12) Noble, J. V. Am. J. Archaeol. 1960, 64, 307−318.
(13) Noll, W.; Holm, R.; Born, L. Angew. Chem., Int. Ed. 1975, 4 (9),602−613.(14) Winter, A. Die Antike Glanztonkeramik: Praktische versuche;Philip von Zabern: Mainz, Germany, 1978.(15) Tite, M. S.; Bimson, M.; Freestone, I. C. Archaeometry 1982, 24(2), 117−26.(16) Maniatis, Y.; Aloupi, E.; Stalios, A. Archaeometry 1993, 35 (1),23−34.(17) Aloupi, E. Nature and Micromorphology of Paint Layers inAncient Ceramics. Ph.D. Thesis; Ph.D publication Ioannina, 1994;ISBN 960-90007-0-3, pp S 63−111 (available online at http://thesis.ekt.gr/thesisBookReader/id/3643).(18) Aloupi-Siotis, E. In Papers on Special Techniques in AthenianVases; Lapatin, K., Ed.; The J. P. Getty Publications: Los Angeles, CA,2008; ppS113−128.(19) Koningsberger, D. C.; Prins, R. X-ray absorption: Principles,applications, techniques of EXAFS, SEXAFS, and XANES; John Wileyand Sons Inc.: New York, 1987.(20) Malzer, W.; Kanngiesser, B. Spectrochim. Acta, Part B 2005, 60,1334−1341.(21) Mantouvalou, I.; Malzer, W.; Schaumann, I.; Luhl, L.; Dargel,R.; Vogt, C.; Kanngiesser, B. Anal. Chem. 2008, 80, 819−826.(22) Luhl, L.; Mantouvalou, I.; Malzer, W.; Schaumann, I.; Vogt, C.;Hahn, O.; Kanngiesser, B. Anal. Chem. 2012, 84, 1907−1914.(23) Eisebitt, S.; Boske, T.; Rubensson, J.; Eberhardt, W. Phys. Rev. B1993, 47, 14103−14109.(24) Haskel, D. FLUO: Correcting XANES for self-absorption influorescence measurements. In Computer program and documentation(online). Available from http://www.aps.anl.gov/xfd/people/haskel/fluo.html 1999, access date: 10/2011.(25) Pfalzer, P.; Urbach, J.; Klemm, M.; Horn, S.; Denboer, M.;Frenkel, A.; Kirkland, J. Phys. Rev. B 1999, 60, 9335−93.(26) Iida, A.; Noma, T. Jpn. J. Appl. Phys. 1993, 32, 2899−2902.(27) Erko, A.; Schafers, F.; Firsov, A.; Peatman, W. B.; Eberhardt, W.;Signorato, R. Spectrochim. Acta, Part B 2004, 59 (10−11), 1543−1548.(28) Erko, A.; Zizak, I. Spectrochim. Acta, Part B 2009, 64 (9), 833−848.(29) Tang, C. C.; MacLean, E. J.; Roberts, M. A.; Clarke, D. T.;Pantos, E. J. Archaeol. Sci. 2001, 28, 1015−1024.(30) Schmitz, S.; Moller, A.; Wilke, M.; Malzer, W.; Kanngiesser, B.;Bousquet, R.; Berger, A.; Schefer, S. Eur. J. Mineral. 2009, 21, 927−945.(31) Wolff, T.; Mantouvalou, I.; Malzer, W.; Nissen, J.; Berger, D.;Zizak, I.; Sokaras, D.; Karydas, A.; Grlj, N.; Pelicon, P.; Schutz, R.;Zitnik, M.; Kanngiesser, B. J. Anal. At. Spectrom. 2009, 24, 669−675.(32) Ravel, B. ATHENA User’s Guide [online], Available fromhttp://cars9.uchicago.edu/ifeffit/BruceRavel/Horae, 2009, accessdate: 10/2011, version 1.5.(33) Sokaras, D.; Bistekos, E.; Georgiou, L.; Salomon, J.; Bogovacd,M.; Aloupi-Siotis, E.; Paschalis, V.; Aslani, I.; Karabagia, S.; AnastasiosLagoyannis, A.; Harissopulos, S.; Kantarelou, V.; Karydas, A.-G. Nucl.Instrum. Methods Phys. Res., Sect. B 2011, 269 (5), 519−527.(34) Luhl, L. Tiefenaufgeloste Rontgenabsorptionsspektroskopie. Ph.D.Dissertation [Online], Technische Universitat Berlin, April 2012.http://opus4.kobv.de/opus4-tuberlin/frontdoor/index/index/docId/3402 (acccessed Jan 12, 2013).
Analytical Chemistry Article
dx.doi.org/10.1021/ac500990k | Anal. Chem. 2014, 86, 6924−69306930
Related Documents