UK AD & BIOGAS TRADESHOW 6-7 JULY 2016 NEC BIRMINGHAM

Welcome message from author
This document is posted to help you gain knowledge. Please leave a comment to let me know what you think about it! Share it to your friends and learn new things together.
Transcript
UK AD & BIOGAS
TRADESHOW
6-7 JULY 2016NEC BIRMINGHAM

WELCOME AND
INTRODUCTION
JOINING THE LINKS IN THE FOOD CHAIN

LAUNCHING THE FOOD WASTE
RECYCLING ACTION PLAN
CHARLOTTE MORTON, ADBA CEO
RAY GEORGESON, CHAIRMAN, FOOD WASTE RECYCLING ACTION PLAN STEERING
GROUP
LINDA CRICHTON, HEAD OF RESOURCE MANAGEMENT, WRAP
A Food Waste Recycling Action Plan for England
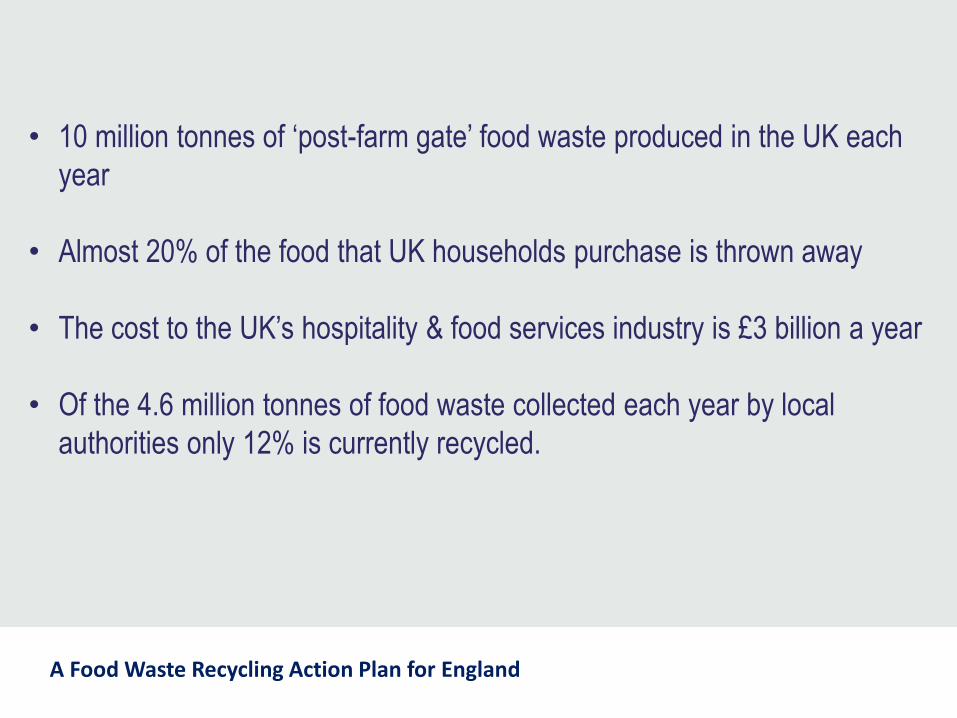
• 10 million tonnes of ‘post-farm gate’ food waste produced in the UK each
year
• Almost 20% of the food that UK households purchase is thrown away
• The cost to the UK’s hospitality & food services industry is £3 billion a year
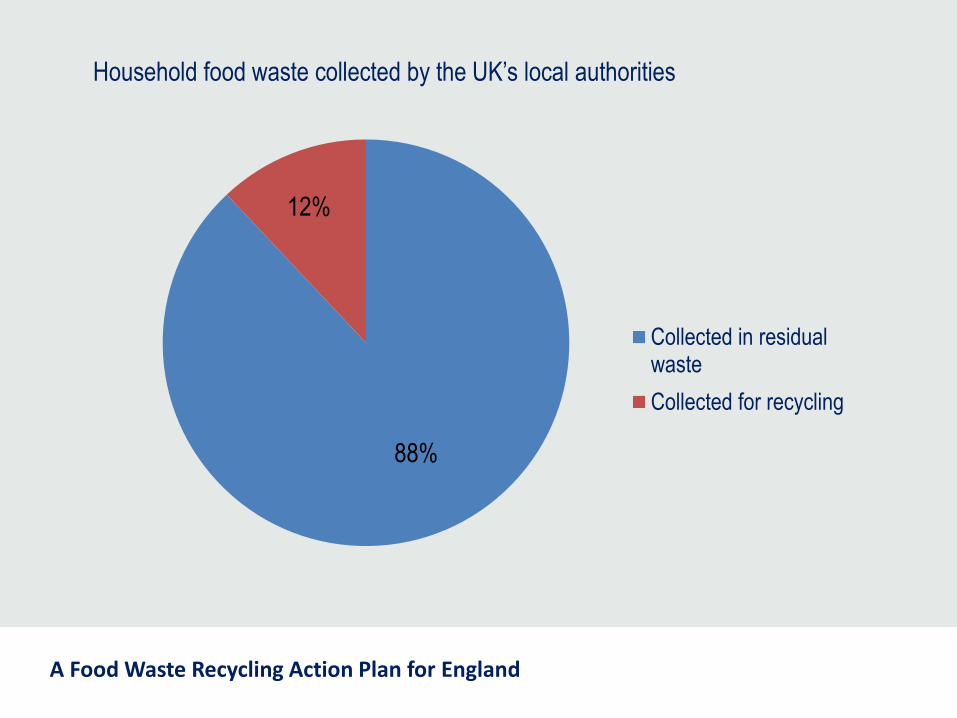
• Of the 4.6 million tonnes of food waste collected each year by local
authorities only 12% is currently recycled.
A Food Waste Recycling Action Plan for England
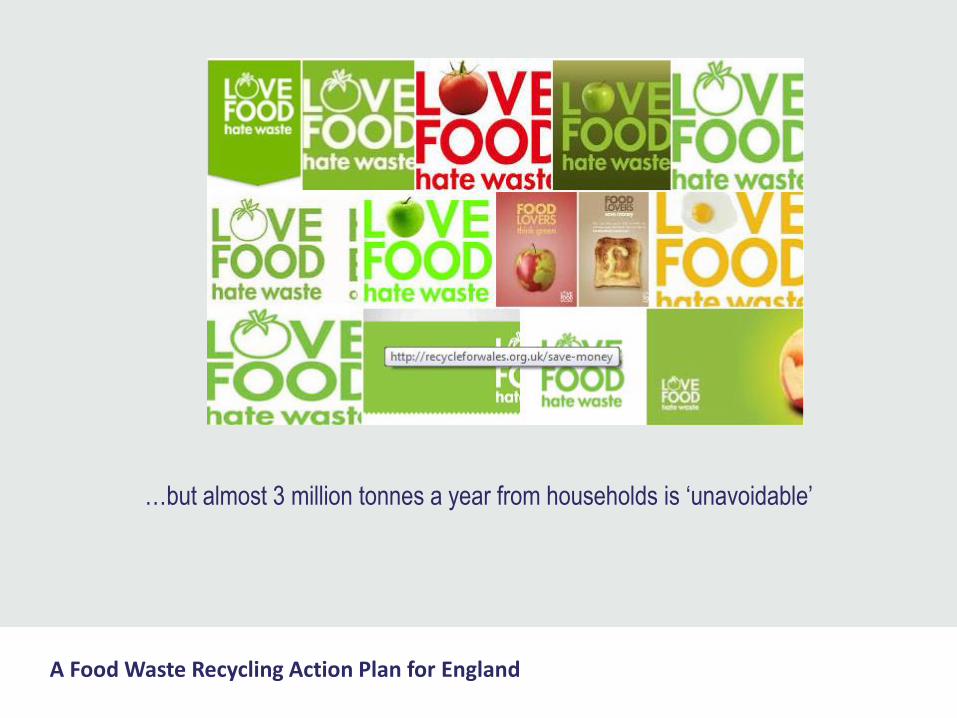
…but almost 3 million tonnes a year from households is ‘unavoidable’
A Food Waste Recycling Action Plan for England
88%
12%
Collected in residualwaste
Collected for recycling
Household food waste collected by the UK’s local authorities

A Food Waste Recycling Action Plan for England
0%
10%
20%
30%
40%
50%
60%
70%
80%
90%
Metalpackaging
Glass Paper &Board
Plastic Textiles &Footwear
Gardenwaste
Food waste WEEE &other scrap
metal
Other(including
wood)
Household waste: capture rate by material 2012/13

A Food Waste Recycling Action Plan for England
The Food Waste Recycling Action Plan is the industry’s response to the challenge of
increasing food waste recycling in England.

A Food Waste Recycling Action Plan for England
• Increase the amount of food waste collected
from households and the commercial and
industrial sector.
• Provide long term sustainable feedstocks for
the operators of food waste processing plants,
both anaerobic digestion (AD) and in vessel
composting (IVC).
• Share the costs and benefits of collecting and
recycling food waste across the food waste
supply chain

A Food Waste Recycling Action Plan for England

A Food Waste Recycling Action Plan for England
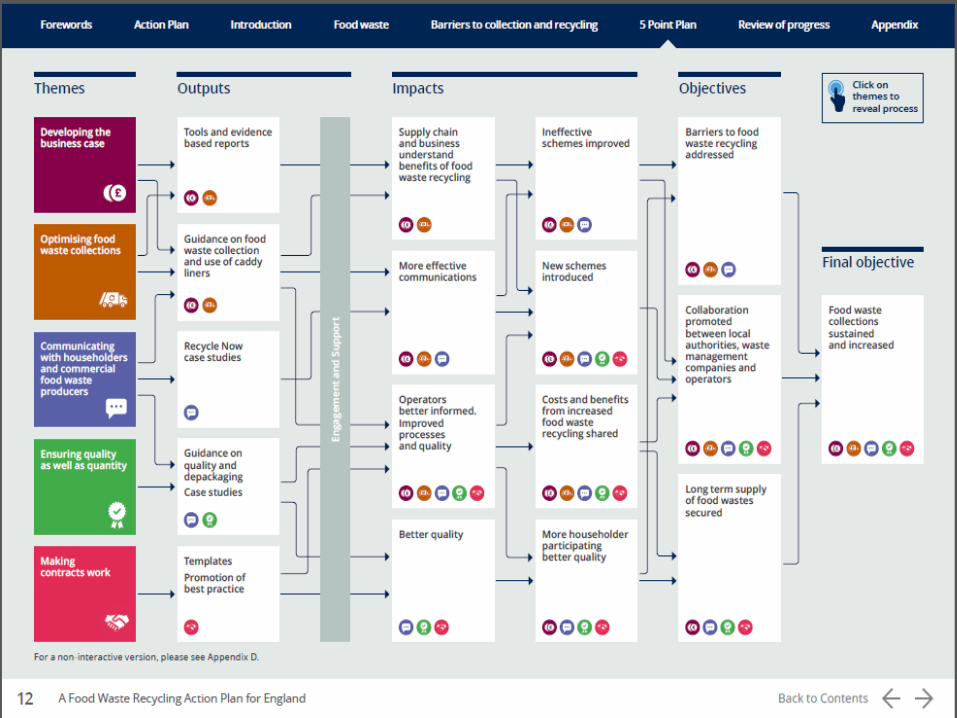
1. Developing the business case
2. Optimising food waste collections
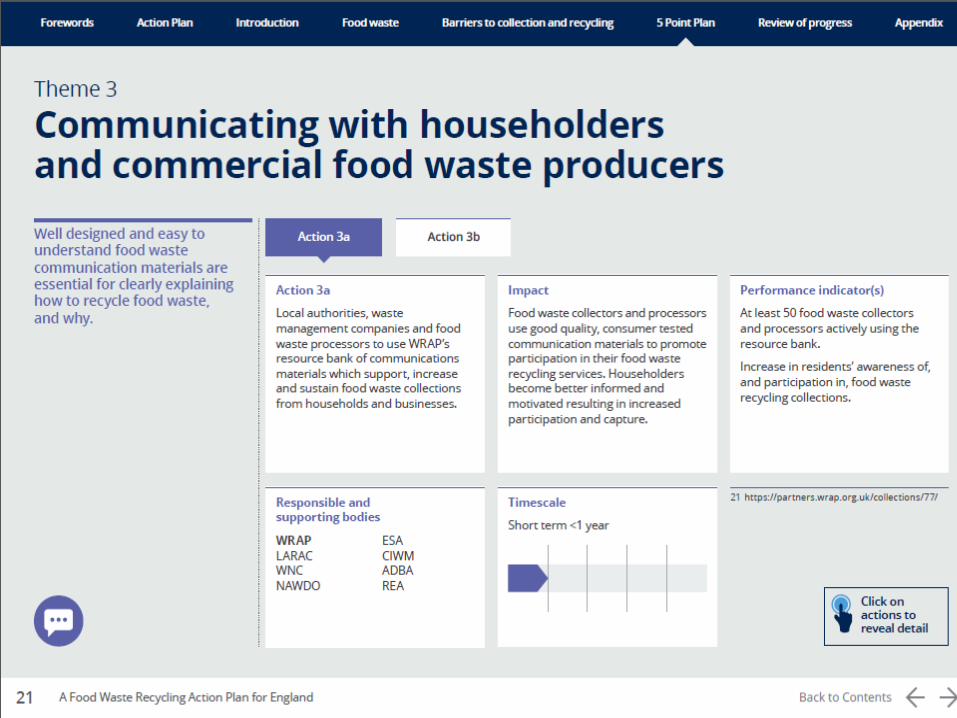
3. Communicating with householders and
commercial food waste producers
4. Ensuring quality as well as quantity
5. Making contracts work


A Food Waste Recycling Action Plan for England
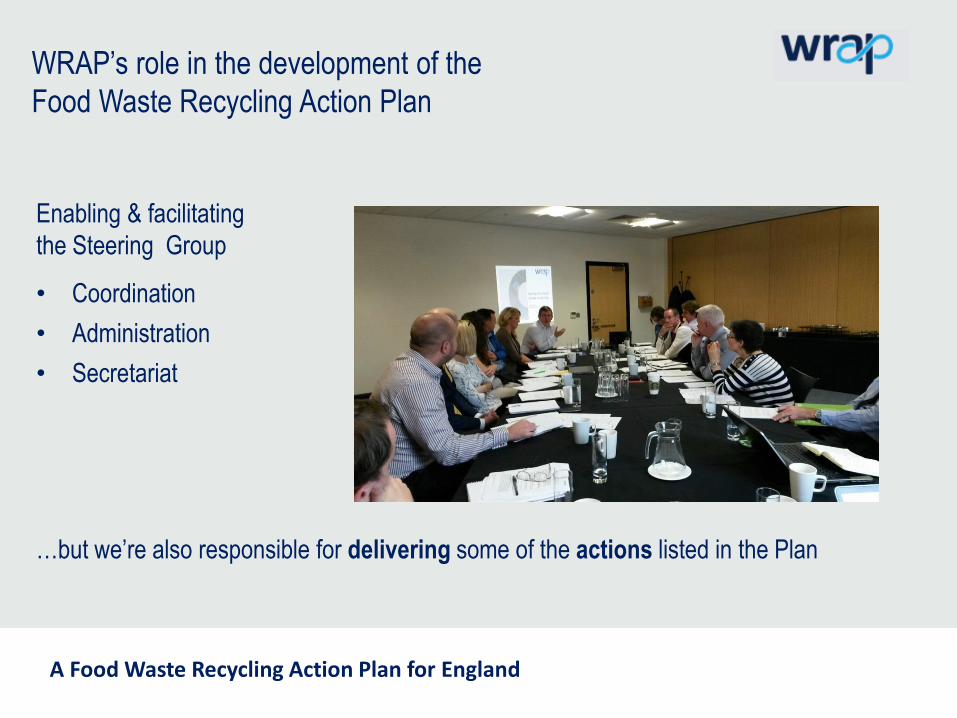
WRAP’s role in the development of the
Food Waste Recycling Action Plan
Enabling & facilitating
the Steering Group
• Coordination
• Administration
• Secretariat
…but we’re also responsible for delivering some of the actions listed in the Plan

A Food Waste Recycling Action Plan for England
Why WRAP supports the Food Waste Recycling Action Plan
• Voluntary industry-led initiative
• Provides a road map for the food waste recycling industry – to help it to realise
it’s full potential
• Establishes a supportive landscape for those already active in food waste
recycling, and for those considering introducing new food waste collections;
• Promotes greater collaboration across the food waste supply chain – essential if
the long term supply of food waste is to be secured
• Will deliver environmental and economic benefits

A Food Waste Recycling Action Plan for England
The Framework for greater consistency in household recycling proposes
the weekly collection of food waste


A Food Waste Recycling Action Plan for England
Communication materials to encourage participation
in food waste collections
A Food Waste Recycling Action Plan for England
A Food Waste Recycling Action Plan for England
0.00
2.00
4.00
6.00
8.00
10.00
12.00
14.00
16.00
1 2 3 4 5 6 7 8 9 10
Uplift askg/hh/year
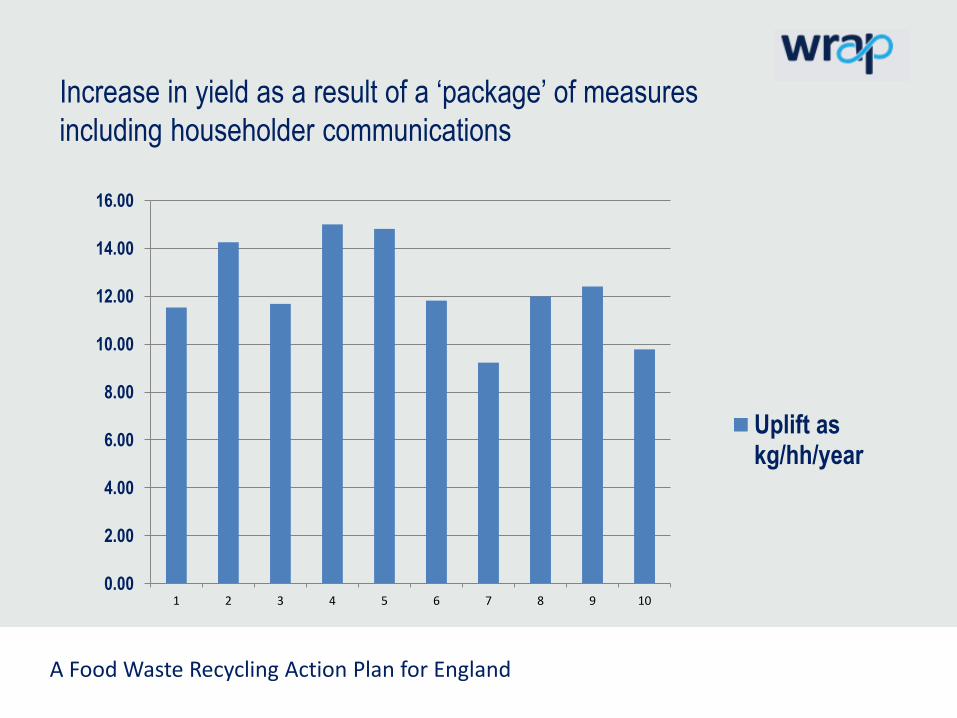
Increase in yield as a result of a ‘package’ of measures
including householder communications
A Food Waste Recycling Action Plan for England
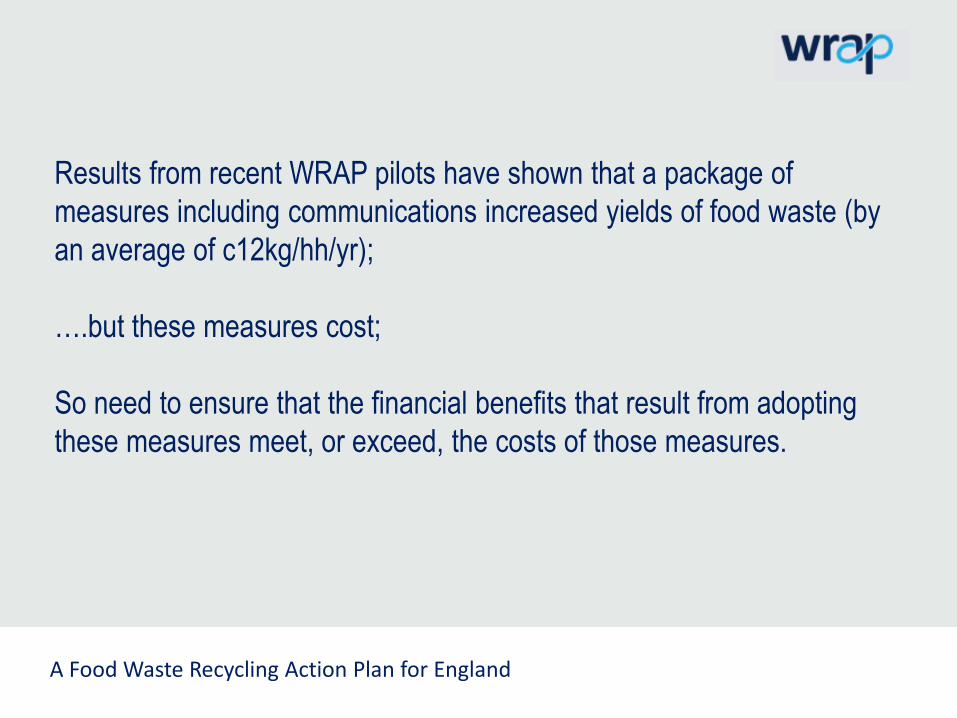
Results from recent WRAP pilots have shown that a package of
measures including communications increased yields of food waste (by
an average of c12kg/hh/yr);
….but these measures cost;
So need to ensure that the financial benefits that result from adopting
these measures meet, or exceed, the costs of those measures.
A Food Waste Recycling Action Plan for England
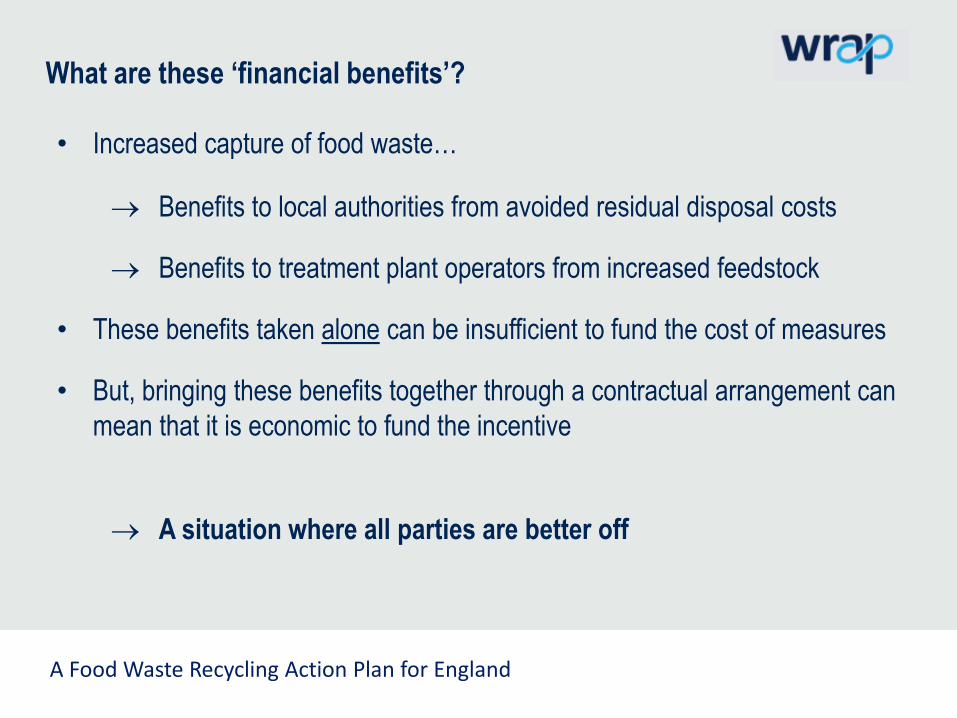
What are these ‘financial benefits’?
• Increased capture of food waste…
Benefits to local authorities from avoided residual disposal costs
Benefits to treatment plant operators from increased feedstock
• These benefits taken alone can be insufficient to fund the cost of measures
• But, bringing these benefits together through a contractual arrangement can
mean that it is economic to fund the incentive
A situation where all parties are better off

A Food Waste Recycling Action Plan for England
Cost Benefit Analysis Tool for the
food waste recycling industry
A Food Waste Recycling Action Plan for England
View the plan at:
www.wrap.org.uk/foodwasterecycling
Follow the conversation on twitter #FWRAP

QUESTIONS AND COMMENTS FROM THE FLOOR
THE EU CIRCULAR ECONOMY PACKAGE:
IMPLEMENTATION, REGULATION, AND
IMPACT ON AD
RAY GEORGESON, CHAIRMAN, FOOD WASTE RECYCLING ACTION PLAN STEERING
GROUP
SUSANNA PFLUGER, SECRETARY GENERAL, EUROPEAN BIOGAS ASSOCIATION
ROY HATHAWAY, ESA AND FEAD
LUCIA GURNARI, ECOMONDO FAIR
The EU Circular Economy Package: implementation, regulation, and impact
on AD
UK AD & Biogas 2016: Conference7 July 2016 Birmingham
Susanna PflügerSecretary General
European Biogas Association
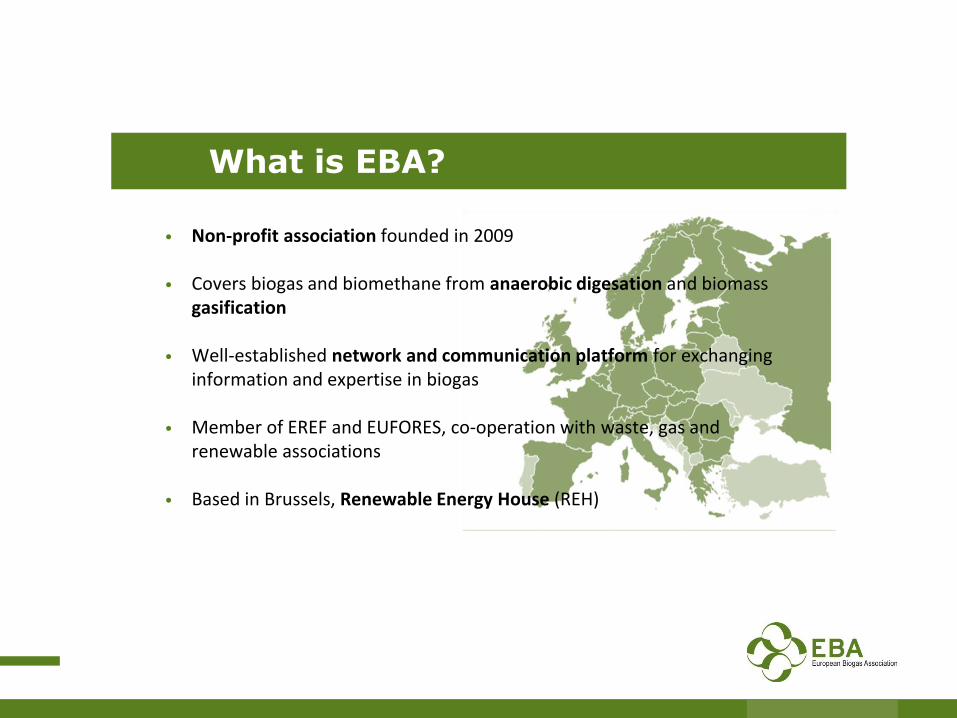
• Non-profit association founded in 2009
• Covers biogas and biomethane from anaerobic digesation and biomass gasification
• Well-established network and communication platform for exchanging information and expertise in biogas
• Member of EREF and EUFORES, co-operation with waste, gas and renewable associations
• Based in Brussels, Renewable Energy House (REH)
What is EBA?

www.european-biogas.eu
37 National Associations + 52 Companies = Representing >7,100 Stakeholders in 25 Countries
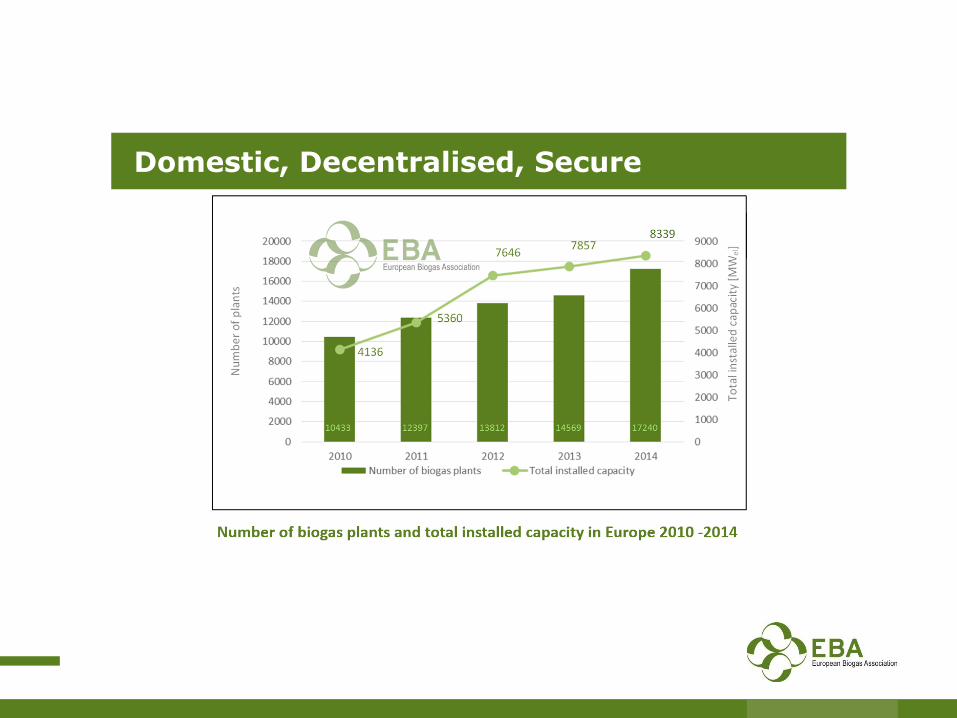
Domestic, Decentralised, Secure

Versatility of Biogas in Europe

Status – Biogas from FAB Waste
* - waste biogas plants allowed to use FAB industry waste
www.fabbiogas.eu
78 MT of green waste landfilled in the EU in 2012Emitting 110 MT CO2eq1
If digested, these emissions would have been avoided
In addition, 11 million tons of CO2eq from fossil fuel would have been substituted
Digesting this and returning the organic fertiliser would deliver:
400,000t of nitrogen (N)
120,000t of phosphorus (P2O5)
450,000t potassium (K2O)
3 million tonnes of organic carbon (to fight soil erosion)
Feedstock Potential – Biowaste
1 National Reporting Landfill Directive
Every YEAR!
Avoid greenhouse gas emissions (GHG) from landfills; production of renewable energy which replaces fossil fuels; production of organic fertilisers which replace energy intensive mineral fertilisers
Produce renewable energy in the form of biogas and biomethane – In 2014, 63.6 TWh of electricity in Europe from AD - equivalent to the consumption of 14.6 million EU households
Recycle organic material in the form of organic fertiliser
Reap social and economic benefits from producing fertilisers and energy from waste: additional revenue for farmers, municipalities and the food industry from producing renewable energy and fertilisers from their waste; around 70,000 jobs in Europe and potential for many more!
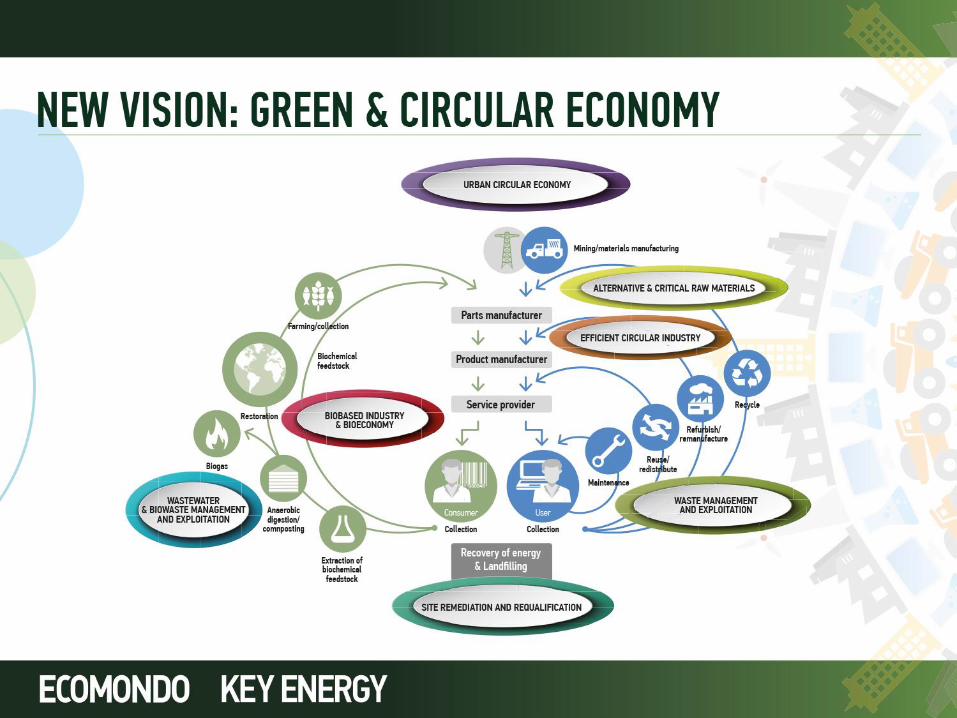
Contribution of AF to the Europe’s Circular Economy

Europe's transition towards a circular economy which will boost global competitiveness, foster sustainable economic growth and generate new jobs
A common EU target for recycling 65% of municipal waste by 2030;
A binding landfill target to reduce landfill to maximum of 10% of municipal waste by 2030;
A ban on landfilling of separately collected waste;
Promotion of economic instruments to discourage landfilling ;
Separate collection of bio-waste where technically, environmentally and economically practicable and appropriate. Member States to encourage the recycling, including composting, and digestion of bio-waste
EU Commission’s Proposal to Close the Loop

Strengthen bio-waste separate collection by removing exemptions – remove words “economically practicable and appropriate”
A progressive incineration ban for organic waste should be included in the amendment of the WFD
Remove manure destined for anaerobic digestion from the scope of the WFD
Clarify and strengthen the provisions for by-products in the WFD
EBA’s Key Messages to Revise the Proposal

First draft report from the European Parliament: stronger EU harmonisation, higher targets and a much better place for biowaste: by 2025, the organic recycling of bio-waste from municipal waste shall be increased to a minimum of 65 % by weight; extend the scope from municipal to industrial waste
Next steps in the EP: committee vote on 7 November, plenary vote likely in December
First Council debate stressing the reduction of food waste; different views on by-products and feasibility of the targets
Next Steps in Legislative Procedure - Parliament and Council

A vast majority of separately collected biowaste directed towards AD
Only synchronised environmental, waste and agricultural policies can ensureeasy access to more feedstock
AD to further expand from rural to urban areas – more jobs, bigger plants
Big plants more difficult to develop (public acceptance, logistics)
Improved performance of wastewater treatment plants through treatment of biowaste (increase the efficiency of the plants)
Increased biogas and biomethane production in Europe
Impact on Europe’s AD Sector
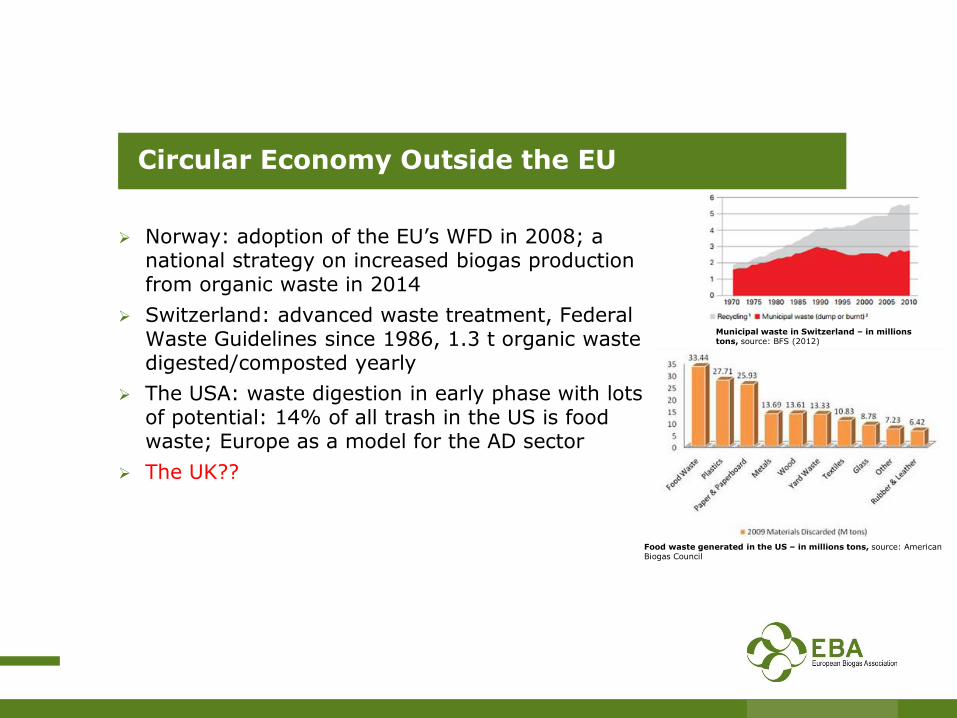
Norway: adoption of the EU’s WFD in 2008; a national strategy on increased biogas production from organic waste in 2014
Switzerland: advanced waste treatment, Federal Waste Guidelines since 1986, 1.3 t organic waste digested/composted yearly
The USA: waste digestion in early phase with lots of potential: 14% of all trash in the US is food waste; Europe as a model for the AD sector
The UK??
Circular Economy Outside the EU
Municipal waste in Switzerland – in millions tons, source: BFS (2012)
Food waste generated in the US – in millions tons, source: American Biogas Council

www.biogasconference.eu
• 3rd biannual Conference on biogas & syngas & biomethane from AD and gasification
• Keynote speakers from the European institutions and the industry – including Commission VP speech on Europe’s Circular Economy!

Thank you
Renewable Energy House
Rue d'Arlon 63-65
B - 1040 Brussels
+32 24.00.10 – [email protected]
European Biogas AssociationSusanna PflügerSecretary [email protected]

The EU Circular Economy Package and its impact on AD
ADBA Conference: 7 July 2016
Roy Hathaway
Europe Policy Adviser
Environmental Services Association

EU Circular Economy package

EU Commission 2015 Proposal - 1
Prevention
“Member States shall take measures…..which shall….reduce the generation of food waste in primary production, in processing and manufacturing, in retail and other distribution of food, in restaurants and food services as well as in households.”
NB no legally binding FW reduction target

EU Commission 2015 Proposal - 2
Separate collection
Replaces first part of WFD Article 22 with:
“ Member States shall ensure the separate collection of bio-waste where technically, environmentally and economically practicableand appropriate to ensure the relevant quality standards and to attain [the MW recycling targets].”

EU Parliament amendments - 1
Prevention
“Member States shall take measures…..which shall….reduce the generation of food waste at the retail and consumer levels and reduce food losses along production and supply chains…..with the aim of achieving a Union food waste reduction target of 50% by 2030”
EU Parliament amendments - 2
Recycling target
“Member States shall take the necessary measures to ensure that by 2025 the organic recycling of bio-waste from municipal waste shall be increased to a minimum of 65% by weight.”
EU Parliament amendments - 3
Separate collection
“Member States shall set up systems for the separate collection at source of bio-waste by 31 December 2020 to ensure the relevant quality standards for compost and digestate and to attain [the MW recycling targets].”
NB the reference to TEEP in the Commission proposal is deleted in the EP amendment

ESA’s Bio-Waste Strategy
Focus on full value chain
Bio-waste hierarchy
AD as recycling
Monitor for quality
Food waste prevention
Bio-waste collections
Conclusions
ESA and FEAD support the Commission proposals to reduce food waste and to make separate bio-waste collections mandatory
subject to a TEEP assessment
UK govt should put policy framework in place to drive towards a more circular economy for the UK organics sector

The EU Circular Economy Package and its impact on AD
Thank you for your attention!
Roy HathawayEurope Policy Advisor
Environmental Services [email protected]

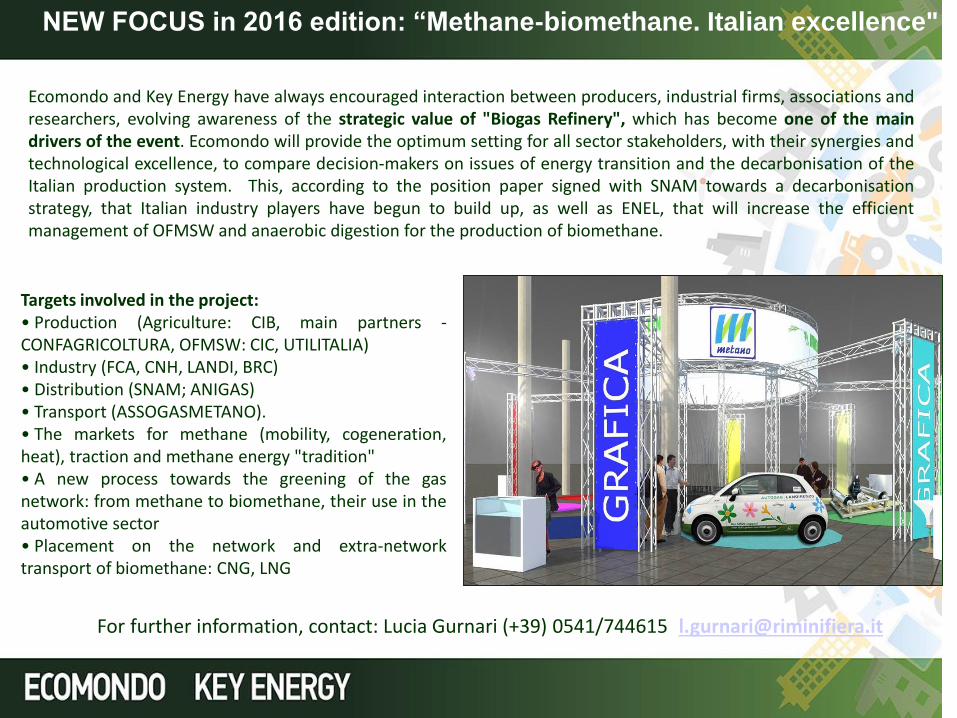
Ecomondo and Key Energy have always encouraged interaction between producers, industrial firms, associations andresearchers, evolving awareness of the strategic value of "Biogas Refinery", which has become one of the maindrivers of the event. Ecomondo will provide the optimum setting for all sector stakeholders, with their synergies andtechnological excellence, to compare decision-makers on issues of energy transition and the decarbonisation of theItalian production system. This, according to the position paper signed with SNAM towards a decarbonisationstrategy, that Italian industry players have begun to build up, as well as ENEL, that will increase the efficientmanagement of OFMSW and anaerobic digestion for the production of biomethane.
NEW FOCUS in 2016 edition: “Methane-biomethane. Italian excellence"
Targets involved in the project:• Production (Agriculture: CIB, main partners -CONFAGRICOLTURA, OFMSW: CIC, UTILITALIA)• Industry (FCA, CNH, LANDI, BRC)• Distribution (SNAM; ANIGAS)• Transport (ASSOGASMETANO).• The markets for methane (mobility, cogeneration,heat), traction and methane energy "tradition"• A new process towards the greening of the gasnetwork: from methane to biomethane, their use in theautomotive sector• Placement on the network and extra-networktransport of biomethane: CNG, LNG
For further information, contact: Lucia Gurnari (+39) 0541/744615 [email protected]


QUESTIONS AND COMMENTS FROM THE FLOOR
CASE STUDIES: FOOD WASTE
COLLECTIONS FROM AROUND THE
WORLD
DR DAVID GREENFIELD, MANAGING DIRECTOR, SOENECS
DR PAUL, BIOCOLLECTORS
JULIAN O’NEILL, CEO, BIOGEN
PETER JONES, SENIOR CONSULTANT, EUNOMIA
ALBERTO CONFALONIERI, CHAIR OF THE TECHNOCAL COMMITTEE, ITALIAN
COMPOSTING AND BIOGAS ASSOCIATION
DIARMID JAMEISON, SLR CONSULTING
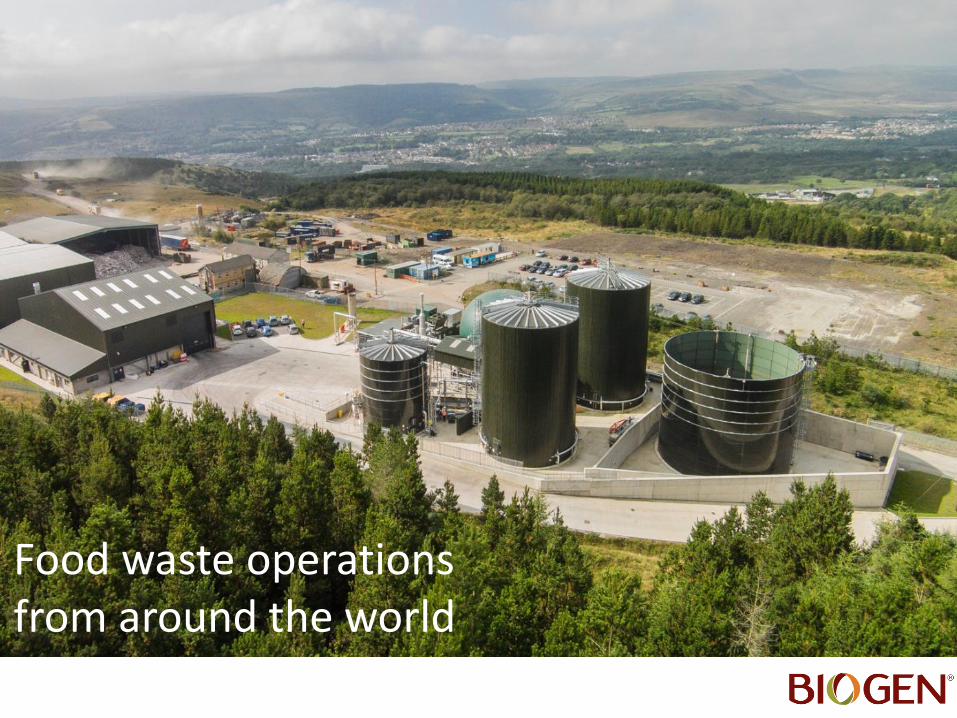
Food waste operations from around the world


Food Waste Collections
Where to Look for Good Examples
Peter Jones
Principal Consultant
Eunomia Research & Consulting
7th July 2016
Agenda
1. Commercial Food Waste – Japan,
Scotland
2. Household Food Waste – Variations
3. Conclusions

Japan
• Creating a market
• Food Waste Act 2000• Agricultural businesses are required to use recycled
fertilizers and feed
• Driving diversion
• Food Recycling Act• Mandates that businesses take measures to promote the
recycling of food resources
• Mandatory plans, escalating targets
• Claimed 82% recycling rate for food waste across the C&I sector
• Principally driven by manufacturing sector
• Has increased self sufficiency and cut farmers’ costs
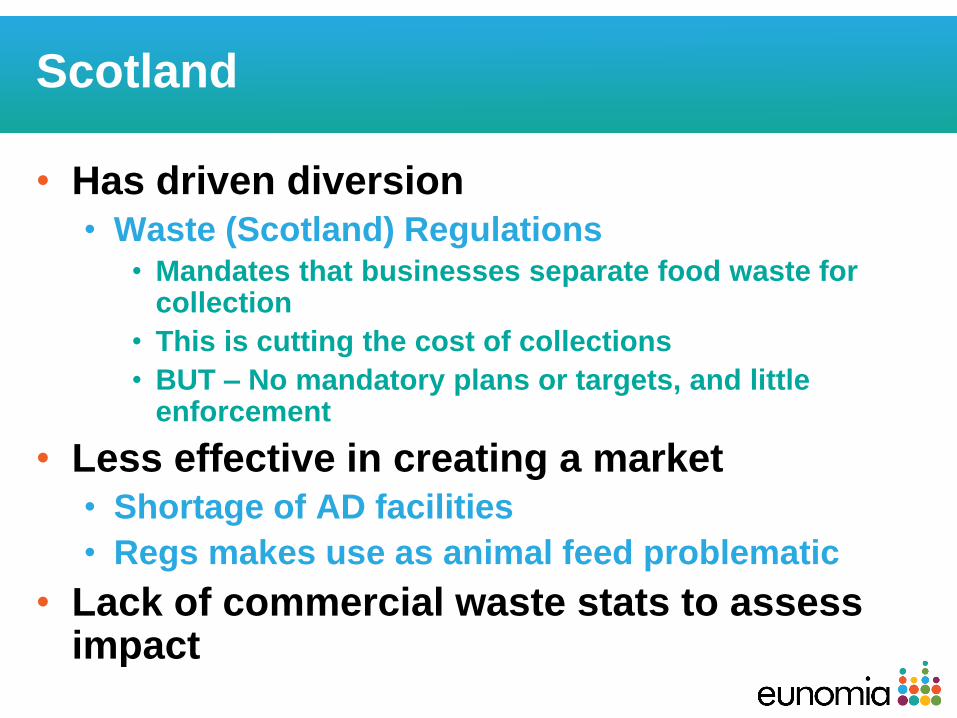
Scotland
• Has driven diversion
• Waste (Scotland) Regulations• Mandates that businesses separate food waste for
collection
• This is cutting the cost of collections
• BUT – No mandatory plans or targets, and little enforcement
• Less effective in creating a market
• Shortage of AD facilities
• Regs makes use as animal feed problematic
• Lack of commercial waste stats to assess impact
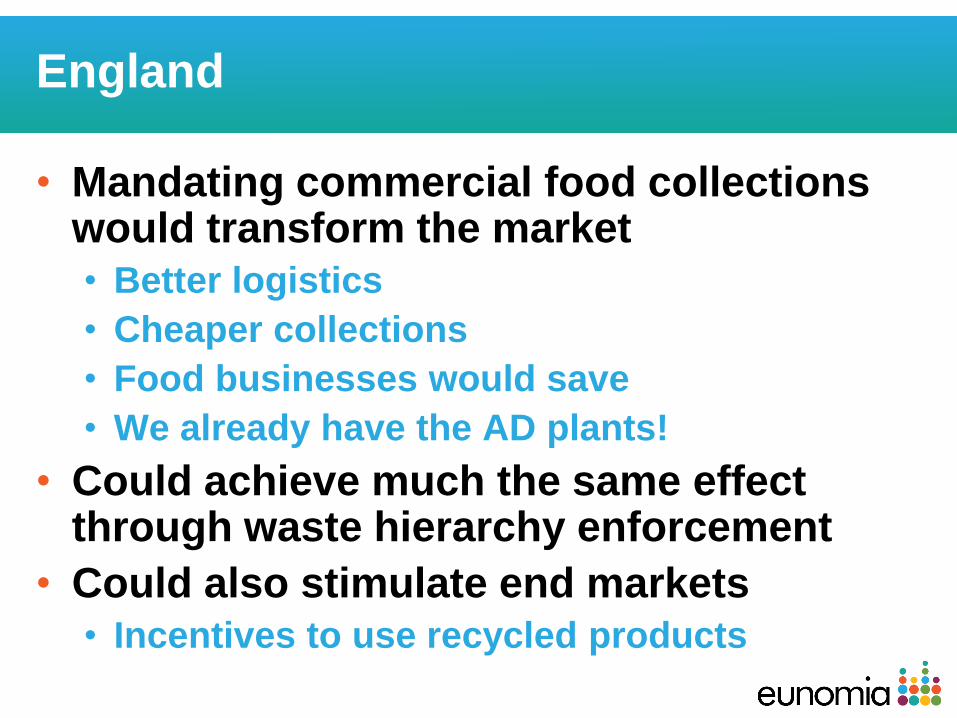
England
• Mandating commercial food collections would transform the market
• Better logistics
• Cheaper collections
• Food businesses would save
• We already have the AD plants!
• Could achieve much the same effect through waste hierarchy enforcement
• Could also stimulate end markets
• Incentives to use recycled products

Household Collections
• 45% of English councils do not offer
separate food waste collections, or
food/garden
• All authorities in Wales offer them!
• Barriers?
• Huge variation in performance
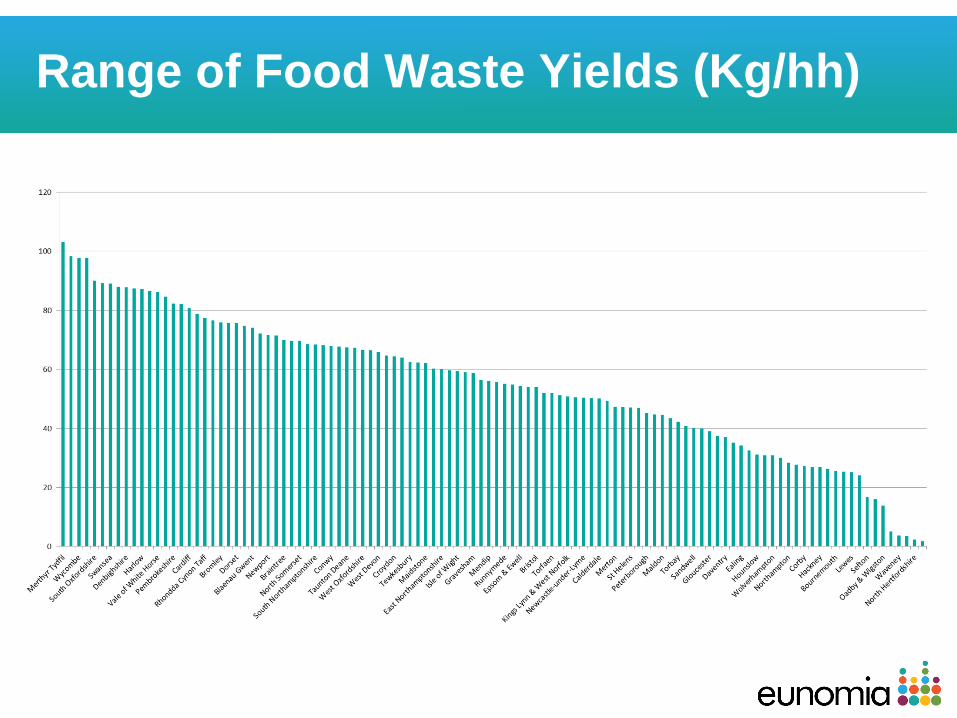
Range of Food Waste Yields (Kg/hh)
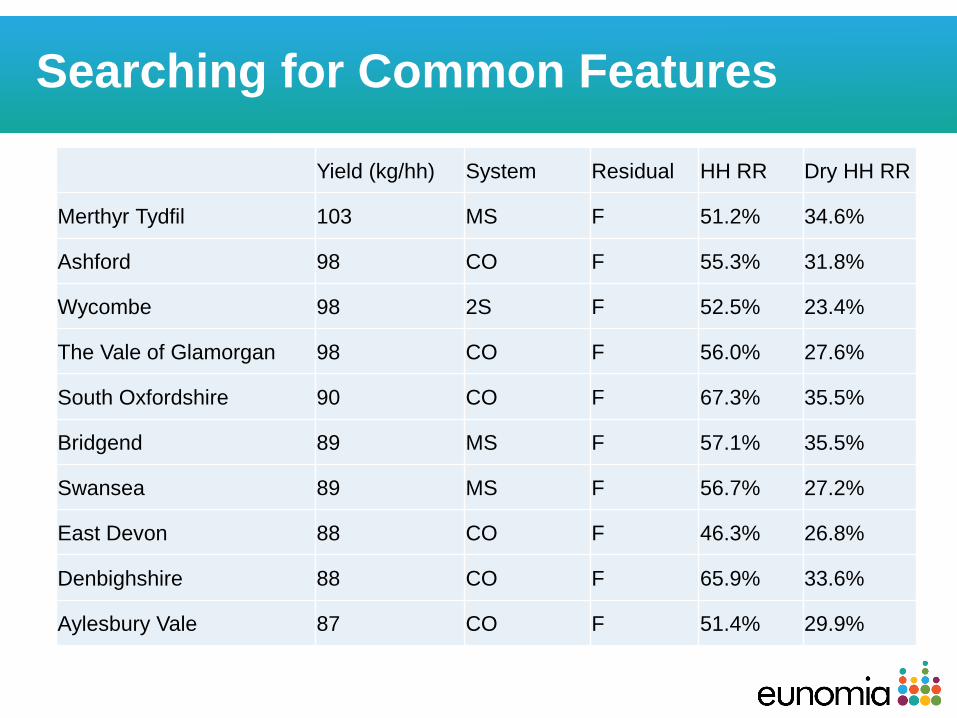
Searching for Common Features
Yield (kg/hh) System Residual HH RR Dry HH RR
Merthyr Tydfil 103 MS F 51.2% 34.6%
Ashford 98 CO F 55.3% 31.8%
Wycombe 98 2S F 52.5% 23.4%
The Vale of Glamorgan 98 CO F 56.0% 27.6%
South Oxfordshire 90 CO F 67.3% 35.5%
Bridgend 89 MS F 57.1% 35.5%
Swansea 89 MS F 56.7% 27.2%
East Devon 88 CO F 46.3% 26.8%
Denbighshire 88 CO F 65.9% 33.6%
Aylesbury Vale 87 CO F 51.4% 29.9%

Conclusions
• Japan shows us just how far C&I food
waste recycling can go
• If England adopted the same approach as
Scotland (and NI, and soon Wales), it could
make considerable progress
• For local authorities
• Separating food waste need not be costly
• Yield is key
• We know which authorities are doing well
• Let’s do more to analyse why!

Successful implementation of separate collection
of food waste in urban areas
07/07/2016UK AD&Biogas
Alberto Confalonieri, Marco Ricci-Jürgensen CIC – Italian Composting and Biogas Association- Rome-Italy
www.compost.it

Keywords for a successful implementation
• Large and constant participation
• high capture rates
• Good quality (i.e. low content of impurities)
• Economical sustainability
Keywords for a successful implementation
• Large and constant participation
• high capture rates
• Good quality (i.e. low content of impurities)
• Economical sustainability
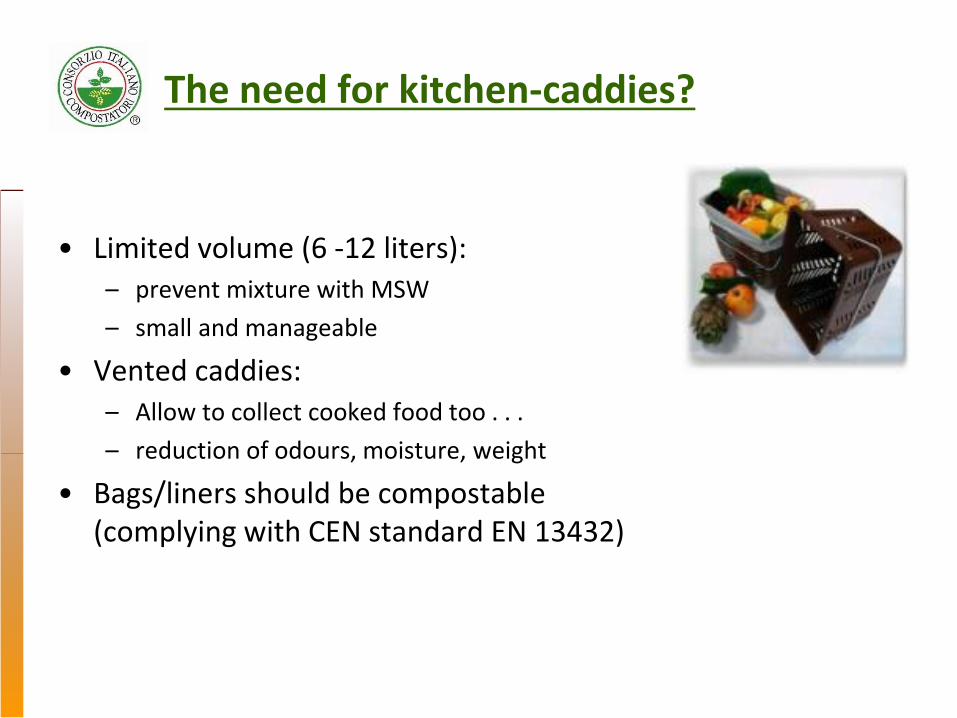
The need for kitchen-caddies?
• Limited volume (6 -12 liters):– prevent mixture with MSW
– small and manageable
• Vented caddies:– Allow to collect cooked food too . . .
– reduction of odours, moisture, weight
• Bags/liners should be compostable (complying with CEN standard EN 13432)
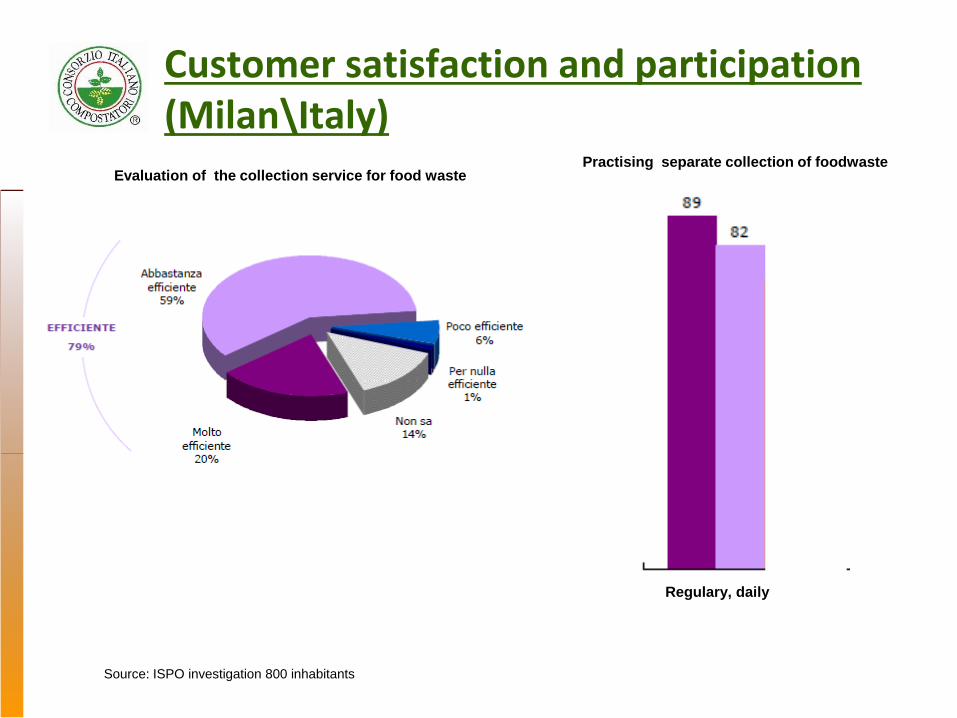
Customer satisfaction and participation (Milan\Italy)
Source: ISPO investigation 800 inhabitants
Evaluation of the collection service for food wastePractising separate collection of foodwaste
Regulary, daily
Keywords for a successful implementation
• Large and constant participation
• high capture rates
• Good quality (i.e. low content of impurities)
• Economical sustainability

www.compost.it
Peculiarities of biowaste separate collection• Focus intensive source separation schemes on food waste only
• Foodwaste (including cooked
food) collected 2-4 times/week
• Garden waste is collected at
bring sites or doorstep at lower
frequency (weekly or
fortnightly)
• Residual waste collection
with lower frequency than
foodwaste (in order to
discourage organic waste
in residual waste)

Milan Metropolitan Area
Population 1.5 M inhab
Density 5-7.000 inhab/km2
Italy’s most vital Economical center
Transient population
Year 2012: food waste collection at Ho.Re.Ca sector only 23kg/inhab/yr
Separate collection 34,5% (2012)
AMSA is the Public company responsible for MSW management in Milan

Milan Metropolitan Area
Year 2014: kerbside collection in the whole city 91kg/inhab/yr
Separate collection 49,9% (2014)
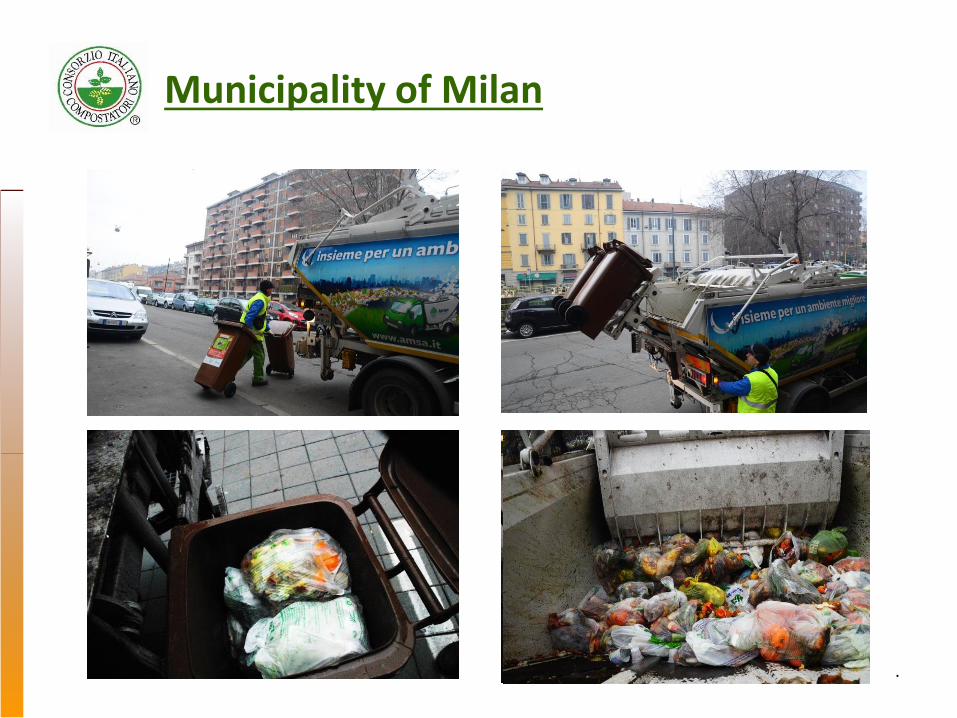
Municipality of Milan
.


Prompt results after the implementation
Recycling of 130,000 t/y of foodwaste (2014/2015)
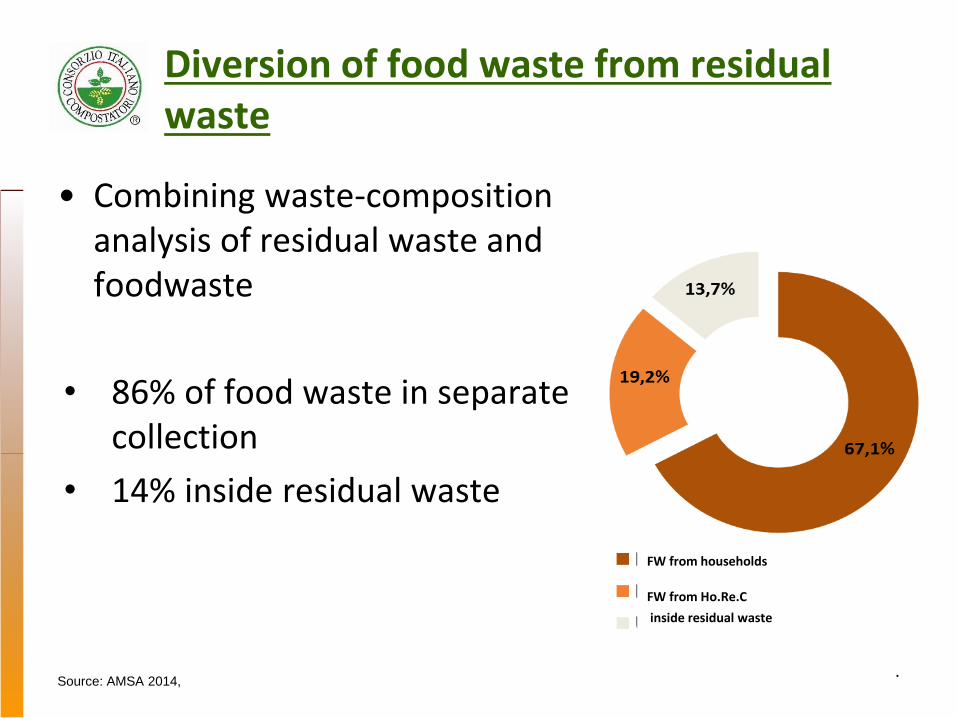
Diversion of food waste from residual waste
• Combining waste-composition analysis of residual waste and foodwaste
• 86% of food waste in separate collection
• 14% inside residual waste
.
FW from households
FW from Ho.Re.C
inside residual waste
Source: AMSA 2014,
Keywords for a successful implementation
• Large and constant participation
• high capture rates
• Good quality (i.e. low content of impurities)
• Economical sustainability

Quality of food waste (non-compostable content)
102Analysis performed by CIC
Average4,27% ± 2,95%
City-center Sub-urbs Social-housing Average
2 months
8 months
14 months
Average
Source: AMSA 2014,

Quality of food waste (non-compostable content)
103impurities inside food waste delivered to CIC’s composting and AD plants - year 2015
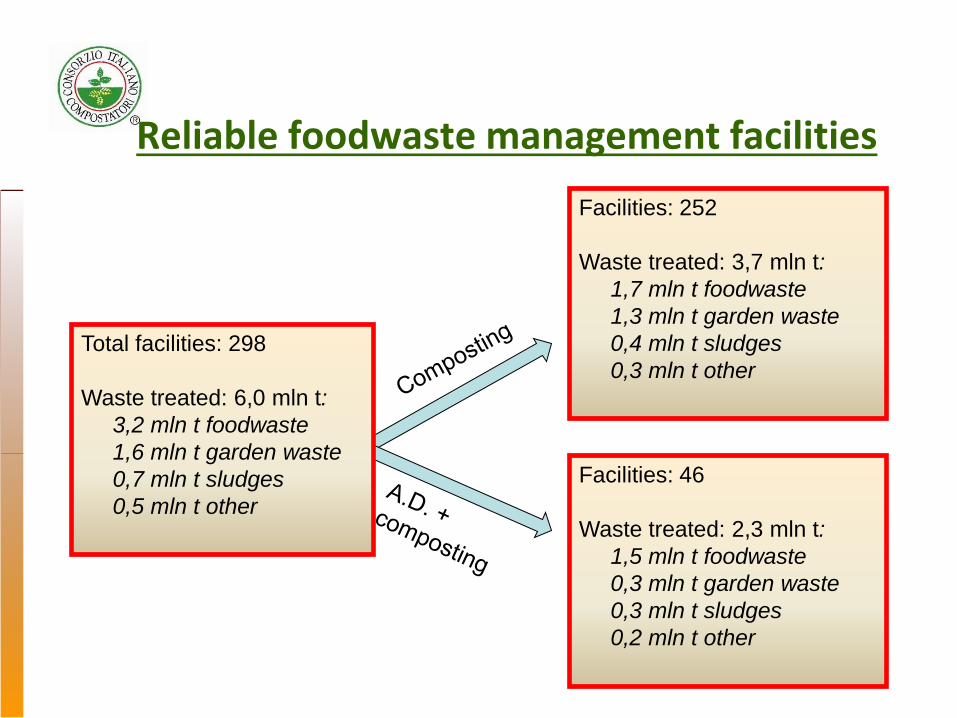
Reliable foodwaste management facilities
Facilities: 252
Waste treated: 3,7 mln t:
1,7 mln t foodwaste
1,3 mln t garden waste
0,4 mln t sludges
0,3 mln t other
Facilities: 46
Waste treated: 2,3 mln t:
1,5 mln t foodwaste
0,3 mln t garden waste
0,3 mln t sludges
0,2 mln t other
Total facilities: 298
Waste treated: 6,0 mln t:
3,2 mln t foodwaste
1,6 mln t garden waste
0,7 mln t sludges
0,5 mln t other
Keywords for a successful implementation
• Large and constant participation
• high capture rates
• Good quality (i.e. low content of impurities)
• Economical sustainability

MSW management costs are stable despite the increasing complexity of MSW management
Region Veneto (Italy); data evaluated by the Author; 2009

Milan waste costs
• The overall scheme for the City of Milan is cost-neutral
• The waste cost (Financial Plan of AMSA) remained substantially unchanged between 2013/2014, compared to the increase of life INDEX in Italy
• Average cost in Lombardy for MSW disposal 95€/ton
• Avarage cost in Milan for Food waste composting 72-74€/ton

Conclusions
• Separate collection of food waste is widespread in Italy, and shown to be possible even in large cities; it reaches outstanding results (Milan: 91 kg/inhab/yr)
• Vented kitchen-caddy & compostable bio-bags (EN13342 certified) increase acceptance and participation
• Low contamination of feedstock is the key-element for producing quality compost and digestate allowing for recycling at AD/C plant
• Total MSW management cost are found to be non-increasing compared to “low-recycling” municipalities, especially in the medium term considering the increase of disposal costs
Thank you
Italian Composting and Biogas Association

Insight into California: – organic waste / AD sector development
Diarmid Jamieson
Technical Director, SLR Consulting Ltd
7th July 2016

Working in Diverse Business Areas
Minerals Infrastructure Energy
Industry Planning and
DevelopmentWaste
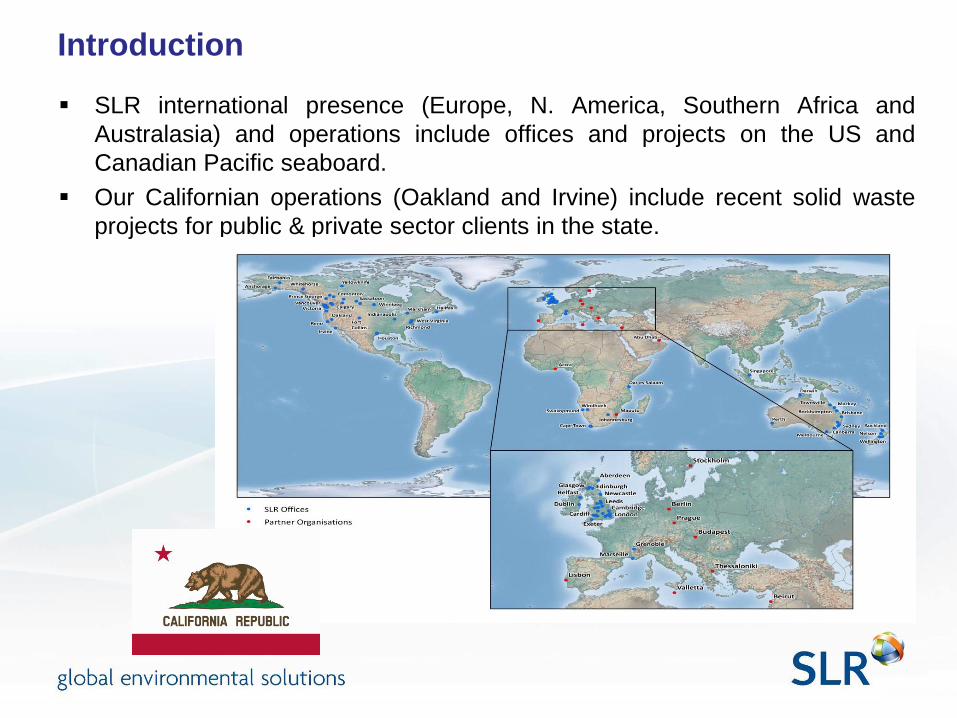
Introduction
SLR international presence (Europe, N. America, Southern Africa and
Australasia) and operations include offices and projects on the US and
Canadian Pacific seaboard.
Our Californian operations (Oakland and Irvine) include recent solid waste
projects for public & private sector clients in the state.

Organics Collection:California:• c.40 million population (most populous US
state) and 3rd largest in area;
• 6th largest economy (GDP) in the world;
• State has diverse range of climatic zones and
an extensive arable/orchards agricultural sector;
• CA has some of the most progressive
environmental legislation and renewable energy
targets in the US;
• Includes generating 1/3 of electricity from
renewable sources by 2020.
Waste Organics Sector:• State has well-established green / yard waste
collection system (>20 years) with strong
demand for quality compost from agricultural /
horticultural end-users, orchards etc.
• Collection services fully privatised but contracts
are organised/managed by city/county
authorities;
• Food waste collection started c.10 years ago in
San Francisco but changes in CA state
legislation since 2011 is driving trend for
separate collection of food waste for AD;
• Estimated 6 million tonnes / a of municipal food
waste available.
Key Drivers for Development of
AD:• Energy - security and renewables;
• State policies / legislation;
• Availability of feedstocks & end-users;
• Increasing cost / scarcity of landfill.
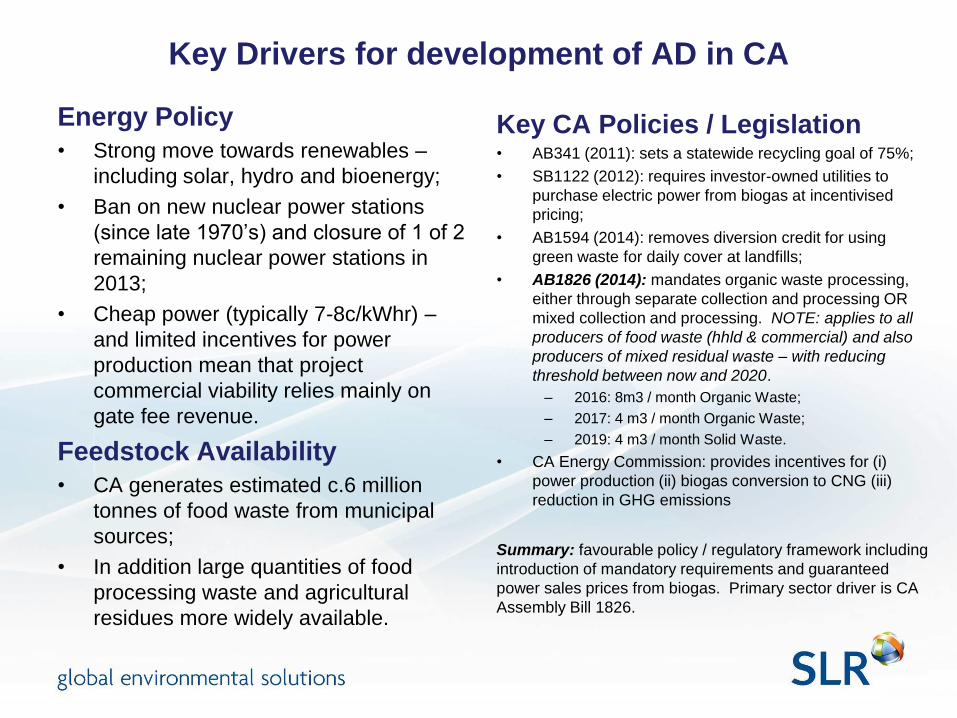
Key Drivers for development of AD in CA
Energy Policy
• Strong move towards renewables –
including solar, hydro and bioenergy;
• Ban on new nuclear power stations
(since late 1970’s) and closure of 1 of 2
remaining nuclear power stations in
2013;
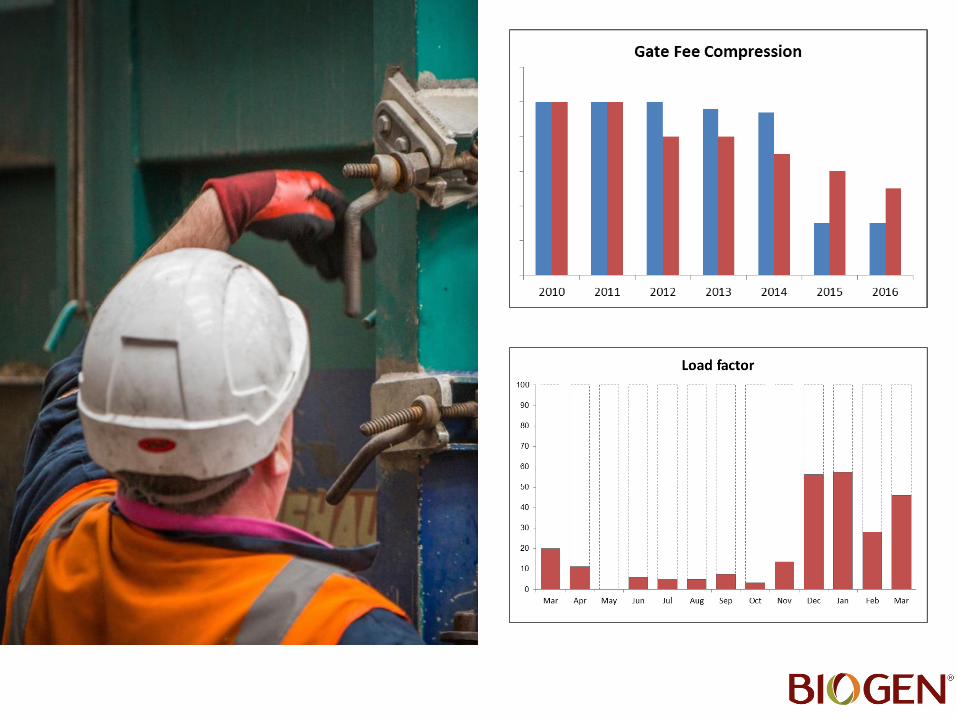
• Cheap power (typically 7-8c/kWhr) –
and limited incentives for power
production mean that project
commercial viability relies mainly on
gate fee revenue.
Feedstock Availability
• CA generates estimated c.6 million
tonnes of food waste from municipal
sources;
• In addition large quantities of food
processing waste and agricultural
residues more widely available.
Key CA Policies / Legislation• AB341 (2011): sets a statewide recycling goal of 75%;
• SB1122 (2012): requires investor-owned utilities to
purchase electric power from biogas at incentivised
pricing;
• AB1594 (2014): removes diversion credit for using
green waste for daily cover at landfills;
• AB1826 (2014): mandates organic waste processing,
either through separate collection and processing OR
mixed collection and processing. NOTE: applies to all
producers of food waste (hhld & commercial) and also
producers of mixed residual waste – with reducing
threshold between now and 2020.
– 2016: 8m3 / month Organic Waste;
– 2017: 4 m3 / month Organic Waste;
– 2019: 4 m3 / month Solid Waste.
• CA Energy Commission: provides incentives for (i)
power production (ii) biogas conversion to CNG (iii)
reduction in GHG emissions
Summary: favourable policy / regulatory framework including
introduction of mandatory requirements and guaranteed
power sales prices from biogas. Primary sector driver is CA
Assembly Bill 1826.
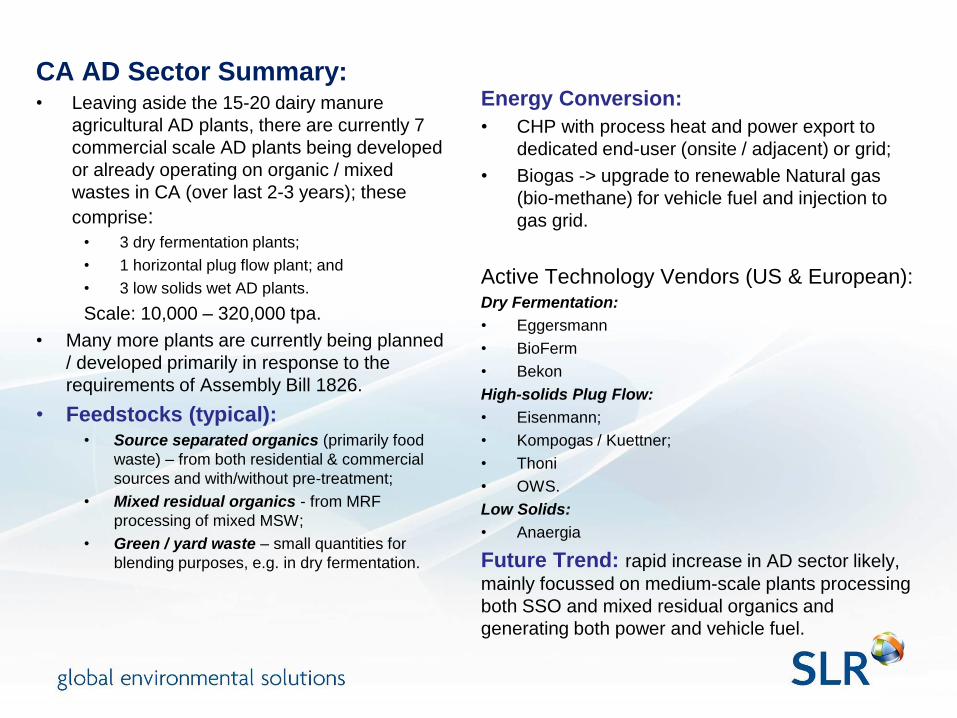
CA AD Sector Summary:• Leaving aside the 15-20 dairy manure
agricultural AD plants, there are currently 7
commercial scale AD plants being developed
or already operating on organic / mixed
wastes in CA (over last 2-3 years); these
comprise:• 3 dry fermentation plants;
• 1 horizontal plug flow plant; and
• 3 low solids wet AD plants.
Scale: 10,000 – 320,000 tpa.
• Many more plants are currently being planned
/ developed primarily in response to the
requirements of Assembly Bill 1826.
• Feedstocks (typical):• Source separated organics (primarily food
waste) – from both residential & commercial
sources and with/without pre-treatment;
• Mixed residual organics - from MRF
processing of mixed MSW;
• Green / yard waste – small quantities for
blending purposes, e.g. in dry fermentation.
Energy Conversion:
• CHP with process heat and power export to
dedicated end-user (onsite / adjacent) or grid;
• Biogas -> upgrade to renewable Natural gas
(bio-methane) for vehicle fuel and injection to
gas grid.
Active Technology Vendors (US & European):Dry Fermentation:
• Eggersmann
• BioFerm
• Bekon
High-solids Plug Flow:
• Eisenmann;
• Kompogas / Kuettner;
• Thoni
• OWS.
Low Solids:
• Anaergia
Future Trend: rapid increase in AD sector likely,
mainly focussed on medium-scale plants processing
both SSO and mixed residual organics and
generating both power and vehicle fuel.
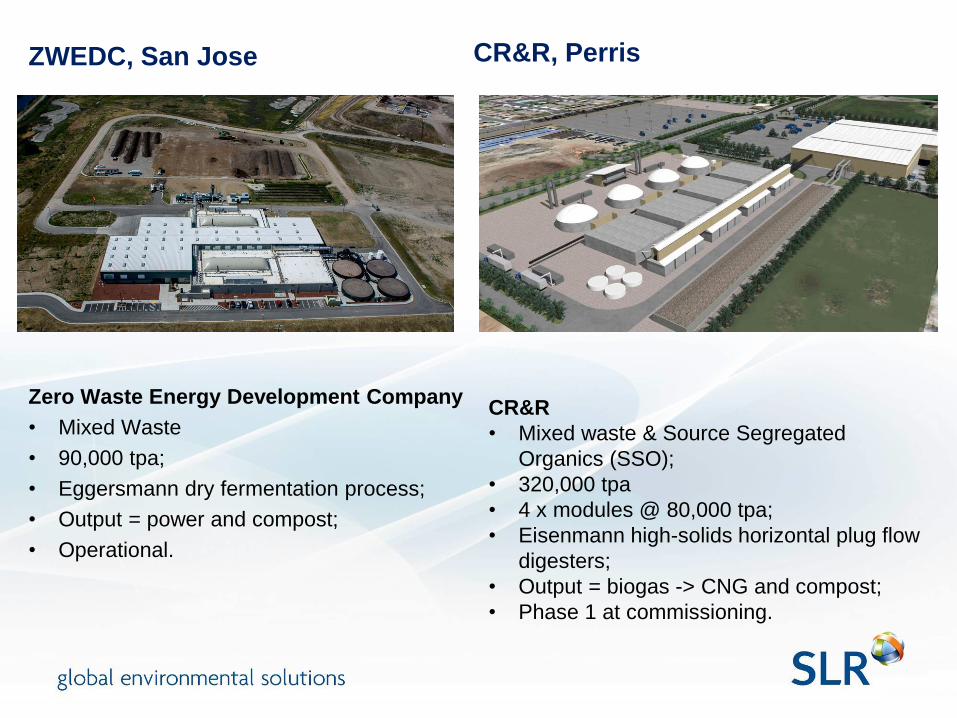
CR&R, Perris ZWEDC, San Jose
Zero Waste Energy Development Company
• Mixed Waste
• 90,000 tpa;
• Eggersmann dry fermentation process;
• Output = power and compost;
• Operational.
CR&R
• Mixed waste & Source Segregated
Organics (SSO);
• 320,000 tpa
• 4 x modules @ 80,000 tpa;
• Eisenmann high-solids horizontal plug flow
digesters;
• Output = biogas -> CNG and compost;
• Phase 1 at commissioning.
Summary
CA AD Sector:
• Favourable market conditions will see rapid growth of organic waste / AD sector in
next 3-5 years, as new legislation is implemented across the state;
• Sector growth largely driven by commercial viability but some financial incentives now
available for renewable power generation and vehicle fuel production;
• Feedstocks include residential & commercial food wastes and also mixed residual
solid waste;
• Strong demand for key process outputs, i.e. renewable energy and digestate /
compost from local market (including well-developed compost sector).
Potential Constraints
• Process water availability;
• Biosecurity;
• Limited current end use for surplus process CHP heat.

Useful Links
• www.biogasassociation.ca
• www.bioenergyca.org
Thank You
Diarmid Jamieson
Technical Director
SLR Consulting Limited
Tel: 0044 131 335 6830
Mob: 0044 7879 814265
Email: [email protected]
Website: www.slrconsulting.com
QUESTIONS AND COMMENTS FROM THE FLOOR
WHAT CHALLENGES AND OPPORTUNITIES
DOES THE DE-REGULATION OF THE
WATER SECTOR HOLD FOR AD?
DR PIERS CLARK, ISLE GROUP
ALISON FERGUSSON, PRINCIPAL ENGINEER – WATER 2020 PROGRAMME, OFWAT
STEVE BUNGAY, CHAIR – WASTEWATER MANAGEMENT PANEL, CIWEM
RICHARD LAIKIN, UK WATER SECTOR LEADER, PWC

Trust in water 122
What challenges and opportunities does the de-regulation of the water sector hold for AD?
Alison Fergusson
July 2016

Trust in water 123
Agenda
Who is Ofwat?
Our role and drivers of change
What’s going on for Ofwat?
What do we mean by “deregulation”?
Why do we think we should introduce markets in sludge?
Key features of Ofwat’s May decision for the way we regulate sludge from 2019:
Publishing information
Transparent market activity
Binding separate price control

Trust in water 124
Ofwat is the economic regulator of the water industry
in England and Wales.
Our key duties:
protect the interests of consumers, wherever
appropriate by promoting effective competition.
secure finance for efficient companies so that they can
properly carry out their functions.
(in relation to English water companies) secure the
long-term resilience of water supply and wastewater
systems so that the needs of customers in the long
term are met.
Ofwat’s role within England and Wales
Government
Defra
Ofgemetc.
Othergroups
NGOs
Europe
Sector Regulators
Environ-ment
Agency
UNECE
EWP
EU
CCWater
Academics
DWI
NaturalEngland
CabinetOffice
Welsh Gov
NaturalResources
Wales
OfwatTrust in water
Other sector
regulators
UKRN

Trust in water 125
Ofwat’s vision and the drivers for change

Trust in water 126
What’s going on for Ofwat?

Trust in water 127
What if we didn’t change our regulation of sludge?
Incremental improvements, saving a few ££?
Optimised
thickness
and
company
transport
costs
More efficient
process
operation and
energy
generation
Optimised in-
company
sludge
movements
Trialling
Innovative
processes
Improved
products for
farmers –
more income
Occasional
exploration
of using third
parties
What do we mean by sludge?
Sludge = activities of sewage sludge transport,
treatment, recycling and disposal. It includes dealing
with liquors generated during treatment.
National Audit Office (October 2015) shows that the impact
on bills of our regulatory approach has fallen over time. This
is partly due to diminishing returns to this form of regulation.

Trust in water 128
There is scope to use markets because…
Potential gains from local market between WaSCs.
Unrealised gains from market with firms in wider
waste markets.
Relatively less stranded asset risk - shorter asset
lives.
1
2
4
Dynamically increasing demand over time - change
in biosolids use and technology.
3
We have analysed the scope for trades between
companies by geography.
We have surveyed potential entrants.
We have examined investment requirements.
We have analysed usage patterns over time.
We know this because…
Why do we think there is scope to use markets in sludge?
What needs to be addressed in order to realise benefits?
Within our influence / control Outside our influence / control
Missing information
Regulatory incentives
Cultural issues
Environmental regulations
Transport costs
Consistent
with 2011
OFT study.
Evidence supports encouraging sludge markets

Trust in water 129
Localised market between WaSCs: rival WaSCs operating STCs within 50km
1

Trust in water 130
Rate of change in sludge treatment and recycling
3
0.0%
10.0%
20.0%
30.0%
40.0%
50.0%
60.0%
70.0%
80.0%
90.0%
100.0%
2010-11 2011-12 2012-13 2013-14 2014-15
Total other including landfill
Through a third party sludge service provider
Phyto-conditioning/composting
Incineration of raw sludge
Raw sludge liming
Incineration of digested sludge
Advanced anaerobic digestion
Conventional anaerobic digestion
UK sludge re-use and disposal routes – tonnes dry solids
Reuse or disposal
routeOthers Sludge reused Sludge disposed Total
Pipelines ShipsSoil and
agricultureOthers Landfill Incineration Others
1992 8,430 273,158 440,137 32,100 129,748 89,800 24,300 997,673
2008 - - 1,241,639 90,857 10,882 185,890 1,523 1,530,779
2010 - - 1,118,159 23,385 8,787 259,642 2,863 1,412,836
England and Wales treatment processes employed

Trust in water 131
Lower risk of stranded assets
4Average asset lives
49
37 36
30
13
0
10
20
30
40
50
60
Waterresources
Watertreatment
Sewagetreatment
Sludgetreatment
Sludgedisposal
Ave
rag
e a
ss
et
live
s (
ye
ars
)

Trust in water 132
Sludge market model: making the best sludge decisions for customers and the environment
Townsville
WwTW, WaSC X
Bigtown STC,
WaSC X
Supertown STC,
WaSC Y.
Novel Tech Co
Commercial
waste co.
Energy
users
Farmers
Energy
users
Farmers
Energy
users
Farmers
??
Trust in water 133
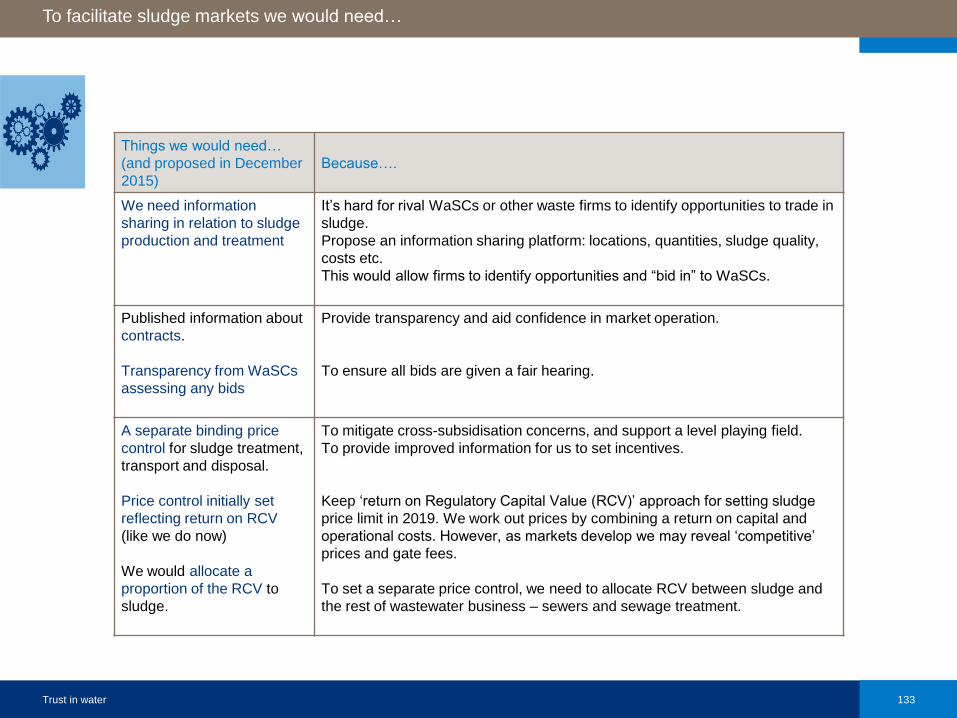
Things we would need…
(and proposed in December
2015)
Because….
We need information
sharing in relation to sludge
production and treatment
It’s hard for rival WaSCs or other waste firms to identify opportunities to trade in
sludge.
Propose an information sharing platform: locations, quantities, sludge quality,
costs etc.
This would allow firms to identify opportunities and “bid in” to WaSCs.
Published information about
contracts.
Transparency from WaSCs
assessing any bids
Provide transparency and aid confidence in market operation.
To ensure all bids are given a fair hearing.
A separate binding price
control for sludge treatment,
transport and disposal.
Price control initially set
reflecting return on RCV
(like we do now)
We would allocate a
proportion of the RCV to
sludge.
To mitigate cross-subsidisation concerns, and support a level playing field.
To provide improved information for us to set incentives.
Keep ‘return on Regulatory Capital Value (RCV)’ approach for setting sludge
price limit in 2019. We work out prices by combining a return on capital and
operational costs. However, as markets develop we may reveal ‘competitive’
prices and gate fees.
To set a separate price control, we need to allocate RCV between sludge and
the rest of wastewater business – sewers and sewage treatment.
To facilitate sludge markets we would need…
Trust in water 134
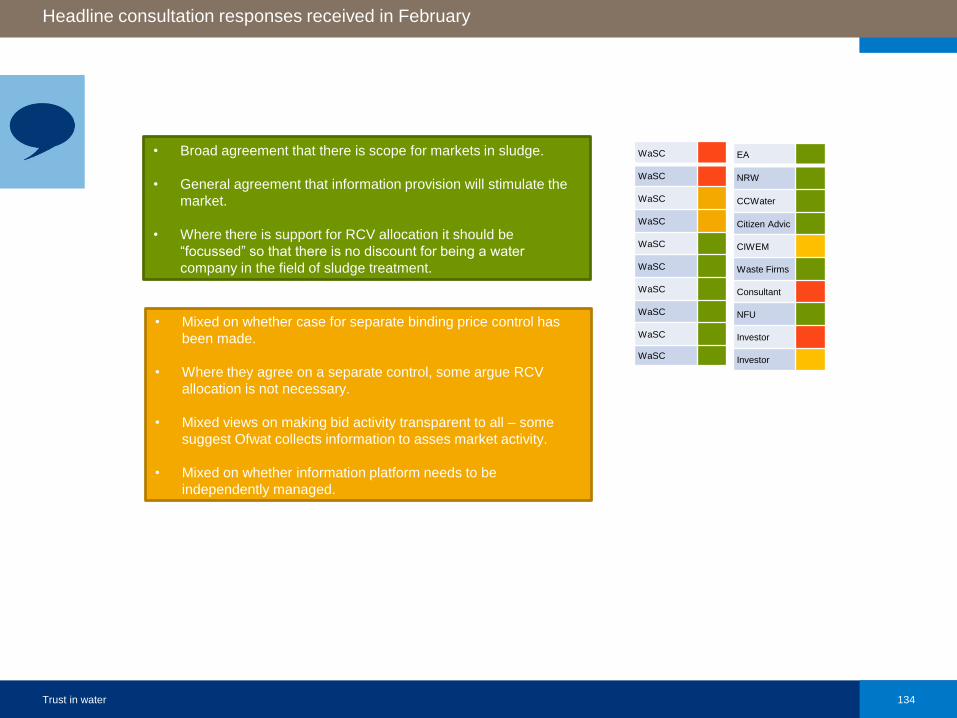
Headline consultation responses received in February
WaSC
WaSC
WaSC
WaSC
WaSC
WaSC
WaSC
WaSC
WaSC
WaSC
EA
NRW
CCWater
Citizen Advic
CIWEM
Waste Firms
Consultant
NFU
Investor
Investor
• Broad agreement that there is scope for markets in sludge.
• General agreement that information provision will stimulate the
market.
• Where there is support for RCV allocation it should be
“focussed” so that there is no discount for being a water
company in the field of sludge treatment.
• Mixed on whether case for separate binding price control has
been made.
• Where they agree on a separate control, some argue RCV
allocation is not necessary.
• Mixed views on making bid activity transparent to all – some
suggest Ofwat collects information to asses market activity.
• Mixed on whether information platform needs to be
independently managed.
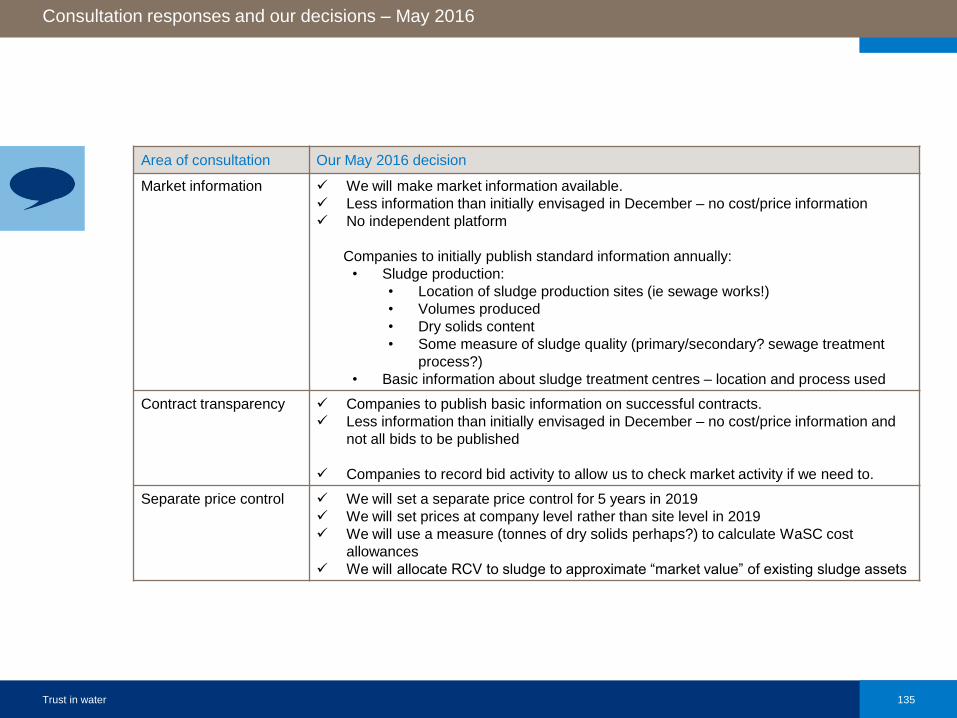
Trust in water 135
Area of consultation Our May 2016 decision
Market information We will make market information available.
Less information than initially envisaged in December – no cost/price information
No independent platform
Companies to initially publish standard information annually:
• Sludge production:
• Location of sludge production sites (ie sewage works!)
• Volumes produced
• Dry solids content
• Some measure of sludge quality (primary/secondary? sewage treatment
process?)
• Basic information about sludge treatment centres – location and process used
Contract transparency Companies to publish basic information on successful contracts.
Less information than initially envisaged in December – no cost/price information and
not all bids to be published
Companies to record bid activity to allow us to check market activity if we need to.
Separate price control We will set a separate price control for 5 years in 2019
We will set prices at company level rather than site level in 2019
We will use a measure (tonnes of dry solids perhaps?) to calculate WaSC cost
allowances
We will allocate RCV to sludge to approximate “market value” of existing sludge assets
Consultation responses and our decisions – May 2016
Trust in water 136
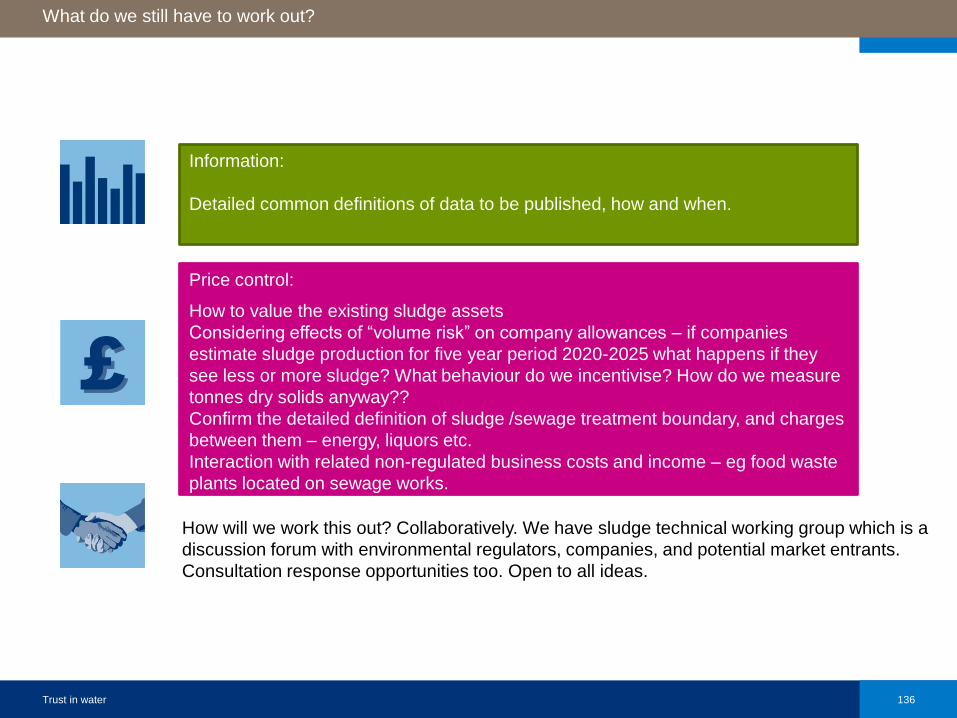
What do we still have to work out?
How will we work this out? Collaboratively. We have sludge technical working group which is a
discussion forum with environmental regulators, companies, and potential market entrants.
Consultation response opportunities too. Open to all ideas.
Information:
Detailed common definitions of data to be published, how and when.
Price control:
How to value the existing sludge assets
Considering effects of “volume risk” on company allowances – if companies
estimate sludge production for five year period 2020-2025 what happens if they
see less or more sludge? What behaviour do we incentivise? How do we measure
tonnes dry solids anyway??
Confirm the detailed definition of sludge /sewage treatment boundary, and charges
between them – energy, liquors etc.
Interaction with related non-regulated business costs and income – eg food waste
plants located on sewage works.
Trust in water 137
www.ofwat.gov.uk
Twitter.com/Ofwat
Thank you and questions

Challenges and Opportunitiesof De-regulation of Sludge
Treatment
Steve Bungay, CIWEM Wastewater Management Panel

Challenges to De-regulation
Disparate Regulation• Sewage Sludge
• Biosolids
• Other Organic Waste
The Final Stakeholder• Protecting Farmers Fields
Regulation
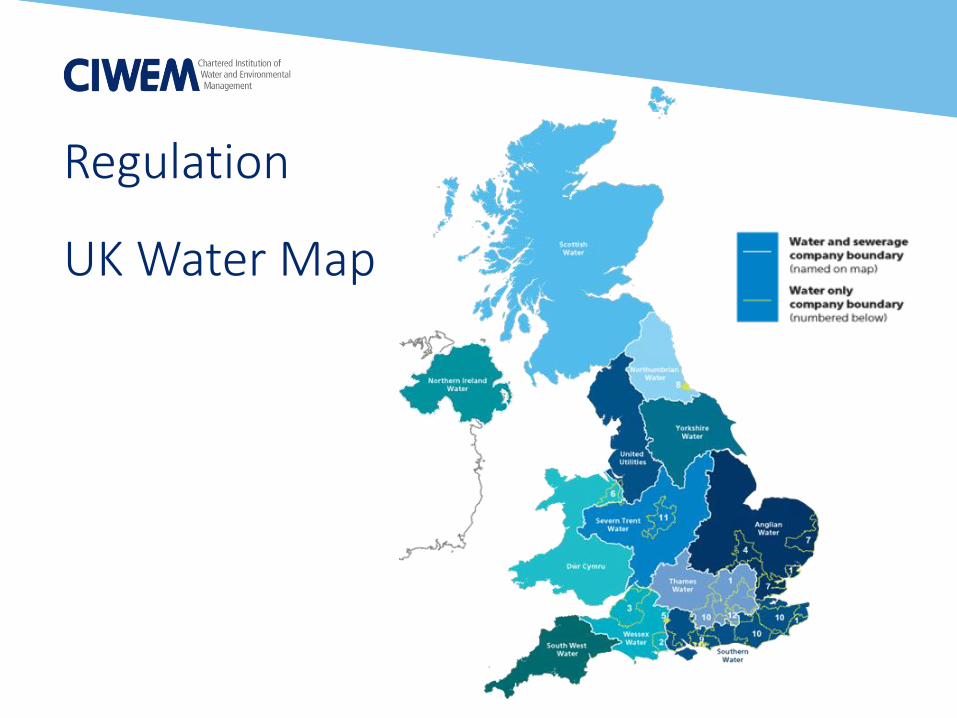
UK Water Map
Regulation

Regulatory Map
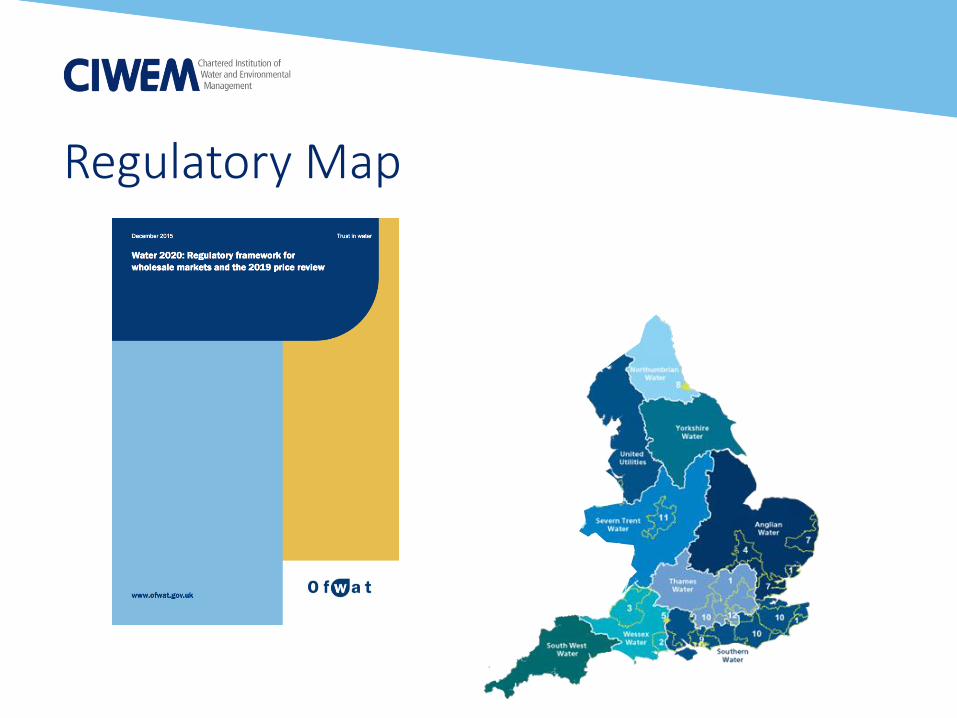
Regulatory Map

Some Existing Regulations/COPs
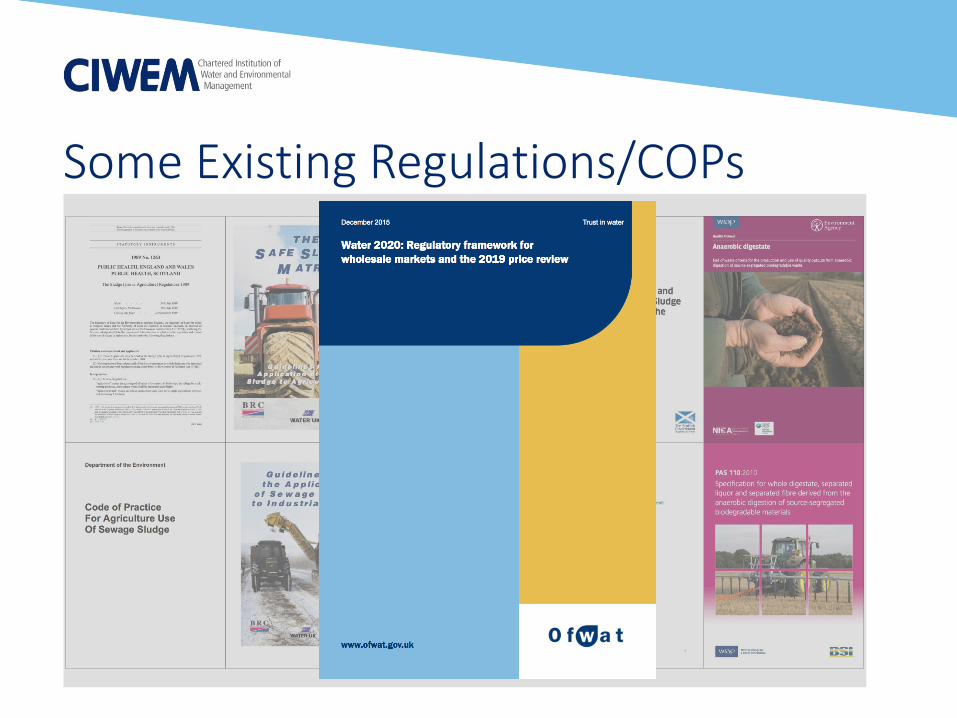
Some Existing Regulations/COPs
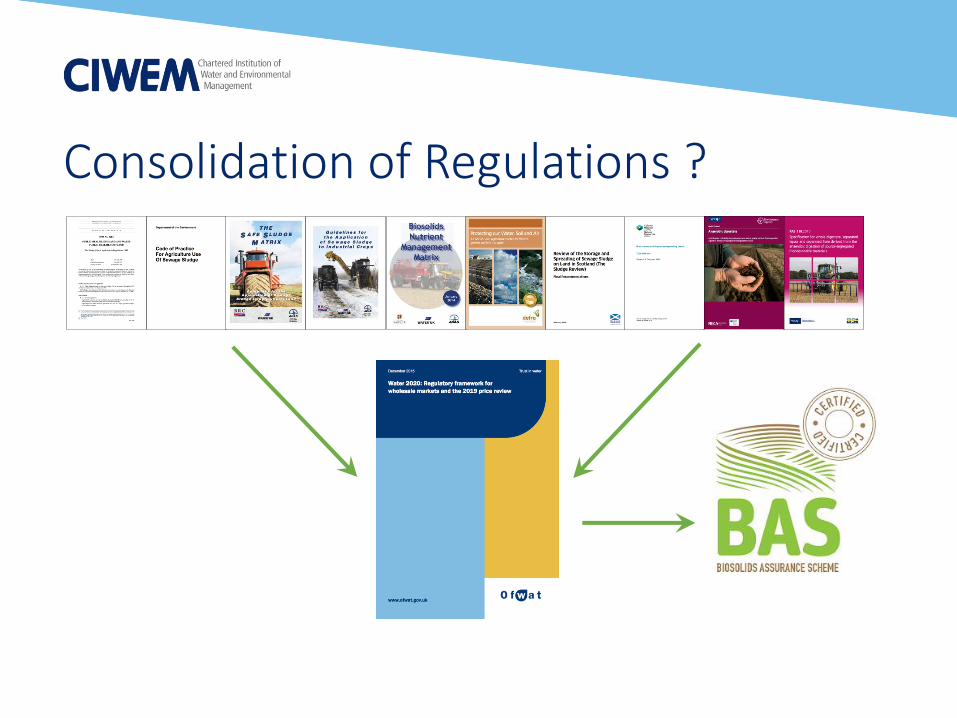
Consolidation of Regulations ?

The Final Stakeholder

Protecting the Farmer’s Fields

Protecting the Farmer’s Fields
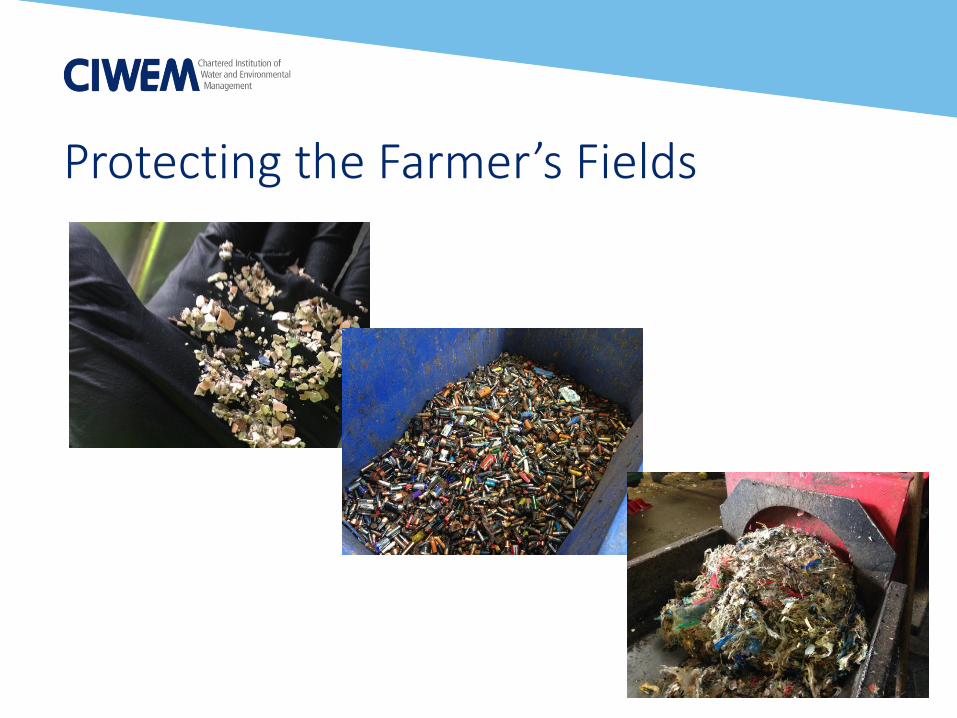
Protecting the Farmer’s Fields

Opportunities

Opportunities

Opportunities

Realising the Potential
• De-regulation presents opportunities and challenges to the water industry
• Integrating the skills from the water industry and waste industry, using pragmatic regulation, will realise the greatest potential from the de-regulated sludge market
• Ultimately, we must not lose site that as Regulators, Engineers, Scientists, Business People, Politicians etc…
…we are custodians of the environment
• Working for the public benefit for sustainable future

Thank you

QUESTIONS AND COMMENTS FROM THE FLOOR
MAKING BIOMETHANE FOR TRANSPORT
PROFITABLE – POLICY, SUBSIDIES, AND
INDUSTRY COLLABORATION
THOMAS KOLLER, POLICY OFFICER, ADBA
ROB WOOD, CHIEF EXECUTIVE, GASREC
JONATHAN HOOD, SENIOR POLICY ADVISOR – LOW CARBON FUELS, DFT
OLLIE MORE, MARKET ANALYST, ADBA
JOHN BICKERTON, CHIEF ENGINEER, READING BUSES
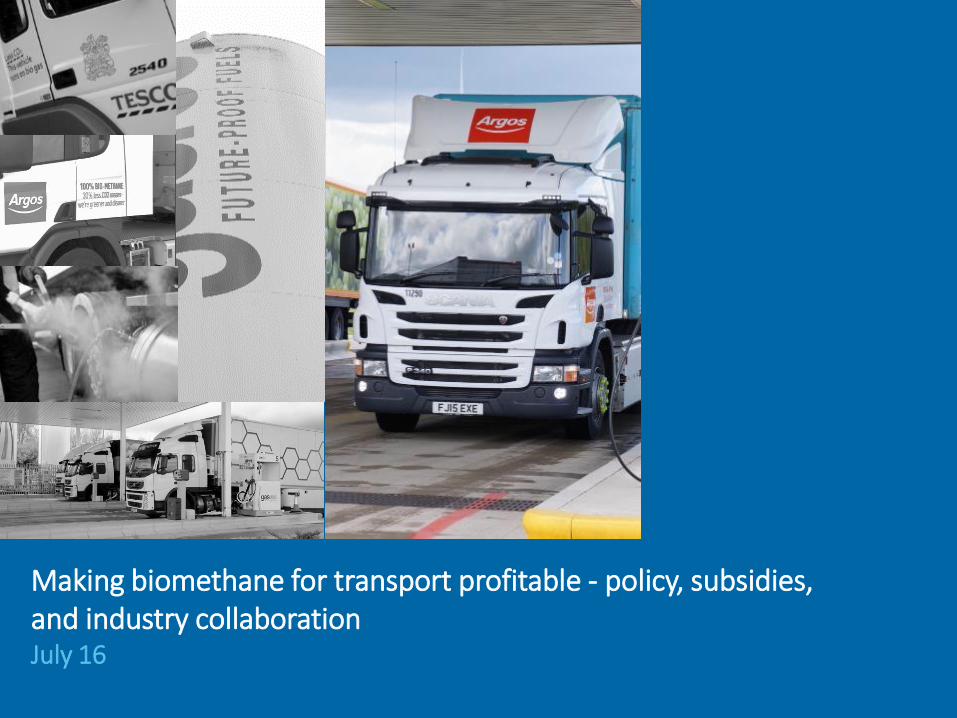
Making biomethane for transport profitable - policy, subsidies, and industry collaborationJuly 16
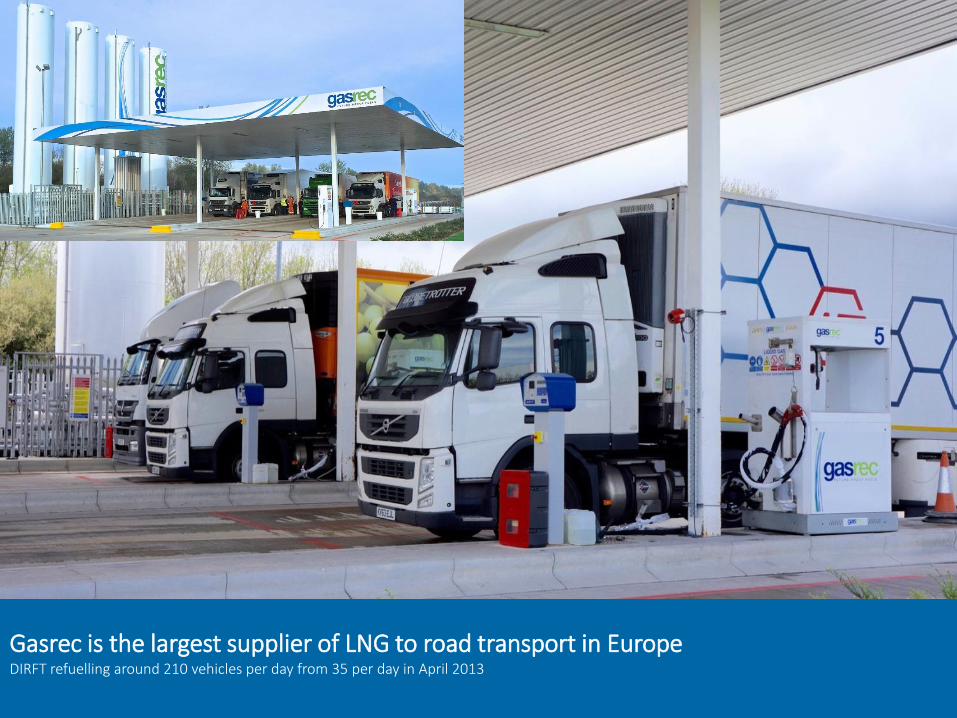
Gasrec is the largest supplier of LNG to road transport in EuropeDIRFT refuelling around 210 vehicles per day from 35 per day in April 2013

The case for methane in road transport
CO2e NOx Cost
15% 35% 70%
Reduction versus Euro 6 diesel
Natural gas
CO2e
90%
Bio-methane


Transports falls-short in subsidy competition
RHI
Bio
-met
han
e p
rod
uce
r
ROC
RTFC
• £0.26 per m3 of raw biogas• Low term certainty• Index linked• Medium capex
• £0.20 per m3 of raw biogas• Predictable market• Low capex
• £0.07 to £0.34 per m3 of raw biogas (5-24p/RTFC)• Market mechanism - un-predicable market price • Certificate price influenced by biofuels production• High capex
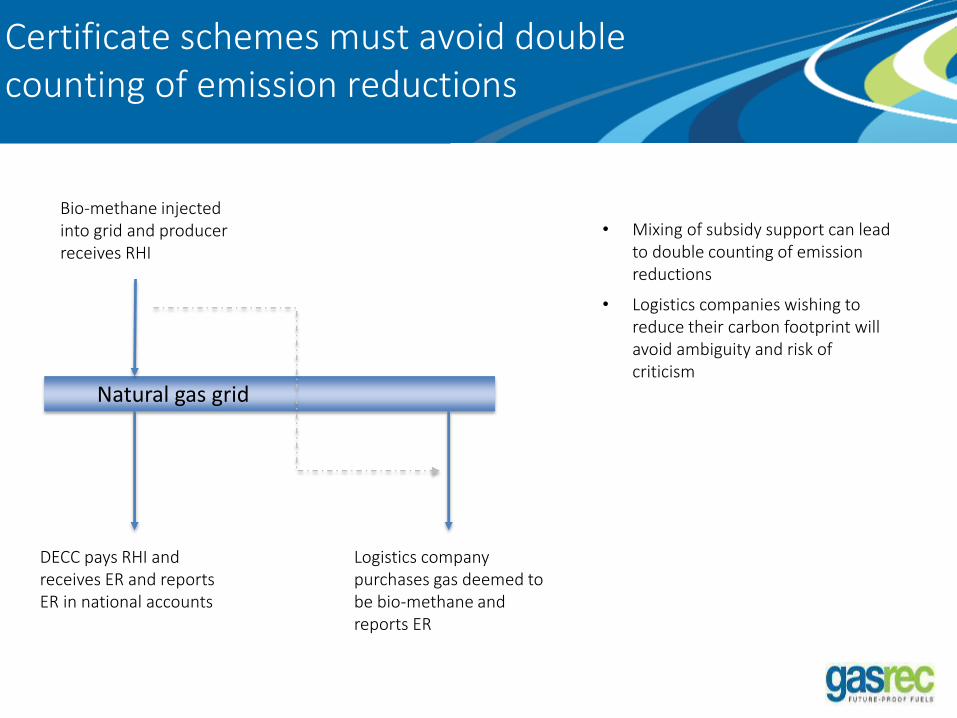
Certificate schemes must avoid double counting of emission reductions
Natural gas grid
Bio-methane injected into grid and producer receives RHI
DECC pays RHI and receives ER and reports ER in national accounts
Logistics company purchases gas deemed to be bio-methane and reports ER
• Mixing of subsidy support can lead to double counting of emission reductions
• Logistics companies wishing to reduce their carbon footprint will avoid ambiguity and risk of criticism

Other policy considerations
How important is the chain of custody and secure supply chain?
• Bio-methane molecules are indistinguishable from methane molecules
• Creating a secure custody chain that delivers bio-methane molecules to transport will be costly
• Mass balancing through the gas network means bio-methane molecules will be mingled with natural gas and not dedicated to transport
• Mass balancing through the gas network should include LNG import terminals otherwise heavy truck operators, the biggest polluters, will be unable to use bio-methane
Can bio-methane attract a price premium to natural gas?
• Road haulage has low barriers to entry and thin margins
• Outside niche operation and philanthropic operators bio-methane will not command a price premium
• Subsidy provides a bridge to carbon pricing and recognition of the carbon impact
Policy should consider ……
• Competition with other methane subsidies
• Bankability of the subsidy regime
• transport company reporting of carbon savings
• stop double counting
• the chain of custody
• ensure biomethane is available at no additional costs to natural gas
In summary ……

Moving Britain Ahead July 16UK Biomethane Day, Birmingham, Weds 20th April 2016
Biomethane transport fuelUK AD & Biogas 2016
Thurs 7th July, NEC, Birmingham
Jonathan Hood
Low Carbon Fuels, Department for Transport
166
Moving Britain Ahead
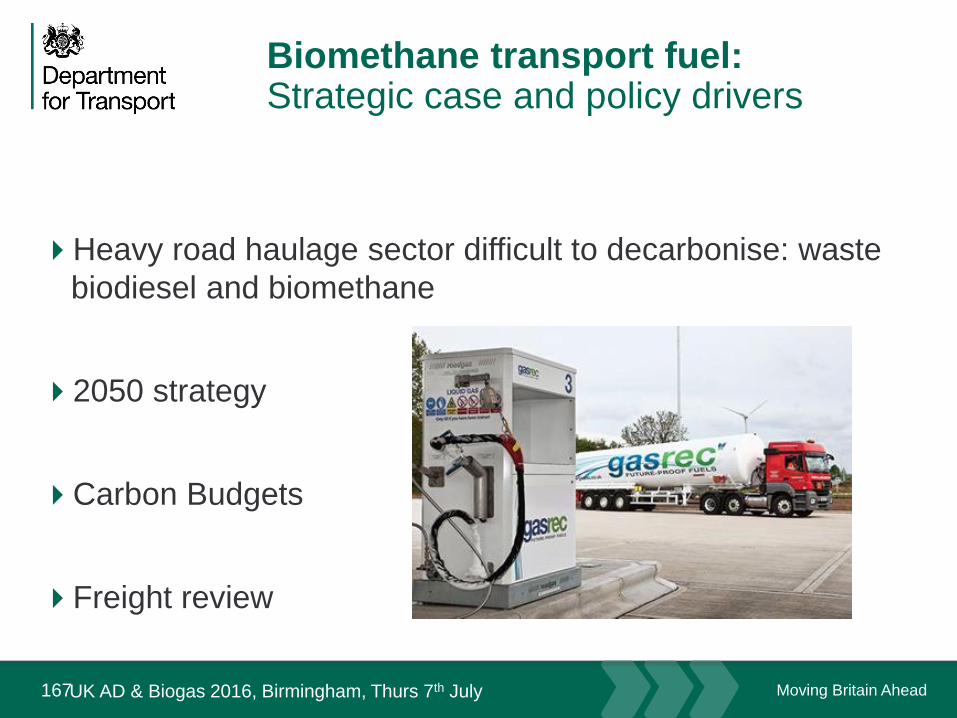
Biomethane transport fuel:Strategic case and policy drivers
Heavy road haulage sector difficult to decarbonise: waste
biodiesel and biomethane
2050 strategy
Carbon Budgets
Freight review
July 16
167UK AD & Biogas 2016, Birmingham, Thurs 7th July
Moving Britain Ahead
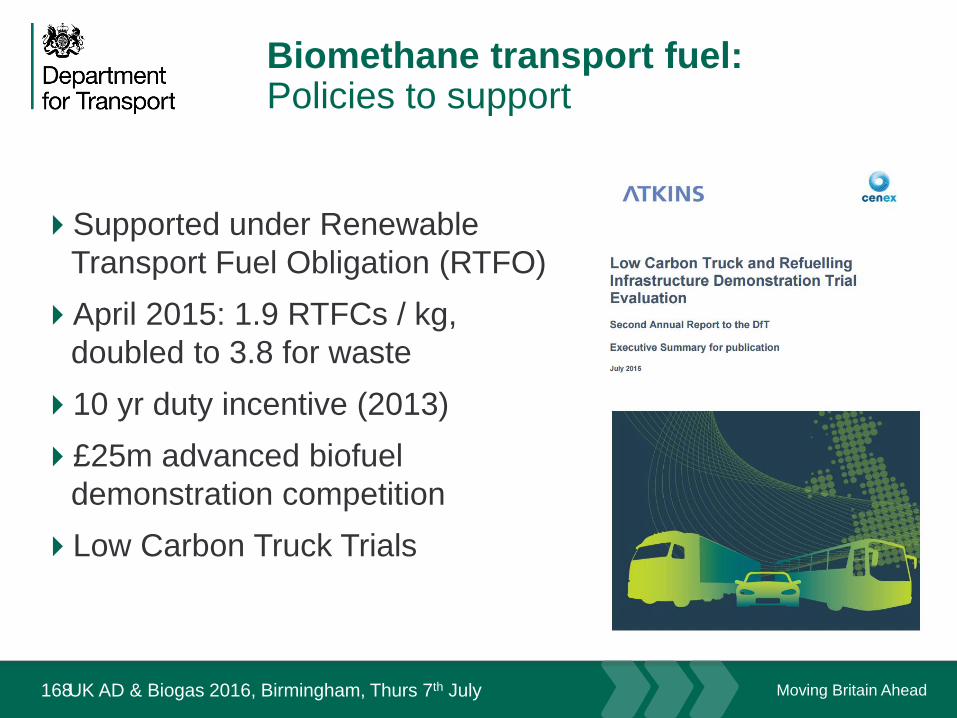
Biomethane transport fuel:Policies to support
Supported under Renewable
Transport Fuel Obligation (RTFO)
April 2015: 1.9 RTFCs / kg,
doubled to 3.8 for waste
10 yr duty incentive (2013)
£25m advanced biofuel
demonstration competition
Low Carbon Truck Trials
July 16
168UK AD & Biogas 2016, Birmingham, Thurs 7th July
Moving Britain Ahead
Committee on Climate Change June 2016 progress report
169
“The Government also has an objective of increasing the use of biomethane in HGVs. As the supply of biomethane is limited, the
Government should consider how emissions savings from use of biomethane
in HGVs compare to savings from using it in other applications, such as heat in buildings and industry. The risks of methane leakage
must also be considered in this assessment…
There is likely to be continued methane demand from buildings and industry in
excess of the available biomethane resource, such that increased use in
transport would displace biomethane from those sectors and not provide a net
reduction in emissions.”
July 16
UK Biomethane Day, Birmingham, Weds 20th April 2016

Moving Britain Ahead
Biomethane transport fuel:How to support in future?
2017 legislative amends for Renewable Energy
Directive (RED) and Fuel Quality Directive (FQD)
Options to support biomethane transport fuel
Changes to vehicle fuel duty challenging
Most likely option is an advanced fuels sub-target
within the RTFO
July 16
170UK AD & Biogas 2016, Birmingham, Thurs 7th July

Moving Britain Ahead
“Advanced” sub target
MSs must set a national
target for Annex IX
feedstocks
MSs should introduce
policies that will help achieve
the target
MSs policies ‘shall’ have due
regard to the waste hierarchy
July 16
171UK AD & Biogas 2016, Birmingham, Thurs 7th July
Moving Britain Ahead
0
500
1,000
1,500
2,000
2,500
3,000
Litr
es (
mill
ion
s)
Advanced diesel/gas
1G low blend waste biodiesel 1G low blend crop biodiesel 2G advanced biodiesel
1G low blend crop ethanol 2G advanced ethanol biomethane
biomethanol
Fuels-specific advanced fuels approach?
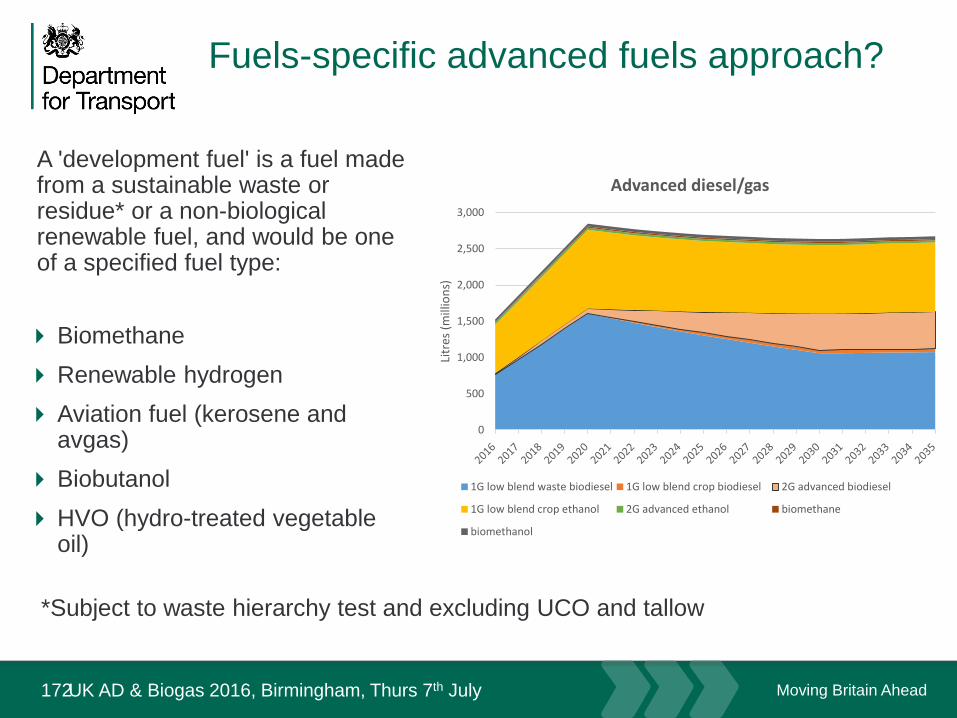
A 'development fuel' is a fuel made from a sustainable waste or residue* or a non-biological renewable fuel, and would be one of a specified fuel type:
Biomethane
Renewable hydrogen
Aviation fuel (kerosene and avgas)
Biobutanol
HVO (hydro-treated vegetable oil)
July 16
*Subject to waste hierarchy test and excluding UCO and tallow
172UK AD & Biogas 2016, Birmingham, Thurs 7th July
Moving Britain Ahead
RED requires consideration of waste hierarchy
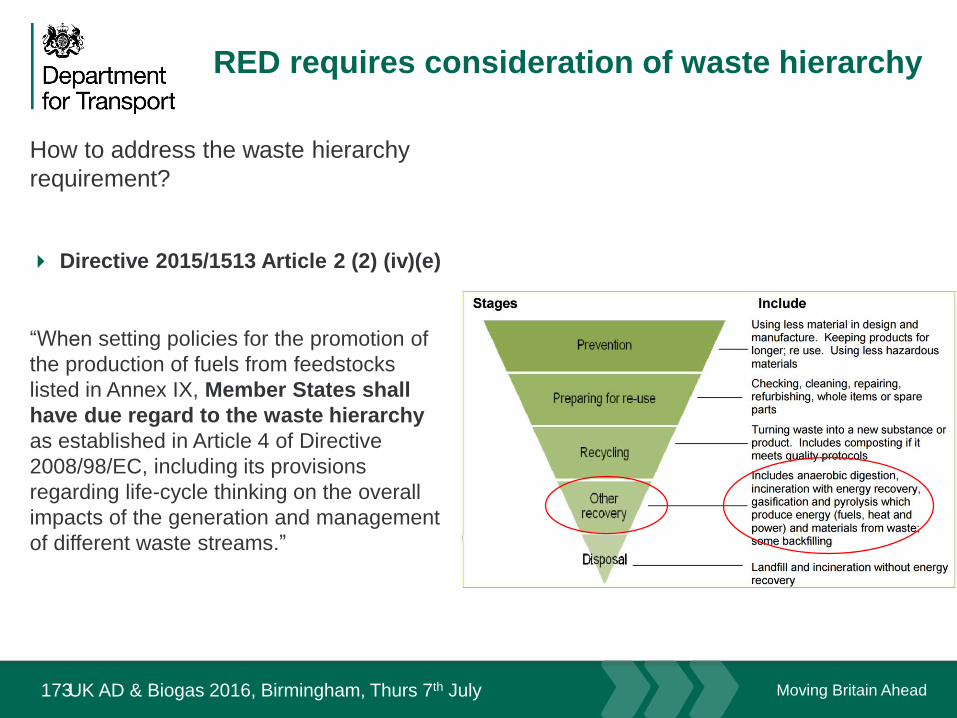
How to address the waste hierarchy
requirement?
Directive 2015/1513 Article 2 (2) (iv)(e)
“When setting policies for the promotion of
the production of fuels from feedstocks
listed in Annex IX, Member States shall
have due regard to the waste hierarchy
as established in Article 4 of Directive
2008/98/EC, including its provisions
regarding life-cycle thinking on the overall
impacts of the generation and management
of different waste streams.”
July 16
173UK AD & Biogas 2016, Birmingham, Thurs 7th July
Moving Britain Ahead
Development fuels sub target: How could it work?
New category of RTFCs: “development fuels”
New obligation on fuel suppliers
Targets set 2017 to 2030. (0.05% in 2017 to 1.2% in 2030 in
Cost-Benefit Analysis)
RTFO Unit assesses whether fuel meets the criteria
Suppliers can supply / trade or pay a buy-out, in keeping
with existing RTFO
Buy-out level set at higher level
2 x development RTFCs issued (because made from waste)
July 16
174UK AD & Biogas 2016, Birmingham, Thurs 7th July
Moving Britain Ahead
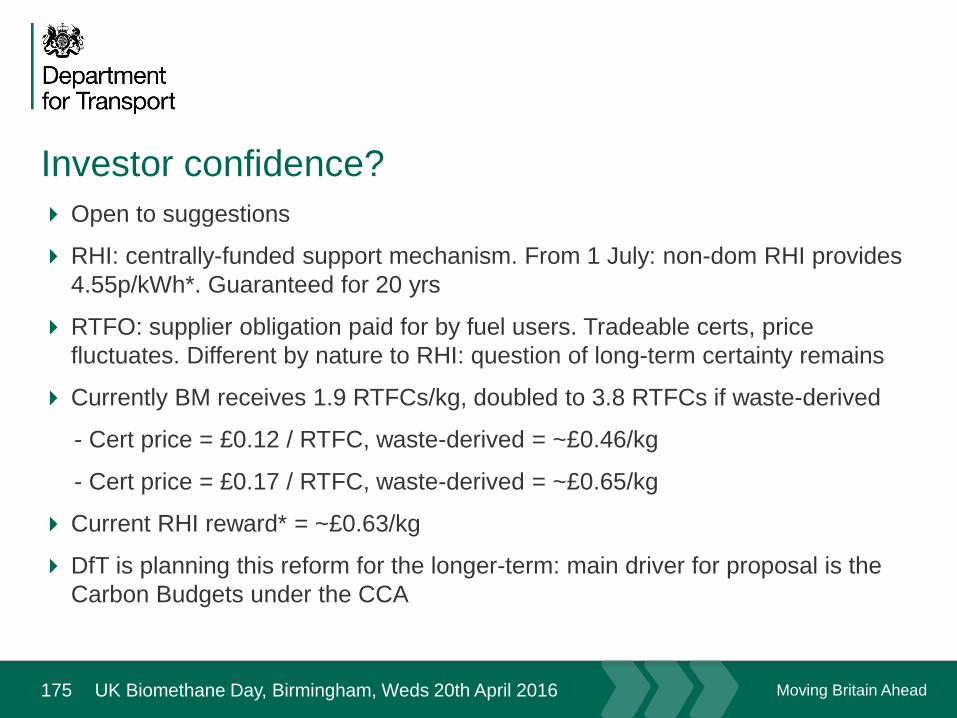
Investor confidence?
175
Open to suggestions
RHI: centrally-funded support mechanism. From 1 July: non-dom RHI provides
4.55p/kWh*. Guaranteed for 20 yrs
RTFO: supplier obligation paid for by fuel users. Tradeable certs, price
fluctuates. Different by nature to RHI: question of long-term certainty remains
Currently BM receives 1.9 RTFCs/kg, doubled to 3.8 RTFCs if waste-derived
- Cert price = £0.12 / RTFC, waste-derived = ~£0.46/kg
- Cert price = £0.17 / RTFC, waste-derived = ~£0.65/kg
Current RHI reward* = ~£0.63/kg
DfT is planning this reform for the longer-term: main driver for proposal is the
Carbon Budgets under the CCA
July 16
UK Biomethane Day, Birmingham, Weds 20th April 2016
Moving Britain Ahead
Biomethane transport fuel:Next steps
July 16
DfT consultation on 2017 legislative amendments this year
Encourage participation in forthcoming consultation
Stakeholder views welcome on what more can be done to remove barriers, within existing frameworks
176UK AD & Biogas 2016, Birmingham, Thurs 7th July
Moving Britain Ahead
Thank you
July 16
177UK AD & Biogas 2016, Birmingham, Thurs 7th July
UK biogas: current use and
potential
Ollie More
ADBA

UK biogas use 2016
Biogas 2016
8.9 TWh
Heat-only
Transport (Ludlow, Avonmouth)
<0.1 TWh
Gas grid
2.6 TWh
Electricity generation
6.3 TWh
Electricity
2.5 TWhe
Co-generated heat
(mainly vented)
3.8 TWhth

UK methane potential: 2025-30

• 180 bus fleet serving Reading and area– Euro IV, Euro V, Euro VI
– Euro V hybrids, Euro V gas
• Early adopters – leaders, innovators
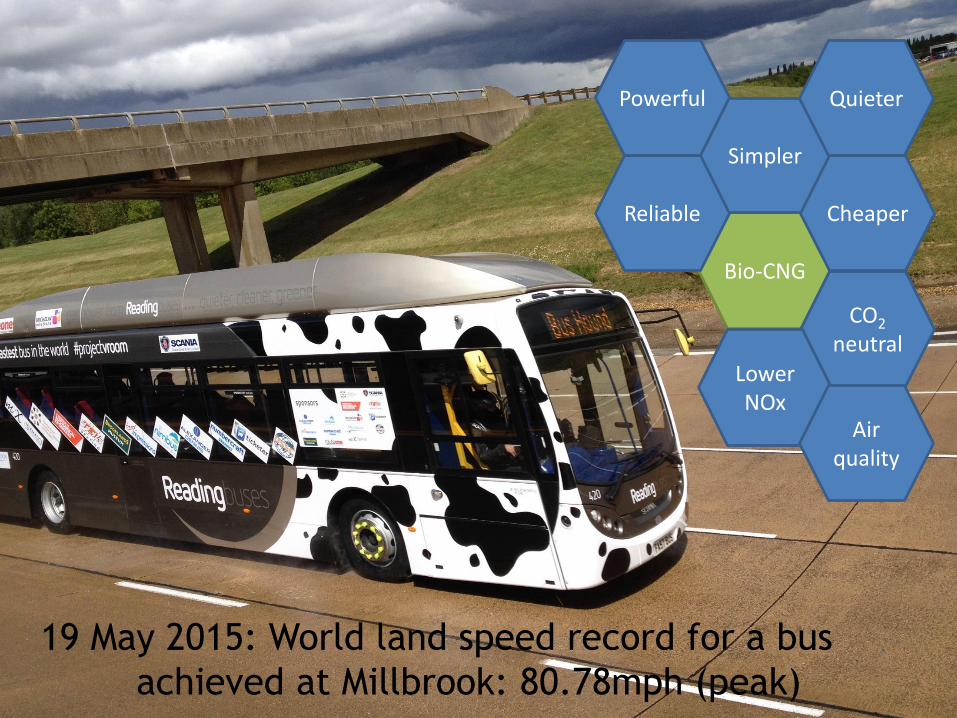
Bio-CNG
Simpler
CO2
neutral
CheaperReliable
Lower NOx
Air quality
QuieterPowerful
19 May 2015: World land speed record for a bus
achieved at Millbrook: 80.78mph (peak)

QUESTIONS AND COMMENTS FROM THE FLOOR
Related Documents