Conference Proceedings 35 th International Conference Mathematical Methods in Economics September 13 th - 15 th , 2017, Hradec Králové, Czech Republic MME 2017

Welcome message from author
This document is posted to help you gain knowledge. Please leave a comment to let me know what you think about it! Share it to your friends and learn new things together.
Transcript

Conference Proceedings
35th International Conference Mathematical Methods in EconomicsSeptember 13th - 15th, 2017, Hradec Králové, Czech Republic
MME
2017
ISBN 978-80-7435-678-0

35th International Conference
Mathematical Methods
in Economics
MME 2017
Conference Proceedings
Hradec Králové, Czech Republic
September 13th – 15th, 2017
University of Hradec Králové
ISBN 978-80-7435-678-0

Faculty of Informatics and Management, University of Hradec Králové
Programme Committee doc. RNDr. Helena Brožová, CSc.
doc. Mgr. Ing. Martin Dlouhý, Dr. MSc.
Mgr. Jan Draesslar, Ph.D.
doc. Ing. Jan Fábry, Ph.D.
prof. RNDr. Ing. Petr Fiala, CSc., MBA
doc. Ing. Jana Hančlová, CSc.
prof. Ing. Josef Jablonský, CSc.
doc. RNDr. Ing. Miloš Kopa, Ph.D.
doc. RNDr. Ing. Ladislav Lukáš, CSc.
prof. RNDr. Jan Pelikán, CSc.
doc. Dr. Ing. Miroslav Plevný
doc. RNDr. Petra Poulová, Ph.D.
doc. RNDr. Pavel Pražák, Ph.D.
prof. RNDr. Jaroslav Ramík, CSc.
Ing. Karel Sladký, CSc.
prof. RNDr. Hana Skalská, CSc.
doc. Ing. Tomáš Šubrt, Ph.D.
doc. RNDr. Jana Talašová, CSc.
prof. RNDr. Milan Vlach, DrSc.
prof. RNDr. Karel Zimmermann, DrSc.
prof. Ing. Miroslav Žižka, Ph.D.
Editor: Pavel Pražák

I
Contents
A DEA Approach for Selecting Performance Measures in Presence of Negative
Data ........................................................................................................................................... 1
Maryam Allahyar, Mehdi Toloo
Defense Expenditure and Economic Growth in Visegrad Group Countries: A Panel
Data Analysis ........................................................................................................................... 6
Tereza Ambler, Jiří Neubauer
Does Relative Income Have an Impact on the Consumption of Hungarian Households? 12
Ondřej Badura
TOPSIS with Generalized Distance Measure GDM in Assessing Poverty and Social
Exclusion at Regional Level in Visegrad Countries ........................................................... 18
Adam P. Balcerzak, Michał Bernard Pietrzak
Modification of EVM by Scenarios ...................................................................................... 24
Jan Bartoška, Tomáš Šubrt, Petr Kučera
DEA Models in Evaluation of Factors of Temporary Absence from Work in the Czech
Republic .................................................................................................................................. 30
Markéta Bartůňková, Jan Öhm, Jiří Rozkovec
Generalized Form of Harmonic Mean in Choosing the Optimal Value of Smoothing
Parameter in Kernel Density Estimation ............................................................................ 36
Aleksandra Baszczyńska
A Medium-Scale DSGE Model with Labour Market Frictions ........................................ 42
Jakub Bechný, Osvald Vašíček
Price Comparison Sites and Their Influence on E-Commerce Processes ........................ 48
Ladislav Beranek, Petr Hanzal
Fuzzy Discretization for Data Mining ................................................................................. 54
Petr Berka
Wages in the Czech Regions: Comparison and Wage Distribution Models .................... 60
Diana Bílková
Study Results on Faculty of Management in Jindřichův Hradec ..................................... 66
Vladislav Bína, Jiří Přibil
Selection of the Suitable Building Savings in the Czech Republic Using Multicriteria
Evaluation Method ................................................................................................................ 72
Adam Borovička
A Stochastic–Integer Programming Approach to Tactical Fixed Interval Scheduling
Problems ................................................................................................................................. 78
Martin Branda

II
Modelling Synergy of the Complexity and Criticalness Factors in the Project
Management .......................................................................................................................... 84
Helena Brožová, Jan Rydval
Inflation Targeting and Variability of Money Market Interest Rates under a Zero
Lower Bound ......................................................................................................................... 90
Karel Brůna, Van Quang Tran
Wavelet Method for Pricing Options with Stochastic Volatility ....................................... 96
Dana Černá
On the Limit Identification Region for Regression Parameters in Linear Regression with
Interval-Valued Dependent Variable ................................................................................ 102
Michal Černý, Miroslav Rada, Ondřej Sokol, Vladimír Holý
Capacitated Vehicle Routing Problem Depending on Vehicle Load ............................. 108
Zuzana Čičková, Ivan Brezina, Juraj Pekár
Modeling Unemployment Rate in Spain: Search and Matching Approach .................. 113
Ondřej Čížek
Correlation Dimension as a Measure of Stock Market Variability ................................ 119
Martin Dlask, Jaromir Kukal
A DEA-Based Inequality Measure: Application to Allocation of Health Resources .... 125
Martin Dlouhý
Solvability of Interval Max-Plus Matrix Equations ......................................................... 131
Emília Draženská
Diversification Problem in Mean-Variance-Skewness Portfolio Models ....................... 137
Renata Dudzińska-Baryła, Donata Kopańska-Bródka, Ewa Michalska
Quantification of Latent Variables Based on Relative Interaction between Players .... 143
Marek Dvořák, Petr Fiala
Goodness-of-Fit Tests for Truncated Distributions –The Empirical Study .................. 149
Krzysztof Echaust, Agnieszka Lach
Backtesting Value-at-Risk for Multiple Risk Levels: a Lexicographic Ordering
Approach .............................................................................................................................. 155
Marcin Fałdziński
Models of Equilibrium on Network Industries Market in Context of Influence of
Regulated Prices in Slovakia .............................................................................................. 161
Eleonora Fendeková, Michal Fendek
Game Theory Models of Co-opetition ............................................................................... 167
Petr Fiala
Implicit-Explicit Scheme Combined with Wavelets for Pricing European Options ..... 173
Václav Finěk
III
Unconventional Monetary Policy in a Small Open Economy under Inflation Targeting
Regime .................................................................................................................................. 177
Jakub Fodor, Osvald Vašíček
Spatial Panel Data Models - Stability Analysis with Application to Regional
Unemployment ..................................................................................................................... 183
Tomáš Formánek, Roman Hušek
ANP Analysis and Selection of Appropriate Managerial Methods ................................ 189
Veronika Frajtová, Helena Brožová
The Effect of the Deaths from Chronic Ischemic Heart Disease versus Acute Coronary
Syndrome on Life Expectancy among the Slovak Population ........................................ 195
Beata Gavurova, Tatiana Vagasova
Transportation Problem with Degressively Stepped Costs ............................................. 201
Vojtěch Graf, Dušan Teichmann, Michal Dorda
Effectiveness as a New Focus of the MAVT MCDM Methods ....................................... 207
Roman Guliak
Contribution to Economic Efficiency Evaluation of Projects in Terms of Uncertainty 213
Simona Hašková
On Comparing Prediction Accuracy of Various EWMA Model Estimators ................ 219
Radek Hendrych, Tomáš Cipra
Robust Optimization Approach in Transportation Problem .......................................... 225
Robert Hlavatý, Helena Brožová
Combining Estimates of Industry Production with the Structure
of Input-Output Table ........................................................................................................ 231
Vladimír Holý
Critical Period Method for Approximate Solution of a Discrete Discounted Stochastic
Program ................................................................................................................................ 236
Milan Horniaček
The Valuation of Discretely Sampled European Lookback Options:
A DG Approach ................................................................................................................... 242
Jiří Hozman, Tomáš Tichý
Möbius. Environment for Learning Mathematical Modelling in Economy .................. 248
Jiří Hřebíček
Application of Kohonen SOM Learning in Crisis Prediction ......................................... 254
Radek Hrebik, Jaromir Kukal
Investigating the Impact of a Labour Market Segmentation Using a Small DSGE Model
with Search nd Matching Frictions ................................................................................... 259
Jakub Chalmovianský
Dynamic Modeling Economic Equilibrium with Maple .................................................. 265
Zuzana Chvátalová, Jiří Hřebíček

IV
Comparison of Efficiency Results for Financial Institutions Using Different
DEA Models ......................................................................................................................... 271
Lucie Chytilová, Jana Hančlová
Benchmarking of Countries at Summer Olympic Games Using Two-Stage
DEA Models ......................................................................................................................... 277
Josef Jablonský
A Comparative Analysis of the Information Society in Poland and Selected
Countries .............................................................................................................................. 283
Anna Janiga-Ćmiel
Avoiding Overfitting of Models: An Application to Research Data on the Internet
Videos ................................................................................................................................... 289
Radim Jiroušek, Iva Krejčová
Optimisation in a Wholesale Company: A Supply Chain Design Problem ................... 295
Petr Jirsak, Veronika Skocdopolova, Petr Kolar
Investment Projects Threshold Value Simulation ............................................................ 301
Petr Jiříček, Stanislava Dvořáková
Robust Regression Estimators: A Comparison of Prediction Performance ................. 307
Jan Kalina, Barbora Peštová
Optimal Value of Loans via Stochastic Programming .................................................... 313
Vlasta Kaňková
EWMA Based AOQL Variables Sampling Plans and Cost Models .............................. 319
Nikola Kaspříková
Modified Transportation Problem .................................................................................... 324
Renata Kawa, Rafal Kucharski
Three-Dimensional Bin Packing Problem with Heterogeneous Batch Constraints ...... 330
František Koblasa, Miroslav Vavroušek, František Manlig
Spatial Modelling of Nominal and Real Net Disposable Household Incomes in the
Districts (LAU1) of the Czech Republic ............................................................................ 336
Aleš Kocourek, Jana Šimanová
Consumption Taxes in Australia: A DSGE Approach .................................................... 342
Zlatica Konôpková
Spa Tourism in Slovakia - analysis of defined aspects ..................................................... 348
Martina Košíková, Anna Šenková, Eva Litavcová, Róbert Bielik
Optimal Choices among Ethic Assets of the Italian Market ........................................... 354
Noureddine Kouaissah, Sergio Ortobelli, Marianna Cavenago
Transformation of Task to Locate a Minimal Hamiltonian Circuit into the Problem of
Finding the Eulerian Path .................................................................................................. 360
Petr Kozel, Václav Friedrich, Šárka Michalcová
V
Comparison of Selected DEA Approaches for Market Risk Models Evaluation .......... 366
Aleš Kresta, Tomáš Tichý
Herding, Minority Game, Market Clearing and Efficient Markets in a Simple Spin
Model Framework ............................................................................................................... 372
Ladislav Kristoufek, Miloslav Vosvrda
The Role of Credit Standards as an Indicator of the Supply of Credit .......................... 378
Zuzana Kučerová, Jitka Poměnková
Multidimensional Alpha Stable Distribution in Model Parameter Estimation
Algorithms ............................................................................................................................ 384
Jaromír Kukal, Quang Van Tran
Optimization Model for the Employees’ Shifts Schedule ................................................ 390
Martina Kuncová, Veronika Picková
Struggle with Curse of Dimensionality in Robust Emergency System Design .............. 396
Marek Kvet, Jaroslav Janáček
Weak Orders for Intersecting Lorenz Curves: Empirical Analysis of Income
Distribution in European Countries .................................................................................. 402
Tommaso Lando, Lucio Bertoli-Barsotti, Michaela Staníčková
On Modelling the Evolution of Financial Metrics in Decision Making Unit in the
Electronics Industries ......................................................................................................... 408
Eva Litavcová, Sylvia Jenčová, Petra Vašaničová
Correlation Structure of Underlying Assets Affecting Multi-asset European Option
Price ...................................................................................................................................... 414
Ladislav Lukáš
Model of Passengers to Line Assignment in Public Municipal Transport ..................... 420
Tomáš Majer, Stanislav Palúch, Štefan Peško
Evaluating the Riskiness of Hedging Strategy with Gold, US Dollar and Czech
Crown ................................................................................................................................... 424
Jiří Málek, Quang Van Tran
Achilles and the Tortoise - The Story of the Minimum Wage ........................................ 430
Lubos Marek, Michal Vrabec
NEG Methodology in Socio-Economic Development and EU Labour Market
Research ............................................................................................................................... 436
Adrianna Mastalerz-Kodzis, Ewa Pośpiech
Early Exercise Premium and Boundary in American Option Pricing Problem ........... 442
Kateřina Mičudová, Ladislav Lukáš
Expected Coalition Influence under I-Fuzzy Setting: The Case of the Czech
Parliament ............................................................................................................................ 448
Elena Mielcová

VI
Comparison of Rankings of Decision Alternatives Based on the Omega Function and
the Prospect Theory ............................................................................................................ 454
Ewa Michalska, Renata Dudzińska-Baryła
Interpretation of Human Resource Management Data using Multiple Correspondence
Analysis ................................................................................................................................ 460
Ondřej Mikulec
The Efficiency of Stocks Investment Strategy with the Use of Chosen Measures of
Deterministic Chaos to Building Optimal Portfolios ....................................................... 466
Monika Miśkiewicz-Nawrocka, Katarzyna Zeug-Żebro
Research on Probabilistic Risk Evaluation of Business System Development Project
Based on Requirements Analysis ....................................................................................... 472
Shinji Mochida
Bayesian Study on When to Restart Heuristic Search ..................................................... 480
Matej Mojzes, Jaromir Kukal
Robustness of Interval Monge Matrices in Max-Min Algebra ....................................... 486
Monika Molnárová
Can Shifts in Public Debt Structure Influence Economic Growth of Advanced
Economies? .......................................................................................................................... 492
Martin Murín
Interval Max-min Matrix Equations with Bounded Solution ......................................... 499
Helena Myšková
Assessment of the Impact of Traffic Police Preventive Interventions ............................ 505
Dana Nejedlová
Modelling Effective Corporate Tax Rate in the Czech Republic .................................... 511
Daniel Němec, Silvester Dulák
Optimal Inserting Depot Visits into Daily Bus Schedules ............................................... 517
Stanislav Palůch, Tomáš Majer
Exchange Rate and Economic Growth in Czech Republic ............................................. 523
Václava Pánková
Modelling the Development of the Consumer Price of Sugar ........................................ 527
Marie Pechrová, Ondřej Šimpach
Application of Measures Based on Quantiles to the Analysis of Income Inequality and
Poverty in Poland by Socio-Economic Group .................................................................. 532
Dorota Pekasiewicz, Alina Jędrzejczak
A Truck Loading Problem ................................................................................................. 538
Jan Pelikán
Competitiveness Evaluation of Czech Republic Regions with Data Envelopment
Analysis ................................................................................................................................ 542
Natalie Pelloneová, Eva Štichhauerová

VII
Generalized Dynamic Simulation Model of Rating Alternatives by Agents with
Interactions .......................................................................................................................... 548
Radomír Perzina, Jaroslav Ramík
Transit Coordination in Bus-Railway Networks .............................................................. 554
Štefan Peško, Tomáš Majer
Expected Return Rate Determined as Oriented Fuzzy Number .................................... 561
Krzysztof Piasecki
Use of Multi-criteria Decision Analysis in Fuzzy Network DEA Models ....................... 566
Michal Pieter
Identification of the Direction of Changes in the Structure of Interdependence among
the US Capital Market and the Leading European Markets .......................................... 572
Michał Bernard Pietrzak, Edyta Łaszkiewicz, Adam P. Balcerzak Tomáš Meluzín, Marek
Zinecker
Effcient Algorithms for X-Simplicity and Weak (X, λ)-Robustness of Fuzzy
Matrices ................................................................................................................................ 578
Ján Plavka
Using the Sweep Algorithm for Decomposing a Set of Vertices and Subsequent Solution
of the Traveling Salesman Problem in Decomposed Subsets .......................................... 584
Marek Pomp, Petr Kozel, Šárka Michalcová, Lucie Orlíková
Optimization of the Tasks and Virtual Machine Allocation Problem ............................ 590
Daniela Ponce, Vladimír Soběslav
The Spatial Weight Matrices and their Influence on the Quality of Spatial Models of
Employment ......................................................................................................................... 596
Ewa Pośpiech, Adrianna Mastalerz-Kodzis
Line Integral in Optimal Control Problems ..................................................................... 602
Pavel Pražák
Tradeoff between Economic and Social Sustainability of Bus Network ....................... 608
Vladimír Přibyl, Jan Černý, Anna Černá
The Concept of Mixed Method Study for Risk Assessment in Manufacturing
Processes ............................................................................................................................... 614
Angelina Rajda – Tasior
Typology of Consumers from Generation Y according to Approach to the Theatre .. 620
Katarína Rebrošová
Decision Matrices under Risk with Fuzzy States of the World and Underlying Discrete
Fuzzy Probability Measure ................................................................................................ 626
Pavla Rotterová, Ondřej Pavlačka
On the Relation of Labour Productivity, Costs and Unemployment in the EU
Countries .............................................................................................................................. 632
Lenka Roubalová, Tomáš Vaněk, David Hampel
VIII
Entropy Based Measures Used in Operation Complexity Analysis of Supplier-Customer
Systems ................................................................................................................................. 638
Pavla Říhová, Ladislav Lukáš
Data Envelopment Analysis of the Renewable Energy Sources ..................................... 644
Jana Sekničková
Wavelet Concepts in Stock Prices Analysis ...................................................................... 650
Jaroslav Schürrer
On Estimation of Bi-liner Regression Parameters ........................................................... 655
Grzegorz Sitek
Multiple Asset Portfolio with Present Value Given as a Discrete Fuzzy Number ....... 661
Joanna Siwek
Estimates of Regional Flows of Manufacturing Products in the Czech Republic ......... 667
Jaroslav Sixta, Jakub Fischer
Software for Changepoints Detection ................................................................................ 673
Hana Skalska
Timetable Construction for a Village Small School ......................................................... 679
Veronika Skocdopolova, Mirka Simonovska
Risk-Sensitive Optimality in Markov Games ................................................................... 684
Karel Sladký, Victor Manuel Martínez Cortés
Use of Simulation Methods for Evaluation of Alzheimer’s disease early detection in
Czechia ................................................................................................................................. 690
Hana Marie Smrčková, Václav Sládek, Markéta Arltová, Jakub Černý
Uncertainly in School Examinations: Estimation of Examinator’s Bias Parameters ... 696
Ondřej Sokol, Michal Černý
Future Performance of Mean-Risk Optimized Portfolios: An Empirical Study of
Exchange Traded Funds ..................................................................................................... 702
Tomas Spousta
On the Impact of Correlation between Variables on the Accuracy of Calibration
Estimators ............................................................................................................................ 708
Tomasz Stachurski, Tomasz Żądło
Identification of Bankruptcy Factors for Engineering Companies in the EU ............... 714
Michaela Staňková, David Hampel
Wave Relations of Exchange Rates in Binary-Temporal Representation ..................... 720
Michał Dominik Stasiak
Linguistic Approximation of Values Close to the Gain/Loss Threshold ........................ 726
Jan Stoklasa, Tomáš Talášek
Macroeconomic Modelling Using Cointegration Vector Autoregression ...................... 732
Radmila Stoklasová
IX
Pseudomedian in Robustification of Jarque-Bera Test of Normality ............................ 738
Luboš Střelec, Ladislava Issever Grochová
The Dynamic Aspects of Income in Terms of Consumption Function in EU
Countries .............................................................................................................................. 744
Kvetoslava Surmanová, Zlatica Ivaničová, Marian Reiff
Using of Markov Chains with Varying State Space for Predicting Short-Term of the
Share Price Movements ...................................................................................................... 749
Milan Svoboda, Mikuláš Gangur
Long-Run Elasticity of Substitution in Slovak Economy: the Low-Frequency Suply
System Model ....................................................................................................................... 755
Karol Szomolányi, Martin Lukáčik, Adriana Lukáčiková
Stability Analysis of Optimal Mean-Variance Portfolio due to Covariance Estimation 759
Blanka Šedivá, Patrice Marek
Long Steps in IPM and L1-Regression .............................................................................. 765
Barbora Šicková
User versus Automatic Selection of Models in Actuarial Demographics: The Impact on
the Expected Development of the Probability of Death in the Czech Republic ............ 771
Ondrej Šimpach, Marie Pechrová
Distance-Based Linguistic Approximation Methods: Graphical Analysis and Numerical
Experiments ......................................................................................................................... 777
Tomáš Talášek, Jan Stoklasa
Mathematical Support for Human Resource Management at Universities .................. 783
Jana Talašová, Jan Stoklasa, Pavel Holeček, Tomáš Talášek
Transportation Problem Model Supplemented with Optimization of Vehicle
Deadheading and Single Depot Parking ............................................................................ 789
Dušan Teichmann, Michal Dorda, Denisa Mocková
Subordinating Lévy Processes and the Measure of Market Activity ............................. 795
Tomáš Tichý
Measuring Co-movements Based on Quantile Regression using High-Frequency
Information: Asymmetric Tail Dependence ..................................................................... 801
Petra Tomanová
Systemic Risk and Community Structure in the European Banking System ............... 807
Gabriele Torri
Nonparametric Kernel Regression and Its Real Data Application ................................ 813
Tomáš Ťoupal, František Vávra
Concept of Income Inequality Gap .................................................................................... 819
Kamila Turečková, Eva Kotlánová

X
On Modelling of the Development of Turnover in Services in Slovak Republic: Tourism
Approach .............................................................................................................................. 824
Petra Vašaničová, Eva Litavcová, Sylvia Jenčová
Analysis of Truncated Data with Application to the Operational Risk Estimation...... 830
Petr Volf
Implementation of Permutation Tests in Research of Problematic Use of the Internet by
Young People ....................................................................................................................... 836
Katarzyna Warzecha, Tomasz Żądło
The Level of Implementation of Europe 2020 Strategy Headline Areas in European
Union Countries ................................................................................................................... 842
Andrzej Wójcik, Katarzyna Warzecha
On Measuring Accuracy in Claim Frequency Prediction ............................................... 849
Tomasz Żądło, Alicja Wolny-Dominiak, Wojciech Gamrot
Multiple Suppliers Selection Using the PROMETHEE V Method ................................ 854
František Zapletal
The Impact of Statistical Standards on Input-Output Analysis ..................................... 860
Jaroslav Zbranek, Jakub Fischer, Jaroslav Sixta
Spatial Analysis of the Population Aging Phenomena in European Union ................... 866
Katarzyna Zeug-Żebro, Monika Miśkiewicz-Nawrocka
Oscillators and Their Usefulness in Foreign Exchange Trading .................................... 872
Tomas Zuscak
Use of Malmquist Index in Evaluating Performance of Companies in Cluster ............ 878
Miroslav Žižka
Weak Orders for Intersecting Lorenz Curves:
Analysis of income distribution in European countries Tommaso Lando1, Lucio Bertoli-Barsotti2, Michaela Staníčková3
Abstract. The low growth of the EU performance has increased concerns regarding an increasing wage dispersion and income inequality, which hampers sustainable and inclusive economic development. In this context, the Lorenz curve can be used to define different ranking criteria for comparison of income distributions in terms of inequality, such as the Lorenz dominance and some weaker dominance relations that have been introduced more recently in the literature. In this paper, we review such methods and propose an empirical study with which we analyse and compare the income distributions of the 28 European Union member states (EU-28) plus oth-er five European countries, on the basis of the dominance criteria discussed. The da-tabase for empirical analysis has been downloaded from the Eurostat’s website – In-come and living conditions statistics.
Keywords: Lorenz curve, income inequality, disparity, stochastic dominance, EU-28.
JEL Classification: C44, E24, O52. AMS Classification: 62C, 91B14.
1 Introduction
In this study, the term “income” is referred to as household disposable income in a particular year, which con-sists of earnings, self-employment, capital income and public cash transfers; income taxes and social security contributions paid by households are deducted. The income of the household is attributed to each of its members, with an adjustment to reflect differences in needs for households of different sizes.
The Lorenz curve (LC) is a fundamental tool for comparison of income distributions in terms of inequality. The LC gives rise to a preorder, that is, the Lorenz dominance (LD), which is generally used to rank distributions based on their degree of inequality. In an economic framework, the LD is coherent with the Pigou-Dalton condi-tion, i.e. the so called “principle of transfers”. According to this principle, the higher of two non-intersecting Lorenz curves can be obtained from the lower one by an iteration of income transfers from “richer” to “poorer” individuals (the so called elementary transfers or T-transforms, see [8], p. 32), also called progressive transfers, [10]). For this reason, the “coherence” with the LD represents a fundamental property for all inequality (or con-centration) measures.
However, many empirical studies revealed that Lorenz curves often intersect in the practice. It is not rare to find couples of distributions that cannot be ranked by the LD. In such cases, we can compare the intersecting distributions by relying on weaker orders of inequality, such as the second-degree Lorenz dominance, 2-LD [1]. The basic idea of the 2-LD is to move from the (first-degree) LD to a dominance relation of higher degree by cumulating LCs i) from the bottom or, ii), from the top, which gives rise to a Lorenz dominance of second de-gree. In the first case (i), this idea has been analysed in several works, related to the concept of third-degree in-verse stochastic dominance [1,9]. These orderings emphasize the left tail of the distribution. Indeed, many au-thors (see e.g. [2,10]) agree that an elementary transfer should be more equalizing the “lower” it occurs in the distribution, that is, the principle of aversion to downside inequality [4]. On the other hand, in an economic con-text, a lot of attention is recently given to those variations occurring at the top of the income distribution [7]. Thus, the second idea (ii), introduced by Muliere and Scarsini [9] and more recently developed by Aaberge [1], emphasizes the right tail of the distribution in spite of the left one. More recently, Lando and Bertoli-Barsotti [6] introduced a new weak order, namely disparity dominance, which is based on the cumulated difference between the upper and the lower parts of the LC and it is aimed at emphasizing inequality in both tails of the distribution. Indeed, this approach attempts to combine the main features of approaches i) and ii) into a single preorder.
1 University of Bergamo, via dei Caniana 2, Bergamo, Italy and VŠB-TU Ostrava, Faculty of Economics, De-partment of Finance, Sokolská třída 33, 702 00 Ostrava 1, Czech Republic e-mail: [email protected] 2 University of Bergamo, via dei Caniana 2, Bergamo, Italy e-mail: [email protected] 3 VŠB-TU Ostrava, Faculty of Economics, Department of European Integration, Sokolská třída 33, 702 00 Os-trava 1, Czech Republic e-mail: [email protected]
Mathematical Methods in Economics 2017
402

In this paper, we analyse the income distributions of the EU-28 countries plus other five non-WU countries in the year 2015 with a twofold objective: i) compare the effectiveness of the weak preorders studied in terms of discriminating power and; ii) characterize mathematically the differences between the distributions of income of the EU-28 countries. In section 2, we introduce the notation and present the dominance relations used in our empirical analysis. In section 3 we present the data and describe the empirical results. In section 4 we summarize the results.
2 Methods
We recall that a preorder is a binary relation ≤ over a set � that is reflexive and transitive. In particular, observe that a preorder ≤ does not generally satisfy the antisymmetric property (that is, � ≤ � and � ≤ � does not neces-sarily imply � = �) and it is generally not total (that is, each pair �, � in � is not necessarily related by ≤).
In this paper, we relax the common assumption of non-negativity of the distribution, because our data in sec-tion 3 present also negative incomes. Although this feature does not hamper the methods discussed below, in what follows we shall discuss the effect of negative incomes on the fundamental tools for the measurement of inequality, such as the LC and the Gini index.
Let � be a distribution with positive and finite expectation � (clearly, the mean cannot be zero or less than zero, otherwise the LC cannot be defined). The (generalized) inverse or quantile function of � is given by:
��� � = inf��: ���� ≥ �, ∈ �0,1�. (1)
The Lorenz curve � is defined as follows:
�� � =�
��� �������
!, ∈ �0,1�. (2)
The LC is a convex function. However, note that, differently by the usual definition of [5], the LC may be de-creasing and negative because of negative incomes. The Gini index is given by twice the area between the Lorenz curve and the 45° line:
Γ��� = 1 − 2 � �������
!. (3)
Under the common assumption of non-negative incomes, the Gini index is typically normalized between 0 and 1. However, in presence of negative incomes, the LC can be negative, so that Γ can exceed 1. For this reason,
Chen, Tien-Wang and Tong-Shieng [3] propose re-normalizing Γ by dividing it by Γ%&' = 1 − 2 � ������(
!,
where ℎ = sup � : �� � ≤ 0�. The resulting index is denoted here by Γ∗ = Γ/Γ%&'. Let us also define the complementary curve �0, given by:
�0� � =�
��� ���1 − ����
!= 1 − ��1 − �, ∈ �0,1� (4)
Actually, for a given percentage , �� � represents the percentage of “total” possessed by the low 100 % part of the distribution, while �0� � represents the percentage of “total” corresponding to the top 100 % part of the distribution. From a geometrical point of view, �0� �, increasing and concave, is the 180° rotation of �� �, increasing and convex, with respect to the point �0.5,0.5�. Now we can introduce:
∆��� = �0��� − ����, � ∈ [0,1/2]. (5)
The interpretation of ∆ is quite simple. As �0��� ≥ ���� ∀� ∈ [0,1/2], the difference between the Lorenz curves expresses the disparity between the “higher” and the “lower” parts of the distribution. In terms of income distributions, ∆ equals the difference between the proportion of the society’s overall wealth that is held by the society’s top (rich) 100�%, and the proportion of the society’s overall wealth that is held by the society’s low (poor) 100�%.
It should be stressed, that the definitions below have been originally introduced only for the case of non-decreasing and non-negative LCs. However, there is no loss of generality if we apply them to our definition of the LC, which also account for the possibility of negative incomes.
Definition 1. We write � ≤8 9 if and only if �� � ≥ �:� �, ∀ ∈ �0,1�.
When the LD is not fulfilled, i.e. when LCs intersect, we need to introduce some weaker criteria in order to obtain unambiguous rankings. Muliere and Scarsini [9] and Aaberge [1] suggest cumulating LCs from the left or from right: that is, attaching more weighting to low or top incomes. Such two parallel approaches give rise to the upward and downward 2-LD [1], defined as follows.
Definition 2. We say that 9 second-degree upward Lorenz dominates �, and write � ≤8; 9 if
Mathematical Methods in Economics 2017
403

� �� �� <
!≥ � �:� ��
<
!, ∀� ∈ [0,1].
We say that 9 second-degree downward Lorenz dominates �, and write � ≤80; 9 iff any of the following equiva-
lent conditions is true:
� �0� �� <
!≤ � �0:� ��
<
!, ∀� ∈ [0,1]
� 1 − �� �� �
<≤ � 1 − �:� ��
�
<, ∀� ∈ [0,1].
Observe that � ≤8 9 implies � ≤8; 9 and � ≤80
; 9, but the converse is not necessarily true, i.e. � ≤8; 9 and
� ≤80; 9 do not imply the LD. Moreover, note that � ≤8
; 9 implies that � starts above �: and presents a lower (or equal) value of the Gini index. Differently, � ≤80
; 9 implies that � starts below �: but still has a lower (or equal) Gini. Hence it is apparent that in both cases the condition Γ��� ≤ Γ�9� is necessary to establish a domi-nance. In particular, if LCs cross only once, the one with higher Gini index dominates the other with respect to upward 2-LD (if the latter starts below, see [11]) or downward 2-LD (if the latter starts above, [6]).
As an alternative approach, Lando and Bertoli-Barsotti [6] combined the basic ideas (preferences) expressed by the ≤8
; and ≤80; orderings into a single preorder, which emphasizes inequality in both the tails of the distribu-
tion. This is done by symmetrically cumulating the Lorenz curve from both sides, through the disparity curve ∆ , described above. In fact, it can be reasonable to wish that � is preferable to 9 if ∆ is (uniformly) as small as possible, compared to ∆: this concept can be expressed as follows in terms of an integral inequality.
Definition 3. We say that � second-degree disparity dominates (2-DD) 9 and write � ≤=
; 9 iff:
� ∆� �� <
!≤ � ∆:� ��
<
! ∀� ∈ [0,0.5].
Like � ≤8; 9, also � ≤=
; 9 implies the condition � ∆� �� �/;
!≤ � ∆:� ��
�/;
!, which is equivalent to
Γ��� ≤ Γ�9� (� ∆� �� �/;
!= � � − �� ���
�
!).
Similarly to what has been discussed above, with regard to single-crossing LCs, if the curves are double-crossing, a theorem in [6] determines a sufficient condition for the 2-DD based on the positions of the crossing points and the values of the Gini index. Thus, 2-LD and 2-DD are especially suitable for ranking single-crossing and double-crossing LCs, respectively.
3 Empirical analysis
The main objective of this paper is to investigate the discriminating power of the dominance relations described in section 2. As a general rule, the stronger the preorder, the less it is applicable. For instance, we may find, in practice, many couples of intersecting LCs that are not comparable with LD. Thus, the main advantage of using a weaker criterion is that we can significantly increase the number of pairs of LCs that are comparable. Here we refer to the proportion of couples that are ranked according to a given preorder as the rate of completeness of such preorder. By increasing the rate of completeness we reduce the ambiguousness and we provide a normative justification for the use of an index of inequality that is coherent with the preorder considered, such as the Gini index. To perform our empirical analysis, we downloaded the income distributions of the EU-28 countries, plus some other non-EU counties, in the year 2015. The dataset is described as follows.
Data have been retrieved online from Eurostat’s website. In particular, Eurostat provides the “distributions of income by quantiles” with two options in terms of income and living conditions indicator, namely: i) top cut-off
point, which represent the income of the individual at the right end of the given quantile and; ii) share of nation-
al equivalized income, which is the share of the total income which belongs to a given interval. Eurostat provides i) and ii) for the three quartiles, the four quintiles, the nine deciles and the first (and last) five percentiles. There-fore, by properly cumulating the shares of national equivalized income we can obtain the values of the LC for
= 0.01,0.02,0.03,0.04,0.05,0.1,0.2,0.25,0.3,0.4,0.5,0.6,0.7,0.75,0.8,0.9,0.94,0.95,0.96,0.97,0.98,0.99,
that is, a LC with 22 nodes.
For the year 2015, we computed the LCs of the EU-28 plus the following five non-EU countries: Macedonia, Iceland, Norway, Serbia and Switzerland, which totalize 33 countries. Then, we compared every pair of LCs (i.e. 33×32/2=528 pairs) based on the four dominance relations studied in section 2, namely LD, upward 2-LD, downward 2-LD and 2-DD. To be noted is that many countries present negative values for the LC, always for ≤ 0.04. The rates of completeness are shown in Table 1.
Mathematical Methods in Economics 2017
404

LD Up. 2-LD Down. 2-LD 2-DD
0.462 0.634 0.729 0.733
Table 1 Rates of completeness
This results reveal that the LD cannot even rank half of the pairs. This is due to the fact that the countries (especially the EU-28) present similar concentration patterns as well as similar values of the Gini index, thus LCs cross most of the times. Furthermore, we observe that generally the set of countries (at least as it is reported by Eurostat’s data) concentrate most of their inequality in the right tails (i.e. high incomes) rather that in the left tails, so that cumulating from the right (downward 2-LD) is more critical (with regard to the discriminating pow-er) than cumulating from the left (upward 2-LD). However, the relevance of the basic idea of downward 2-LD, that is, to emphasize the left tail, is acknowledged my many economists (unlike upward 2-LD). Therefore, it seems to be wiser to adopt 2-DD, so that we can rank the highest possible number of pairs by emphasizing both tails at the same time. However, although 2-DD yields the highest rate of completeness, it is far from reaching a complete ranking of the EU-28. In fact, some of the countries present very similar LCs, which might be ranked only by relying on dominance relations that are even weaker than 2-LD and 2-DD, so that their use would be hardly justifiable.
Further analyses, reported in Table 2, show the effectiveness of the different ranking criteria depending on the number of times a couple of LCs intersect. Downward 2-LD and 2-DD rank 65% of the single-crossing LCs, but 2-DD has slightly more discriminating power when dealing with double-crossing LCs, coherently with the theoretical result of [6]. We also note that the maximum number of times a LC crosses another is 3, but none of the dominance relations analysed is able to rank such pairs (that are just 3 pairs over 528, i.e. the 0.05%).
No. of intersections Up. 2-LD Down. 2-LD 2-DD
1 0.35 0.65 0.65 2 0.29 0.30 0.33
Table 2 Proportions of single and double-crossing LCs ranked by 2-LD and 2-DD
Table 3 shows the values of the different values of the Gini index for the EU-28 countries and the other five non-EU countries, and the different rankings yielded. We also computed the normalized Gini index Γ∗, which accounts for the presence of negative incomes, but in our case the differences between the normalized and non-normalized values are negligible (the rankings are identical), thus we do not report the values of Γ∗ below (the maximum value of Γ%&' obtained is 1.0001). However, our results presented above suggest that ranking based on the Gini index (when dealing with the 33 countries considered here) is supported by the LD only in less than 50% of the cases, whilst e.g. the 2-DD supports the Gini index in almost 75% of the cases.
Country D Country D
Austria 0.541,{24} Lithuania 0.754,{2} Belgium 0.519,{26} Luxembourg 0.564,{20} Bulgaria 0.732,{4} Malta 0.561,{21} Croatia 0.610,{14} Macedonia 0.672,{10} Cyprus 0.668,{11} Netherlands 0.530,{25}
Czech Rep. 0.502,{27} Norway 0.479,{31} Denmark 0.547,{23} Poland 0.607,{15} Estonia 0.689,{6} Portugal 0.675,{9} Finland 0.501,{28} Romania 0.744,{3} France 0.581,{19} Serbia 0.759,{1}
Germany 0.597,{16} Slovakia 0.470,{32} Greece 0.681,{8} Slovenia 0.488,{30}
Hungary 0.561,{22} Spain 0.687,{7} Iceland 0.469,{33} Sweden 0.499,{29} Ireland 0.592,{17} Switzerland 0.586,{18}
Italy 0.642,{12} U.K. 0.640,{13} Latvia 0.705,{5}
Table 3 Gini indices and rankings for the EU-28 countries and the other non-EU countries
Mathematical Methods in Economics 2017
405
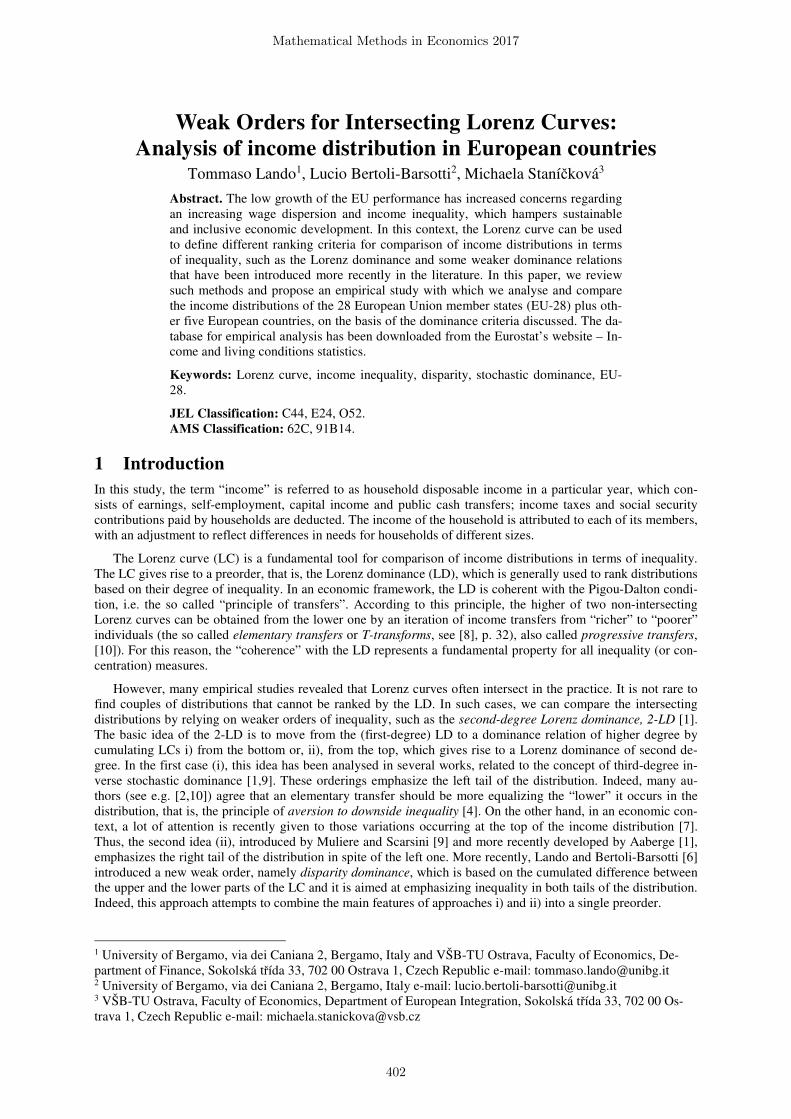
It is also worth mentioning some special cases. The LC of Czech republic LD-dominates 19 of the other 32 countries. However, it can be seen in Figure 1 that the left tail of the LC of Czech republic is above all the oth-ers. Indeed, by using upward 2-LD, downward 2-LD and 2-DD, one obtains that Czech Republic dominates 24, 19 and 21 countries, respectively. The reason is that upward 2-LD emphasizes the left tail.
Figure 1 LCs of Czech Republic (solid form) and the other 32 countries (dotted form)
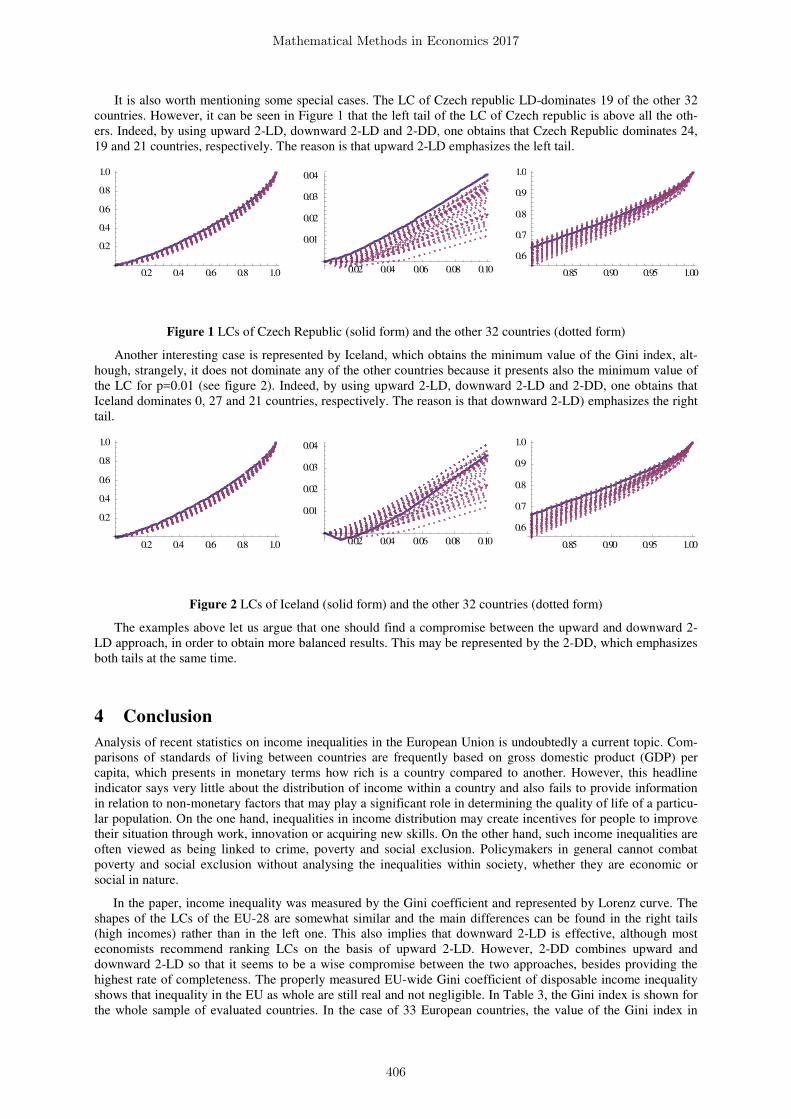
Another interesting case is represented by Iceland, which obtains the minimum value of the Gini index, alt-hough, strangely, it does not dominate any of the other countries because it presents also the minimum value of the LC for p=0.01 (see figure 2). Indeed, by using upward 2-LD, downward 2-LD and 2-DD, one obtains that Iceland dominates 0, 27 and 21 countries, respectively. The reason is that downward 2-LD) emphasizes the right tail.
Figure 2 LCs of Iceland (solid form) and the other 32 countries (dotted form)
The examples above let us argue that one should find a compromise between the upward and downward 2-LD approach, in order to obtain more balanced results. This may be represented by the 2-DD, which emphasizes both tails at the same time.
4 Conclusion
Analysis of recent statistics on income inequalities in the European Union is undoubtedly a current topic. Com-parisons of standards of living between countries are frequently based on gross domestic product (GDP) per capita, which presents in monetary terms how rich is a country compared to another. However, this headline indicator says very little about the distribution of income within a country and also fails to provide information in relation to non-monetary factors that may play a significant role in determining the quality of life of a particu-lar population. On the one hand, inequalities in income distribution may create incentives for people to improve their situation through work, innovation or acquiring new skills. On the other hand, such income inequalities are often viewed as being linked to crime, poverty and social exclusion. Policymakers in general cannot combat poverty and social exclusion without analysing the inequalities within society, whether they are economic or social in nature.
In the paper, income inequality was measured by the Gini coefficient and represented by Lorenz curve. The shapes of the LCs of the EU-28 are somewhat similar and the main differences can be found in the right tails (high incomes) rather than in the left one. This also implies that downward 2-LD is effective, although most economists recommend ranking LCs on the basis of upward 2-LD. However, 2-DD combines upward and downward 2-LD so that it seems to be a wise compromise between the two approaches, besides providing the highest rate of completeness. The properly measured EU-wide Gini coefficient of disposable income inequality shows that inequality in the EU as whole are still real and not negligible. In Table 3, the Gini index is shown for the whole sample of evaluated countries. In the case of 33 European countries, the value of the Gini index in
0.2 0.4 0.6 0.8 1.0
0.2
0.4
0.6
0.8
1.0
0.02 0.04 0.06 0.08 0.10
0.01
0.02
0.03
0.04
0.85 0.90 0.95 1.00
0.6
0.7
0.8
0.9
1.0
0.2 0.4 0.6 0.8 1.0
0.2
0.4
0.6
0.8
1.0
0.02 0.04 0.06 0.08 0.10
0.01
0.02
0.03
0.04
0.85 0.90 0.95 1.00
0.6
0.7
0.8
0.9
1.0
Mathematical Methods in Economics 2017
406
2015 ranged from 0.469 (the best results for Iceland, Slovakia and Norway) to 0.759 (the worst results in Serbia followed by Lithuania and Romania). We observe that the most extreme values of the Gini index are obtained for non-EU countries (Serbia and Iceland). Countries at the top of the ranking are Slovenia, Sweden and Finland with the Gini indices from 0.488 to 0.501, whilst those at the bottom are Bulgaria, Latvia and Estonia, having the Gini index from 0.732 to 0.689. Then, the remainder countries can be broadly divided into two groups, with Croatia, Cyprus, Macedonia, Greece, Italy, Poland, Portugal and United Kingdom having the Gini index up to 0.6 value, and others such as Austria, Belgium, Czech Republic, Denmark, France, Germany, Hungary, Ireland, Luxembourg, Malta, Netherlands, Spain and Switzerland having values of the Gini index up to 0.5. Thus, we have two quite large sets with very similar values of the Gini index. Moreover, dominance results show that the Gini index is not sufficient to capture the real differences between the income distributions.
Within the EU, there are differences in income inequality which require policy action. It is important to re-member that high levels of income inequality have various negative consequences (including poor health out-comes, weak social mobility and potential swings towards political populism). Therefore, efforts to address in-come inequalities should be stepped up in a number of countries as well as at the EU level. Many politicians and economists believe that economic growth replaces or diminishes the need for social policies. However, the EU growth over the last decades has been accompanied by increase in inequalities in many countries. Inequalities threaten social cohesion and they threaten growth. Inequality is a key problem facing the EU, and it has signifi-cant impacts not only on human well-being, but also on economic performance. If such concerns are correct, it is essential not only to build institutional structures for European social union but also to map social inequalities (including income dispersion) in the EU. Cohesion is about income and employment, but also about other di-mensions of well-being.
The recent interest in income inequality is thus simply the recognition of the centrality of the topic to eco-nomic theory, policy, and performance. The recent return of the topic of income inequality has been triggered by important contributions to the empirical analysis of inequality, but these empirical analyses must be combined with an economic theory that is adequate to address the macroeconomic and microeconomic effects of income inequality on social welfare. These problems are not always well diagnosed because the empirical measurement of inequality is often unable to take into account the geographical dimension of inequality, which is particularly complex in the EU. To study income inequality in the EU as a whole, one needs adequate statistical tools which can be used in the geographical and political context faced by the EU. Important is also the relevant database as source for required data and indicators. In the case of the EU analysis, the relevant source is Eurostat, i.e. the official statistical office of the EU, but there are also some data particularities in Income and living conditions statistics, e.g. negative incomes. A deeper exploration of the underlying data shows that among those whose income is in the lower tail, negative income components are at work; these negative components can be due to self-employment, tax burden, transfers to other households or loss in property income.
Acknowledgements
This paper is supported by the grant No. 17-23411Y of the Czech Science Agency (to T.L and M.S.).
References
[1] Aaberge, R.: Ranking intersecting Lorenz curves. Soc. Choice Welf 33 (2009), 235-259. [2] Atkinson, A.B.: More on the measurement of inequality. J. Econ. Inequal. 6 (2008), 277-283. [3] Chen, C., Tien-Wang, T., and Tong-Shieng, R.: The Gini coefficient and negative income. Oxford Econom-
ic Papers 34 (3) (1982), 473-478. [4] Davies, J.B. and Hoy, M.: Making inequality comparisons when Lorenz curves intersect. Am. Econ. Rev. 85
(1995), 980-986. [5] Gastwirth, J.L.: A general definition of the Lorenz curve. Econometrica 39 (1971), 1037-1039. [6] Lando, T. and Bertoli-Barsotti, L.: Weak orderings for intersecting Lorenz curves. Metron 74 (2), (2016),
177-192. [7] Makdissi, P. and Yazbeck, M.: On the measurement of plutonomy. Soc. Choice Welf 44 (2015), 703-717. [8] Marshall, A.W., Olkin, I. and Arnold, B.C.: Inequalities: theory of majorization and its applications. (sec-
ond edition), Springer, 2009. [9] Muliere P., Scarsini M.: A note on stochastic dominance and inequality measures. Journal of Economic
Theory 49 (2) (1989), 314-323. [10] Shorrocks, A.F., Foster J.E.: Transfer sensitive inequality measures. Rev. Econ. Stud., 14 (1987) 485-497. [11] Zoli C.: Intersecting generalized Lorenz curves and the Gini index. Soc. Choice Welf 16 (2), (1999) 183-
196.
Mathematical Methods in Economics 2017
407
Related Documents