Should Policymakers Care Whether Inequality Is Helpful or Harmful For Growth? Jason Furman Harvard Kennedy School & Peterson Institute for International Economics Rethinking Macroeconomic Conference, October 11-12 2018 Preliminary Draft: October 5, 2017 The view that inequality is harmful for growth is gaining currency among policymakers around the world. In the strongest form of this argument, high levels of inequality can make sustained growth impossible or even cause recessions. In a weaker form, lower levels of inequality are good for growth. Among policymakers this view has almost entirely supplanted the traditional economic view that there was a tradeoff between inequality and growth and that greater inequality might be the price to be paid for higher levels of growth. This paper is not a fresh attempt to assess the empirical evidence on inequality and growth or a survey of the existing literature. Instead this paper addresses the question of whether policymakers should even be interested in this question in its traditional form, answering with a resounding no for three reasons. First, although more recent papers have reached the conclusion that exogenously higher levels of inequality result in lower longer-run growth rates, a number of studies have found more nuanced and complicated results, the magnitude and importance of inequality is not so high that it deserves a special place as an explanatory variable, and in general cross-country growth regressions are inherently limited in their ability to make definitive and robust causal claims. Second, and more importantly, with few notable recent exceptions, the literature is about the impact of inequality on growth not the impact of policies to reduce inequality on growth. The former is of interest to social scientists and historians but it is the latter that is relevant for policymakers. Third, and fundamentally, the question itself is mis-specified, at least from the perspective of policymakers. From a normative perspective most policymakers do not care about the average of incomes in the economy—which is the left-hand side variable posed in most of this literature—which accords equal weight to $1 added to the income of a poor person or a billionaire. Most social welfare functions would place more weight on the bottom than on the

Welcome message from author
This document is posted to help you gain knowledge. Please leave a comment to let me know what you think about it! Share it to your friends and learn new things together.
Transcript
Should Policymakers Care Whether Inequality Is Helpful or Harmful For Growth?
Jason Furman Harvard Kennedy School & Peterson Institute for International Economics
Rethinking Macroeconomic Conference, October 11-12 2018
Preliminary Draft: October 5, 2017
The view that inequality is harmful for growth is gaining currency among policymakers
around the world. In the strongest form of this argument, high levels of inequality can make
sustained growth impossible or even cause recessions. In a weaker form, lower levels of
inequality are good for growth. Among policymakers this view has almost entirely supplanted
the traditional economic view that there was a tradeoff between inequality and growth and that
greater inequality might be the price to be paid for higher levels of growth.
This paper is not a fresh attempt to assess the empirical evidence on inequality and
growth or a survey of the existing literature. Instead this paper addresses the question of whether
policymakers should even be interested in this question in its traditional form, answering with a
resounding no for three reasons.
First, although more recent papers have reached the conclusion that exogenously higher
levels of inequality result in lower longer-run growth rates, a number of studies have found more
nuanced and complicated results, the magnitude and importance of inequality is not so high that
it deserves a special place as an explanatory variable, and in general cross-country growth
regressions are inherently limited in their ability to make definitive and robust causal claims.
Second, and more importantly, with few notable recent exceptions, the literature is about
the impact of inequality on growth not the impact of policies to reduce inequality on growth. The
former is of interest to social scientists and historians but it is the latter that is relevant for
policymakers.
Third, and fundamentally, the question itself is mis-specified, at least from the
perspective of policymakers. From a normative perspective most policymakers do not care about
the average of incomes in the economy—which is the left-hand side variable posed in most of
this literature—which accords equal weight to $1 added to the income of a poor person or a
billionaire. Most social welfare functions would place more weight on the bottom than on the

2
top. Certainly politicians generally like to talk about the impact of their policies on “the middle
class” or the poor or some other group, not simple the arithmetic average across the population.
So even if inequality was bad for growth, it still might be good for growth of social welfare in
the relevant normative sense.
The aggregate question posed in much of the literature is not convincingly answerable,
policy focused, or normatively relevant. Instead more research should focus on developing and
analyzing left-hand side variables that are normatively relevant, from simple ones like median
income, the income of the bottom quintile or the mean of log income to more complicated
aggregates like the Organisation of Economic Cooperation and Development (OECD)’s Multi-
dimensional Living Standards (Boarini, et al. 2016). Moreover, the right-hand side variable of
interest are not inequality in the aggregate but specific policies that might increase or reduce
inequality.
Policies that reduce inequality while increasing growth—and there are many—are clearly
worth prioritizing. But in many cases, there are tradeoffs that need to be evaluated based on the
magnitude of the tradeoff and a social welfare function. The answer will vary area by area but I
provide some examples and evidence that suggest that in advanced economies a lexicographic
framework that focuses exclusively on distributional analysis and then only to growth when the
distribution of different policies is the same is generally likely to be appropriate under a broad
range of social welfare functions. This is because the distributional effects of many policies are
orders of magnitudes larger than the growth effects. In developing economies, however, the
scope for policy- and institutionally-induced variations in growth rates is much larger and thus
the lexicographic approach is unlikely to be as widely appropriate.
The first part of this paper answers the question in the title of the paper—discussing the
ways in which many of the existing approaches to answering the question of the impact of
inequality on growth are misguided. In the second part of the paper I discuss some policy areas
where reducing inequality and growth are complementary and also how to evaluate tradeoffs
between them, developing a specific example from the analysis of tax cuts and talking more
broadly about the aggregate macroeconomic evidence and how it might be similar or different
between developing and advanced economies.

3
Aggregate Analysis on the Impact of Inequality on Growth
Many surveys have considered the ways that inequality could help or hurt growth so this
is not the place to repeat them at length. Traditionally more of an emphasis was placed on ways
that inequality could help growth. From a macroeconomic perspective, Nicholas Kaldor (1955)
argued that because higher-income households saved more, more skewed incomes would
increase national savings, capital accumulation, and thus the level of output. The traditional
microeconomic argument is that inequality provides an incentive for greater investments in
human capital, risk-taking and entrepreneurship, all of which are critical for growth (Mirrlees
1971; Lazear and Rosen 1981).
On the other side, a number of arguments have been put forward about ways in which
inequality is harmful for growth including cutting off segments of the population from the
education they would need to be maximally innovative (Bell, et al. 2016), reducing trust and thus
requiring more inefficient contracts (Stiglitz 1974; Bowles 2012), making it harder to take risks
because the consequences of failure can be even larger, and leading to political instability and
economically harmful policies (Alesina and Perotti 1996; Keefer and Knack 2002).
A steady stream of papers have attempted to empirically estimate the answer to this
question. The aggregate literature starts with Alesina and Rodrik (1994), runs through a spate of
papers in the late 1990s and early 2000s, and has recently been revived with notable
contributions by the IMF and OECD. On balance this literature, much of which has been
summarized elsewhere (e.g., Cingano 2014 and Boushey and Price 2014), has more often found
that inequality is harmful to growth than helpful to growth, although the conclusion has varied a
lot from paper to paper. Findings from a number of papers also suggest differential effects by a
country’s level of development, with inequality having a negative impact on growth for poorer
countries and an insignificant, or even positive, effect for richer countries (e.g. Deininger and
Squire 1998; Barro 2000; Forbes 2000; Knowles 2005; Castellò 2010).
This literature, like all cross-country growth literature, is in some ways the best we can
do in answering aggregate, general equilibrium questions. But like all cross-country growth
regressions, it struggles with untangling causation from correlation, noisiness and comparability
of data, and the degrees of freedom problem when there are fewer countries than there are
explanations of inequality. Although instrumental variables are used to find plausibly exogenous

4
variations in inequality, the weakness of the instruments has raised doubts about the results
(Kraay 2015).
As a social scientist if forced to answer the question of the effect of inequality on
growth—recognizing the inevitably limited evidence and absence of anything resembling
convincing causal identification—I would bet on inequality being harmful to growth. As a
policymaker, however, I would not find that conclusion particularly useful for any particular
decisions or broader prioritization. In part this is because the lack of certainty about the evidence
and the fact that even in these results reducing inequality is not necessarily the most important
factor for boosting growth and reasonable reductions in inequality do not result in large increases
in growth. This is not to say that reducing inequality is not good, just that these empirical
estimates give little reason to argue that the motivation for such reductions should be to achieve
higher growth.
More importantly, however, the interpretation of the cross-country research has suffers
from two other issues: the interpretation of the right-hand side variable of inequality and the
meaningfulness of the left-hand side variable of growth.
The Right-Hand Side Variable: Inequality
The right-hand side variable in almost all of this empirical work is inequality itself, not
redistribution—with the notable exceptions of Ostry, Berg and Tsangarides (2014) and OECD
(2015) who examine the impact of both inequality and redistribution as measured by the
difference between the Gini index for market income and the Gini index for post-tax and transfer
income. In part, this focus has been the result of data limitations, until recently there were not
comprehensive datasets that included measures of redistribution—and even now there are serious
questions about the noisiness of those measures (Wittenberg 2015). However, it also reflects
researchers’ focus on a social science question—why do some countries grow more than
others—rather than a policy relevant question.
To illustrate the difference, imagine a literature that tried to figure out whether it was
better for a country to have an asset-to-GDP ratio of 75 or a debt-to-GDP ratio of 75.
Undoubtedly it would find that the former is better than the later. Everything else being equal,
what country would not prefer to have a sizeable asset to a meaningful debt? It would not follow,

5
however, that the right policy for a country with a 75 percent debt-to-GDP ratio would be to run
large surpluses until it ended up with a 75 percent asset-to-GDP ratio.
Most of the literature and speculation on the aggregate impact of inequality is similar.
One example is Alesina and Rodrik (1994), the paper that started the modern literature on the
impact of growth on inequality. That paper found a statistically significant, economically
meaningful and robust negative impact of inequality on growth—the relevant conclusion for
social scientists seeking to understand growth. But the model underlying the paper provided
exactly the opposite lesson for policymakers. Specifically, Alesina and Rodrik model had two
features. The first feature of the model is that redistribution is economically inefficient, reducing
growth (in their model, this is because the instrument of redistribution is capital taxation). The
second feature of the model is that the greater degree of inequality the more a government will
engage in redistribution (in their model, the median voter is decisive and her difference from the
mean voter determines the magnitude of redistribution).
In the Alesina-Rodrik model inequality is only bad for growth because it leads
policymakers to undertake policies that are bad for growth. The same types of features persist in
models up through today, for example Halter, Oechslin and Zweimüller (2014) have a model in
which greater inequality leads the median voter to want more transfers at the expense of less
investment in long-term public goods and thus less long-run growth. They too find that in the
long-run inequality is detrimental to growth.
If these models are taken seriously they suggest two lessons for policymakers. The first is
that you are better off being born in a country that is endowed with a low level of inequality,
which is about as useful as the advice that it is better to start with a large public asset than a large
public debt. The second lesson, however, is that if your goal is to maximize growth then you
should not try to reduce inequality—either through the tax system (Alesina and Rodrik) or the
transfer system (Halter, Oechslin and Zweimüller)—because that would be bad for growth. That
is precisely the opposite of the naïve interpretation of the headline empirical finding that
inequality is bad for growth. Moreover, these particular models do not admit an “efficient” way
to redistribute and if they did, they would no longer explain their empirical finding that
inequality is bad for growth. Effectively, these models are subject to the Lucas critique that if
you try to exploit the reduced form relationships they find in the data, the relationship will go
away.

6
I am not arguing that to the degree inequality is associated with lower growth these
models offer the correct interpretation. Consider an alternative model which has two features:
policies to engage in upward redistribution through rent seeking and foreclosure of creative
destruction are harmful to economic growth and the greater the magnitude of inequality, the
more powerful elites will be (this is not too far from the work of Daron Acemoglu, Simon
Johnson and James Robinson, see e.g., Acemoglu, Johnson, and Robinson 2001). Such a model
would be observationally equivalent to the Alesina and Rodrik or Halter, Oechslin and
Zweimüller models in the cross-country growth literature. But it would have exactly the opposite
conclusions, both about political economy (it would imply that to maximize growth, elites power
should be limited) and about policy (inequality-increasing policies themselves are bad for
growth).
The purpose of this is not to take a stand on which of these interpretations is correct, just
to suggest some of the limits of the policy relevance of the aggregate research and encourage
more research on the specific links in the argument. Or at least promote more clarity about what
results are relevant to social scientists and what results are relevant to policymakers.
Some of the policy questions are discussed in the next section, but before getting there I
wanted to talk about the left-hand side variable: economic growth.
The Left-hand Side Variable: Economic Growth
An even more fundamental issue about the question of whether inequality is good or bad
for growth is that growth itself has limited normative usefulness as a guide to public policy. In
part this is for broadly accepted and conceptually straightforward reasons that growth is the not
the same as welfare. A policy that raises GDP by 1 percentage point by having everyone work
harder will not increase everyone’s welfare by 1 percentage point after accounting for the cost of
the lost leisure. For this reason, optimal policies in areas like public finance and regulatory
policies are generally based on welfare analysis or cost-benefit analysis not a simple GDP
maximization exercise. As discussed below, this can be particularly relevant in assessing tax
policies—especially when they present tradeoffs between growth and inequality—because the
welfare benefits can be only about one-quarter of the headline growth effects.
More important is the fact that growth rates record the growth of the arithmetic average
of individual or household incomes. This reflects one particular social welfare function in which

7
$1 of income is equally good whether it is added to a billionaire or a poor person. Similarly,
under this metric a policy that raised a billionaire’s income by $1,000 while lowering everyone
else’s by a combined $500 would be preferred to one that provided $400 evenly divided across
the income distribution. This, of course, does not reflect the social welfare function that most
policymakers would defend—policies are more often advocated based on their purported
benefits for the middle class, rather than the claim that while they hurt the middle class that harm
is outweighed by the benefits for billionaires. The view that $1 is equal at every income level is
also inconsistent with the way individuals treat risk and marginal additions to their income.
Unfortunately, however, there is no unambiguously accepted social welfare function. One
simple summary statistic would be to use median income instead of mean income, which has the
virtue of being understandable to policymakers and may capture more of the normatively-
relevant changes in well-being than mean income. Of course, such a measure also throws out a
tremendous amount of information about how incomes are changing for everyone who is not at
the median.
An economist’s first instinct might be to reach for the mean of log income. This metric
reflects a particular way to combine growth and inequality, with a mean-preserving spread of
incomes (i.e., greater inequality) lowering the indicator. In particular, it corresponds to the
normative assumption that a 10 percent increase in income for a lower-income household is
equivalent to a 10 percent increase in income for a higher-income household. There is some
evidence from household-level and cross-country data that this is a reasonable description of the
way people view their own satisfaction (Stevenson and Wolfers 2008). The evidence, however,
does not rule out other possibilities for the curvature of the utility function.
A large literature on how people respond to risk finds the coefficient of relative risk
aversion somewhere in the range of 1 to 4, with 2 being a general consensus value. This suggests
that someone would be willing to give up somewhat more than 10 percent of their income in a
high-income state to protect against a 10 percent loss of income in a low-income state. To the
degree this intrapersonal experience is used as a basis of social welfare comparisons, it would
suggest that the change in log income would understate the costs of inequality. Moreover, long-
standing ethical arguments have advanced the proposition that the interpersonal comparison
should be based on a greater degree of risk aversion than is empirically associated with
individuals. In the extreme, infinite risk aversion would lead to the Rawlsian view that changes
8
in welfare should be judged by the change for the worst-off person (Rawls 1971). In practical
terms, such a welfare metric might correspond to looking at the change in income for the bottom
quintile, a measure that has the benefit of being comprehensible to policymakers, like median
income.
The Atkinson (1970) generalized mean provides a flexible framework that encompasses
all of these alternative metrics. Most importantly, it allows policymakers to choose a normative
parameter that reflects the weight that they put on changes in different parts of the income
distribution, which can range from 0 (which corresponds to mean incomes) to infinity (which
corresponds to the Rawlsian case), with values of 1.5 (roughly corresponding to median income)
and 50 (roughly corresponding to the bottom quintile) often employed (Boarini, Murtin,
Schreyer, and Fleurbaey 2016). Such measures, however, have the disadvantage that they are not
readily understandable by policymakers are not readily available.
Recent efforts by the OECD build on the Atkinson index to also incorporate the ways in
which people value longevity and are averse to a greater risk of becoming unemployed,
combining these measures together into Multi-Dimensional Living Standards (Boarini, Murtin,
Schreyer, and Fleurbaey 2016). This measure moves even closer to a welfare-relevant metric, but
at the cost of being even less intuitively meaningful to policymakers. Moreover, it places a lot of
weight on mortality—which may correctly reflect individual preferences but has the downside of
varying a lot based on factors beyond the traditional considerations.
If all of these measures generally moved together then these considerations would be
purely theoretical. Dollar and Kraay (2002) found that the level and growth of GDP is highly
correlated with the level and growth of the bottom quintile in a large sample of countries. If you
are only interested in the relative well-being of the bottom 20 percent across the Central African
Republic, Brazil, and the United States, comparing GDP per capita will give you a reasonable
approximation. But the differences among the Central African Republic, Brazil and the United
States are much greater in magnitude than what could be driven by policy choices, especially in
rich countries with relatively mature economic institution over any relevant time horizon. In the
case of the advanced economies, in particular, aggregate growth rates are a poor proxy for
alternative normative metrics.
An illustration of these differences is provided by Table 1 which shows growth rates for
the G-7 countries from 1995 to 2015 or the closest available dates. The United States is tied with

9
the United Kingdom for the highest growth rate in GDP per capita over this period but is near the
bottom of the group in the growth of the incomes of the bottom 20 percent, the median
household, and the OECD’s two measures of Multi-Dimensional Living Standards. The measure
of the change in log income—measured indirectly using the change in income and the change in
the Gini coefficient under the assumptions that incomes are log-normally distributed (Stevenson
and Wolfers 2016)—shows a different trend as well.
Table 1
Moreover, the relevant question for policymakers is not whether the level or growth of
incomes is correlated with the level or growth of these welfare-based measures. This is still the
example of the Central African Republic versus the United States. Instead, the relevant question
is: What is the impact of a policy-induced change on the change in average incomes and these
other welfare measures? To the degree that one is considering policies that create tradeoffs
between growth and distribution—which is the only question that requires thinking through these
issues—then the correlation in the policy-driven deltas on these different metrics might be even
lower than in the aggregate data.
Evaluating Particular Policies That Affect Inequality and Growth
There is no unambiguously correct metric for assessing policies. But ultimately
policymakers are concerned with the question of how a given policy intervention affects the
Poorest 10 % of Households
Median Household
Canada 1.4 0.4 0.7 3.0 3.4 1.3France 1.0 0.7 0.6 2.4 2.7 0.9Germany 1.3 -0.2 -0.2 2.4 2.6 0.6Italy 0.2 1.1 0.3 0.9 1.3 -0.1Japan 0.8 1.1 1.4 0.5United Kingdom 1.5 2.0 1.8 2.8 3.4 1.7United States 1.5 0.0 0.3 1.5 2.4 1.2
Annualized Growth Rates of Alternative Measures of Economic Growth in G-7 Countries, 1995-2015
Note: Bottom quintile and median household income are from 1994-2010 for Canada, France, and Germany; from 1995-2010 for Italy; and from 1994-2014 for the United Kingdom and United States. Mean log GDP per capita is from 1995-2014. Source: Organisation for Economic Co-operation and Development; Gornick, et al. (2016); Solt (2016); author's calculations.
Mean Log GDP per Capita
OECD Multi-dimensional Living Standards
GDP per Capita
Bottom Quintile Average
Household Income
Median Household
Income
10
well-being of the bottom quintile or the typical citizen or the bulk of the middle class or possibly
in some rare cases (the exceedingly rational policymakers in Singapore?), mean log income.
This question shifts the focus from broader macroeconomic considerations to the more
microeconomic analysis of specific policies. Posed this way, it is clear that there is no one
answer to the question. Clearly there are policies that help both growth and inequality, education
being one widely accepted example. There are also inequality-reducing policies that dramatically
reduce growth, likely making everyone worse off—with Venezuela being just the most vivid
recent case. And there are policies that might result in a small reduction in growth rates
(measured in the conventional manner), but, by reducing inequality, would actually increase the
growth of living standards for the bulk of citizens. The fact that policies in the real world reflect
a mixture of all of the above is another reason to believe that there is no single and true answer to
the question of whether inequality is good or bad for growth.
All-Good-Things-Go-Together Policies
The easiest case is policies where all good things go together, increasing growth rates (or
creating a one-time increase in the level of output) and reducing inequality. Such policies are
worth adopting on any of the metrics for adopting them. There appear to be a wide range of such
policies, perhaps wider than policymakers had traditionally considered.
One of the strongest cases for an all-good-things-go-together policy is in education. This
is clearly the case for reforms that do not cost money, for example reforms to improve the quality
of K-12 education or shifting to a more Australian-like system of income-based repayments for
higher education. Many reforms that do cost money, for example expanded preschool in the
United States, would also likely generate economic benefits that exceed the deadweight loss
associated with the taxes to fund them (CEA 2014).
Recent research and policy debates around the issue of competition point in a potential
direction for expanding the possibilities of all-good-things-go-together policies. Specifically, this
research identifies a number of ways in which imperfect competition in labor or product markets
is leading to increased inequality—the so called “rise of rents” (Stiglitz 2012, Furman and
Orszag 2015; Barkai 2016) Moreover, the same lack of competition that gave rise to these rents
also may be inhibiting investment and innovation (Gutiérrez and Philippon 2017 and Gilbert
11
2006; Aghion, et al. 2005) To the degree that greater competition can reduce these rents that
could improve both the distribution of income and efficiency.
This could be relevant in product markets, for example through more vigorous antitrust
policy, less strict intellectual property policies, or increased consumer ownership of their data. It
also could be relevant in labor markets, where efforts to combat collusion, reduce non-competes
agreements, or increase the minimum wage or unionization, have the prospect of not only
reducing inequality but also of reducing or redistributing rents in a manner that is efficiency
neutral or even efficiency improving.
Policies that improve either growth (conventionally measured) or inequality without
worsening the other metric would also fall into this category. Revenue neutral business tax
reform, for example, has the prospect of raising the level of output with no meaningful impact on
the distribution of income. Other growth-enhancing measures like infrastructure or expanded
research might affect the distribution of income but in ways that have been little studied and
could reasonably be considered second order for this purpose.
Evaluating Tradeoffs—the Example of Tax Reform
While one might debate whether specific policies truly belong in the all-good-things-go-
together category, there is no debate that policies in this category are worth pursuing. The
trickier question is when policies cause a tradeoff. To understand how to evaluate tradeoffs in
theory and how they actually work out in practice I will examine a toy example from tax policy
that reflects the canonical tradeoff between output and distribution generally assumed in the
public finance literature (although not necessarily universal, see for example Zidar 2017 on
evidence that tax cuts for lower-income households might have larger effects on employment
than tax cuts for higher-income households).
Specifically, consider a 10-percent reduction in labor taxes paid for by a lump-sum tax in
the Ramsey framework put forward by N. Gregory Mankiw and Matthew Weinzierl (2006).
Under these parameters, this policy would increase output by 1 percent and raise welfare by an
amount equivalent to a 0.5-percent increase in consumption in the long run for the representative
agent (the welfare increase is lower because of the cost of foregone leisure).1
1 See Furman (2016) for details underlying these calculations.
12
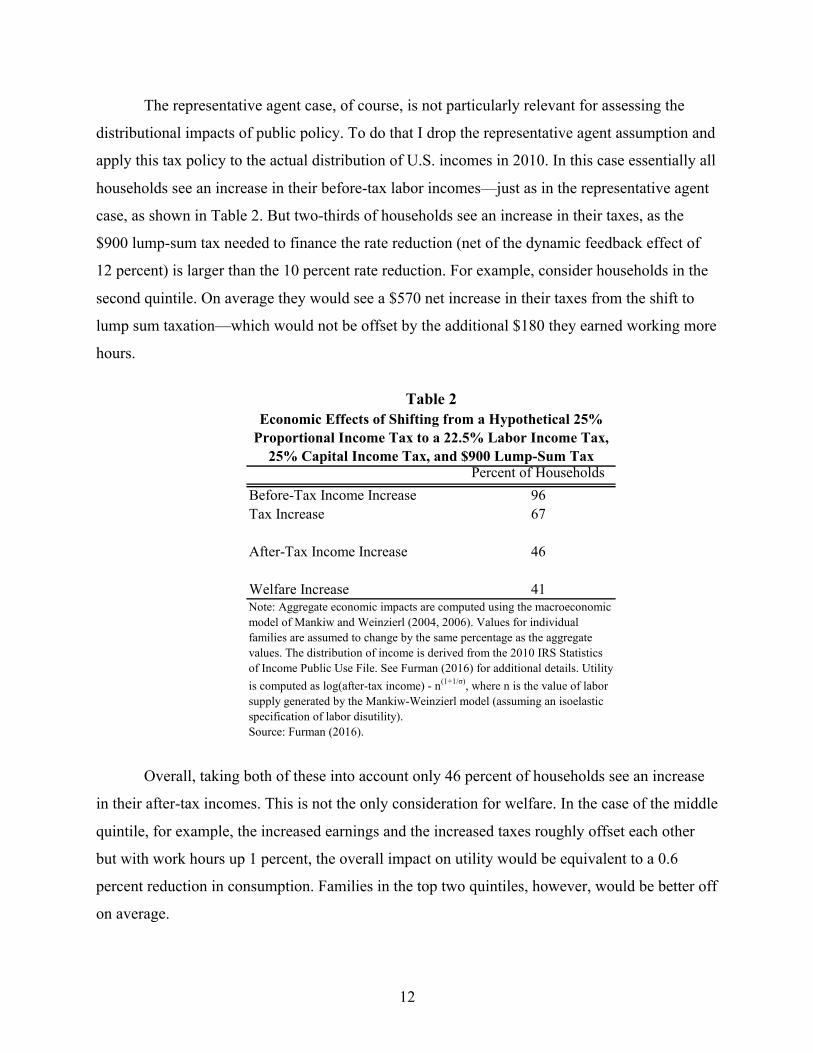
The representative agent case, of course, is not particularly relevant for assessing the
distributional impacts of public policy. To do that I drop the representative agent assumption and
apply this tax policy to the actual distribution of U.S. incomes in 2010. In this case essentially all
households see an increase in their before-tax labor incomes—just as in the representative agent
case, as shown in Table 2. But two-thirds of households see an increase in their taxes, as the
$900 lump-sum tax needed to finance the rate reduction (net of the dynamic feedback effect of
12 percent) is larger than the 10 percent rate reduction. For example, consider households in the
second quintile. On average they would see a $570 net increase in their taxes from the shift to
lump sum taxation—which would not be offset by the additional $180 they earned working more
hours.
Table 2
Overall, taking both of these into account only 46 percent of households see an increase
in their after-tax incomes. This is not the only consideration for welfare. In the case of the middle
quintile, for example, the increased earnings and the increased taxes roughly offset each other
but with work hours up 1 percent, the overall impact on utility would be equivalent to a 0.6
percent reduction in consumption. Families in the top two quintiles, however, would be better off
on average.
Percent of HouseholdsBefore-Tax Income Increase 96Tax Increase 67
After-Tax Income Increase 46
Welfare Increase 41
Economic Effects of Shifting from a Hypothetical 25% Proportional Income Tax to a 22.5% Labor Income Tax,
25% Capital Income Tax, and $900 Lump-Sum Tax
Note: Aggregate economic impacts are computed using the macroeconomic model of Mankiw and Weinzierl (2004, 2006). Values for individual families are assumed to change by the same percentage as the aggregate values. The distribution of income is derived from the 2010 IRS Statistics of Income Public Use File. See Furman (2016) for additional details. Utility is computed as log(after-tax income) - n(1+1/σ), where n is the value of labor supply generated by the Mankiw-Weinzierl model (assuming an isoelastic specification of labor disutility).Source: Furman (2016).

13
To map this back into the framework discussed above, while mean after-tax income rises
by 1 percent the log of after-tax income falls by 1 percent, as shown in Table 3. Using the utility
function assumed in the model and assuming these utilities are interpersonally, additively
comparable, then welfare also declines. The same is also true of a social welfare function that
uses the log of utility to effectively place less weight on the utility of higher-income households
than lower-income households.
Table 3
These results do not provide an answer to the question of whether this tax policy is a
good idea. But I suspect that most of the policymakers who might otherwise have been attracted
to the promise of the higher growth associated with this particular reform would overall object to
the policy if they understood that this growth was achieved by higher taxes on two-thirds of
households, a policy that would leave the median household working harder to earn about the
same after-tax income.
Importantly, these results generalize to a large class of tax policies. In general, and
oversimplifying somewhat, in most models greater growth can only be achieved by making the
tax system less progressive. The traditional revenue-neutral, distribution-neutral tax reform will
Baseline(25% Flat Tax)
Alternative(22.5% Labor Tax + $900 Lump Sum)
PercentChange
IncomeMean After-Tax Income 50,221 50,788 1.1Log After-Tax Income 10.2 10.1 -1.0
WelfareMean Utility 10.00 9.89Mean Log of (Utility + 1) 2.39 2.36
Economic Effects of Shifting from a Hypothetical 25% Proportional Income Tax to a 22.5% Labor Income Tax, 25% Capital Income Tax, and $900 Lump-Sum Tax
Note: Aggregate economic impacts are computed using the macroeconomic model of Mankiw and Weinzierl (2004, 2006). Values for individual families are assumed to change by the same percentage as the aggregate values. The distribution of income is derived from the 2010 IRS Statistics of Income Public Use File. Utility is computed as log(after-tax income) - n(1+1/σ), where n is the value of labor supply generated by the Mankiw-Weinzierl model (assuming an isoelastic specification of labor disutility). See Furman (2016) for additional details. Source: Furman (2016).

14
leave the effective tax rate on labor income unchanged.2 Moreover, the growth effects of tax
changes are about an order of magnitude smaller than the distributional effects of tax changes—
and the disparity between the welfare and distribution effects is even larger. For example,
Treasury’s analysis of the 2005 Bush Tax Reform Panel’s Simplified Income Tax plan found it
would increase national income by 0.2 to 0.9 percent in the long run and Altig et al. (2001) found
that a flat tax with transition relief would increase national income by 2 percent in the long run.
These are similar in magnitudes to a wide range of estimates from official organizations of recent
tax proposals as shown in Table 4.
2 Such a reform lowers the statutory tax rate but also raises the after-tax price of items the person would like to buy, like mortgages, charity and healthcare. As a result the effective rate is essentially unchanged—although the details depend on the income elasticity of specific base broadeners and how behavior works in practice.

15
Table 4
In contrast, Table 5 shows the impact on after-tax incomes of the cumulative tax and
spending changes from 1986 to 2013, showing that these can easily raise or lower incomes by 6
or even 12 percent. Expanded tax credits and health insurance subsidies enacted in 2009 and
2010, for example, raised the after tax income of the bottom two quintiles by 18 and 6 percent
Source Policy Change Short-Run Long-Run
Gravelle (2014) Stylized Reform: 20% Reduction in Income Tax Rates n. r. 0.7 - 4.0
JCT (2014) Camp Plan 0.1 - 1.6 n. r.
Treasury (2006b) President's Advisory Panel on Tax ReformSimplified Income Tax 0.0 - 0.4 0.2 - 0.9Growth and Investment Tax 0.1 - 1.9 1.4 - 4.8Progressive Consumption Tax 0.2 - 2.3 1.9 - 6.0
Treasury (2006a) Permanent Extension of the 2001/2003 Tax CutsFinanced with Future Spending Cuts 0.5 0.7Financed with Future Tax Increases 0.8 (0.9)
JCT (2005) Cut in Federal Individual Income Tax Rates(4.0% in first decade, 2.9% thereafter) 0.0 - 0.5 (0.2) - (0.6)
Not Financed 0.1 - 0.3 0.3 - 0.4Financed with Future Spending Cuts
20% Cut in Federal Corporate Tax RateNot Financed 0.2 - 0.4 0.0 - 0.3Financed with Future Spending Cuts 0.2 - 0.4 0.5 - 0.9
Dennis et al. (2004) 10% Cut in Federal Individual Income Tax RatesFinanced with Future Spending Cuts 0.2 (0.4)Financed with Future Tax Increases 0.3 (2.1)
Altig et al. (2001) Stylized Revenue-Neutral Tax ReformsFlat Tax with Transition Relief 0.5 1.9
Select Estimates of the Effect of Tax Reform on the Level of Output
n. r. = Not reported. Red indicates negative values.Note: Output measure is (in order of preference if multiple measures are reported) national income, real gross national product, and real gross domestic product. Time period for short-run effects varies across studies, but (in most cases) is an average over several years in the first decade. Long-run effects typically reflect estimates of the change in the steady state level of output.Source: Furman (2016).

16
respectively (CEA 2016). No mainstream modelling of a tax plan has an effect close to as large,
let alone one that would take effect immediately.
Table 5
The implications of this are that a welfarist analyzing tax policies that entail tradeoffs
between efficiency and equity would not be far off in just looking at static distribution tables and
ignoring any dynamic effects altogether. This is true for just about any social welfare function
that places a greater weight on absolute gains for households at the bottom than at the top. Under
such an approach policymaking could still be done under a lexicographic process—so two tax
plans with the same distribution would be evaluated on the basis of whichever had higher growth
rates (e.g., a reformed business tax system versus the status quo). But in this case growth would
be the last consideration, not the first.
Does the Tax Reform Example Generalize to Other Policies?
Analyzing tax policies has the advantage of drawing on a broad set of theoretical and
empirical models that integrate output, distribution, and welfare. In most other domains of policy
we do not have anything close to this. Nevertheless, I would speculate that the lexicographic
approach of considering distribution first and then growth is likely broadly applicable to the
types of policy decisions facing the advanced economies but unlikely to be broadly applicable to
the types of policy decisions facing the emerging economies.
Income Percentile Percent Change
0-20 6.620-40 7.140-60 6.560-80 4.580-90 2.790-95 0.795-99 -3.499-100 -12.4
Note: Net of tax rate is 100 minus the average tax rate. Change in after-tax income due to changes in average tax rate is the percent change in the net of tax rate. Source: Furman (2016).
Change in After-Tax Income due to Changes in Average Tax Rates by Income Percentile, 1986 to 2013
17
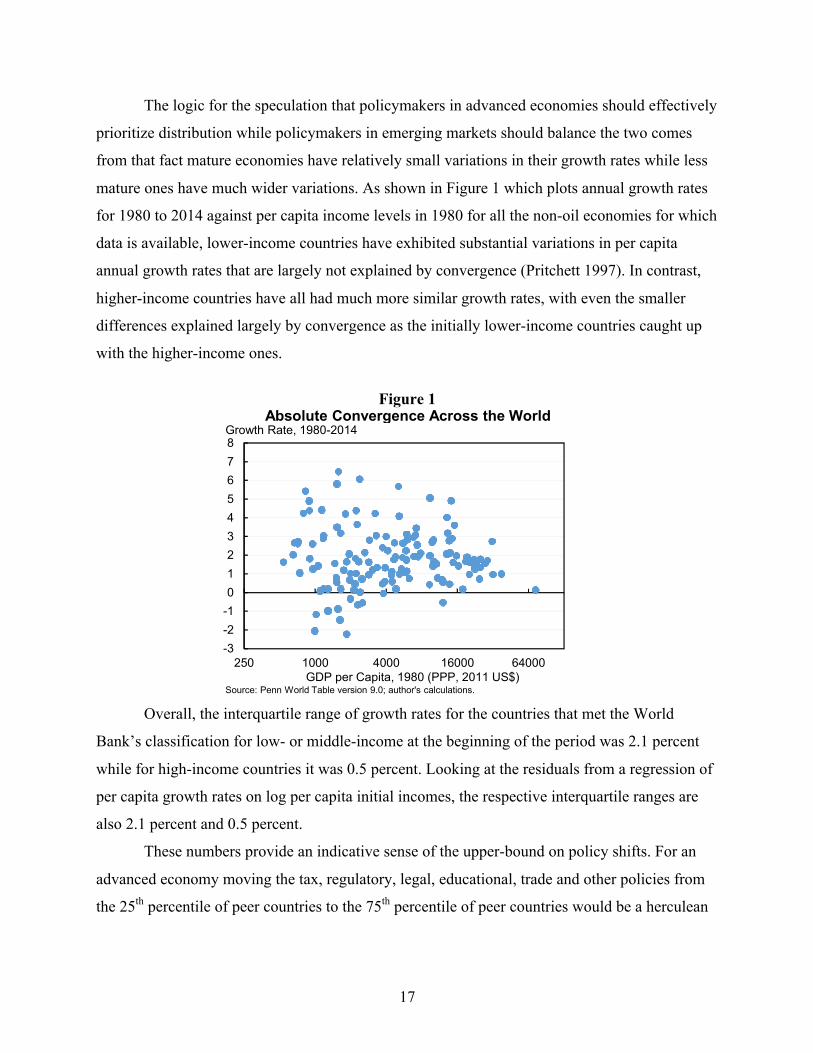
The logic for the speculation that policymakers in advanced economies should effectively
prioritize distribution while policymakers in emerging markets should balance the two comes
from that fact mature economies have relatively small variations in their growth rates while less
mature ones have much wider variations. As shown in Figure 1 which plots annual growth rates
for 1980 to 2014 against per capita income levels in 1980 for all the non-oil economies for which
data is available, lower-income countries have exhibited substantial variations in per capita
annual growth rates that are largely not explained by convergence (Pritchett 1997). In contrast,
higher-income countries have all had much more similar growth rates, with even the smaller
differences explained largely by convergence as the initially lower-income countries caught up
with the higher-income ones.
Figure 1
Overall, the interquartile range of growth rates for the countries that met the World
Bank’s classification for low- or middle-income at the beginning of the period was 2.1 percent
while for high-income countries it was 0.5 percent. Looking at the residuals from a regression of
per capita growth rates on log per capita initial incomes, the respective interquartile ranges are
also 2.1 percent and 0.5 percent.
These numbers provide an indicative sense of the upper-bound on policy shifts. For an
advanced economy moving the tax, regulatory, legal, educational, trade and other policies from
the 25th percentile of peer countries to the 75th percentile of peer countries would be a herculean
-3-2-1012345678
250 1000 4000 16000 64000
Absolute Convergence Across the WorldGrowth Rate, 1980-2014
GDP per Capita, 1980 (PPP, 2011 US$)Source: Penn World Table version 9.0; author's calculations.

18
effort. And the fact that the growth rates between these percentiles vary by a few tenths annually
suggests the difficulty of achieving much larger growth effects from such a policy.
This exercise does not establish bounds on the impact of policies. On the one hand, these
ranges could overstate the plausible impact of policy changes if luck or endowments had a
substantial impact on growth rates. On the other hand, if countries have offsetting collections of
good and bad policies then just shifting all policies in a good direction could have a larger impact
on growth than is found in actual sample of countries. Nevertheless, it appears consistent with a
much wider scope for policies to impact growth rates in developing countries than in advanced
economies.
Overall, the fact that the United States and France have nearly identical levels of
productivity despite the fact that France fares considerably worse on most measures of regulation
is just a vivid example of the fact that for mature economies with mature institutions the
difference in growth rates that results from different policies is considerably lower than one
might suspect. This is true both based on bottom-up estimates of the growth impacts of
individual policies and the top-down analysis presented here of the difference in growth rates
across the advanced economies.
Conclusion
The question of whether inequality is good or bad for growth is an interesting and
important one that deserves time and attention from social scientists, although I am skeptical it
will ever lend itself to a clear answer because the many different sources of inequality may have
many different impacts on growth.
The interests of policymakers are different from the interests of social scientists.
Policymakers are concerned not with inequality per se—which they cannot choose—but with
policies that affect inequality. And they are, or at least profess to be, not concerned with growth
but with how the policies they pursue affect their population, understood variously as the median
income, the bottom quintile, the average income for the bottom 90 percent, or the many other
metrics that draw on information from across the distribution.

19
Policies exist in all quadrants of the two-by-two matrix: good for both growth and
distribution, good for one but not the other, or bad for both. Two of those quadrants are
straightforward—policymakers should be working to identify all-good-things-go-together
policies and avoid the opposite. In the case of tradeoffs, the answer is less obvious but as an
empirical matter it is plausible that a number of policies in advanced economies have first order
distributional impacts but only second order effects on growth—suggesting that policymakers
focused on just about anything except for mean incomes would be better off evaluating their
merits solely only the basis of the static impact on distribution.
It is plausible that a flat tax, for example, might have boosted U.S. growth—but by only a
tenth or two annually which would not be enough to materially change the results from just
looking at the direct effect of the tax change on incomes. In contrast, just about anyone would
take China’s deal of higher growth rates plus higher inequality—including the more than 800
million people lifted out of extreme poverty in China since 1980.
Going forward, as we continue to rethink macroeconomics, better incorporating welfare
and distributional considerations into models and understanding how they relate to specific
policy instruments. The fact that we cannot agree on the appropriate social welfare function is
not an argument for choosing one particular social welfare function—the average of incomes—
that is inconsistent with the way most policymakers describe their ultimate goals.

20
References
Acemoglu, Daron, Simon Johnson, and James A. Robinson. 2001. “The Colonial Origins of Comparative Development: An Empirical Investigation.” American Economic Review 91(5): 1369-1401. Altig, David, Alan J. Auerbach, Laurence J. Kotlikoff, Kent A. Smetters, and Jan Walliser. 2001. “Simulating Fundamental Tax Reform in the United States.” American Economic Review 91 (3): 574-595. Aghion, et al. 2005. “Competition and Innovation: An Inverted-U Relationship.” Quarterly Journal of Economics 120(2): 701-728. Alesina, Alberto, and Roberto Perotti. 1996. “Income Distribution, Political Instability, and Investment.” European Economic Review 40(6): 1203-1228. Alesina, Alberto, and Dani Rodrik. 1994. “Distributive Politics and Economic Growth.” Quarterly Journal of Economics 109(2): 465-490. Atkinson, Anthony B. 1970. “On the Measurement of Inequality.” Journal of Economic Theory 2(3): 244-263. Autor, David, et al. 2017. “The Fall of the Labor Share and the Rise of Superstar Firms.” NBER Working Paper No. 23396. Cambridge, MA: National Bureau of Economic Research. Barkai, Simcha. 2016. “Declining Labor and Capital Shares.” Unpublished manuscript, University of Chicago. Barro, Robert J. 2000. “Inequality and Growth in a Panel of Countries.” Journal of Economic Growth 5(1): 5-32. Bell, Alex, et al. 2016. “The Lifecycle of Inventors.” Working Paper. Boarini, Romina, Fabrice Murtin, Paul Schreyer, and Marc Fleurbaey. 2016. “Multi-dimensional Living Standards: A Welfare Measure Based on Preferences.” OECD Statistics Working Papers, 2016/05. Paris: OECD Publishing. Boushey, Heather, and Carter C. Price. 2014. “How Are Economic Inequality and Growth Connected? A Review of Recent Research.” Washington: Washington Center for Equitable Growth. Report. Bowles, Samuel. 2012. The New Economics of Inequality and Redistribution. Cambridge: Cambridge University Press. Castelló-Climent, Amparo. 2010. “Inequality and Growth in Advanced Economies: An Empirical Investigation.” Journal of Economic Inequality 8(3): 293-321.
21
Cingano, Frederico. 2014. “Trends in Income Inequality and Its Impact on Economic Growth.” OECD Social, Employment and Migration Working Papers, No. 163. Paris: OECD Publishing. Dennis, Robert, et al. 2004. “Macroeconomic Analysis of a 10 Percent Cut in Income Tax Rates.” Congressional Budget Office (CBO) Technical Paper Series, 2004-07. Council of Economic Advisers (CEA). 2014. “The Economics of Early Childhood Investments.” Report. ______. 2016. “The Economic Record of the Obama Administration: Progress Reducing Inequality.” Report. Deininger, Klaus, and Lyn Squire. 1998. “New Ways of Looking at Old Issues: Inequality and Growth.” Journal of Development Economics 57(2): 259-287. Dollar, David, and Aart Kraay. 2002. “Growth is Good for the Poor.” Journal of Economic Growth 7(3): 195-225. Forbes, Kristin J. 2000. “A Reassessment of the Relationship between Inequality and Growth.” American Economic Review 90(4): 869-887. Furman, Jason. 2016 “Dynamic Analysis, Welfare, and Implications for Tax Reform.” Remarks at the National Bureau of Economic Research Tax Policy and the Economy Conference. Washington. September 22. Furman, Jason, and Peter Orszag. 2015. “A Firm-Level Perspective on the Role of Rents in the Rise in Inequality.” Paper prepared for “A Just Society” Centennial Event in Honor of Joseph Stiglitz. New York, NY. October 16. Gandelman, Néstor, and Rubén Hernández-Murillo. 2015. “Risk Aversion at the Country Level.” Federal Reserve Bank of St. Louis Review 97(1): 53-66. Gilbert, Robert. “Looking for Mr. Schumpeter: Where Are We in the Competition-Innovation Debate.” Innovation Policy and the Economy 6: 159-215. Gornick, Janet, et al. 2016. “LIS / New York Times Income Distribution Database (2016).” April. Gravelle, Jane G. 2014. “Dynamic Scoring for Tax Legislation: A Review of Models.” Congressional Research Service. Gutiérrez, Germán, and Thomas Philippon. 2017. “Declining Competition and Investment in the U.S.” NBER Working Paper No. 23583. Cambridge, MA: National Bureau of Economic Research.
22
Halter, Daniel, Manuel Oechslin, and Josef Zweimüller. 2014. “Inequality and Growth: The Neglected Time Dimension.” Journal of Economic Growth 19(1): 81-104. Kaldor, Nicholas. 1955. “Alternative Theories of Distribution.” The Review of Economic Studies 23(2): 83-100. Keefer, Philip, and Stephen Knack. 2002. “Polarization, Politics and Property Rights: Links between Inequality and Growth.” Public Choice 111(1): 127-154. Knowles, Stephen. 2005. “Inequality and Economic Growth: The Empirical Relationship Reconsidered in the Light of Comparable Data.” Journal of Development Studies 41(1): 135-159. Kraay, Aart. 2015. “Weak Instruments in Growth Regressions: Implications for Recent Cross-Country Evidence on Inequality and Growth.” Policy Research Working Paper 7494. Washington: World Bank. Lazear, Edward P., and Sherwin Rosen. 1981. “Rank-Order Tournaments as Optimum Labor Contracts.” Journal of Political Economy 89(5): 841-864. Mankiw, N. Gregory, and Matthew Weinzierl. 2004. “Dynamic Scoring: A Back-of-the-Envelope Guide.” NBER Working Paper No. 11000. Cambridge, MA: National Bureau of Economic Research. ______. 2006. “Dynamic Scoring: A Back-of-the-Envelope Guide.” Journal of Public Economics 90(8): 1415-1433. Mirrlees, James A. 1971. “An Exploration in the Theory of Optimum Income Taxation.” The Review of Economic Studies 38(2): 175-208. Organisation for Economic Co-operation and Development (OECD). 2015. “Chapter 2: The Impact of Income Inequality on Economic Growth.” In In it Together: Why Less Inequality Benefits All. Paris: OECD Publishing. Ostry, Jonathan D, Andrew Berg, and Charalambos G. Tsangarides. 2014. “Redistribution, Inequality, and Growth.” Staff Discussion Note 14/02. Washington, DC: International Monetary Fund. Pritchett, Lant. 1997. “Divergence, Big Time.” The Journal of Economic Perspectives 11(3): 3-17. Rawls, John. 1971. A Theory of Justice. Cambridge, MA: Belknap Press of Harvard University Press. Solt, Frederick. 2016. “The Standardized World Income Inequality Database.” Social Science Quarterly 97(5): 1267-1281. SWIID Version 6.0, July 2017.

23
Stevenson, Betsey, and Justin Wolfers. 2008. “Economic Growth and Subjective Well-Being: Reassessing the Easterlin Paradox.” Brookings Papers on Economic Activity 2008(1): 1-87. ______. 2016. “Inequality and Subjective Well-Being.” Slides. Stiglitz, Joseph E. 1974. “Incentives and Risk Sharing in Sharecropping.” The Review of Economic Studies 41(2): 219-255. U.S. Congress, Joint Committee on Taxation (JCT). 2005. “Macroeconomic Analysis of Various Proposals to Provide $500 Billion in Tax Relief.” Report. ______. 2014. “Macroeconomic Analysis of the ‘Tax Reform Act of 2014’.” Report. U.S. Department of the Treasury, Office of Tax Analysis. 2006a. “A Dynamic Analysis of Permanent Extension of the President’s Tax Relief.” Report. ______. 2006b. “A Summary of the Dynamic Analysis of the Tax Reform Options Prepared for the President’s Advisory Panel on Federal Tax Reform.” Report. Wittenberg, Martin. 2015. “Problems with SWIID: The Case of South Africa.” Journal of Economic Inequality 13(4): 673-677. Zidar, Owen M. 2017. “Tax Cuts for Whom? Heterogeneous Effects of Income Tax Changes on Growth and Employment.” NBER Working Paper No. 21035. Cambridge, MA: National Bureau of Economic Research.
Related Documents