Lease-to-Purchase Housing Finance in Chile: Context, Past Experience, Future Opportunities & Challenges Conference: Expanding Housing Finance to the Lower Income Groups The World Bank, Washington D.C. 17 March, 2006 Presented by: Juan Enrique Montes Gerente General de Securitizadora Security GMAC- RFC S.A.

Conference: Expanding Housing Finance to the Lower Income Groups The World Bank, Washington D.C.
Jan 01, 2016
Lease-to-Purchase Housing Finance in Chile: Context, Past Experience, Future Opportunities & Challenges. Conference: Expanding Housing Finance to the Lower Income Groups The World Bank, Washington D.C. 17 March, 2006 Presented by: Juan Enrique Montes - PowerPoint PPT Presentation
Welcome message from author
This document is posted to help you gain knowledge. Please leave a comment to let me know what you think about it! Share it to your friends and learn new things together.
Transcript

Lease-to-Purchase Housing Finance in Chile: Context, Past Experience, Future Opportunities & Challenges
Conference:
Expanding Housing Finance to the Lower Income Groups
The World Bank, Washington D.C.
17 March, 2006
Presented by:
Juan Enrique Montes
Gerente General de Securitizadora Security GMAC-RFC S.A.

2
Outline of PresentationContext:
Macroeconomic Scenario
Income Distribution and Housing Needs
Housing activity
Lease-to-Purchase Housing Finance: Past Experience and Current Status
Funding Players in Housing Activity
Leasings versus other Financing Vehicles
Historic Evolution
The Role of Government
MBS: Securitization of Leasings and Mutuos Hipotecarios Endosables (EMC)
ABS Track Record
MBS Track Record
Mortgage Prepayment Impact on MBS
Securitizatio of Lease-to-Purchase Housing Contracts: Future Opportunities and Challenges
Needs, Opportunities & Challenges
Expected Future Outcomes

3
Macroeconomic Scenario: GDP Dynamism
GDP (Growth Rate,%)
6,4%
4,4%
-0,02
0,01
0,04
0,07
0,10
0,13
19
90
19
91
19
92
19
93
19
94
19
95
19
96
19
97
19
98
19
99
20
00
20
01
20
02
20
03
20
04
20
05
GDP Average
4
Macroeconomic Scenario: Spread Comparison
Local Curency: A+
Foreing Currency: A
Local Curency: AA
Foreing Currency: A
Local Curency: A+
Foreing Currency: BBB+
Moody's
Fitch :National Rating
S&P Rating / Long Term

5
Macroeconomic Scenario: Unemployment Rate
Unemployment (%)
8,8
7,3
5,5
6,0
6,5
7,0
7,5
8,0
8,5
9,0
9,5
10,0
19
89
19
91
19
93
19
95
19
97
19
99
20
01
20
03
20
05
Unemployment % Average
6
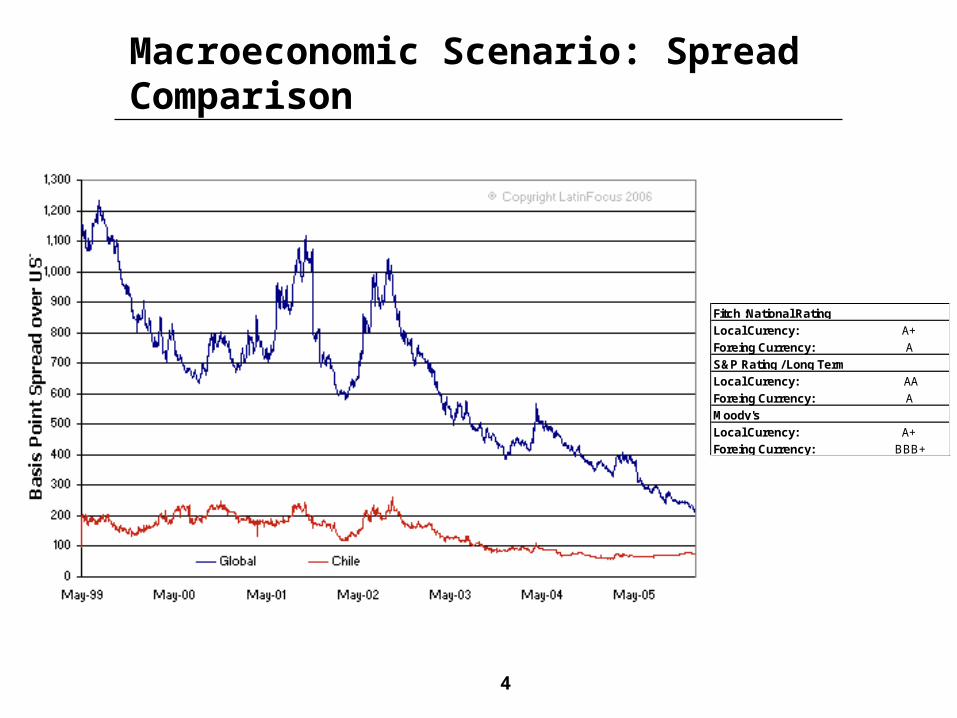
Income Distribution & Housing Needs
CountryTop/Low
20% Ratio
Japan 3,4Germany 4,7Spain 5,4France 5,6India 5,7China 7,9USA 8,9Uruguay 8,9Peru 11,6Russia 12,2Costa Rica 13,0Chile 15,5Mexico 16,2Colombia 20,3Brazil 25,5
Income Distribution

7
Income Distribution & Housing Needs
20% 1990 1994 1996 1998 2000 2003I 4,1 4 3,9 3,7 3,8 3,9II 8,1 8,1 8 8 8,1 8,4III 12,3 11,9 11,7 11,7 12,2 12,1IV 18,1 18,7 19,3 19,3 18,5 19V 57,4 57,3 57,1 57,3 57,5 56,5V/ I 14 14,3 14,6 15,5 15,3 14,3
Home Income Distribution Evolution

8
Income Distribution & Housing Needs
Income Decil Total (%)1 22,42 17,13 16,34 13,2
Subtotal (40% poorest people) 69,0
5 9,16 7,27 6,68 4,19 3
10 1,1
Total 100,0
Housing Deficit Distribution

9
Housing Activity: Sales v/s Housing Deficit
As of 2002, Housing Deficit reaches 543,000 houses or 14% of Total Housing stock
Housing Deficit is explained by 2 basic factors:
387,000 difference between number of Families v/s Number of Houses
155,000 of houses in poor structural conditions
House building pattern (120,000 new houses per year) would take 4,5 years to meet Housing Deficit Needs
However, population growth (1.3%) plus social-economic changes has meant a 2.3% housing need growth
In addition to that, house deterioration also boost housing needs
Considering just home 2.3% growth and 4% house building growth, Chilean housing deficit would disappear in 12 years
This housing deficit is focused in the lowest socio-economic spectrum, thus representing a long-term demand for leasing

10
Housing Activity: Sales v/s Housing Deficit
In 2005, house sales reached US$ 3.2 billion in Santiago. (This data does not include houses provided by the government to poor people)
These sales only represents houses valued at US$ 17,500 (or more)
Leasings typically funds US$ 17,500 to US$ 52,500 houses
33% of total sales (in number) are concentrated in the Leasing niche but, in terms of amounts, sales in this niche represent 13% of the total volume
Thus, this segment reached US$ 420 million sales in 2005
Giving that Santiago represents 40% of Chile housing activity, we may estimate Leasing Market Volume at US$ 1 billion per year
Economic growth (through employment & wages increases) plus Income Distribution improvements may boost this market volume
11
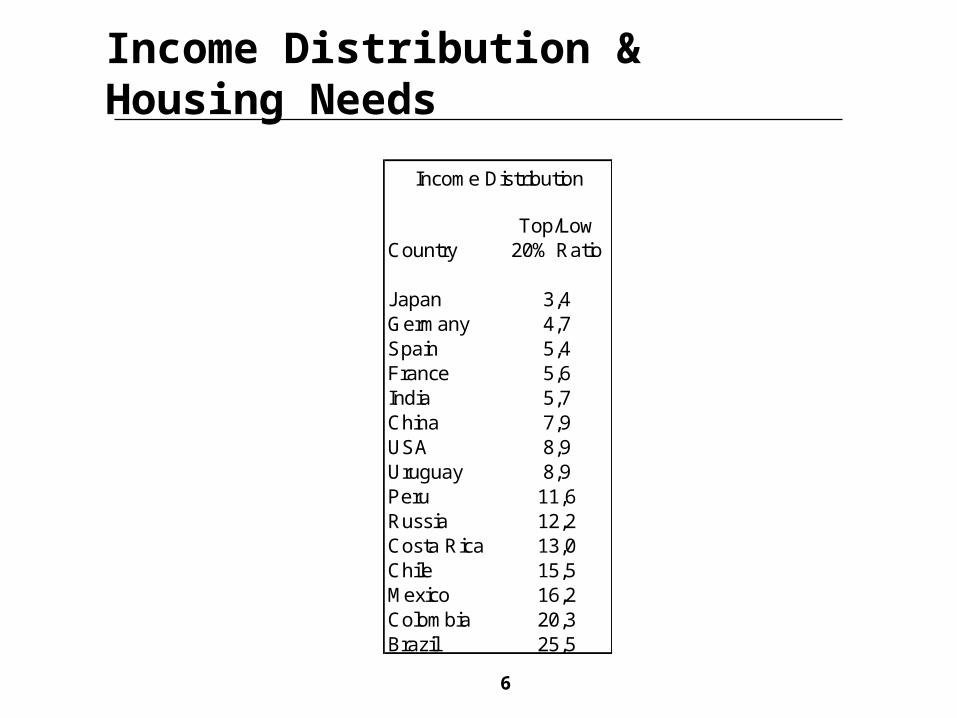
Housing Activity: Public v/s Private Sector Roles
Government Activity:
Has focused on supporting poor people
Has basically used a demand-side approach
Has replaced loan by subsidies to poor people
US$ 8,700 houses are simple provided (free) to very poor people
Houses of higher values may be purchased by using subsidies

12
Leasings : Funding Players in Housing Activity
Real Estate Developers and Constructing companies
Bank Loans
Demand Side Funding:
Government Funding Mechanisms and Banco del Estado (average mortgage of Banco Estado: US$ 9,000).
Commercial Banks Loans (average mortgage: US$ 56,600)
“Mutuos Hipotecarios Endosables” (EMC)
Leasing Habitacional (Lease-to-Purchase Housing Vehicle)

13
Leasings : Pros/Cons v/s Alternative Vehicles
Advantages
No tax applicable (Alternatives: 1,6% of Loan Volume)
No down-payment (Alternatives: non less than 25% of house value)
Houses of US$ 35,000 (or less) are eligible for automatic subsidy (Alternatives: Subsidy uses an “application system”)
Collateral is the house (Alternative: Mortgage over the house)
Legal Framework allows quick “arbitral” legal process (Alternative: Longer legal process)
No tax for investors if house is a “DFL-2” (Alternative: pays 17% corp. tax or personal tax, DFL2 is an “economic house of 140 or less sq. meters)
Disadvantages
Relatively new vehicle (Alternatives: More than 25 years track record provides experience)
Some uncertainty in case leasings are used as collateral and borrower falls into bankruptcy (Alternatives: Pledge over EMC presents no legal uncertainty)
Must be held by a Securitizadora, Lease Originator or Real Estate Fund, only (Alternatives: EMC are eligible for Life Insurance Companies and Banks)
Consequences
Leasings has focused in medium income segments (US$ 17,500 to US$ 52,500 houses)
Leasings have not been fully exploited in terms of volume and rates

14
PeriodNon-bank
EMCsLeasing
ContractsNon-Bank
TotalBank EMCs
Bank Loans
Letters of Credit
Bank Total TOTAL
1996 199 1 200 146 112 924 1.181 1.3811997 243 10 252 236 128 716 1.081 1.3321998 225 24 246 684 32 168 884 1.1311999 208 35 239 600 224 194 1.018 1.2572000 170 41 206 185 214 479 878 1.0842001 259 58 309 -308 157 539 389 6982002 325 79 394 66 243 305 614 1.0082003 493 97 580 -31 697 783 1.450 2.0292004 582 86 668 -103 3.591 -856 2.631 3.2992005 739 81 820 104 3.305 -251 3.157 3.977
Supply Flow Analysis: Residential Mortgages (Figures in USD Millions)
Leasings: Historic Evolution of Funding Vehicles

15
PeriodNon-bank
EMCsLeasing
ContractsNon-Bank
Total Bank EMCs Bank Loans Letters of Credit Bank Total TOTAL
2002 1.786 229 2.014 1.733 1.524 7.411 10.668 12.6822003 1.688 321 2.009 1.702 2.221 8.194 12.117 14.1272004 1.940 410 2.350 1.599 5.811 7.338 14.748 17.0992005 2.114 491 2.605 1.723 8.763 7.077 17.564 20.169
Stock Analysis: Residential Mortgages
(Figures in USD Millions)
Leasings: Historic Evolution of Funding Vehicles

16
Leasing: Historic Evolution of EMC & Leasings
Loan Volume Average Rate Average Loan Loan Volume Average Rate Average Loan Loan to Value
in Th. US$ in UF in Th. US$ in Th. US$ in UF in Th. US$
1996 199 8,5% 52 1 23 86
1997 243 8,5% 45 10 23 90
1998 225 9,4% 44 24 22 90
1999 208 8,6% 52 35 22 91
2000 170 8,7% 50 41 11,9% 24 92
2001 259 7,8% 58 58 11,3% 25 92
2002 325 7,1% 59 79 10,6% 25 93
2003 493 6,5% 63 97 10,6% 26 93
2004 582 5,9% 74 86 11,5% 22 87
2005 738 5,1% 74 81 10,0% 21 79
Average 344 7,6% 57 51 11,0% 23 89
Non-Bank EMC's Leasings

17
Leasings: The role of government
Demand Side Subsidy (Borrower)
Eligibility: House Values of US$ 8,750 to US$ 35,000
Magnitude: 11% of House Value (From 56% to 9%)
Leasing Case: New (Bond) System v/s Old System
Supply Side Subsidy (Originator)
Eligibility: House Values of US$ 21,000 or less
Magnitude: 2.3% of House Value (“Modest” Houses)
Lender Subsidy (SPV or other credit holder)
Eligibility: House Values of US$ 21,000 or less
Loss Limit capped at US$ 7,000 or 75% of loss volume

18
As of December 2005 in US millions
Total Investment ABS Penetration
Pension Funds 74.755 309 0,4%Life Insurance Co. 23.063 614 2,7%P&C Insurance Co. 576 11 1,9%Banks 16.168 N/A N/AMutual Funds 12.628 167 1,3%Others N/A 701 N/A
Total 127.190 1.802 1,4% *
MBS Track Record: Capital Market Penetration

19
Figures in Millions US$MBS Non MBS Total
Total Bond 1.274 1.625 2.899
Number of Total SPV's 37 32 69
Total
Total Bond 44% 56% 100%
Number of Total SPV's 54% 46% 100%
MBS Non MBS
ABS Track Record: Outstanding Bond Volumes

20
Mortgage Prepayment Impact: Risk-Free Rate Trajectory
PRC 20, BCU 10
2,00
3,00
4,00
5,00
6,00
7,00
8,00
9,00
Ene
-95
Jul-9
5
Ene
-96
Jul-9
6
Ene
-97
Jul-9
7
Ene
-98
Jul-9
8
Ene
-99
Jul-9
9
Ene
-00
Jul-0
0
Ene
-01
Jul-0
1
Ene
-02
Jul-0
2
Ene
-03
Jul-0
3
Ene
-04
Jul-0
4
Ene
-05
Jul-0
5
Ene
-06
Date
Rat
e (%
)

21
Mortgage Prepayment Impact: MBS Shock
Note: 2 of the 11 downgrade-liquidated cases were impacted by asset default performance and prepayment, whereas 9 were impacted by prepayment only
Prepayment Impact Over SPV's bond classification
Quantity% Over Senior Bond Amount
% Leasing participation
(Amount)
% EMC participation
(Amount)
Downgraded 5 16,8% 10,9% 89,1%
Liquidated 6 36,8% 18,1% 81,9%
Remain Identical 26 46,3% 45,1% 54,9%
Total 37 100,0% 29,4% 70,6%

22
Mortgage Prepayment Impact: Long-Term Consequences
No (or negligible) negative equity on Senior Bonds
Originators not able to continue making short-run profits
Rating Risk Agencies and Securitizadoras improving structures
Regulator increases control
Institutional investors more able to assess different risks
In sum, a deep change on MBS industrial organization

23
Securitization of Leasings: Opportunities & Challenges
Social and Private Needs:
Housing deficit reduction
Leasing penetration & rates reduction
Higher MBS penetration: Improve volumes, liquidity and risk features
Challenges :
Government: Improve Leasing legal framework, Simplify ABS issuance rules
Rating Risk Agencies: Anticipate potential portfolio changes
Originators: Adaptation to new business environment and improve U/W criteria
Securitizadoras: Boost MBS penetration
Opportunities:
Originators: Focus on originating activities
Banks: Provide long-term funding to warehouse and/or credit enhancement
Securitizadoras: Launch a new business model

24
Securitizations of Leasings: Opportunities & Challenges
Expected Future Outcomes
Housing deficit reduction
Individuals with more funding opportunities
Long term bankers with more loan exposure
Private credit enhancement replaces Government subsidies
Capital Market (MBS) development
Securitizadora and Originators more focused on their core competencies
Related Documents