2013年4月29日 Conference Call and Webcast First Quarter 2013

Welcome message from author
This document is posted to help you gain knowledge. Please leave a comment to let me know what you think about it! Share it to your friends and learn new things together.
Transcript

2013年4月29日
Conference Call and Webcast First Quarter 2013

2
Presenters
• Director Investor Relations Stacey Witten
• President & Chief Executive Officer Avi Reichental
• Senior Vice President & Chief Financial Officer Damon Gregoire
• Vice President & General Counsel Andrew Johnson
2

3
Welcome Webcast Viewers
To listen to the conference via phone and to ask
questions during our Q&A session, please dial:
• 1-866-318-8616 in the United States
• 1-617-399-5135 from outside the United States
• Participant Code: 19084856
3

4
Forward Looking Statements
4
4
This presentation contains forward-looking statements, as defined by federal and state securities laws. Forward-looking statements include statements concerning plans, objectives, goals, strategies, expectations, intentions, projections, developments, future events, performance or products, underlying assumptions, and other statements which are other than statements of historical facts. In some cases, you can identify forward-looking statements by terminology such as ''may,'' ''will,'' ''should,'' “hope,'' "expects,'' ''intends,'' ''plans,'' ''anticipates,'' "contemplates," ''believes,'' ''estimates,'' ''predicts,'' ''projects,'' ''potential,'' ''continue,'' and other similar terminology or the negative of these terms. From time to time, we may publish or otherwise make available forward-looking statements of this nature. All such forward-looking statements, whether written or oral, and whether made by us or on our behalf, are expressly qualified by the cautionary statements described on this message including those set forth below. In addition, we undertake no obligation to update or revise any forward-looking statements to reflect events, circumstances, or new information after the date of the information or to reflect the occurrence or likelihood of unanticipated events, and we disclaim any such obligation.
Forward-looking statements are only predictions that relate to future events or our future performance and are subject to known and unknown risks, uncertainties, assumptions, and other factors, many of which are beyond our control, that may cause actual results, outcomes, levels of activity, performance, developments, or achievements to be materially different from any future results, outcomes, levels of activity, performance, developments, or achievements expressed, anticipated, or implied by these forward-looking statements. As a result, we cannot guarantee future results, outcomes, levels of activity, performance, developments, or achievements, and there can be no assurance that our expectations, intentions, anticipations, beliefs, or projections will result or be achieved or accomplished. These forward-looking statements are made as of the date hereof and are based on current expectations, estimates, forecasts and projections as well as the beliefs and assumptions of management. 3D System’s actual results could differ materially from those stated or implied in forward-looking statements. Past performance is not necessarily indicative of future results. We do not intend to update these forward looking statements even though our situation may change in the future. Further, we encourage you to review the risks that we face and other information about us in our filings with the SEC, including our Annual Report on Form 10-K which was filed on February 25, 2013. These are available at www.SEC.gov.

2013年4月29日
Operating Results Avi Reichental, President & CEO

6
Q1 2013 Highlights
Revenue grew 31%, to a record $102.1 million on a 61% increase in printers & other products revenue and 22.1% overall organic growth
Gross profit increased 38% on higher revenue and GPM expanded 250 basis points to 52.4%
We introduced significant new products including several personal and professional 3D printers and powerful designer software packages
We acquired Geomagic, a provider of design, sculpt and scan software tools further enhancing our 3D authoring platform growth initiative
6

7
Record Quarterly Revenue
Printers & Other Products
Print Materials
Services
Healthcare
First Quarter
2013
2012
2013
2012
2013
2012
2013
2012
61%
18%
16%
18%
$ in millions
$ 24.7
$ 39.7
$ 24.7
$ 28.7
$ 28.5
$ 33.6
$ 12.0
$ 14.1
7
31.0% total revenue growth 22.1% organic revenue growth
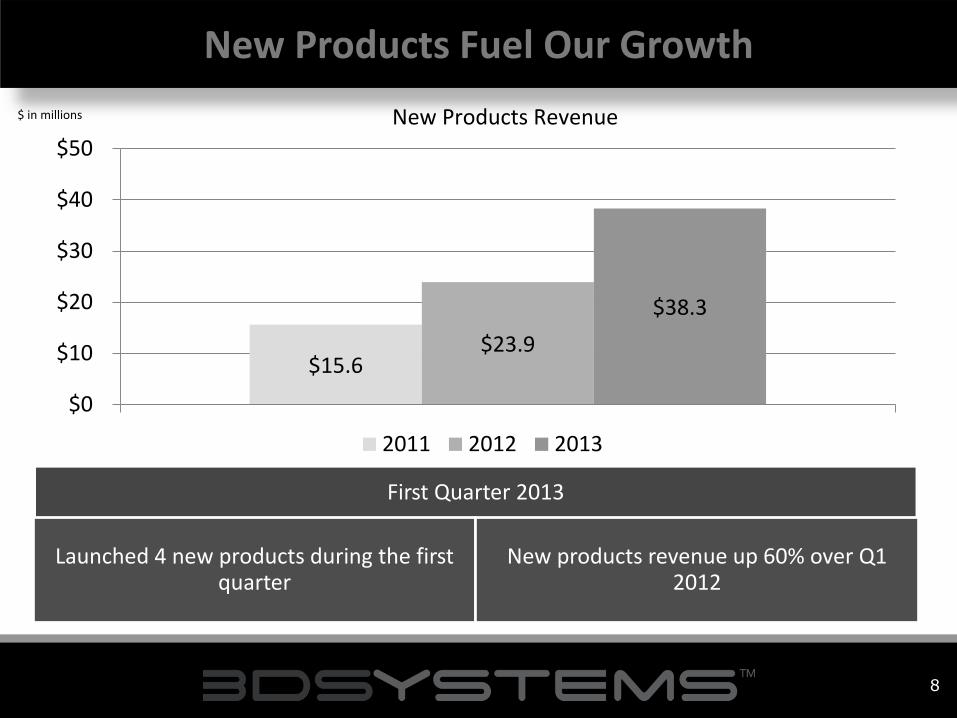
8
New Products Fuel Our Growth
First Quarter 2013
Launched 4 new products during the first quarter
New products revenue up 60% over Q1 2012
$15.6 $23.9
$38.3
$0
$10
$20
$30
$40
$50
New Products Revenue
2011 2012 2013
$ in millions
8

2013年4月29日
Financial Review Damon Gregoire, Senior Vice President and CFO

10
First Quarter Operating Results
2012 2013 Non-GAAP % Change Favorable/
(Unfavorable) Drivers GAAP Non-GAAP GAAP Non-GAAP
Revenue $ 77.9 $ 77.9 $ 102.1 $ 102.1 31.0%
Gross Profit $ 38.9 $ 39.0 $ 53.5 $ 53.5 37.6%
% of Revenue 49.9% 49.9% 52.4% 52.4%
Operating Expenses $ 28.9 $ 21.9 $ 36.0 $ 27.8 (26.6%)
% of Revenue 37.1% 28.2% 35.2% 27.2%
Operating Income $ 10.0 $ 17.0 $ 17.5 $ 25.8 59.1%
% of Revenue 12.8% 21.7% 17.2% 25.2%
Net Income $ 6.2 $ 13.2 $ 5.9 $ 18.9 43.0%
% of Revenue 7.9% 16.9% 5.8% 18.5%
Diluted Earnings Per Share $ 0.08 $ 0.17 $ 0.06 $ 0.21 23.5%
$ in millions, except earnings per share
10

11
Non-GAAP Reconciliation
Q1 2012 Q1 2013
GAAP Adjustment Non-GAAP GAAP Adjustment Non-GAAP
Revenue $ 77.9 - $ 77.9 $ 102.1 - $102.1
Cost of sales Gross Profit Operating expenses Income from Operations Interest & other expense, net Provision for income taxes
$ 39.1 $ 38.9 $ 28.9 $ 10.0 $ 2.7 $ 1.1
($ 0.1) $ 0.1
($ 6.9) $ 6.9
($ 1.0) $ 1.0
$ 39.0 $ 38.9 $ 21.9 $ 17.0 $ 1.7 $ 2.1
$ 48.6 $ 53.5 $ 36.0 $ 17.5 $ 10.1 $ 1.6
($ 0.1) $ 0.1
($ 8.2) $ 8.2
($ 8.2) $ 3.4
$ 48.5 $ 53.5 $ 27.8 $ 25.8 $ 1.9 $ 5.0
Net income $ 6.2 $ 7.0 $13.2 $ 5.9 $ 13.0 $ 18.9
Diluted earnings per share $ 0.08 $ 0.17 $ 0.06 $ 0.21
11
($ in millions, except per share amounts)
We use non-GAAP financial measures of adjusted net income and adjusted earnings per share to supplement our unaudited condensed consolidated financial statements presented on a GAAP basis to facilitate a better understanding of the impact that several strategic acquisitions had on our financial results.
Q1 2013 non-GAAP adjustments include: • $3.2 million amortization expense in SG&A and cost of sales • $2.2 million non-cash compensation and $1.6 million acquisition expenses in SG&A • $8.2 million non-cash interest, loss on conversions of convertible notes and loss on litigation settlement in
interest and other expense, net
-columns and rows may not foot due to rounding

12
0
20
40
60
80
100
120
31%
39%
32%
28%
37%
33% $ 77.9
$ 102.1
Services
Materials
Printers & Other
Products
Q1 2013 recurring revenue accounted for 61% of total revenue
$ in millions
2012 2013
0
20
40
60
80
100
120
59% 56%
27%
28% 14%
16% $ 77.9
$ 102.1
Europe
North America
Asia-Pacific
Category
Revenue by Category & Geography
12
Geography
2012 2013
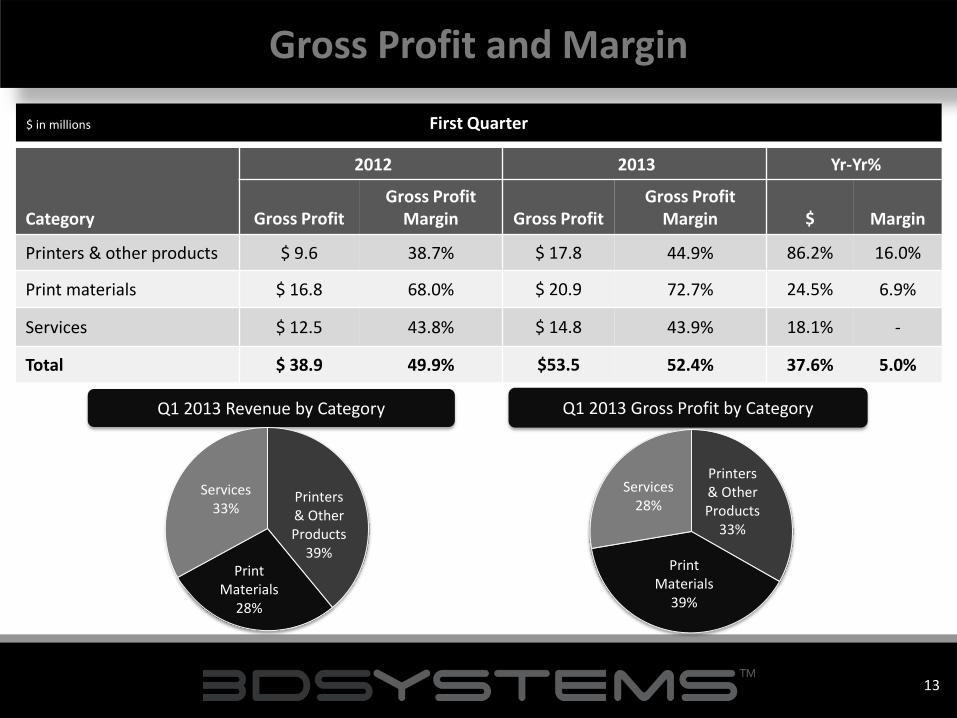
13
Gross Profit and Margin
13
First Quarter
Category
2012 2013 Yr-Yr%
Gross Profit Gross Profit
Margin Gross Profit Gross Profit
Margin $ Margin
Printers & other products $ 9.6 38.7% $ 17.8 44.9% 86.2% 16.0%
Print materials $ 16.8 68.0% $ 20.9 72.7% 24.5% 6.9%
Services $ 12.5 43.8% $ 14.8 43.9% 18.1% -
Total $ 38.9 49.9% $53.5 52.4% 37.6% 5.0%
$ in millions
Q1 2013 Revenue by Category Q1 2013 Gross Profit by Category
Printers & Other Products
39% Print
Materials 28%
Services 33%
Printers & Other Products
33%
Print Materials
39%
Services 28%

14
Operating Expenses
14
First Quarter
GAAP Non-GAAP
Category 2012 2013
% Change Favorable/
(Unfavorable) 2012 2013
% Change Favorable/
(Unfavorable)
SG&A $ 24.0 $ 29.5 (23.0%) $ 17.0 $ 21.3 (25.1%)
R&D $ 4.9 $ 6.5 (31.8%) $ 4.9 $ 6.5 (31.9%)
Total Operating Expenses $ 28.9 $ 36.0 (24.5%) $ 21.9 $ 27.8 (26.6%)
% of Revenue 37.1% 35.2% 28.2% 27.2%
-Columns may not foot due to rounding
$ in millions

15
Working Capital
December 2012 March 2013 % Change
Favorable/(Unfavorable)
Cash $ 155.9 $ 110.5 (29.1%)
Inventory $ 41.8 $ 44.0 (5.3%)
Accounts Receivable $ 79.9 $ 89.6 12.1%
Accounts Payable $ 32.1 $ 29.8 7.2%
Working Capital $ 212.3 $ 174.2 (18.0%)
($ in millions)
• Cash on hand at end of March 2013 compared to the end of 2012 decreased $45.3 million after paying $52.9 million for acquisitions and generating $10.7 million from operations
15
2013年4月29日
Outlook and Progress Avi Reichental, President and CEO

17
Strategic Growth Initiatives Update
In support of our rapidly growing 3D printer business, we launched eight new ProJet® 3510 professional 3D printers
We also launched our new full-color ProJet® x60 series of professional 3D printers and new VisiJet® PXL materials built on the proven ZPrinter® platform and our exclusive ColorJet Printing (CJP) technology
In support of our consumer initiative, we launched the second generation Cube® and the new CubeX™ 3D printer, winning a KAPi award and Best of CES in emerging tech
In support of our 3D authoring solutions growth initiative, we launched new Geomagic Design software utilizing our combined Alibre® and Geomagic® platform and commercialized three new Geomagic® Designer packages for creation of freeform and mechanical 3D designs perfectly tuned for instant 3D printing
17

18
Outlook
We entered the second quarter of 2013 with positive sales momentum, driven by increased demand primarily from advanced manufacturing activities and continued robust R&D and manufacturing spending
We are pleased with our consumer solutions progress and expect consumer products revenue to reach meaningful levels in the second half of 2013
We expect ongoing portfolio diversification, expanded channels and focused growth initiatives to deliver continued success
We expect to continue to launch exciting new products spanning our entire portfolio that we believe will make 2013 our best ever new products year
18

19
Q&A Session
Out of respect for other conference call participants, please ask one question and then return to the queue to ask additional
questions
Please direct all questions through the teleconference portion of this call
• U.S.: 1-866-318-8616
• International: 1-617-399-5135
• Conference ID: 19084856
To ask questions:
19

2013年4月29日 www.3dsystems.com NYSE: DDD
Thank You
Related Documents


