University of Nebraska - Lincoln University of Nebraska - Lincoln DigitalCommons@University of Nebraska - Lincoln DigitalCommons@University of Nebraska - Lincoln Theses, Dissertations, & Student Research in Computer Electronics & Engineering Electrical & Computer Engineering, Department of 12-2012 CONDUCTIVE CONCRETE FOR ELECTROMAGNETIC SHIELDING – CONDUCTIVE CONCRETE FOR ELECTROMAGNETIC SHIELDING – METHODS FOR DEVELOPMENT AND EVALUATION METHODS FOR DEVELOPMENT AND EVALUATION Aaron P. Krause University of Nebraska-Lincoln, [email protected] Follow this and additional works at: https://digitalcommons.unl.edu/ceendiss Part of the Civil Engineering Commons, Electrical and Electronics Commons, Electromagnetics and Photonics Commons, Power and Energy Commons, and the Systems and Communications Commons Krause, Aaron P., "CONDUCTIVE CONCRETE FOR ELECTROMAGNETIC SHIELDING – METHODS FOR DEVELOPMENT AND EVALUATION" (2012). Theses, Dissertations, & Student Research in Computer Electronics & Engineering. 18. https://digitalcommons.unl.edu/ceendiss/18 This Article is brought to you for free and open access by the Electrical & Computer Engineering, Department of at DigitalCommons@University of Nebraska - Lincoln. It has been accepted for inclusion in Theses, Dissertations, & Student Research in Computer Electronics & Engineering by an authorized administrator of DigitalCommons@University of Nebraska - Lincoln.

Welcome message from author
This document is posted to help you gain knowledge. Please leave a comment to let me know what you think about it! Share it to your friends and learn new things together.
Transcript
University of Nebraska - Lincoln University of Nebraska - Lincoln
DigitalCommons@University of Nebraska - Lincoln DigitalCommons@University of Nebraska - Lincoln
Theses, Dissertations, & Student Research in Computer Electronics & Engineering
Electrical & Computer Engineering, Department of
12-2012
CONDUCTIVE CONCRETE FOR ELECTROMAGNETIC SHIELDING – CONDUCTIVE CONCRETE FOR ELECTROMAGNETIC SHIELDING –
METHODS FOR DEVELOPMENT AND EVALUATION METHODS FOR DEVELOPMENT AND EVALUATION
Aaron P. Krause University of Nebraska-Lincoln, [email protected]
Follow this and additional works at: https://digitalcommons.unl.edu/ceendiss
Part of the Civil Engineering Commons, Electrical and Electronics Commons, Electromagnetics and
Photonics Commons, Power and Energy Commons, and the Systems and Communications Commons
Krause, Aaron P., "CONDUCTIVE CONCRETE FOR ELECTROMAGNETIC SHIELDING – METHODS FOR DEVELOPMENT AND EVALUATION" (2012). Theses, Dissertations, & Student Research in Computer Electronics & Engineering. 18. https://digitalcommons.unl.edu/ceendiss/18
This Article is brought to you for free and open access by the Electrical & Computer Engineering, Department of at DigitalCommons@University of Nebraska - Lincoln. It has been accepted for inclusion in Theses, Dissertations, & Student Research in Computer Electronics & Engineering by an authorized administrator of DigitalCommons@University of Nebraska - Lincoln.
CONDUCTIVE CONCRETE FOR ELECTROMAGNETIC SHIELDING –
METHODS FOR DEVELOPMENT AND EVALUATION
by
Aaron P. Krause
A THESIS
Presented to the Faculty of
The Graduate College at the University of Nebraska
In Partial Fulfillment of Requirements
For the Degree of Master of Science
Major: Telecommunications Engineering
Under the Supervision of Professor Lim Nguyen
Lincoln, Nebraska
December 2012
CONDUCTIVE CONCRETE FOR ELECTROMAGNETIC SHIELDING –
METHODS FOR DEVELOPMENT AND EVALUATION
Aaron P. Krause, M.S.
University of Nebraska, 2012
Adviser: Lim Nguyen
This research investigates the development and evaluation innovative methods for the
use of conductive concrete as an electromagnetic shield. New testing methods are
developed to determine the best conductive components to use in the design of a concrete
mixture for shielding that shows the best promise. The conductive concrete mixture has
the potential to provide electromagnetic shielding that is cost-effective in terms of
construction, operation, and maintenance compared to conventional approaches. Two
testing methods, Small Sample Testing and Large Slab Testing, are developed based on
standardized testing methods that have been modified for the testing of conductive
concrete mixtures. As a result of these innovative testing methods, a promising
conductive concrete design has been chosen and the testing methods validated.
iii
Acknowledgments
There are many people who deserve a great amount of thanks for their support through
the pursuit of my Master’s Degree and none more than Professor Lim Nguyen. Without
his involvement and encouragement I would have never become involved in this project
or come to appreciate the importance or realize my interest in electromagnetics. Through
my college education he has guided me to learn and understand many things and
constantly challenged me to better myself along the way.
My appreciation also extends to the whole of the Computer and Electronics Engineering
faculty, specifically Professor Bing Chen for providing me the opportunity to pursue my
graduate degree and Professor Yaoqing Yang for serving on my review committee and
being a driving force of my interest in electromagnetics as well. Thanks also to Professor
Christopher Tuan of the Civil Engineering department for serving on my review
committee, as well as Kelvin Lein and Jeff Svatora for providing me with the many
concrete samples tested in this project.
Most importantly, a great amount of thanks and adoration belongs with my family.
Without their encouragement, love, and support I would not be where I am today, and
could never have accomplished all that I have.
iv
TABLE OF CONTENTS
1 CHAPTER 1 - INTRODUCTION 1
1.1 Purpose 1
1.2 Literature Review 2
1.3 Methods 7
2 CHAPTER 2 - SHIELDING EFFECTIVENESS THEORY 9
2.1 Introduction 9
2.2 Reflection 11
2.3 Absorption 14
2.4 Summary 15
3 CHAPTER 3 - TESTING 16
3.1 Introduction 16
3.2 Small Sample Testing 16
3.2.1 Test Fixture 19
3.2.2 Sample Sets 22
3.2.3 Sample Preparation and Sealing 23
3.3 Large Slab Testing 25
3.3.1 Test Setup 31
3.3.2 Sample Slabs 34
3.3.3 Issues with Port 38
3.4 Summary 39
4 CHAPTER 4 - RESULTS 41
4.1 Introduction 41
4.2 Small Sample Testing Results 41
4.3 Large Slab Testing Results 47
4.4 Summary 56
5 CHAPTER 5 - CONCLUSIONS 57
6 REFERENCES 59
v
TABLE OF FIGURES
Figure 2-1: MIL-STD-188-125-1 shielding requirements 11
Figure 2-2: Electric field interaction with highly conductive surface 12
Figure 2-3: Magnetic field inducing a current on conductive surface 14
Figure 3-1: EM-2107A test fixture attached to network analyzer 17
Figure 3-2: Example plot of total loss, reflection, and absorption measurements 18
Figure 3-3: Inside structure of EM-2107A 20
Figure 3-4: Test fixture with test sample in place 20
Figure 3-5: Dynamic Range vs. Frequency of EM-2107A 21
Figure 3-6: Example reference (left) and experimental (right) sample loads 22
Figure 3-7: Elastomer gaskets cut to fit test fixture surfaces 24
Figure 3-8: Test fixture with gaskets placed to mate samples 24
Figure 3-9: RF shelter used in Large Slab Testing 27
Figure 3-10: PAMS setup used for detecting RF leaks 27
Figure 3-11: Copper tape used to seal RF leaks in shelter 28
Figure 3-12: Square hole cut in shelter skin with mounting shelves installed and test port 29
Figure 3-13: Concrete slab mounted to outside of shelter 29
Figure 3-14: Switch connections for transmitter system 32
Figure 3-15: Passive loop, left, and log periodic, right, antennas 33
Figure 3-16: Large slab test system 34
Figure 3-17: First slab of steel fibers and carbon powder 35
Figure 3-18: Gaskets on RF shelter test port 36
Figure 3-19: Slab with steel plate 37
Figure 3-20: Slab with steel plate and domed cavity 38
Figure 3-21: Dynamic Range vs. Frequency of 4-inch test port 39
Figure 4-1: S21 vs. frequency of 0.25 in. concrete with no conductive components 43
Figure 4-2: S21 vs. frequency of 0.25 in. concrete with steel fibers and carbon powder 44
Figure 4-3: S21 vs. frequency of 0.5 in. concrete with taconite aggregates 45
Figure 4-4: S21 vs. frequency of 0.25 in. concrete with steel fibers and taconite 46
Figure 4-5: S21 vs. frequency of several thicknesses of small samples 47
Figure 4-6: Relative attenuation vs. frequency of initial conductive concrete 49
Figure 4-7: Relative attenuation vs. frequency of 3 in. conductive concrete slab with domed cavity 51
Figure 4-8: Relative attenuation vs. frequency of 6 in. conductive concrete slab with domed cavity 53
Figure 4-9: Relative attenuation vs. frequency of 12 in. conductive concrete slab with domed cavity 54
Figure 4-10: Relative attenuation vs. frequency of 3 in. conductive concrete slab with painted sides 55
1
1 CHAPTER 1 - Introduction
The subjects of conductive concrete and electromagnetic (EM) shielding, or even, the
use of composite materials such as conductive concrete for EM shielding are not new [1]
[2]. However, advancements in the latter have been few and far between in recent years.
The need for adaptive shielding solutions is more and more important every day in the
ever-changing electromagnetic world we live in. In this regard, evaluation of new
technologies outside the norm of steel panels and fine meshes must be considered in
order to provide alternative construction methods. This research investigates two methods
of testing the shielding properties of conductive concrete mixtures. The first method,
Small Sample Testing, provides a way to judge the effects of mixture components in a
low-cost and timely manner. The second method, Large Slab Testing, gives a strong
sense of the actual shielding effectiveness provided by concrete mixtures that have been
determined to be desirable by Small Sample Testing. The results from these testing
methods have been analyzed and proven their usefulness in evaluating the EM shielding
properties of conductive concrete.
1.1 Purpose
The purpose of this research was to investigate simple and innovative approaches
towards developing an effective conductive concrete mixture for EM shielding
applications. Concrete as a material is often difficult to work with in small construction,
especially with the addition of components such as steel fibers. To this end, it was desired
to develop a method for evaluating the effect of conductive concrete ingredients on the
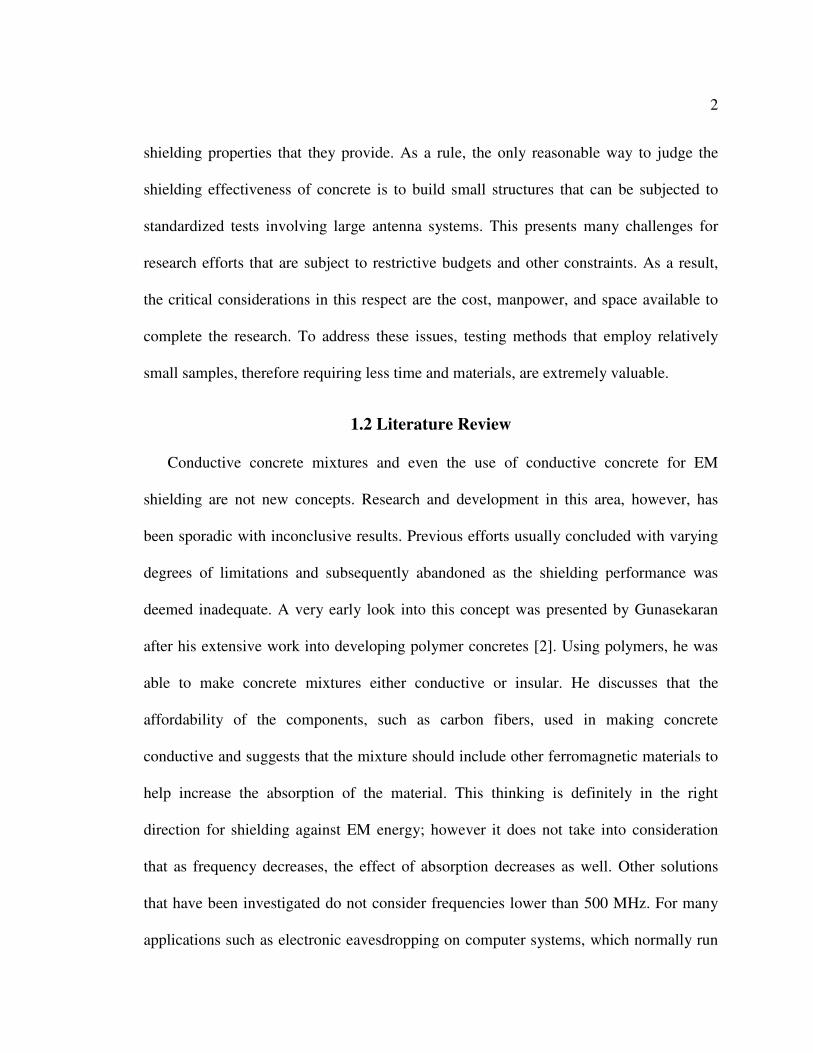
2
shielding properties that they provide. As a rule, the only reasonable way to judge the
shielding effectiveness of concrete is to build small structures that can be subjected to
standardized tests involving large antenna systems. This presents many challenges for
research efforts that are subject to restrictive budgets and other constraints. As a result,
the critical considerations in this respect are the cost, manpower, and space available to
complete the research. To address these issues, testing methods that employ relatively
small samples, therefore requiring less time and materials, are extremely valuable.
1.2 Literature Review
Conductive concrete mixtures and even the use of conductive concrete for EM
shielding are not new concepts. Research and development in this area, however, has
been sporadic with inconclusive results. Previous efforts usually concluded with varying
degrees of limitations and subsequently abandoned as the shielding performance was
deemed inadequate. A very early look into this concept was presented by Gunasekaran
after his extensive work into developing polymer concretes [2]. Using polymers, he was
able to make concrete mixtures either conductive or insular. He discusses that the
affordability of the components, such as carbon fibers, used in making concrete
conductive and suggests that the mixture should include other ferromagnetic materials to
help increase the absorption of the material. This thinking is definitely in the right
direction for shielding against EM energy; however it does not take into consideration
that as frequency decreases, the effect of absorption decreases as well. Other solutions
that have been investigated do not consider frequencies lower than 500 MHz. For many
applications such as electronic eavesdropping on computer systems, which normally run
3
in the gigahertz frequency range, do not require protection in the lower frequencies.
However, this should be a priority, in order to provide an overall protection against
multiple threats all at once.
A review of conductive concrete products revealed that there are several solutions
that have been patented for the purpose of EM shielding. However, most of these
solutions do not address the idea of shielding requirement at low frequencies that are less
than a few hundred megahertz at best [3]. One such patent is from a group in Japan for
“Electromagnetic wave shielding building material” [4]. The building material here is a
conductive concrete mixture that incorporates carbon fibers to increase the conductivity.
The mixture is studied from 30 MHz to 1 GHz and shows a decent amount of shielding,
between 26 and 54 dB across the frequency range. One issue that arises with this product
however is that the data presented shows no discernible difference when the concrete
thickness increases from 5 mm to 10 mm. This lack of change suggests that the majority
of EM wave attenuation is due to reflection rather than absorption. Though this product
shows a decent amount of shielding, it is still far from meeting the High-Altitude
Electromagnetic Pulse (HEMP) standard that was set as a goal for this project. Another
patent, developed under the support of the National Research Council of Canada, shows
that conductive concrete can be made to achieve a very low resistivity and also describes
its use for shielding, but does not specify how well the mixture actually works [5]. This
concrete mixture utilizes coke breeze - a byproduct of steel making, as well as carbon
fibers, to increase the conductivity of the concrete. In much the same way, this research
develops a conductive concrete mixture that also employs carbon powder, which is a
4
more refined carbon product with a higher conductivity than coke breeze. Nevertheless,
the inventors in this patent were able to attain an average conductivity of less than 10 Ω-
cm in resistivity with coke breeze, which is the limit set in the patent as being acceptable
for conductive concrete. The lack of shielding analysis for this mixture is indicative of
another issue with researching conductive concrete as an EM shield: the lack publicly
accessible SE data. Another product named Electro Conductive Concrete was developed
into individual blocks that could be used to build structures using a conductive mortar
[6]. This study shows promising results over a large frequency range, 30 MHz to 5 GHz.
The concrete block structure provides a good deal of SE in the higher frequencies,
measuring about 65 dB at 500 MHz, 75 dB at 1 GHz, and rising quickly to 95 dB at about
1.5 GHz.
Very few SE data are available on concrete mixtures in structure applications such
as rooms or buildings. This is partly due to the desire to keep the data from third parties
or foreign powers, since there is a strong possibility of military applications. Providing
others with the capabilities of conductive concrete shielding could empower them to
devise way to circumvent the protection provided by the shield or allow them to use the
materials to protect their own assets, putting the developer at a disadvantage. Many
initiatives into measuring the SE of conductive mixtures focus on using smaller samples
of concrete poured into a coaxial structure. One such investigation into various mixtures
of concrete utilizing steel and carbon fibers as well as different grades of carbon powder,
reached the same conclusion as our research on a conductive mixture that could provide
around 52 dB of SE at 1 GHz [7]. They find that the most promising conductive mixture
5
would contain steel fibers and carbon powder to achieve the desirable low resistivity.
Another pair of studies provide a more in-depth look at using carbon fibers to produce a
conductive mixture for shielding, but attains an SE of only around 20 dB to 30 dB
between the frequencies of 1 GHz and 2 GHz [8] [9]. This supports the decision of to use
steel fibers over carbon fibers due to the effect on resistivity of the concrete versus cost of
the fibers. Further testing of steel fiber mixes produced a cement paste that was able to
reach 70 dB of SE at 1.5 GHz. However, this paste did not include any of the main
components used in the concrete mixtures, such as sand or aggregates, which are
typically insulating factors that reduce the conductivity of the final product [10].
Several research efforts seek to analyze and simulate the SE of concrete structures
rather than actual implementation [11] [12]. Most of the simulations employ utilize the
finite-difference time domain (FDTD) method. This computational method numerically
solves Maxwell equations to estimate the interaction of EM waves with the material
surfaces. FDTD method requires prior knowledge of the electrical properties of the
material, such as conductivity, permittivity, and permeability. Since these material
properties are measurable with most conductive concrete mixtures, FDTD can model and
analyze how EM waves propagation through the concrete structure, and evaluates the use
of conductive concrete as an EM shield. One good example of this approach was reported
by the Nanjing Engineering Institute outlining the effect of conductive concrete mixtures
on a HEMP pulse [13]. HEMP research, focuses on the effect of conductive concrete on
an intense EM pulse (modeled mathematically as a double exponential waveform) that
can be analyzed using FDTD. In this case, the authors studied the amount of shielding
6
that can be estimated for differing conductivities as well as thicknesses of concrete. To
test this idea, the authors constructed rooms of conductive concrete with the desired
conductivities. Using a pulse source, they determined the amount of attenuation provided
by the room. The experimental results showed a higher amount of attenuation than was
predicted by FDTD, but within a discrepancy of around 10% - 20% of the expected
value. This shows that the use of FDTD is valid for estimating the attenuation provided
by conductive concrete mixtures to EM waves. The discrepancy could be attributed to the
possibility of the electrical properties of the concrete mixtures being frequency
dependent. Since a HEMP event would produce energy across a wide frequency range,
this would affect the concrete attenuation level of the EM energy by the concrete.
Other attributes of concrete structures as well as other conductive additives have
been thoroughly examined in the scope of conductivity and shielding. Several reports
detail the effect of rebar structures in reinforced concrete on RF waves [14] [15]. In these
cases, the authors were investigating the effect of rebar in concrete structures and how
they affected communications such as wireless internet, but this same data can be applied
to shielding applications. The majority of the interactions caused by rebar being
embedded in concrete are of a reflective nature in regards to EM waves. Due to the grid-
like structure produced, the rebar effectively creates a Faraday cage. The research
presented is for wire mesh cages with rather large apertures, about 4 to 6 inches square, in
comparison with the wavelengths of the frequencies studied. The results show that there
is a decent amount of reflective shielding. The amount of EM shielding is at a high
enough level to hamper low-power communications in the gigahertz range, but not
7
enough to satisfy the HEMP requirements. This effect should become more pronounced
as the frequency decreases and the wavelength increases inversely. So even though the
data produced by the authors may not be directly applicable for the given frequency
range, it does show the advantage of using a conductive mesh structure in concrete to
provide reflective attenuation. This reinforces the idea of using fibers of steel to create a
mesh network in conductive concrete.
1.3 Methods
Two methods of evaluation are used in to determine the effectiveness of conductive
concrete in attenuating EM energy. These methods are directly derived from; though do
not necessarily hold to, well-established standards used in their respective fields. The
Small Sample Testing method uses the EM-2107A test fixture from Electro-Metrics,
which is designed to conform to the ATSM test method D4935-1 [16]. This standard
outlines a test method for determining the SE of planar materials. These materials are
expected to be electrically thin, described in the standard as a material thickness less than
one one-hundredth of the electrical wavelength inside the specimen [16]. This
requirement is relaxed to allow for the testing of concrete specimens since they must be
thicker than outlined by the ASTM test method. A second consideration for Small
Sample Testing is the frequency range to be investigated. According to both the ASTM
method as well as the EM-2107A datasheet [17], the applicable frequency range is
between 30 MHz and 1.5 GHz. Interest in high-altitude electromagnetic pulse shielding
spans a range of 10 kHz to 1 GHz. Because of these differences, the Small Sample
Testing method must be considered in terms of “relative attenuation” when comparing
8
material components, but will be proven to be accurate in predicting the effect of the
components.
The second method presented here is Large Slab Testing to more accurately gauge the
ability of conductive concrete to shield against EM energy. Much like the Small Sample
Testing setup, the large slabs are tested in a hybrid method. This experimental method is
a combination of testing outlined by MIL-STD-125-188-1 and the use of an RF shelter.
Normally HEMP testing is performed on room-sized structures when testing building
components. This concept is not feasible when trying to develop a new product based on
conductive concrete. Building structures large enough to contain the test equipment and
antennas are labor-intensive and high monetary cost if a good number of different
mixtures are to be tested. To alleviate these issues, an RF shelter is modified with a test
port to allow for EM waves to penetrate from the outside of the shelter to the inside.
Concrete slabs are then cast in an appropriate configuration to cover this port. By
blocking the port with the conductive concrete, an estimate of the shielding provided by
the different mixtures can be determined. This allows for timely and accurate
development of a final conductive concrete mixture to be used for EM shielding.
9
2 CHAPTER 2 - Shielding Effectiveness Theory
2.1 Introduction
The most important concept in electromagnetic (EM) shielding is the shielding
effectiveness (SE) of a material. For most shielding applications, the highest possible SE
level is without a doubt the most preferable solution. The details of SE lie in two main
concepts, the reflection and absorption of EM waves. Because the EM waves of a HEMP
event are comprised of both magnetic and electric fields over a broad frequency range, a
broad-spectrum solution is necessary to attenuate the EM energy over a large range of
frequencies. Unfortunately, when dealing with a heterogeneous mixture like concrete it is
much more difficult to appropriately estimate the possible reflection or absorption
provided. This becomes an issue due to the reactions occurring inside the conductive
concrete components. Because of the interactions between conductive components and
the normal structure of concrete, the conductivity, permittivity, and permeability of the
conductive mixture are expected to be frequency dependent. Although the electrical
properties of the concrete change with frequency, the basic SE concepts remain
unchanged and are applicable to the final conductive mixture.
Shielding effectiveness is defined as a measure of how well a given material
attenuates EM energy in the form of magnetic and electric fields [18]. This basic concept
is typically broken down into three components: reflection, absorption, and multiple
reflections. Multiple reflections can be ignored when considering the bulk of SE provided
by an EM shield. Over the course of reflection and propagation through the material the
10
amount of SE due to each succeeding reflection becomes successively small and hence
may be of little interest. The two concepts of reflection and absorption are envisioned as
mathematical terms that make up the SE equation: SEdB = Sr + Sa, where Sa is the
attenuation due to absorption and Sr is attenuation due to reflection in dB [19]. These two
terms add directly to result in the overall SE provided by a material. Both of these
methods for attenuating signals are extremely important in creating an effective shield.
Overall, both reflection and absorption apply to the EM spectrum of a HEMP event, but
achieving significant levels of shielding can be difficult due to size and material
restrictions. The basic solution for most EM shielding needs is by means of steel plates.
The high conductivity and continuous surface provide excellent shielding all across the
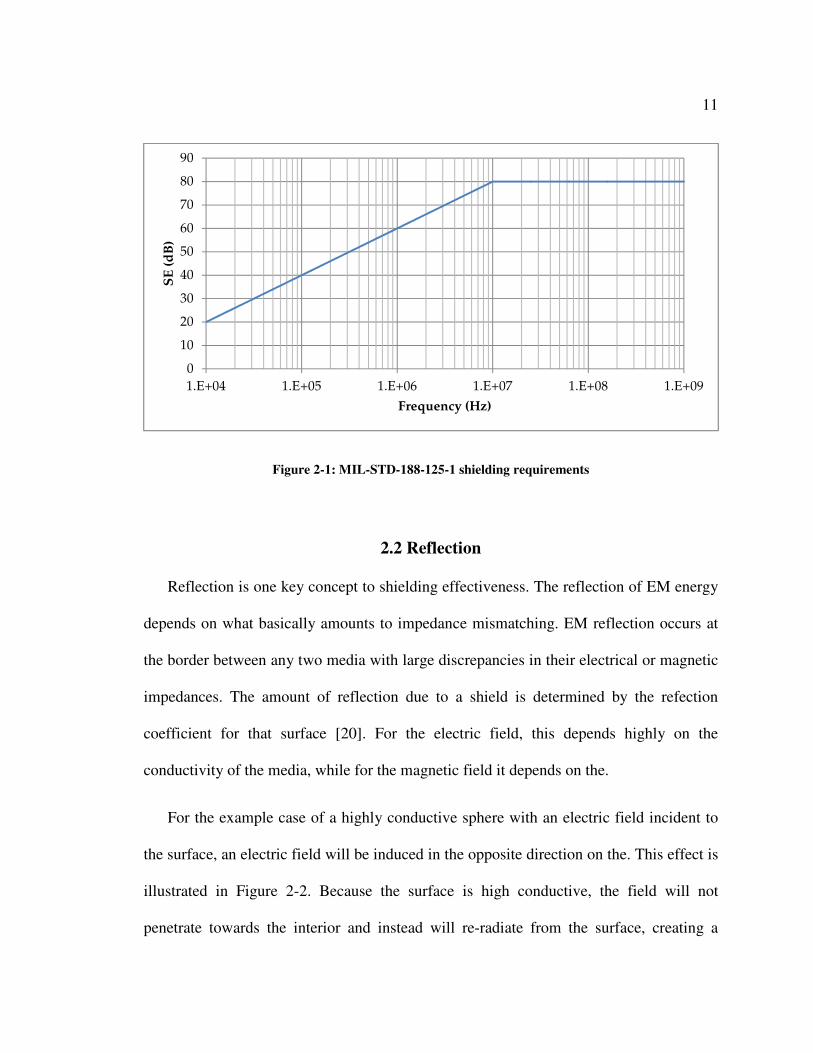
frequency spectrum defined in MIL-STD-188-125-1. To reach the goal of this standard,
illustrated in Figure 2-1, it is almost necessary to use either steel plates entirely or a
combination of other materials. The goal of this research in conductive concrete is to
develop a mixture that will provide shielding to meet or exceed this military standard.
11
Figure 2-1: MIL-STD-188-125-1 shielding requirements
2.2 Reflection
Reflection is one key concept to shielding effectiveness. The reflection of EM energy
depends on what basically amounts to impedance mismatching. EM reflection occurs at
the border between any two media with large discrepancies in their electrical or magnetic
impedances. The amount of reflection due to a shield is determined by the refection
coefficient for that surface [20]. For the electric field, this depends highly on the
conductivity of the media, while for the magnetic field it depends on the.
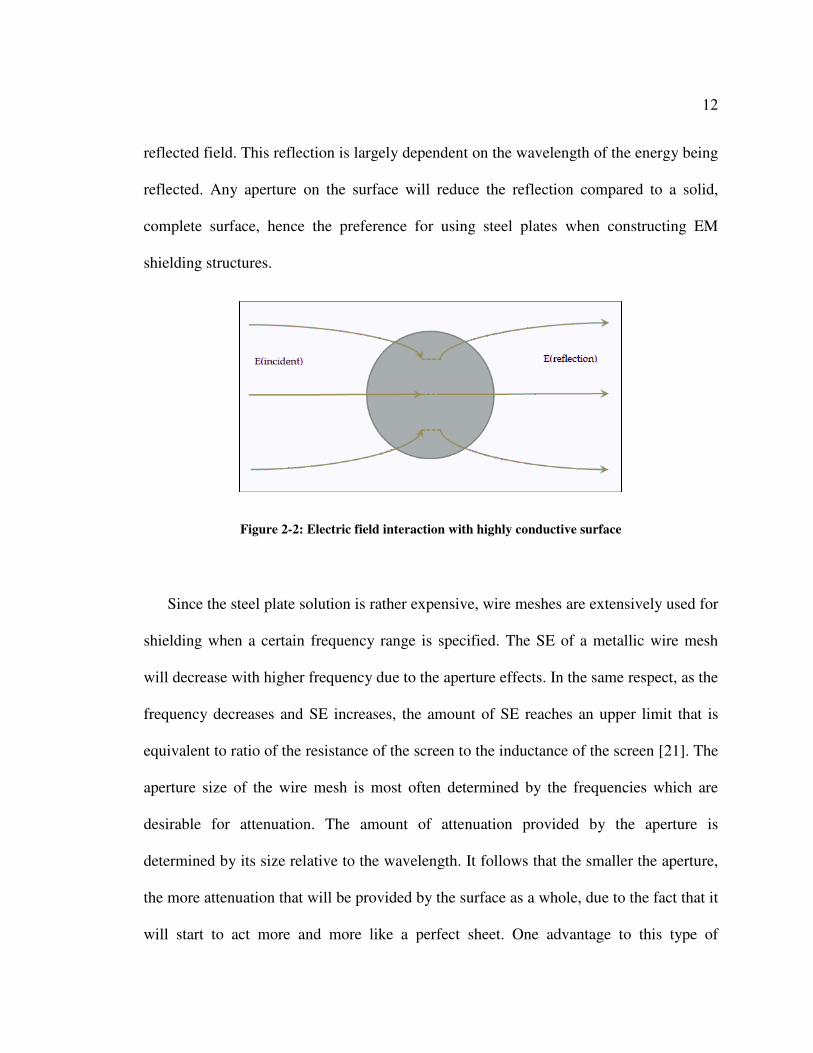
For the example case of a highly conductive sphere with an electric field incident to
the surface, an electric field will be induced in the opposite direction on the. This effect is
illustrated in Figure 2-2. Because the surface is high conductive, the field will not
penetrate towards the interior and instead will re-radiate from the surface, creating a
0
10
20
30
40
50
60
70
80
90
1.E+04 1.E+05 1.E+06 1.E+07 1.E+08 1.E+09
SE
(d
B)
Frequency (Hz)
12
reflected field. This reflection is largely dependent on the wavelength of the energy being
reflected. Any aperture on the surface will reduce the reflection compared to a solid,
complete surface, hence the preference for using steel plates when constructing EM
shielding structures.
Figure 2-2: Electric field interaction with highly conductive surface
Since the steel plate solution is rather expensive, wire meshes are extensively used for
shielding when a certain frequency range is specified. The SE of a metallic wire mesh
will decrease with higher frequency due to the aperture effects. In the same respect, as the
frequency decreases and SE increases, the amount of SE reaches an upper limit that is
equivalent to ratio of the resistance of the screen to the inductance of the screen [21]. The
aperture size of the wire mesh is most often determined by the frequencies which are
desirable for attenuation. The amount of attenuation provided by the aperture is
determined by its size relative to the wavelength. It follows that the smaller the aperture,
the more attenuation that will be provided by the surface as a whole, due to the fact that it
will start to act more and more like a perfect sheet. One advantage to this type of
13
shielding is that the effect of the aperture size translates to all frequencies of electric
fields below the cutoff frequency desired. This means that if a mesh is designed to work
at 1 GHz for example, then it will also attenuate frequencies lower than 1 GHz to a larger
degree as the frequency decreases. This effect however will eventually give way to the
skin-depth property needed for absorption and thus results in the noticeable differences in
SE between wire meshes of exceedingly small aperture size and metal plating. One
example cited by Björklöf, is that a wire mesh room designed with aperture size of 0.5
mm will only attain SE of about 40 dB for frequencies up to 1 GHz while an aluminum-
plated room of 6 mm thickness can achieve around 100 dB across the same spectrum.
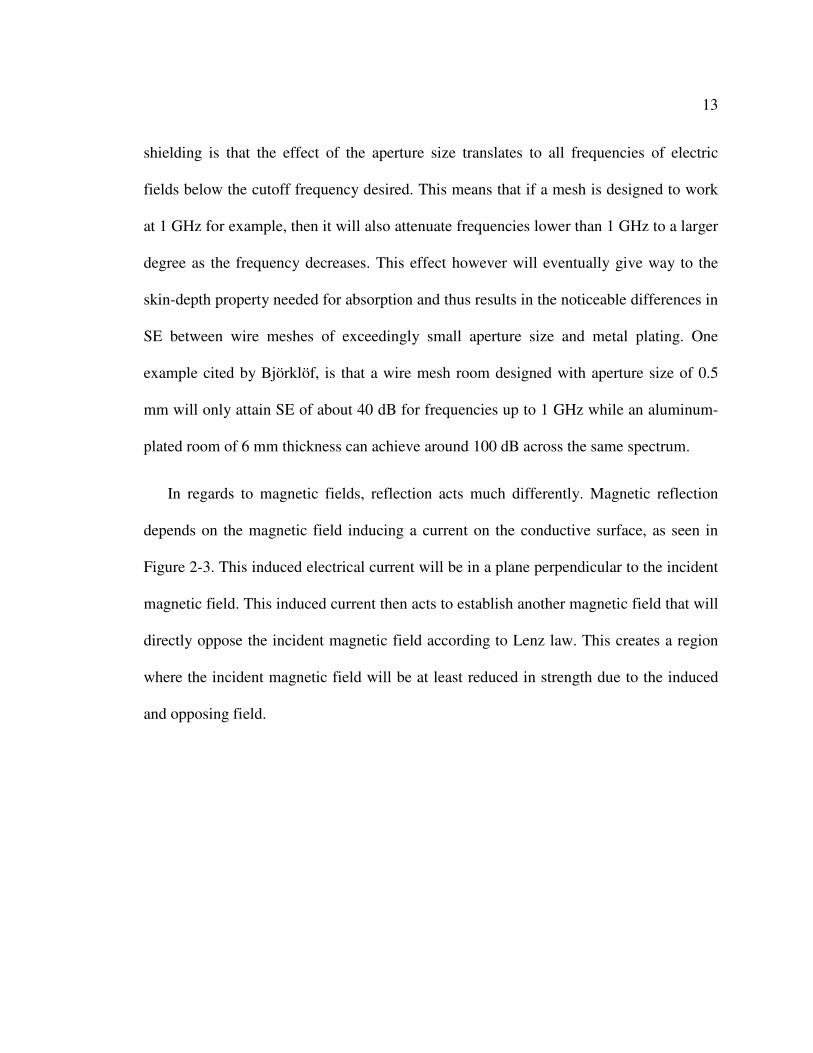
In regards to magnetic fields, reflection acts much differently. Magnetic reflection
depends on the magnetic field inducing a current on the conductive surface, as seen in
Figure 2-3. This induced electrical current will be in a plane perpendicular to the incident
magnetic field. This induced current then acts to establish another magnetic field that will
directly oppose the incident magnetic field according to Lenz law. This creates a region
where the incident magnetic field will be at least reduced in strength due to the induced
and opposing field.
14
Figure 2-3: Magnetic field inducing a current on conductive surface
Much in the same manner as electric reflection, apertures on the conductive surface
will produce problems due to interfering with the natural flow of the current. This
disturbs the uniformity of the induced current on the surface, which in turn leads to a less
uniform reflected magnetic field. Due to this disruption, the effect of the reflection will
be much reduced. To alleviate this disruption while preserving the use of a mesh over
steel plates, the spacing between apertures should be as large as possible. This gives the
impression of a large sheet with very small perforations instead of just a sheet of woven
wire. The larger the surface area in between apertures, the more uniform the current will
be allowed to flow over the entirety of the surface.
2.3 Absorption
Absorption is the second component of shielding effectiveness. The main idea is to
provide a material that is highly absorbing of EM energy across the selected range. This
effect is referred to as the skin-depth of the material. This can be defined as “the
penetration depth at which the strength of the field will have decayed to 1/e” of the
15
surface current density [19]. Skin depth (δ) is computed as follows:
; where f is
the frequency, µ is the permeability of the material, and σ is the conductivity. The amount
of absorption provided by a given material is approximated by the factor, / , where t
is the thickness of the material [20]. This shows that the amount of absorptive attenuation
provided by a shield is largely dependent on the thickness of the material as well as the
conductive properties of said material, sharply in contrast with reflective attenuation
which depends almost entirely on the conductive properties of said material. The EM
fields penetrating the materials decay exponentially. For higher frequencies, around the
megahertz and gigahertz range, the skin-depth begins to get very small. For this reason,
thin metal plating is a good solution for EM shielding. Improving the conductivity and
permeability of a given material can greatly increase the amount of EM absorption.
2.4 Summary
The shielding property of a given material depends on reflection and absorption.
Both of these properties are heavily dependent on conductivity and permeability of the
material in question. The reflective property depends on creating an impedance mismatch
between the incident EM field and the conductive surface. The absorptive property is
determined by the amount of absorption of EM energy penetrating the given. Efficient
shielding over a broad frequency spectrum depends on finding a good combination of
these properties.
16
3 CHAPTER 3 - Testing
3.1 Introduction
Testing methods for conductive concrete have been developed to gain an
understanding of how different mixtures and thicknesses will affect the shielding
effectiveness (SE) of the final product. Thus far, two stages of testing have resulted in
finding a viable mixture of components that can now be used for larger scale, more
expansive testing. The two testing methods are referred to as Small Sample Testing and
Large Slab Testing. These two testing methods allow for a reduction in the cost in terms
of labor, time, and money associated with developing an effective concrete mixture.
3.2 Small Sample Testing
Small Sample Testing is the first step used in determining what ingredients can be
added to the concrete mixture to increase the overall shielding properties. This test uses
relatively small samples that require minimal amounts of concrete to be produced.
Making small samples allows for the production of a large number of sample sets with a
sweeping variety of mixtures. This provides the option of making almost every
combination of ingredients to effectively see how each element behaves and what
significance it has in the final mixture. Using this method, we can quickly narrow down
the most effective combination of elements that warrant future testing.
The simplicity of the system is also a very important aspect of this testing method. To
test the small samples, we utilized the EM-2107A from Electro-Metrics. This test fixture
is specifically designed to measure the shielding effectiveness materials with various
conductive, as well as dielectric properties. Normally thes
than 0.25” in thickness, however, it is very difficult to make a concrete sample thin
enough to match the standard size used. Because of this inaccuracy, the test fixture is not
used for its traditional function to measure SE,
analysis of different mixtures and how
energies passing through the concrete
analyzer, as seen in Figure 3
Figure 3-1
The network analyzer is adept at producing the measurements need to compare these
sample sets. The most important measurement needed is to see how much energy passes
through the concrete. This gives us an idea of how it will work for shielding purposes. By
measuring the S21 of the test
port 1 to port 2 of the network analyzer and thus judge the relative attenuation seen in the
is specifically designed to measure the shielding effectiveness materials with various
conductive, as well as dielectric properties. Normally these samples are very thin, less
than 0.25” in thickness, however, it is very difficult to make a concrete sample thin
enough to match the standard size used. Because of this inaccuracy, the test fixture is not
used for its traditional function to measure SE, but instead provides a comparative
analysis of different mixtures and how varying the ingredients can effect electromagnetic
passing through the concrete. The test fixture is connected to a network
analyzer, as seen in Figure 3-1 below.
1: EM-2107A test fixture attached to network analyzer
The network analyzer is adept at producing the measurements need to compare these
sample sets. The most important measurement needed is to see how much energy passes
through the concrete. This gives us an idea of how it will work for shielding purposes. By
measuring the S21 of the test fixture, we can observe how much energy is passed from
port 1 to port 2 of the network analyzer and thus judge the relative attenuation seen in the
17
is specifically designed to measure the shielding effectiveness materials with various
e samples are very thin, less
than 0.25” in thickness, however, it is very difficult to make a concrete sample thin
enough to match the standard size used. Because of this inaccuracy, the test fixture is not
but instead provides a comparative
effect electromagnetic
The test fixture is connected to a network
2107A test fixture attached to network analyzer
The network analyzer is adept at producing the measurements need to compare these
sample sets. The most important measurement needed is to see how much energy passes
through the concrete. This gives us an idea of how it will work for shielding purposes. By
, we can observe how much energy is passed from
port 1 to port 2 of the network analyzer and thus judge the relative attenuation seen in the
18
concrete. By comparing the S21 measurements of various samples, we can get a clear
picture of how each additive element affects the EM attenuation over the frequency
ranges. Using an Agilent E5062A Network Analyzer, we are able to take measurements
from 300 kHz to 2 GHz. In addition to measuring the attenuation, the network analyzer
also allows for a measurement of the reflection due to transmission from a port, or the
S11. Utilizing this measurement gives us a basic understanding of the reflective nature of
a mixture. Since reflection is necessary in the lower frequencies, especially below 100
MHz, it is extremely useful to know the impact of the various on the EM reflection with
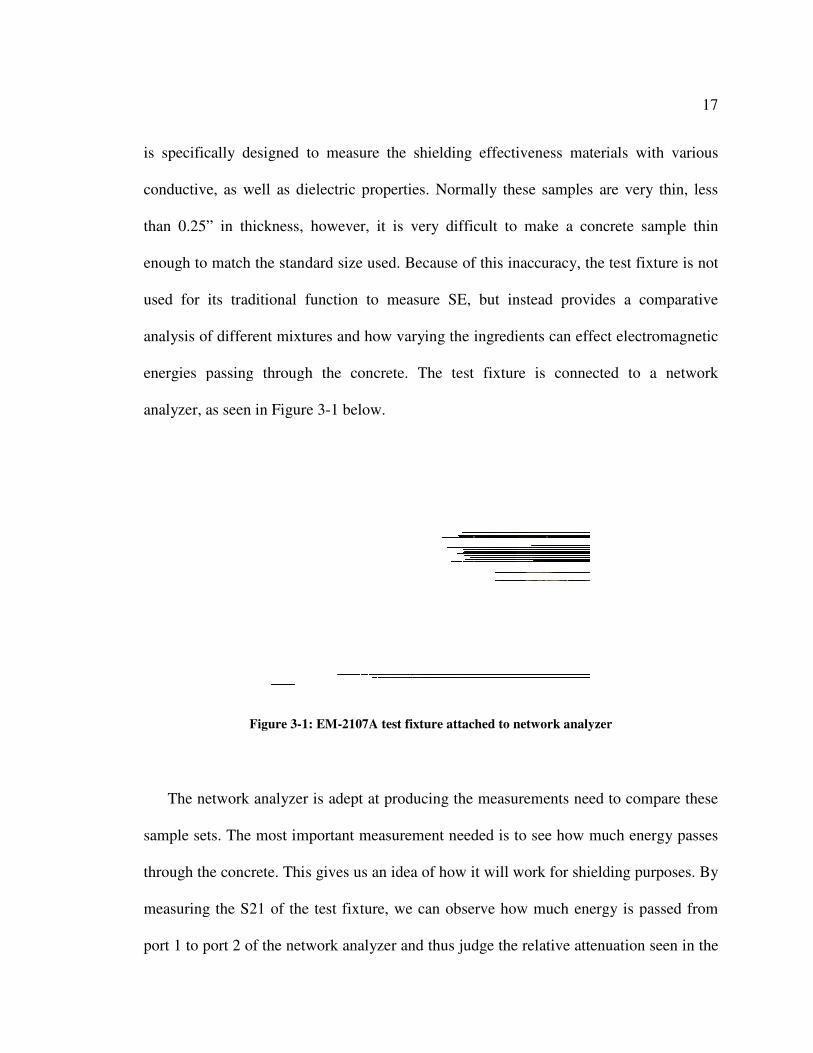
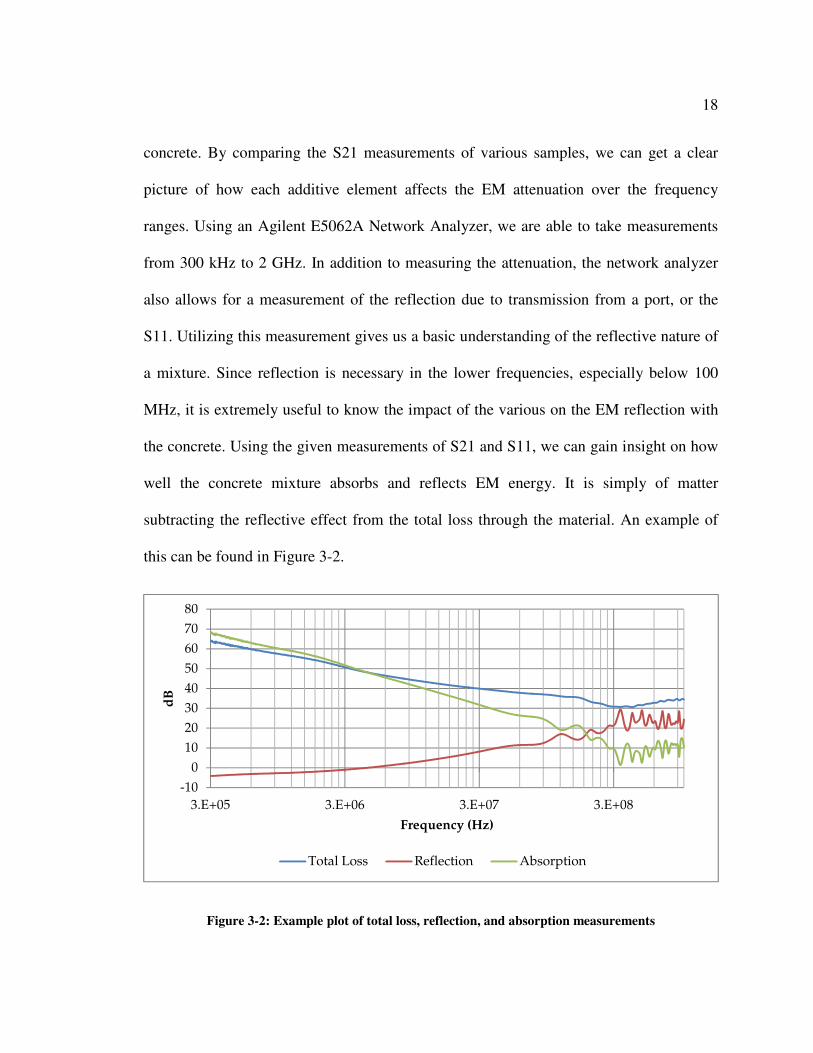
the concrete. Using the given measurements of S21 and S11, we can gain insight on how
well the concrete mixture absorbs and reflects EM energy. It is simply of matter
subtracting the reflective effect from the total loss through the material. An example of
this can be found in Figure 3-2.
Figure 3-2: Example plot of total loss, reflection, and absorption measurements
-10
0
10
20
30
40
50
60
70
80
3.E+05 3.E+06 3.E+07 3.E+08
dB
Frequency (Hz)
Total Loss Reflection Absorption
19
Through this testing we can gain significant knowledge of the effects differing
ingredients have on the EM attenuation provided by conductive concrete. The results for
this round of testing are found in Section 4.1. For this testing method, a wide variety of
sample sets were produced using varying amounts and qualities of ingredients.
Throughout the testing the main components remained the same: cement powder, carbon
powder, conductive fibers, and taconite. To gauge effectiveness of carbon powder, the
amount was varied between different sample sets. Different conductive fibers were tested
including short and long steel fibers, fine and coarse steel fibers, as well as copper filings.
Taconite was prepared in forms that included a fine powder, small pieces, and high
purity. The great multitude of possible combinations provides a large amount of guidance
when proceeding with larger scale testing.
3.2.1 Test Fixture
The test fixture used for Small Sample Testing, as previously stated, is the EM-
2107A. This device is made to conform to the standard ASTM test method D4935-1,
used to determine the amount of SE provided by a sample material. The fixture is
essentially an enlarged section of a coaxial cable. To this end, it is built with an inner
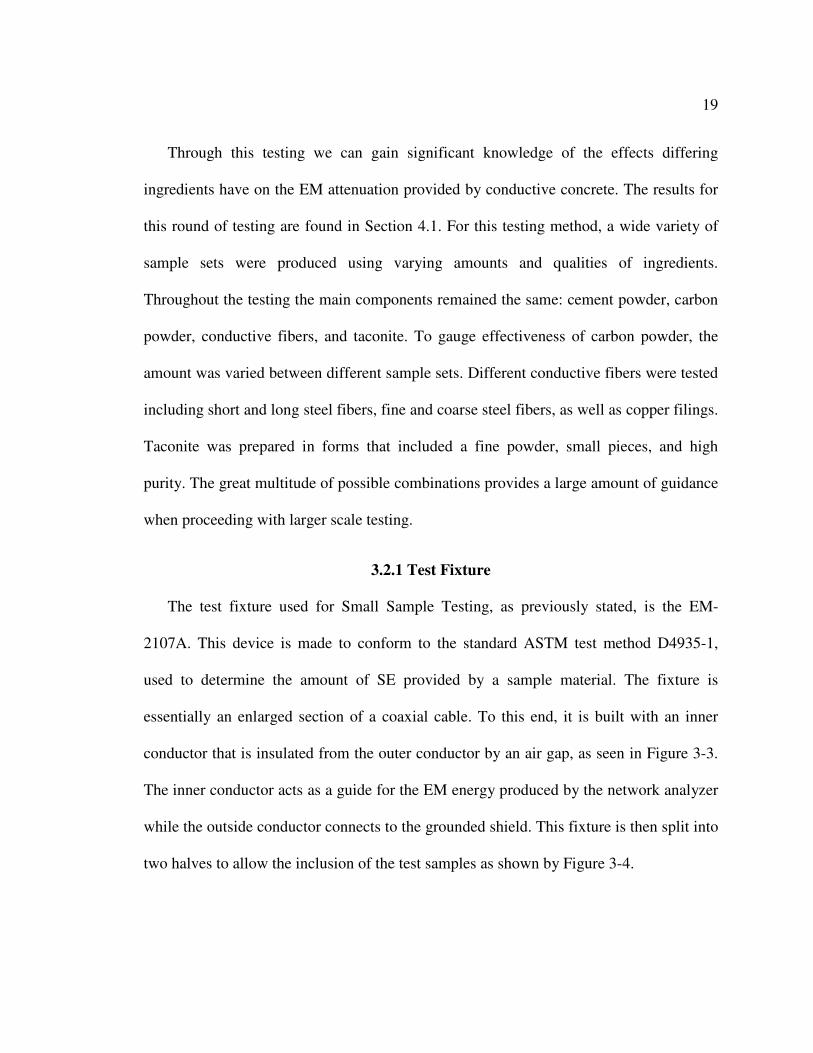
conductor that is insulated from the outer conductor by an air gap, as seen in Figure 3-3.
The inner conductor acts as a guide for the EM energy produced by the network analyzer
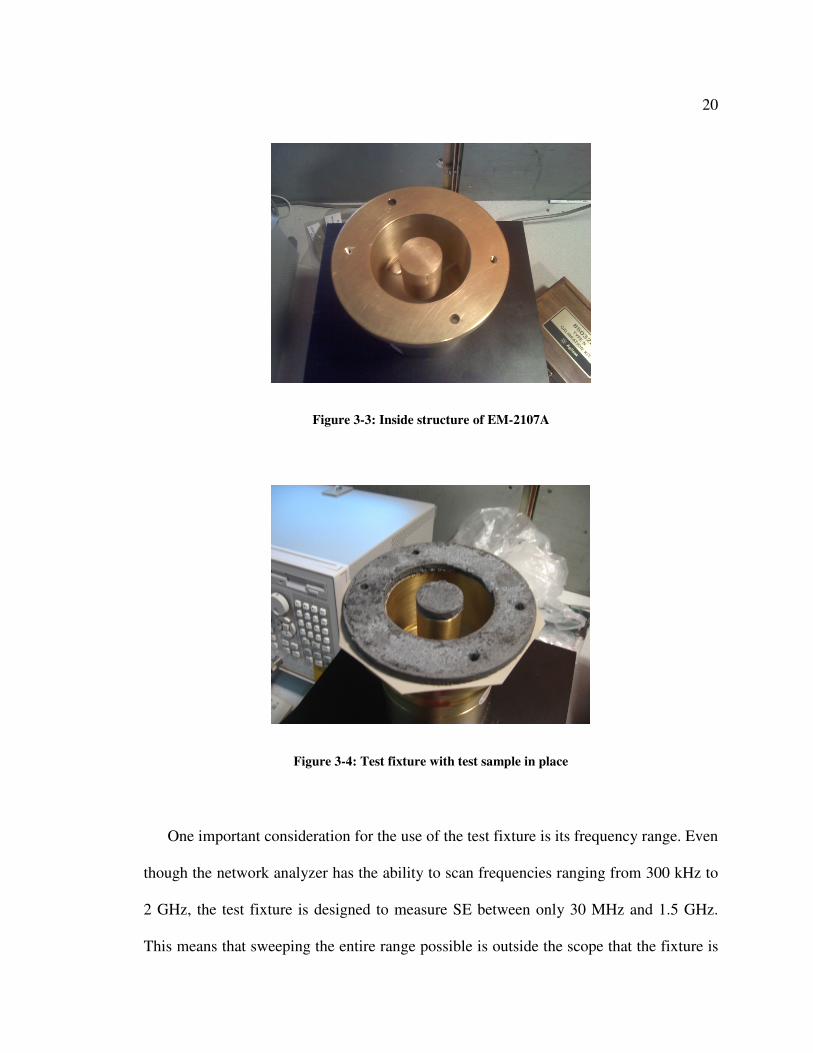
while the outside conductor connects to the grounded shield. This fixture is then split into
two halves to allow the inclusion of the test samples as shown by Figure 3-4.
20
Figure 3-3: Inside structure of EM-2107A
Figure 3-4: Test fixture with test sample in place
One important consideration for the use of the test fixture is its frequency range. Even
though the network analyzer has the ability to scan frequencies ranging from 300 kHz to
2 GHz, the test fixture is designed to measure SE between only 30 MHz and 1.5 GHz.
This means that sweeping the entire range possible is outside the scope that the fixture is
21
intended to be used. To this end, we needed to verify that the measurements could still be
considered useful below 30 MHz since the standard we wish to meet requires attenuation
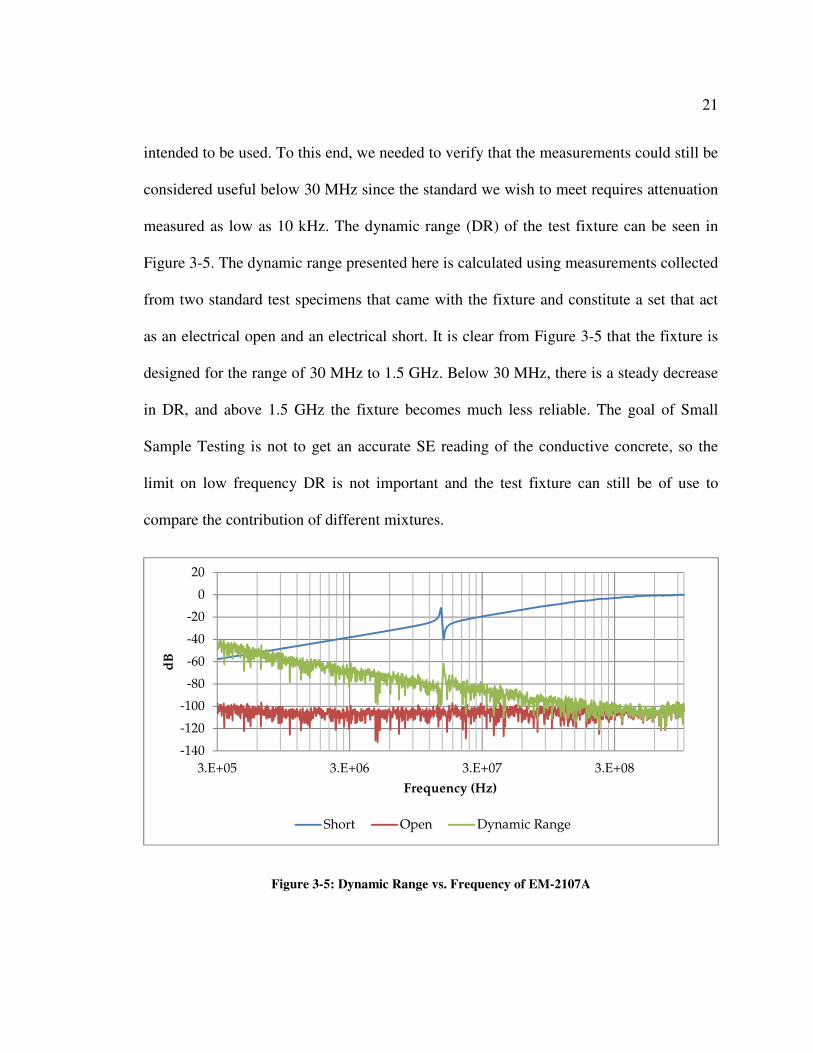
measured as low as 10 kHz. The dynamic range (DR) of the test fixture can be seen in
Figure 3-5. The dynamic range presented here is calculated using measurements collected
from two standard test specimens that came with the fixture and constitute a set that act
as an electrical open and an electrical short. It is clear from Figure 3-5 that the fixture is
designed for the range of 30 MHz to 1.5 GHz. Below 30 MHz, there is a steady decrease
in DR, and above 1.5 GHz the fixture becomes much less reliable. The goal of Small
Sample Testing is not to get an accurate SE reading of the conductive concrete, so the
limit on low frequency DR is not important and the test fixture can still be of use to
compare the contribution of different mixtures.
Figure 3-5: Dynamic Range vs. Frequency of EM-2107A
-140
-120
-100
-80
-60
-40
-20
0
20
3.E+05 3.E+06 3.E+07 3.E+08
dB
Frequency (Hz)
Short Open Dynamic Range
22
3.2.2 Sample Sets
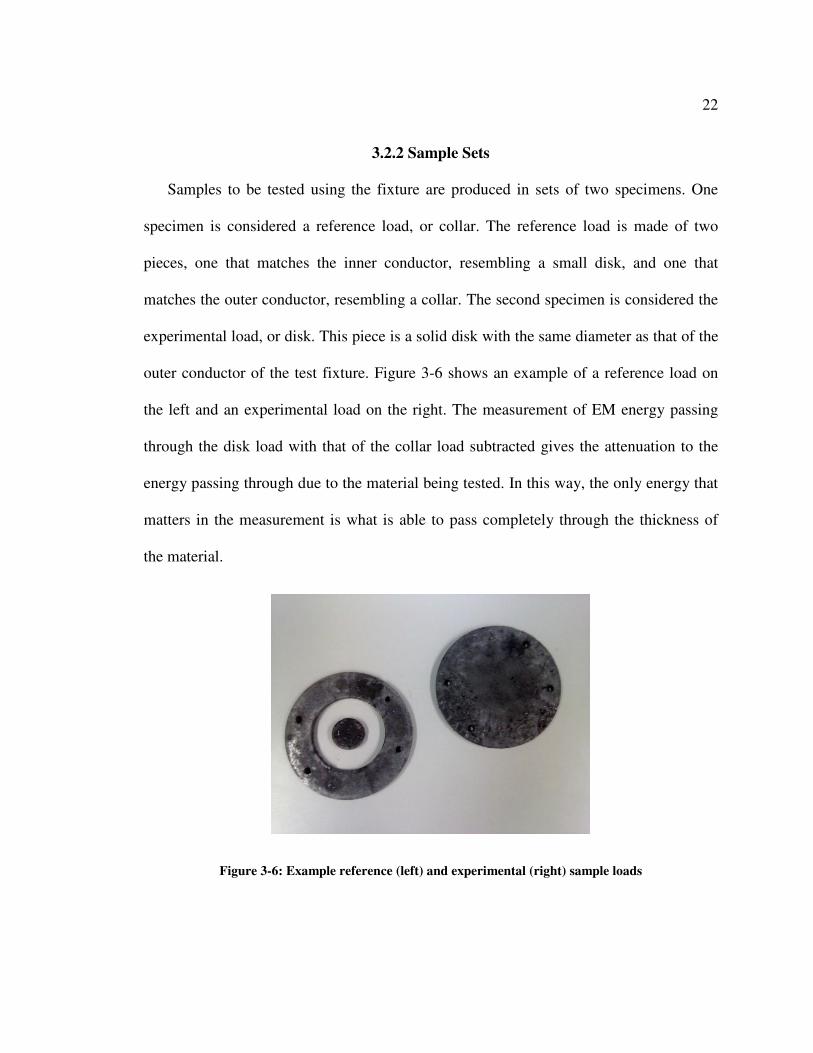
Samples to be tested using the fixture are produced in sets of two specimens. One
specimen is considered a reference load, or collar. The reference load is made of two
pieces, one that matches the inner conductor, resembling a small disk, and one that
matches the outer conductor, resembling a collar. The second specimen is considered the
experimental load, or disk. This piece is a solid disk with the same diameter as that of the
outer conductor of the test fixture. Figure 3-6 shows an example of a reference load on
the left and an experimental load on the right. The measurement of EM energy passing
through the disk load with that of the collar load subtracted gives the attenuation to the
energy passing through due to the material being tested. In this way, the only energy that
matters in the measurement is what is able to pass completely through the thickness of
the material.
Figure 3-6: Example reference (left) and experimental (right) sample loads
23
3.2.3 Sample Preparation and Sealing
It is natural for concrete surfaces to have a certain amount of roughness and
inconsistency. The test fixture is designed to test samples that have perfectly smooth
surfaces and consistent thickness throughout. This situation proves to be problematic for
producing reliable and accurate measurements. Because of this, the sample specimens
must first be prepared after the concrete has set. The first step to this process is to use an
angle grinder with a masonry disk to get rid of large imperfections and better level out the
surface. The second step is to use a lapping table to get the surface as smooth and level as
possible. Even after using the lapping table, the surface of the specimen is still somewhat
rough and pitted. Further smoothing is possible but much too labor intensive for the final
result. In the end, the surface of the concrete will still not be smooth enough to accurately
match the surface of the test fixture. Because of this, the use of gaskets was investigated.
Two choices of gaskets were considered to meet the specimen and fixture surfaces,
dielectric and conductive. Either type of gasket would be a viable candidate, though
ultimately the dielectric option was eliminated. Dielectric gaskets tend to be harder and
less pliable than conductive materials. In this configuration, the gasket would be
considered to be extending the surface of the specimen to mate with the fixture. Instead
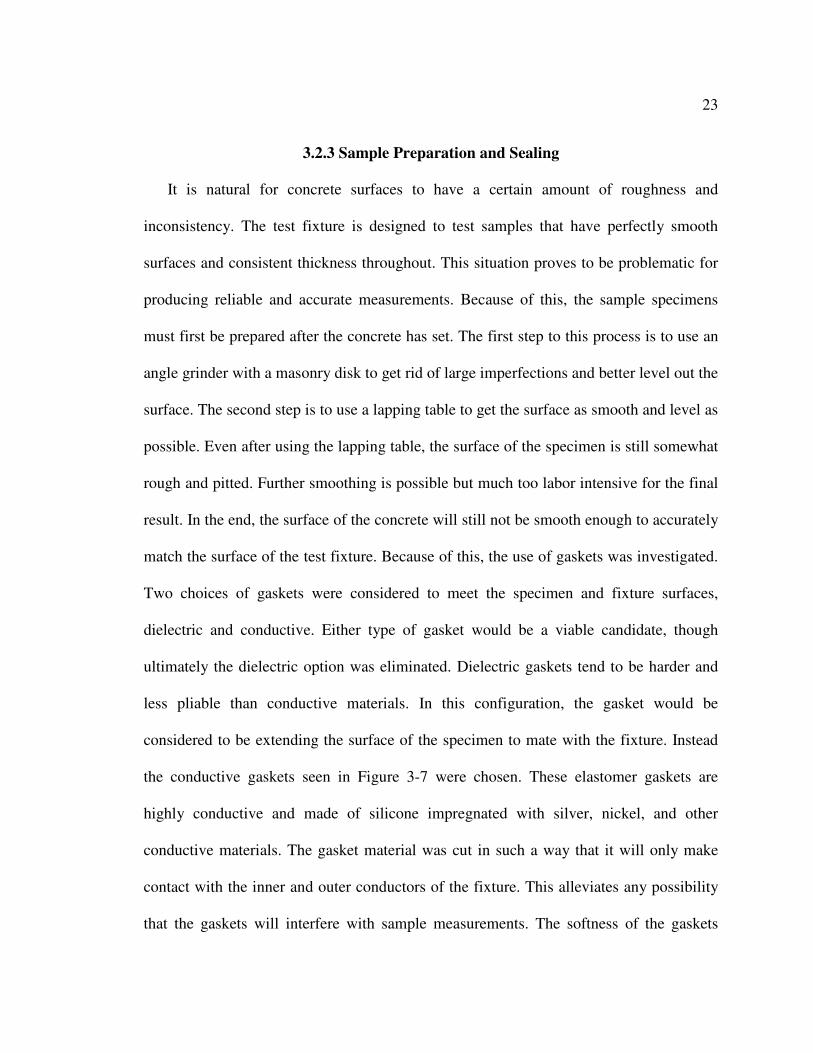
the conductive gaskets seen in Figure 3-7 were chosen. These elastomer gaskets are
highly conductive and made of silicone impregnated with silver, nickel, and other
conductive materials. The gasket material was cut in such a way that it will only make
contact with the inner and outer conductors of the fixture. This alleviates any possibility
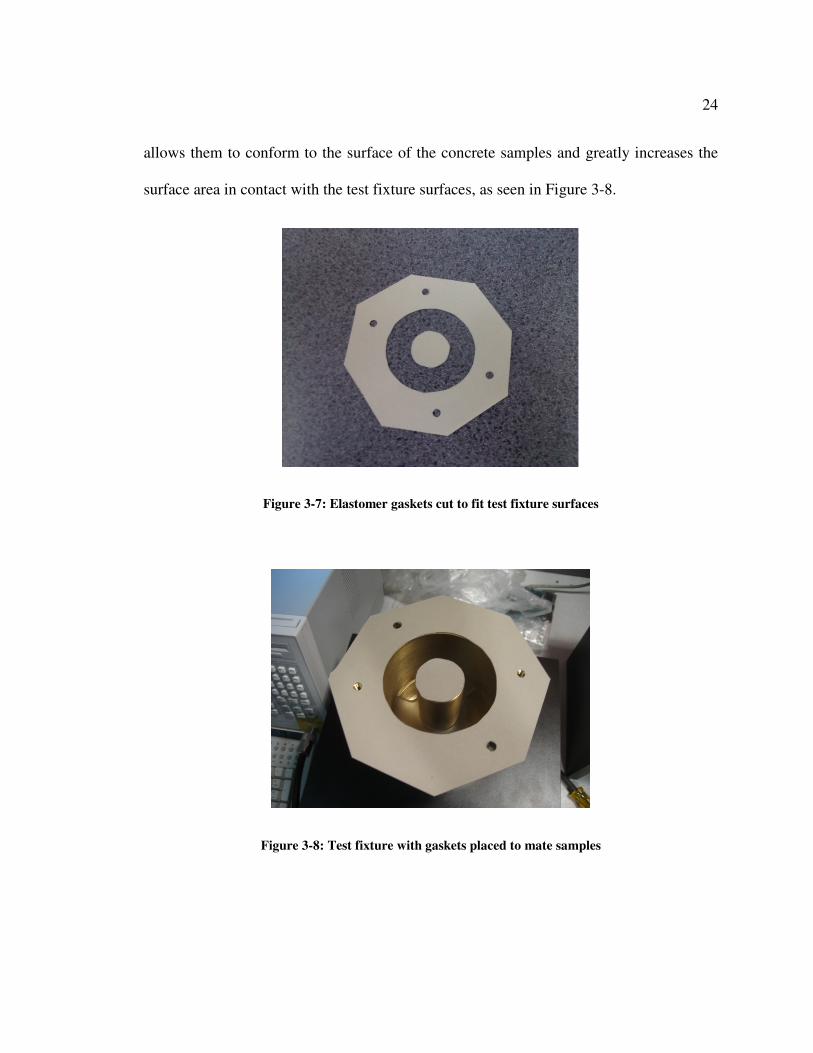
that the gaskets will interfere with sample measurements. The softness of the gaskets
24
allows them to conform to the surface of the concrete samples and greatly increases the
surface area in contact with the test fixture surfaces, as seen in Figure 3-8.
Figure 3-7: Elastomer gaskets cut to fit test fixture surfaces
Figure 3-8: Test fixture with gaskets placed to mate samples
25
3.3 Large Slab Testing
Large Slab Testing is the second step in determining a viable mixture of conductive
concrete for EM shielding. This test gives a better idea of how the concrete will react to
EM energy and how effective it can be at attenuating it. Much like the Small Sample
Testing, the slab testing method provides important data at what can be considered a low
cost of materials and labor. One large advantage to using slabs over the small samples is
that we can adhere more closely to the testing methods outlined by MIL-STD-188-125-1.
This method of testing allows the use of larger slabs whose properties will act much
more like those of a structure made with conductive concrete. To test these slabs, a new
system for testing had to be considered. Under normal circumstances, a conductive
material to be tested can be placed over an aperture created in a RF (radio-frequency)
shelter. However, in the case of conductive concrete, it is not as easy to mate with a
conductive surface as a metal plate or something of similar construction. The thickness of
the concrete also creates an issue with the most common setups, because they rely on
thin, highly conductive samples much like what is used with the EM-2107A for Small
Sample Testing. To cover an aperture large enough to be useful and allow the passing of
a wide range of frequencies, the concrete slab must be thick enough to stay together. This
requires then that the slab be of significant thickness as well as length and width. Because
of the density of concrete, the weight of the test slabs presents another impediment to
building a testing method. A wire mesh shelter cannot support the extra weight without a
large amount of reinforcement.
26
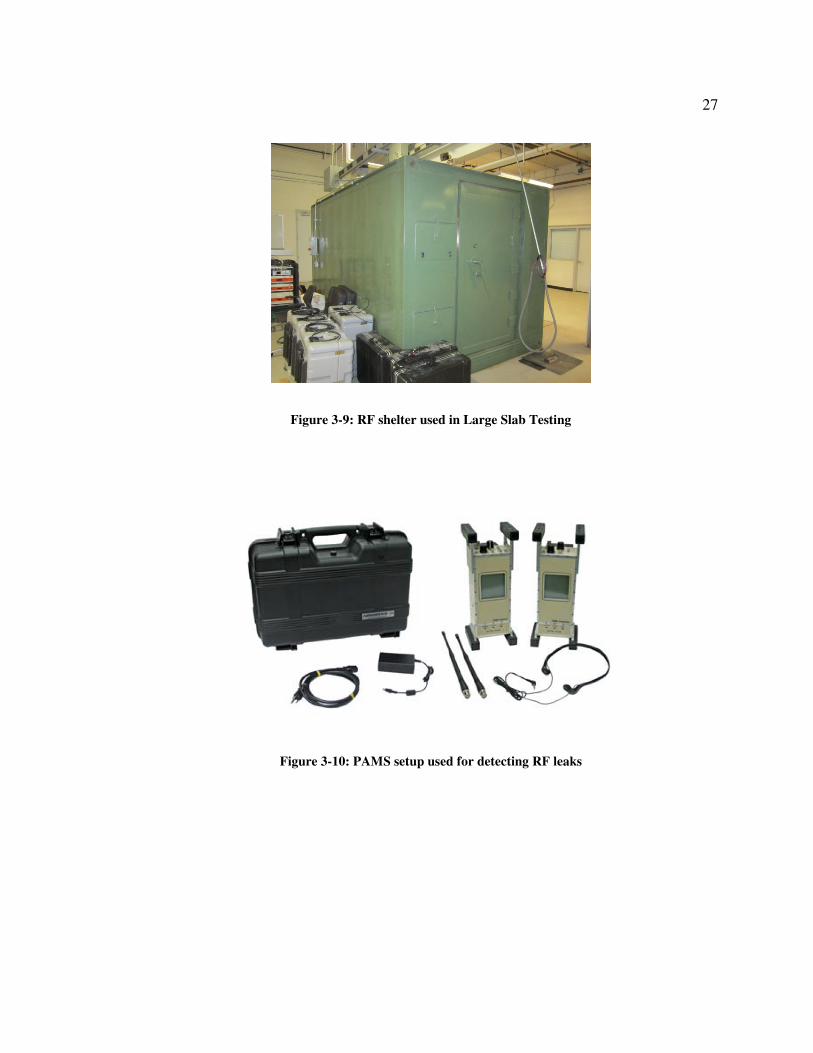
For this round of testing we were fortunate enough to be allowed the use of a mobile
RF shelter. This shelter is built of steel plating and is about 8’ wide by 8’ tall by 16’ long
(Figure 3-9.) To prepare the shelter for use, the first step was to verify that it had enough
SE at the military standard frequency range to easily gauge how much SE is provided by
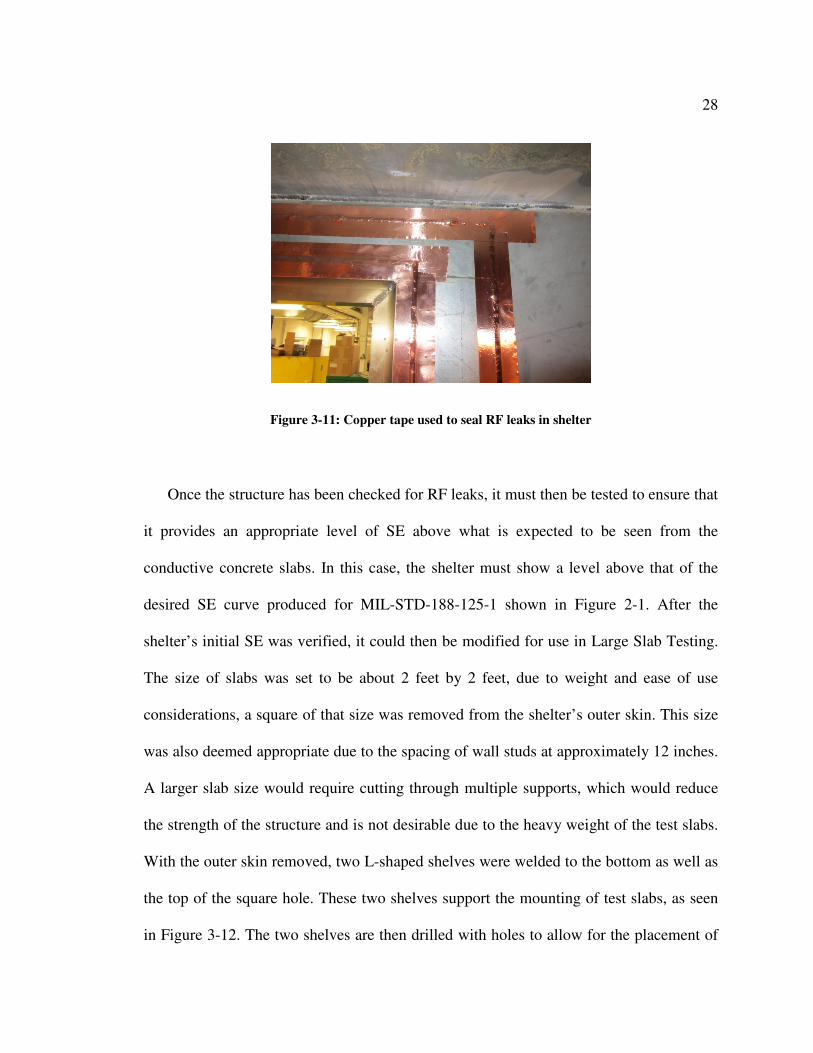
the concrete slabs. This was accomplished by using a system called PAMS (Portable
Attenuation Measurement System) to determine where weak points were present in the
shield. PAMS consists of a transmitter and receiver pair of handheld devices, seen in
Figure 3-10 [22]. PAMS measurements yield the path loss between the two devices at a
wide range of power levels from +30 dBm transmitting to -120 dBm on the receiving
end, giving the total dynamic range of 150 dB.
The measurement procedure beings with a free-space calibration performed at a
distance of 10 feet between the transmitter and receiver. This calibration allows for a zero
point to be set on the receiver, showing the difference readout from the nominal value.
Once this has been performed, the transmitter is setup outside the shelter and the receiver
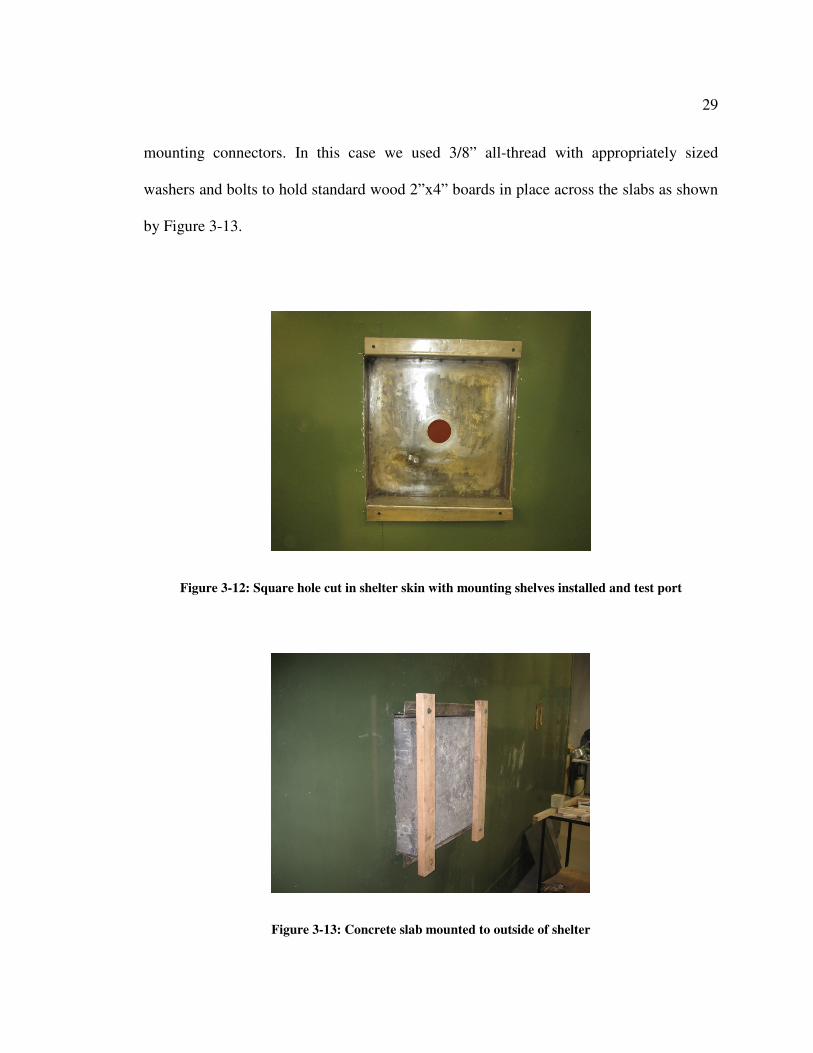
is taken inside the shield. Once the shield is sealed, the receiver can be used to “sniff”
around the seams and other areas of concern within the shelter. Areas that show a lack of
shielding can be reinforced using copper tape to seal along seams or possible cracks in
the steel shielding as shown by Figure 3-11.
27
Figure 3-9: RF shelter used in Large Slab Testing
Figure 3-10: PAMS setup used for detecting RF leaks
28
Figure 3-11: Copper tape used to seal RF leaks in shelter
Once the structure has been checked for RF leaks, it must then be tested to ensure that
it provides an appropriate level of SE above what is expected to be seen from the
conductive concrete slabs. In this case, the shelter must show a level above that of the
desired SE curve produced for MIL-STD-188-125-1 shown in Figure 2-1. After the
shelter’s initial SE was verified, it could then be modified for use in Large Slab Testing.
The size of slabs was set to be about 2 feet by 2 feet, due to weight and ease of use
considerations, a square of that size was removed from the shelter’s outer skin. This size
was also deemed appropriate due to the spacing of wall studs at approximately 12 inches.
A larger slab size would require cutting through multiple supports, which would reduce
the strength of the structure and is not desirable due to the heavy weight of the test slabs.
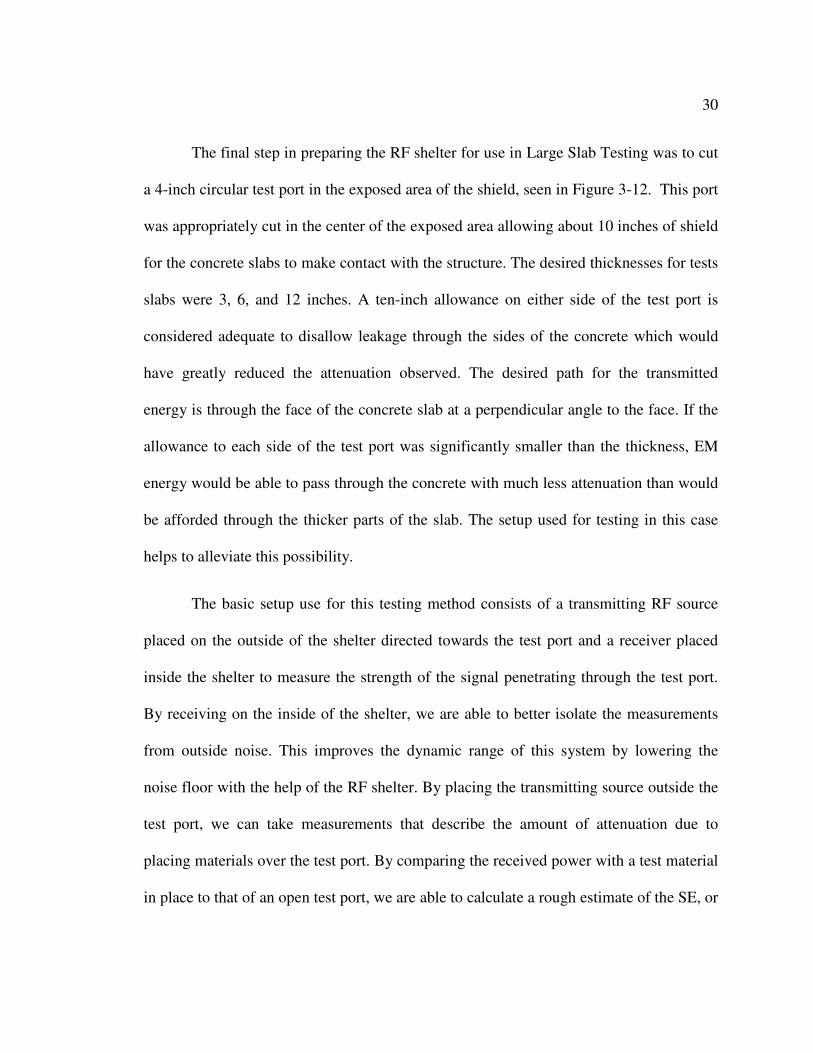
With the outer skin removed, two L-shaped shelves were welded to the bottom as well as
the top of the square hole. These two shelves support the mounting of test slabs, as seen
in Figure 3-12. The two shelves are then drilled with holes to allow for the placement of
29
mounting connectors. In this case we used 3/8” all-thread with appropriately sized
washers and bolts to hold standard wood 2”x4” boards in place across the slabs as shown
by Figure 3-13.
Figure 3-12: Square hole cut in shelter skin with mounting shelves installed and test port
Figure 3-13: Concrete slab mounted to outside of shelter
30
The final step in preparing the RF shelter for use in Large Slab Testing was to cut
a 4-inch circular test port in the exposed area of the shield, seen in Figure 3-12. This port
was appropriately cut in the center of the exposed area allowing about 10 inches of shield
for the concrete slabs to make contact with the structure. The desired thicknesses for tests
slabs were 3, 6, and 12 inches. A ten-inch allowance on either side of the test port is
considered adequate to disallow leakage through the sides of the concrete which would
have greatly reduced the attenuation observed. The desired path for the transmitted
energy is through the face of the concrete slab at a perpendicular angle to the face. If the
allowance to each side of the test port was significantly smaller than the thickness, EM
energy would be able to pass through the concrete with much less attenuation than would
be afforded through the thicker parts of the slab. The setup used for testing in this case
helps to alleviate this possibility.
The basic setup use for this testing method consists of a transmitting RF source
placed on the outside of the shelter directed towards the test port and a receiver placed
inside the shelter to measure the strength of the signal penetrating through the test port.
By receiving on the inside of the shelter, we are able to better isolate the measurements
from outside noise. This improves the dynamic range of this system by lowering the
noise floor with the help of the RF shelter. By placing the transmitting source outside the
test port, we can take measurements that describe the amount of attenuation due to
placing materials over the test port. By comparing the received power with a test material
in place to that of an open test port, we are able to calculate a rough estimate of the SE, or
31
relative attenuation in this case. Much like the measurements taken in Small Sample
Testing, these results are more of a comparable nature than true SE figures.
3.3.1 Test Setup
The test setup used for Large Slab Testing consists of three main systems: RF shelter,
transmitter, and receiver.
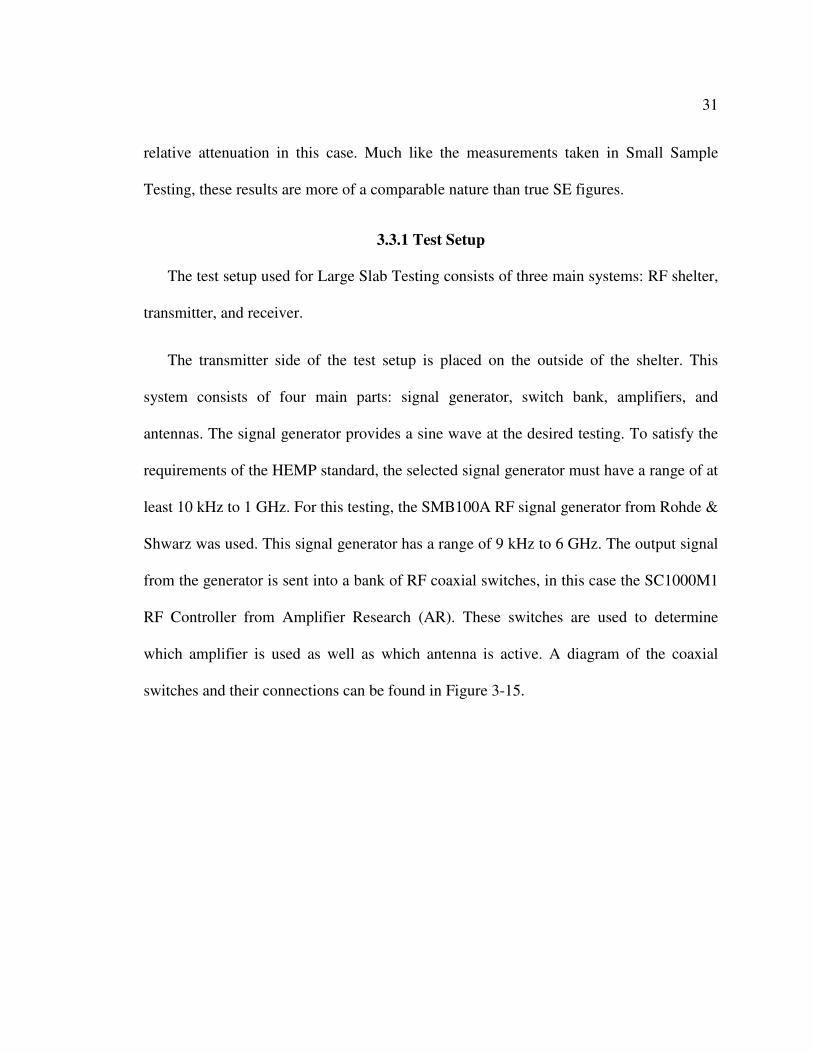
The transmitter side of the test setup is placed on the outside of the shelter. This
system consists of four main parts: signal generator, switch bank, amplifiers, and
antennas. The signal generator provides a sine wave at the desired testing. To satisfy the
requirements of the HEMP standard, the selected signal generator must have a range of at
least 10 kHz to 1 GHz. For this testing, the SMB100A RF signal generator from Rohde &
Shwarz was used. This signal generator has a range of 9 kHz to 6 GHz. The output signal
from the generator is sent into a bank of RF coaxial switches, in this case the SC1000M1
RF Controller from Amplifier Research (AR). These switches are used to determine
which amplifier is used as well as which antenna is active. A diagram of the coaxial
switches and their connections can be found in Figure 3-15.
Figure
Figure 3-14 shows that for this transmitter system, two amplifiers and two antennas
are utilized. Both the amplifiers and antennas are used to span different
of the measurement spectrum. The
a 150A100B power amplifier from AR. This amplifier is rated at 150W across the
frequency range of 10 kHz to 100
can be seen that this amplifier is then connected through to the passive loop antenna for
transmission. Per MIL-STD
in the frequency range of 10
field at these lower frequenci
Figure 3-14: Switch connections for transmitter system
shows that for this transmitter system, two amplifiers and two antennas
utilized. Both the amplifiers and antennas are used to span different frequency
spectrum. The signal in the lower frequency range is amplified using
a 150A100B power amplifier from AR. This amplifier is rated at 150W across the
kHz to 100 MHz. Referring to the switch configuration above, it
can be seen that this amplifier is then connected through to the passive loop antenna for
STD-188-125, the passive loop antenna is used to transmit si
in the frequency range of 10 kHz to 30 MHz. The passive loop establishes a magnetic
at these lower frequencies, while the higher frequency signals are transmitted as
32
shows that for this transmitter system, two amplifiers and two antennas
frequency ranges
lower frequency range is amplified using
a 150A100B power amplifier from AR. This amplifier is rated at 150W across the
Referring to the switch configuration above, it
can be seen that this amplifier is then connected through to the passive loop antenna for
is used to transmit signals
establishes a magnetic
are transmitted as
33
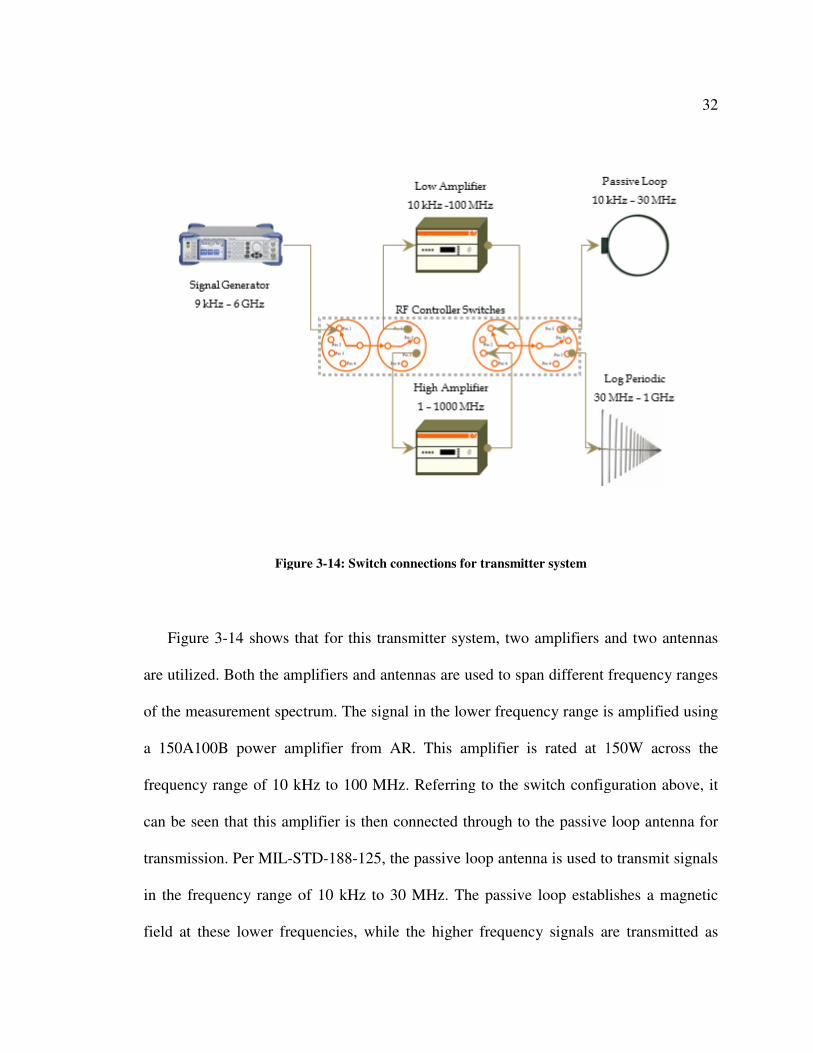
electric fields using a log periodic antenna between 30 MHz and 1 GHz (Figure 3-15).
For this frequency range, a second amplifier is needed better matched to the entire range.
The 30W1000B amplifier from Amplifier Research, with a range of 1 MHz to 1 GHz,
was used. This amplifier has a lower power rating at 30W.
Figure 3-15: Passive loop, left, and log periodic, right, antennas
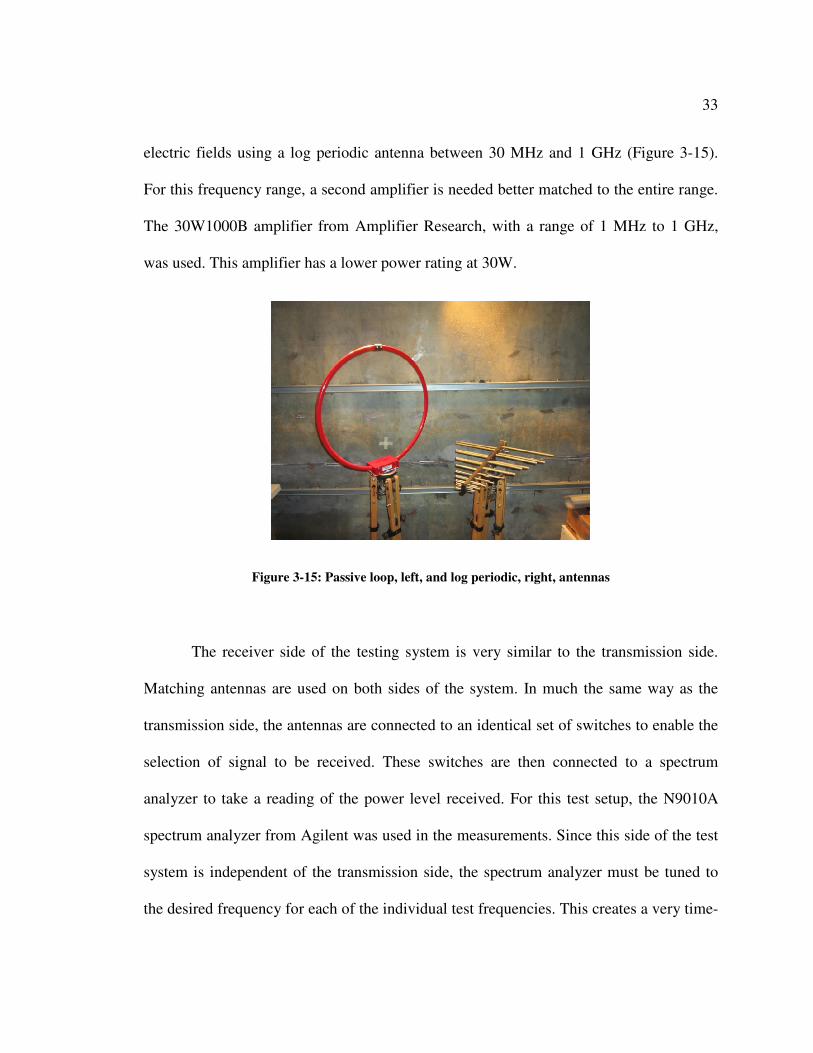
The receiver side of the testing system is very similar to the transmission side.
Matching antennas are used on both sides of the system. In much the same way as the
transmission side, the antennas are connected to an identical set of switches to enable the
selection of signal to be received. These switches are then connected to a spectrum
analyzer to take a reading of the power level received. For this test setup, the N9010A
spectrum analyzer from Agilent was used in the measurements. Since this side of the test
system is independent of the transmission side, the spectrum analyzer must be tuned to
the desired frequency for each of the individual test frequencies. This creates a very time-
consuming process that could be
A diagram of the entire test system is seen belo
Over the course of large slab testing, several thicknesses of various combinations of
the desired materials were produced to judge the effect
attenuating EM energy. The
of 3in. thick using steel fibers and carbon powder in the normal concrete mixture. This
was cast to keep in line with the first set made for small sample testing. This slab
presented issues almost immediately. Mating the straight concrete surface with that of the
consuming process that could be expedited by computer control of the entire test system.
A diagram of the entire test system is seen below in Figure 3-16.
Figure 3-16: Large slab test system
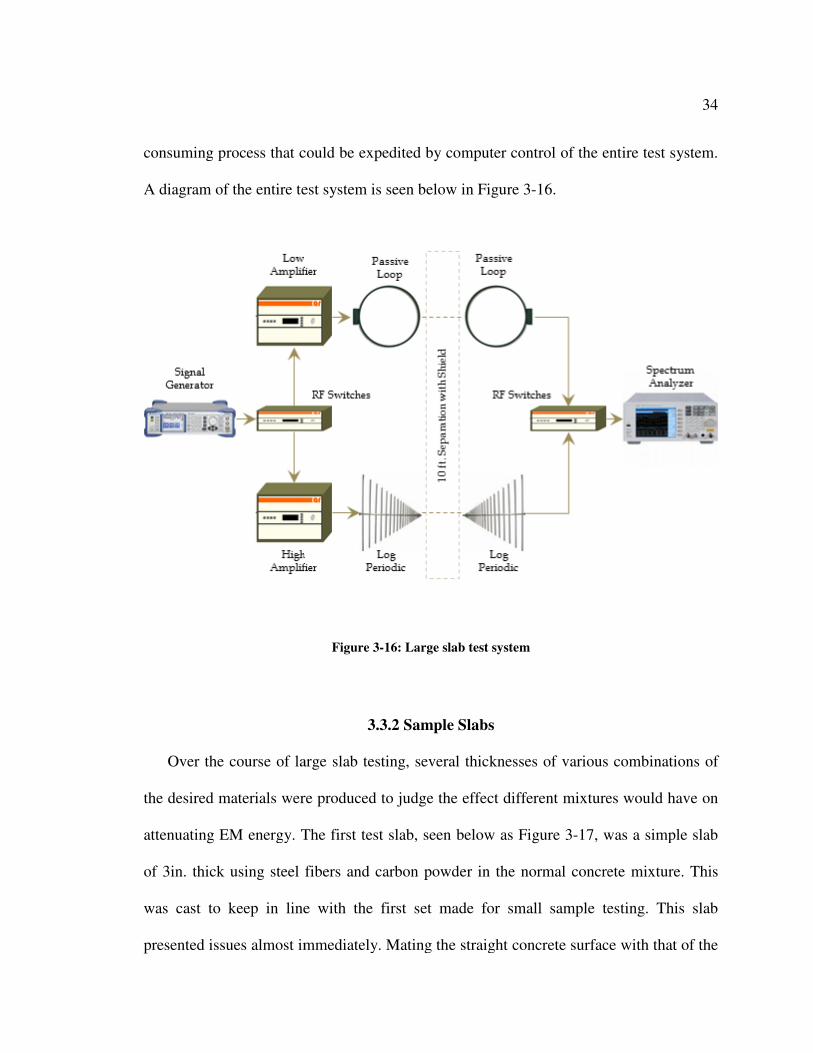
3.3.2 Sample Slabs
Over the course of large slab testing, several thicknesses of various combinations of
the desired materials were produced to judge the effect different mixtures would have on
energy. The first test slab, seen below as Figure 3-17, was a simple slab
of 3in. thick using steel fibers and carbon powder in the normal concrete mixture. This
to keep in line with the first set made for small sample testing. This slab
st immediately. Mating the straight concrete surface with that of the
34
of the entire test system.
Over the course of large slab testing, several thicknesses of various combinations of
different mixtures would have on
, was a simple slab
of 3in. thick using steel fibers and carbon powder in the normal concrete mixture. This
to keep in line with the first set made for small sample testing. This slab
st immediately. Mating the straight concrete surface with that of the
35
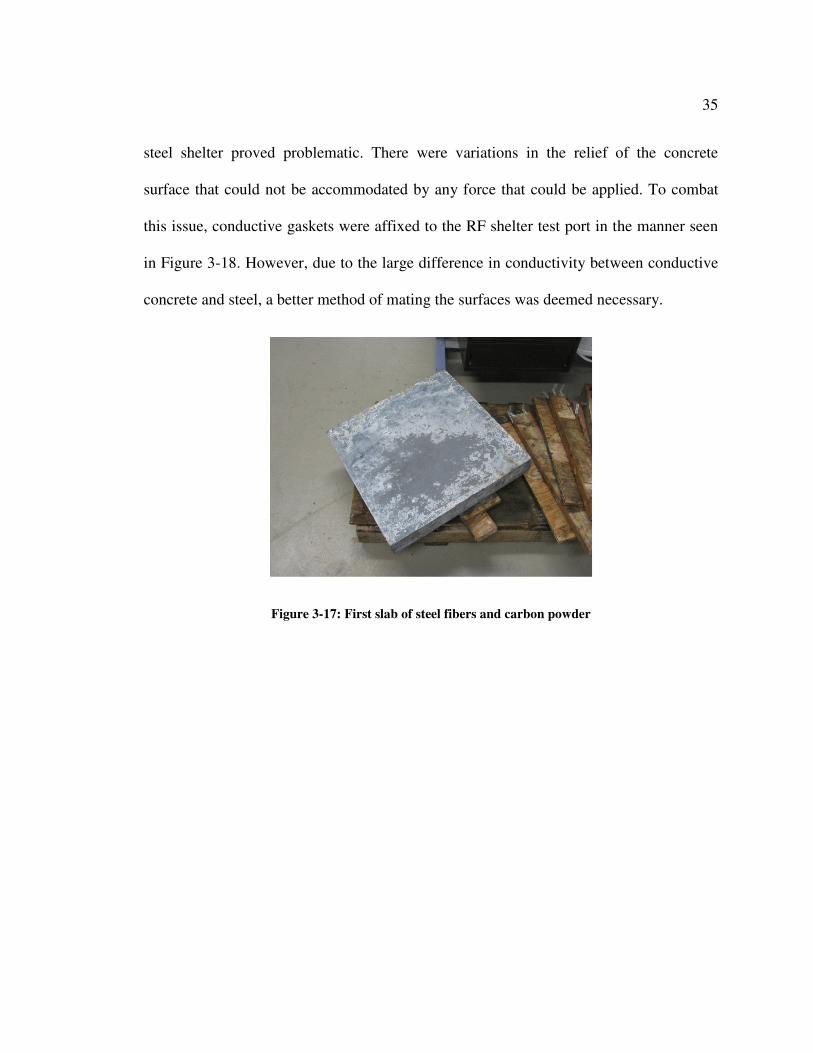
steel shelter proved problematic. There were variations in the relief of the concrete
surface that could not be accommodated by any force that could be applied. To combat
this issue, conductive gaskets were affixed to the RF shelter test port in the manner seen
in Figure 3-18. However, due to the large difference in conductivity between conductive
concrete and steel, a better method of mating the surfaces was deemed necessary.
Figure 3-17: First slab of steel fibers and carbon powder
36
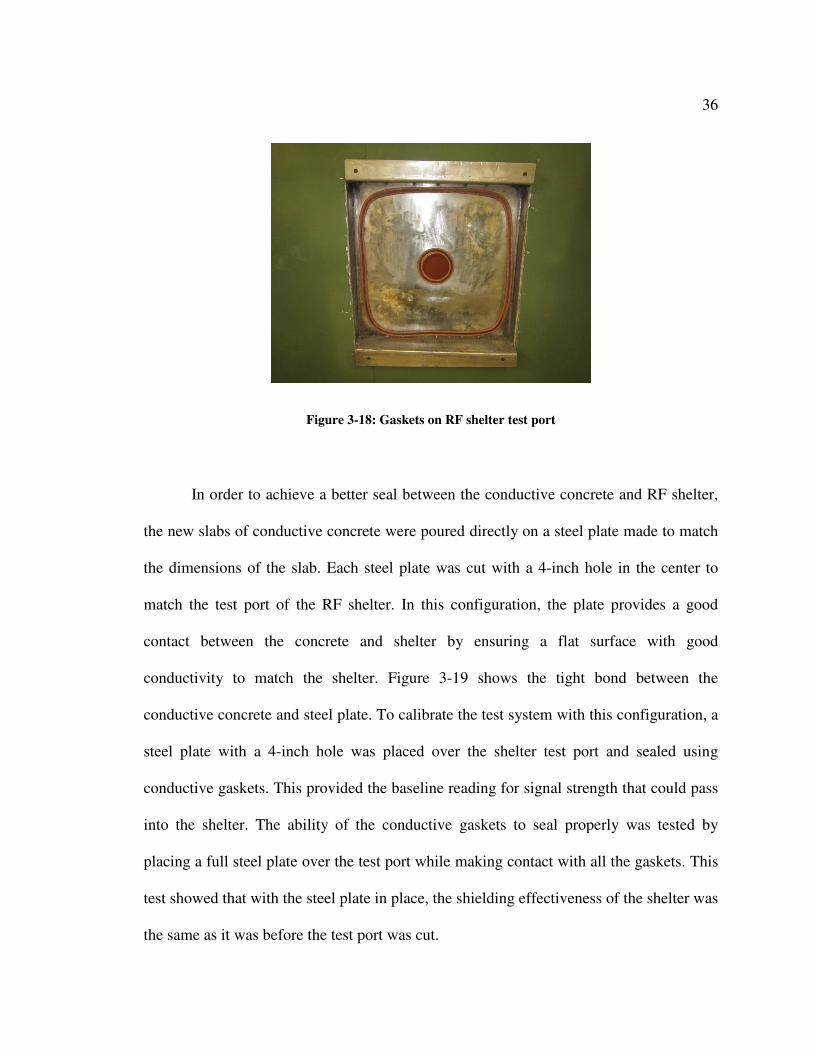
Figure 3-18: Gaskets on RF shelter test port
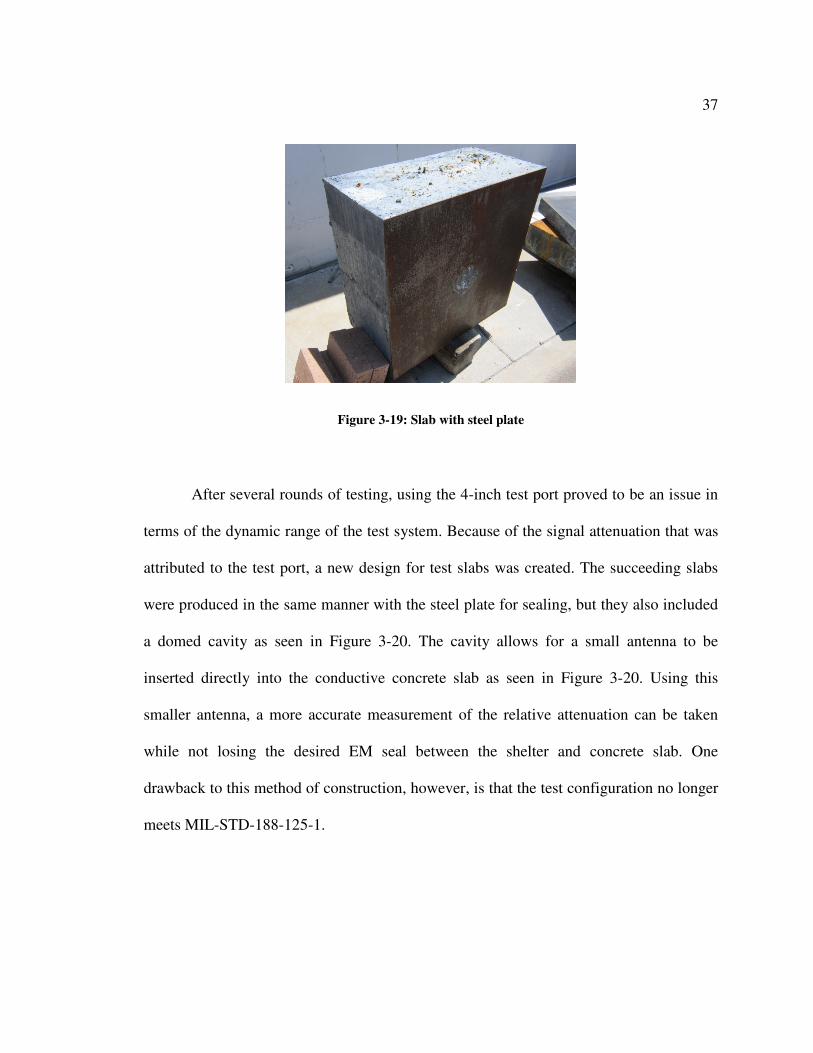
In order to achieve a better seal between the conductive concrete and RF shelter,
the new slabs of conductive concrete were poured directly on a steel plate made to match
the dimensions of the slab. Each steel plate was cut with a 4-inch hole in the center to
match the test port of the RF shelter. In this configuration, the plate provides a good
contact between the concrete and shelter by ensuring a flat surface with good
conductivity to match the shelter. Figure 3-19 shows the tight bond between the
conductive concrete and steel plate. To calibrate the test system with this configuration, a
steel plate with a 4-inch hole was placed over the shelter test port and sealed using
conductive gaskets. This provided the baseline reading for signal strength that could pass
into the shelter. The ability of the conductive gaskets to seal properly was tested by
placing a full steel plate over the test port while making contact with all the gaskets. This
test showed that with the steel plate in place, the shielding effectiveness of the shelter was
the same as it was before the test port was cut.
37
Figure 3-19: Slab with steel plate
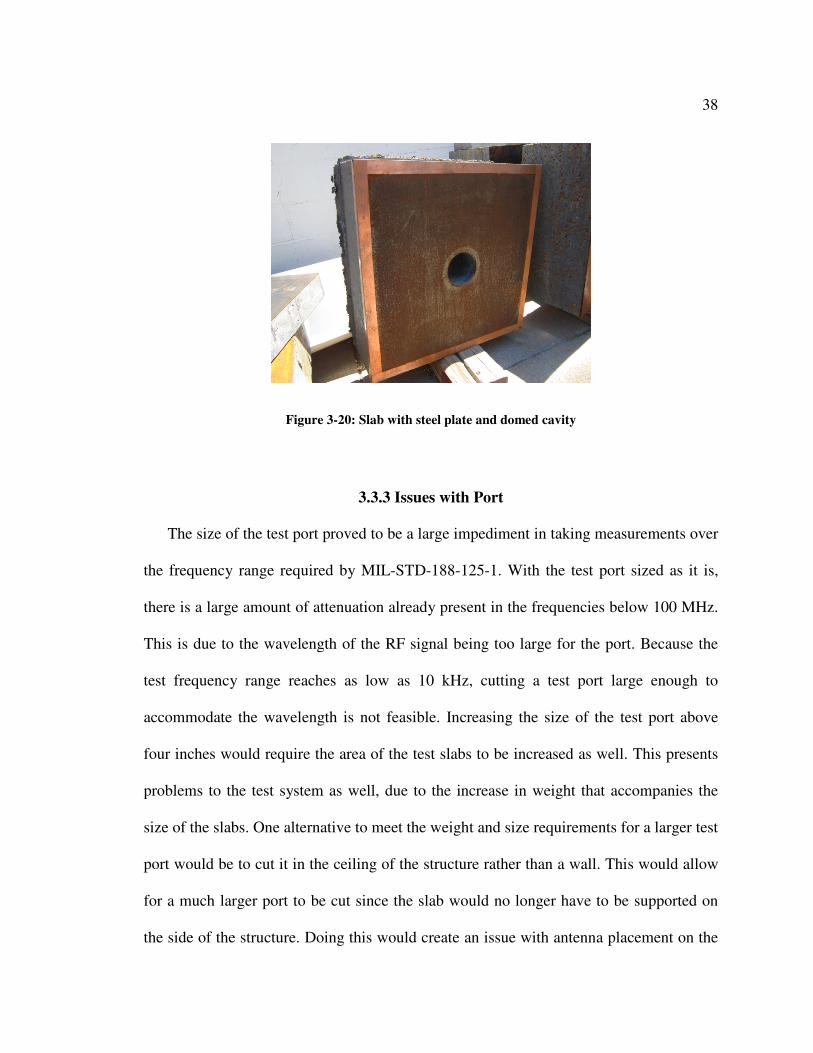
After several rounds of testing, using the 4-inch test port proved to be an issue in
terms of the dynamic range of the test system. Because of the signal attenuation that was
attributed to the test port, a new design for test slabs was created. The succeeding slabs
were produced in the same manner with the steel plate for sealing, but they also included
a domed cavity as seen in Figure 3-20. The cavity allows for a small antenna to be
inserted directly into the conductive concrete slab as seen in Figure 3-20. Using this
smaller antenna, a more accurate measurement of the relative attenuation can be taken
while not losing the desired EM seal between the shelter and concrete slab. One
drawback to this method of construction, however, is that the test configuration no longer
meets MIL-STD-188-125-1.
38
Figure 3-20: Slab with steel plate and domed cavity
3.3.3 Issues with Port
The size of the test port proved to be a large impediment in taking measurements over
the frequency range required by MIL-STD-188-125-1. With the test port sized as it is,
there is a large amount of attenuation already present in the frequencies below 100 MHz.
This is due to the wavelength of the RF signal being too large for the port. Because the
test frequency range reaches as low as 10 kHz, cutting a test port large enough to
accommodate the wavelength is not feasible. Increasing the size of the test port above
four inches would require the area of the test slabs to be increased as well. This presents
problems to the test system as well, due to the increase in weight that accompanies the
size of the slabs. One alternative to meet the weight and size requirements for a larger test
port would be to cut it in the ceiling of the structure rather than a wall. This would allow
for a much larger port to be cut since the slab would no longer have to be supported on
the side of the structure. Doing this would create an issue with antenna placement on the
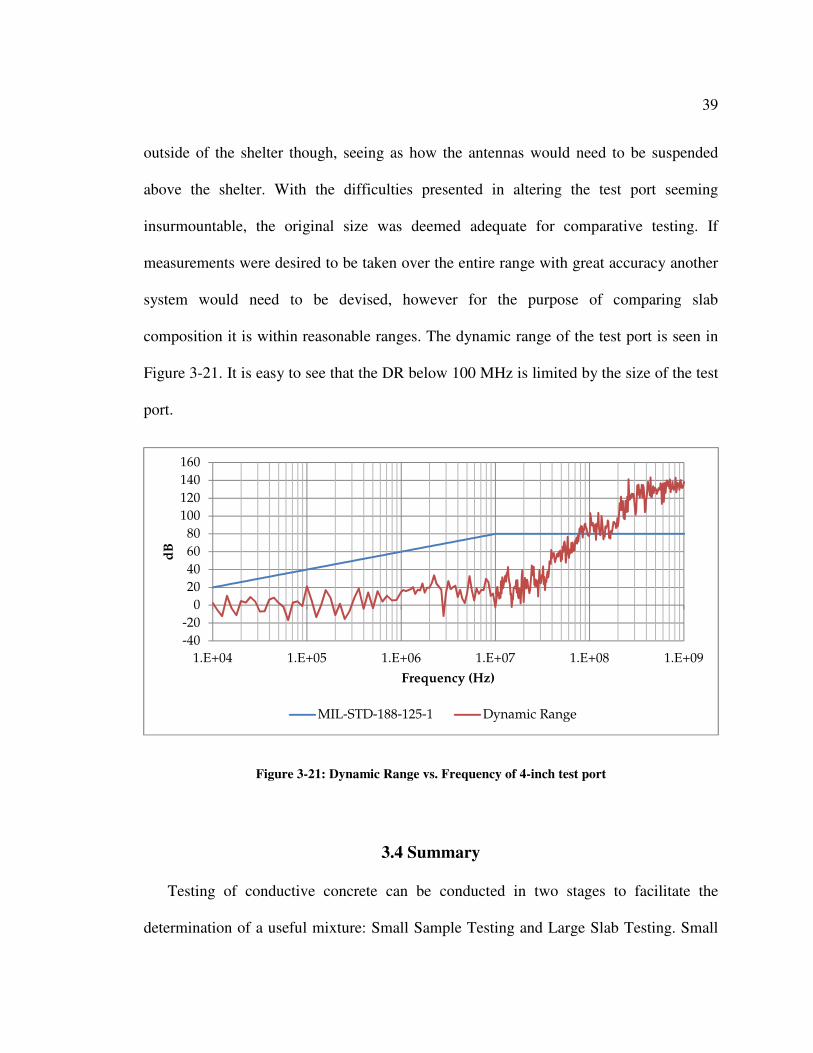
39
outside of the shelter though, seeing as how the antennas would need to be suspended
above the shelter. With the difficulties presented in altering the test port seeming
insurmountable, the original size was deemed adequate for comparative testing. If
measurements were desired to be taken over the entire range with great accuracy another
system would need to be devised, however for the purpose of comparing slab
composition it is within reasonable ranges. The dynamic range of the test port is seen in
Figure 3-21. It is easy to see that the DR below 100 MHz is limited by the size of the test
port.
Figure 3-21: Dynamic Range vs. Frequency of 4-inch test port
3.4 Summary
Testing of conductive concrete can be conducted in two stages to facilitate the
determination of a useful mixture: Small Sample Testing and Large Slab Testing. Small
-40
-20
0
20
40
60
80
100
120
140
160
1.E+04 1.E+05 1.E+06 1.E+07 1.E+08 1.E+09
dB
Frequency (Hz)
MIL-STD-188-125-1 Dynamic Range

40
Sample Testing yields useful comparative information of how the individual components
in the mixture will affect the overall shielding. Large Slab Testing gives a more accurate
measurement of how the conductive concrete will attenuate EM energy. Combining these
two methods enables the development of a conductive concrete mixture that will yield
promising results for EM shielding.
41
4 CHAPTER 4 - Results
4.1 Introduction
Thus far the results of Small Sample Testing and Large Slab Testing with conductive
concrete have been very promising. The results of the Large Slab Testing validated the
method used with the small concrete samples. Observing the EM attenuation of
conductive concrete under actual testing has demonstrated the experimental process that
was developed for gauging the effect of different components on the final concrete
mixture. Much in the same way, the Large Slab Testing is an experimental method at its
core, but further testing on a larger scale will allow for proper standards to be used and
should prove the validity of this testing method. The following results demonstrate that
the mixture derived from Small Sample Testing is on the right track further standardized
testing is warranted.
4.2 Small Sample Testing Results
The results obtained from Small Sample Testing validate the expected attributes of
several different components used in the conductive concrete mixture. The reflective
nature of the steel fibers as well as the absorptive properties of the taconite aggregates
seem to show rather prominently in the tests that were undertaken. Several sets of
samples were created using various combinations of the desired components to determine
a mixture that performed well at attenuating EM energy. Multiple mixtures were used to
determine not only the nature of the components used but also what effect attributes such
as quality and quantity of the selected additives had on the conductive concrete. With
42
respect to the steel fibers, the amount of fibers used was one way to vary their effect, as
well as fibers that were larger, longer, and processed differently. For the taconite, the
concentration of taconite aggregates was varied greatly as well as a foray into how much
the purity of the taconite affected its contribution to the concrete mix. In addition to
varying the components of the concrete, several thicknesses were tested as well. This was
in an effort to extrapolate the difference thickness would make on the effects of different
concrete components. To this end, samples were produced in thicknesses of 0.25 in, 0.5
in, and 0.75 in. These wide-ranging variations gave plenty of possible combinations to be
considered for further testing. After exhaustive Small Sample Testing a promising
mixture was determined and was then used in Large Slab Testing.
It is very important to note that the results reported in this section cannot be taken as
actual SE measurements even though that is the intent of the EM-2107A. It is noticeable
in the data recorded that the limits of the test fixture are stretched to accommodate testing
of concrete samples. The test fixture is normally used to judge the shielding effectiveness
of very thin material samples. The thicknesses of concrete used are much greater than
what would normally be used for testing. To this end, the results of Small Sample Testing
must be regarded as comparison between the various mixtures and not as a measure of
how effective the concrete would be.
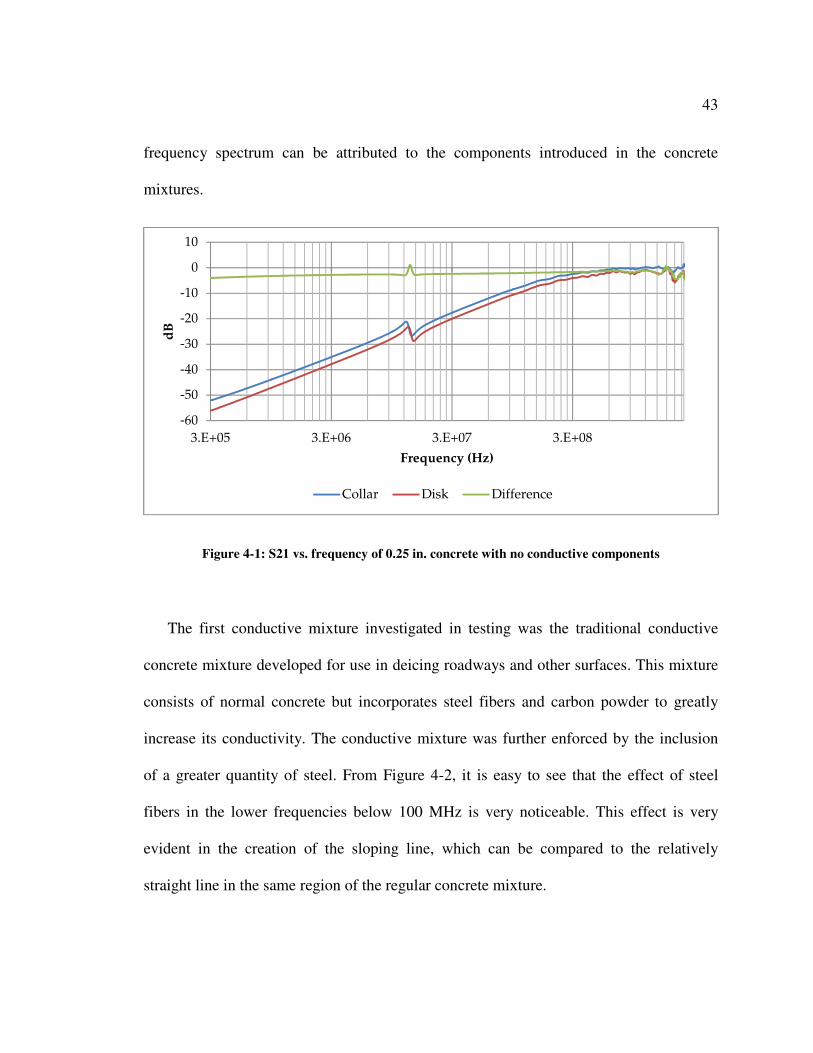
It is easily observed in Figure 4-1, that traditional concrete with no added conductive
components creates little to no attenuation in reaction to EM energy. This gives a good
baseline for comparison of the results obtained from conductive mixtures. Any change in
the amount of energy passing through the concrete or even in the general shape of the
43
frequency spectrum can be attributed to the components introduced in the concrete
mixtures.
Figure 4-1: S21 vs. frequency of 0.25 in. concrete with no conductive components
The first conductive mixture investigated in testing was the traditional conductive
concrete mixture developed for use in deicing roadways and other surfaces. This mixture
consists of normal concrete but incorporates steel fibers and carbon powder to greatly
increase its conductivity. The conductive mixture was further enforced by the inclusion
of a greater quantity of steel. From Figure 4-2, it is easy to see that the effect of steel
fibers in the lower frequencies below 100 MHz is very noticeable. This effect is very
evident in the creation of the sloping line, which can be compared to the relatively
straight line in the same region of the regular concrete mixture.
-60
-50
-40
-30
-20
-10
0
10
3.E+05 3.E+06 3.E+07 3.E+08
dB
Frequency (Hz)
Collar Disk Difference
44
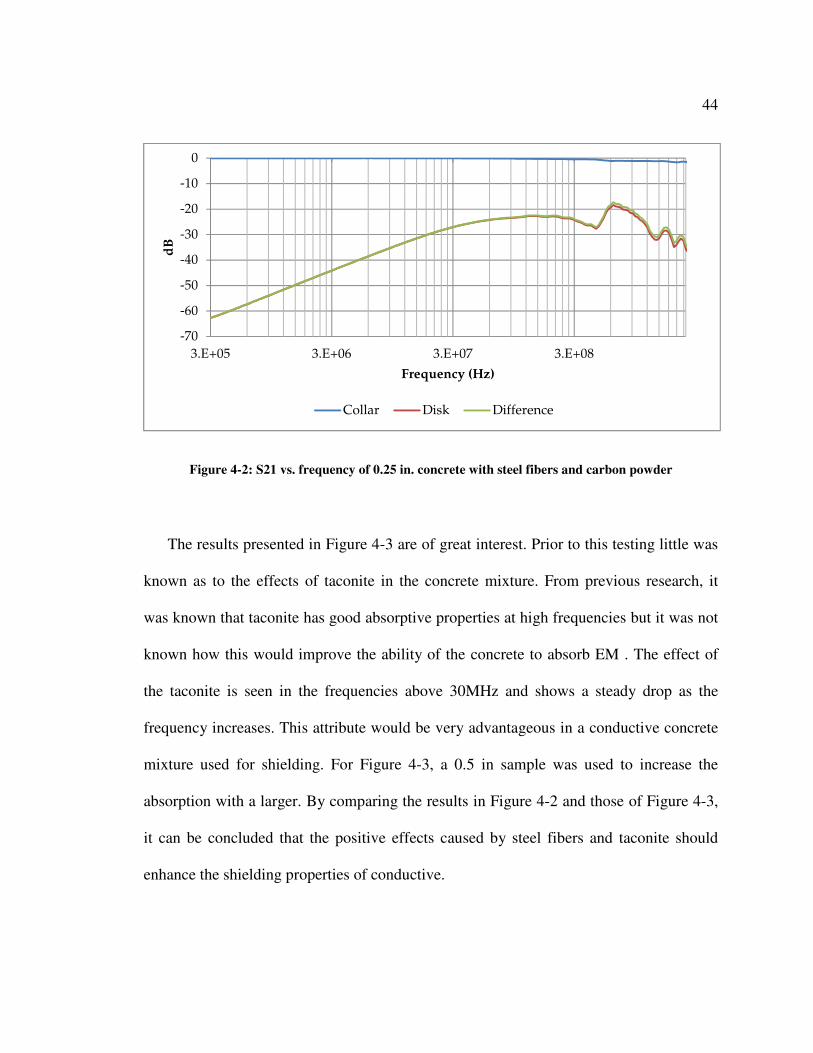
Figure 4-2: S21 vs. frequency of 0.25 in. concrete with steel fibers and carbon powder
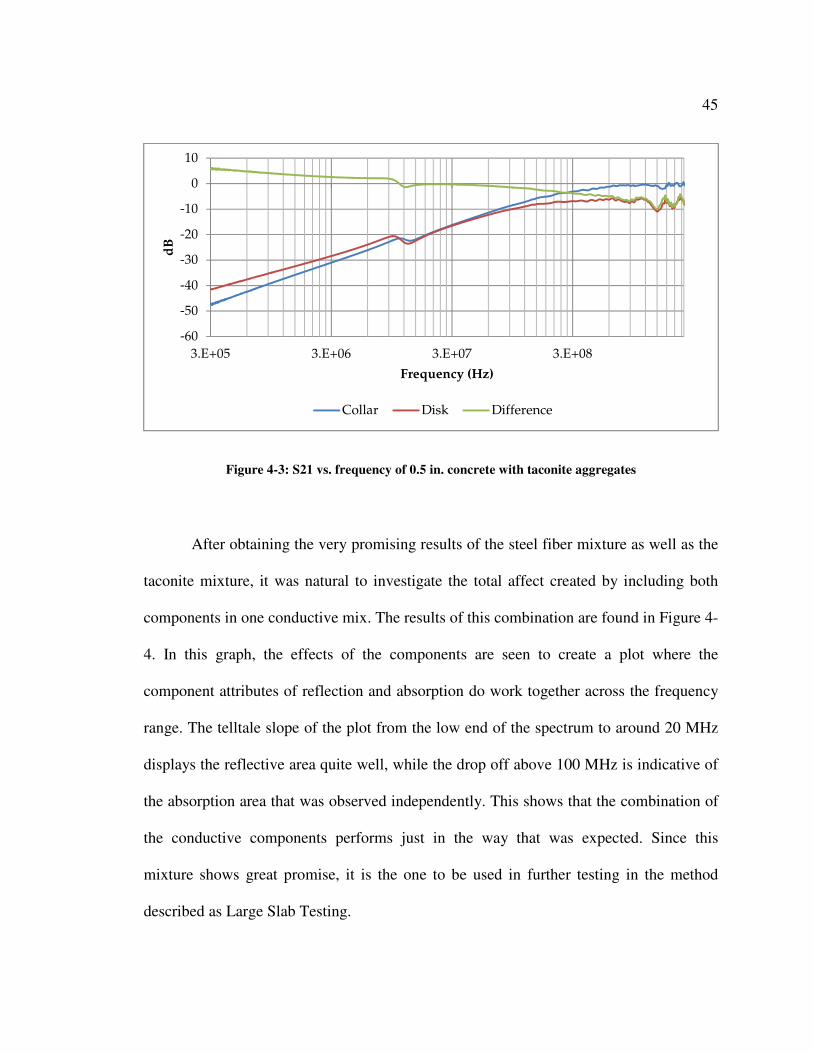
The results presented in Figure 4-3 are of great interest. Prior to this testing little was
known as to the effects of taconite in the concrete mixture. From previous research, it
was known that taconite has good absorptive properties at high frequencies but it was not
known how this would improve the ability of the concrete to absorb EM . The effect of
the taconite is seen in the frequencies above 30MHz and shows a steady drop as the
frequency increases. This attribute would be very advantageous in a conductive concrete
mixture used for shielding. For Figure 4-3, a 0.5 in sample was used to increase the
absorption with a larger. By comparing the results in Figure 4-2 and those of Figure 4-3,
it can be concluded that the positive effects caused by steel fibers and taconite should
enhance the shielding properties of conductive.
-70
-60
-50
-40
-30
-20
-10
0
3.E+05 3.E+06 3.E+07 3.E+08
dB
Frequency (Hz)
Collar Disk Difference
45
Figure 4-3: S21 vs. frequency of 0.5 in. concrete with taconite aggregates
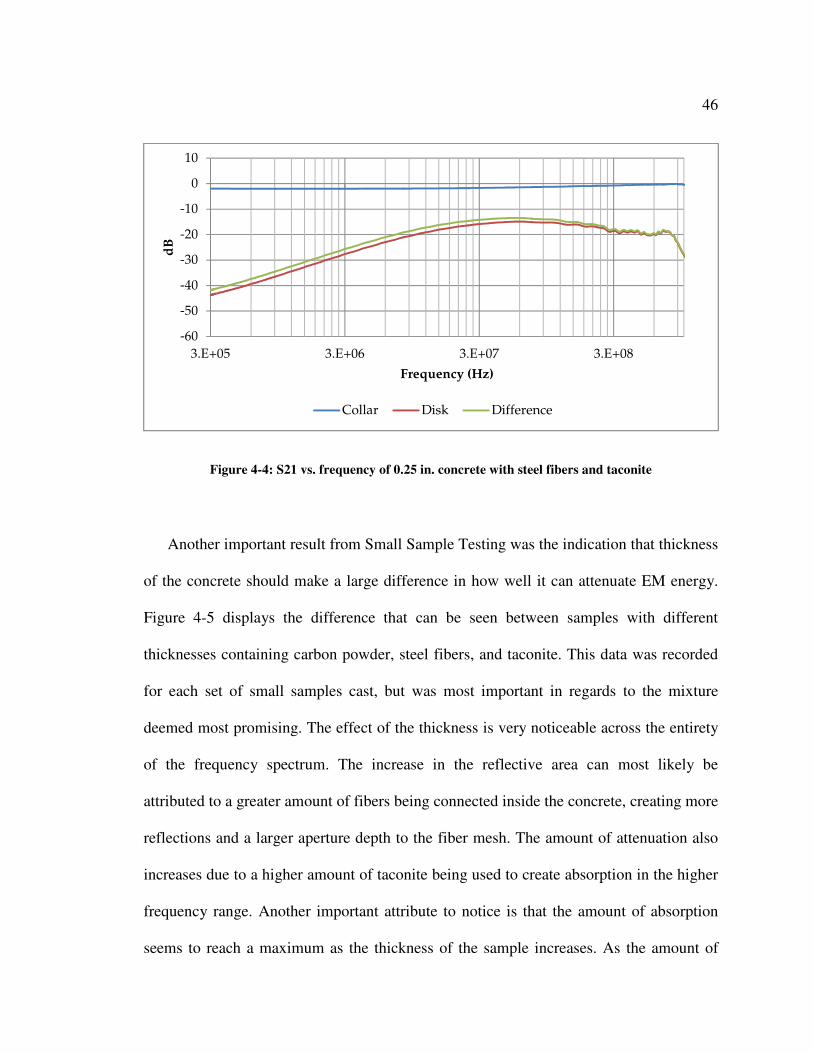
After obtaining the very promising results of the steel fiber mixture as well as the
taconite mixture, it was natural to investigate the total affect created by including both
components in one conductive mix. The results of this combination are found in Figure 4-
4. In this graph, the effects of the components are seen to create a plot where the
component attributes of reflection and absorption do work together across the frequency
range. The telltale slope of the plot from the low end of the spectrum to around 20 MHz
displays the reflective area quite well, while the drop off above 100 MHz is indicative of
the absorption area that was observed independently. This shows that the combination of
the conductive components performs just in the way that was expected. Since this
mixture shows great promise, it is the one to be used in further testing in the method
described as Large Slab Testing.
-60
-50
-40
-30
-20
-10
0
10
3.E+05 3.E+06 3.E+07 3.E+08
dB
Frequency (Hz)
Collar Disk Difference
46
Figure 4-4: S21 vs. frequency of 0.25 in. concrete with steel fibers and taconite
Another important result from Small Sample Testing was the indication that thickness
of the concrete should make a large difference in how well it can attenuate EM energy.
Figure 4-5 displays the difference that can be seen between samples with different
thicknesses containing carbon powder, steel fibers, and taconite. This data was recorded
for each set of small samples cast, but was most important in regards to the mixture
deemed most promising. The effect of the thickness is very noticeable across the entirety
of the frequency spectrum. The increase in the reflective area can most likely be
attributed to a greater amount of fibers being connected inside the concrete, creating more
reflections and a larger aperture depth to the fiber mesh. The amount of attenuation also
increases due to a higher amount of taconite being used to create absorption in the higher
frequency range. Another important attribute to notice is that the amount of absorption
seems to reach a maximum as the thickness of the sample increases. As the amount of
-60
-50
-40
-30
-20
-10
0
10
3.E+05 3.E+06 3.E+07 3.E+08
dB
Frequency (Hz)
Collar Disk Difference
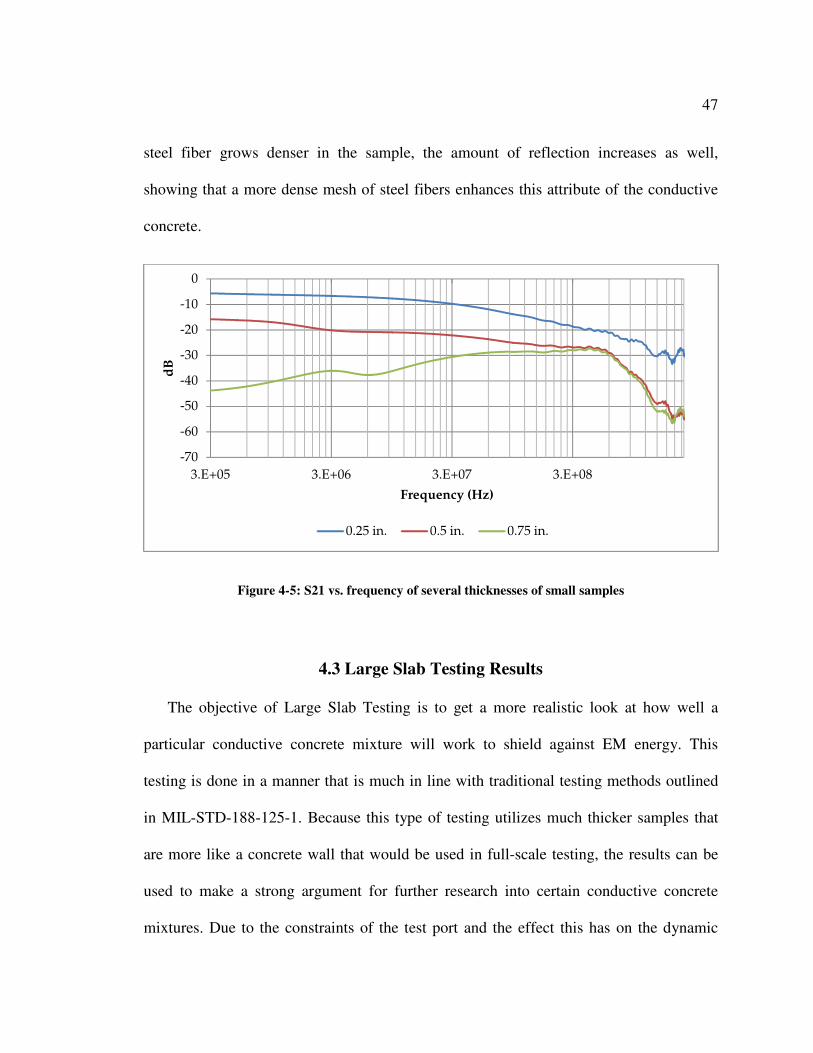
47
steel fiber grows denser in the sample, the amount of reflection increases as well,
showing that a more dense mesh of steel fibers enhances this attribute of the conductive
concrete.
Figure 4-5: S21 vs. frequency of several thicknesses of small samples
4.3 Large Slab Testing Results
The objective of Large Slab Testing is to get a more realistic look at how well a
particular conductive concrete mixture will work to shield against EM energy. This
testing is done in a manner that is much in line with traditional testing methods outlined
in MIL-STD-188-125-1. Because this type of testing utilizes much thicker samples that
are more like a concrete wall that would be used in full-scale testing, the results can be
used to make a strong argument for further research into certain conductive concrete
mixtures. Due to the constraints of the test port and the effect this has on the dynamic
-70
-60
-50
-40
-30
-20
-10
0
3.E+05 3.E+06 3.E+07 3.E+08
dB
Frequency (Hz)
0.25 in. 0.5 in. 0.75 in.
48
range of the system used, the data recorded here should be considered as a measure of the
relative attenuation, and not SE under standardized tests. The most important aspect of
this testing was to show a connection between the data taken in Small Sample Testing
and how the conductive concrete performs in a real-world environment. Throughout the
previous testing with small disks samples there was an obvious effect due to taconite and
it will be shown that this positive data is reinforced through the second round of testing
with larger specimens.
Several slab thicknesses were investigated for the chosen concrete mixtures. Because
of the higher complexity offered by manufacturing the large slabs and the much higher
cost incurred, fewer mixtures were tested using this method. The thicknesses chosen for
Large Slab Testing were decided to be 3 in, 6 in, and 12 in. Larger samples become much
heavier and thus harder to mount in the manner needed for this testing. Due to this issue,
data for the lighter, thinner slabs is more commonly used for comparison between
mixtures.
Two main mixtures were chosen for this round of testing: concrete with steel fibers
and carbon powder, and concrete with steel fibers, carbon powder, and taconite. The first
is once again the starting point for this testing based on the fact that it is the mixture
already chosen for deicing purposes and was the first mix tested in the small sample
manner. This first slab was produced at the 3 in and 6 in thicknesses. Though it has little
bearing on the effectiveness of the desired mixture, this test shows that the data taken in
Small Sample Testing does seem to extrapolate to how the concrete would perform on a
larger scale across the desired frequency spectrum. Figure 4-6 shows the results from this
49
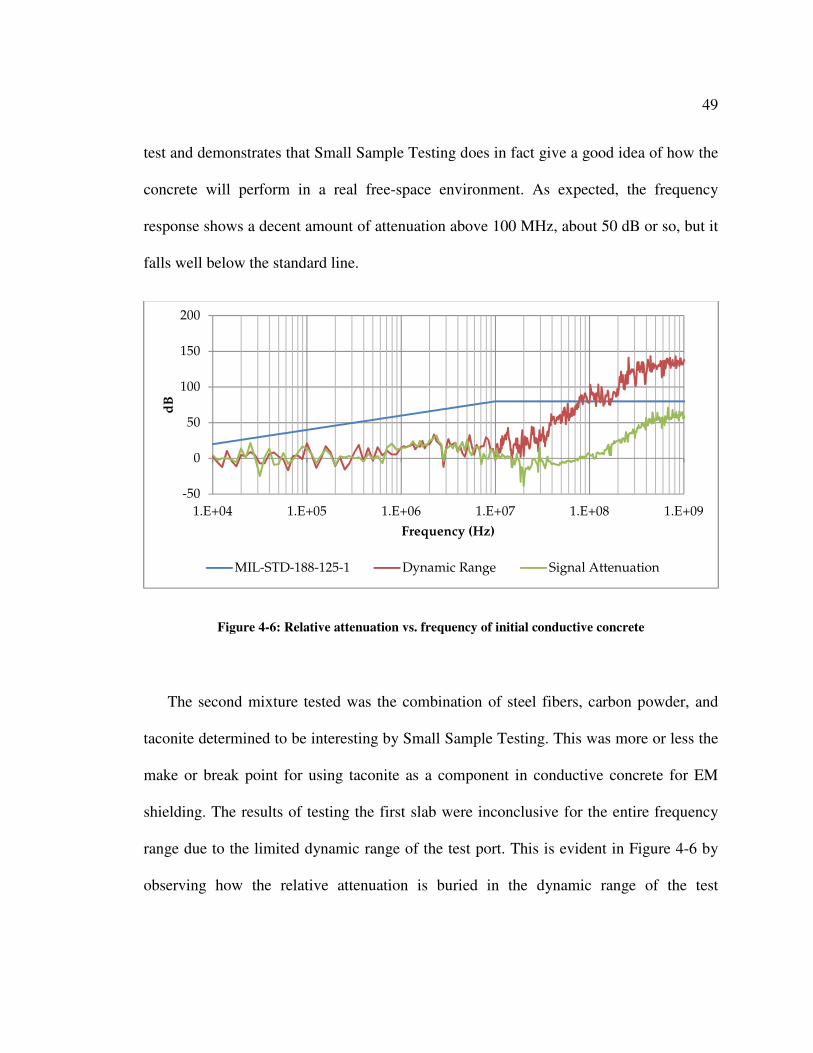
test and demonstrates that Small Sample Testing does in fact give a good idea of how the
concrete will perform in a real free-space environment. As expected, the frequency
response shows a decent amount of attenuation above 100 MHz, about 50 dB or so, but it
falls well below the standard line.
Figure 4-6: Relative attenuation vs. frequency of initial conductive concrete
The second mixture tested was the combination of steel fibers, carbon powder, and
taconite determined to be interesting by Small Sample Testing. This was more or less the
make or break point for using taconite as a component in conductive concrete for EM
shielding. The results of testing the first slab were inconclusive for the entire frequency
range due to the limited dynamic range of the test port. This is evident in Figure 4-6 by
observing how the relative attenuation is buried in the dynamic range of the test
-50
0
50
100
150
200
1.E+04 1.E+05 1.E+06 1.E+07 1.E+08 1.E+09
dB
Frequency (Hz)
MIL-STD-188-125-1 Dynamic Range Signal Attenuation
50
configuration. Without a higher dynamic range for the system, nothing can be said about
the effects of the conductive concrete components on EM shielding.
To counter the issue of test port dynamic range, a new method of pouring the concrete
slabs was devised. The addition of the domed cavity in the concrete slabs, as described in
section 3.2.3, proved to help alleviate this issue. This again modified the testing method
in a way that does not correspond with the standardized testing outlined in MIL-STD-
188-125-1, but the data recorded supported the use of smaller antennas inserted into the
domed cavity. As it is seen in Figure 4-7, the small antennas, specifically the loop and
rubber duck, provide a much higher dynamic range that either exceeds or holds very near
the desired range. This plot also shows that the data collected in the higher frequency
range, above 100 MHz, stays much the same as it was before.
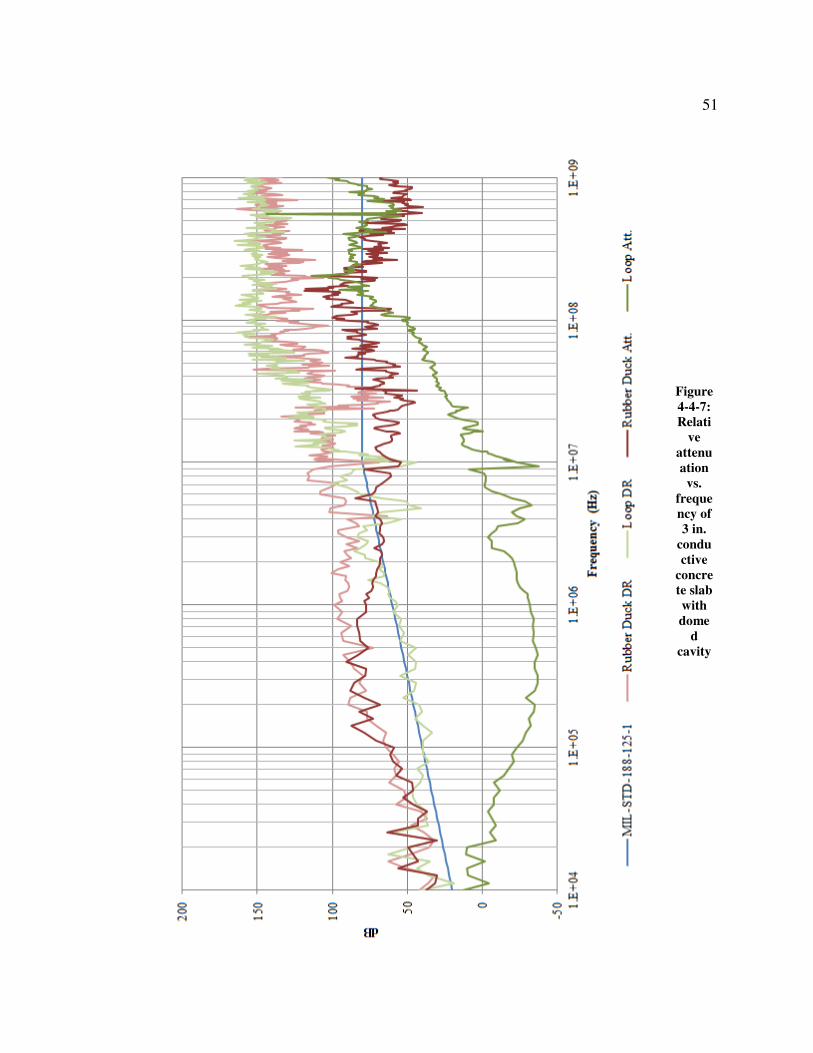
51
Figure
4-4-7:
Relati
ve
attenu
ation
vs.
freque
ncy of
3 in.
condu
ctive
concre
te slab
with
dome
d
cavity
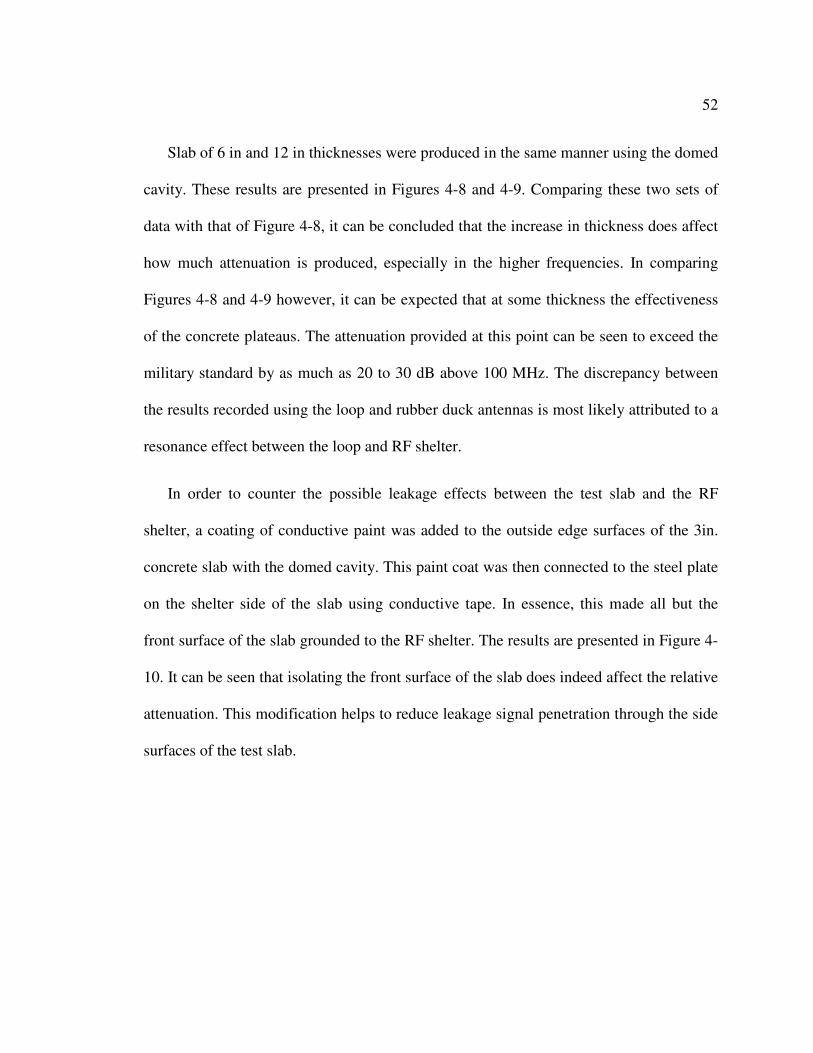
52
Slab of 6 in and 12 in thicknesses were produced in the same manner using the domed
cavity. These results are presented in Figures 4-8 and 4-9. Comparing these two sets of
data with that of Figure 4-8, it can be concluded that the increase in thickness does affect
how much attenuation is produced, especially in the higher frequencies. In comparing
Figures 4-8 and 4-9 however, it can be expected that at some thickness the effectiveness
of the concrete plateaus. The attenuation provided at this point can be seen to exceed the
military standard by as much as 20 to 30 dB above 100 MHz. The discrepancy between
the results recorded using the loop and rubber duck antennas is most likely attributed to a
resonance effect between the loop and RF shelter.
In order to counter the possible leakage effects between the test slab and the RF
shelter, a coating of conductive paint was added to the outside edge surfaces of the 3in.
concrete slab with the domed cavity. This paint coat was then connected to the steel plate
on the shelter side of the slab using conductive tape. In essence, this made all but the
front surface of the slab grounded to the RF shelter. The results are presented in Figure 4-
10. It can be seen that isolating the front surface of the slab does indeed affect the relative
attenuation. This modification helps to reduce leakage signal penetration through the side
surfaces of the test slab.
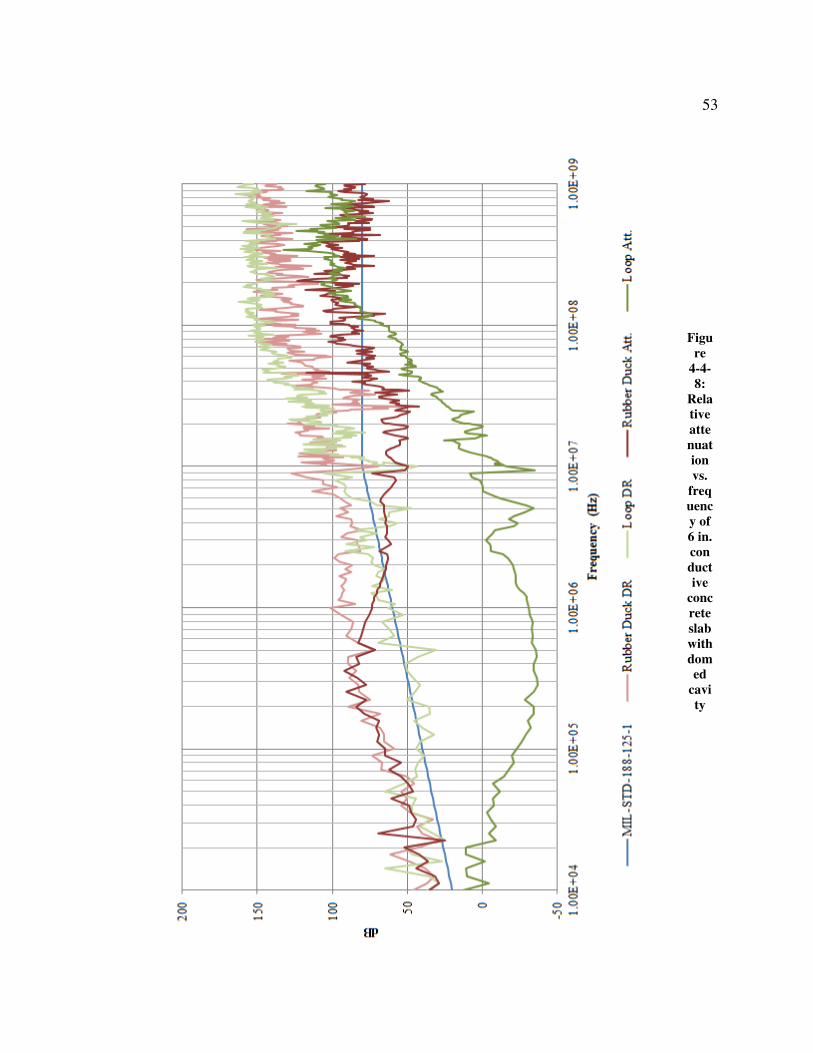
53
Figu
re
4-4-
8:
Rela
tive
atte
nuat
ion
vs.
freq
uenc
y of
6 in.
con
duct
ive
conc
rete
slab
with
dom
ed
cavi
ty
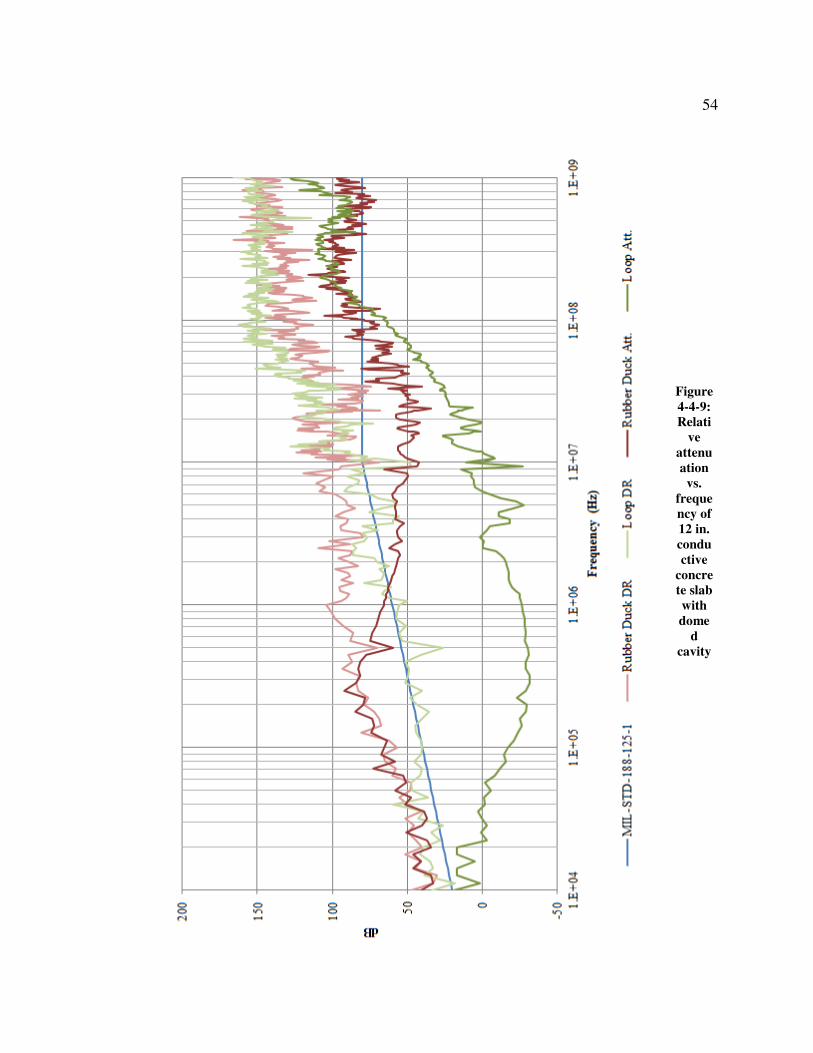
54
Figure
4-4-9:
Relati
ve
attenu
ation
vs.
freque
ncy of
12 in.
condu
ctive
concre
te slab
with
dome
d
cavity
55
Figure
4-10:
Relati
ve
attenu
ation
vs.
freque
ncy of
3 in.
condu
ctive
concre
te slab
with
painte
d sides
56
The overall results of Large Slab Testing are very promising as to the future of
conductive concrete, composed of steel fibers, carbon powder, and taconite, being used
for EM shielding. They also act to validate the use of Small Sample Testing for
determining the possible effect of concrete components at a smaller, more cost-effective
level of testing. From the results produced here, it can be expected that conductive
concrete should work effectively as a shielding.
4.4 Summary
The results provided by Small Sample Testing and Large Slab Testing help to
validate the use of conductive concrete as an EM shield. Through Small Sample Testing,
the effects of individual components were proven and the inclusion of taconite showed a
marked improvement in frequencies higher than 100MHz. Further experiments in Large
Slab Testing helped to reinforce the results of Small Sample Testing as well as
demonstrating how well conductive concrete can attenuate EM energy. The result of
shielding at a level of 80 dB above 100 MHz show that conductive concrete has the
potential to be a promising EM shield material.
57
5 CHAPTER 5 - Conclusions
The objective for this research was to develop a cost-saving method for evaluating
conductive concrete mixtures for the purpose of EM shielding along the lines of MIL-
STD-188-125-1. Through Small Sample Testing, it has been shown that the effects of
conductive concrete components can be observed. Using this method, it can also be
determined what mixture of these components and their derivatives would make a
conductive concrete that is worthy of investigation. In this case, the final mixture that was
most promising was comprised of cement powder, carbon powder, steel fibers, and
taconite. Previously, taconite had not been included in conductive concrete mixtures.
With the most interesting mixture decided, Large Slab Testing was developed to verify
the results of Small Sample Testing and to demonstrate how well the concrete would
perform in more typical testing conditions. Through this testing method, it was verified
that the addition of taconite aggregates did enhance the relative attenuation in the high
frequency range very well, resulting in over 80 dB above 100 MHz. The absorption
provided by the taconite was of greater value than previously anticipated. This testing
method experienced the problem with the degradation of the dynamic range of the test
setup due to the limited size of the RF shelter test port. Adding the domed cavity to the
test slabs alleviated this problem and the testing results were able to demonstrate the
relative attenuation of conductive concrete. By using the small test samples and large test
slabs, a great deal of money and effort was saved in relation to the amount of test data
collected for various mixtures and thicknesses. Investigating the concrete as thoroughly
as it was, would cost a great deal more if conductive concrete rooms had been

58
constructed in the same quantity as the test samples and slabs. These methods also saved
much time in the development process as the time needed to produce the samples and
slab used is much less than what is needed to build even a small structure. Overall, this
research verifies the test methods that have been developed. The results encourage future
research effort to develop conductive concrete as an electromagnetic shielding material
with a great deal of potential in a world so concerned with electronic privacy and safety.
59
6 REFERENCES
[1] K. Casey, "Electromagnetic Shielding by Advanced Composite Materials," Kansas
State University, Manhattan, KS, 1977.
[2] M. Gunasekaran, "A Simplified Low-cost Materials Approach to Shielding in EMC
Applications," in Seventh International Conference on Electromagnetic
Compability, 1990.
[3] L. Huang and S. Ding, "Experimental and Numerical Analyses of Electromagnetic
Attenuation Properties of an L-Shaped Channel Constructed by Electromagnetic
Absorbing Concrete," in Third International Joint Conference on Computational
Science and Optimization, 2010.
[4] T. Shintani and M. Nakamura, "Electromagnetic Wave Shielding Building
Material". United States of America Patent 5422174, 13 August 1993.
[5] G. B. Pye, R. E. Myers, M. R. Arnott, J. J. Beaudoin and P. J. Tumidajski,
"Conductive Concrete Composition". United States of America Patent 6503318, 28
March 2001.
[6] Tarmac, "Electro Conductive Concrete," in IET Seminar on Electromagnetic
Propagation in Structures and Buildings, 2008.
[7] D. D. L. Chung, "Electrically Conductive Cement-Based Materials," Advances in
60
Cement Research, vol. 16, no. 4, pp. 167-176, 2004.
[8] S. Muthusamy and D. D. L. Chung, "Carbon-Fiber Cement-Based Materials for
Electromagnetic Shielding," ACI Materials Journal, vol. 107, no. 6, pp. 602-610,
2010.
[9] J.-M. Chiou, Q. Zheng and D. D. L. Chung, "Electromagnetic Interference Shielding
by Carbon Fibre Reinforced Cement," Composites, vol. 20, no. 4, pp. 379-380, 1989.
[10] S. Wen and D. D. L. Chung, "Electromagnetic Interference Shielding Reaching 70
dB in Steel Fiber Cement," Cement and Concrete Research, vol. 34, no. 2, pp. 329-
332, 2004.
[11] Z. Zhao, X. Cui, L. Li and C. Gao, "Analysis of the Shielding Effectiveness of
Rectangular Concrete Enclosure," in International Symposium on Electromagnetic
Compatibility. EMC 2007, 2007.
[12] A. Ogunsola, U. Reggiani and L. Sandrolini, "Shielding properties of conductive
concrete against transient electromagnetic disturbances," in IEEE International
Conference on Microwaves, Communications, Antennas and Electronics Systems,
2009, 2009.
[13] G. Fei, Z. Bihua, G. Cheng and C. Hailin, "Analysis of Shielding Effectiveness of
Conductive Cement-based Materials in HEMP Environment," in International
Conference on Microwave and Millimeter Wave Technology, 2008.
61
[14] L. Ping, Y. Qi-tao and L. Yun-liang, "Analysis of electromagnetic propagation into
reinforced concrete walls by FEM-PML methods," in International Conference on
Microwave and Millimeter Wave Technology, 2008, 2008.
[15] R. A. Dalke, C. L. Holloway, P. McKenna, M. Johansson and A. S. Ali, "Effects of
Reinforced Concrete Structures on RF Communications," IEEE Transactions on
Electromagnetic Compatibility, vol. 42, no. 4, pp. 486-496, 2000.
[16] ASTM Standard 4935-10, Standard Test Method for Measuring the Electromagnetic
Shielding Effectiveness of Planar Materials, West Conshohocken, Pennsylvania:
www.astm.org.
[17] Electro-Metrics, "2107A-New-Version," [Online]. Available: www.electro-
metrics.com. [Accessed 8 July 2012].
[18] Department of Defense, "MIL-STD-188-125-1," 7 April 2005. [Online]. Available:
http://www.wbdg.org/ccb/FEDMIL/std188_125_1.pdf. [Accessed 5 July 2012].
[19] D. Björklöf, "Shielding for EMC," 1999. [Online]. Available: http://www.ce-
mag.com/99ARG/Bjorklof137.html. [Accessed 5 July 2012].
[20] C. R. Paul, "Shielding Effectiveness," in Introduction to Electromagnetic
Compatibility, Hoboken, New Jersey, John Wiley & Sons, Inc., 2006, pp. 718-721.
[21] K. F. Casey, "Electromagnetic Shielding Behavior of Wire-Mesh Screens," IEEE
62
Transactions on Electromagnetic Compatibility, vol. 30, no. 3, pp. 298-306, 1988.
[22] Practical Systems Engineering: Praxsym, "PAMS-C Datasheet," 2012. [Online].
Available: http://www.praxsym.com/documents/PAMS-Cdatasheet.pdf. [Accessed
22 July 2012].
Related Documents