Conducting polymers functionalized carbon nanotubes for applications in the rechargeable lithium batteries M. Baibarac*, I. Baltog, T. Velula, National Institute of Materials Physics, Atomistilor Street 105 Bis, Magurele, PO Box MG-7, R-77125, Romania (E-mail: [email protected]) P. Gomez Romero Centre d’Investigacio en Nanociencia i Nanotecnologia, CIN2 (CSIC-ICN), Campus de la UAB, 08193, Bellaterra,Spain S. Lefrant Institut des Materiaux Jean Rouxel, 2 rue de la Houssiniere, Nantes, France Abstract This work deals with recent progress in the rechargeable lithium batteries field using as active material composites based on conducting polymers (CPs) and carbon nanotubes (CNTs). A brief review of the synthesis and vibrational properties of composites of the type poly (3,4- ethylenedioxythiophene)/ single-walled carbon nanotubes (PEDOT/SWNTs) and polydiphenylamine (PDPA)/SWNTs is shown in this work. The performances of the two composites and the mechanism which explain the insertion/de-insertion of Li + ions during charge/discharge tests of cells using as active materials PEDOT and PDPA functionalized SWNTs, respectively is reported. 1. Introduction In the last ten years many publications have gathered the tremendous progress made in the knowledge of physical and chemical properties of CNTs and their composites having conjugated polymers (CPs) as host matrices [1-5]. This is a consequence of the various and numerous applications reported for CPs/CNTs composites in different fields such as those of supercapacitors, rechargeable batteries, sensors, photovoltaic cells and photodiodes, optical limiting devices, solar cells, high- resolution printable conductors, electromagnetic absorbers and, last but not least, advanced transistors [3,5]. In this context, the first studies concerning the use of the CPs/CNTs composites as active materials in lithium rechargeable batteries have started in 2006 [6]. Thus, using an electrolytic solution containing LiPF 6 , a current density of 10 mA g -1 and a potential range between 1 and 3.5 V, during the first 20th charge–discharge cycles, high specific discharge capacities of about 45 and 115 mA h g -1 were reported for a positive electrode based on single-walled carbon nanotubes (SWNTs) and multi-

Welcome message from author
This document is posted to help you gain knowledge. Please leave a comment to let me know what you think about it! Share it to your friends and learn new things together.
Transcript
Conducting polymers functionalized carbon nanotubes for
applications in the rechargeable lithium batteries
M. Baibarac*, I. Baltog, T. Velula, National Institute of Materials Physics, Atomistilor Street 105 Bis, Magurele,
PO Box MG-7, R-77125, Romania (E-mail: [email protected])
P. Gomez Romero Centre d’Investigacio en Nanociencia i Nanotecnologia, CIN2 (CSIC-ICN),
Campus de la UAB, 08193, Bellaterra,Spain
S. Lefrant Institut des Materiaux Jean Rouxel, 2 rue de la Houssiniere, Nantes, France
Abstract
This work deals with recent progress in the rechargeable lithium batteries field using as active
material composites based on conducting polymers (CPs) and carbon nanotubes (CNTs). A brief
review of the synthesis and vibrational properties of composites of the type poly (3,4-
ethylenedioxythiophene)/ single-walled carbon nanotubes (PEDOT/SWNTs) and polydiphenylamine
(PDPA)/SWNTs is shown in this work. The performances of the two composites and the mechanism
which explain the insertion/de-insertion of Li+ ions during charge/discharge tests of cells using as
active materials PEDOT and PDPA functionalized SWNTs, respectively is reported.
1. Introduction
In the last ten years many publications have gathered the tremendous progress made in the
knowledge of physical and chemical properties of CNTs and their composites having conjugated
polymers (CPs) as host matrices [1-5]. This is a consequence of the various and numerous applications
reported for CPs/CNTs composites in different fields such as those of supercapacitors, rechargeable
batteries, sensors, photovoltaic cells and photodiodes, optical limiting devices, solar cells, high-
resolution printable conductors, electromagnetic absorbers and, last but not least, advanced transistors
[3,5]. In this context, the first studies concerning the use of the CPs/CNTs composites as active
materials in lithium rechargeable batteries have started in 2006 [6]. Thus, using an electrolytic solution
containing LiPF6, a current density of 10 mA g-1 and a potential range between 1 and 3.5 V, during the
first 20th charge–discharge cycles, high specific discharge capacities of about 45 and 115 mA h g-1
were reported for a positive electrode based on single-walled carbon nanotubes (SWNTs) and multi-

wall carbon nanotubes (MWNTs) functionalized with poly N-vinyl carbazole (PVK), respectively. M.
Baibarac et al. report a striking difference between PVK/SWNTs and PVK/MWNTs composites in the
range of 1.5-2.5 V. In the case of PVK/MWNTs composite, they invoke a two stage interaction
process, which increases in intensity with the number of cycles. These results indicate that the
electrochemical performance of the PVK battery is much improved when a CNT functionalized with
PVK composite is used as active material because of the apparent synergy between the host polymeric
matrix and guest nanoparticles [6]. One year later, J. Chen et al. indicate that a membrane electrode
based on “free-standing” aligned carbon nanotubes (ACN), PEDOT and polyvinilidene fluoride
(PVDF), which is lightweight, flexible, highly conductive and mechanically robust, can be easily
fabricated into a rechargeable battery without using a metal substrate or binder [7]. In this Li ion
battery, the weight of the electrode is reduced significantly compared with a conventional electrode
made by coating a mixture containing an active material onto the metal substrate. The results published
in Ref. 8 show that the capacity of the ACN/PEDOT/PVDF electrode is 50% higher than that observed
for free-standing SWNT paper. In fact, a highly stable dischargeable capacity of 265 mA hg-1 was
reported after 50 cycles when ACN/PEDOT/PVDF electrode in a Li-ion cell was tested under a
constant current density of 0.1 mA cm-2. This is significantly higher than the value obtained previously
for SWNT paper (173 mA h g-1) under identical working conditions [9]. This result was attributed to
the high accessible surface area (140 cm2/cm2) of the aligned CNTs, which coupled to the robust
polymer layer provides a mechanically stable array. In 2009, the performance of polyaniline (PANI)
/MWNTs composites as cathode for rechargeable lithium batteries was tested by B.L. He et al. [5]. The
discharge capacity of PANI/MWNTs composites is high as 122.8 mA h g−1 compared to 98.9 mA h g−1
for PANI. The composites show a stable discharge behavior, while the discharge capacity of pure
PANI exhibits during 50 cycles a decreasing tendency. The results reported of B.L. He et al. [10] are
much better than those obtained on PANI nanotubes or nanofibers as the cathode for lithium/PANI
rechargeable batteries reported by Wang et al. [11]. The main reason may be that the addition of
MWNTs to PANI makes the composites similar to an interwoven fibrous structure, which improves the
conductivity and facilitates access of the electrolyte. A particular result of these studies is that the
specific capacity and coulombic efficiency values are much higher than other rechargeable lithium-
PANI cells assembled with gel polymer electrolyte [12, 13]. The promising results reported until now
in the Li rechargeable batteries field make this application of primary importance. Therefore, in this
paper, our attention is concentrated on testing the PEDOT/SWNTs and PDPA/SWNTs composites as
an active material for cathodes in Li rechargeable batteries.

2. Experimental
Composites based on PEDOT and SWNTs were synthesized by the chemical polymerization of
EDOT in the presence of SWNTs according to Ref. [14]. Despite the low EDOT solubility in water, the
chemical polymerization was carried out in aqueous solution containing 2.1 g dm-3 of monomer. The
oxidizing agent, i.e. FeCl3, was added to the monomer solution, and the whole mixture was stirred for
24 hours at 250C. Using stoichiometric amounts of FeCl3, slow rates of polymerization were noted,
with low yields of about 14% after 24 hours. [14] According to the paper of R. Corradi et al. [14], an
increase of the PEDOT yield was obtained by a synthesis carried out with an excess of oxidant (from
2.33:1 up to 25.63:1, i.e., ten fold excess over the stoichiometric amount). In this case, for the chemical
synthesis of PEDOT, a mass of monomer of 0.1 g was used. Afterwards, the dark blue PEDOT
suspensions was washed with 1000 ml of de-ionized water and then dried under vacuum at 650C. For
the PEDOT/SWNTs composite synthesis, different masses of CNs, i.e., 0.005, 0.01 and 0.02 g were
added to the reaction mixture.
Composites based on PDPA and SWNTs were obtained by the electrochemical polymerization
of DPA in a conventional three-electrode one-compartment cell having Pt or a SWNT film deposited
onto a 1 cm2 Pt plate as working electrodes. The counter electrode was a spiral Pt wire. The area of
counter electrode was greater than that of the working electrode. The potential of the working electrode
was measured vs. saturated calomel reference electrode (SCE). The polymerization solution consisted
of 10-2 M DPA and 1M HCl in DMF-H2O (1:1 vol). PDPA was electrochemically synthesized by
cyclic voltammetry in the potential range (+100; +960) mV vs. SCE with a sweep rate varied from 5 to
100 mV s-1 applied both on a blank Pt electrode and a Pt electrode coated with a SWNTs film. The
electrochemical measurements were carried out using a potentiostat/galvanostat, VOLTALAB 80
model, from Radiometer Analytical.
Surface enhanced Raman scattering (SERS) spectra were recorded at room temperature and in
ambient air in a backscattering geometry under excitation wavelengths of 676 and 1064 nm. For the
two excitation wavelengths, 676 and 1064 nm, we used a spectrophotometer Jobin Yvon T 64000 and a
FT Raman Bruker RFS 100, respectively.
Fourier Transform Infrared (FTIR) spectra in the attenuated total reflexion (ATR) geometry
were recorded using a Bruker FTIR spectrophotometer, Vertex 70 model.
Charge/discharge tests were carried out using a multichannel potentiostat-galvanostat (Arbin
Instruments, College Station, USA) for two-electrode cells. To fabricate the positive electrode
(cathode), we used the PEDOT/SWNTs or PDPA/SWNTs composite or CPs of the type PEDOT or

PDPA (80 wt.% as active material), poly(vinylidene fluoride) (PVDF; 5 wt%) as binder, super-P
carbon (15 wt.%), dibutyl phthalate (DBP, 2 drops) and acetone (1 ml), all of which were mixed and
stirred for 12 h to yield a homogeneous paste. The paste was tape-cast onto a glass surface and acetone
allowed to evaporate. After peeling off the resulting film, it was washed with diethyl ether in order to
remove the DBP. Lithium foil 0.38 mm thick with an area of 2.03 cm2 was used as the negative
electrode (anode). A solution of LiPF6 (1M) in a 50:50 mixture (by volume) of ethylene carbonate and
dimethyl carbonate was used as the electrolyte. Cell assembly was carried out under a purified argon
atmosphere in a MBraun glove box. Electrochemical testing of the cells was performed using constant-
current cycles. The current density was 10 mA g-1. The cells were cycled between: i) 2 and 4.4 V in the
case of PEDOT and the PEDOT/SWNTs composite and ii) 2 and 4 V in the case of PDPA and the
PDPA/SWNTs composite.
3. Results and discussions
3.1 Composites based on PEDOT and SWNTs
Figs. 1 and 2 show SERS spectra of SWNTs films at excitation wavelengths 1064 and 676 nm,
before and after functionalization process with PEDOT. Spectra exhibit the well known two main
groups of bands whose relative intensities and peak positions vary with excitation wavelength. The first
group, from 100 to 350 cm-1 is associated with the radial breathing modes (RBM). The intensity and
peak position of these bands, related to the tube diameter through the relation ν (cm-1) = 223.75/d (nm)
[1] are very sensitive to the excitation wavelength. The two strong bands situated at 174 and 164 cm-1,
observed at excitation wavelengths of 676 and 1064 nm, indicate that resonance occurs over a narrow
range of diameters of about 1.36 and 1.27 nm, respectively. At the excitation wavelength of 1064 nm,
the two Raman lines at 164 and 176 cm-1 have been associated with the RBM activated in isolated and
bundled nanotubes, respectively.[15] The second group, consisting of the TM and D bands, is found
from 1000 to 1700 cm-1. These bands are not only related to the nanotube structure; the former, peaking
at about 1595 cm-1 and attributed to the tangential vibration mode, is also seen in the Raman spectra of
other graphitic materials such as HOPG. [1] The analysis of the group of bands associated with TM
vibration at 676 nm excitation wavelength reveals four components, three of Lorentzian type at about
1606, 1588 and 1560 cm-1, with widths at half maximum of about 32, 26 and 26 cm-1 and the fourth, at
about 1542 cm-1, asymmetrical in its lower energy side. This Breit-Wigner-Fano (BWF) profile has
been related until recently as originating from an electron-phonon interaction [1], but recent
calculations describe it as the G- band which is in metallic tubes strongly dependent upon the tube

diameters [16]. The D band is frequently associated with a disorder in the graphitic lattice or defects in
nanotubes. [1]
200 400 600 800 1000 1200 1400 1600
200 400 600 800 1000 1200 1400 1600
176
a)
Wavenumbers/ cm-1
1263 13
70
PEDOT
1426
1529
442
176
164
PEDOT/SWNTs
1263
315
1595
1529
1430
1370
1108
1020993
85870
552644
2
1263
1595
PEDOT:SWNT=1:1
SWNT
140
164
176
164
Nor
mal
ized
Ram
an In
tens
ity
b)SERS
Raman
1443
1263992861704575527441
1417
124798785
2436
Fig. 1 SERS spectra (λexc = 1064 nm) of the films of SWNTs, PEDOT in undoped state and composite materials obtained
by: i) the chemical synthesis of 0.1 g EDOT and 0.02 g SWNTs (PEDOT/SWNTs) and ii) the mixture of the two
constituents in the massic ratio of PEDOT:SWNTs of 1:1 (a). Raman and SERS spectra of PEDOT doped with FeCl4- ions
(b).
Figs. 1 and 2 also show the SERS spectra of the PEDOT film. We note that the main Raman
lines of the PEDOT are localized at 439-575, 698, 860, 990, 1250, 1365, 1412-1450, and 1545 cm-1,
being associated to the following vibration modes: oxyethylene ring deformation, symmetric C-S-C
deformation, asymmetric C-S-C deformation, oxyethylene ring deformation, Cα- Cα’ stretching +C-H

bending, Cβ- Cβ’ stretching, symmetric C-C stretching and asymmetric C-C stretching, respectively
[17] An interesting behavior of the C=C stretching vibration of PEDOT is worth noting. This band,
located at 1424 cm-1 in the un-doped polymer is firstly shifted to 1410 cm-1 and then to 1450 cm-1 with
the doping level. [17]
1000 1200 1400 16000
1
2
3
4
a
1365
Wavenumber / cm-1
1430
1538
1538
1538
3
2
1
Ram
an i
nten
sity
(arb
.uni
ts)
1000 1200 1400 16000
1
1362
1260
1530
1430
SERS: Au substrateλexcit = 676.4 nm
c
1000 1200 1400 16000
2
4
6
8
2
1
b
1365
1251
1538
1430
Fig. 2 SERS spectra (λexc = 676 nm) of films of SWNTs (curve 1a), PEDOT in un-doped state (c) and the composite
materials obtained by the chemical synthesis of i) 0.1 g EDOT and 0.01 g SWNTs (2a) and ii) 0.1 g EDOT and 0.02 g
SWNTs (3a). Curves 1b and 2b correspond to SERS spectra of composites obtained by the mixture of the two constituents
PEDOT:SWNTs in the massic ratio of 1:1 and 2:1, respectively.
Concerning the C=C stretching vibration of PEDOT, Fig. 1 shows an intriguing experimental
fact. The position of Raman band associated to the C=C stretching vibration is changed when the

Raman spectrum is carried out on a PEDOT sample in the powder state and thin film, respectively (of.
ca. 50 nm) deposited on the rough Au support. At first sight, this variation is difficult to understand.
However, the modification can be explained if one takes into account the mechanisms which govern
SERS. It is well known that the SERS spectrum originates in two basic enhancement mechanisms: i)
electromagnetic, achieved by the resonant excitation of the surface plasmons and ii) chemical, mainly
due to charge transfer processes between the metallic substrate and adsorbed molecules. In our case, we
think that electrons of the SERS metal support, excited by the incident photons, are transferred by
tunneling into an excited state of the adsorbed polymer. In this way, the charge transfer process induces
another equilibrium geometry in the excited molecule. The return of the electron to the metal leaves
PEDOT into another vibrational excited state than the partially doped polymer molecule leading to the
emission of a Raman shifted phonon. Consequently, the SERS spectrum of PEDOT deposited on the
Au support appears as being different from the standard Raman spectrum because of the symmetry
lowering effect produced by the laser excitation. We note that such variations for the PEDOT films
with thickness bigger of 100 nm are not observed. Therefore, in all SERS studies are used the films
with thickness around of 120 nm. As observed in Figs. 1 and 2, the different SERS spectra for the
PEDOT/SWNTs composites are obtained, resulting from the mixture of the two constituents and from
the chemical polymerization of EDOT in the presence of CNTs,. The main variations observed in the
SERS spectra from Figs. 1 and 2 are: i) in comparison with SERS spectra of SWNTs, an enlargement
of the RBM band at 1064 nm excitation wavelength is observed in the case of the PEDOT/SWNTs
composite obtained by chemical polymerization of monomers in the presence of CNTs. A detailed
analysis of the 100 - 250 cm-1 spectral range shows that this band is formed from three Raman lines
localized at 140, 164 and 176 cm-1. We note that all these Raman lines belong to SWNTs. Besides, for
the chemical synthesis, a change of the ratio between the intensities of the Raman bands with the
maximum situated at 164 and 1595 cm-1 is noted, too. When mixing the two constituents (PEDOT and
SWNTs) is carried out, a significant decrease in the intensity of the RBM band is observed. At the 676
nm excitation wavelength, an increase in the intensity of the G- component, independently on the way
of preparation of the PEDOT/SWNTs composite, is observed; ii) in comparison with SERS
spectrum of PEDOT doped with FeCl4- ions, one observes that for the PEDOT/SWNTs composite: a)
in the case of the two synthesis ways, the most intense Raman line is peaked at 1430 cm-1 not longer by
those of the un-doped polymer; b) the ratio between the intensities of the Raman bands with maxima at
1263 and 699-705 cm-1 (I1260/I699-705) changes from 3:1 to 1:2 for the PEDOT/SWNTs composite
prepared by the mixture route and chemical polymerization, respectively; c) in the case of the chemical
polymerization of EDOT in the presence of SWNTs, the increase of the Raman bands intensity located

at 442-526 and 705 cm-1 indicate the presence of some steric hindrance effects. An explanation for all
these variations is not easy to be given at the present time. In our opinion, the increase in the intensity
of G- component indicates the existence of an electron-phonon interaction enhanced by a
supplementary roping of nanotubes through their functionalization with conducting polymer molecules.
In the case of the chemical polymerization of EDOT in the presence of SWNTs, we think that a
covalent functionalization takes place according with the following reaction from Scheme 1.
Scheme 1 The chemical polymerization reaction of EDOT in the presence of FeCl3 and SWNTs
The reaction shown in Scheme 1 is supported by the following experimental facts: i) the
increase in the intensity of the deformation vibration modes of the oxyethylene ring and the C-S-C
bond noticed by the Raman line at 442-526 and 705 cm-1, respectively as a result of the steric hindrance
effects induced by the formation of the new covalent bonds between PEDOT and SWNTs; ii) the
localization of the most intense Raman line of PEDOT at 1430 cm-1, situated always for un-doped
polymer at 1426 cm-1 suggests that the reaction product contains mainly PEDOT covalently
functionalized SWNTs and to a smaller extent PEDOT doped with FeCl4- ions; iii) the appearance of
the Raman line at 140 cm-1 is a consequence of the formation of a new covalent bond between PEDOT
and SWNTs.
For the availability of high power density battery systems, it is important to increase the active
surface area of the electrodes. Such an example is shown in this paper by the use of new cathode active
materials based on the composites of the type PEDOT/SWNTs. Our studies concerning the use of the
derivatives of PEDOT in the Li rechargeable batteries field indicate better performances than for the
cell Li/LiPF6/PEDOT by substituting the polymer with the PEDOT/SWNTs composite obtained by
chemical polymerization of EDOT in the presence of CNTs. Fig. 3 is rather illustrative in this respect.
S
O O
4n + 5n C=C
SWNT[ ]
+ 8n FeCl3
OO
S( )+ n
FeCl4-
+n
)(S
O O
O O
S
( )n
C C
PEDOT-SWNTs[ ]
+ 2n HFeCl4 + 4n SWNTs. FeCl2
+ 3nH22
[ ]n

0 5 10 15 20 25 30
25
50
75
100
0 5 10 15 20 25 30200
400
600
800
6000 9000 12000 15000 18000 21000 240002
3
4
2,0 2,5 3,0 3,5 4,0 4,5
-6,0x10⁻⁶
-4,0x10⁻⁶
-2,0x10⁻⁶
0,0
2,0x10⁻⁶
4,0x10⁻⁶
6,0x10⁻⁶
8,0x10⁻⁶
2,0 2,5 3,0 3,5 4,0 4,5
-4,0x10⁻⁶
-2,0x10⁻⁶
0,0
2,0x10⁻⁶
4,0x10⁻⁶
6,0x10⁻⁶
8,0x10⁻⁶
1,0x10⁻⁵
2800003200003600004000004400004800002
3
4
a1
Cap
acity
(mA
h/g)
Cyclic numbers
PEDOT Charge Discharge
b1
Cyclic numbers
PEDOT/SWNTs Charge Discharge
a3PEDOT
Volta
ge (V
)
Time (sec)
a2
PEDOT
Diff
eren
tial c
apac
ity
Voltage (V) vs. Li+/Li
5th cycle 10th cycle 20th cycle
b2
PEDOT/SWNTs
Voltage (V) vs. Li+/Li
5th cycle 10th cycle 20th cycle
b3PEDOT/SWNTs
Time (sec)
Fig. 3 The evolution of specific capacities vs. cycle number for PEDOT and PEDOT functionalized SWNTs electrodes in
lithium cells is shown in a1 and b1, respectively. Fig. a2 and b2 show incremental capacity curves (for the 5th cycle (open
circles), the 10th cycle (full circles) and the 20th cycle (open square) of PEDOT and PEDOT functionalized SWNTs battery.
Fig. a3 and b3 show the voltage profile of PEDOT and PEDOT functionalized SWNTs batteries.
The first remarkable result is the very large specific capacity of the hybrid PEDOT/SWNT
material in the first cycle (close to 800 mAh/g) which decreases and gets stabilized above 200mAh/g.
Indeed, for the two compounds (PEDOT doped with FeCl4- ions and PEDOT functionalized SWNTs), a
significant decrease of the capacity during the first twelve charge-discharge cycles is observed.
Afterwards, an increase of the number of charge-discharge cycles leads to a smaller decrease of the cell
capacity in the case of battery having PEDOT functionalized SWNTs as active cathode material. We
believe that these results can be related to a more pronounced degradation of the PEDOT in comparison

with the composites based on PEDOT and SWNTs. After 30 charge-discharge cycles, discharge
capacities of ca. 25 and 200 mA h g-1 in the case of PEDOT and PEDOT functionalized SWNTs,
respectively, are recorded. This result demonstrates a better performance of the Li/LiPF6/PEDOT-
functionalized SWNTs battery in comparison with that of the type Li/LiPF6/PEDOT.
3.2 Composites based on PDPA and SWNTs
Fig. 4a shows the Raman spectrum of PDPA in bipolaronic state deposited on blank Pt
electrode with the main lines situated at 412 - 612, 1174, 1204, 1372, 1491-1580 and 1609 cm-1, which
are assigned to the following vibration modes: benzene ring deformation, C-H bending in benzoid ring
(B)-Ag mode, C-N stretching, semiquinone radical structure, C=C stretch, in quinoid ring (Q) and C-C
stretch. (B), respectively [4, 18].
200 400 600 800 1000 1200 1400 1600
200 400 600 800 1000 1200 1400 1600
412
612 11
77
1372 PDPA-salt
PDPA-base 1608
Nor
mal
ized
Ram
an In
tens
ity
Wavenumber (cm-1)
post-treatment with NH4OH
100 cycles
50 cycles
25 cycles
initial
5
4
3
2
1
b
1314
1612
412 61
2
1174 1377
1590
172
174
1316
1590
a
Fig. 4 Raman spectra at λexc = 647 nm of PDPA deposited on: (a) Pt support in doped (dotted line) and un-doped state (solid
line) and (b) SWNTs film before (spectrum 1) and after electrochemical synthesis of PDPA-salt upon 25 (spectrum 2), 50
(spectrum 3) and 100 cycles (spectrum 4). Raman spectrum of the PDPA-base/SWNTs composite obtained by the
interaction of PDPA-salt/SWNT film with NH4OH 1M is shown in Fig. b as curve 5.
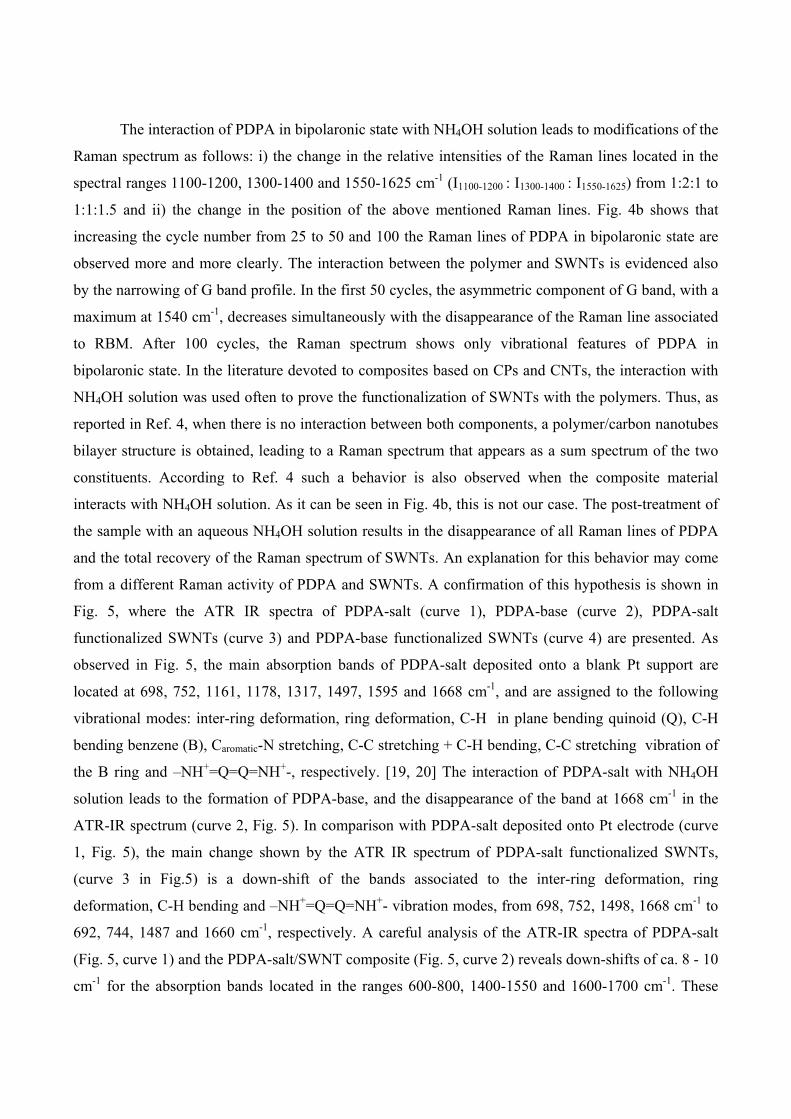
The interaction of PDPA in bipolaronic state with NH4OH solution leads to modifications of the
Raman spectrum as follows: i) the change in the relative intensities of the Raman lines located in the
spectral ranges 1100-1200, 1300-1400 and 1550-1625 cm-1 (I1100-1200 : I1300-1400 : I1550-1625) from 1:2:1 to
1:1:1.5 and ii) the change in the position of the above mentioned Raman lines. Fig. 4b shows that
increasing the cycle number from 25 to 50 and 100 the Raman lines of PDPA in bipolaronic state are
observed more and more clearly. The interaction between the polymer and SWNTs is evidenced also
by the narrowing of G band profile. In the first 50 cycles, the asymmetric component of G band, with a
maximum at 1540 cm-1, decreases simultaneously with the disappearance of the Raman line associated
to RBM. After 100 cycles, the Raman spectrum shows only vibrational features of PDPA in
bipolaronic state. In the literature devoted to composites based on CPs and CNTs, the interaction with
NH4OH solution was used often to prove the functionalization of SWNTs with the polymers. Thus, as
reported in Ref. 4, when there is no interaction between both components, a polymer/carbon nanotubes
bilayer structure is obtained, leading to a Raman spectrum that appears as a sum spectrum of the two
constituents. According to Ref. 4 such a behavior is also observed when the composite material
interacts with NH4OH solution. As it can be seen in Fig. 4b, this is not our case. The post-treatment of
the sample with an aqueous NH4OH solution results in the disappearance of all Raman lines of PDPA
and the total recovery of the Raman spectrum of SWNTs. An explanation for this behavior may come
from a different Raman activity of PDPA and SWNTs. A confirmation of this hypothesis is shown in
Fig. 5, where the ATR IR spectra of PDPA-salt (curve 1), PDPA-base (curve 2), PDPA-salt
functionalized SWNTs (curve 3) and PDPA-base functionalized SWNTs (curve 4) are presented. As
observed in Fig. 5, the main absorption bands of PDPA-salt deposited onto a blank Pt support are
located at 698, 752, 1161, 1178, 1317, 1497, 1595 and 1668 cm-1, and are assigned to the following
vibrational modes: inter-ring deformation, ring deformation, C-H in plane bending quinoid (Q), C-H
bending benzene (B), Caromatic-N stretching, C-C stretching + C-H bending, C-C stretching vibration of
the B ring and –NH+=Q=Q=NH+-, respectively. [19, 20] The interaction of PDPA-salt with NH4OH
solution leads to the formation of PDPA-base, and the disappearance of the band at 1668 cm-1 in the
ATR-IR spectrum (curve 2, Fig. 5). In comparison with PDPA-salt deposited onto Pt electrode (curve
1, Fig. 5), the main change shown by the ATR IR spectrum of PDPA-salt functionalized SWNTs,
(curve 3 in Fig.5) is a down-shift of the bands associated to the inter-ring deformation, ring
deformation, C-H bending and –NH+=Q=Q=NH+- vibration modes, from 698, 752, 1498, 1668 cm-1 to
692, 744, 1487 and 1660 cm-1, respectively. A careful analysis of the ATR-IR spectra of PDPA-salt
(Fig. 5, curve 1) and the PDPA-salt/SWNT composite (Fig. 5, curve 2) reveals down-shifts of ca. 8 - 10
cm-1 for the absorption bands located in the ranges 600-800, 1400-1550 and 1600-1700 cm-1. These

bands are associated with vibrational modes of the ring or inter-ring deformation type, C-C stretching
vibration of the benzene ring and NH+=Q=Q=NH+- (Q= quinoide ring).
600 800 1000 1200 1400 1600 18000
1
2
3
4PDPA-base/SWNT
PDPA-salt/SWNT
PDPA-base
PDPA-salt
166074
469
2
1487
1497
16951663
15931489
1317
1173
744
692
1668
15951497
1317
1178
116175
269
8
2
4
1
3
Abs
orba
nce
(arb
. uni
ts)
Wavenumbers (cm-1)
Fig. 5 ATR IR spectra of PDPA-salt (curve 1), PDPA-base (curve 2), PDPA-salt functionalized SWNTs
(curve 3) and PDPA-base functionalized SWNTs (curve 4).
The change in the position of these bands indicates a modification of the force constants, which
can be explained only on the basis of a covalent functionalization process of SWNT with PDPA-salt.
Such a functionalization induces significant steric hindrance effects, which must be detected in the
spectral range of the aromatic rings deformation ((600-800 cm-1 as reported above). The chemical
interaction of PDPA-salt functionalized SWNTs with NH4OH solution results in PDPA-base
functionalized SWNTs. As it could be expected, the ATR IR spectrum of PDPA-base functionalized
SWNTs (curve 4, Fig. 5) shows all IR bands of PDPA. Besides, in the spectral range 1600-1700 cm-1,
we detect an up-shift of the absorption bands from 1660 to 1663 cm-1 that is accompanied by the
appearance of a new band with maximum at 1695 cm-1. This new band indicates the appearance of
C=O groups onto SWNTs. [21]. Having all these considerations in mind, we conclude that when
electrochemical polymerization of DPA onto SWNTs film takes place, it results in SWNTs covalently
functionalized with PDPA-salt.

In the following paragraph we can see the application of PDPA-salt functionalized SWNTs as
active material for the positive electrode rechargeable lithium cells. Analyzing incremental capacity
curves (Fig.6), we found different characteristics for the PDPA-salt and PDPA-salt covalently
functionalized SWNTs composite. A significant decrease of capacity during the first 10 charge-
discharge cycles is observed for the two materials. A decrease in capacity, of about 40% and 50%, is
noted in Figs. 6a1 and 6b1 during the first 10 charge/discharge cycles of the cells (-) Li / PDPA-
salt/SWNTs composite (+) and (-) Li / PDPA-salt (+), respectively.
0 5 10 15 20 25 30 35
250
300
350
400
0 5 10 15 20 25 30 35
40
60
80
100
2,0 2,5 3,0 3,5 4,0
-3,0x10⁻⁶
0,0
3,0x10⁻⁶
6,0x10⁻⁶
9,0x10⁻⁶
1,2x10⁻⁵
2,0 2,5 3,0 3,5 4,0-6,0x10⁻⁶
-3,0x10⁻⁶
0,0
3,0x10⁻⁶
6,0x10⁻⁶
9,0x10⁻⁶
4,0x10⁴ 8,0x10⁴ 1,2x10⁵ 1,6x1052
3
4
3x10⁵ 4x10⁵ 5x10⁵ 6x10⁵ 7x1052
3
4
b1
Number of cycles
PDPA-salt/SWNTs Charge Discharge
a1
Cap
acity
(mA
h/g)
Number of cycles
PDPA-salt Charge Discharge
b2
A6
A5
A4
B5B6
A3A2
A1
Voltage (V) vs. Li+/Li
PDPA-salt/SWNTs 6th cycle 15th cycle
a2
B1
A2
A1
Diff
eren
tial c
apac
ity
PDPA-salt 6th cycle 15th cycle
Voltage (V) vs. Li+/Li
a3
Volta
ge (V
)
Time (s)
PDPA-salt b3
Time (s)
PDPA-salt/SWNTs
Fig. 6 The evolution of specific capacities vs. cycle number for PDPA-salt and PDPA-salt functionalized SWNTs electrodes
in lithium cells is shown in a1 and b1, respectively. Fig. a2 and b2 show incremental capacity curves (for the 6th cycle (open
circles) and the 15th cycle (full circles)) of PDPA-salt and PDPA-salt functionalized SWNTs battery. Fig. a3 and b3 show the
voltage profile of PDPA-salt and PDPA-salt functionalized SWNTs batteries.
A careful analysis of Figs. 6a1 and 6b1 reveals that during the first charge/discharge cycle
irreversible capacity losses of 5 and 21 mA h g-1 are detected for PDPA-salt and PDPA-salt/SWNTs

composite, respectively. This irreversible capacity is connected both to the reduction of the active
materials, PDPA-salt and PDPA-salt/SWNTs composite, and the decomposition of the electrolyte with
the formation of a passive protecting layer (labeled as solid electrolyte interface (SEI) film) takes place
according to the following reaction [22, 23]:
C3H4O3 +2e- +2 Li+ = Li2CO3 + CH2=CH2
The charge spent in the formation of the passive layer is strictly connected to the surface area of the
electrode material. Significant differences in capacity are noted for the two cells after 20
charge/discharge cycles. In the case of the (-) Li/ the PDPA-salt/SWNT composite (+) cell, the capacity
remains unchanged and at a high value. On the other hand, in the case of the (-) Li/PDPA-salt (+) cell
specific capacity values are lower and suffer a second drop from cycles 20 to 28 approximately. After
that the capacity remains constant until the end of the 35 cycles are completed.
The reactions taking place at each of the cells studied ((-) Li/PDPA-salt (+) and (-) Li/ PDPA-
salt/SWNT composite (+)) during the charge/discharge tests are shown in Scheme 1.
a) Negative electrode:
2n Lidischarge
charge2n Li + + 2n e-
b) Positive electrode of (-) Li/PDPA-salt (+) cell:
chargeN
H
Cl-
N
H
Cl-
N
H
N
H
( )n
+
2n e-+. +.( )
n+
discharge
2n Cl-
Total reaction of the (-) Li/PDPA-salt (+) cell:
2n Li
2n Li+
+ N
H
Cl-
N
H
Cl-+. +.( )
n charge
discharge
N
H
N
H
( )n
+
+ 2n Cl-

c) Positive electrode of the (-) Li/ the PDPA-salt/SWNTs composite (+) cell:
chargeN
H
Cl-
N
Cl-
N N( )n
+
2n e-+. +.( )
n+
discharge
2n Cl-
C C
H
C C
H
C C
H
C C
N N
H
C C
H
C C
charge
discharge
2n e-( )n
+
N N
H
C C
( )n
+
2n..-
Total reaction of the (-) Li/ the PDPA-salt/SWNTs composite (+) cell:
chargeN
H
Cl-
N
Cl-
+
+. +.( )n
+discharge
2n Cl-
C C
H
C C
N N
H
C C
( )n
+
2n..-
4n Li
4n Li+
Scheme 1. Reactions at the two electrodes for the batteries (-) Li/PDPA-salt (+) and (-) Li/ the PDPA-salt/SWNTs
composite (+): (a) the positive electrode, (b) and (c) the negative electrode containing as active material PDPA-salt and the
PDPA-salt/SWNTs composite, respectively.

We believe that the second capacity drop could be related with a decomposition of the electrode
surface. In the case of the (-) Li/ PDPA-salt/SWNTs composite (+) cell, the absence of the second
capacity drop indicates an inhibiting role of SWNT towards a further decomposition of the electrode
surface. At the end of the final 35th charge-discharge cycle, discharge capacities of 35 and 245 mA h g-
1 were recorded for PDPA-salt and the PDPA-salt/SWNTs composite, respectively. These results
indicate that the electrochemical performance of a lithium battery based on PDPA-salt is substantially
surpassed by the PDPA-salt/SWNTs composite as active material. This suggests a synergism between
the host polymer matrix and guest nanoparticles, as detected in other hybrid systems. [24] The effect of
the two active materials on the lithium cell potential is shown in Fig. 6. Analyzing the incremental
curves of the two materials, electrochemical activity associated to Li insertion in the range 3-4 V
(during discharge) is detected in both cases. For the PDPA-salt active material, the peaks associated to
Li insertion and Li de-insertion noted in Fig. 6 as A1-A2 and B1, respectively are found at 3.73 - 3.31
and 3.19 V vs. Li/Li+. In the case of the PDPA-salt/SWNTs composite, the Li insertion is characterized
by the maxima labeled A1, A2, A3 and A4 localized at potentials of about 3.7, 3.6, 3.41 and 3.17 V vs.
Li/Li+. On the other hand, a striking difference between PDPA and the PDPA/SWNTs composite is
observed in the potential range 2-3 V, the latter active material showing a process characterized by two
couples of intercalation/de-intercalation. These are characterized by the peaks associated to the Li
insertion/Li de-insertion noted as A5/B5 and A6/B6 having potentials at 3.01/2.19 and 2.75/2.48 V,
respectively. In the case of the (-) Li/ PDPA-salt/SWNTs composite (+) cell, as increasing of the
charge/discharge cycles number (Fig. 6b2), it is interesting to note: i) the change in the relative
intensities of the peaks situated in the potential range (2; 3) V and (3; 4) V and ii) an up-shift of the A6
peak accompanied by a down-shift of the B5 and B6 peaks. Understanding of this particular behavior
needs further research. However, the data presented here are more than sufficient to show that the
PDPA-salt/SWNTs composite performs better in rechargeable Li batteries than the PDPA-salt material
alone, and maintains a remarkably high value of specific charge of 245 mAh g-1 after 35 cycles which
makes it worth of further studies for this particular application.
4. Conclusions
In this work, we have reported new results concerning the performances of the PEDOT/SWNTs
and PDPA/SWNTs type composites as active materials in Li rechargeable batteries. Our results lead to
the following conclusions:
i) the chemical polymerization of EDOT in the presence of SWNTs and FeCl3 results in a
covalent functionalization of SWNTs with PEDOT molecules, which is evidenced in the SERS spectra

of PEDOT and SWNTs by: a) the appearance of a Raman line at 140 cm-1 indicating the formation of a
new covalent bond between PEDOT and SWNTs; b) an increase in the intensity of the Raman line at
705 cm-1, associated with the deformation vibration mode of C-S-C bond, the result of a steric
hindrance effect induced by the bonding of PEDOT on SWNTs; and c) the enhancement of the Raman
band with maximum at 1540 cm-1 (G- component) in SWNTs when the PEDOT weight in the
PEDOT/SWNTs composite increases.
ii) using the PEDOT/SWNTs composite as a positive electrode and an electrolytic solution
containing LiPF6 into a Li rechargeable battery, a high specific discharge capacity (stabilized at ca. 200
mA h g-1) is reported for the cathode active material;
iii) a covalent functionalization of SWNTs with PDPA in bipolaronic state takes place when
electropolymerization of DPA onto SWNTs film occurs. The covalent functionalization process is
probed by Raman and ATR IR spectroscopy studies;
iv) optimization of the electrochemical synthesis of the PDPA-salt functionalized SWNTs
composite, as performed here, may improve their electrochemical performance in different
applications. In this paper, such an example is given by an improvement of the specific capacity of
PDPA-salt/SWNTs (steady at 245 mAhg-1 after 35 cycles) with respect to pure PDPA-salt (35 mAhg-1)
in rechargeable Li cells.
Acknowledgment
This research was financed by projects PNII 72-182/2008 and PNII 62-081/2008.
References
[1] M. S. Dresselhaus, G. Dresselhaus, P. C. Eklund, Science of fullerene and carbon nanotubes,
Academic Press, New York, 1996
[2] M. Baibarac, I. Baltog, S. Lefrant, Chapter 5. Composites based on conducting polymers and
carbon nanotubes in Book Nanostructured conductive polymers, Ali Eftekhari Ed., Wiley-
Blackwell Interscience, 209-260, 2010
[3] M. Baibarac, P. Gomez-Romero, J. Nanosci. Nanotech. 6, 289, 2006
[4] S. Lefrant, M. Baibarac, I. Baltog, J. Mater. Chem. 19, 5690, 2009
[5] M. Baibarac, I. Baltog, S. Lefrant, Current Organic Chemistry 17, 2011
[6] M. Baibarac, M. Lira Cantu, J. Oro-Sole, N. Casan-Pastor, P. Gomez Romero, Small 2, 1075,
2006
[7] J. Chen, Y. Liu, A. I. Minett, C. Lynam, J. Wag, G.G. Wallace, Chem. Mater 19, 3595, 2007

[8] J. Wang, Y. Xu, X. Sun, X. Li, X. Du, J. Solid State Electrochem. 12, 947, 2008
[9] S. H. Ng, J. Wang, Z. P. Guo, J. Chen, G. X. Wang, H. K. Liu, Electrochim. Acta 51, 23, 2005
[10] B. L. He, B. Dong, W. Wang, H. L. Li, Materials Chemistry and Physics 114, 371, 2009
[11] C. Y. Wang, V. Mottaghitalab, C.O. Tov, G. M. Spinks, G. G. Wallace, J. Power Sources 163,
1105, 2007
[12] S. R. Sivakkumar, W. J. Kima, J.A. Choi, D. R. MacFarlane, M. Forsyth, D. W. Kim, J. Power
Sources 171, 1062, 2007
[13] F. Cheng, W. Tang, C. Li, J. Chen, H. Lium P. Shen, S. Dou, Chem. Eur. J. 12, 3082, 2006
[14] R. Corradi, S. P. Armes, Synth. Met. 84, 453, 1997
[15] P. R. Marcoux, J. Schreiber, P. Batail, S. Lefrant, J. Renourd, G. Jacob, D. Albertini,
J.Y.Mevellec, Phys. Chem. Chem.Phys. 4, 2278, 2002
[16] S. Piscanec, M. Lazzeri, J. Robertson, B. Chase, A.C. Ferrari, F. Mauri, Phys. Rev. B 75,
035427, 2007
[17] S. Garreau, J. L. Duvail, G. Louarn, Synth. Met. 125, 325, 2002
[18] M. Lapkowski, K. Berrada, S. Quillard, G. Louarn, S. Lefrant, A. Pron, Macromolecules 28,
1233, 1995
[19] S. Quillard, G. Louarn, S. Lefrant, A. G. MacDiarmid, Phys. REv. B 50, 12496, 1994
[20] C. T. Kuo, W. K. Chiul, Synth. Met. 88, 23, 1997
[21] L. V. Daimag, N. B. Colthup, W. G. Fately, J. G. Grasseli, The Handbook of infrared and
Raman characteristic frequencies of organic molecules, Academic Press, New York, 1991
Related Documents