
Welcome message from author
This document is posted to help you gain knowledge. Please leave a comment to let me know what you think about it! Share it to your friends and learn new things together.
Transcript
Journal of Global Business and Trade Vol. 8, No. 2 (2012)
1
Journal of Global Business and Trade
Health Impacts of The Business Process Outsourcing Industry: Condom Use in Call Centers Erickson T. Felicilda and Anna Floresca F. Firmalino Department of Economics, University of the Philippines Los Baños
ARTICLE INFO
ABSTRACT
Keywords: consumer choice, risk behavior, multinomial logistic regression, business process outsourcing industry, Human Immunodeficiency Virus, Acute Immune Deficiency Syndrome
The business process outsourcing industry is viewed as a major contributor in the Philippine economy although concerns have been raised regarding the health impacts, particularly the sexual behavior of its workers and the increasing number of Human Immunodeficiency Virus and/or Acute Immune Deficiency Syndrome cases, engendered by the culture of these firms. Using a multinomial logistic regression model on data gathered from a survey of call center agents in Metro Manila, this study provides an analysis of the factors that affect condom use in call centers. Results of this study show that risk awareness and social influence positively and significantly affect the choice to use condoms, although condom use among these workers is still at a level that can contribute to increased incidence of infections. Risky sexual behavior is prevalent among call center agents despite high awareness of the associated risks and the social acceptability of condom use.
I. Introduction
Business process outsourcing (BPO) is among the
industries that kept gaining momentum around the
world despite the global economic slowdown. The BPO
industry has continuously contributed to the growth of
the services sector in the Philippines since the start of
the millennium (SEPO 2010). In the first quarter of
2012, the Philippine economy grew by 6.4%, faster than
expected, with significant contributions from tourism
and business outsourcing (Landingin, 2012).
Among the activities of the BPO industry, the call
center industry has been making the most significant
contributions to the Philippine services sector.
According to the Contact Center Association of the
Philippines, the Philippines is the largest call-center
operator in the world as of 2011, employing 350,000
and generating $6.3 billion in revenue in 2010.
Mentioned among the factors to explain the
attractiveness of the country as an outsourcing
destination, particularly for U.S. firms, is the
"Philippines' embrace of the American culture" (Yun
and Chu, 2011).
Health Impacts of The Business Process Outsourcing Industry: Condom Use in Call Centers
2
The willingness of Filipino call center workers to
take on graveyard shifts, to accommodate the working
hours of their clients (in the U.S., for example), has
isolated them from others who hold regular day jobs,
thus allowing them to create their own subculture
(Manalastas, 2011). The unconventional work hours,
the comfort that the workplace offers, and the non-
judgmental atmosphere in these centers have allowed a
new social phenomenon, one in which the accepted
permissiveness among workers may lead to risky sexual
behavior (Mendoza, 2010).
A study by the University of the Philippines
Population Institute and the Department of Health
found a higher incidence of early penetrative premarital
sex, sex with persons of the same sex, and casual sexual
experiences among call center workers than among
professionals not working in call centers (Baguio, 2010).
Although the study authors refuse to attribute this trend
to the fact that the employees work in call centers, based
on the cross-sectional (one point in time) nature of their
study, the number of call center workers in the
Philippines engaged in risky sexual behavior remains
alarming (Ramos, 2010). Another study of call center
workers in Metro Manila by the Ateneo de Manila
University shows that casual, unprotected sex is quite
widespread among these workers, increasing the risk of
sexually transmitted infections (STIs) among these
young professionals (Mendoza, 2010).
At a time when many other countries are seeing
Human Immunodeficiency Virus (HIV) infection rates
leveling off or declining, the Philippines is seeing the
number of reported HIV cases increasing (Cuneta,
2012). As of April 2012, there have been a total of 9,163
cases reported in the Philippine HIV and AIDS registry
since 1984, with a record-breaking 313 new HIV and/or
full-blown Acquired Immune Deficiency Syndrome
(AIDS) cases recorded in March (Crisostomo, 2012).
The unexpected surge in cases has happened in the past
several years, with a more than five-fold increase
between 2007 and 2011 (Cuneta, 2012).
On the whole, the registry shows that sexual contact
is the leading source of recent infections, with males
having sex with other males being predominant among
sexual transmission cases (Crisostomo, 2012). Overseas
Filipino workers were found to have contributed to
these numbers, comprising about one-fifth of the total,
again being infected through sexual contact (Cuneta,
2012). In addition, more Filipino youth aged 20-24 are
getting infected (Ong, 2011).
The HIV prevalence rate in the Philippines is still
considered to be low, which is particularly surprising to
experts, given the strong influence of the Catholic
Church that discourages condom use (Cuneta, 2012).
However, the surge in the number of HIV cases in
recent years lends importance to the discussion of low
condom use in the country as a contributing factor.
Returning to the interest in call centers, it is
concerning that cases of HIV infection among young
Filipino professionals in this industry have been on the
rise, mainly due to risky sexual behavior arising from
the environment and peer pressure (Ong, 2011). This
raises the question of whether there really is a downside
to the financial benefits that the BPO industry and
particularly call centers provide the economy.
With authorities continually providing incentives to
foreign firms, particularly companies establishing
offshore operations in the country, the further expansion
of the BPO industry is almost a foregone conclusion
along with the view of the BPO industry as an engine of
growth in the Philippine economy, specifically to the
services sector. The issue is whether there is a drawback
to the growth engendered by the expansion of the BPO
industry, principally in terms of the health impacts.
The question of whether the culture engendered by
these outsourcing firms is causing the higher prevalence
of risky sexual behavior among call center workers is
not the concern of this study; although it is still
interesting to note the liberal and permissive working
Journal of Global Business and Trade Vol. 8, No. 2 (2012)
3
environment of these workplaces in spite of the
conservative nature of the predominantly Catholic
society in which they exist. Results of previous studies
indicating that there is a high incidence of casual sexual
encounters in these workplaces is enough reason to
assume that there is a high probability of STIs, including
HIV and/or AIDS, among their workers.
Prevention is key to combating the spread of
HIV/AIDS and other STIs. With most infections arising
from sexual transmission, abstinence or monogamy
may be the best options. The next best option is the use
of condoms, which, when properly handled and used,
could reduce the chance of HIV and STI transmission
to almost zero (Calica, et al., 2008).
This study thus intends to provide an analysis of the
factors that affect condom use, particularly in the call
center industry. Increasing hiring rates and higher
incomes in the industry should indeed be viewed as
significant contributions to the economy. However,
these gains should not be achieved at the cost of the
health of the working population. Results of this study
may provide clues to appropriate government and firm
interventions.
II. Methodology
Choice finds its roots in discussions of demand.
Based on consumer theory, quantity demanded is
affected by the own price of a commodity, prices of
related commodities, consumer income, tastes and
preferences, consumer expectations, and the number of
consumers. In the particular case of the choice to use
condoms, the own price and consumer incomes would
constitute the monetary considerations. Other factors
that could influence the choice include personal aspects
related to consumer expectations as well as tastes and
preferences such as educational attainment (as it relates
to sexual health awareness), gender, parental support (as
a mirror of social acceptance/influence), age, religion,
marital status, number of sexual partners, and risk
perception (Coren, 2003; Meekers and Klein, 2002;
Adetunji, 2000; Cuneta, 2012).
To determine whether these factors affect the
condom use of call center agents, a survey of 326 agents
from 16 call centers in Metro Manila was conducted in
late 2010 to early 2011. Given the sensitivity of the
study's concerns, questionnaires were provided to
respondents based on a non-probability sampling
technique.
Summary statistics of the individual characteristics
of the respondents are generated. A Multinomial
Logistic regression is then implemented to determine
the factors affecting the condom use decision of call
center agents, based on the following functional form:
CU = α + β1 AGE + β2 INCOME + β3 SEX + β4 PRT + β5 SCH + β6 MS + β7 SOCIAL + β8 RISK + β9 REL +
β10 PRICE + ε
where CU is the frequency of condom use variable
categorized as 0 – non-use, 1 – occasional use, 2 –
practical use, and 3 – consistent use; AGE is the current
age of the respondent; INCOME includes all possible
sources of income of the respondent; SCH or the
educational attainment of the respondent (number of
formal schooling years); PRICE of the condom; PRT or
the number of sexual partners of the respondent; SEX or
the respondent’s gender (0 if male, 1 if female); MS or
marital status (0 if married, 1 if not married); SOCIAL
or peer influence (0 if condom use is influenced by peer,
1 if otherwise); RISK or risk perception about acquiring
HIV/AIDS (0 if low or none, 1 if high); and REL or
effect of their religion on condom use (0 if not affected,
1 if otherwise).
III. Results
Only sexually active call center agents were
considered respondents of interest. To be considered
sexually active, an agent must have had at least one
sexual encounter in the past three months. Based on the
Health Impacts of The Business Process Outsourcing Industry: Condom Use in Call Centers
4
responses, with data censoring prior to the regression
analysis, the results discussed here apply to the reduced
sample of 130 agents. Table 1 summarizes the
distribution of the respondents based on demographic
characteristics.
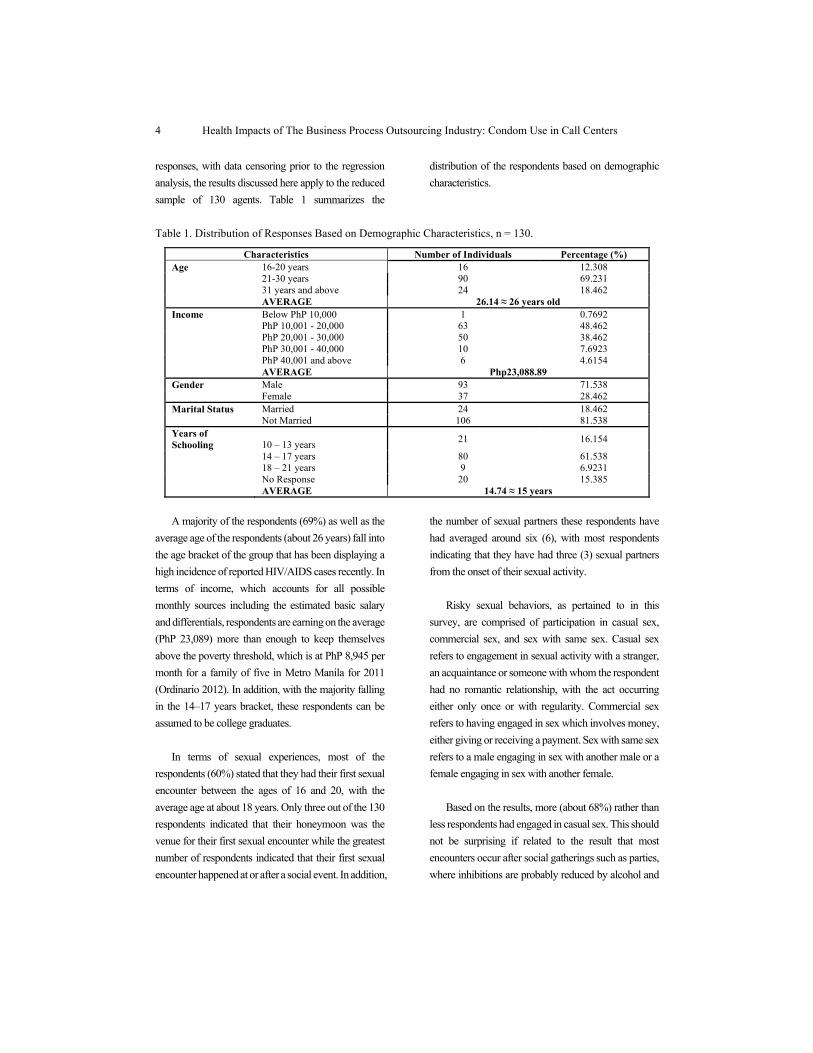
Table 1. Distribution of Responses Based on Demographic Characteristics, n = 130.
Characteristics Number of Individuals Percentage (%) Age 16-20 years 16 12.308 21-30 years 90 69.231 31 years and above 24 18.462 AVERAGE 26.14 ≈ 26 years old Income Below PhP 10,000 1 0.7692 PhP 10,001 - 20,000 63 48.462 PhP 20,001 - 30,000 50 38.462 PhP 30,001 - 40,000 10 7.6923 PhP 40,001 and above 6 4.6154 AVERAGE Php23,088.89 Gender Male 93 71.538 Female 37 28.462 Marital Status Married 24 18.462 Not Married 106 81.538 Years of Schooling 10 – 13 years
21 16.154
14 – 17 years 80 61.538 18 – 21 years 9 6.9231 No Response 20 15.385 AVERAGE 14.74 ≈ 15 years
A majority of the respondents (69%) as well as the
average age of the respondents (about 26 years) fall into
the age bracket of the group that has been displaying a
high incidence of reported HIV/AIDS cases recently. In
terms of income, which accounts for all possible
monthly sources including the estimated basic salary
and differentials, respondents are earning on the average
(PhP 23,089) more than enough to keep themselves
above the poverty threshold, which is at PhP 8,945 per
month for a family of five in Metro Manila for 2011
(Ordinario 2012). In addition, with the majority falling
in the 14–17 years bracket, these respondents can be
assumed to be college graduates.
In terms of sexual experiences, most of the
respondents (60%) stated that they had their first sexual
encounter between the ages of 16 and 20, with the
average age at about 18 years. Only three out of the 130
respondents indicated that their honeymoon was the
venue for their first sexual encounter while the greatest
number of respondents indicated that their first sexual
encounter happened at or after a social event. In addition,
the number of sexual partners these respondents have
had averaged around six (6), with most respondents
indicating that they have had three (3) sexual partners
from the onset of their sexual activity.
Risky sexual behaviors, as pertained to in this
survey, are comprised of participation in casual sex,
commercial sex, and sex with same sex. Casual sex
refers to engagement in sexual activity with a stranger,
an acquaintance or someone with whom the respondent
had no romantic relationship, with the act occurring
either only once or with regularity. Commercial sex
refers to having engaged in sex which involves money,
either giving or receiving a payment. Sex with same sex
refers to a male engaging in sex with another male or a
female engaging in sex with another female.
Based on the results, more (about 68%) rather than
less respondents had engaged in casual sex. This should
not be surprising if related to the result that most
encounters occur after social gatherings such as parties,
where inhibitions are probably reduced by alcohol and
Journal of Global Business and Trade Vol. 8, No. 2 (2012)
5
other substance use. More hopeful are the results that
more respondents do not engage in commercial sex
(69%) or have sex with same sex (78%).
In terms of risk awareness or knowledge,
respondents were asked questions regarding HIV/AIDS.
Integrating the responses for the several questions asked,
the risk awareness of the respondents were classified as
either high or low. The results show that about 72% of
the respondents display a high level of risk awareness,
which does not seem to manifest in their sexual
behavior. Condom use, through limiting the risks of
infection, may provide a probable explanation for the
respondents' penchant for multiple partners.
It is encouraging to note that more rather than less
respondents (about 65.38% to 34.62%) did use
condoms. When asked whether the condom users used
a condom in their last sexual encounter, about 80%
reported having used condoms. Considering only
condom use in the last sexual encounter, more than half
of all respondents indicated that they did use condoms.
Since it seems that condom use was consistent, with
more respondents using condoms, sexually experienced
respondents who have used condoms were also asked
how frequently they use condoms. The frequency of
their condom use is then used to classify what type of
users they were. Those who always use condoms were
“consistent” users (27.69% of all respondents); those
who use condoms only when available or only when
engaging in sex with casual partners were considered
“practical” users (16.15%); and, those who use
condoms only sometimes, even when condoms are
available were considered “occasional” users (21.54%).
With more consistent and practical users among
them, condom users were asked to identify reasons for
their use of condoms. Non-users were instead asked for
the reasons for their failure or refusal to use condoms.
For the former group, prevention of HIV/AIDS
infection was the most cited reason for condom use. For
the latter group, the most cited reason for non-use is the
reduced pleasure associated with condom use.
To estimate a measure of whether the respondents
could be influenced by their peers, respondents were
asked whether they discussed condom use with their
friends, whether they would be embarrassed if their
friends found out that they were using condoms, and
whether they discussed HIV/AIDS with their friends.
More respondents (more than 60%) had discussed
condom use with friends while a very small proportion
of the respondents (about 13%) indicated that they
would be embarrassed by having friends know of their
condom use. Many respondents had discussed
HIV/AIDS with friends, usually in the context of having
read or heard news items on HIV/AIDS and/or
searching for HIV/AIDS on the internet. Based on an
integration of the responses to these questions, social
influence seems to have an impact on a majority of
respondents.
Before running the regression, variances of the
explanatory variables were computed to determine if
there was enough variation in the sample points to allow
for a reliable regression run. Based on the response rates
and the results of the variance analysis, it was decided
to drop several variables from the regression analysis,
namely: price of condoms, religious affiliation, age,
number of schooling years, and marital status. Table 2
summarizes the results of the regression analysis.
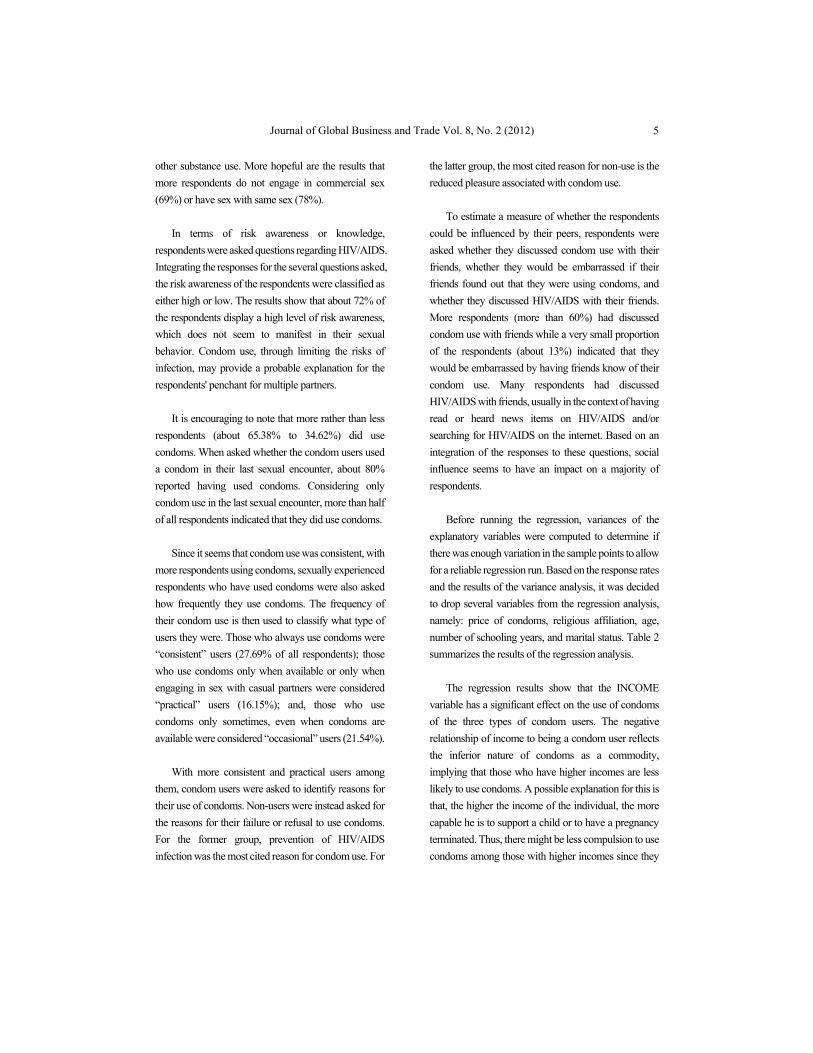
The regression results show that the INCOME
variable has a significant effect on the use of condoms
of the three types of condom users. The negative
relationship of income to being a condom user reflects
the inferior nature of condoms as a commodity,
implying that those who have higher incomes are less
likely to use condoms. A possible explanation for this is
that, the higher the income of the individual, the more
capable he is to support a child or to have a pregnancy
terminated. Thus, there might be less compulsion to use
condoms among those with higher incomes since they
Health Impacts of The Business Process Outsourcing Industry: Condom Use in Call Centers
6
are better equipped to handle the consequences of not
using condoms.
Gender also has a significant effect on the likelihood
of condom use among the occasional and practical
condom users. The negative coefficient of the SEX
variable denotes that females are less likely to use
condoms. This seems surprising given claims that
females’ likelihood to use condoms is higher since there
is a reduction of "pleasure" from sex among males using
condoms (Meekers and Klein, 2002). In addition,
females tend to use condoms because they have a higher
risk perception compared to males. However, as a
possible explanation for the result here, it must be
considered that female condoms are relatively rare in
the Philippines and it is the males who are usually
expected to bring condoms to encounters.
Table 2. Multinomial Logistic Regression Results
Category Variable Coefficient P>|z| Non User (reference category)
Occasional User
Income** -0.0000534 0.031 Number of partners 0.0195573 0.785 Sex* -1.0288250 0.054 Social influence 0.5559319 0.310 Risk awareness 0.7230200 0.163 Constant 0.1853162 0.819
Practical User
Income* -0.0000401 0.058 Number of partners* 0.0956597 0.093 Sex* -1.1735250 0.079 Social influence 0.5683745 0.370 Risk awareness 0.2130579 0.705 Constant -0.5088893 0.553
Consistent User
Income** -0.0000552 0.046 Number of partners 0.0136501 0.835 Sex 0.2834073 0.600 Social influence 1.0760700 0.106 Risk awareness* 1.0657780 0.068 Constant -0.9187134 0.308
Log pseudolikelihood = -159.56129 Prob > chi2 = 0.0247 ** Significant at 5% Wald chi2(15) = 27.53 Pseudo R2 = 0.0971 *Significant at 10%
The number of partners has a significant effect only
on the likelihood of condom use among practical
condom users. The positive relationship of the PRT
variable to becoming a condom user implies that, the
more sexual partners of the respondents, the more likely
he or she would use condoms with casual partners or
when condoms are available. The reason for this could
be because these types of users could be concerned with
the uncertainty surrounding sexual activities with
partners with whom they are not in a committed
relationship, in terms of infection or other consequences.
Risk awareness has a significant effect only on the
likelihood of condom use among consistent condom
users. The positive coefficient of the RISK variable
means that the higher the risk awareness, the higher the
likelihood of condom use. This would be a logical turn
of events since, if people find the spread of HIV/AIDS
alarming, this would be reason for their intention to
prevent it from spreading even more or to avoid
becoming infected such that they would consistently
use condoms.
The results of the analysis of marginal effects for
this sample predicts that about one-third (35.59%) of the
respondents would fall under the non-user category.
Among the condom users, most (24.19%) would
belong to the occasional user category.
Journal of Global Business and Trade Vol. 8, No. 2 (2012)
7
With the rather surprising result that females in this
sample are less likely to use condoms than males, the
factors that affect condom use were then tested for the
two separate gender groups. A comparison of the
characteristics of the two groups shows that there were
some considerable differences between the two groups,
such as the male respondents (with average income of
PhP 23,957.83) earning more than the female
respondents (with PhP 22,623.40) and males having
more sexual partners (seven against four). Results of the
model runs for the separate samples, where the variable
for SEX was deleted, are shown in Table 3.
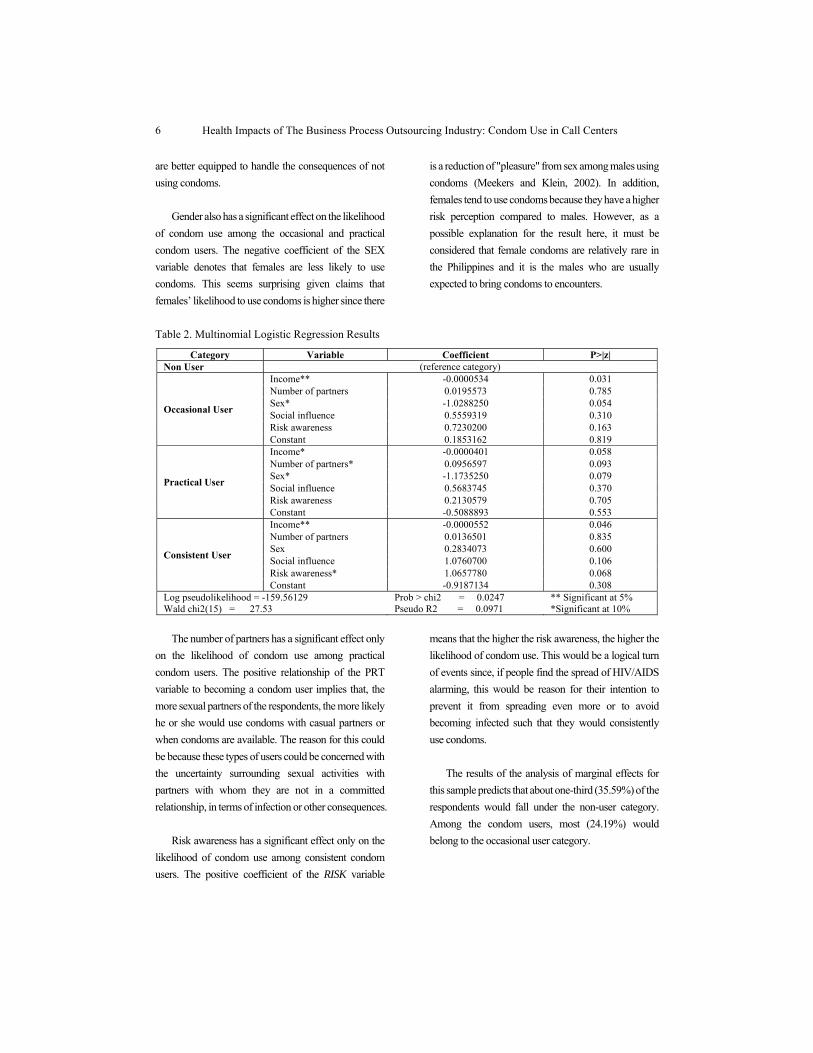
Table 3. Multinomial Logistic Regression Results by Gender
Category Variable MALE FEMALE
Coefficient P>|z| Coefficient P>|z| Non User (reference category)
Occasional Users
Income -0.0000467* 0.080 -0.0000637 0.308 Number of partners 0.0405119 0.588 -0.1221129 0.466 Social influence 0.4684941 0.464 15.8732800** 0.000 Risk awareness 0.7230200 0.725 16.2471900** 0.000 Constant 0.3182639 0.711 -30.4742200** 0.000
Practical Users
Income -0.0000343 0.140 -0.0000231 0.602 Number of partners 0.1094644 0.105 0.0233864 0.872 Social influence 0.8549844 0.225 -0.4305954 0.769 Risk awareness -0.3350257 0.607 16.5264400** 0.000 Constant -0.6058102 0.515 -16.7451800** 0.000
Consistent Users
Income -0.0000133 0.658 -0.0001037* 0.090 Number of partners -0.0177286 0.817 0.0017616 0.990 Social influence 2.3064910* 0.060 0.3300930 0.734 Risk awareness 1.8585640 0.131 0.5826708 0.450 Constant -3.4934290 0.115 1.5347690 0.347
**Significant at 1% Log pseudolikelihood =-101.06 Log pseudolikelihood =-49.38 *Significant at 10% Wald chi2(12) = 13.19 Wald chi2(12) = 1612.55 Prob > chi2 = 0.3552 Prob > chi2 = 0.0000 Pseudo R2 = 0.1062 Pseudo R2 = 0.1439
The regression results seem to imply that the model
better describes condom use of females rather than
males. It is thus not surprising that more variables were
shown to be significant for the female sample.
Results show that the INCOME variable has a
significant effect on the use of condoms of male
occasional users and female consistent users. The
negative relationship of INCOME to condom use
implies that those with higher incomes are less likely to
use condoms. An explanation for this, as previously
discussed, is that those with higher income are better
equipped to deal with the consequences of non-use.
Social influence has a significant effect on the
likelihood of condom use among male consistent users
and female occasional users. The positive relationship
between the SOCIAL variable and condom use means
that social influence heightens the likelihood of condom
use. This could be a reasonable circumstance because,
if people have friends or peers who consider condom
use a normal trend, they would have no excuse to not
use condoms out of social embarrassment.
The RISK variable has a significant effect only on
the likelihood of condom use among female condom
users, specifically occasional and practical users. The
positive relationship between risk awareness and
becoming a condom user means that awareness of the
risks of risky sexual behavior increases the likelihood of
condom use. Alarm over the spread of HIV/AIDS may
encourage individuals to become more cautious and to
practice safe sex and thus use condoms.
Based on the results of the analysis of marginal
effects, the model predicts that about one-third (35.15%)

Health Impacts of The Business Process Outsourcing Industry: Condom Use in Call Centers
8
of the male respondents and more than half (52.06%) of
the female respondents would fall under the non-user
category. Among the condom users, most male users
are occasional users (31.36%) and most of the females
users are consistent users (47.60%).
The SOCIAL variable is significant only in two
categories. Results show that males who are socially
influenced are 0.15% more likely to be consistent users
rather than non-users. On the other hand, females who
are socially influenced are 0.006% more likely to be
occasional users rather than non-users. The INCOME
variable is significant only in female consistent users.
Based on the mean value of female respondents’
income, every PhP 22,623.40 additional income would
increase females’ likelihood of non-use of condoms by
0.003%. More notably, risk awareness was significant
in the condom use of female occasional and practical
users. Those who are highly aware of the risks of
HIV/AIDS are 0.03% and 0.15% more likely to be
occasional and practical users rather than non-users,
respectively.
IV. Conclusions and Implications
Differing from findings in previous studies, results
showed that income, believed to have a positive impact
on condom use, seems to have a negative effect on an
individual’s decision to use a condom. Also, females,
who were expected to be more likely to use condoms,
were found to have a lower likelihood of using condoms
than males. However, consistent with earlier research,
this study found that risk awareness, particularly
regarding the risks of HIV/AIDS infection, was a
significant determinant of condom use. In addition,
social influence was shown to have a positive impact on
the condom use decision.
Although most of the call center agents in the
sample population have high risk awareness, a majority
of them still hold to the notion that HIV/AIDS can be
cured. For this reason, the government should help raise
awareness that HIV/AIDS cannot be cured. In doing
this, call center agents or the greater population may
think twice before engaging in unprotected sex.
Moreover, the results of this study show that
females have a lower likelihood of condom use, making
them more susceptible to pregnancy and HIV/AIDS.
Since female condoms are relatively rare in the country,
knowledge about it is also limited. In this case, the
government could seek to introduce people to female
condoms and make women aware of its existence
through dissemination programs. By doing so, the
government addresses the problem of inaccessibility of
condoms, which may help control the rapid population
growth and the spread of HIV/AIDS. The objectives of
the proposed Reproductive Health Bill of the
Philippines include possible solutions to the problems
that this study seeks to address. Among others, through
reproductive health or sex education, the government
could raise awareness of the risks that unprotected sex
brings.
Considering the BPO industry as a contributor to the
economy, it seems that these firms are providing more
than fair compensation; however the health situation of
the industry's employees in these firms may be cause for
concern. Although not specifically investigated in this
study, previous reports have suggested that the culture
engendered by these working environments lends itself
to promiscuity and other risky sexual behavior. This
study found that awareness regarding the risks of risky
sexual behavior is high but behaviors do not seem to be
consistent with the level of knowledge supposedly
exhibited by their workers.
Condom use among call center agents is still at a
level that can contribute to increased prevalence of
infections. Based on the results, social influence and the
number of partners are significant determinants of the
choice to use condoms. With reports that infections in
call centers are on the rise, this implies that interpersonal
relationships in the workplace are critical in this
discussion. Friendships in the workplace and
socialization beyond work hours can only add to worker
Journal of Global Business and Trade Vol. 8, No. 2 (2012)
9
satisfaction and thus to productivity. However, should
employees be allowed to take these further and involve
themselves in romantic and/or sexual relationships?
According to a report, sexual activity can be had in
some BPO firms during breaks in the workplace
(Mendoza, 2010). On the other hand, some firms in the
country discourage romantic/sexual relations among
co-workers. Some even explicitly disallow office
romances or couples from working in the same
department. Apparently, most BPO firms have not
adopted these restrictions or, at the least, tolerate
romantic/sexual relationships between employees in the
office. This is probably a result of the fair labor laws that
these foreign firms implement, even in their offshore
operations. Despite these legal constraints, it would not
hurt for companies to discourage these types of
relationships and to provide some modicum of control
to reduce the probability that such acts could occur in
the workplace. Reminding or educating their workers
on safe sex practices may also help to encourage them
to think twice about participating in risky behaviors or
relationships. At the least, these intensified efforts can
foster more widespread and consistent condom use that
can only serve to reduce the likelihood of sexually
transmitted infections.
Ensuring that the working population is infection-
free promotes a healthier workforce. Good health is at
the forefront of better productivity of the workforce,
which can only be good for the firm as well as the
economy in general.
REFERENCES
Adetunji, J. (2000). Condom use in marital and
nonmarital relationships in Zimbabwe.
International Family Planning Perspectives, 26, 4.
Accessed October 13, 2010 from http://sparky.
guttmacher.org/pubs/journals/ 2619600.html. Baguio, M. A. (2010). According to study: Call center
agents prone to HIV-AIDS. Philippine Star: The
Philippine Global Community, January 30.
Accessed October 13, 2010 from
http://www.philstar.com/Article.aspx?
articleId=545166&publicationSub
CategoryId=107. Calica, C. L., Melgar, M. I. E., Fuentes, C. B. &
Roquero, L. B. (2008). Assessment of condom
programming in Lao PDR. United Nations
Population Fund. Accessed October 13, 2010 from
http://countryoffice.unfpa.org/ lao/drive/
CondomAssessmentLaoPDRFullreport(17Jun08).
pdf Coren, C. (2003). For Cameroonian youth, perceived
risk and parental support boost condom use.
International Family Planning Perspective, 29(2).
Accessed July 8, 2012 from http://www.
guttmacher.org/pubs/journals/ 2909703b.html.
Crisostomo, S. (2012). 313 HIV/AIDS cases recorded
in March. Philippine Star: The Philippine Global
Community, April 26. Accessed July 8, 2012 from
http://www.philstar.com/Article.aspx?publicationS
ubCategoryId= 63&articleId=800836. Cuneta, J. (2012). Rise in HIV cases worries the
Philippines. The Wall Street Journal Southeast Asia,
July 5. Accessed July 8, 2012 from
http://blogs.wsj.com/searealtime/2012/07/05/rise-
in-hiv-cases-worries-the-philippines/.
Landingin, R. (2012). Philippine growth outperforms
neighbors. Financial Times Asia-Pacific, May 31.
Accessed July 8, 2012 from http://www.ft.
com/cms/s/0/f822dcde-aafa-11e1-b675-
00144feabdc0.html#axzz20Gos5KNV.
Manalastas [SASAdmin] (2011). Sex and the
workplace in Sex and Sensibilities. Sex and
Sensibilities, April 19. Accessed July 8, 2012 from
http://sexandsensibilities.com/2011/04/19/sex-and-
the-workplace/.
Meekers, D. & Klein, M. (2002). Determinant of
condom use among young people in urban
Cameroon. Studies in Family Planning, 33, 4, 335-
346. Mendoza, D. G. (2010). Philippines: Call centre boom
breeds new culture – and risky behaviour. Global
Geopolitics & Political Economy, October 1.
Health Impacts of The Business Process Outsourcing Industry: Condom Use in Call Centers
10
Accessed July 8, 2012 from http://global
geopolitics.net/wordpress/2010/ 10/01/philippines-
call-centre-boom-breeds-new-culture-and-risky-
behaviour/. Ong, C. (2011). HIV cases soar among call-centre
workers in the Philippines. Channel News Asia,
June 10. Accessed July 8, 2012 from http://
www.channelnewsasia.com/stories/southeastasia/v
iew/1134422/ 1/.html.
Ordinario, C. U. (2012). Filipino family needs
P7.6k/mo. to breach poverty line, says NSCB.
Business Mirror, January 19. Accessed July 8, 2012
from http://www.ft.com/cms/s/0/f822dcde-aafa-
11e1-b675-00144feabdc0.
html#axzz20GOs5KNV.
Ramos, L. C. (2010). Study revealing 'risky' behavior of
call center employees unfair. Sun Star Cebu,
February 2. Accessed July 8, 2012 from
http://www.sunstar.com.ph/cebu/study-
revealing-%E2%80%98risky%E2%80%99-
behavior-call-center-employees-unfair.
Senate Economic Planning Office [SEPO] (2010). BPO
industry at a glance. AG-10-01, January 2010.
Accessed August 16, 2010 from http://www.
senate.gov.ph/publications/AG%202010-
01%20-%20BPO% 20Industry.pdf.
Yun, M. & Chu, K. (2011). Philippines passes India in
call center jobs. USA TODAY, January 9. Accessed
July 8, 2012 from http://www.usatoday.com/
money/world/2011-01-10-callcenters10_CV_N.
htm.
Journal of Global Business and Trade Vol. 8, No. 2 (2012)
11
Journal of Global Business and Trade
Development of the Indian Market and Strategies: Focusing on the Middle Income Class Tirtha Bahadur Karki Graduate School of Asian and International Business Strategy, Japan
ARTICLE INFO
ABSTRACT
Keywords: India, Japan, Middle income, Volume zone, Business strategy
Doing business in India is indeed challenging. The paper describes the challenges as well as the emerging opportunities of doing business in India. In recent years India has been experiencing a process of economic and social transformation, becoming the 2nd fastest growing economy and expected to be the 5th largest consumer market by 2015. Nevertheless, the Japanese presence in India in terms of trade and investment is still limited. Traditionally, Japanese businesses have mainly targeted the upper income class in emerging market countries to date, selling them high-quality and high-price products. Underlying sustained growth in India is the ever-increasing middle income class (Volume Zone). There is no doubt that this group has also become an important target for Japanese businesses now. However, this market segment requires new approaches, or the ways of conducting business that are different from what Japanese firms used to carry out. This study thus polled Japanese and foreign firms operating in India to identify common concrete features of their business strategies and operational practices. Its objective is to put together a proposal of business strategies for the Volume zone market segment in India.
I. Introduction
India’s market potential lures foreign companies.
For foreign companies, doing business in India can be
gut-wrenching. Its demanding consumers can be
difficult to read, and local rivals can be surprisingly
tough. For most of its postcolonial life, India has shut
out the world, adhering to a socialist ideal of self-
reliance. Policymakers have been struggling for the past
16 years to attract capital and ignite growth. In 1991, the
government dramatically rejected its socialist past and
admitted foreign investors. The idea was to enlist
foreign companies' aid to turn India into another Asian
Tiger where cheap labor, an English-speaking
workforce, a vast new middle class, and a democratic
government would create a wave of prosperity.
Despite an unprecedented global recession, India
remained the second fastest growing economy in the
world. Whereas most countries suffered negative
growth in at least one quarter over the last two years,
India’s GDP grew by more than 6% throughout this
period. India is the third largest Asian economy after
China and Japan. Among the major emerging markets,
India ranks second in terms of economic growth with
the IMF forecasting a GDP growth rate of 6.9 percent
EVALUATING THE RETURN ON MARKETING EFFORT USING A CUSTOMER EQUITY APPROACH
for 2012. India is the second most populous country in
the world; approximately thirty percent of the country’s
1.2 billion inhabitants reside in urban areas.
India's industrialized economy encompasses
diverse manufacturing sectors (steel production, oil and
gas refining, auto, plastics, textiles) while also including
traditional village farming, modern agriculture, and
handicrafts. Services, especially information
technology, are the major source of economic growth,
accounting for more than half of India's output with less
than one third of its labor force, which is currently
estimated to be 457 million workers1.
Finding new sources for growth is one reason
foreign companies are vigorously investing in Indian
markets, but it’s not the only reason. The Indian
economy is beginning to produce their own powerful
multinationals—Tata and Mittal in India are just two
examples. By entering Indian markets, foreign
multinationals are playing both offense and defense.
They know they must be on the ground in the Indian
economy, investing for the long term, physically close
enough to learn the ways of markets that differ from
those they’re accustomed to. Indian companies now
succeeding as global players have thus far been
confined mainly to the B2B sector, but the makers of
branded, aspirational consumer products are coming up
fast. The day when the Indian markets create major
brands to compete with the established giants is not far
off. The Indian five-star hotel chains Taj and Oberoi are
making forays into Western markets. The Taj Group
recently bought the Ritz-Carlton in Boston, renaming it
the Taj Boston.
Any move into Indian markets will require
innovations in products, technology, and services, as
well as major changes in operating procedures. No
longer can a company simply export a product to a
distribution network in the Indian market and expect it
to succeed. Indian customers, even the poorest, have
become too sophisticated for that. In fact, companies
1 According to Indian US Export Assistance center (USEAC). 2 More than 1,000 Japanese companies enrolled in China.
may have to rethink repetitive business models to
compete effectively.
Whilst Korean firms in particular have found
success in penetrating the Indian market, Japanese
companies remain slow to enter. According to the
Japanese embassy in India, as of October 2011, 813
Japanese firms were active in the Indian market through
1422 separate investments; a growing figure, but one
that pales in comparison with other economic
relationships in the region2. The emerging markets that
are expected to achieve remarkable growth in the future
are geo-graphically far from Japan and are generally
unfamiliar or unknown to Japanese companies. These
markets are expected to be the places of all-out
competition among market participants; achieving
success in the Indian market will be an important step as
a touchstone for setting strategies for other emerging
markets in the future.
Increasing FDI
The number of FDI projects in India increased by
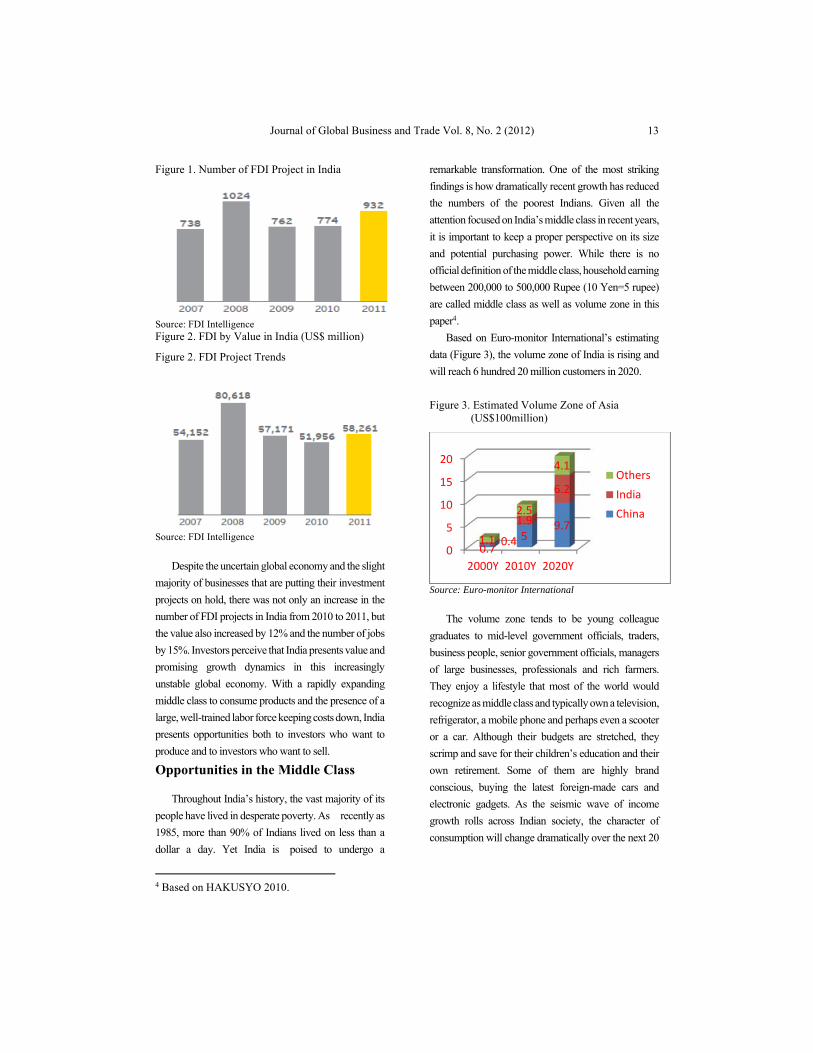
20% in 2011, reaching 932 projects (Figure 1).
Companies have started to invest, albeit cautiously; their
confidence has been supported by the consumer
demand and the easy access to financing and the
increased approvals by the Foreign Investment
Promotion Board 3 . Mirroring the trend seen in the
number of investment projects, investments peaked in
value in 2008. This number declined in 2009 and 2010
following the financial crisis, but returned in 2011
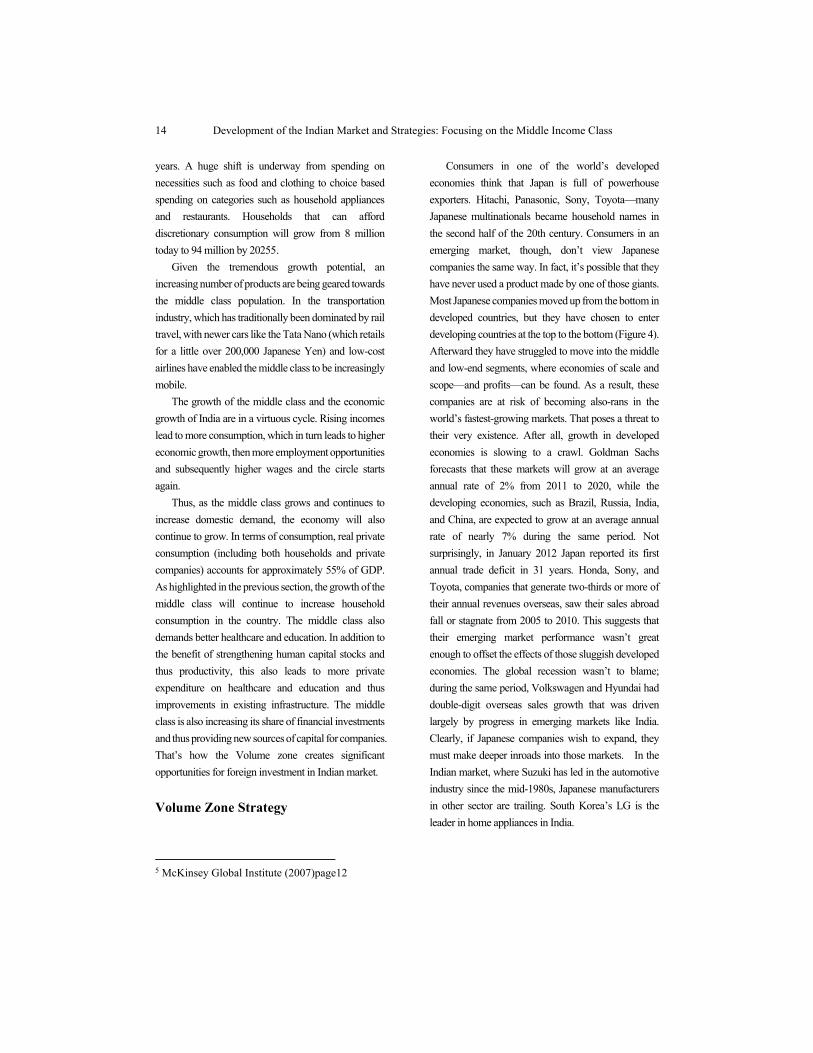
(Figure 2).
3 Ministry of Commerce and Industry, Government of India.
Journal of Global Business and Trade Vol. 8, No. 2 (2012)
13
Figure 1. Number of FDI Project in India
Source: FDI Intelligence Figure 2. FDI by Value in India (US$ million)
Figure 2. FDI Project Trends
Source: FDI Intelligence
Despite the uncertain global economy and the slight
majority of businesses that are putting their investment
projects on hold, there was not only an increase in the
number of FDI projects in India from 2010 to 2011, but
the value also increased by 12% and the number of jobs
by 15%. Investors perceive that India presents value and
promising growth dynamics in this increasingly
unstable global economy. With a rapidly expanding
middle class to consume products and the presence of a
large, well-trained labor force keeping costs down, India
presents opportunities both to investors who want to
produce and to investors who want to sell.
Opportunities in the Middle Class
Throughout India’s history, the vast majority of its
people have lived in desperate poverty. As recently as
1985, more than 90% of Indians lived on less than a
dollar a day. Yet India is poised to undergo a
4 Based on HAKUSYO 2010.
remarkable transformation. One of the most striking
findings is how dramatically recent growth has reduced
the numbers of the poorest Indians. Given all the
attention focused on India’s middle class in recent years,
it is important to keep a proper perspective on its size
and potential purchasing power. While there is no
official definition of the middle class, household earning
between 200,000 to 500,000 Rupee (10 Yen=5 rupee)
are called middle class as well as volume zone in this
paper4.
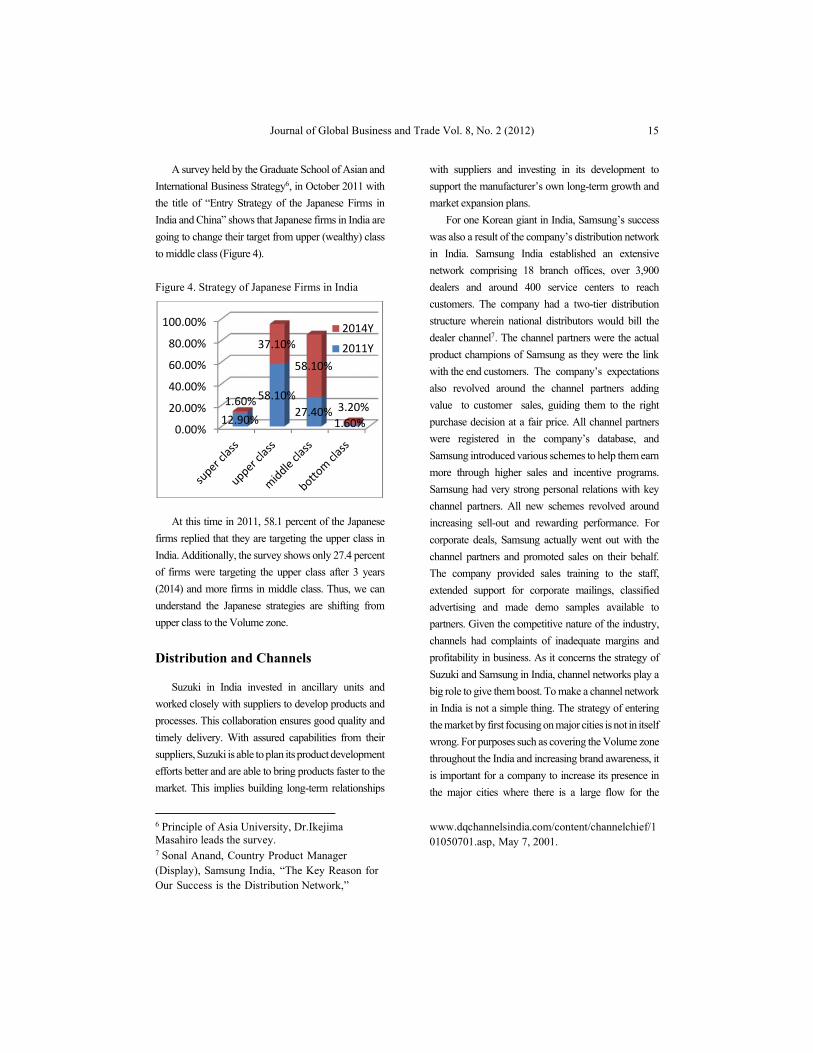
Based on Euro-monitor International’s estimating
data (Figure 3), the volume zone of India is rising and
will reach 6 hundred 20 million customers in 2020.
Figure 3. Estimated Volume Zone of Asia (US$100million)
Source: Euro-monitor International
The volume zone tends to be young colleague
graduates to mid-level government officials, traders,
business people, senior government officials, managers
of large businesses, professionals and rich farmers.
They enjoy a lifestyle that most of the world would
recognize as middle class and typically own a television,
refrigerator, a mobile phone and perhaps even a scooter
or a car. Although their budgets are stretched, they
scrimp and save for their children’s education and their
own retirement. Some of them are highly brand
conscious, buying the latest foreign-made cars and
electronic gadgets. As the seismic wave of income
growth rolls across Indian society, the character of
consumption will change dramatically over the next 20
0
5
10
15
20
2000Y 2010Y 2020Y
0.75
9.7
0.4
1.9
6.2
1.1
2.5
4.1Others
India
China
Development of the Indian Market and Strategies: Focusing on the Middle Income Class
14
years. A huge shift is underway from spending on
necessities such as food and clothing to choice based
spending on categories such as household appliances
and restaurants. Households that can afford
discretionary consumption will grow from 8 million
today to 94 million by 20255.
Given the tremendous growth potential, an
increasing number of products are being geared towards
the middle class population. In the transportation
industry, which has traditionally been dominated by rail
travel, with newer cars like the Tata Nano (which retails
for a little over 200,000 Japanese Yen) and low-cost
airlines have enabled the middle class to be increasingly
mobile.
The growth of the middle class and the economic
growth of India are in a virtuous cycle. Rising incomes
lead to more consumption, which in turn leads to higher
economic growth, then more employment opportunities
and subsequently higher wages and the circle starts
again.
Thus, as the middle class grows and continues to
increase domestic demand, the economy will also
continue to grow. In terms of consumption, real private
consumption (including both households and private
companies) accounts for approximately 55% of GDP.
As highlighted in the previous section, the growth of the
middle class will continue to increase household
consumption in the country. The middle class also
demands better healthcare and education. In addition to
the benefit of strengthening human capital stocks and
thus productivity, this also leads to more private
expenditure on healthcare and education and thus
improvements in existing infrastructure. The middle
class is also increasing its share of financial investments
and thus providing new sources of capital for companies.
That’s how the Volume zone creates significant
opportunities for foreign investment in Indian market.
Volume Zone Strategy
5 McKinsey Global Institute (2007)page12
Consumers in one of the world’s developed
economies think that Japan is full of powerhouse
exporters. Hitachi, Panasonic, Sony, Toyota—many
Japanese multinationals became household names in
the second half of the 20th century. Consumers in an
emerging market, though, don’t view Japanese
companies the same way. In fact, it’s possible that they
have never used a product made by one of those giants.
Most Japanese companies moved up from the bottom in
developed countries, but they have chosen to enter
developing countries at the top to the bottom (Figure 4).
Afterward they have struggled to move into the middle
and low-end segments, where economies of scale and
scope—and profits—can be found. As a result, these
companies are at risk of becoming also-rans in the
world’s fastest-growing markets. That poses a threat to
their very existence. After all, growth in developed
economies is slowing to a crawl. Goldman Sachs
forecasts that these markets will grow at an average
annual rate of 2% from 2011 to 2020, while the
developing economies, such as Brazil, Russia, India,
and China, are expected to grow at an average annual
rate of nearly 7% during the same period. Not
surprisingly, in January 2012 Japan reported its first
annual trade deficit in 31 years. Honda, Sony, and
Toyota, companies that generate two-thirds or more of
their annual revenues overseas, saw their sales abroad
fall or stagnate from 2005 to 2010. This suggests that
their emerging market performance wasn’t great
enough to offset the effects of those sluggish developed
economies. The global recession wasn’t to blame;
during the same period, Volkswagen and Hyundai had
double-digit overseas sales growth that was driven
largely by progress in emerging markets like India.
Clearly, if Japanese companies wish to expand, they
must make deeper inroads into those markets. In the
Indian market, where Suzuki has led in the automotive
industry since the mid-1980s, Japanese manufacturers
in other sector are trailing. South Korea’s LG is the
leader in home appliances in India.
Journal of Global Business and Trade Vol. 8, No. 2 (2012)
15
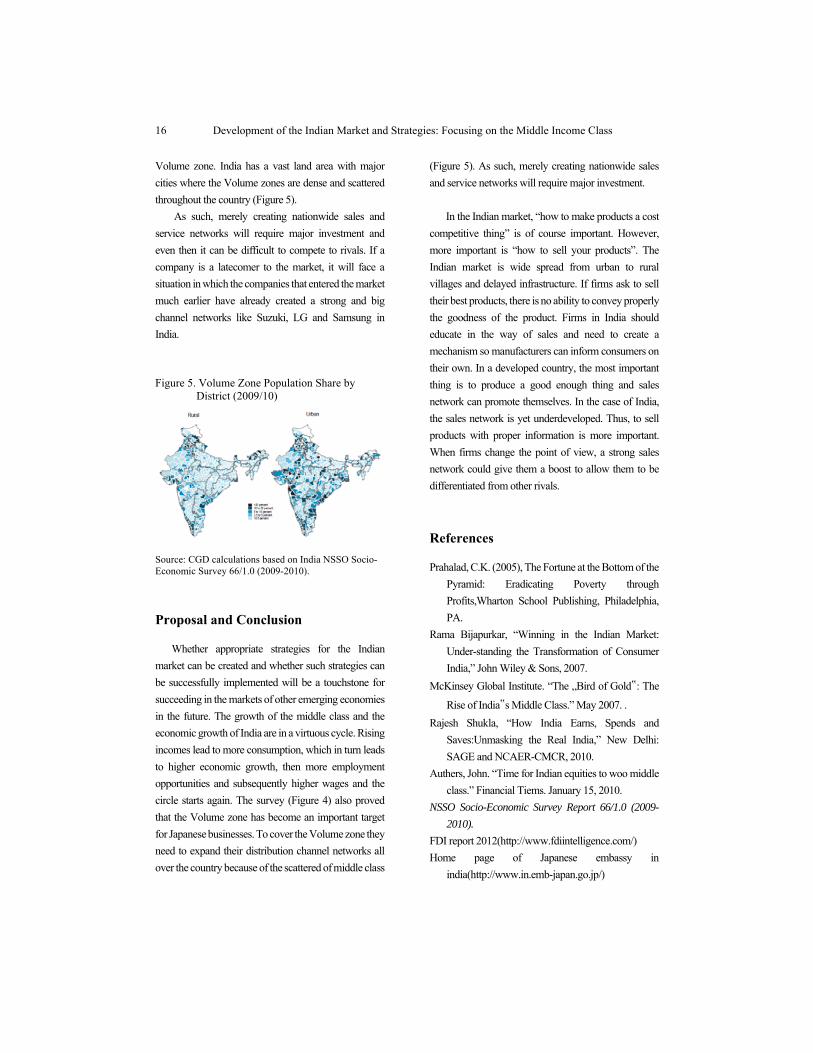
A survey held by the Graduate School of Asian and
International Business Strategy6, in October 2011 with
the title of “Entry Strategy of the Japanese Firms in
India and China” shows that Japanese firms in India are
going to change their target from upper (wealthy) class
to middle class (Figure 4).
Figure 4. Strategy of Japanese Firms in India
At this time in 2011, 58.1 percent of the Japanese
firms replied that they are targeting the upper class in
India. Additionally, the survey shows only 27.4 percent
of firms were targeting the upper class after 3 years
(2014) and more firms in middle class. Thus, we can
understand the Japanese strategies are shifting from
upper class to the Volume zone.
Distribution and Channels
Suzuki in India invested in ancillary units and
worked closely with suppliers to develop products and
processes. This collaboration ensures good quality and
timely delivery. With assured capabilities from their
suppliers, Suzuki is able to plan its product development
efforts better and are able to bring products faster to the
market. This implies building long-term relationships
6 Principle of Asia University, Dr.Ikejima Masahiro leads the survey. 7 Sonal Anand, Country Product Manager (Display), Samsung India, “The Key Reason for Our Success is the Distribution Network,”
with suppliers and investing in its development to
support the manufacturer’s own long-term growth and
market expansion plans.
For one Korean giant in India, Samsung’s success
was also a result of the company’s distribution network
in India. Samsung India established an extensive
network comprising 18 branch offices, over 3,900
dealers and around 400 service centers to reach
customers. The company had a two-tier distribution
structure wherein national distributors would bill the
dealer channel7. The channel partners were the actual
product champions of Samsung as they were the link
with the end customers. The company’s expectations
also revolved around the channel partners adding
value to customer sales, guiding them to the right
purchase decision at a fair price. All channel partners
were registered in the company’s database, and
Samsung introduced various schemes to help them earn
more through higher sales and incentive programs.
Samsung had very strong personal relations with key
channel partners. All new schemes revolved around
increasing sell-out and rewarding performance. For
corporate deals, Samsung actually went out with the
channel partners and promoted sales on their behalf.
The company provided sales training to the staff,
extended support for corporate mailings, classified
advertising and made demo samples available to
partners. Given the competitive nature of the industry,
channels had complaints of inadequate margins and
profitability in business. As it concerns the strategy of
Suzuki and Samsung in India, channel networks play a
big role to give them boost. To make a channel network
in India is not a simple thing. The strategy of entering
the market by first focusing on major cities is not in itself
wrong. For purposes such as covering the Volume zone
throughout the India and increasing brand awareness, it
is important for a company to increase its presence in
the major cities where there is a large flow for the
www.dqchannelsindia.com/content/channelchief/101050701.asp, May 7, 2001.
0.00%
20.00%
40.00%
60.00%
80.00%
100.00%
12.90%
58.10%
27.40%1.60%
1.60%
37.10%
58.10%
3.20%
2014Y
2011Y
Development of the Indian Market and Strategies: Focusing on the Middle Income Class
16
Volume zone. India has a vast land area with major
cities where the Volume zones are dense and scattered
throughout the country (Figure 5).
As such, merely creating nationwide sales and
service networks will require major investment and
even then it can be difficult to compete to rivals. If a
company is a latecomer to the market, it will face a
situation in which the companies that entered the market
much earlier have already created a strong and big
channel networks like Suzuki, LG and Samsung in
India.
Figure 5. Volume Zone Population Share by District (2009/10)
Source: CGD calculations based on India NSSO Socio-Economic Survey 66/1.0 (2009-2010).
Proposal and Conclusion
Whether appropriate strategies for the Indian
market can be created and whether such strategies can
be successfully implemented will be a touchstone for
succeeding in the markets of other emerging economies
in the future. The growth of the middle class and the
economic growth of India are in a virtuous cycle. Rising
incomes lead to more consumption, which in turn leads
to higher economic growth, then more employment
opportunities and subsequently higher wages and the
circle starts again. The survey (Figure 4) also proved
that the Volume zone has become an important target
for Japanese businesses. To cover the Volume zone they
need to expand their distribution channel networks all
over the country because of the scattered of middle class
(Figure 5). As such, merely creating nationwide sales
and service networks will require major investment.
In the Indian market, “how to make products a cost
competitive thing” is of course important. However,
more important is “how to sell your products”. The
Indian market is wide spread from urban to rural
villages and delayed infrastructure. If firms ask to sell
their best products, there is no ability to convey properly
the goodness of the product. Firms in India should
educate in the way of sales and need to create a
mechanism so manufacturers can inform consumers on
their own. In a developed country, the most important
thing is to produce a good enough thing and sales
network can promote themselves. In the case of India,
the sales network is yet underdeveloped. Thus, to sell
products with proper information is more important.
When firms change the point of view, a strong sales
network could give them a boost to allow them to be
differentiated from other rivals.
References
Prahalad, C.K. (2005), The Fortune at the Bottom of the
Pyramid: Eradicating Poverty through
Profits,Wharton School Publishing, Philadelphia,
PA.
Rama Bijapurkar, “Winning in the Indian Market:
Under-standing the Transformation of Consumer
India,” John Wiley & Sons, 2007.
McKinsey Global Institute. “The „Bird of Gold‟: The
Rise of India‟s Middle Class.” May 2007. .
Rajesh Shukla, “How India Earns, Spends and
Saves:Unmasking the Real India,” New Delhi:
SAGE and NCAER-CMCR, 2010.
Authers, John. “Time for Indian equities to woo middle
class.” Financial Tiems. January 15, 2010.
NSSO Socio-Economic Survey Report 66/1.0 (2009-
2010).
FDI report 2012(http://www.fdiintelligence.com/)
Home page of Japanese embassy in
india(http://www.in.emb-japan.go.jp/)
Journal of Global Business and Trade Vol. 8, No. 2 (2012)
17
Journal of Global Business and Trade
Transforming Agrarian Reform Beneficiaries into Agricultural Entrepreneurs: The Case of The Abaca Production with Processing in BOAC, Marinduque, Philippines Rolando T. Bello,a Amelia L. Bello b a Institute of Governance and Rural Development, College of Public Affairs, University of the Philippines Los Banos b Department of Economics, College of Economics and Management, University of the Philippines Los Banos
ARTICLE INFO
ABSTRACT
Keywords: abaca, multi-purpose cooperative, agrarian reform beneficiary organization
The paper illustrates the transition process faced by a multipurpose cooperative operating in an agrarian reform community as it evolves into an agri-business enterprise. The cooperative is considered an agrarian reform beneficiary organization, having been formed by agrarian reform beneficiaries. The cooperative is proposing to grow abaca and use it in the making of slippers. A needs assessment framework was utilized.
I. Introduction
The Philippines may be considered the “Abaca
Capital of the World”; contributing some 87% of the
total world abaca fiber production (Panti, 2010). In the
last decade, it contributed an average of US$ 77 million
annually in export earnings and employed about 1.5
million Filipinos. It is cultivated in about 140,000
hectares in 52 provinces (Panti, 2010).
Abaca is traditionally used for cordage due to its
durability, strength and resistance to saltwater
decomposition. It is also used to make filter paper,
sausage skins, cigarette papers, medical gas masks and
currency papers (NARC, 2009 as cited in Panti, 2010).
Abaca is likewise fashioned into novelty items known
as fiber crafts. These include handbags, footwear,
baskets, wall coverings and draperies. The Philippine
fiber craft industry exports its produce to the United
States, the United Kingdom, Hongkong, Japan,
Netherlands and West Germany (Teodoro, 1989 as
cited in Bellen, 2009).
Transforming Agrarian Reform Beneficiaries into Agricultural Entrepreneurs: The Case of The Abaca Production with Processing in BOAC, Marinduque, Philippines
18
Meanwhile, the Department of Agrarian Reform
(DAR) is the lead government agency in the
implementation of the Comprehensive Agrarian
Reform Program (CARP) which is comprised of three
components, namely land tenure improvement, agrarian
justice, and coordinated delivery of essential support
services to farmer-beneficiaries. In line with this, the
department is tasked with the mandate to help improve
the over-all socio-economic well-being of agrarian
reform beneficiaries (ARBs) and other smallholder
farmers through the provision of support services to
exploit agricultural opportunities and maximize the
utilization of their land.
As part of the extension of the appropriate support
services, the DAR has continuously implemented
special projects in agrarian reform communities (ARCs)
nationwide, one of which is the Agrarian Reform
Community Connectivity and Economic Support
Services (ARCCESS) Project which was
conceptualized and designed by the DAR as a
government-led initiative to tap an intersectoral (public-
social-private) partnership. It aims to provide
sustainable livelihoods through the organization of
competitive agricultural enterprises, thereby
transforming ARBs into viable entrepreneurs by
providing support services that will consequently
increase their household incomes and improve their
farming capabilities. Through ARCCESS, DAR,
together with other partner agencies, will teach new
agricultural technologies and business development and
management to farmer organizations and provide farm
equipment and machinery to improve and increase their
yields. The ARCCESS is initially designed to be
implemented for a maximum period of three (3) years.
II. Objectives
The objectives of this paper are to describe the
entrepreneurial project of the Tanikala sa Pagkakaisa
Multi-Purpose Cooperative and to evaluate the
proposed slipper project using a needs assessment
framework. A needs assessment is a systematic
approach to identify the nature and scope of the social
problem being addressed as well as the reasons that are
causing the undesirable outcomes, to define the target
population to be served, and to determine the services
needed to meet the problem.
The Tanikala ng Pagkakaisa Multi-Purpose
Cooperative was organized in 2006 and operates in
Kansurok-Tugos, Boac, Marinduque.
III. The Abaca Industry in the Philippines
Abaca production in the Philippines is dominated
by three areas: Eastern Visayas, Bicol and Davao. The
first contributes some 42% to total abaca output, Bicol
produces some 29% while Davao is responsible for
about 13% Thus, the three areas account for 84% of
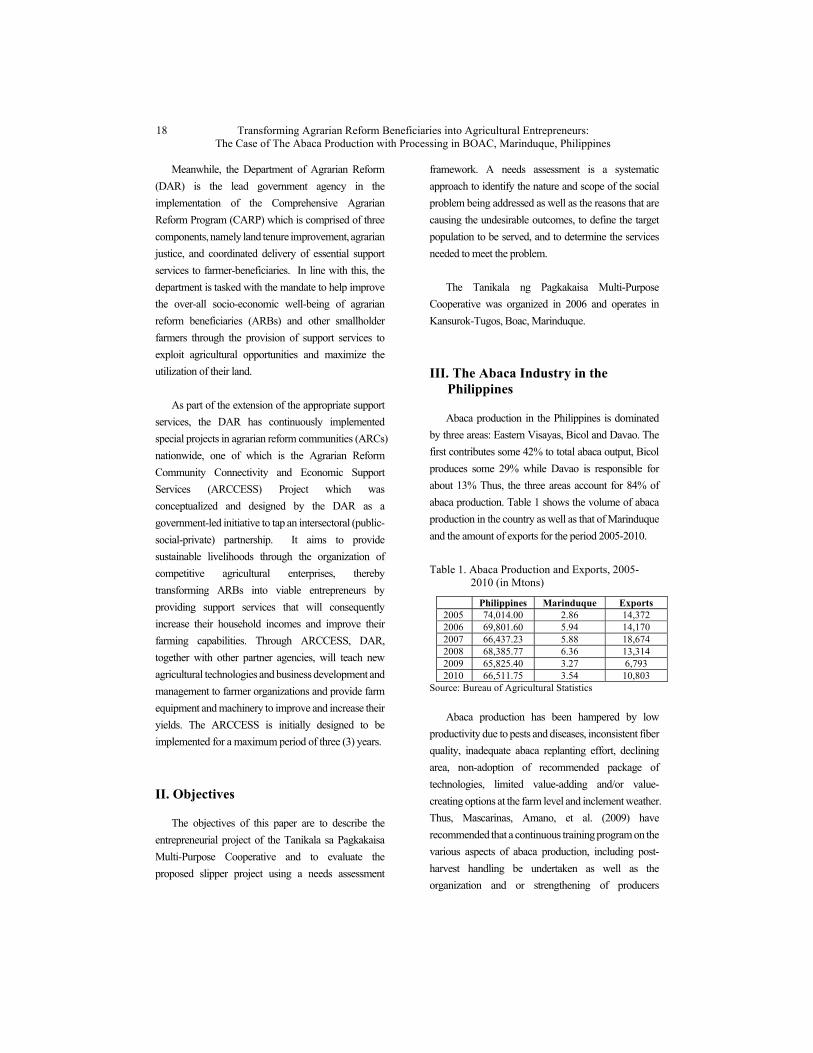
abaca production. Table 1 shows the volume of abaca
production in the country as well as that of Marinduque
and the amount of exports for the period 2005-2010.
Table 1. Abaca Production and Exports, 2005-2010 (in Mtons)
Philippines Marinduque Exports 2005 74,014.00 2.86 14,372 2006 69,801.60 5.94 14,170 2007 66,437.23 5.88 18,674 2008 68,385.77 6.36 13,314 2009 65,825.40 3.27 6,793 2010 66,511.75 3.54 10,803
Source: Bureau of Agricultural Statistics
Abaca production has been hampered by low
productivity due to pests and diseases, inconsistent fiber
quality, inadequate abaca replanting effort, declining
area, non-adoption of recommended package of
technologies, limited value-adding and/or value-
creating options at the farm level and inclement weather.
Thus, Mascarinas, Amano, et al. (2009) have
recommended that a continuous training program on the
various aspects of abaca production, including post-
harvest handling be undertaken as well as the
organization and or strengthening of producers
Journal of Global Business and Trade Vol. 8, No. 2 (2012)
19
associations among farmers. They have also urged the
design and development of a portable abaca stripper.
Abaca is presently made into rope, clothing, and
footwear as well as tea bags, meat/sausage casings,
cigarette papers, filter papers, currency and bank notes,
and surgical masks. It can also be made into bags, hats,
rugs, hot pads, placemats and coasters. A Camalig,
Albay-based exporter prides itself in producing abaca
wall coverings, rugs/tapestries and sunshades. The
abaca stalk can be made into decorative accessories like
table-top runners and fashion accessories and is also
used in sinamay weaving. The abaca seeds can be used
as food; it is used to make cosmetics and skin care
products while its industrial uses include paints and ink.
Indonesia and Ecuador are two of the country’s
competitors.
IV. Conceptual Framework and Methodology
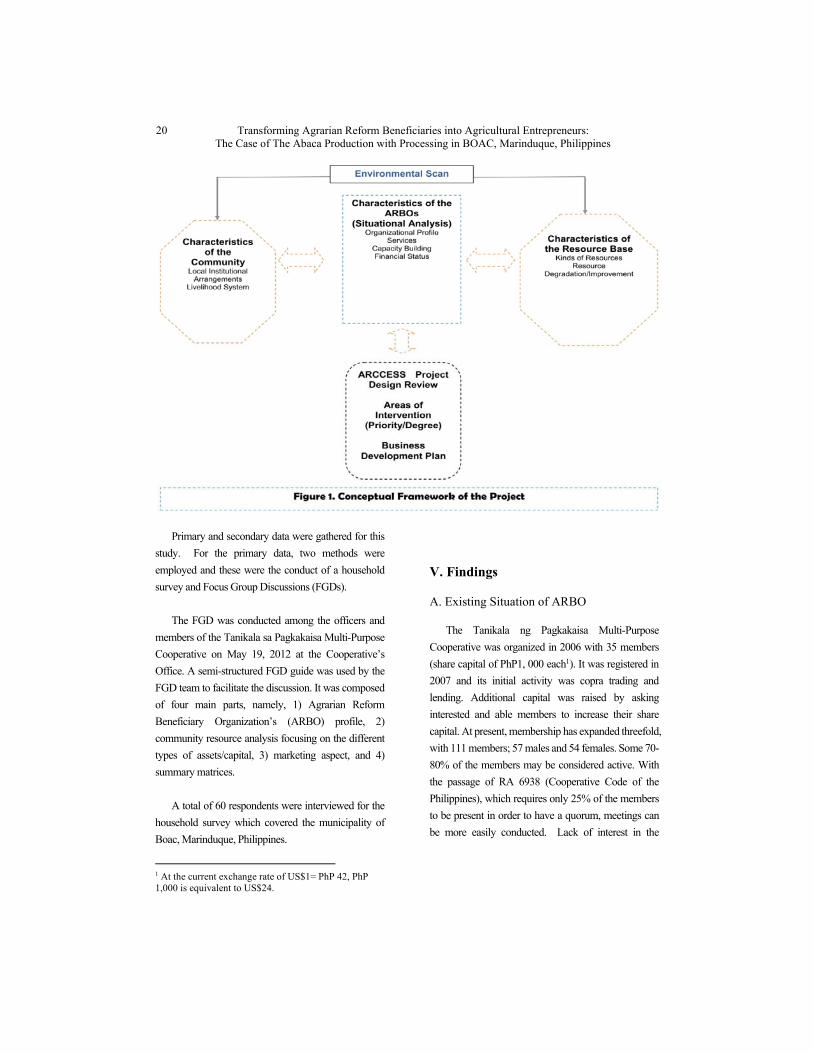
Figure 1 presents the conceptual framework of the
needs assessment of the proposed abaca enterprise
project. In order to make these planned business projects
thrive and eventually be effective, there is a need to
review the proposed projects, including their designs so
that the embodied components and activities match the
needs and strengths of the target organizations and
beneficiaries. The design review will involve
identifying the appropriate areas of interventions as well
as the priority sequence of these interventions. A work
breakdown will underscore the order of interventions to
facilitate project implementation.
Corollary to the design review is the assessment of
needs that can be done through an environmental scan
describing the organizations, the communities and their
corresponding resource bases. The characterizations of
the organizations is imperative in assessing their
strengths and weaknesses in adopting and
implementing the proposed projects. This may include
the current profile, existing services and capacities as
well as the financial standing of these target
organizations.
An examination of the resources, both of the
community and natural surroundings, will aid in
furthering the effectiveness of the projects. This may
entail appraising the present institutional arrangements
and livelihood opportunities coupled with the types of
resources and their conditions, among others. This has
the end view of identifying and subsequently providing
the complementary and supplementary means to
achieve project success.
Transforming Agrarian Reform Beneficiaries into Agricultural Entrepreneurs: The Case of The Abaca Production with Processing in BOAC, Marinduque, Philippines
20
Primary and secondary data were gathered for this
study. For the primary data, two methods were
employed and these were the conduct of a household
survey and Focus Group Discussions (FGDs).
The FGD was conducted among the officers and
members of the Tanikala sa Pagkakaisa Multi-Purpose
Cooperative on May 19, 2012 at the Cooperative’s
Office. A semi-structured FGD guide was used by the
FGD team to facilitate the discussion. It was composed
of four main parts, namely, 1) Agrarian Reform
Beneficiary Organization’s (ARBO) profile, 2)
community resource analysis focusing on the different
types of assets/capital, 3) marketing aspect, and 4)
summary matrices.
A total of 60 respondents were interviewed for the
household survey which covered the municipality of
Boac, Marinduque, Philippines.
1 At the current exchange rate of US$1= PhP 42, PhP 1,000 is equivalent to US$24.
V. Findings
A. Existing Situation of ARBO
The Tanikala ng Pagkakaisa Multi-Purpose
Cooperative was organized in 2006 with 35 members
(share capital of PhP1, 000 each1). It was registered in
2007 and its initial activity was copra trading and
lending. Additional capital was raised by asking
interested and able members to increase their share
capital. At present, membership has expanded threefold,
with 111 members; 57 males and 54 females. Some 70-
80% of the members may be considered active. With
the passage of RA 6938 (Cooperative Code of the
Philippines), which requires only 25% of the members
to be present in order to have a quorum, meetings can
be more easily conducted. Lack of interest in the
Journal of Global Business and Trade Vol. 8, No. 2 (2012)
21
cooperative, little or limited information on what being
a cooperative member entails, and low income were
among the reasons cited for members being inactive in
the cooperative.
The Cooperative’s latest profile shows a share
capital of over PhP275 thousand and savings of PhP
45.9 thousand. Copra trading and lending (emergency,
livelihood and regular) remain to be its activities but it
has expanded to also include abaca production, the
production of abaca slippers, scrunch and macrame
bags, abaca twine, upland rice production (organic) and
savings deposits. Agricultural mortgaging has been
discontinued.
The Cooperative has allotted some PhP200
thousand for lending. Outstanding loans at present
amount to some PhP 150 thousand. Almost all
members have availed of loans; loans under PhP 5
thousand must be paid in three months while loans from
over PhP5 thousand to PhP10 thousand must be settled
within six months. The Cooperative talks and sends a
letter to delinquent borrowers.
Monthly dues are PhP20.00; interest and other
charges on loans are 4% (2% is interest, 1% is service
fee and 1% goes to retained earnings).
Loans and grants availed by the Cooperative
included a PhP 50,000 grant from the local government
of Boac , a shoe grinder and sander from the
Department of Trade and Industry (DTI) and a sewing
machine from the Rotary Club.
The Cooperative has been recipient of a number of
training projects. These include: silk screening, simple
book keeping, cooperative management and
governance, abaca production and stripping, and
extraction and application of natural dyes to indigenous
fibers. It has also been the recipient of workshops on
action planning, entrepreneurship and skills training.
The cooperating agencies were DAR, the Cooperative
Development Authority (CDA), Fiber Industry and
Development Authority (FIDA), the DTI, Department
of Science and Technology (DOST), Department of
Labor and Employment (DOLE) and the provincial
government. The Cooperative has been recognized as
an outstanding CARP organization and has been cited
as having achieved the highest organizational maturity
level (level 5) in 2009, 2010 and 2011 among the
existing cooperatives.
The Cooperative is governed by a Board of
Directors and has the following committees: Credit,
Audit and Inventory, Education and Training, Election
and Mediation and Conciliation. There are two project
committees to oversee copra trading and abaca
processing. The Cooperative’s Board of Directors
meets every first Saturday of the month while the
General Assembly is conducted within 90 days after the
fiscal year.
Copra trading has not been lucrative in the past year.
Some farmers chose to sell their copra to private traders
who were willing to pay two pesos more per kilo in
order to get a larger volume. The Cooperative sells its
copra to a miller in Lucena. Last year, it was able to sell
the copra at PhP24 per kilo, netting the farmers PhP12
per kilo. One fourth of the proceeds from the sale are
kept by the Cooperative as incentives.
The Cooperative keeps office in a modest structure
with a roof, but the floor remains sand. Though the
office has no locks and the four sewing machines and
the other raw materials are stored here, nothing has been
reported missing.
Financial statements for the last three years show
that the sales from copra trading ranged from PhP 1.2
million in 2011 to PhP2.4 million in 2010 and PhP 1.8
million in 2009. The drop in sales in 2011 was due to
the low volume of copra as well as the low market price.
Gross profits from copra trading thus slid to PhP 119
thousand in 2011, down from PhP 363 thousand the
year before and PhP 214 thousand in 2009. Other
Transforming Agrarian Reform Beneficiaries into Agricultural Entrepreneurs: The Case of The Abaca Production with Processing in BOAC, Marinduque, Philippines
22
income contributed a modest amount of PhP 28
thousand in 2011, PhP 46 thousand in 2010 and PhP36
thousand in 2009; expenses ranged from PhP 102
thousand in 2011, PhP 161 thousand in 2010 and PhP
104 thousand in 2009 which translated to a net surplus
of PhP 46 thousand in 2011, PhP 248 thousand in 2010
and PhP 146 thousand in 2009
B. Environmental Scan
The Ugnayang Bayan ARC Cluster is located in a
hilly and mountainous terrain with limited plains.
Lengthy, snake-like earth-gravel roads provide
accessibility to the area. However, during rainy seasons,
travel is difficult because the rivers can flood and certain
sections of the road become muddy due to the lack of
drainage structures. The soil is of clay or sandy loam.
Agriculture, in particular coconut farming, is the
main livelihood of the households in the community.
Seasonal crops like rice, corn and a variety of root crops
(ginger) are also grown. Bananas (saba and latundan)
are planted, though haphazardly, between coconut trees.
Mono-cropping remains to be the usual farming system
and no major crop is cultivated on a large scale.
Households also engage in backyard livestock-raising.
A majority of the households also raise butterflies.
Aside from the processed abaca products, other
products of the community are turmeric powder, coco
vinegar, and instant ginger tea. All four products are
marketed domestically.
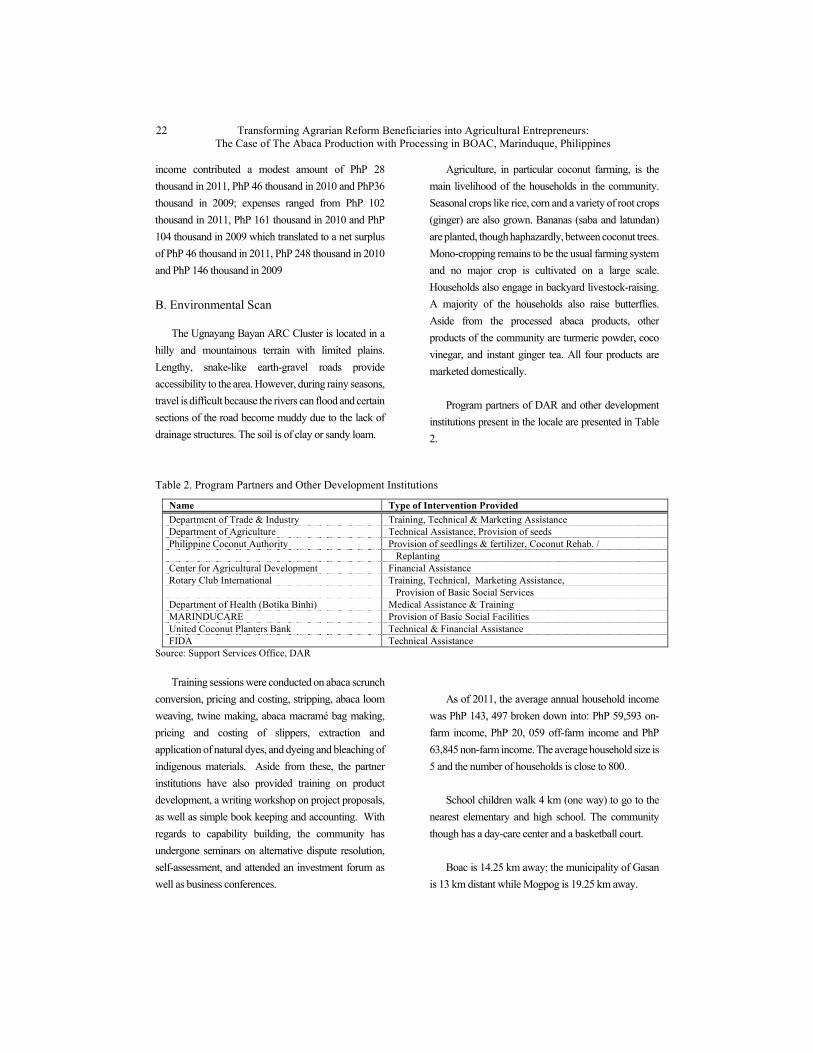
Program partners of DAR and other development
institutions present in the locale are presented in Table
2.
Table 2. Program Partners and Other Development Institutions
Name Type of Intervention Provided
Department of Trade & Industry Training, Technical & Marketing Assistance Department of Agriculture Technical Assistance, Provision of seeds Philippine Coconut Authority Provision of seedlings & fertilizer, Coconut Rehab. / Replanting Center for Agricultural Development Financial Assistance Rotary Club International Training, Technical, Marketing Assistance, Provision of Basic Social Services Department of Health (Botika Binhi) Medical Assistance & Training MARINDUCARE Provision of Basic Social Facilities United Coconut Planters Bank Technical & Financial Assistance FIDA Technical Assistance
Source: Support Services Office, DAR
Training sessions were conducted on abaca scrunch
conversion, pricing and costing, stripping, abaca loom
weaving, twine making, abaca macramé bag making,
pricing and costing of slippers, extraction and
application of natural dyes, and dyeing and bleaching of
indigenous materials. Aside from these, the partner
institutions have also provided training on product
development, a writing workshop on project proposals,
as well as simple book keeping and accounting. With
regards to capability building, the community has
undergone seminars on alternative dispute resolution,
self-assessment, and attended an investment forum as
well as business conferences.
As of 2011, the average annual household income
was PhP 143, 497 broken down into: PhP 59,593 on-
farm income, PhP 20, 059 off-farm income and PhP
63,845 non-farm income. The average household size is
5 and the number of households is close to 800.
School children walk 4 km (one way) to go to the
nearest elementary and high school. The community
though has a day-care center and a basketball court.
Boac is 14.25 km away; the municipality of Gasan
is 13 km distant while Mogpog is 19.25 km away.
Journal of Global Business and Trade Vol. 8, No. 2 (2012)
23
C. The Proposed Project
An Abaca Production with Processing Project in the
amount of PhP 1,169,000 is being proposed for funding
by the DAR. The proposed beneficiary organization is
the Tanikala ng Pagkakaisa Multi-Purpose Cooperative.
Equity from the proponent will amount to PhP 264,750
while collaborating agencies will contribute PhP
295,000. Thus, the project’s total amount is PhP
1,728,750.
The proposed 10-year project basically involves the
production and processing of abaca fiber. Abaca was
previously commercially grown in the area, but the
introduction of nylon ropes and other synthetic products
led to its wane. However, the present global call for
environmental preservation and conservation has
revived interest in the fibers sourced from natural
products.
Abaca is the source of fibrous materials which are
made and woven into ropes and other indigenous
products like bags, mats, slippers, etc. It is also a raw
material in the production of various international
currencies like the Japanese yen.
The general objective of the project is to establish an
alternative eco-friendly agri-based industry which will
utilize a greater number of idle agricultural land
resources for the purpose of generating additional
employment opportunities for the province of
Marinduque. In particular, there are 5 specific
objectives; namely:
a. To expand abaca production areas in Barangay Tugos to at least ten hectares by 2012 and to reach 50 hectares by the fifth year of implementation;
b. To provide a fiber production center in Barangay Tugos by 2012;
1 Marikina is known as the “Shoe Capital” of the
Philippines.
c. To acquire a one each of a mobile spindle stripping machine, a weighing scale (baskula), a denting machine and a “hilohan” by 2012;
d. To acquire two additional heavy duty industrial sewing machines by 2012; and
e. To generate an initial 30 rural employment opportunities in Barangay Tugos by 2012 and an additional 20 rural employment opportunities by 2013.
The production of slippers made from abaca has
been identified and assigned to the Tanikala ng
Pagkakaisa Multi-Purpose Cooperative. The
cooperative has participated in various trade fairs and its
products were well-appreciated by the market. Last
year, the Cooperative has recorded PhP 45 thousand
from sales of 300 slippers and netted PhP 13,000. One
kilo of fiber is enough to make 25 slippers, which can
be produced in a day.
D. Constraints
This section summarizes the constraints faced by
the cooperative as it embarks on the proposed project.
i. Raw Materials – The Cooperative has received an offer for 6,000 slippers a month, but due to the tight supply of abaca fibers (as well as a lack of improved processing equipment and facilities), the Cooperative had to turn down the offer. The Cooperative’s plans might also be hampered by the absence of an “abaca fiber specialist” in the province who can readily be consulted should the need arise. Other raw materials are sourced from Marikina1 and the Cooperative anticipates no major problems as long as it has the financial capital to buy the inputs. The Cooperative hopes to devise an arrangement with the Marikina supplier so that physical travel to Marikina is minimized.
ii. Power – Adequate power is needed to operate the sewing machines, electric fans, computer and other equipment and to provide ample lighting in the production center and office. A
Transforming Agrarian Reform Beneficiaries into Agricultural Entrepreneurs: The Case of The Abaca Production with Processing in BOAC, Marinduque, Philippines
24
more reliable connection is also needed for the use of cell phones.
iii. Equipment - A stainless steel vat suitable for preparing the dye needs to be fabricated. At present, the Cooperative uses “baldes” but they easily get destroyed after just several uses. A dryer is needed because the abaca fibers need to be air dried. Drying them under the sun causes discoloration and affects the quality of the fiber. Likewise, mobile implements like a stripping machine are necessary to eliminate the hauling of abaca stalks for stripping. Other equipment necessary are: a twining/twisting machine, an abaca slicer/shaver, a weighing scale, a “hilohan”, sewing machines, a computer, filing cabinets, office tables and chairs. Finally, a vehicle is needed by the cooperative to transport the inputs and finished products. A vehicle is badly needed given the distance and the current state of the roads.
iv. Market and Product Development – More hands are needed in the various stages of production. This is especially true in the actual laying of the woven and dyed fibers onto the rubber soles. Continuous training in product design and innovation is a must for the Cooperative to keep abreast with new trends in the market. A system also must be put into place to look after the inventory position of the different inputs and semi-processed abaca fibers as well as finished abaca products. A target sales objective should also be set.
v. Costs - At present, a pair of slippers cost PhP 120.00. Raw materials cost PhP52.50 while labor amounts to PhP 67.50. Continuous monitoring of the cost structure is necessary. Already, there are comments on the high labor costs, which could potentially limit the market for the slippers.
vi. Organizational Management – Though the Cooperative has been a recipient of several awards, continuous training or seminars for cooperative management to sustain the organization’s viability and enable it to better serve its members are vital. Organizational strengthening activities are needed, especially at the start. These activities will not only promote the cooperative and its programs but also attract young and potential members. It has been observed that not many members want to be officers. Likewise, activities that will
further improve the financial management skills of the members are necessary. Thus, a computer, office tables, filing cabinets, and other office equipment must be procured. It would also be beneficial if the cooperative members can take the Personal Entrepreneurial Competence (PEC) assessment to establish some baseline data and ascertain their entrepreneurial skills.
vii. Production Center and Cooperative Office – Right now, the Cooperative’s office stands on land belonging to the brother of the Chairman. The owner is willing to have the Cooperative use the land as long as the Cooperative exists. A written agreement to this effect must be drafted. The office has no locks. The Cooperative’s office also serves as the production area where the semi-finished slippers are completed. However, provisions must be made for a bigger office if the production center will also be housed there. While at the moment some people choose to work at home, this might not be true in the future.
E. Areas of Intervention
The Cooperative is very grateful for the help
extended by the following agencies: DAR, the CDA,
the Department of Agriculture (DA) - FIDA, DTI,
DOST, the provincial government of Marinduque, local
government of Boac, the Rotary Club, and the United
Coconut Planters Bank (UCPB).
DAR, with the help of the CDA, organized the
cooperative. The DA –FDA gave seeds and technical
assistance while the DTI conducted seminars and
through trade fairs promoted the Cooperative’s products.
The Municipal government gave PhP 50,000 for the
purchase of three sewing machines while the Rotary
Club donated a sewing machine and also helped in the
butterfly and silk screening projects; the DOST helped
in the use of natural dyes while the UCPB lent money
for the Cooperative’s copra trading activity.
With the proposed project, the Cooperative would
appreciate the same assistance from the mentioned
Journal of Global Business and Trade Vol. 8, No. 2 (2012)
25
agencies. In particular, the following interventions are
noted:
a. DAR – The DAR must oversee the proposed project. It must monitor and evaluate the project from its inception to its operation. It must troubleshoot any problems that may arise. The status of the land (ownership, et al) to be used by the project as well as the Cooperative office must be made clear. The DAR should head the team composed of representatives from the different collaborating agencies.
b. DA-FIDA – In the choice of the production sites, the help of the FIDA is necessary. Soil testing and analysis must be done to determine the suitability of the soil. An abaca specialist must also be deployed in the area. Technology training on the appropriate management of the abaca plants well as potential pests and disease prevention are needed. Help in the processing of the abaca plants is also needed.
c. DOST – Help from the DOST is needed in finding better ways of processing the raw fibers (stripping, dyeing, twining, etc) as well as in the use of indigenous dyes. Assistance in the fabrication of the equipment is sought.
d. DTI – The DTI’s assistance is sought in the development of the abaca-based products, in securing the necessary permits and licenses, product pricing, labeling, packaging and marketing. The DTI can also help pinpoint input sources, help make sourcing arrangements as well as identify and create potential markets. Short-term and long-term planning horizons must be adopted. The cost of the inputs and pricing of the output must be continuously monitored. The development of an inventory system as well as production schedule must be taught to the cooperative members.
e. CDA – The CDA may require more capability and skills upgrading seminars from the Cooperative in order to operate and sustain the project.
f. Local and Provincial Governments – Both the local and provincial government’s assistance in addressing the power situation are necessary in order for the proposed project to take off and be sustained. Adequate power is needed to operate
the sewing machines, electric fans and lighting facilities all at the same time. Likewise, communication facilities must be upgraded so that the cooperative can be in touch with its suppliers and buyers.
g. Marinduque State College – The College can be involved through its research and extension activities in the development of the abaca industry and in mentoring and monitoring the project as it evolves into a business enterprise. The College may administer the Personal Entrepreneurial Competence assessment.
Greater involvement of the private sector is likewise
encouraged so that strategic partnerships may be
formed.
F. Business Development Agenda
In order to better appreciate the work that the project
entails, a business development agenda has been
prepared.
Component 1 – Land
Activity 1 – The legal papers regarding the status of the
areas proposed for planting as well as the
Cooperative’s office and production
center have to be prepared. Who “owns”
the targeted lands? Can the cooperative
and its members just go ahead and
prepare the areas? Concerned Agencies:
DAR, Municipality of Boac
Activity 2 – Soil analysis must be conducted after which
the land proposed for planting must be
prepared. Planting can then commence.
Initially, the area planted with abaca is
targeted to reach 10 hectares by 2012, but
by the fifth year of implementation, the
area planted with abaca will reach 50
hectares. Concerned Agencies: DA-
FIDA, DAR
Activity 3 – Coordination with the DA-FIDA regarding
technical training on the management of
abaca plants as well as pest and disease
Transforming Agrarian Reform Beneficiaries into Agricultural Entrepreneurs: The Case of The Abaca Production with Processing in BOAC, Marinduque, Philippines
26
prevention. Concerned Agency – DA-
FIDA
Activity 4 –Construction of the cooperative’s office and
production center. Concerned Agencies:
DAR, the Cooperative
Activities 1 and 2 will be on-going activities until all
targeted areas for abaca production have been covered.
Component 2 – Transport, Power and Telecommunications
Activity 1 – Make arrangements for a reliable source for
the needed power and
telecommunications. Concerned Agencies:
Municipality of Boac
Activity 2 – Purchase a vehicle. Concerned Agencies:
DAR, the Cooperative
Component 3 – Product Development and Marketing
Activity 1 – Arrange training on product processing and
development, pricing, marketing and other
related skills improvement workshops.
Concerned Agencies: DTI, Marinduque
State College
Activity 2 – Set up a target sales objective.
Activity 3 – Set up a system to procure and make an
inventory of the inputs.
Activity 4 – Standardize and document the recipe for the
various colors to be used to dye the fibers.
Concerned Agencies: DTI, the
Cooperative
Activity 5 – Procure the necessary equipment and inputs.
Concerned Agency: DAR, the
Cooperative
Activity 6 - Make Prototype or Sample Outputs and
Quality Control for Output. The
Cooperative must also decide on the
packaging of the outputs. Concerned
Agencies: the Cooperative, DTI
Activity 7 – Set up an inventory system of the finished
outputs. Concerned Agencies: The
Cooperative, DTI
Activity 8 – A team must be organized for the purpose
of looking for markets, new designs, etc. It
is safe to assume that the members of the
cooperative will need help and
information regarding the current status of
the abaca industry as well as current and
potential markets. Concerned Agencies:
the Cooperative, DTI
Activity 9- As a medium-term activity, the cooperative
must acquaint itself with the many other
possible abaca products that can be
produced and marketed. However, it will
have to coordinate with the local and
provincial governments inasmuch as other
organizations are said to have been
designated or assigned specific products to
produce.
Component 4 – Social Infrastructure and Capability Building
Activity 1 – A series of organizational capability
building exercises or activities must be
arranged to strengthen the cooperative and
prepare for its transition into an agri-
business enterprise. The Personal
Entrepreneurial Competence assessment
may be administered as part of the
exercises. Concerned Agencies: DAR,
CDA, DTI, the Cooperative
Activity 2 – Procure a business permit and other licenses
needed. Concerned Agencies: DTI, the
Cooperative
Component 5 – Monitoring and Evaluation
Activity 1 – With DAR as the lead agency, a team
composed of representatives from the
collaborating agencies must be formed to
regularly monitor and assess the project
Journal of Global Business and Trade Vol. 8, No. 2 (2012)
27
VI. Conclusions/Recommendations
The proposed project presents an excellent
opportunity to enhance the welfare of the residents of
the ARC. The project will make use of idle lands, revive
the abaca industry in Marinduque, develop as well as
promote environmentally-friendly products, create rural
employment for both male and female members of the
community and generate more farm income. If
successful, the project will showcase how a multi-
purpose cooperative can manage and run an agri-
business enterprise. More importantly, the project will
build human capital among the members of the
cooperative.
However, in order for the project to be successful,
the assistance of various government agencies as well
as the private sector is needed. These agencies include
the following: DAR, DA-FIDA, DOST, DTI, CDA, the
provincial government of Marinduque and the local
government of Boac. A firm commitment from these
agencies to support the proposed project is vital.
References
Bellen, A.L. B. (2009). Enterprise Study on Abaca
Fiber Craft Enterprises in Tabaco, Albay.
Unpublished Undergraduate Special Problem,
Department of Agribusiness Management, College
of Economics and Management, University of the
Philippines Los Banos.
Mascarinas, A. Amano, V. et al. (2009). Supply Chain
Improvement for the Abaca Industry in the Bicol
Region, Phase 1: Evaluation Research. Journal of
the International Society for Southeast Asian
Agricultural Sciences. Vol 15, No.2.
Panti, F. R. S. (2010). Strategic Alliance Opportunities
Between Two Catanduanes Abaca Processing
Cooperatives and Three Manufacturing Companies.
Unpublished Undergraduate Special Problem,
Department of Agribusiness Management, College
of Economics and Management, University of the
Philippines Los Banos.
Teodoro, M.L. (1989). The Philippine Abaca
Commodity System. Undergraduate Special
Problem, Department of Agribusiness
Management, College of Economics and
Management, University of the Philippines Los
Banos.

Journal of Global Business and Trade Vol. 8, No. 2 (2012)
29
Journal of Global Business and Trade
Strategic Tourism Tools Following the Disaster in Japan – Could it Happen in the U.S.? Cetron, M. J,a F.J. DeMicco,b Ruiqing Fang,c Linda Woo c and O. Davies a a. Forecasting International b. Lerner College of Business and Economics in the University of Delaware c. Hospitality Information Management at the University of Delaware
ARTICLE INFO
ABSTRACT
Keywords: Tourism, Hospitality, Terrorism, Crime, Disasters, Strategic Management
Terrifying images from Japan after its triple whammy of earthquake, tsunami, and radioactive meltdowns have left many in the United States wondering: Could something like that happen here? Unfortunately, history’s answer is yes. Managers of tourism destinations and hospitality firms in many regions are faced with uncertain environmental events, both man-made and naturally occurring. In a complex and dynamic tourism and hospitality environment, strategic planning tools can be of value in positioning resources to mitigate any negative impact of these environmental events. This paper examines some strategy tools that can be used by hospitality and tourism managers in the future.
I. Introduction
Terrifying images from Japan after its triple
whammy of earthquake, tsunami, and radioactive
meltdowns have left many in the United States
wondering: Could something like that happen here?
Unfortunately, history’s answer is yes.
Like Japan, the U.S. mainland has itself suffered
major calamities – both natural and man-made - that
struck with little or no warning to devastating effect.
Among them:
The Great Chicago Fire of 1871. The city burned for
two days, over 300 died, and 4 square miles of the
city turned to ash.
In 1900, a Category 4 hurricane struck Galveston,
Texas, with little warning, killing at least 6,000
people. It was the deadliest natural disaster ever
to hit the United States.
The San Francisco earthquake of 1906 leveled
much of the city. Estimated at magnitude 7.9, it
left some 3,000 dead and nearly a quarter-million
homeless.
Strategic Tourism Tools Following the Disaster in Japan – Could it Happen in the U.S.?
30
Hurricane Katrina in 2005 claimed more than 1,800
lives, leaving New Orleans and much of the
neighboring Gulf Coast in ruins.
And, of course, the September 11 attacks killed
2,973, plunged the United States into recession,
and forever altered Americans’ assumption that
their homeland was unassailable.
As those incidents suggest, there is no place of
perfect safety. Clearly, some places hold greater danger
than others. Japan, for example, is an island that sits in
an active earthquake zone. The Kobe earthquake there
in 1995 claimed over 6,400 lives (Cetron, DeMicco &
Davies, 2010).
II. Scanning the Environment
The destructive power of natural disasters could kill
not only local residents but also thousands of tourists.
Tourists may recognize that the natural disasters make
their travel more risky. According Park & Reisinger
(2010), there are several kinds of natural disasters:
avalanches, droughts, earthquakes, floods, heat waves,
hurricanes, landslides, tornadoes, tsunamis, volcanoes,
wildfires, winter storms. Natural disasters cause loss of
life and economic damage and cannot be avoided.
Tourism destinations are very vulnerable to natural
disasters. Natural disaster will seriously impact and
damage the destination and could eventually reduce
tourist arrivals. Hotel managers must understand natural
disasters so they can respond to them positively and
lessen their impact on hotel guests. For example, resort
hotels on the Pacific shore must have enough facilities
to protect guests’ safety during a tsunami.
Travelers also perceive the risks from manmade
dangers. This paper will focus risks from crime risk and
terrorism. Crime risks include the possibility of
becoming the victim of robbery, burglary, fraud, rape,
or murder. Crimes occurring at tourist destinations will
have negative effects on travel areas. Also, the growth
of tourist activities may bring an increase in crimes. For
example, a destination might have higher crime rates
during tourist season, such as we see in places like
Miami, Florida. When tourists are concerned about
crime, they will choose to book safer alternatives. In
certain destinations, such as Washington, DC; Miami,
Florida; and New Orleans, Louisiana, guests could be
more vulnerable to crime. For hotel managers, it is
important to protect hotel guests from being victims of
crime. The can train hotel employees never to announce
the guest’s name and room number, remind guests to
protect themselves, make efforts to safeguard guests’
personal information, and prepare to offer assistance in
case of stolen property, etc.
Park and Reisinger (2010), in “International
Tourism”, described terrorism risk as the possibility of
being involved in acts such as airplane or personal
hijacking, bomb explosion, or biochemical attack.
Tourists are concerned with traveling and the threats
that accompany political disorder. Terrorism therefore
may have a more critical influence on the travel industry
than on any other industry. Tourism services are highly
perishable and cannot be stored or sold at another time;
once the moment passes, the opportunity for the sale is
lost. Thus, tourism usually suffers in times of crisis.
Since there is no sign that the terrorist attacks are
coming to an end, terrorism will continuously threaten
the tourism industry. Hotels which are high-status and
vulnerable to terrorism should combat the threat of
terrorism and be prepared for terror attacks. For instance,
hotel managers could hire training specialists at major
facilities, work with the American Hotel and Motel
Association to train employees in how to cope with a
terrorist attack, and establish a network of counter-
terrorism security guidance for individual locations.
This paper examines how tourism and hospitality
managers can apply strategic tools for improving
tourism demand in locations challenged by natural
disaster or man-made (criminal, terrorism, etc.)
phenomenon.
III. Background
What is true in Japan is true here as well: Some
places are safer than others. A qualitative study
consulting with more than a dozen security experts and
Journal of Global Business and Trade Vol. 8, No. 2 (2012)
31
emergency-preparedness specialists throughout the
United States revealed a host of factors involved in
determining the 18 most dangerous places to live in
America.
Among those many considerations: vulnerability to
major natural disasters such as earthquakes, hurricanes,
tsunamis, floods, and volcanic eruptions; the presence
of nuclear reactors, chemical factories, natural gas
storage depots and pipelines; the threat of terrorist
events; and the frequency of violent crime.
Based on those factors, here are the 18 of the most
dangerous places in America, based on our
environmental scanning.
18. Honolulu, Hawaii
With perfect weather, a prosperous economy, and
violent crime rates well under the national average,
Hawaii seems a perfect place to live. Even the Pacific
cyclones tend to pass it by, and when they strike they
seldom cause much harm.
What could spoil this idyllic picture? Geology.
What you see as the Hawaiian Islands are actually
the tops of ancient volcanoes. Most of them seem to be
extinct, but not all. On the Big Island, about 165 miles
to the southwest, Mauna Loa and Mauna Kea remain
active. Hilo and Kauai, at the feet of the volcanoes, face
the threat of lava flows and, potentially, scalding clouds
of volcanic gas, ash, rock, and steam of the kind that
killed Pompeii and Herculaneum.
However, what really puts Honolulu’s population
of 910,000 at risk is the threat of massive tsunamis that
make the 30-foot-high wave that smashed into Japan
look minor by comparison. Twice in history, pieces of
Mauna Loa have slumped into the sea, pushing up vast
waves that roared straight to the Oahu coast – site of
Honolulu today. The smaller of those two tsunamis was
a towering 256 feet high. Scientists estimate the larger
wave reached an almost unimaginable 1,006 feet high –
roughly the height of New York’s Chrysler Building!
Either of those would have destroyed Honolulu more
completely than an atomic bomb.
The good news: Tsunamis on this scale reach the
island only once every 100,000 years. The not so good
news: The most recent one occurred 100,000 years ago;
Honolulu may be due for the big one. Japan has already
shown the devastation a far smaller tsunami could cause.
17. Boston, Massachusetts
The rate of violent crime here is relatively low, the
113th highest in the country. That’s just the beginning.
You might be surprised to learn that New England
experiences 40 to 50 earthquakes a year. Most are too
small to feel, but there are exceptions. Boston College
seismologist John Ebel believes they are centered in
nearby New Hampshire, where they can be strong
enough to shake the region's largest city. In 1990,
scientists predicted that a magnitude 6.2 quake in
Boston would cause hundreds of deaths, thousands of
injuries, and up to $10 billion in damage. About three-
fourths of the city's 100,000 or so structures were put up
before 1973, when the building code was amended to
protect against earthquake damage. Quakes of 6.2 or
greater have occurred in the region at least twice since
the city was founded in 1630.
Still, Boston faces an even bigger threat; one that
comes from man rather than nature. In nearby Everett,
just cross the Mystic River, stands the Distrigas
liquefied natural gas depot. Experts estimate that if the
gas there were to escape and spread prior to detonation,
it would cause an explosion equal to 50 Hiroshima
bombs. That would level a substantial piece of Boston
and the surrounding communities, and the death toll
could run into the hundreds of thousands. This
vulnerability has already been noted in several
published reports, so you can be sure it is on the radar
both of terrorists and homeland security officials
determined to stop their nefarious plots. The chance that
anything would happen to Distrigas is low, but its
consequences are frankly too great to ignore.
16. Salt Lake City, Utah
Earthquakes are surprisingly common in northern
Utah. A magnitude 6 tremor struck Salt Lake City in
Strategic Tourism Tools Following the Disaster in Japan – Could it Happen in the U.S.?
32
1934. The Wasatch fault passes directly beneath the city,
and geologists estimate that a magnitude 7 quake will
occur there on average every 1,300 years. The last one
took place 1,300 years ago. If a major quake hits, an
estimated 185,000 buildings in the city could collapse.
If the earthquakes don’t get you, the pollution might.
The Environmental Protection Administration tallied 15
unhealthy air quality days in Salt Lake City in 2009 --
one more than smoggy Los Angeles. (Bakersfield,
Calif., had 43!)
Salt Lake City industries release more than 130
million tons of toxic chemicals each year, more than any
other major American city.
15. Washington, DC
The nation's capital has the 22nd-highest rate of
violent crime in the country; until recently, it also had
the second-highest murder rate. But the real risk here is
the obvious one -- terrorism. Washington, D.C., is the
bulls-eye for anyone with a grudge against the West.
Stand in the right neighborhood, turn in place, and you
will find inviting targets on all sides -- government
offices, monuments, restaurants full of the political elite,
crowds of tourists, and the homes of important officials.
Forecasting International does not believe a major
terrorist attack on the U.S. homeland is likely again
anytime soon. However, it is no less probable than an
earthquake or a tsunami, and the biggest terror target in
the world is Washington, D.C.
14. Richland, Washington
A community of 364,000 people, Richland belongs
on this list for only one reason: the Hanford Site, which
churned out nuclear material for atomic weapons from
World War II through the end of the Cold War. The
Columbia River flows past the site. From 1944 to 1971,
large quantities of long-lived radioisotopes were flushed
into it each day. In the early 1990s, radioactivity was
detected some 200 miles away on the Washington and
Oregon coast.
Hanford remains home to 53 million gallons of
high-level radioactive waste, some two-thirds of all the
radioactive waste (rad-waste) in the country. Four
separate Superfund clean-up projects at the facility were
scheduled to be completed by 2019. So far, the job is
less than half finished. Already, there is evidence that at
least some of the waste containers may be leaking:
contaminated rabbits and mulberry bushes have been
reported at the site as recently as 2010.
There is no clear evidence that any human beings
have been harmed by Hanford’s toxic radioactive stew
– yet. The risk of a serious accident, whether by nature
or by the hands of man, will remain high until the clean-
up is finally complete.
13. Anchorage, Alaska
Although it ranks a surprising 44th on the FBI's list
of cities with the most violent crime, it’s nature that
most threatens the 279,000-odd people who live in
America's northernmost major city. No fewer than 13
volcanoes are found along the Cook Inlet that includes
Anchorage at the end of a narrow channel. They include
Redoubt, currently the most active volcano in the
United States. The Redoubt Volcano sits atop a
subduction zone, the kind of geological fault that caused
the recent tsunami in Japan. This is just one of several
important faults in the area. In 1901, this was the site of
a magnitude 7.1 earthquake which triggered several
tsunamis.
12. Oklahoma City, Oklahoma
Oklahoma City is the biggest city in the heart of
Tornado Alley, and tornadoes are an ever-present
danger in spring and summer. More than 15 tornadoes
per 1,000 square miles have been recorded in the region.
Oklahoma City itself has seen more than 100 since 1893,
and two dozen since 2000.
One spectacular example occurred during the May
1999 tornado outbreak, which brought twisters to
Oklahoma, Texas, Kansas, Arkansas, and Tennessee.
Oklahoma alone had 160 confirmed storms. By far the
worst was the so-called Bridge Creek-Moore F5, which
touched down in nearby Amber and wandered through
Oklahoma City and surrounding communities. It was
Journal of Global Business and Trade Vol. 8, No. 2 (2012)
33
the deadliest tornado since 1979, with 36 people killed.
It became the most expensive in U.S. history, causing
$1.1 billion in damages.
Even for Oklahoma City, this was not business as
usual. In spring and early summer, tornadoes are an
ever-present hazard.
11. Detroit, Michigan
In the Motor City, crime is supercharged. Detroit
ranks third on the FBI's list of most violent cities.
If anything major goes amiss in Detroit, the cash-
strapped government is ill-equipped to respond. A hint
was provided last September, when over 700 power
lines were downed during a fierce wind storm. This
sparked fires which swept through abandoned, poorly
maintained, and dilapidated structures. At least 85
buildings were severely damaged or destroyed.
Critics say budget cuts have hampered the fire
department's ability to respond to any emergency. At
one point, between eight and 12 of the city's 66 fire
companies were deactivated on any given day in order
to save the city money. Although no official plan has
been announced, more cuts to city services are rumored
to be on the way.
10. Memphis, Tennessee
Crime is an issue here, too. With a population of
nearly 677,000, Memphis has the twelfth-highest rate of
violent crime in America. However, it has far bigger
problems that loom beneath its streets.
Memphis lies at one end of the New Madrid fault,
the most active earthquake zone east of the Mississippi.
Seismologists consider the region about 40 years
overdue for a quake measuring 6 to 6.5 on the Richter
scale—enough to cause significant damage. Over a six-
week period beginning in December 1811, a series of
magnitude 7.0 to 8.1 earthquakes just north of Memphis
damaged houses as far away as St. Louis, more than 200
miles north of the epicenter. The quakes were so intense
they briefly caused parts of the Mississippi River to run
backward.
Today, few of the city's buildings would hold up to
even one such earthquake. The U.S. Geological Survey
projects that highway and rail overpasses and pipelines
across the Mississippi could also be lost.
Memphis faces a significant tornado risk as well.
Twisters have hit Shelby County, where the city is
located, about eight times every ten years in recent
decades. However, the most destructive storm touched
down in 1909. A Force 4 storm, it killed 29 and injured
100.
9. Houston, Texas
What earns Houston a place on this list is its large
population and its proximity to the Gulf of Mexico.
With about 2.28 million people, and another 300,000 in
the barrier-island suburb of Galveston, Houston is the
largest community in the United States that regularly
faces hurricanes.
In September 1900, a hurricane and storm surge at
Galveston killed more than 6,000 people. Some
estimate the death toll at twice that, and it was by any
measure the worst U.S. natural disaster ever.
Rampant pollution is another problem. Houston-
area manufacturers dumped nearly 59 million pounds of
toxic chemicals into the city's air and water in 2009. And
according to the Environmental Protection
Administration, Houston's water has been contaminated
with small quantities of radioactivity ever since the city
began keeping records in 1996.
8. Seattle, Washington
The home of high-priced coffee, craft beer, and
some 609,000 people (3.4 million, including
neighboring Tacoma and Bellevue), Seattle is also the
site of the Cascadia subduction zone. This is the fault
that scientists say is most likely to produce the most
powerful earthquakes in the lower 48 states. Only three
serious quakes have occurred in the last century, none
larger than magnitude 7.1. Most recently, the magnitude
6.8 Nisqually earthquake in 2001 damaged some
buildings, but there were no fatalities. However, an
earthquake in 1700 is believed to have reached
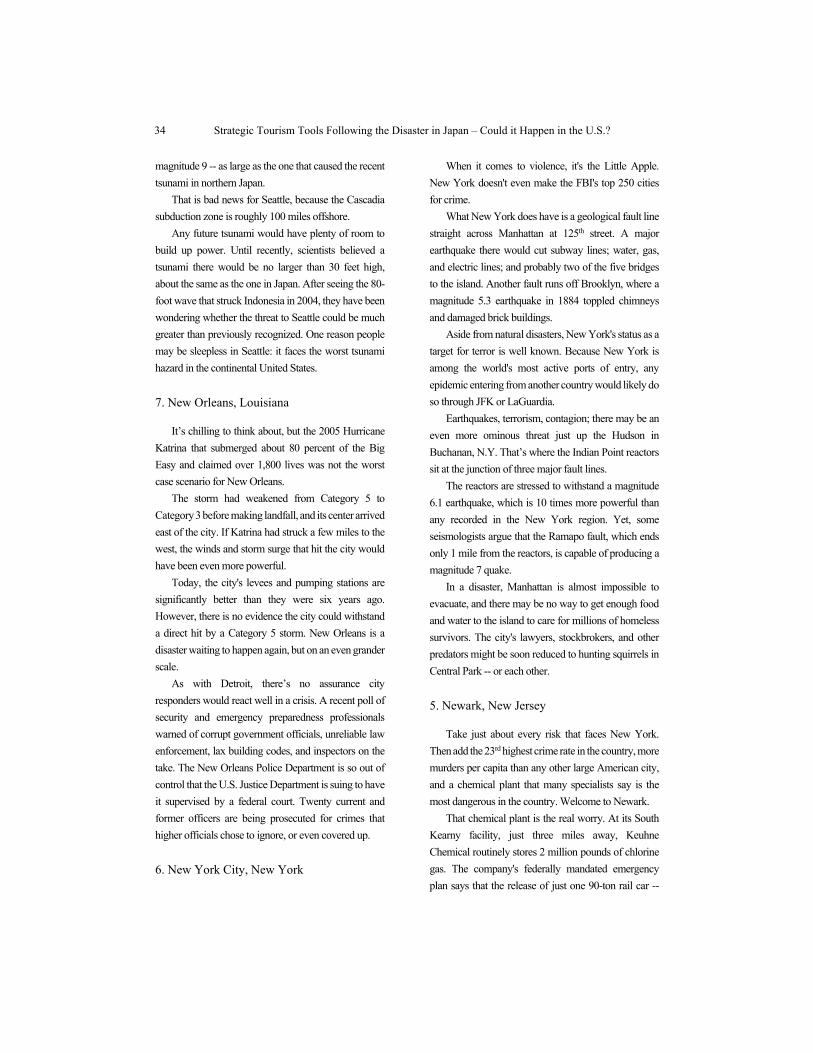
Strategic Tourism Tools Following the Disaster in Japan – Could it Happen in the U.S.?
34
magnitude 9 -- as large as the one that caused the recent
tsunami in northern Japan.
That is bad news for Seattle, because the Cascadia
subduction zone is roughly 100 miles offshore.
Any future tsunami would have plenty of room to
build up power. Until recently, scientists believed a
tsunami there would be no larger than 30 feet high,
about the same as the one in Japan. After seeing the 80-
foot wave that struck Indonesia in 2004, they have been
wondering whether the threat to Seattle could be much
greater than previously recognized. One reason people
may be sleepless in Seattle: it faces the worst tsunami
hazard in the continental United States.
7. New Orleans, Louisiana
It’s chilling to think about, but the 2005 Hurricane
Katrina that submerged about 80 percent of the Big
Easy and claimed over 1,800 lives was not the worst
case scenario for New Orleans.
The storm had weakened from Category 5 to
Category 3 before making landfall, and its center arrived
east of the city. If Katrina had struck a few miles to the
west, the winds and storm surge that hit the city would
have been even more powerful.
Today, the city's levees and pumping stations are
significantly better than they were six years ago.
However, there is no evidence the city could withstand
a direct hit by a Category 5 storm. New Orleans is a
disaster waiting to happen again, but on an even grander
scale.
As with Detroit, there’s no assurance city
responders would react well in a crisis. A recent poll of
security and emergency preparedness professionals
warned of corrupt government officials, unreliable law
enforcement, lax building codes, and inspectors on the
take. The New Orleans Police Department is so out of
control that the U.S. Justice Department is suing to have
it supervised by a federal court. Twenty current and
former officers are being prosecuted for crimes that
higher officials chose to ignore, or even covered up.
6. New York City, New York
When it comes to violence, it's the Little Apple.
New York doesn't even make the FBI's top 250 cities
for crime.
What New York does have is a geological fault line
straight across Manhattan at 125th street. A major
earthquake there would cut subway lines; water, gas,
and electric lines; and probably two of the five bridges
to the island. Another fault runs off Brooklyn, where a
magnitude 5.3 earthquake in 1884 toppled chimneys
and damaged brick buildings.
Aside from natural disasters, New York's status as a
target for terror is well known. Because New York is
among the world's most active ports of entry, any
epidemic entering from another country would likely do
so through JFK or LaGuardia.
Earthquakes, terrorism, contagion; there may be an
even more ominous threat just up the Hudson in
Buchanan, N.Y. That’s where the Indian Point reactors
sit at the junction of three major fault lines.
The reactors are stressed to withstand a magnitude
6.1 earthquake, which is 10 times more powerful than
any recorded in the New York region. Yet, some
seismologists argue that the Ramapo fault, which ends
only 1 mile from the reactors, is capable of producing a
magnitude 7 quake.
In a disaster, Manhattan is almost impossible to
evacuate, and there may be no way to get enough food
and water to the island to care for millions of homeless
survivors. The city's lawyers, stockbrokers, and other
predators might be soon reduced to hunting squirrels in
Central Park -- or each other.
5. Newark, New Jersey
Take just about every risk that faces New York.
Then add the 23rd highest crime rate in the country, more
murders per capita than any other large American city,
and a chemical plant that many specialists say is the
most dangerous in the country. Welcome to Newark.
That chemical plant is the real worry. At its South
Kearny facility, just three miles away, Keuhne
Chemical routinely stores 2 million pounds of chlorine
gas. The company's federally mandated emergency
plan says that the release of just one 90-ton rail car --
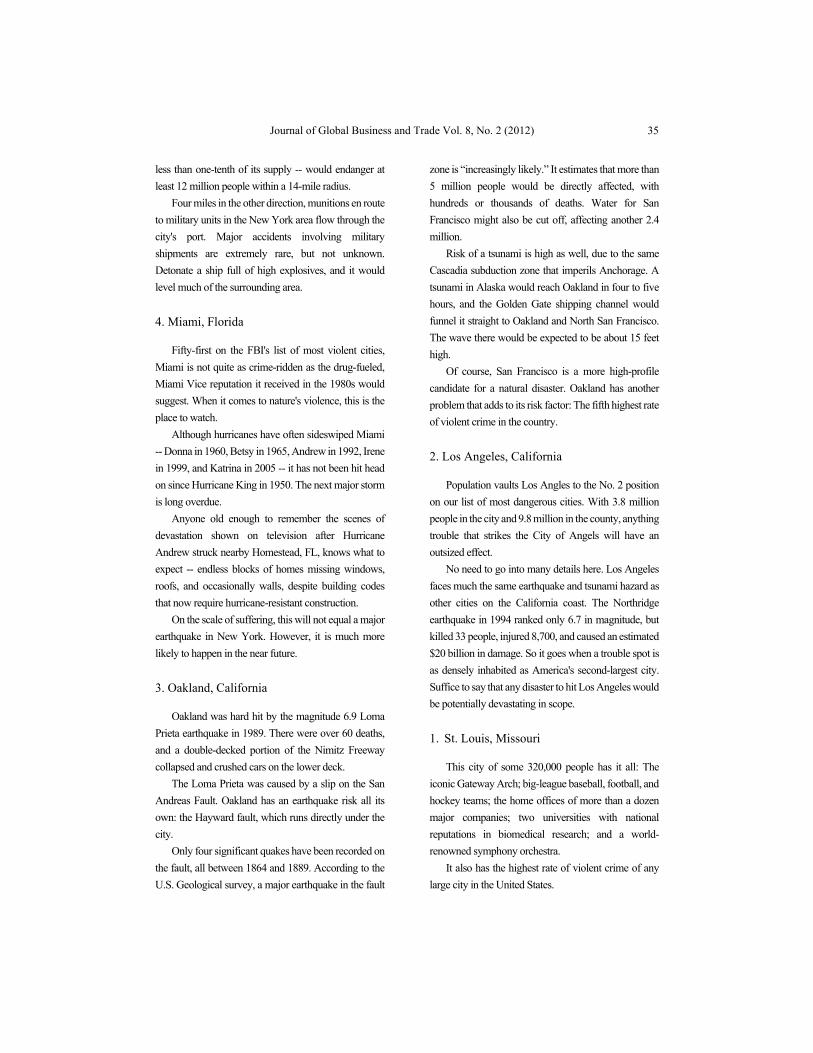
Journal of Global Business and Trade Vol. 8, No. 2 (2012)
35
less than one-tenth of its supply -- would endanger at
least 12 million people within a 14-mile radius.
Four miles in the other direction, munitions en route
to military units in the New York area flow through the
city's port. Major accidents involving military
shipments are extremely rare, but not unknown.
Detonate a ship full of high explosives, and it would
level much of the surrounding area.
4. Miami, Florida
Fifty-first on the FBI's list of most violent cities,
Miami is not quite as crime-ridden as the drug-fueled,
Miami Vice reputation it received in the 1980s would
suggest. When it comes to nature's violence, this is the
place to watch.
Although hurricanes have often sideswiped Miami
-- Donna in 1960, Betsy in 1965, Andrew in 1992, Irene
in 1999, and Katrina in 2005 -- it has not been hit head
on since Hurricane King in 1950. The next major storm
is long overdue.
Anyone old enough to remember the scenes of
devastation shown on television after Hurricane
Andrew struck nearby Homestead, FL, knows what to
expect -- endless blocks of homes missing windows,
roofs, and occasionally walls, despite building codes
that now require hurricane-resistant construction.
On the scale of suffering, this will not equal a major
earthquake in New York. However, it is much more
likely to happen in the near future.
3. Oakland, California
Oakland was hard hit by the magnitude 6.9 Loma
Prieta earthquake in 1989. There were over 60 deaths,
and a double-decked portion of the Nimitz Freeway
collapsed and crushed cars on the lower deck.
The Loma Prieta was caused by a slip on the San
Andreas Fault. Oakland has an earthquake risk all its
own: the Hayward fault, which runs directly under the
city.
Only four significant quakes have been recorded on
the fault, all between 1864 and 1889. According to the
U.S. Geological survey, a major earthquake in the fault
zone is “increasingly likely.” It estimates that more than
5 million people would be directly affected, with
hundreds or thousands of deaths. Water for San
Francisco might also be cut off, affecting another 2.4
million.
Risk of a tsunami is high as well, due to the same
Cascadia subduction zone that imperils Anchorage. A
tsunami in Alaska would reach Oakland in four to five
hours, and the Golden Gate shipping channel would
funnel it straight to Oakland and North San Francisco.
The wave there would be expected to be about 15 feet
high.
Of course, San Francisco is a more high-profile
candidate for a natural disaster. Oakland has another
problem that adds to its risk factor: The fifth highest rate
of violent crime in the country.
2. Los Angeles, California
Population vaults Los Angles to the No. 2 position
on our list of most dangerous cities. With 3.8 million
people in the city and 9.8 million in the county, anything
trouble that strikes the City of Angels will have an
outsized effect.
No need to go into many details here. Los Angeles
faces much the same earthquake and tsunami hazard as
other cities on the California coast. The Northridge
earthquake in 1994 ranked only 6.7 in magnitude, but
killed 33 people, injured 8,700, and caused an estimated
$20 billion in damage. So it goes when a trouble spot is
as densely inhabited as America's second-largest city.
Suffice to say that any disaster to hit Los Angeles would
be potentially devastating in scope.
1. St. Louis, Missouri
This city of some 320,000 people has it all: The
iconic Gateway Arch; big-league baseball, football, and
hockey teams; the home offices of more than a dozen
major companies; two universities with national
reputations in biomedical research; and a world-
renowned symphony orchestra.
It also has the highest rate of violent crime of any
large city in the United States.
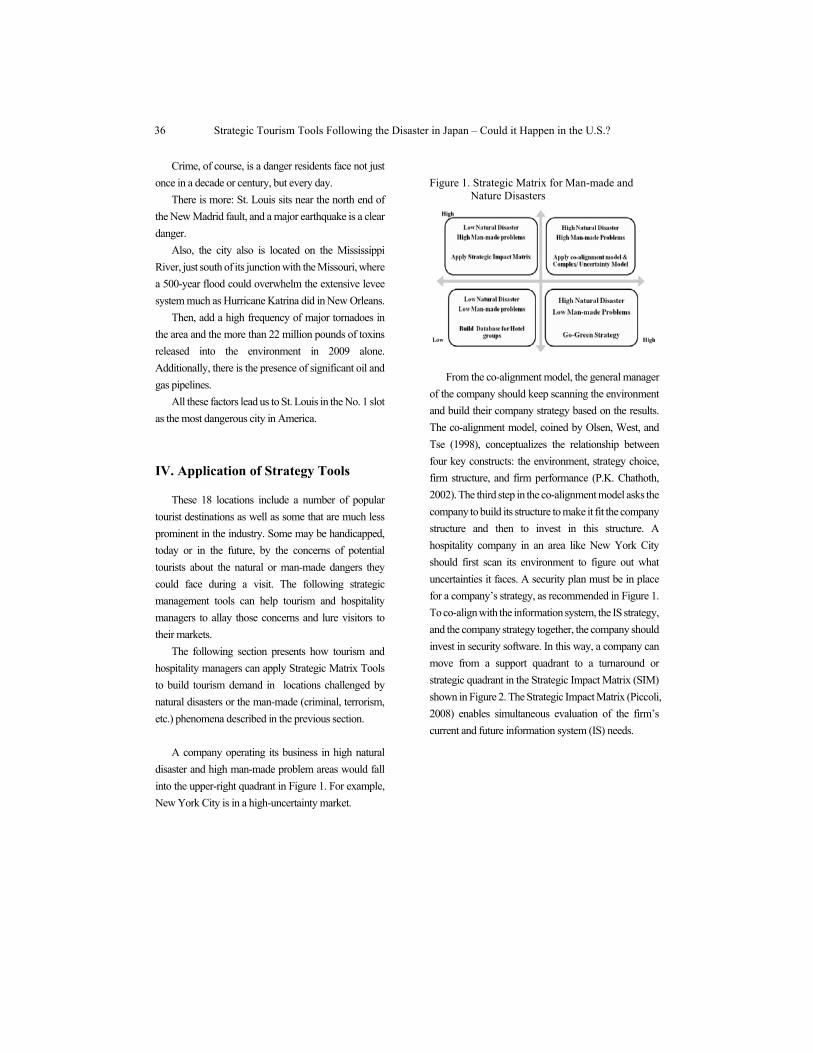
Strategic Tourism Tools Following the Disaster in Japan – Could it Happen in the U.S.?
36
Crime, of course, is a danger residents face not just
once in a decade or century, but every day.
There is more: St. Louis sits near the north end of
the New Madrid fault, and a major earthquake is a clear
danger.
Also, the city also is located on the Mississippi
River, just south of its junction with the Missouri, where
a 500-year flood could overwhelm the extensive levee
system much as Hurricane Katrina did in New Orleans.
Then, add a high frequency of major tornadoes in
the area and the more than 22 million pounds of toxins
released into the environment in 2009 alone.
Additionally, there is the presence of significant oil and
gas pipelines.
All these factors lead us to St. Louis in the No. 1 slot
as the most dangerous city in America.
IV. Application of Strategy Tools
These 18 locations include a number of popular
tourist destinations as well as some that are much less
prominent in the industry. Some may be handicapped,
today or in the future, by the concerns of potential
tourists about the natural or man-made dangers they
could face during a visit. The following strategic
management tools can help tourism and hospitality
managers to allay those concerns and lure visitors to
their markets.
The following section presents how tourism and
hospitality managers can apply Strategic Matrix Tools
to build tourism demand in locations challenged by
natural disasters or the man-made (criminal, terrorism,
etc.) phenomena described in the previous section.
A company operating its business in high natural
disaster and high man-made problem areas would fall
into the upper-right quadrant in Figure 1. For example,
New York City is in a high-uncertainty market.
Figure 1. Strategic Matrix for Man-made and Nature Disasters
From the co-alignment model, the general manager
of the company should keep scanning the environment
and build their company strategy based on the results.
The co-alignment model, coined by Olsen, West, and
Tse (1998), conceptualizes the relationship between
four key constructs: the environment, strategy choice,
firm structure, and firm performance (P.K. Chathoth,
2002). The third step in the co-alignment model asks the
company to build its structure to make it fit the company
structure and then to invest in this structure. A
hospitality company in an area like New York City
should first scan its environment to figure out what
uncertainties it faces. A security plan must be in place
for a company’s strategy, as recommended in Figure 1.
To co-align with the information system, the IS strategy,
and the company strategy together, the company should
invest in security software. In this way, a company can
move from a support quadrant to a turnaround or
strategic quadrant in the Strategic Impact Matrix (SIM)
shown in Figure 2. The Strategic Impact Matrix (Piccoli,
2008) enables simultaneous evaluation of the firm’s
current and future information system (IS) needs.
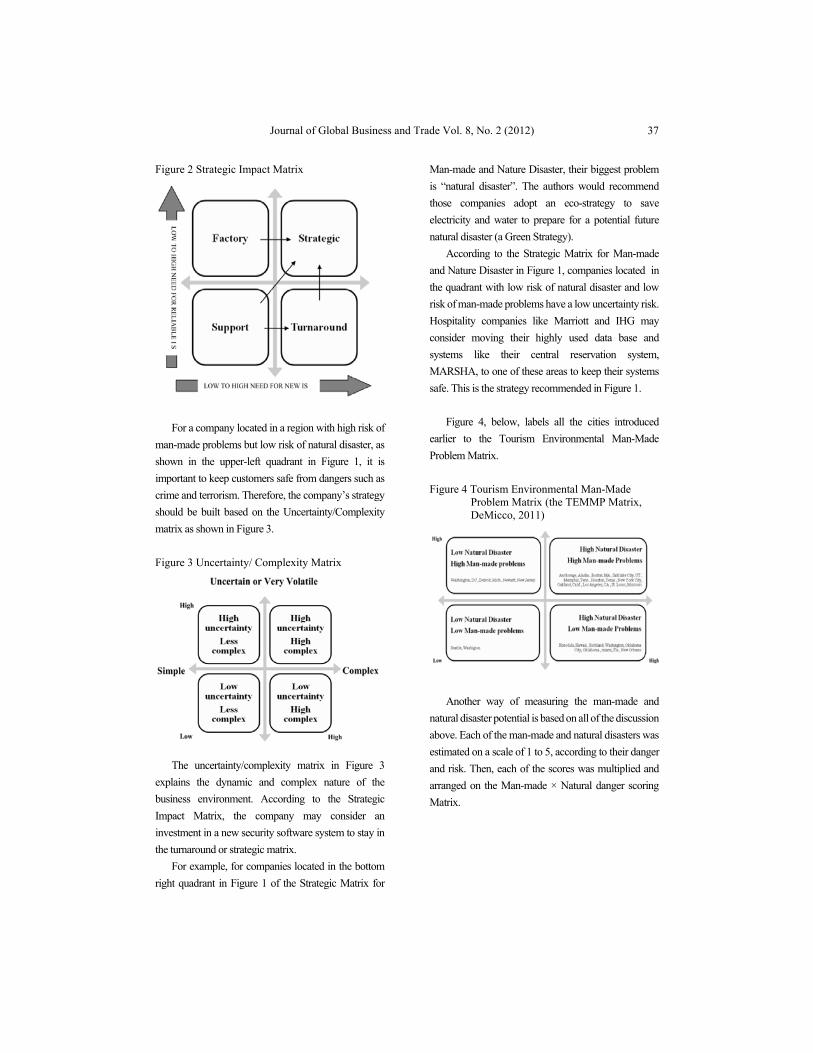
Journal of Global Business and Trade Vol. 8, No. 2 (2012)
37
Figure 2 Strategic Impact Matrix
For a company located in a region with high risk of
man-made problems but low risk of natural disaster, as
shown in the upper-left quadrant in Figure 1, it is
important to keep customers safe from dangers such as
crime and terrorism. Therefore, the company’s strategy
should be built based on the Uncertainty/Complexity
matrix as shown in Figure 3.
Figure 3 Uncertainty/ Complexity Matrix
The uncertainty/complexity matrix in Figure 3
explains the dynamic and complex nature of the
business environment. According to the Strategic
Impact Matrix, the company may consider an
investment in a new security software system to stay in
the turnaround or strategic matrix.
For example, for companies located in the bottom
right quadrant in Figure 1 of the Strategic Matrix for
Man-made and Nature Disaster, their biggest problem
is “natural disaster”. The authors would recommend
those companies adopt an eco-strategy to save
electricity and water to prepare for a potential future
natural disaster (a Green Strategy).
According to the Strategic Matrix for Man-made
and Nature Disaster in Figure 1, companies located in
the quadrant with low risk of natural disaster and low
risk of man-made problems have a low uncertainty risk.
Hospitality companies like Marriott and IHG may
consider moving their highly used data base and
systems like their central reservation system,
MARSHA, to one of these areas to keep their systems
safe. This is the strategy recommended in Figure 1.
Figure 4, below, labels all the cities introduced
earlier to the Tourism Environmental Man-Made
Problem Matrix.
Figure 4 Tourism Environmental Man-Made Problem Matrix (the TEMMP Matrix, DeMicco, 2011)
Another way of measuring the man-made and
natural disaster potential is based on all of the discussion
above. Each of the man-made and natural disasters was
estimated on a scale of 1 to 5, according to their danger
and risk. Then, each of the scores was multiplied and
arranged on the Man-made × Natural danger scoring
Matrix.
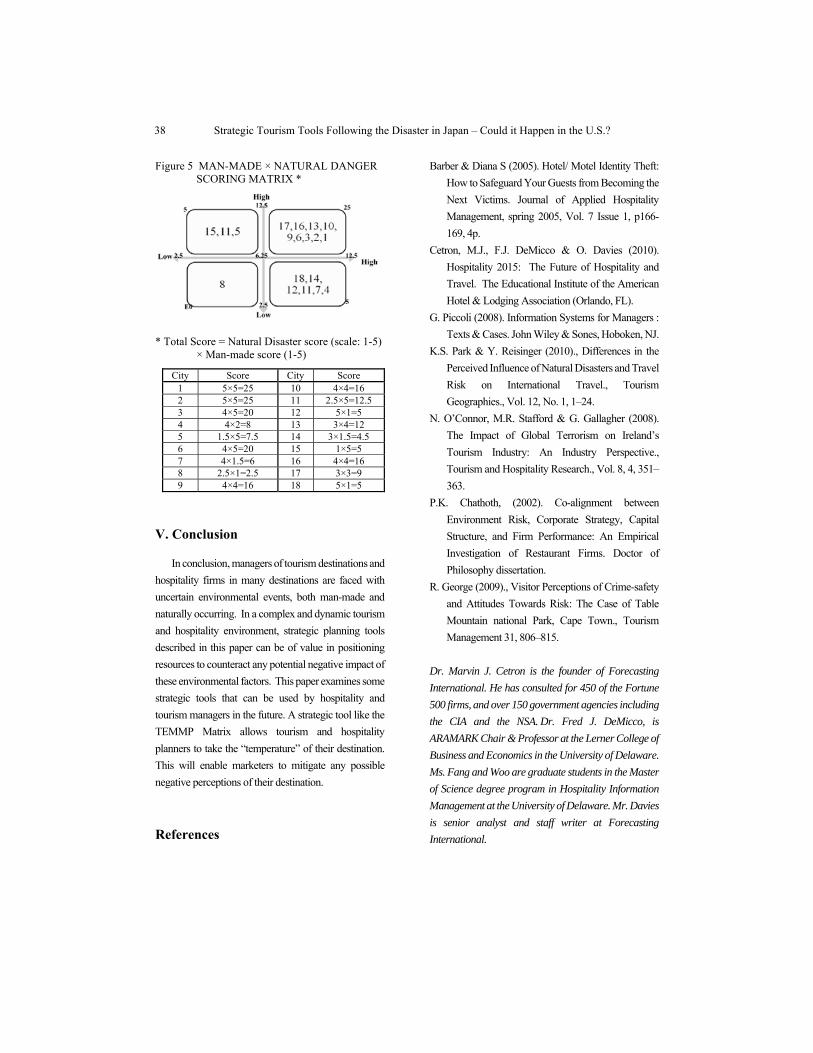
Strategic Tourism Tools Following the Disaster in Japan – Could it Happen in the U.S.?
38
Figure 5 MAN-MADE × NATURAL DANGER SCORING MATRIX *
* Total Score = Natural Disaster score (scale: 1-5) × Man-made score (1-5)
City Score City Score 1 5×5=25 10 4×4=16 2 5×5=25 11 2.5×5=12.5 3 4×5=20 12 5×1=5 4 4×2=8 13 3×4=12 5 1.5×5=7.5 14 3×1.5=4.5 6 4×5=20 15 1×5=5 7 4×1.5=6 16 4×4=16 8 2.5×1=2.5 17 3×3=9 9 4×4=16 18 5×1=5
V. Conclusion
In conclusion, managers of tourism destinations and
hospitality firms in many destinations are faced with
uncertain environmental events, both man-made and
naturally occurring. In a complex and dynamic tourism
and hospitality environment, strategic planning tools
described in this paper can be of value in positioning
resources to counteract any potential negative impact of
these environmental factors. This paper examines some
strategic tools that can be used by hospitality and
tourism managers in the future. A strategic tool like the
TEMMP Matrix allows tourism and hospitality
planners to take the “temperature” of their destination.
This will enable marketers to mitigate any possible
negative perceptions of their destination.
References
Barber & Diana S (2005). Hotel/ Motel Identity Theft:
How to Safeguard Your Guests from Becoming the
Next Victims. Journal of Applied Hospitality
Management, spring 2005, Vol. 7 Issue 1, p166-
169, 4p.
Cetron, M.J., F.J. DeMicco & O. Davies (2010).
Hospitality 2015: The Future of Hospitality and
Travel. The Educational Institute of the American
Hotel & Lodging Association (Orlando, FL).
G. Piccoli (2008). Information Systems for Managers :
Texts & Cases. John Wiley & Sones, Hoboken, NJ.
K.S. Park & Y. Reisinger (2010)., Differences in the
Perceived Influence of Natural Disasters and Travel
Risk on International Travel., Tourism
Geographies., Vol. 12, No. 1, 1–24.
N. O’Connor, M.R. Stafford & G. Gallagher (2008).
The Impact of Global Terrorism on Ireland’s
Tourism Industry: An Industry Perspective.,
Tourism and Hospitality Research., Vol. 8, 4, 351–
363.
P.K. Chathoth, (2002). Co-alignment between
Environment Risk, Corporate Strategy, Capital
Structure, and Firm Performance: An Empirical
Investigation of Restaurant Firms. Doctor of
Philosophy dissertation.
R. George (2009)., Visitor Perceptions of Crime-safety
and Attitudes Towards Risk: The Case of Table
Mountain national Park, Cape Town., Tourism
Management 31, 806–815.
Dr. Marvin J. Cetron is the founder of Forecasting
International. He has consulted for 450 of the Fortune
500 firms, and over 150 government agencies including
the CIA and the NSA. Dr. Fred J. DeMicco, is
ARAMARK Chair & Professor at the Lerner College of
Business and Economics in the University of Delaware.
Ms. Fang and Woo are graduate students in the Master
of Science degree program in Hospitality Information
Management at the University of Delaware. Mr. Davies
is senior analyst and staff writer at Forecasting
International.
Journal of Global Business and Trade Vol. 8, No. 2 (2012)
39
Journal of Global Business and Trade
Technology and Competitiveness: Assessing The Influence of Transaction Costs in The Adoption of Technology and Recommended Farm Practices for Rice Agham C. Cuevasa a Department of Economics College of Economics and Management University of the Philippines Los Baños
ARTICLE INFO
ABSTRACT
Keywords: Transaction costs, Rice technology, Technology adoption, Multinomial logit regression, Philippines
Modern rice technology plays an important role in enhancing agricultural productivity and improving competitiveness that translates to higher household farm income. However, despite the benefits that these technologies and recommended farming practices bring, the adoption rate by farmers has been low. Adoption literature identifies a variety of factors ranging from farm characteristics and farm household attributes to varietal characteristics and technology attributes. One particular stream of adoption studies explores the role that transaction cost plays in technology adoption. The paper explored the influence of transaction costs on the adoption of technology and recommended farm practices by rice farmers. The study suggests that aside from farm and household characteristics, transaction costs affect farmers’ decisions to adopt recommended rice technologies and farm practices. Reduction of transaction costs makes adopting recommended practices more attractive as it assures the farmer that the eventual increases in yield will result to higher level of market participation and therefore higher value of net surplus.
I. Introduction
Significant increases in crop yield experienced
during last several decades due to the Green Revolution
have highlighted the important role that modern rice
technology plays in enhancing agricultural productivity
and improving competitiveness that translate to
increased household farm income. In the Philippines, a
noteworthy increase in rice yield growth in the last ten
years of 30%, from 2.93 tons per hectare in 1997 to 3.80
tons per hectare in 2007, notwithstanding the lack of
new “revolutionary” rice technology, has been partly
attributed to farmers’ adoption of certified seeds and
government recommended farming practices (Matala et
al., 2008). This has resulted in an improvement in
farmers’ living standards with more than 60% now
living above the poverty threshold. Indeed, agricultural
innovation creates tremendous opportunities to increase
production and enhance competitiveness. However,
despite the benefits that these technologies and
Technology and Competitiveness: Assessing The Influence of Transaction Costs in The Adoption of Technology and Recommended Farm Practices for Rice
40
recommended farming practices bring, the adoption rate
by farmers has been low. Household survey data show,
for example, that the ratio of farmers who used certified
seeds are only 25% (Matala et al.). This is in spite of the
established fact that good quality seeds can increase
yield by 5% to 20% while decreasing seeding rate.
Adoption literature identifies a variety of factors
ranging from farm characteristics and farm household
attributes to varietal characteristics and technology
attributes. One particular stream of adoption studies
explores the role that transaction cost plays in
technology adoption. Transaction costs are household
specific costs incurred by agents whenever they
participate in the market. Market exchange, especially
in imperfect markets, entail significant costs to
households to the point of altering the effective prices
they pay or receive. Transportation costs, costs of
acquiring information, searching, negotiation,
monitoring, coordination, screening, and enforcement
are just some of the costs that farm households incur that
create a gap between the selling and buying price of a
commodity. The presence of these costs partially
explains why some farmers participate in the market
and some do not.
Aguirre (1999) found that market participation
decisions significantly influence the choice of maize
variety to plant. Meng (1997) found that distances to
market and road quality influence variety choice.
Omamo (1998) observed that transportation costs
explained why farmers choose low return food crops
instead of high return cash crops. Perrin and
Winklemann (1976) identified that transaction costs
involved in learning and acquiring new technology are
important determinants of the rate of technology
adoption.
This paper explores the influence of transaction
costs on the adoption of technology and recommended
farm practices by rice farmers in the Philippines. The
study uses cross section survey data for the wet season
of 2006 from 33 major rice-producing provinces in the
country. The paper is structured as follows: the next
section presents a brief review of technology adoption
literature followed by the empirical framework of the
study in Section III. Section IV discusses the results.
The last section concludes the paper.
II. Review of Related Literature
Adoption literature often starts by citing Feder, Just
and Zilberman’s state of the art survey in 1985. They
define adoption as the degree of use of a new technology
in long run equilibrium when the farmer has full
information about the new technology and its potential
and identify key explanations affecting adoption like
farm size, risk and uncertainty, human capital, labor
availability, credit constraint, tenure, and supply
constraint, among others. Taking a cue from Feder et al.,
farm-level adoption studies have usually focused on the
differences among farmers (or households) in the
economic constraints they face, especially with respect
to access to productive resources like human and
physical resources. Commonly identified constraints to
rapid adoption of new agricultural technologies include
credit rationing, information asymmetries and/or
differential access to information resources, risk
aversion, small farm size, human capital differences,
disruptions in the market for labor and complementary
inputs (such as seed, chemicals and water) and poor
infrastructure (Hintze, 2002). At the aggregate level,
adoption studies focus on comparisons across different
geographic areas or on the sequence of adoption across
time (the innovation-diffusion approach) using
measures of adoption such as the proportion of farmers
employing the new technology in different regions or
the area share of a technology at different points in time
in a particular region (Hintze, 2002).
The set of determinants has expanded considerably.
Konsiega, (unpublished) in examining non-local
migration and its impact on food technology adoption,
found that migrant households have a significantly
higher average adoption rate. Kshirsagar, et al. (2002)
Journal of Global Business and Trade Vol. 8, No. 2 (2012)
41
explains low adoption of improved varieties and high
degree of varietal diversity using farmers’ perceptions
regarding traditional and improved rice varieties. Joshi
and Pandey (2005), in a study of MV adoption in Nepal,
conclude that an econometric model that includes
farmers’ perception variables is superior in explaining
adoption behavior than the ones using only the usual
farm and farm related variables. Rosenberg, as early as
1982, stressed the role of learning by using and
expectations of future prices of innovation on the take-
off and shape of technology diffusion. More recently,
Khanna (2001) includes a proxy variable for farmer’s
innovativeness in a double selectivity model and finds it
to have a significant impact on the adoption of variable
rate technology in four Midwestern states in the U.S.
Fernandez-Cornejo (2007), working on the hypothesis
that adoption is driven by “unquantified” advantages,
such as simplicity and flexibility, which translate to
reduced managerial intensity, concludes that adoption
of agricultural innovations that save managerial time is
positively associated with higher off-farm income. An
earlier study by Dorfman (1996) which investigates
adoption decisions by farmers facing multiple
technologies which can be adopted in various
combinations via a multinomial probit model shows
that adoption decisions are most significantly
influenced by off-farm labor supply.
Aside from household and technology
characteristics, property rights and institutions also play
an important role in adoption decisions. Jodha and
Mundial (1992), in analyzing the impact of changing
property rights regime, found that if a technology
requires large adopting farmers to enforce property
rights, privatizing resources previously held in common,
then small farmers will adversely be affected and make
it difficult for them to adopt. Yesuf and Kholin (2008),
in investigating the impacts of market and institutional
imperfections on technology adoption, learned that
limited access to credit, plot size, risk considerations,
and rates of time preference, were significant factors in
explaining variations in farm technology adoption
decisions. Smucker et al. (2000), in their study of
agricultural technology adoption in Haiti, suggest that
perceived stability of access to land – via stability of
personal and social relationships – is a more important
determinant of technology adoption than formal land
titles. The results of the study by Katungi (2006) on
social capital and technology adoption on Ugandan
farms indicate that different aspects of social capital
shape the decision to use and extent of use of an
improved management practice, but the nature of the
effect is specific to the practice as well as form of social
capital. Isham (2000) finds that tribally-based social
affiliations, acting as a form of social capital, influence
adoption decisions in Tanzania.
Transaction cost is another important factor that
affects technology adoption. Feder, et al. (1985)
identifies market access as one of the determinants of
the adoption of agricultural innovation. Meng (1997)
found that distances to market and road quality
influence variety choice. Omamo (1998a) observed that
transportation costs explained why farmers choose low
return food crops instead of high return cash crops.
Perrin and Winklemann (1976) identified that
transaction costs involved in learning and acquiring new
technology are important determinants of the rate of
technology adoption. Khaledi et al. (2010) evaluated the
effect of transaction costs on the decision to convert
partially or completely from conventional to organic
practices. The results highlight the importance of
lowering certain transaction costs to encourage the
adoption of organic management practices. Significant
transaction costs were found to include infrastructure
and services, satisfaction with marketer performance,
marketing problems, and Internet use. Hintze (2002)
found that transaction cost variables, particularly the
quality of roads connecting villages to markets, are
significant in explaining variety choice of Maize in
Honduras. Jayne et al. (1999) studied how the decisions
of Zimbabwe’s farmers to cultivate cash and food crops
can be affected by transaction costs among net buyers
of the food crop (without requiring a risk related
explanation). Usually, relative profitability calculations
for food and cash crop alternatives imply that the cash
Technology and Competitiveness: Assessing The Influence of Transaction Costs in The Adoption of Technology and Recommended Farm Practices for Rice
42
crop is the better alternative. However, in the presence
of transaction costs, cash crop cultivation may provide
lower expected net revenues than food crops for grain-
deficit households, depending on the level of food
marketing costs and consumer prices in rural areas. For
net food purchasers, the opportunity cost of cash crop
production is the cost of acquiring food grains
(including transaction costs) and not the expected profit
of selling grain or other food crops (as cited by Hintze,
2002).
III. Empirical Framework
The technology adoption is defined as farmers’
utilization of the Department of Agriculture’s
recommended technology and farming practices during
the 2006 wet season. While the recommended farming
practices are being promoted by the government as a
package through an integrated crop management
system called the PalayCheck System (a full description
of which can be found in Castañeda, 2007), independent
use of the components can still result in positive benefits,
albeit less than the benefits that could accrue to the
farmer if the whole package is adopted. The data set
provides information on farmers’ use of eight
recommended technologies/practices, which are core
components of five of the seven key checks of the
PalayCheck system. The technologies/ practices are: the
use of certified seeds, the use of 400 m2 seedbed, no high
and low soil spots, use of recommended seeding rates,
use of organic fertilizer, basal fertilizer application, use
of the minus-one element technique (MOET), use of the
leaf color chart (LCC), and intermittent/controlled
irrigation. For parsimony, these technologies/practices are
categorized into five management areas: seed quality,
land preparation, crop establishment, nutrient
management, and water management. Table 1 shows
the classification of each technology/practice according
to the abovementioned categories. The choice set is
therefore comprised of the five categories and the
choice of not adopting. A category is considered
adopted when at least one of the recommended
technologies/practices is utilized by the farmer.
Table 1. Classification of Recommended Technologies/Practices
Land Preparation Crop Establishment Nutrient
Management Water
Management 1. Use of certified seeds
1. No high and low soil spots
1. Use of 400 m2 seedbed
1. Basal fertilizer application
1. Intermittent/ controlled irrigation
2. Use of recommended seeding rates
2. Use of the minus-one element technique (MOET
3. Use of organic fertilizer
3. Use of the leaf color chart (LCC)
The study adopts the random utility framework
wherein the farmer, i, is designated as the decision
maker and is faced with J choices of technologies to
adopt. The farmer will obtain a certain level of utility (or
profit) from each alternative. The utility (profit) that
farmer i obtains from technology j is
U
ij T
ij'
ij (1)
The farmer chooses the alternative the yields the
greatest utility (profit). Hence, the behavioral model is:
choose alternative k if and only if Uik > Uij, k ≠ j.
The study implements this through the multinomial
logit model. The multinomial logit model is an
extension of the binary logit model where the unordered
response has more than two outcomes (Woolridge,
2002). Following Long and Freese (2001) the
multinomial logit model can be written formally as
Journal of Global Business and Trade Vol. 8, No. 2 (2012)
43
lnm|b
( X ) lnPr( y j | X )
Pr( y b | X ) X
m|b for
m=0,….,J (2)
where ln is the logit (log of the odds ratio)
function and b is the base category or the comparison
group. These J equations can be solved to compute the
predicted probabilities:
Pr( y j | X ) e
X j|b
eXk|b
k0
K (3).
The model regresses the vector of farm and
household characteristics and transaction costs against
the choice of not adopting, adopting only one
management category, and adopting multiple
management categories.
One important assumption that the multinomial
logit presupposes is independence of irrelevant
alternatives or IIA. IIA refers to the fact that the odds of
choosing one alternative over another are independent
of the presence or absence of additional alternatives in
the choice set – that is, the probability ratio is the same
no matter what other alternatives are in the choice set
(Hintze, 2002). The results of both the suest-based
Hausman tests and the Small-Hsiao tests support the
assumption of IIA for the model.
The set of covariates used are: farm gate price of rice
(PRODUCERPRICE), farm size (APLANT), a
dummy variable for irrigated barangays
(IRRIGATION), farmer’s years of education
(YRSSCHOOL), farm experience (YRSFARM), the
prevailing wage rate (WAGE), dummy variables for
membership in farmers’ organizations (ORGMEM)
and training attended (TRAINING), ordinal rankings
that represent the income class of the municipality
(INCOMECLASS), and dummy variables for access to
informal credit (INFORMAL), whether the family has
a source of off-farm income (NFARM) and land
ownership (OWNLAND). In addition, a dummy
variable representing road structure/conditions, i.e.
whether roads are paved or not (ASPCON1), is also
included. The distance from the wholesale market
(DISTANCE) and an interaction term for distance and
road condition (ASPCON1XDISTANCE) are used as
regressors as well. A regional dummy for Central Luzon
(CL) is also included as a covariate.
Prices are incentives for suppliers to supply more. It
is expected that the higher the farm gate prices, the more
incentive the farmers have to increase their yield and the
higher the odds of adopting a certain technology.
It is usually assumed that larger farms are more
likely to adopt. Farm size may be expected to be more
important for technologies that entail a large fixed cost
of implementation. Also, farm size may be related to
wealth and economies of scale, both of which would
have an influence in adoption decisions (Hintze, 2002).
Land ownership, on the other hand, affects the kind of
technology that is adopted. Unsecure property rights
usually discourage farmers from adopting technologies
that require larger fixed investments.
Road structure, distance from the wholesale market,
and the interaction term for distance and road structure
represent transport costs that influence access to both
output and input markets. Omamo (1998a) and Meng
(1997) have shown that transport costs influence
technology choices. The income class of the
municipality proxies for physical and market
infrastructure and institutions. It is expected that farmers
who are situated in higher ranked municipalities (i.e.
cities and 1st class towns) are likely to have more access
to input and output markets and information than those
in lower ranked municipalities (4th and 5th class)
because richer municipalities would tend to have better
infrastructure, communication facilities and have more
commercial establishments which can reduce
transaction costs in the input and output markets.
Farmer’s years of education, farm experience,
membership in organizations and training attended
represent household characteristics that determine the
farmer’s ability to mitigate information costs. Perrin and
Winklemann (1976) identified that transaction costs
Technology and Competitiveness: Assessing The Influence of Transaction Costs in The Adoption of Technology and Recommended Farm Practices for Rice
44
involved in learning and acquiring new technology are
important determinants of the rate of technology
adoption.
Access to credit is an important factor that
determines technology adoption. Feder, et al. (1985)
identified credit constraints as an impediment to
technology adoption in developing economies since
technologies introduced to increase agricultural
productivity are often accompanied by an increase in the
cost of some inputs. The availability of informal credit
gives the farmer a second best option in lieu of high
transaction costs associated with formal credit
institutions. Access to sources of nonfarm income is
also expected to ease credit constraints.
The type of irrigation affects the choice of
technology that the farmer adopts as it determines land
quality, reduces uncertainty and defines the kind of
water management scheme to implement.
The wage rate represents input costs while the
regional dummy for Central Luzon is used to account
for the fact that technology diffusion is often limited
initially by geography and that adoption is usually high
within the geographical bounds of the initial source of
the technology because of lower information costs.
Since these recommended practices were developed by
the Philippine Rice Research Institute (PhilRice) in
Central Luzon, it is expected that farmers in this region
will have higher adoption rates.
The study uses data from the 2006 Wet Season
round of the Rice-Based Farm Household Survey
conducted by the Philippine Rice Research Institute
(PHILRICE) and the Bureau of Agricultural Statistics
(BAS). The RBFHS is conducted every five years to
update and monitor changes in the rice farming sector.
It covers 33 major rice-growing provinces of the
country with 1999 sample households. The RBFHS
adopted a two-stage stratified sampling technique
where the province is the domain, the barangay is the
first stage sampling unit, and the household is the
second stage sampling unit. Sample farm households
were selected using a random start and application of the
“right coverage procedure” (Matala et al., 2008). After
dropping observations due to missing data, the
regression model uses a total of 1620 observations.
Table 2 presents the sample summary statistics of the
variables used.
Table 2. Definitions and Full Sample Summary Statistics of Variables Used (N=1620)
Variable Definitions Mean Std. Dev. Min Max Farmgate price (PRODUCERPRICE) 9.52 1.46 6 24 Barangay is irrigated (=1 if irrigated, 0 otherwise) (IRRIGATION) 0.68 0.47 0 1 Number of years schooling (YRSSCHOOL) 7.42 3.26 0 18 Number of years farming (YRSFARM) 25.14 13.48 0 72 Farm size (APLANT) 1.07 0.93 0.05 10 Distance from nearest wholesale market (DISTANCE) 6.78 6.96 .1 58 Paved roads (=1 if yes, 0 otherwise) (ASPCON1) 0.64 0.48 0 1 Interaction term for distance and pave roads (ASPCON1XDISTANCE)
4.38 6.51 0 58
Access to informal credit (=1 if yes, 0 otherwise) (INFORMAL)
0.42 0.49 0 1
Income class of the municipality (INCOMECLASS) 3.54 1.47 1 6 Wage rate (WAGE) 151.60 28.44 93.33 206.25 Own land (=1 if yes, 0 otherwise) (OWNLAND) 0.21 0.41 0 1 Attended trainings on rice (=1 if yes, 0 otherwise) (TRAINING)
0.39 0.48 0 1
Has source of nonfarm income (=1 if yes, 0 otherwise) (NFARM) 0.71 0.45 0 1 Membership in farmers’ organizations (=1 if yes, 0 otherwise) (ORGMEM)
0.47 0.50 0 1
Regional dummy for Central Luzon (CL) 0.17 0.38 0 2
IV. Results and Discussions
Journal of Global Business and Trade Vol. 8, No. 2 (2012)
45
Table 3. Multinomial Logit Results for Single and Multiple Adopters
VARIABLES Single Multiple Multiple (vs. Single)
PRODUCERPRICE 1.051547 1.043934 0.9927608 (0.0521365) (0.0496625) (0.0383037)
IRRIGATION 3.092415*** 5.702179*** 1.843924*** (0.4666212) (0.8421799) (0.262082)
WAGE 0.9937669** 0.9884008*** 0.9946002** (0.0025922) (0.002484) (0.0022025)
YRSSCHOOL 0.9866649 1.046752* 1.060899*** (0.0242887) (0.0247046) (0.0220192)
YRSFARM 0.9809924*** 0.9934664 1.012716*** (0.0055929) (0.0053856) (0.0050381)
ORGMEM 1.369111** 1.205571 0.88055 (0.214554) (0.1804212) (0.1149847)
TRAINING 1.054747 1.510778 *** 1.432361*** (0.1688727) (0.2275666) (0.1884989)
DISTANCE 1.013895 1.009497 0.9956624 (0.015374) (0.015143) (0.0120849)
ASPCON1 1.251136 1.340993** 1.071821 (0.1904914) (0.1951995) (0.1375205)
ASPCON1XDISTANCE 0.9709147* 0.9763283 1.005576 (0.0156035) (0.0152268) (0.0131523)
INFORMAL 1.314161* 1.414811** 1.076589 (0.1974536) (0.2030296) (0.133495)
NFARM 1.157558 0.9984571 0.8625549 (0.1881048) (0.1531241) (0.1166463)
APLANT 1.137927 1.102375 0.9687574 (0.116251) (0.1078631) (0.0695483)
OWNLAND 1.138111 1.171341 1.029197 (0.2427534) (0.2380526) (0.1749751)
INCOMECLASS 0.9717781 0.8603783*** 0.885365*** (0.0488423) (0.0411268) (0.0378097)
CL 0.5868605*** 0.3412154*** 0.5814251*** (0.1127831) (0.0641552) (0.104618)
Observations 1620 1620 1620 *** p<0.01, ** p<0.05, * p<0.1; standard errors in parenthesis
Table 3 presents the results of the multinomial logit
model which determines the effects of transaction cost
on the farmer’s decision to use one technology (i.e.
management category) and the decision to use a
combination of technologies. The second and third
columns give the result of the multinomial logit model
with not adopting as the base outcome (i.e. the choice is
between adopting one technology and not adopting and
adopting multiple technologies and not adopting). The
fourth column, on the other hand, presents the result of
the logit regression wherein the pairwise comparison is
between adopting only one technology and adopting
more than one technology (i.e. the base outcome is
adopting only one technology). All results are
expressed in conditional odds ratios (relative risk ratios).
The conditional odds ratio of IRRIGATION,
WAGE, and CL are statistically significant for single
and multiple adopters (vis a vis not adopting and single
adoption). Since the odds ratios for IRRIGATION are
greater than 1, being in an irrigated barangay gives the
farmer higher odds of adopting a certain practice than
those in barangays that only have rain fed irrigation.
Single adopters have 3 times higher odds of adopting
while multiple adopters have almost 6 times higher odds
if the choice is between adopting and not adopting, and
Technology and Competitiveness: Assessing The Influence of Transaction Costs in The Adoption of Technology and Recommended Farm Practices for Rice
46
an 80% higher odd of adopting if the choice is between
using one technology and using multiple technologies.
The odds ratio associated with WAGE is less than
one, implying that a one peso increase in the wage rate
reduces the odds of adopting. For both single and
multiple adopters, an increase in the wage rate makes
them less likely to adopt by at least an odds ratio of 0.98.
This is due to the fact that most of the practices may
entail additional labor and thus higher costs as wage
rates increase.
Interestingly, the conditional odds ratio associated
with the regional dummy for Central Luzon is less than
one, implying that those in the region are less likely to
adopt than those outside the region, which is opposite of
what was expected. Further investigation of the sample
population reveals that there are more adopters outside
of Central Luzon (77%) than adopters in Central Luzon
(65.6%). The two-sample test of proportion affirms that
indeed, Central Luzon has proportionately more non-
adopters than the rest of the country. One possible
explanation may be the fact that the sample from
Central Luzon has proportionately less farmers who
attended training, 30.11% to 39.76%, indicating that
extension efforts may be geared toward farmers who
have less access to information geographically.
Furthermore, the mean wage in Central Luzon is higher
(P162.9182) than in the other regions (P150.0528)
indicating that whatever advantage in terms of
information costs that proximity to the source of
technology may bring is offset by higher input costs
associated with technology adoption.
The conditional odds ratios associated with farming
experience (YRSFARM) are statistically significant for
single adopters and multiple adopters (if the other option
is adopting a single technology). The odds ratios
indicate that less experienced farmers usually adopt one
technology first while more experienced farmers
usually adopt multiple practices. An additional year of
experience increases the odds of adopting more than
one practice/technology by 6%.
Organizational membership (ORGMEM) increases
the odds of adopting one technology while attendance
in training (TRAINING) and each year of education
completed (YRSSCHOOL) increase the odds of
adopting more than one technology.
Road conditions/structure significantly influence
the adoption of technology. The conditional odds ratio
of the interaction term for distance and road structure
(ASPCON1XDISTANCE) is less than one and is
statistically significant at 10% for single adopters while
the odds ratio of the dummy variable for paved roads
(ASPCON1) is statistically significant at the 5% level
for multiple adopters. For single adopters, the general
effect of distance and road structure on the likelihood of
adoption are the combined effects of the constituent
variables and the interaction term. However, the
combined effects of distance and the interaction term as
computed are not jointly significant at the 90%
confidence interval for single adopters. On the other
hand, road conditions matter for multiple adopters.
Paved roads increase the odds of adopting multiple
technologies 1.34 times. This stresses the importance of
transport costs in technology adoption.
Access to informal credit (INFORMAL) is also a
significant determinant of technology adoption as the
odds of both single and multiple adopters are higher for
those with access to informal credit than those who do
not have access. Better physical and market
infrastructure and institutions as represented by the
variable INCOMECLASS also increases the odds of
adopting multiple technologies but is not influential for
single adopters. Those in lower ranked municipalities
have at least 0.86 less odds of adopting than those in the
higher ranks.
V. Summary and Conclusions
The paper explored the influence of transaction
costs on the adoption of technology and recommended
farm practices by rice farmers. The study suggested that
aside from farm and household characteristics,
Journal of Global Business and Trade Vol. 8, No. 2 (2012)
47
transaction costs affect farmers’ decisions to adopt
recommended rice technologies and farm practices.
Transaction costs affect the decision to adopt multiple
practices or not. Significant influences of transaction
cost variables like INCOMECLASS, INFORMAL and
ASPCON1 emphasize the fact that the full benefits of
technology adoption can only be realized if the farmer
has adequate access to the market. A reduction of
transaction costs makes adopting recommended
practices more attractive as it assures the farmer that the
eventual increases in yield will result in a higher level of
market participation and therefore higher value of net
surplus.
Since lower transport costs, better infrastructure and
irrigation, and more access to credit have been shown to
have positive effects on the adoption of technology,
more investments in these areas will further increase
productivity and enhance the farmers’ competitiveness
not only through improved market access but also
through increased adoption of technological
innovations.
VI. References
Alene, A., Manyong, V.M., Omanya, H.D., Mignouna,
H.D., Bokanga, M., Odhiambo, G., (2008).
Smallholder market participation under transaction
costs: Maize suppy and fertilizer demand in Kenya.
Food Policy, 33:318-328.
Baliscan, A., Sebastian, L. and Associates. (2006).
Securing rice, reducing poverty: Challenges and
policy directions. College, Laguna: SEARCA.
Besley, T., & Case, A. (1993). Modelling technology
adoption in developing countries. American
Economic Review, 83:396-402.
Castañeda, A. (2007). An evaluation of the potential
impact of the PALAYCHECK system for the
Philippine rice industry. M.A. Thesis. UP School of
Economics.
De Janvry, A., Fafchamps, M., Sadoulet, E., (1991).
Peasant household behavior with missing markets:
some paradoxes explained. Econ. J., 101:1400-
1417.
De Janvry, A., & Sadoulet, E. (2005). Progress in the
modeling of rural houeholds’ behavior under
market failures. In Poverty, Inequality and
Development, essays in Honor of Erick Thorbecke.
De janvry A. and Kanbur R., eds. Kluwer
Publishing.
Dorfman, J. (1996). Modeling multiple adoption
decisions in a joint framework. American Journal of
Agricultural Economics, 78:547-57.
Feder, G. (1982). Adoption of interrelated agricultural
innovations: Complementarity and impact of risk,
scale and credit. American Journal of Agricultural
Economics, 64:94-101.
Feder, G., Just R., & Zilberman D. (1985). Adoption of
agricultural innovations in developing countries: a
survey. Econ Dev Cult Change 33:255-298.
Feder, G., & Umali D. (1993). The adoption of
agricultural innovations: a review. Technological
Forecasting and Social Change, 43:215-239. Fernandez-Cornejo, J. (2007). Off-farm income,
technology adoption, and farm economic
performance. Economic Research Report Number
36. United States Department of Agriculture. Greene, W. (1997). Econometric Analysis 3rd ed. New
Jersey: Prentice-Hall, Inc.
Hintze, L. (2002). Characteristics, transaction costs, and
adoption of modern varieties in Honduras. Ph.D.
Dissertation. North Carolina State University.
Isham, J. (2000). A model of technology adoption with
social capital. Ph.D. Dissertation. University of
Maryland.
Joshi, G., & Pandey, S. (2005). Effects of farmers’
perceptions on the adoption of modern rice varieties
in Nepal. A paper presented at the Conference on
International Agricultural Research for
Development, Srtuttgart-Hohenheim, October 11-
13, 2005.
Katungi. E. (2006). Social capital and technology
adoption on small farms: The case of banana
production technology in Uganda. Ph.D.
Dissertation. University of Pretoria. South Africa.
Technology and Competitiveness: Assessing The Influence of Transaction Costs in The Adoption of Technology and Recommended Farm Practices for Rice
48
Key, N., Sadoulet, E., de Janvry, A. (2000). Transaction
Cost and agricultural household supply response.
Am. J. Agric. Econ. 82(1), 245-259.
Khanna, M. (2001). Sequential adoption of site-specific
technologies and its implications for nitrogen
productivity: a double selectivity model. American
Journal of Agricultural Economics, 83:35-51.
Khaledi, M. Weseen, S., Sawyer, S., Ferguson, S., Gray,
R. (2010). Factors influencing partial and complete
adoption of organic farming practices in
Saskatchewan, Canada. Canadian Journal of
Agricultural Economics, 58:37-56.
Kshirsagar, K. Pandey, S., Bellon, R. (2002). Farmer
perceptions, varietal characteristics and technology
adoption: a rainfed rice village in Orissa. Economic
and Political Weekly, 37:1239-1246.
Long, J., & Freese, J. (2001). Regression models for
categorical dependent variables using STATA.
Stata Corporation.
Makhura M., Kirsten J., Delgado C. (2001). Transaction
costs and smallholder participation in the maize
market in the Northern Province of South Africa. A
paper presented at the Seventh Eastern and
Southern Africa regional Conference, February
2001.
Matala, A., Jamora, N., Moya, P., Dawe, D. (2008). A
decade of rice yield growth in the Philippines:
changes in crop management practices, input use,
and technology adoption. Paper presented at the 6th
ASAE International Conference. 28-30 August
2008. Makati City, Philippines. Meng, E. (1997). Land allocation decisions and in situ
conservation of crop genetic resources: the case of
wheat landraces in Turkey. Ph.D. Dissertation.
University of California, Davis. Omamo, S. (1998a). Transport cost and smallholder
cropping choices: an application to Saiya zdistrict,
Kenya. Am. J. Agric. Econ. 80(1), 116-123.
Omamo, S. (1998b). Farm–to–market transaction costs
and specialization in small-scale agriculture:
Explorations with a non-separable household
model. The Journal of Development Studies,
35:152-163.
Perrin, R., & Winkelmann, D. (1976). Impediment to
technical progress on small versus large farms.
American Journal of Agricultural Economics 58:
888-894.
Renkow, M., Hallstrom, D., Karanja, D. (2004). Rural
infrastructure, transactions costs and market
Participation in Kenya. Journal of Development
Economics, 73:349-367.
Smucker, G., Anderson, T., Bannister, M. (2000). Land
tenure and the adoption of agricultural technology
in Haiti. CAPRi Working Paper No. 6. StataCorp, (2009). Stata : Release 11. Statistical
Software, College Station, TX: SataCorp I.P. Vakis, R. (2002). The impact of market failures on
household behavior: explaining labor market
segmentation, technology adoption patterns and
transaction costs in rural Peru. Ph.D. Dissertation.
University of Califronia-Berkely.
Winter-Nelson, A., & Temu, A. (2002). Institutional
adjustment and transaction costs: product and
inputs markets in the Tanzanian coffee system.
World Dev. 30(4), 561-574.
Winter-Nelson, A., & Temu, A., (2005). Impacts of
prices and transactions costs on input usage in a
liberalizing economy: evidence from Tanzanian
coffee growers. Agric. Econ. 33(3), 243-253.
Woolridge, J. (2002). Introductory econometrics: A
modern approach, second edition. South-Western.
Yesuf, M., & Kohlin, G., (2008). Market imperfections
and farm technology adoption decisions: A case
study from the highlands of Ethiopia. Environment
for Development Discussion Paper Series 08-04.
Journal of Global Business and Trade Vol. 8, No. 2 (2012)
49
Journal of Global Business and Trade
Technical Efficiency and Profitability Analyses of Tea Production in Phú Tho Province, Vietnam Hoang Van Hung, Reynaldo L. Tan, Dinah Pura T. Depositario and Jimmy B. Williams Department of Agribusiness Management, College of Economics and Management, University of the Philippines Los Baños, Philippines
ARTICLE INFO
ABSTRACT
Keywords: Technical Efficiency, Productivity, Profitability, Tea Production, Vietnam, Cobb-Douglas Frontier Production Function
In an economy where resources are scarce, raising productivity by improving an economic activity’s efficiency becomes the more feasible option. This study analyzed the technical efficiency of tea production in Phú Tho province, Vietnam in order to identify the factors which could contribute to greater productivity and profitability. Using a stochastic frontier approach to determine the sources of productive efficiency/inefficiency, data for the year 2010 from 182 tea farmers from six communes in Phú Tho province in Vietnam was analyzed to examine technical efficiency in tea production. Results show that education, experience, and organization membership have significant negative relationships with technical inefficiency. Further, the results reveal that the technical efficiency of tea farms ranged from 43.50% to 99.99% with a mean of 80.09%, which suggests that the tea output of the “average farmer” could still be increased by 19.91% if the technology followed by the “best performers” is adopted. It was found that improved yield can be achieved by increasing labor presently applied and by planting a higher-yielding variety. A cost and return analysis showed that the farmers who planted new varieties (LDP) posted higher income compared to those who planted the old variety (PH).
I. Introduction
The top five tea-exporting countries in the world, as
of 2008, are Kenya, Sri Lanka, China, India and
Vietnam (FAO, 2008). Although Vietnam is the fifth
biggest tea exporter in the world, the local tea industry
is facing serious challenges. Though its volume of tea
export increased twice from 55,600 tons in 2000 to
114,000 tons in 2007, the export price of Vietnam tea
declined from 1.252 USD/kg to 1.148 USD/kg. In
contrast, the volume and price of tea in the world
increased from 1,464,334 kg with a price of 1.997
USD/kg in year 2000 to 1,701,607 kg with a price of
2.404 USD/kg in 2007. In addition, Vietnamese tea in
the international markets is considered of lower quality.
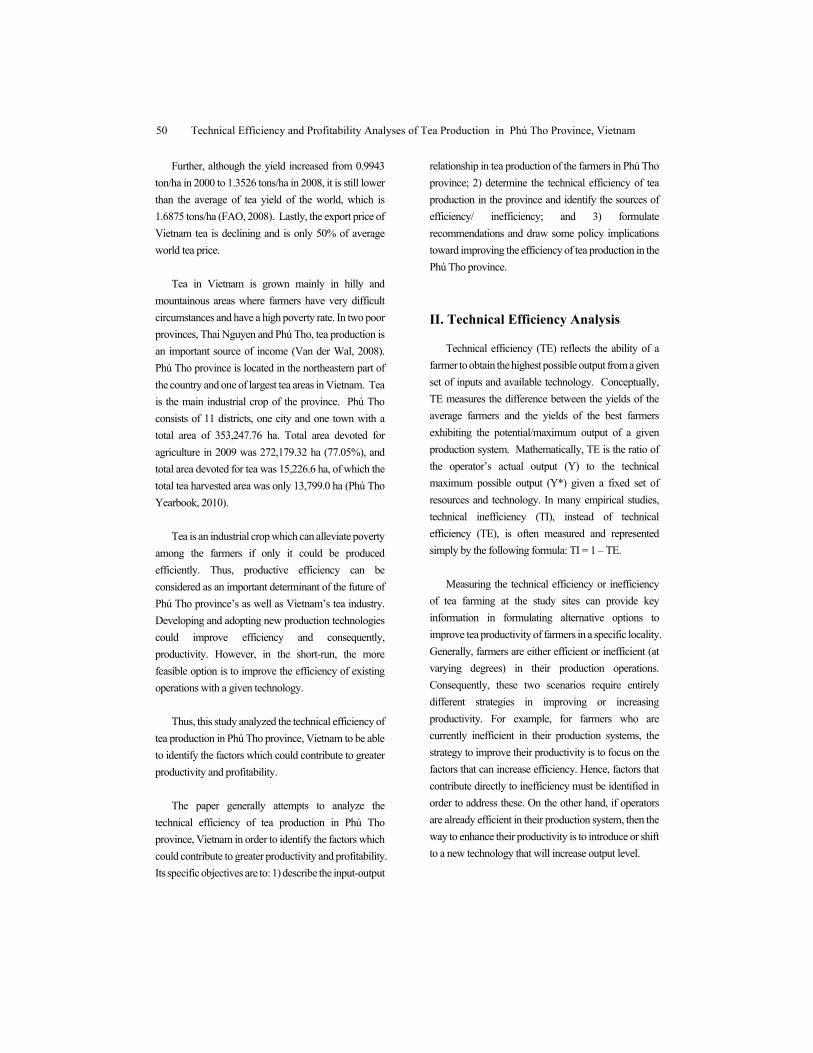
Technical Efficiency and Profitability Analyses of Tea Production in Phú Tho Province, Vietnam
50
Further, although the yield increased from 0.9943
ton/ha in 2000 to 1.3526 tons/ha in 2008, it is still lower
than the average of tea yield of the world, which is
1.6875 tons/ha (FAO, 2008). Lastly, the export price of
Vietnam tea is declining and is only 50% of average
world tea price.
Tea in Vietnam is grown mainly in hilly and
mountainous areas where farmers have very difficult
circumstances and have a high poverty rate. In two poor
provinces, Thai Nguyen and Phú Tho, tea production is
an important source of income (Van der Wal, 2008).
Phú Tho province is located in the northeastern part of
the country and one of largest tea areas in Vietnam. Tea
is the main industrial crop of the province. Phú Tho
consists of 11 districts, one city and one town with a
total area of 353,247.76 ha. Total area devoted for
agriculture in 2009 was 272,179.32 ha (77.05%), and
total area devoted for tea was 15,226.6 ha, of which the
total tea harvested area was only 13,799.0 ha (Phú Tho
Yearbook, 2010).
Tea is an industrial crop which can alleviate poverty
among the farmers if only it could be produced
efficiently. Thus, productive efficiency can be
considered as an important determinant of the future of
Phú Tho province’s as well as Vietnam’s tea industry.
Developing and adopting new production technologies
could improve efficiency and consequently,
productivity. However, in the short-run, the more
feasible option is to improve the efficiency of existing
operations with a given technology.
Thus, this study analyzed the technical efficiency of
tea production in Phú Tho province, Vietnam to be able
to identify the factors which could contribute to greater
productivity and profitability.
The paper generally attempts to analyze the
technical efficiency of tea production in Phú Tho
province, Vietnam in order to identify the factors which
could contribute to greater productivity and profitability.
Its specific objectives are to: 1) describe the input-output
relationship in tea production of the farmers in Phú Tho
province; 2) determine the technical efficiency of tea
production in the province and identify the sources of
efficiency/ inefficiency; and 3) formulate
recommendations and draw some policy implications
toward improving the efficiency of tea production in the
Phú Tho province.
II. Technical Efficiency Analysis
Technical efficiency (TE) reflects the ability of a
farmer to obtain the highest possible output from a given
set of inputs and available technology. Conceptually,
TE measures the difference between the yields of the
average farmers and the yields of the best farmers
exhibiting the potential/maximum output of a given
production system. Mathematically, TE is the ratio of
the operator’s actual output (Y) to the technical
maximum possible output (Y*) given a fixed set of
resources and technology. In many empirical studies,
technical inefficiency (TI), instead of technical
efficiency (TE), is often measured and represented
simply by the following formula: TI = 1 – TE.
Measuring the technical efficiency or inefficiency
of tea farming at the study sites can provide key
information in formulating alternative options to
improve tea productivity of farmers in a specific locality.
Generally, farmers are either efficient or inefficient (at
varying degrees) in their production operations.
Consequently, these two scenarios require entirely
different strategies in improving or increasing
productivity. For example, for farmers who are
currently inefficient in their production systems, the
strategy to improve their productivity is to focus on the
factors that can increase efficiency. Hence, factors that
contribute directly to inefficiency must be identified in
order to address these. On the other hand, if operators
are already efficient in their production system, then the
way to enhance their productivity is to introduce or shift
to a new technology that will increase output level.
Journal of Global Business and Trade Vol. 8, No. 2 (2012)
51
The procedure for measuring technical
efficiency/inefficiency entails several options in
estimating the underlying production function that
defines the input-output relationship of the farmer.
Among the existing approaches, the stochastic frontier
model has been one of the most popular and appropriate
models in assessing farm efficiencies in Asian
aquaculture (Dey et. al. 2005; Bimbao et al.,2000;
Sharma and Leung, 2000a, 2000b; and Irz & McKenzie,
2003 as cited by Tan et. al., 2009).
The technical efficiency model of Tan et al. (2009)
(based on the works of Aigner, Lovell and Schmidt
(1977) and Meeusen and van den Broeck (1977)),
specified the production function as follows:
Yi = f (Xi; β) exp (Vi – Ui)
Where:
Yi is the output of the ith farm (i = 1, 2, 3,…, n);
Xi is a l x k vector of input quantities applied by
the ith farm;
Β is a k x l vector of model parameters to be
estimated;
Ui is a non-negative random error term
associated with technical inefficiency in
production;
Vi is a random error term assumed to be
normally distributed with mean zero and
variance σ2v, i.e., Vi ~N(0, σ2v) and is
independent of Ui.
Note that the technical efficiency model includes
two types of error terms, i.e., Vi which accounts for the
usual random effects in the model while Ui represents
the technical inefficiency in production. Tan et al.
(2009), following Battese and Coelli (1995), assumed
the error term Ui to be independently distributed and has
a half-normal distribution with truncation at zero, i.e., Ui
~ |N(µi, σ2u) |.
The farm-specific frontier production function (Y*)
representing the maximum possible output can be
expressed as:
Y*i = f (xi; ß) exp (Ui)
The technical efficiency of the individual farmer
can be predicted based on the conditional expectation of
exp (-Ui). The level of efficiency depends on the value
of Ui and is interpreted as follows: a) if Ui > 0, then
production lies below the frontier function and the farm
is considered technically inefficient; and b) if Ui = 0,
then production lies on the frontier function and the
farm is deemed technically efficient. Figure 1 shows the
graphical illustration of technical inefficiency given the
yield difference between the “best” and “average”
farmers as represented by the frontier and mean
production functions, respectively. Specifically,
technical efficiency (TEi) of the ith farm is derived as
follows:
TEi = Yi / Yi* = exp (-Ui)
The variance of the model (σ2) can be expressed as
the sum of the variance parameters σv2, i.e.,
σ2 = σv2 + σu
2
γ = σu2/ σ2
The value of gamma (γ) ranges from 0 to 1, which
indicates the possible source of deviation of a given
production level from the frontier production function
specifically, a value of γ equal to 1 implies that the
production deviations from the frontier function are due
entirely on technical inefficiency (Coelli et al. (1998) as
cited in Tan et. al (2009)).
To investigate the possible sources of technical
inefficiency, TE can then be expressed as the function
TEi = σZi where Zi is a l x m vector of farm-specific
variables that may help explain the observed technical
inefficiency among farmers while σ is a m x l vector of
parameters to be estimated.
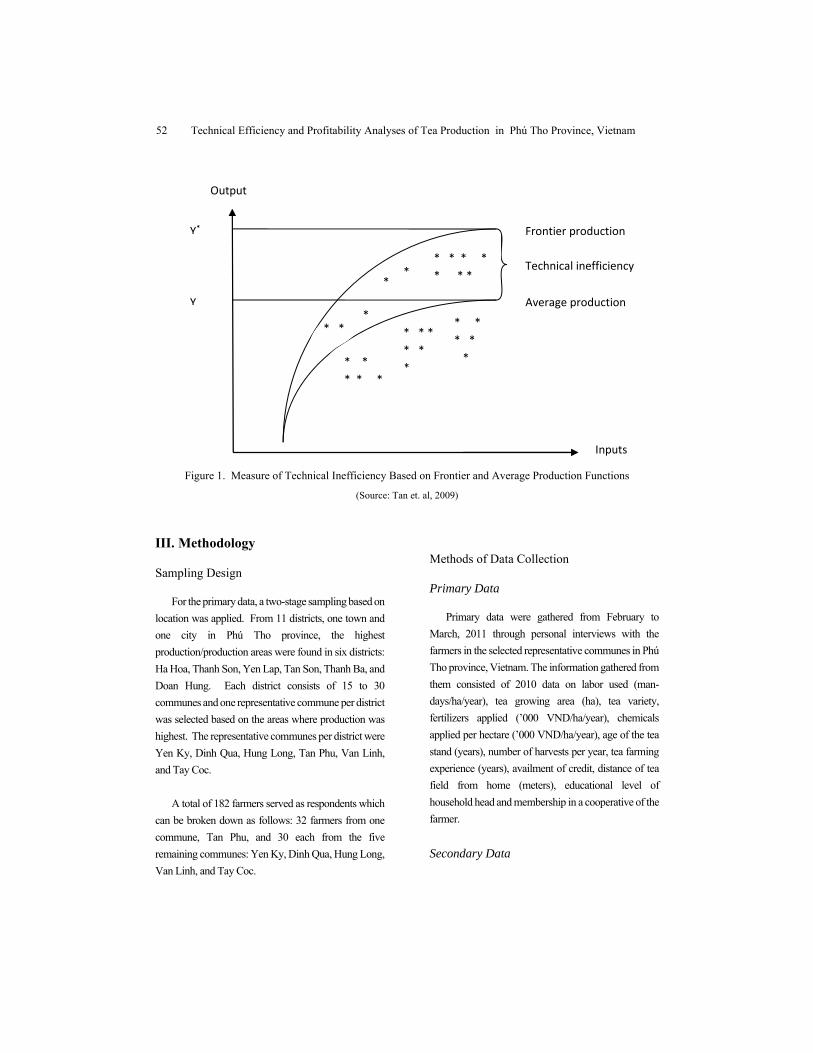
Technical Efficiency and Profitability Analyses of Tea Production in Phú Tho Province, Vietnam
52
Figure 1. Measure of Technical Inefficiency Based on Frontier and Average Production Functions
(Source: Tan et. al, 2009)
III. Methodology
Sampling Design
For the primary data, a two-stage sampling based on
location was applied. From 11 districts, one town and
one city in Phú Tho province, the highest
production/production areas were found in six districts:
Ha Hoa, Thanh Son, Yen Lap, Tan Son, Thanh Ba, and
Doan Hung. Each district consists of 15 to 30
communes and one representative commune per district
was selected based on the areas where production was
highest. The representative communes per district were
Yen Ky, Dinh Qua, Hung Long, Tan Phu, Van Linh,
and Tay Coc.
A total of 182 farmers served as respondents which
can be broken down as follows: 32 farmers from one
commune, Tan Phu, and 30 each from the five
remaining communes: Yen Ky, Dinh Qua, Hung Long,
Van Linh, and Tay Coc.
Methods of Data Collection
Primary Data
Primary data were gathered from February to
March, 2011 through personal interviews with the
farmers in the selected representative communes in Phú
Tho province, Vietnam. The information gathered from
them consisted of 2010 data on labor used (man-
days/ha/year), tea growing area (ha), tea variety,
fertilizers applied (’000 VND/ha/year), chemicals
applied per hectare (’000 VND/ha/year), age of the tea
stand (years), number of harvests per year, tea farming
experience (years), availment of credit, distance of tea
field from home (meters), educational level of
household head and membership in a cooperative of the
farmer.
Secondary Data
Output
Y*
Y
Frontier production
Average production
Technical inefficiency
Inputs
* * * *
* * *
* *
* *
*
* * *
* *
* * *
* * *
* *
**
*
Journal of Global Business and Trade Vol. 8, No. 2 (2012)
53
Secondary data consisting of technical and
statistical data and other relevant information were
obtained from the Ministry of Agricultural and
Development (MAD), the General Office of Statistics,
the Phú Tho Statistic Yearbook, and the Department of
Agriculture in Phú Tho province.
Methods of Data Analysis
To establish the specific relationship between
output and inputs, an empirical production function
must first be specified which commonly takes the form
of the Cobb-Douglas (CD) or the transcendental
logarithmic (translog) functions. Despite the restrictive
nature of the CD function, i.e., constant returns to scale,
Dey et al. (2005) as cited in Tan et al. (2009) have
shown that there were cases that the CD specification
can better capture the production behavior of particular
culture systems. Incidentally, the translog production
function reduces to CD specification when all the
coefficients associated with the second-order
relationships of inputs or interaction terms of the
function are equal to zero. However, when there are
significant interactions among production inputs, the
translog function can be more advantageous than CD in
capturing the production process.
To determine the factors that explain a farmer’s
efficiency, either the TE or TI can be expressed as a
function of the various farm-specific factors that are
hypothesized to affect these, such as the farmer’s
education, age, experience, membership in organization,
type of household by income level, availment of credit,
and distance of farm from the house.
Two approaches can be used to estimate this
regression model. One is to estimate the TE or TI
measure in the first stage and then run the regression
model in the second stage. The second approach is to
estimate the frontier production function and efficiency
regression model simultaneously.
This study employed the second approach as it
boasts of generating parameters that are statistically
efficient and obtained the maximum-likelihood
estimates (MLEs) of the frontier production function
and the parameters of the technical inefficiency
regression simultaneously using the FRONTIER
Version 4.1 software (Coelli, 1994 as cited in Tan et. al
2009).
Both Ordinary Least Square Method (OLS) and
Maximum Likelihood Method (MLM) were employed
to estimate the production functions. OLS gives
information on production function of average practice
farmers while MLM gives information on production of
the best practices farmers or frontier production
function. The estimated frontier production functions
were then used to measure technical efficiency.
Empirical Model for Identifying Determinants of Productivity
The Cobb-Douglas frontier production function,
which was formulated to measure farm specific and
average technical efficiencies for tea production of a
whole province, was specified as follows:
LnYi = β0 + β1LnHARVEST + β2LnFERTILIZER + β3LnCHEMICAL +
β 4LnLABOR + β5LnTEA AGE + β6VARIETY + Vi - Ui
Where:
LnYi = output of farm i (kg)
LnHARVEST = Number of harvest per year
LnFERTILIZER = Fertilizer used expenses (VND’000/ha)
LnCHEMICAL = Chemicals used expenses (VND’000/ha)
Technical Efficiency and Profitability Analyses of Tea Production in Phú Tho Province, Vietnam
54
LnLABOR = Number of labor in the production (man-days)
LnTEA AGE = Tea age (years)
VARIETY = Variety dummy taking value of 1 if variety is LPD, and 0 otherwise PH
Vi = Two- sided error term representing random error of farm i at time t
Ui = One- sided error term, representing technical inefficiency of farm i at time t
β0, αi, γi = Parameters to be estimated.
Empirical Model for Assessing Determinants of Technical Inefficiency
Farmer-specific technical inefficiency, based on the
review of literature, was seen to be influenced by farmer
characteristics and socioeconomic and natural factors.
In this study, farm-specific technical inefficiency
was assumed to be influenced by education, experience,
distance, organization, type of household, credit, and
household age, and the TI function was specified as:
TIj = δ0 + δ1Edu + δ2Experj + δ3Distancej + δ4Organizationj + δ5Creditj + εj
Where:
TIj
=
Technical inefficiency of farm j
Education = Number of years in school of household head (in years)
Experience = Years in cultivation of tea
Distance = The distance from farm’s house to the tea farm
Organization = Organization dummy taking value of 1 if the farmer is member of cooperative, and 0 otherwise
Credit = Credit dummy taking value of 1 if farmer borrowed, and 0 otherwise
Cost and Return Analysis
Profitability was first determined based on the cost
and return of each farm/farmer and then converted on a
per hectare basis (due to farm size differences) for
comparison purposes. A comparison was made based
tea variety planted (i.e., LDP (new variety) vs. PH (old
variety). This comparison was done to determine the
better tea variety in terms of profitability.
Operational Framework of the Study
Figure 3 presents the operational framework of the
study where the relationships between and among
inputs and outputs of the study are shown.
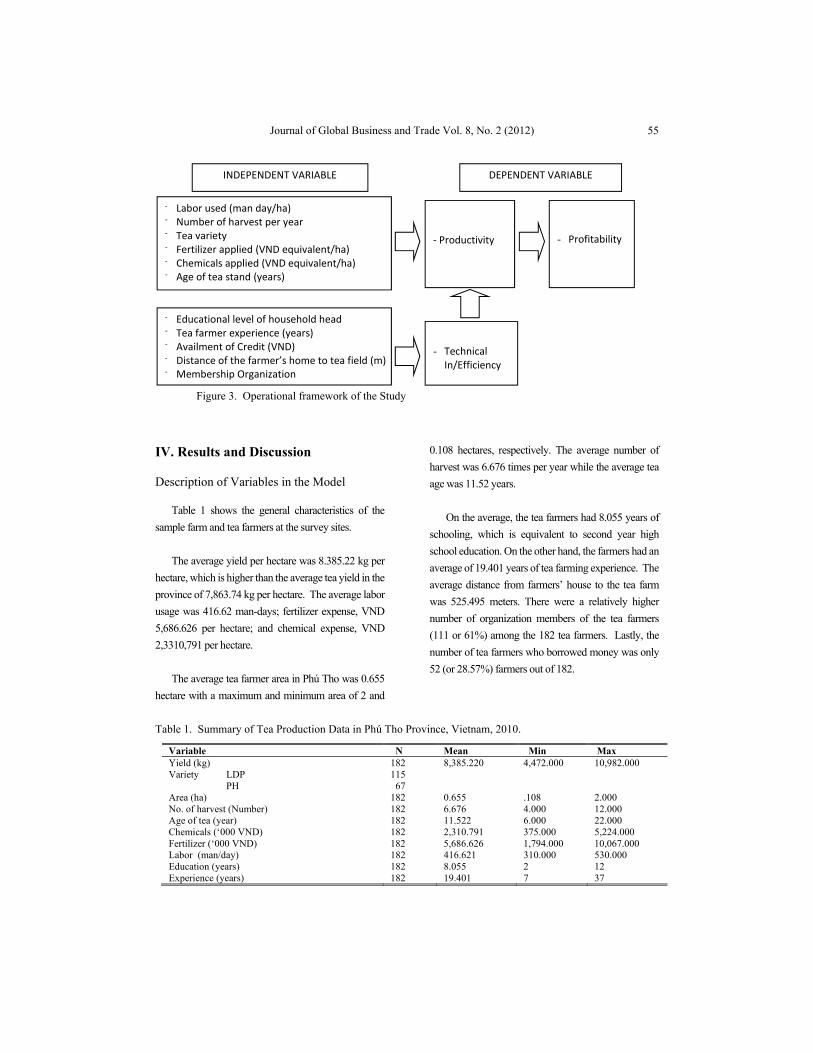
Journal of Global Business and Trade Vol. 8, No. 2 (2012)
55
Figure 3. Operational framework of the Study
IV. Results and Discussion
Description of Variables in the Model
Table 1 shows the general characteristics of the
sample farm and tea farmers at the survey sites.
The average yield per hectare was 8.385.22 kg per
hectare, which is higher than the average tea yield in the
province of 7,863.74 kg per hectare. The average labor
usage was 416.62 man-days; fertilizer expense, VND
5,686.626 per hectare; and chemical expense, VND
2,3310,791 per hectare.
The average tea farmer area in Phú Tho was 0.655
hectare with a maximum and minimum area of 2 and
0.108 hectares, respectively. The average number of
harvest was 6.676 times per year while the average tea
age was 11.52 years.
On the average, the tea farmers had 8.055 years of
schooling, which is equivalent to second year high
school education. On the other hand, the farmers had an
average of 19.401 years of tea farming experience. The
average distance from farmers’ house to the tea farm
was 525.495 meters. There were a relatively higher
number of organization members of the tea farmers
(111 or 61%) among the 182 tea farmers. Lastly, the
number of tea farmers who borrowed money was only
52 (or 28.57%) farmers out of 182.
Table 1. Summary of Tea Production Data in Phú Tho Province, Vietnam, 2010.
Variable N Mean Min Max Yield (kg) Variety LDP PH
182 115 67
8,385.220
4,472.000
10,982.000
Area (ha) 182 0.655 .108 2.000 No. of harvest (Number) 182 6.676 4.000 12.000 Age of tea (year) 182 11.522 6.000 22.000 Chemicals (‘000 VND) 182 2,310.791 375.000 5,224.000 Fertilizer (‘000 VND) 182 5,686.626 1,794.000 10,067.000 Labor (man/day) 182 416.621 310.000 530.000 Education (years) 182 8.055 2 12 Experience (years) 182 19.401 7 37
INDEPENDENT VARIABLE
‐ Productivity
DEPENDENT VARIABLE
- Labor used (man day/ha) - Number of harvest per year - Tea variety - Fertilizer applied (VND equivalent/ha) - Chemicals applied (VND equivalent/ha) - Age of tea stand (years)
- Technical In/Efficiency
- Educational level of household head - Tea farmer experience (years) - Availment of Credit (VND) - Distance of the farmer’s home to tea field (m) - Membership Organization
- Profitability
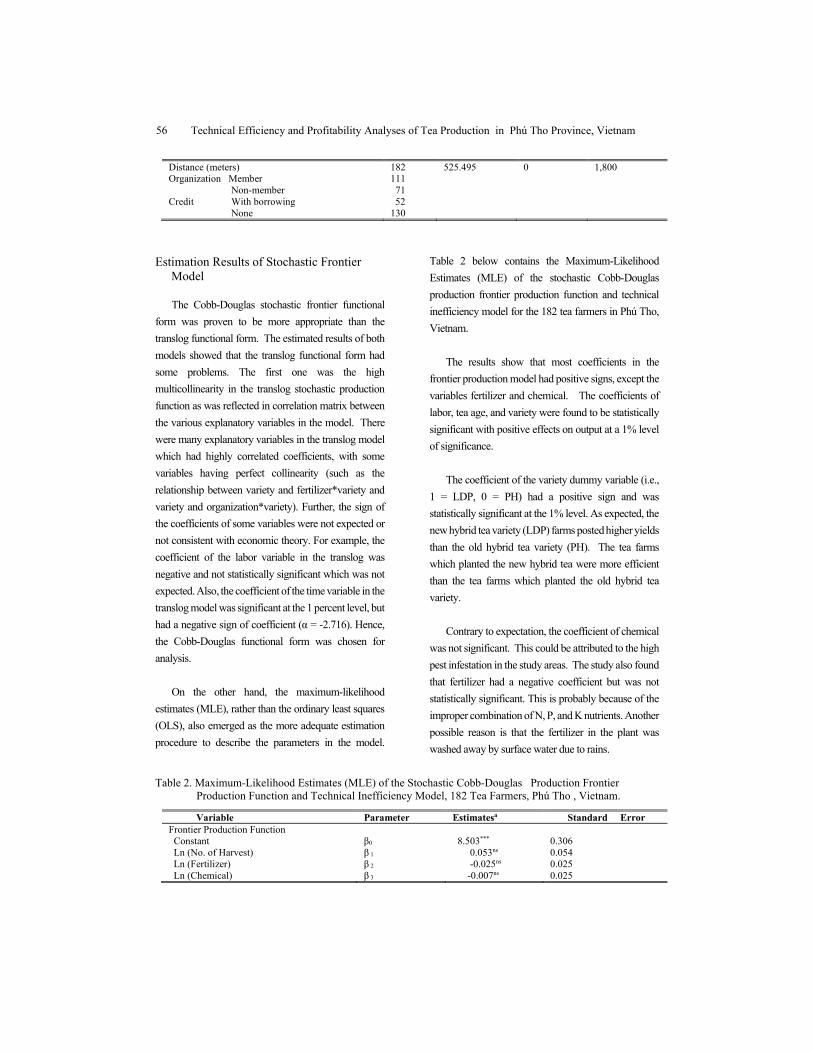
Technical Efficiency and Profitability Analyses of Tea Production in Phú Tho Province, Vietnam
56
Distance (meters) 182 525.495 0 1,800 Organization Member 111 Non-member 71 Credit With borrowing 52 None 130
Estimation Results of Stochastic Frontier Model
The Cobb-Douglas stochastic frontier functional
form was proven to be more appropriate than the
translog functional form. The estimated results of both
models showed that the translog functional form had
some problems. The first one was the high
multicollinearity in the translog stochastic production
function as was reflected in correlation matrix between
the various explanatory variables in the model. There
were many explanatory variables in the translog model
which had highly correlated coefficients, with some
variables having perfect collinearity (such as the
relationship between variety and fertilizer*variety and
variety and organization*variety). Further, the sign of
the coefficients of some variables were not expected or
not consistent with economic theory. For example, the
coefficient of the labor variable in the translog was
negative and not statistically significant which was not
expected. Also, the coefficient of the time variable in the
translog model was significant at the 1 percent level, but
had a negative sign of coefficient (α = -2.716). Hence,
the Cobb-Douglas functional form was chosen for
analysis.
On the other hand, the maximum-likelihood
estimates (MLE), rather than the ordinary least squares
(OLS), also emerged as the more adequate estimation
procedure to describe the parameters in the model.
Table 2 below contains the Maximum-Likelihood
Estimates (MLE) of the stochastic Cobb-Douglas
production frontier production function and technical
inefficiency model for the 182 tea farmers in Phú Tho,
Vietnam.
The results show that most coefficients in the
frontier production model had positive signs, except the
variables fertilizer and chemical. The coefficients of
labor, tea age, and variety were found to be statistically
significant with positive effects on output at a 1% level
of significance.
The coefficient of the variety dummy variable (i.e.,
1 = LDP, 0 = PH) had a positive sign and was
statistically significant at the 1% level. As expected, the
new hybrid tea variety (LDP) farms posted higher yields
than the old hybrid tea variety (PH). The tea farms
which planted the new hybrid tea were more efficient
than the tea farms which planted the old hybrid tea
variety.
Contrary to expectation, the coefficient of chemical
was not significant. This could be attributed to the high
pest infestation in the study areas. The study also found
that fertilizer had a negative coefficient but was not
statistically significant. This is probably because of the
improper combination of N, P, and K nutrients. Another
possible reason is that the fertilizer in the plant was
washed away by surface water due to rains.
Table 2. Maximum-Likelihood Estimates (MLE) of the Stochastic Cobb-Douglas Production Frontier Production Function and Technical Inefficiency Model, 182 Tea Farmers, Phú Tho , Vietnam.
Variable Parameter Estimatesa Standard Error Frontier Production Function Constant β0 8.503*** 0.306 Ln (No. of Harvest) β 1 0.053ns 0.054 Ln (Fertilizer) β 2 -0.025ns 0.025 Ln (Chemical) β 3 -0.007ns 0.025
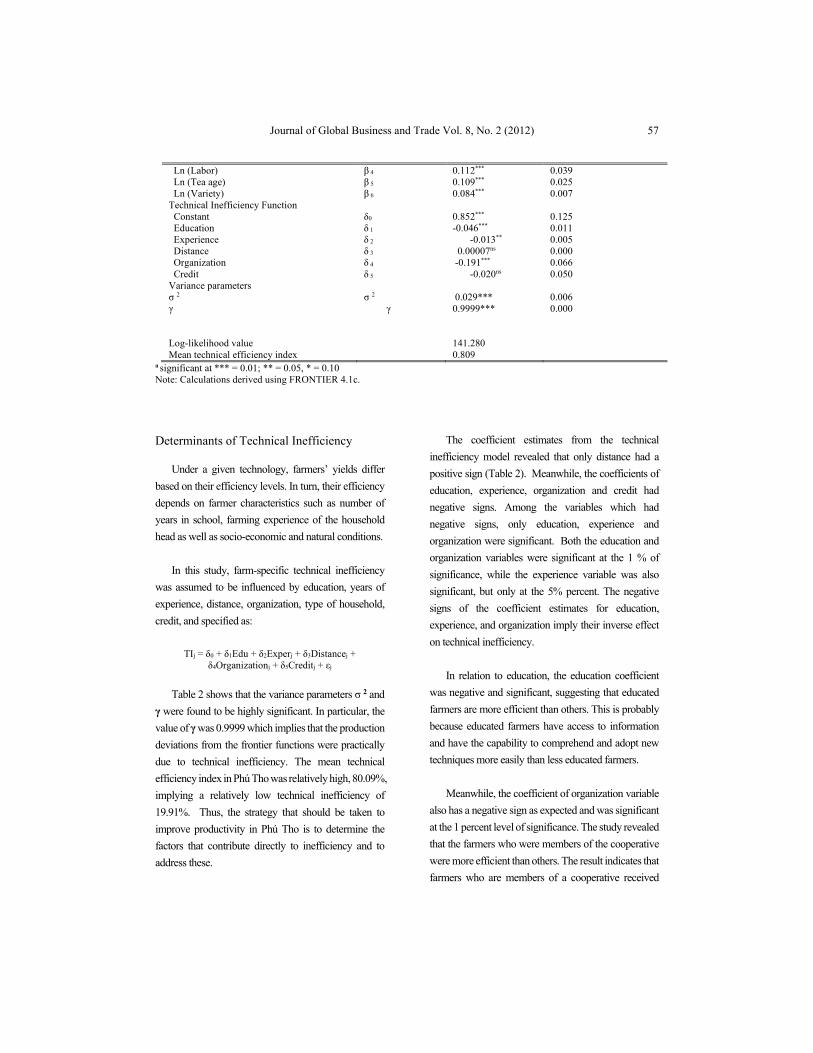
Journal of Global Business and Trade Vol. 8, No. 2 (2012)
57
Ln (Labor) β 4 0.112*** 0.039 Ln (Tea age) β 5 0.109*** 0.025 Ln (Variety) β 6 0.084*** 0.007 Technical Inefficiency Function Constant δ0 0.852*** 0.125 Education δ 1 -0.046*** 0.011 Experience δ 2 -0.013** 0.005 Distance δ 3 0.00007ns 0.000 Organization δ 4 -0.191*** 0.066 Credit δ 5 -0.020ns 0.050 Variance parameters σ 2 σ 2 0.029*** 0.006 γ
γ
0.9999*** 0.000
Log-likelihood value 141.280 Mean technical efficiency index 0.809
a significant at *** = 0.01; ** = 0.05, * = 0.10 Note: Calculations derived using FRONTIER 4.1c.
Determinants of Technical Inefficiency
Under a given technology, farmers’ yields differ
based on their efficiency levels. In turn, their efficiency
depends on farmer characteristics such as number of
years in school, farming experience of the household
head as well as socio-economic and natural conditions.
In this study, farm-specific technical inefficiency
was assumed to be influenced by education, years of
experience, distance, organization, type of household,
credit, and specified as:
TIj = δ0 + δ1Edu + δ2Experj + δ3Distancej + δ4Organizationj + δ5Creditj + εj
Table 2 shows that the variance parameters σ 2 and
γ were found to be highly significant. In particular, the
value of γ was 0.9999 which implies that the production
deviations from the frontier functions were practically
due to technical inefficiency. The mean technical
efficiency index in Phú Tho was relatively high, 80.09%,
implying a relatively low technical inefficiency of
19.91%. Thus, the strategy that should be taken to
improve productivity in Phú Tho is to determine the
factors that contribute directly to inefficiency and to
address these.
The coefficient estimates from the technical
inefficiency model revealed that only distance had a
positive sign (Table 2). Meanwhile, the coefficients of
education, experience, organization and credit had
negative signs. Among the variables which had
negative signs, only education, experience and
organization were significant. Both the education and
organization variables were significant at the 1 % of
significance, while the experience variable was also
significant, but only at the 5% percent. The negative
signs of the coefficient estimates for education,
experience, and organization imply their inverse effect
on technical inefficiency.
In relation to education, the education coefficient
was negative and significant, suggesting that educated
farmers are more efficient than others. This is probably
because educated farmers have access to information
and have the capability to comprehend and adopt new
techniques more easily than less educated farmers.
Meanwhile, the coefficient of organization variable
also has a negative sign as expected and was significant
at the 1 percent level of significance. The study revealed
that the farmers who were members of the cooperative
were more efficient than others. The result indicates that
farmers who are members of a cooperative received
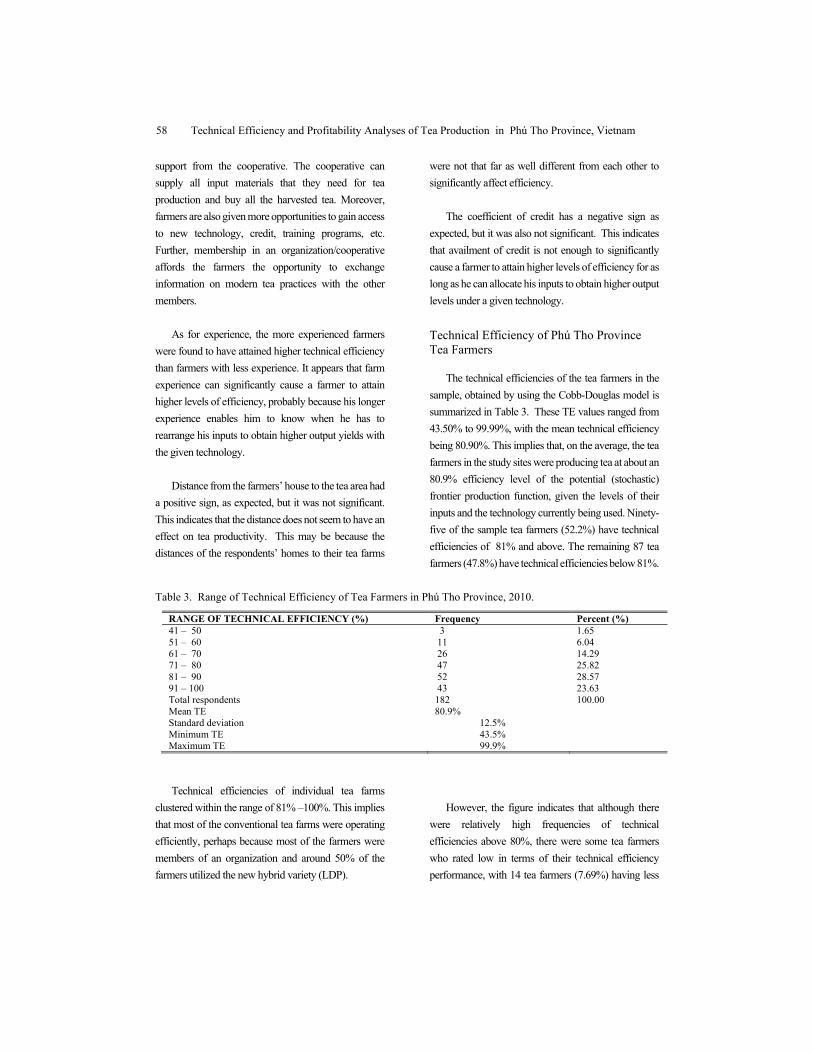
Technical Efficiency and Profitability Analyses of Tea Production in Phú Tho Province, Vietnam
58
support from the cooperative. The cooperative can
supply all input materials that they need for tea
production and buy all the harvested tea. Moreover,
farmers are also given more opportunities to gain access
to new technology, credit, training programs, etc.
Further, membership in an organization/cooperative
affords the farmers the opportunity to exchange
information on modern tea practices with the other
members.
As for experience, the more experienced farmers
were found to have attained higher technical efficiency
than farmers with less experience. It appears that farm
experience can significantly cause a farmer to attain
higher levels of efficiency, probably because his longer
experience enables him to know when he has to
rearrange his inputs to obtain higher output yields with
the given technology.
Distance from the farmers’ house to the tea area had
a positive sign, as expected, but it was not significant.
This indicates that the distance does not seem to have an
effect on tea productivity. This may be because the
distances of the respondents’ homes to their tea farms
were not that far as well different from each other to
significantly affect efficiency.
The coefficient of credit has a negative sign as
expected, but it was also not significant. This indicates
that availment of credit is not enough to significantly
cause a farmer to attain higher levels of efficiency for as
long as he can allocate his inputs to obtain higher output
levels under a given technology.
Technical Efficiency of Phú Tho Province Tea Farmers
The technical efficiencies of the tea farmers in the
sample, obtained by using the Cobb-Douglas model is
summarized in Table 3. These TE values ranged from
43.50% to 99.99%, with the mean technical efficiency
being 80.90%. This implies that, on the average, the tea
farmers in the study sites were producing tea at about an
80.9% efficiency level of the potential (stochastic)
frontier production function, given the levels of their
inputs and the technology currently being used. Ninety-
five of the sample tea farmers (52.2%) have technical
efficiencies of 81% and above. The remaining 87 tea
farmers (47.8%) have technical efficiencies below 81%.
Table 3. Range of Technical Efficiency of Tea Farmers in Phú Tho Province, 2010.
RANGE OF TECHNICAL EFFICIENCY (%) Frequency Percent (%) 41 – 50 3 1.65 51 – 60 11 6.04 61 – 70 26 14.29 71 – 80 47 25.82 81 – 90 52 28.57 91 – 100 43 23.63 Total respondents 182 100.00 Mean TE 80.9% Standard deviation 12.5% Minimum TE 43.5% Maximum TE 99.9%
Technical efficiencies of individual tea farms
clustered within the range of 81% –100%. This implies
that most of the conventional tea farms were operating
efficiently, perhaps because most of the farmers were
members of an organization and around 50% of the
farmers utilized the new hybrid variety (LDP).
However, the figure indicates that although there
were relatively high frequencies of technical
efficiencies above 80%, there were some tea farmers
who rated low in terms of their technical efficiency
performance, with 14 tea farmers (7.69%) having less
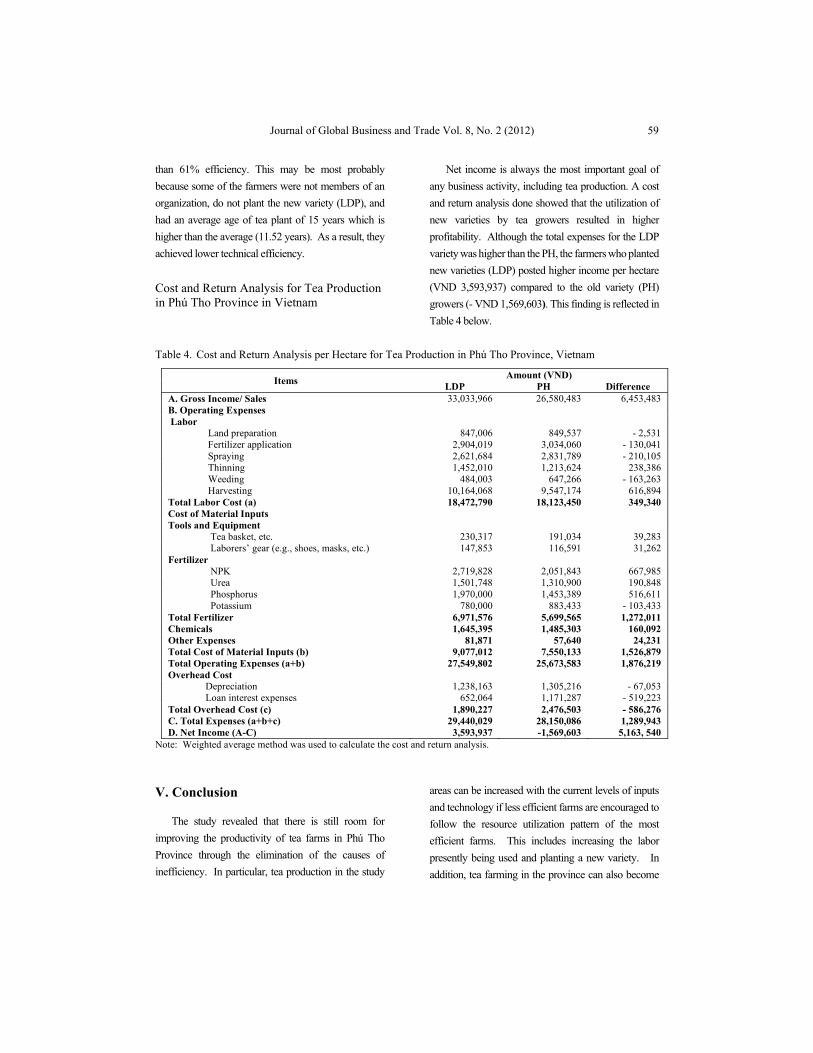
Journal of Global Business and Trade Vol. 8, No. 2 (2012)
59
than 61% efficiency. This may be most probably
because some of the farmers were not members of an
organization, do not plant the new variety (LDP), and
had an average age of tea plant of 15 years which is
higher than the average (11.52 years). As a result, they
achieved lower technical efficiency.
Cost and Return Analysis for Tea Production in Phú Tho Province in Vietnam
Net income is always the most important goal of
any business activity, including tea production. A cost
and return analysis done showed that the utilization of
new varieties by tea growers resulted in higher
profitability. Although the total expenses for the LDP
variety was higher than the PH, the farmers who planted
new varieties (LDP) posted higher income per hectare
(VND 3,593,937) compared to the old variety (PH)
growers (- VND 1,569,603). This finding is reflected in
Table 4 below.
Table 4. Cost and Return Analysis per Hectare for Tea Production in Phú Tho Province, Vietnam
Items Amount (VND)
LDP PH Difference A. Gross Income/ Sales 33,033,966 26,580,483 6,453,483 B. Operating Expenses Labor Land preparation 847,006 849,537 - 2,531 Fertilizer application 2,904,019 3,034,060 - 130,041 Spraying 2,621,684 2,831,789 - 210,105 Thinning 1,452,010 1,213,624 238,386 Weeding 484,003 647,266 - 163,263 Harvesting 10,164,068 9,547,174 616,894 Total Labor Cost (a) 18,472,790 18,123,450 349,340 Cost of Material Inputs Tools and Equipment Tea basket, etc. 230,317 191,034 39,283 Laborers’ gear (e.g., shoes, masks, etc.) 147,853 116,591 31,262 Fertilizer NPK 2,719,828 2,051,843 667,985 Urea 1,501,748 1,310,900 190,848 Phosphorus 1,970,000 1,453,389 516,611 Potassium 780,000 883,433 - 103,433 Total Fertilizer 6,971,576 5,699,565 1,272,011 Chemicals 1,645,395 1,485,303 160,092 Other Expenses 81,871 57,640 24,231 Total Cost of Material Inputs (b) 9,077,012 7,550,133 1,526,879 Total Operating Expenses (a+b) 27,549,802 25,673,583 1,876,219 Overhead Cost Depreciation 1,238,163 1,305,216 - 67,053 Loan interest expenses 652,064 1,171,287 - 519,223 Total Overhead Cost (c) 1,890,227 2,476,503 - 586,276 C. Total Expenses (a+b+c) 29,440,029 28,150,086 1,289,943 D. Net Income (A-C) 3,593,937 -1,569,603 5,163, 540
Note: Weighted average method was used to calculate the cost and return analysis.
V. Conclusion
The study revealed that there is still room for
improving the productivity of tea farms in Phú Tho
Province through the elimination of the causes of
inefficiency. In particular, tea production in the study
areas can be increased with the current levels of inputs
and technology if less efficient farms are encouraged to
follow the resource utilization pattern of the most
efficient farms. This includes increasing the labor
presently being used and planting a new variety. In
addition, tea farming in the province can also become
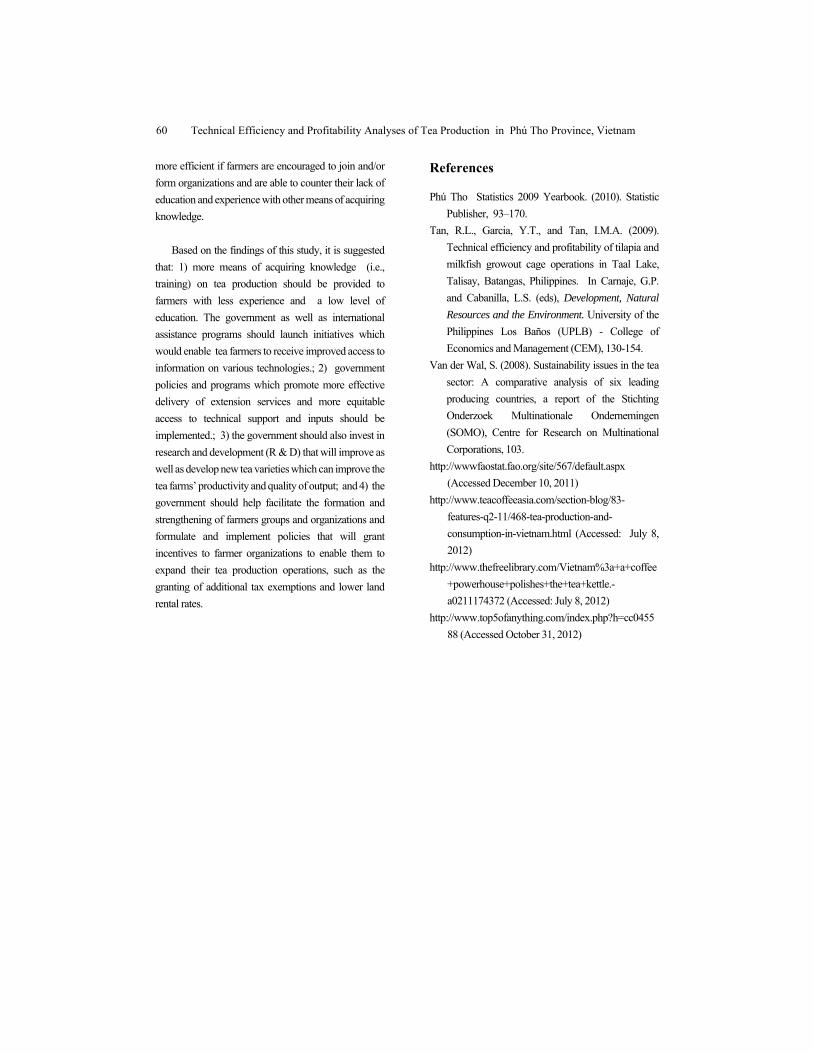
Technical Efficiency and Profitability Analyses of Tea Production in Phú Tho Province, Vietnam
60
more efficient if farmers are encouraged to join and/or
form organizations and are able to counter their lack of
education and experience with other means of acquiring
knowledge.
Based on the findings of this study, it is suggested
that: 1) more means of acquiring knowledge (i.e.,
training) on tea production should be provided to
farmers with less experience and a low level of
education. The government as well as international
assistance programs should launch initiatives which
would enable tea farmers to receive improved access to
information on various technologies.; 2) government
policies and programs which promote more effective
delivery of extension services and more equitable
access to technical support and inputs should be
implemented.; 3) the government should also invest in
research and development (R & D) that will improve as
well as develop new tea varieties which can improve the
tea farms’ productivity and quality of output; and 4) the
government should help facilitate the formation and
strengthening of farmers groups and organizations and
formulate and implement policies that will grant
incentives to farmer organizations to enable them to
expand their tea production operations, such as the
granting of additional tax exemptions and lower land
rental rates.
References
Phú Tho Statistics 2009 Yearbook. (2010). Statistic
Publisher, 93–170.
Tan, R.L., Garcia, Y.T., and Tan, I.M.A. (2009).
Technical efficiency and profitability of tilapia and
milkfish growout cage operations in Taal Lake,
Talisay, Batangas, Philippines. In Carnaje, G.P.
and Cabanilla, L.S. (eds), Development, Natural
Resources and the Environment. University of the
Philippines Los Baños (UPLB) - College of
Economics and Management (CEM), 130-154.
Van der Wal, S. (2008). Sustainability issues in the tea
sector: A comparative analysis of six leading
producing countries, a report of the Stichting
Onderzoek Multinationale Ondernemingen
(SOMO), Centre for Research on Multinational
Corporations, 103.
http://wwwfaostat.fao.org/site/567/default.aspx
(Accessed December 10, 2011)
http://www.teacoffeeasia.com/section-blog/83-
features-q2-11/468-tea-production-and-
consumption-in-vietnam.html (Accessed: July 8,
2012)
http://www.thefreelibrary.com/Vietnam%3a+a+coffee
+powerhouse+polishes+the+tea+kettle.-
a0211174372 (Accessed: July 8, 2012)
http://www.top5ofanything.com/index.php?h=cc0455
88 (Accessed October 31, 2012)
Journal of Global Business and Trade Vol. 8, No. 2 (2012)
61
Journal of Global Business and Trade
A Strategy for Technical Innovation in Large-Scale Enterprises Meng Wang Asia International Business Strategy, Asia University
ARTICLE INFO
ABSTRACT
Keywords: strategy, innovation ,sustaining, disruptive, dual innovation
This paper analyzed related articles to find effective an strategy to promote technical innovation in large-scale enterprises. Technical innovation is the key means to make all enterprises be able to grow. In other words, enterprises must devote themselves to technical innovation for sustainable development. Although most enterprises, large-scale enterprises in particular, realize how important technical innovation is, a large organization, which large-scale enterprises have, is suitable for sustaining innovation, while it is also a large impediment for disruptive innovation. (Christensen,2001:p.11)In this paper, we made an analysis of research related to the problems impeding disruptive technical innovations in large-scale enterprises and tried to propose an efficient strategy to stimulate disruptive technical innovation in large-scale enterprises.
I. Classification of Technical Innovation
Technical innovation can be classified into
sustaining technical innovation and disruptive technical
innovation. (Christensen, 2001:p.9)
Sustaining technical innovation is to enhance
quality by improving current products and services
aimed at existing market and high-end demand.
Compared with sustaining technical innovation,
disruptive technical innovation is to accept changes by
starting from scratch by breaking an existing concept
and aiming at a new market with low-end demand and
new customers without original intention to purchase.
(Christensen, Raynor 2003: p.55)
In order to keep and enlarge existing customers,
large-scale enterprises use abundant business resources
and the ability of higher technical development to
pursue existing interests in the current market. At the
same time, this makes large-scale enterprises less
sensitive to disruptive technical innovations and harder
to implement innovations than small and medium scale
businesses. Too much attention on sustaining
innovation in large-scale enterprises slows down the rise
of disruptive innovation from themselves and causes the
following problems.
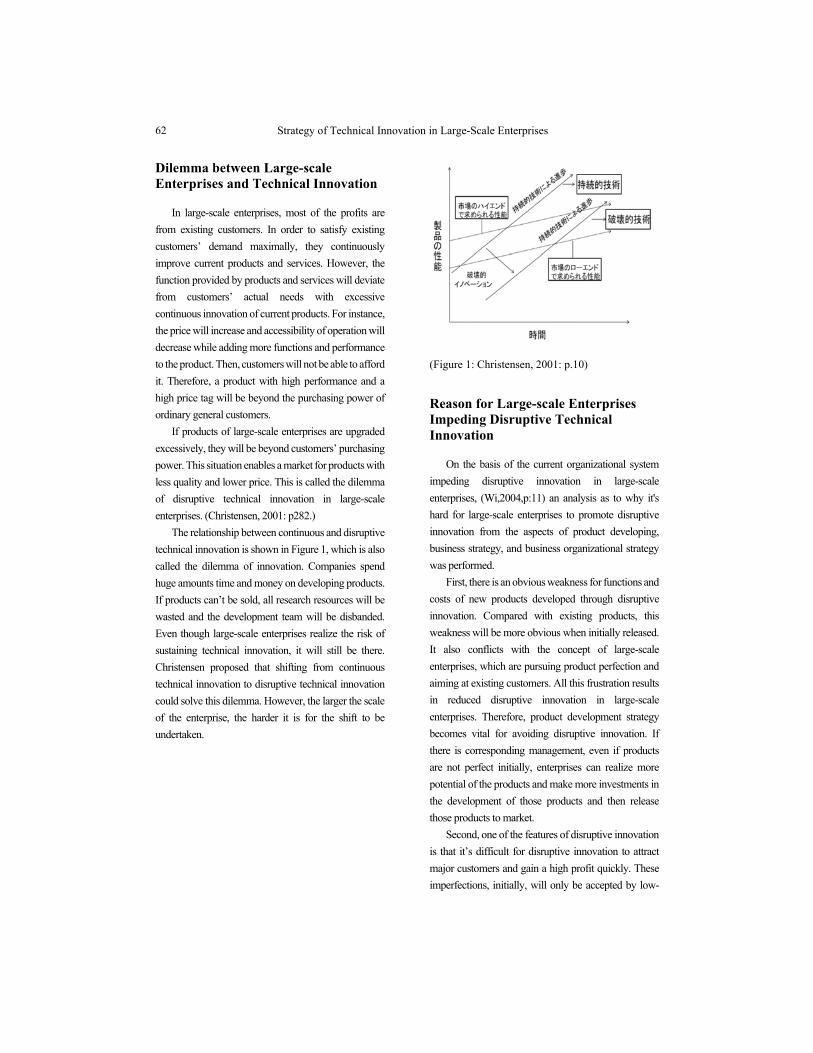
Strategy of Technical Innovation in Large-Scale Enterprises
62
Dilemma between Large-scale Enterprises and Technical Innovation
In large-scale enterprises, most of the profits are
from existing customers. In order to satisfy existing
customers’ demand maximally, they continuously
improve current products and services. However, the
function provided by products and services will deviate
from customers’ actual needs with excessive
continuous innovation of current products. For instance,
the price will increase and accessibility of operation will
decrease while adding more functions and performance
to the product. Then, customers will not be able to afford
it. Therefore, a product with high performance and a
high price tag will be beyond the purchasing power of
ordinary general customers.
If products of large-scale enterprises are upgraded
excessively, they will be beyond customers’ purchasing
power. This situation enables a market for products with
less quality and lower price. This is called the dilemma
of disruptive technical innovation in large-scale
enterprises. (Christensen, 2001: p282.)
The relationship between continuous and disruptive
technical innovation is shown in Figure 1, which is also
called the dilemma of innovation. Companies spend
huge amounts time and money on developing products.
If products can’t be sold, all research resources will be
wasted and the development team will be disbanded.
Even though large-scale enterprises realize the risk of
sustaining technical innovation, it will still be there.
Christensen proposed that shifting from continuous
technical innovation to disruptive technical innovation
could solve this dilemma. However, the larger the scale
of the enterprise, the harder it is for the shift to be
undertaken.
(Figure 1: Christensen, 2001: p.10)
Reason for Large-scale Enterprises Impeding Disruptive Technical Innovation
On the basis of the current organizational system
impeding disruptive innovation in large-scale
enterprises, (Wi,2004,p:11) an analysis as to why it's
hard for large-scale enterprises to promote disruptive
innovation from the aspects of product developing,
business strategy, and business organizational strategy
was performed.
First, there is an obvious weakness for functions and
costs of new products developed through disruptive
innovation. Compared with existing products, this
weakness will be more obvious when initially released.
It also conflicts with the concept of large-scale
enterprises, which are pursuing product perfection and
aiming at existing customers. All this frustration results
in reduced disruptive innovation in large-scale
enterprises. Therefore, product development strategy
becomes vital for avoiding disruptive innovation. If
there is corresponding management, even if products
are not perfect initially, enterprises can realize more
potential of the products and make more investments in
the development of those products and then release
those products to market.
Second, one of the features of disruptive innovation
is that it’s difficult for disruptive innovation to attract
major customers and gain a high profit quickly. These
imperfections, initially, will only be accepted by low-
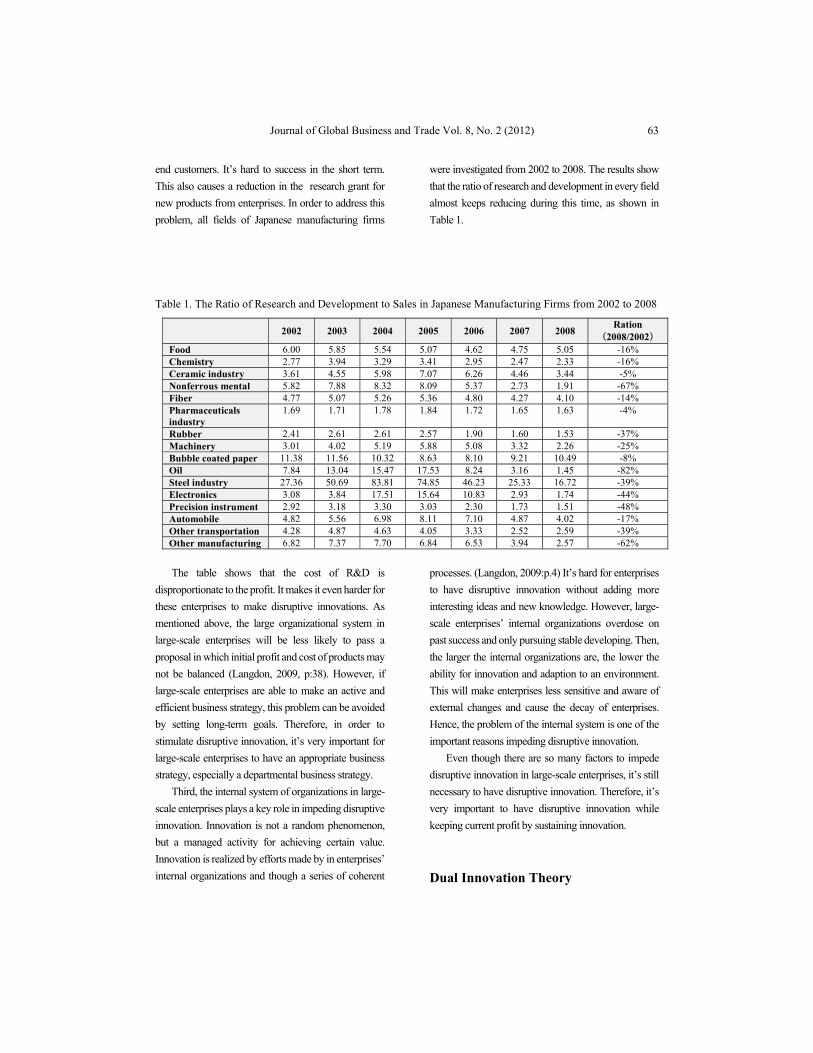
Journal of Global Business and Trade Vol. 8, No. 2 (2012)
63
end customers. It’s hard to success in the short term.
This also causes a reduction in the research grant for
new products from enterprises. In order to address this
problem, all fields of Japanese manufacturing firms
were investigated from 2002 to 2008. The results show
that the ratio of research and development in every field
almost keeps reducing during this time, as shown in
Table 1.
Table 1. The Ratio of Research and Development to Sales in Japanese Manufacturing Firms from 2002 to 2008
2002 2003 2004 2005 2006 2007 2008 Ration
(2008/2002) Food 6.00 5.85 5.54 5.07 4.62 4.75 5.05 -16% Chemistry 2.77 3.94 3.29 3.41 2.95 2.47 2.33 -16% Ceramic industry 3.61 4.55 5.98 7.07 6.26 4.46 3.44 -5% Nonferrous mental 5.82 7.88 8.32 8.09 5.37 2.73 1.91 -67% Fiber 4.77 5.07 5.26 5.36 4.80 4.27 4.10 -14% Pharmaceuticals industry
1.69 1.71 1.78 1.84 1.72 1.65 1.63 -4%
Rubber 2.41 2.61 2.61 2.57 1.90 1.60 1.53 -37% Machinery 3.01 4.02 5.19 5.88 5.08 3.32 2.26 -25% Bubble coated paper 11.38 11.56 10.32 8.63 8.10 9.21 10.49 -8% Oil 7.84 13.04 15.47 17.53 8.24 3.16 1.45 -82% Steel industry 27.36 50.69 83.81 74.85 46.23 25.33 16.72 -39% Electronics 3.08 3.84 17.51 15.64 10.83 2.93 1.74 -44% Precision instrument 2.92 3.18 3.30 3.03 2.30 1.73 1.51 -48% Automobile 4.82 5.56 6.98 8.11 7.10 4.87 4.02 -17% Other transportation 4.28 4.87 4.63 4.05 3.33 2.52 2.59 -39% Other manufacturing 6.82 7.37 7.70 6.84 6.53 3.94 2.57 -62%
The table shows that the cost of R&D is
disproportionate to the profit. It makes it even harder for
these enterprises to make disruptive innovations. As
mentioned above, the large organizational system in
large-scale enterprises will be less likely to pass a
proposal in which initial profit and cost of products may
not be balanced (Langdon, 2009, p:38). However, if
large-scale enterprises are able to make an active and
efficient business strategy, this problem can be avoided
by setting long-term goals. Therefore, in order to
stimulate disruptive innovation, it’s very important for
large-scale enterprises to have an appropriate business
strategy, especially a departmental business strategy.
Third, the internal system of organizations in large-
scale enterprises plays a key role in impeding disruptive
innovation. Innovation is not a random phenomenon,
but a managed activity for achieving certain value.
Innovation is realized by efforts made by in enterprises’
internal organizations and though a series of coherent
processes. (Langdon, 2009:p.4) It’s hard for enterprises
to have disruptive innovation without adding more
interesting ideas and new knowledge. However, large-
scale enterprises’ internal organizations overdose on
past success and only pursuing stable developing. Then,
the larger the internal organizations are, the lower the
ability for innovation and adaption to an environment.
This will make enterprises less sensitive and aware of
external changes and cause the decay of enterprises.
Hence, the problem of the internal system is one of the
important reasons impeding disruptive innovation.
Even though there are so many factors to impede
disruptive innovation in large-scale enterprises, it’s still
necessary to have disruptive innovation. Therefore, it’s
very important to have disruptive innovation while
keeping current profit by sustaining innovation.
Dual Innovation Theory
Strategy of Technical Innovation in Large-Scale Enterprises
64
Suzuki (2007) proposed Dual Innovation Theory
which suggested implementing sustained innovation
and disruptive innovation simultaneously. He analyzed
existing research papers related to “Dual Innovation
Theory”. According to his critical analysis, we can
know that existing research is lacking specificity on
managerial behavior for dual innovation. Suzuki (2007)
examined Smith, Paap & Katzh, and March. Smith
proposed a theory of implementing sustained
innovation and disruptive innovation simultaneously,
but at the same time he did not point out how to manage
these two concepts in conflict. After analyzing many
corporate cases, Paap and Katzh pointed out the
necessity for large-scale enterprises to insist on dual
innovation; however, there were still no details about
operations in practice. Although March described a
flexible usage of current techniques and the
development of new techniques and their necessity, he
didn’t give any details about management. On the basis
of this research, Suzuki (2007) summarized the details
of a management system for dual innovation which can
be divided into three phases. Phase One is the idea phase.
In this phase, there should be the building of an
exchange site for convenient communication among
departments in the firm. Phase Two is the research and
development phase in which the CTO (Chief
Technology Officer) will play a very important role.
The last phase is the production phase in which it should
be considered whether the organization systems are
suitable for the external environment. Suzuki (2007)
indicated that disruptive innovation can be implemented
simultaneously while sustaining innovation if there is
such a three phase management system.
Summary
This paper analyzed research papers related to the
classification of innovation and the relationship
between large-scale enterprises and disruptive
innovation. Suzuki (2007) pointed out that disruptive
innovation and sustaining innovation could be
implemented simultaneously. Schumpeter (1943, p.192)
pointed out several problems about large-scale
enterprises in creating innovation: 1) because large-
scale enterprises emphasize the impact of the founders,
large-scale enterprises will be harder on innovation than
the other business, and 2) large-scale enterprises are
more likely to lead development of innovation and these
two conflict concepts. Due to large organizational
systems, large-scale enterprises lack sensitivity to
innovation. The concept of innovation in Schumpeter
(1943) has the same meaning as disruptive innovation
mentioned above. We can conclude that it’s hard for
large-scale enterprises to create disruptive innovation.
At the same time, large-scale enterprises are more
likely to promote innovation because of the abundant
resources that large-scale enterprises have. This kind of
concept of innovation can be considered sustained
innovation. This is to say that Schumpeter believes that
large-scale enterprises are suitable for sustaining
innovation, but impeding disruptive innovation.
This shows that Schumpeter pointed out the
necessity of dual innovation and difficulties of actual
practice at the beginning of innovation concepts
beggining in Economics almost a century ago. However,
the essence of a series of recent research into innovation
is about discover the answer to this old question.
English Reference
Christensen, C. M., (1997)The Innovator’s Dilemma,
Harvard Business Review Press.
Christensen, C. M., and Raynor, M.E (2003)The
Innovator’s Solution, Harvard Business Review
Press
Langdon Morris.,(2006)Permanent Innovation, Lulu
Enterprises, Inc
Schumperter, Joseph. A(1943)Capitalism, Socialism
and Democracy, Routledge
Japanese Reference
鈴木康之・亀岡秋男・井川康夫(2005)「破壊的
イノベーション活性化による新規ビジネス

Journal of Global Business and Trade Vol. 8, No. 2 (2012)
65
創造のためのマネジメント研究」,
研究技術計画,Vol.22,No.2
鈴木康之(2005)「イノベーション・マネジメン
ト・システムにおける CTO の資質・能力」
,研究技術計画,Vol.21,No.2
鈴木康之(2007)「企業における新規創発および
既存活用のイノベーションを並行して実現
するデュアル・イノベーション・マネジメ
ント・システム」,研究技術計画,Vol.22,No.3/4
魏晶玄(2004)『イノベーションの組織戦略―知
識マネジメントの組織設計』, 信山社.
今口忠政(2007)「組織の衰退とイノベーション
――ライフサイクルの視点から」,
三田商学研究, vol.50(3), pp.45-55.
丹羽清(2010)『イノベーション実践論』,
東京大学出版会.
野中郁次郎(2002)『イノベーションとベンチャ
ー企業』, 八千代出版社.
榊原清則・大滝精一・沼上幹(1989)『事業創造
のダイナミクス』, 白桃書房.
澤嶋祐希(2008)「特許戦略と経営効率」
十川廣國, 青木幹喜, 神戸和雄, 遠藤健哉,
馬塲杉夫, 清水馨, 今野喜文, 山崎秀雄,
山田敏之, 坂本義和, 周 [ゲン]宗, 横尾陽道,
小沢一郎, 角田光弘, 永野寛子(2009)
「マネジメント・イノベーションと組織能
力の向上
―新たな競争優位構築をめざして」,
成城大学社会イノベーション研究, vol.4(2),
pp.1-25.

Journal of Global Business and Trade Vol. 8, No. 2 (2012)
67
Journal of Global Business and Trade
Opportunities and Challenges in The Emerging Global Herbal Medicine Industry Nimfa D. Montes and Normito R. Zapata Jr. Department of Agribusiness Management College of Economics and Management University of the Philippines at Los Baños
ARTICLE INFO
ABSTRACT
Keywords: Herbal medicine industry, strategic alliance, SWOT analysis, profitability assessment, strategic management and technopreneurship.
Herbal medicine plays a major role in the health and wellbeing of consumers. Global Industry Analysts, Inc. (GIA) reported that the herbal supplements and remedies market will reach an estimated US $107 billion in 2017. Rapid market growth is caused by an aging population and consumers’ inclinations toward a healthier lifestyle. Some intrinsic benefits from using natural herbs and botanical derivatives such as efficacy, little or no side effects and economy are realized. However, evidence of product safety founded on scientific research and clinical trials will remain a crucial factor to ensure long-run industry success. With the growing interest in herbal medicine, a country’s entrepreneurs manufacture herbal products to obtain a fair market share through licensing. Consequently, they must address the limited supply of quality raw materials at competitive costs. Hence, this paper determines the vision and mission of the industry and enterprises; identifies key opportunities and threats as well as key strengths and weaknesses; and formulates effective strategies through SWOT analysis. Concrete measures must be undertaken: a) pursue an effective strategic alliance between pharmaceutical companies and farmers; b) determine quality standards for raw materials and finished products; c) utilize appropriate technologies; d) enhance the role of consolidators; and e) engage new product development.
I. Introduction
Herbal medicine plays a major role in consumer
health and wellbeing. Global Industry Analysts, Inc.
(GIA 2012) reported that the herbal supplements and
remedies market will reach an estimated US $107
billion by the year 2017, attributed to the rapid market
growth caused by the aging population and consumers’
inclination toward healthier lifestyles. Some intrinsic
benefits realized from natural herbs and botanical
derivatives are efficacy, little or no side effects and
economy. However, scientific research and clinical
trials as evidence of the safety of herbal products will
contribute immensely to the success of the industry.
Opportunities and Challenges in The Emerging Global Herbal Medicine Industry
68
With the growing interest in herbal medicine, local
companies have ventured into the manufacture of herbal
medicine and, consequently, must address the limited
supply of raw materials for herbal production. Guided
by the vision and mission of the industry, researchers
discussed various opportunities and challenges faced by
the Philippine herbal medicine industry as a whole;
identified key strengths and key weaknesses of the
enterprises; and determined strategic issues and
formulated effective strategies using a Strength-
Weakness-Opportunity-Threat (SWOT) analysis. The
research findings of this paper provide concrete guides
to decision-making by the investors and entrepreneurs.
II. Review of Literature
Opportunity analysis has provided a sound
framework for identifying, monitoring and evaluating
key economic, socio-cultural, demographic,
environmental, political, governmental, legal,
technological and competitive factors. The process
enables enterprises to anticipate emerging opportunities
and threats in times of increasing turbulence in
industries and markets (David 2003). Consequently,
they may pursue effective strategies to avail of
opportunities and to minimize threats and thus, ensure
its long-run success.
In industry and competitive analysis, key success
factors (KSFs) are considered prerequisites for industry
success. These are strategy elements, product attributes,
competitive capabilities and business outcomes that
indicate enterprises are generating profits or incurring
losses, leading to competitive success or failure
(Strickland 2003). Briefly, key variables may affect
favorably or adversely the overall competitive positions
of the enterprises within any particular industry. Usually,
these are determined by the economic and technological
characteristics of the industry and by the competitive
moves undertaken by the competitors or rivals
(Wheelen and Hunger 2004).
China, which is the world’s major exporter of
mainly Chinese natural herbal medicine at a lower price,
consumed quantities equivalent to the annual export
volume of almost 20 % of its total production (Beijing
Zeefer Consulting Ltd. 2008). Known for its traditional
Chinese medicine, China had about 50% of people
adopting traditional Chinese medicine to treat ailments
(Figure 1).
In India, there have been efforts to develop public
and private sector research and a development
capability intended to boost quality of plant derived
medicines (Wakdikar 2004). The country heavily
invested in agricultural studies on medicinal plants with
a higher priority for commercial cultivation.
Simultaneously, it carried out research in support of
industrial development, covering crucial activities from
the development of superior propagation materials,
agro-technology, low cost and efficient processing
technologies to improve quality and yield, new
formulations for new products and the marketing of the
finished products. In most recent years, India
aggressively pursued capability building for R & D of
medicinal formulations involving plants and its
compounds both in the private/industry sector as well
government funded research (Figure 1).
III. Methodology and Data
Using a strategic management process, this paper
identified and analyzed the different components
necessary to help formulate effective strategies for the
Philippine herbal medicine industry and enterprises,
from vision and mission, various key opportunities,
challenges and threats, key strengths and weaknesses to
the matching process using SWOT analysis (Figure 2).
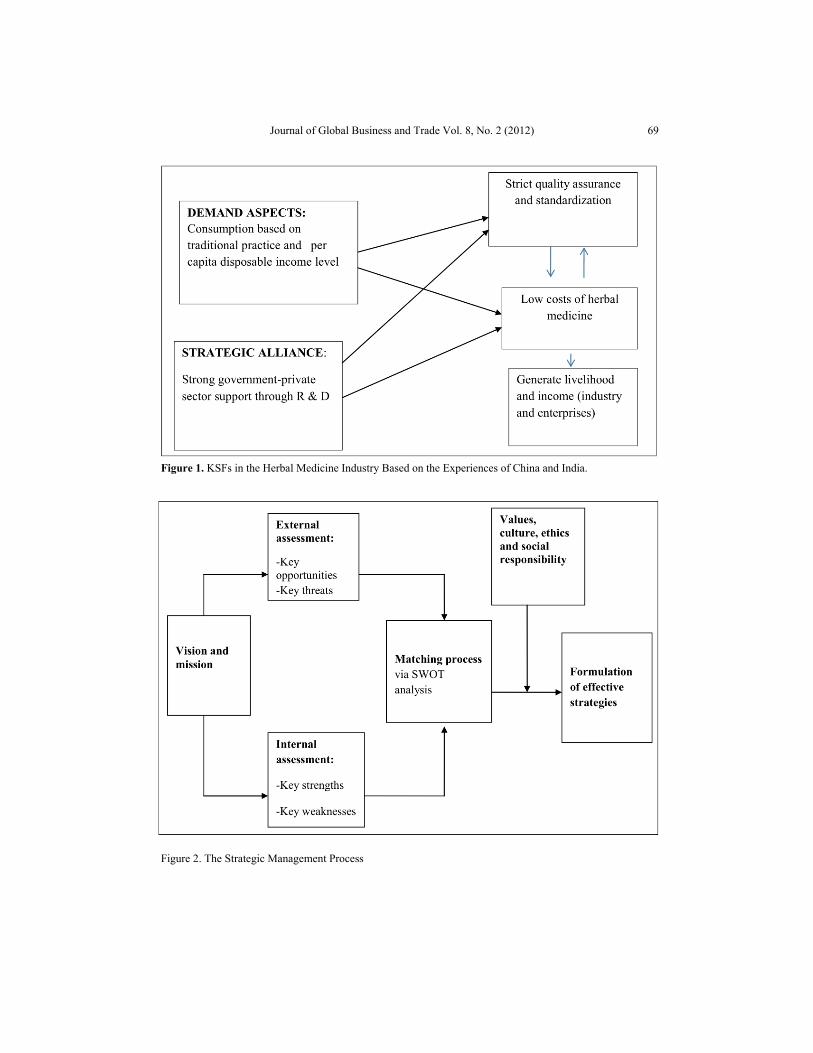
Journal of Global Business and Trade Vol. 8, No. 2 (2012)
69
Figure 1. KSFs in the Herbal Medicine Industry Based on the Experiences of China and India.
Figure 2. The Strategic Management Process
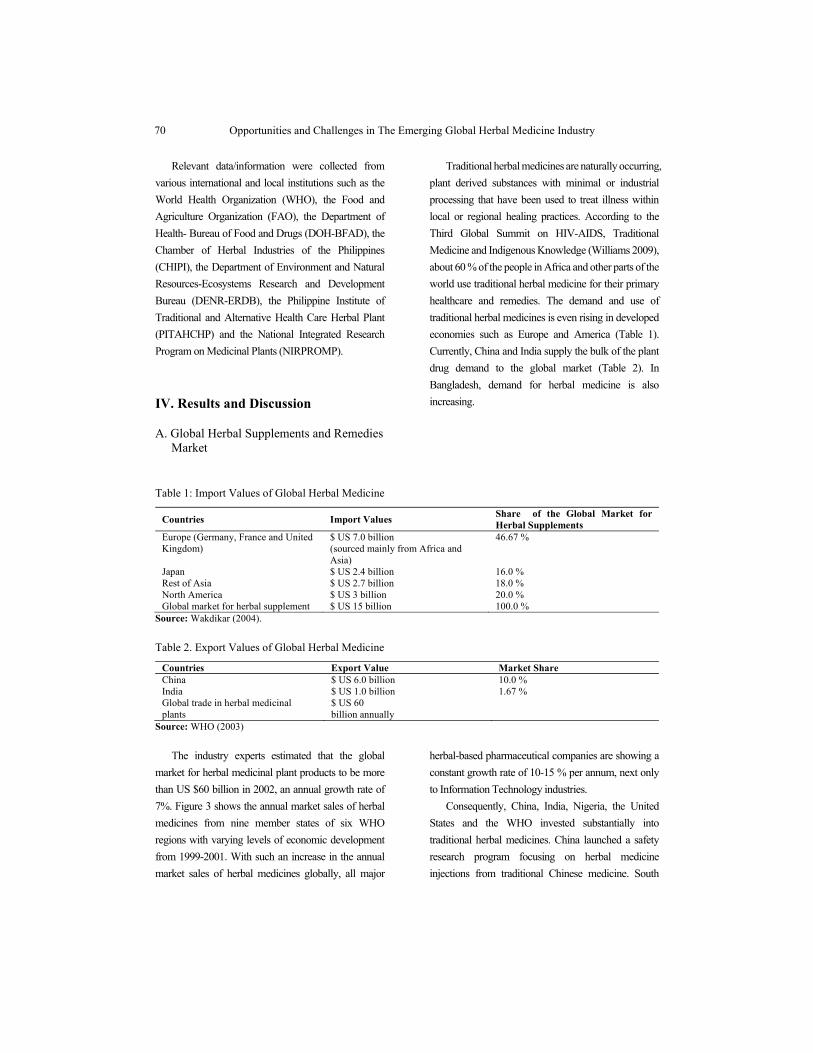
Opportunities and Challenges in The Emerging Global Herbal Medicine Industry
70
Relevant data/information were collected from
various international and local institutions such as the
World Health Organization (WHO), the Food and
Agriculture Organization (FAO), the Department of
Health- Bureau of Food and Drugs (DOH-BFAD), the
Chamber of Herbal Industries of the Philippines
(CHIPI), the Department of Environment and Natural
Resources-Ecosystems Research and Development
Bureau (DENR-ERDB), the Philippine Institute of
Traditional and Alternative Health Care Herbal Plant
(PITAHCHP) and the National Integrated Research
Program on Medicinal Plants (NIRPROMP).
IV. Results and Discussion
A. Global Herbal Supplements and Remedies Market
Traditional herbal medicines are naturally occurring,
plant derived substances with minimal or industrial
processing that have been used to treat illness within
local or regional healing practices. According to the
Third Global Summit on HIV-AIDS, Traditional
Medicine and Indigenous Knowledge (Williams 2009),
about 60 % of the people in Africa and other parts of the
world use traditional herbal medicine for their primary
healthcare and remedies. The demand and use of
traditional herbal medicines is even rising in developed
economies such as Europe and America (Table 1).
Currently, China and India supply the bulk of the plant
drug demand to the global market (Table 2). In
Bangladesh, demand for herbal medicine is also
increasing.
Table 1: Import Values of Global Herbal Medicine
Countries Import Values Share of the Global Market for Herbal Supplements
Europe (Germany, France and United Kingdom)
$ US 7.0 billion (sourced mainly from Africa and Asia)
46.67 %
Japan $ US 2.4 billion 16.0 % Rest of Asia $ US 2.7 billion 18.0 % North America $ US 3 billion 20.0 % Global market for herbal supplement $ US 15 billion 100.0 %
Source: Wakdikar (2004).
Table 2. Export Values of Global Herbal Medicine
Countries Export Value Market Share China $ US 6.0 billion 10.0 % India $ US 1.0 billion 1.67 % Global trade in herbal medicinal plants
$ US 60 billion annually
Source: WHO (2003)
The industry experts estimated that the global
market for herbal medicinal plant products to be more
than US $60 billion in 2002, an annual growth rate of
7%. Figure 3 shows the annual market sales of herbal
medicines from nine member states of six WHO
regions with varying levels of economic development
from 1999-2001. With such an increase in the annual
market sales of herbal medicines globally, all major
herbal-based pharmaceutical companies are showing a
constant growth rate of 10-15 % per annum, next only
to Information Technology industries.
Consequently, China, India, Nigeria, the United
States and the WHO invested substantially into
traditional herbal medicines. China launched a safety
research program focusing on herbal medicine
injections from traditional Chinese medicine. South
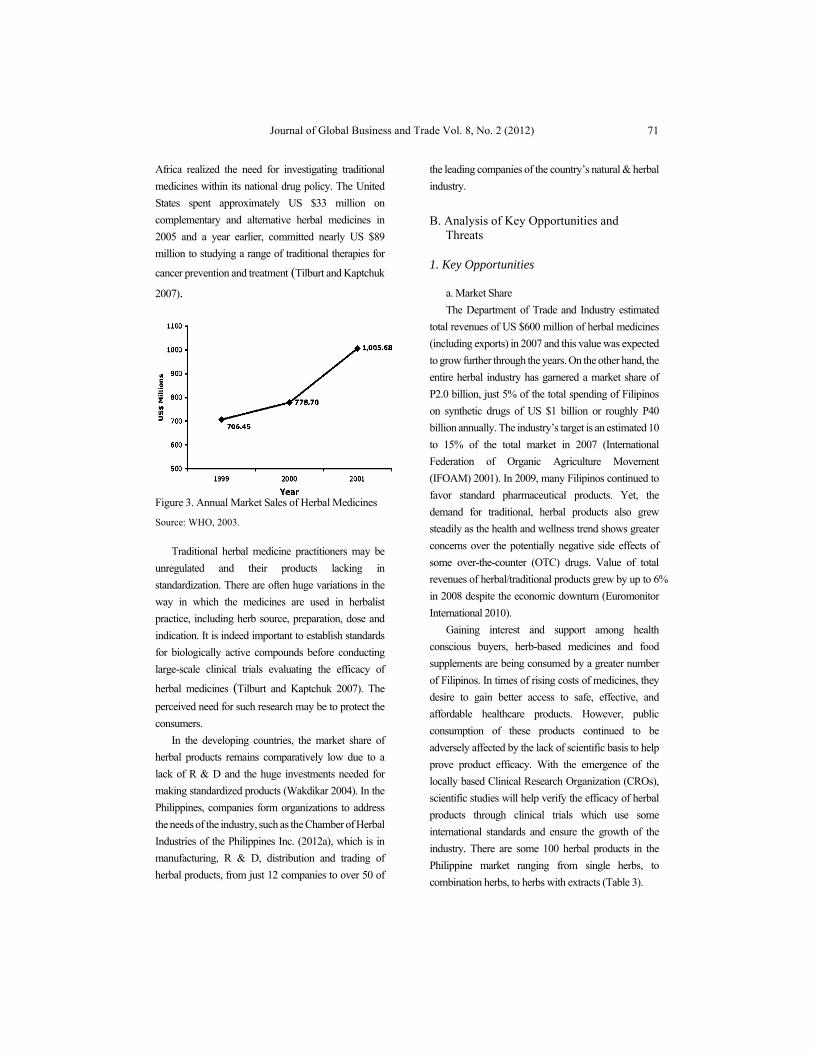
Journal of Global Business and Trade Vol. 8, No. 2 (2012)
71
Africa realized the need for investigating traditional
medicines within its national drug policy. The United
States spent approximately US $33 million on
complementary and alternative herbal medicines in
2005 and a year earlier, committed nearly US $89
million to studying a range of traditional therapies for
cancer prevention and treatment (Tilburt and Kaptchuk
2007).
Figure 3. Annual Market Sales of Herbal Medicines
Source: WHO, 2003.
Traditional herbal medicine practitioners may be
unregulated and their products lacking in
standardization. There are often huge variations in the
way in which the medicines are used in herbalist
practice, including herb source, preparation, dose and
indication. It is indeed important to establish standards
for biologically active compounds before conducting
large-scale clinical trials evaluating the efficacy of
herbal medicines (Tilburt and Kaptchuk 2007). The
perceived need for such research may be to protect the
consumers.
In the developing countries, the market share of
herbal products remains comparatively low due to a
lack of R & D and the huge investments needed for
making standardized products (Wakdikar 2004). In the
Philippines, companies form organizations to address
the needs of the industry, such as the Chamber of Herbal
Industries of the Philippines Inc. (2012a), which is in
manufacturing, R & D, distribution and trading of
herbal products, from just 12 companies to over 50 of
the leading companies of the country’s natural & herbal
industry.
B. Analysis of Key Opportunities and Threats
1. Key Opportunities
a. Market Share
The Department of Trade and Industry estimated
total revenues of US $600 million of herbal medicines
(including exports) in 2007 and this value was expected
to grow further through the years. On the other hand, the
entire herbal industry has garnered a market share of
P2.0 billion, just 5% of the total spending of Filipinos
on synthetic drugs of US $1 billion or roughly P40
billion annually. The industry’s target is an estimated 10
to 15% of the total market in 2007 (International
Federation of Organic Agriculture Movement
(IFOAM) 2001). In 2009, many Filipinos continued to
favor standard pharmaceutical products. Yet, the
demand for traditional, herbal products also grew
steadily as the health and wellness trend shows greater
concerns over the potentially negative side effects of
some over-the-counter (OTC) drugs. Value of total
revenues of herbal/traditional products grew by up to 6%
in 2008 despite the economic downturn (Euromonitor
International 2010).
Gaining interest and support among health
conscious buyers, herb-based medicines and food
supplements are being consumed by a greater number
of Filipinos. In times of rising costs of medicines, they
desire to gain better access to safe, effective, and
affordable healthcare products. However, public
consumption of these products continued to be
adversely affected by the lack of scientific basis to help
prove product efficacy. With the emergence of the
locally based Clinical Research Organization (CROs),
scientific studies will help verify the efficacy of herbal
products through clinical trials which use some
international standards and ensure the growth of the
industry. There are some 100 herbal products in the
Philippine market ranging from single herbs, to
combination herbs, to herbs with extracts (Table 3).
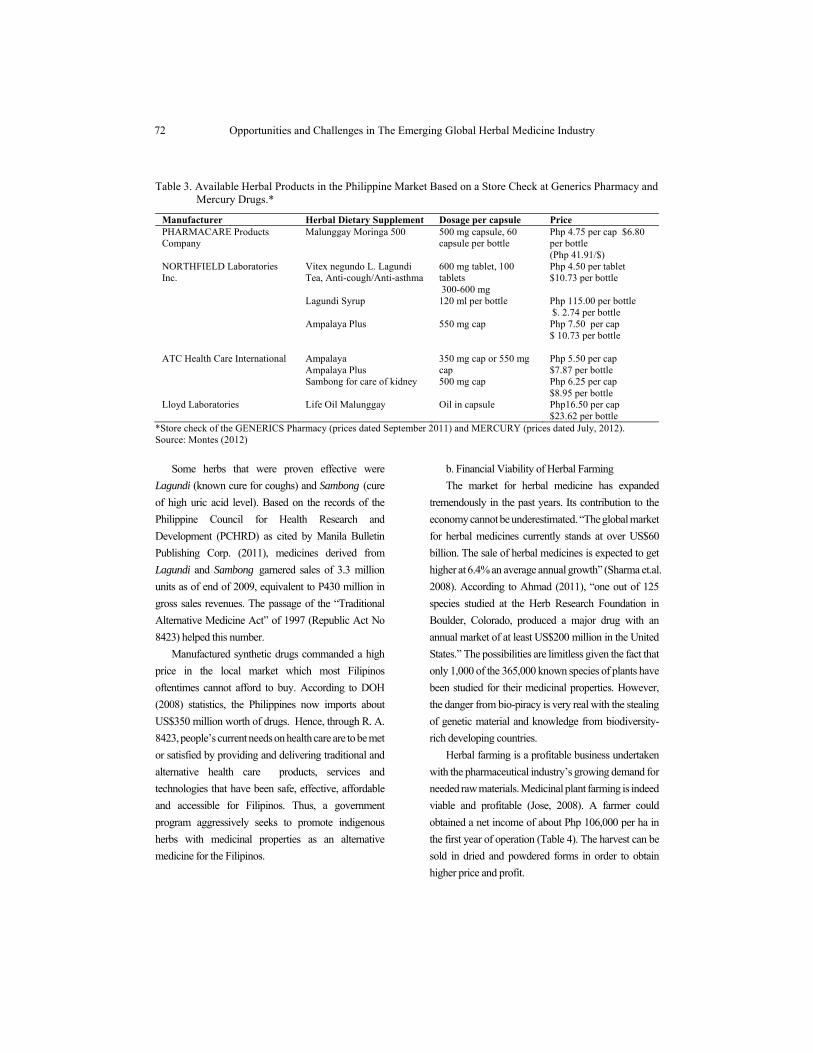
Opportunities and Challenges in The Emerging Global Herbal Medicine Industry
72
Table 3. Available Herbal Products in the Philippine Market Based on a Store Check at Generics Pharmacy and Mercury Drugs.*
Manufacturer Herbal Dietary Supplement Dosage per capsule Price PHARMACARE Products Company
Malunggay Moringa 500 500 mg capsule, 60 capsule per bottle
Php 4.75 per cap $6.80 per bottle (Php 41.91/$)
NORTHFIELD Laboratories Inc.
Vitex negundo L. Lagundi Tea, Anti-cough/Anti-asthma
600 mg tablet, 100 tablets 300-600 mg
Php 4.50 per tablet $10.73 per bottle
Lagundi Syrup 120 ml per bottle Php 115.00 per bottle $. 2.74 per bottle
Ampalaya Plus 550 mg cap Php 7.50 per cap $ 10.73 per bottle
ATC Health Care International Ampalaya Ampalaya Plus
350 mg cap or 550 mg cap
Php 5.50 per cap $7.87 per bottle
Sambong for care of kidney 500 mg cap Php 6.25 per cap $8.95 per bottle
Lloyd Laboratories Life Oil Malunggay Oil in capsule Php16.50 per cap $23.62 per bottle
*Store check of the GENERICS Pharmacy (prices dated September 2011) and MERCURY (prices dated July, 2012). Source: Montes (2012)
Some herbs that were proven effective were
Lagundi (known cure for coughs) and Sambong (cure
of high uric acid level). Based on the records of the
Philippine Council for Health Research and
Development (PCHRD) as cited by Manila Bulletin
Publishing Corp. (2011), medicines derived from
Lagundi and Sambong garnered sales of 3.3 million
units as of end of 2009, equivalent to P430 million in
gross sales revenues. The passage of the “Traditional
Alternative Medicine Act” of 1997 (Republic Act No
8423) helped this number.
Manufactured synthetic drugs commanded a high
price in the local market which most Filipinos
oftentimes cannot afford to buy. According to DOH
(2008) statistics, the Philippines now imports about
US$350 million worth of drugs. Hence, through R. A.
8423, people’s current needs on health care are to be met
or satisfied by providing and delivering traditional and
alternative health care products, services and
technologies that have been safe, effective, affordable
and accessible for Filipinos. Thus, a government
program aggressively seeks to promote indigenous
herbs with medicinal properties as an alternative
medicine for the Filipinos.
b. Financial Viability of Herbal Farming
The market for herbal medicine has expanded
tremendously in the past years. Its contribution to the
economy cannot be underestimated. “The global market
for herbal medicines currently stands at over US$60
billion. The sale of herbal medicines is expected to get
higher at 6.4% an average annual growth” (Sharma et.al.
2008). According to Ahmad (2011), “one out of 125
species studied at the Herb Research Foundation in
Boulder, Colorado, produced a major drug with an
annual market of at least US$200 million in the United
States.” The possibilities are limitless given the fact that
only 1,000 of the 365,000 known species of plants have
been studied for their medicinal properties. However,
the danger from bio-piracy is very real with the stealing
of genetic material and knowledge from biodiversity-
rich developing countries.
Herbal farming is a profitable business undertaken
with the pharmaceutical industry’s growing demand for
needed raw materials. Medicinal plant farming is indeed
viable and profitable (Jose, 2008). A farmer could
obtained a net income of about Php 106,000 per ha in
the first year of operation (Table 4). The harvest can be
sold in dried and powdered forms in order to obtain
higher price and profit.
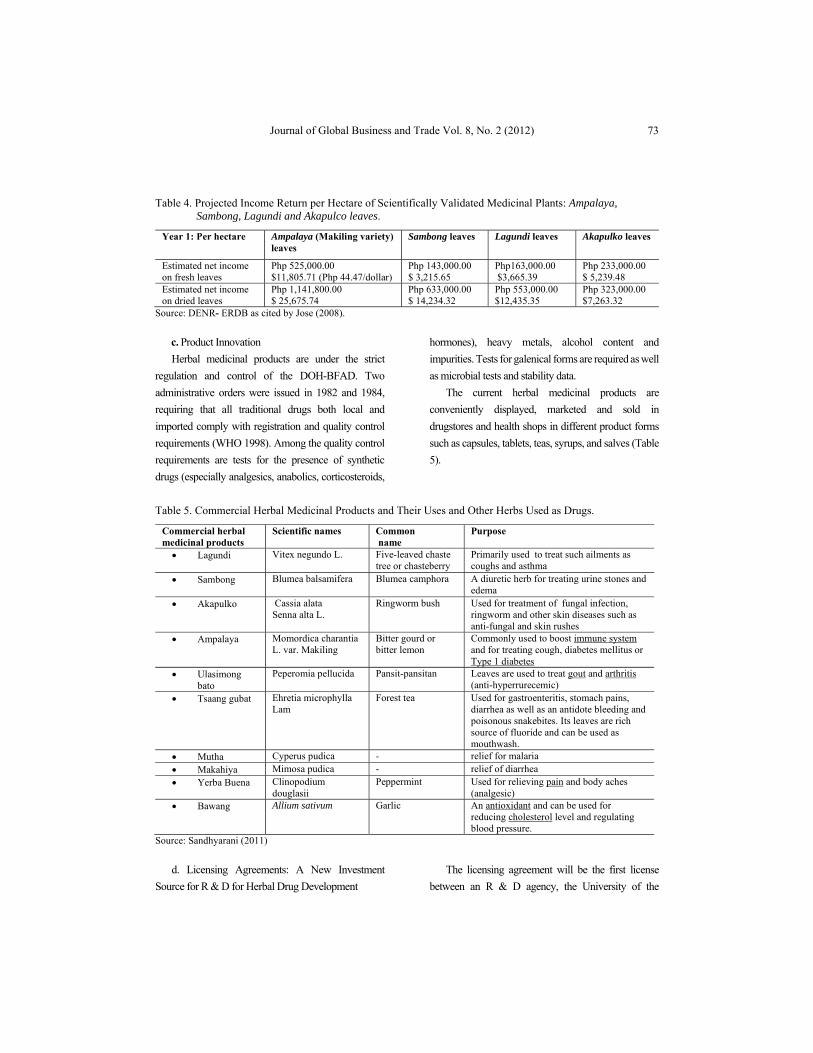
Journal of Global Business and Trade Vol. 8, No. 2 (2012)
73
Table 4. Projected Income Return per Hectare of Scientifically Validated Medicinal Plants: Ampalaya, Sambong, Lagundi and Akapulco leaves.
Year 1: Per hectare
Ampalaya (Makiling variety) leaves
Sambong leaves
Lagundi leaves Akapulko leaves
Estimated net income on fresh leaves
Php 525,000.00 $11,805.71 (Php 44.47/dollar)
Php 143,000.00 $ 3,215.65
Php163,000.00 $3,665.39
Php 233,000.00 $ 5,239.48
Estimated net income on dried leaves
Php 1,141,800.00 $ 25,675.74
Php 633,000.00 $ 14,234.32
Php 553,000.00 $12,435.35
Php 323,000.00 $7,263.32
Source: DENR- ERDB as cited by Jose (2008).
c. Product Innovation
Herbal medicinal products are under the strict
regulation and control of the DOH-BFAD. Two
administrative orders were issued in 1982 and 1984,
requiring that all traditional drugs both local and
imported comply with registration and quality control
requirements (WHO 1998). Among the quality control
requirements are tests for the presence of synthetic
drugs (especially analgesics, anabolics, corticosteroids,
hormones), heavy metals, alcohol content and
impurities. Tests for galenical forms are required as well
as microbial tests and stability data.
The current herbal medicinal products are
conveniently displayed, marketed and sold in
drugstores and health shops in different product forms
such as capsules, tablets, teas, syrups, and salves (Table
5).
Table 5. Commercial Herbal Medicinal Products and Their Uses and Other Herbs Used as Drugs.
Commercial herbal medicinal products
Scientific names Common name
Purpose
Lagundi
Vitex negundo L. Five-leaved chaste tree or chasteberry
Primarily used to treat such ailments as coughs and asthma
Sambong
Blumea balsamifera Blumea camphora A diuretic herb for treating urine stones and edema
Akapulko Cassia alata Senna alta L.
Ringworm bush Used for treatment of fungal infection, ringworm and other skin diseases such as anti-fungal and skin rushes
Ampalaya
Momordica charantia L. var. Makiling
Bitter gourd or bitter lemon
Commonly used to boost immune system and for treating cough, diabetes mellitus or Type 1 diabetes
Ulasimong bato
Peperomia pellucida Pansit-pansitan Leaves are used to treat gout and arthritis (anti-hyperrurecemic)
Tsaang gubat
Ehretia microphylla Lam
Forest tea Used for gastroenteritis, stomach pains, diarrhea as well as an antidote bleeding and poisonous snakebites. Its leaves are rich source of fluoride and can be used as mouthwash.
Mutha Cyperus pudica - relief for malaria Makahiya Mimosa pudica - relief of diarrhea Yerba Buena Clinopodium
douglasii Peppermint Used for relieving pain and body aches
(analgesic) Bawang Allium sativum Garlic An antioxidant and can be used for
reducing cholesterol level and regulating blood pressure.
Source: Sandhyarani (2011)
d. Licensing Agreements: A New Investment
Source for R & D for Herbal Drug Development
The licensing agreement will be the first license
between an R & D agency, the University of the
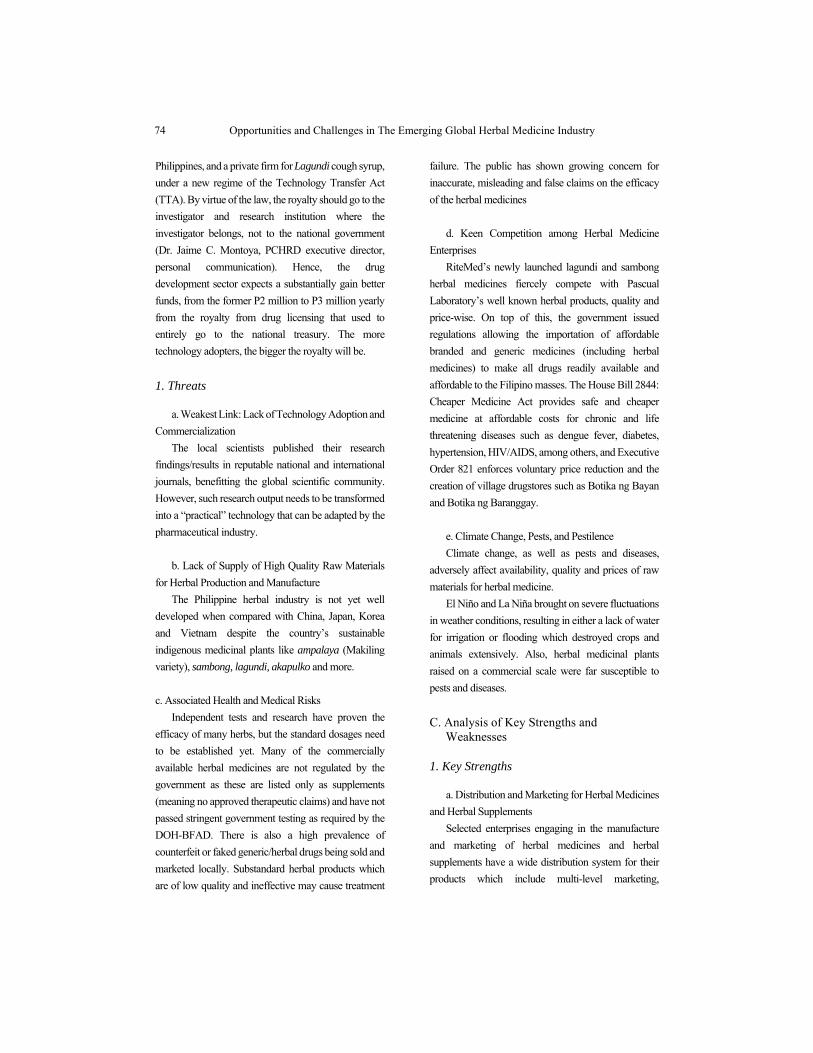
Opportunities and Challenges in The Emerging Global Herbal Medicine Industry
74
Philippines, and a private firm for Lagundi cough syrup,
under a new regime of the Technology Transfer Act
(TTA). By virtue of the law, the royalty should go to the
investigator and research institution where the
investigator belongs, not to the national government
(Dr. Jaime C. Montoya, PCHRD executive director,
personal communication). Hence, the drug
development sector expects a substantially gain better
funds, from the former P2 million to P3 million yearly
from the royalty from drug licensing that used to
entirely go to the national treasury. The more
technology adopters, the bigger the royalty will be.
1. Threats
a. Weakest Link: Lack of Technology Adoption and
Commercialization
The local scientists published their research
findings/results in reputable national and international
journals, benefitting the global scientific community.
However, such research output needs to be transformed
into a “practical” technology that can be adapted by the
pharmaceutical industry.
b. Lack of Supply of High Quality Raw Materials
for Herbal Production and Manufacture
The Philippine herbal industry is not yet well
developed when compared with China, Japan, Korea
and Vietnam despite the country’s sustainable
indigenous medicinal plants like ampalaya (Makiling
variety), sambong, lagundi, akapulko and more.
c. Associated Health and Medical Risks
Independent tests and research have proven the
efficacy of many herbs, but the standard dosages need
to be established yet. Many of the commercially
available herbal medicines are not regulated by the
government as these are listed only as supplements
(meaning no approved therapeutic claims) and have not
passed stringent government testing as required by the
DOH-BFAD. There is also a high prevalence of
counterfeit or faked generic/herbal drugs being sold and
marketed locally. Substandard herbal products which
are of low quality and ineffective may cause treatment
failure. The public has shown growing concern for
inaccurate, misleading and false claims on the efficacy
of the herbal medicines
d. Keen Competition among Herbal Medicine
Enterprises
RiteMed’s newly launched lagundi and sambong
herbal medicines fiercely compete with Pascual
Laboratory’s well known herbal products, quality and
price-wise. On top of this, the government issued
regulations allowing the importation of affordable
branded and generic medicines (including herbal
medicines) to make all drugs readily available and
affordable to the Filipino masses. The House Bill 2844:
Cheaper Medicine Act provides safe and cheaper
medicine at affordable costs for chronic and life
threatening diseases such as dengue fever, diabetes,
hypertension, HIV/AIDS, among others, and Executive
Order 821 enforces voluntary price reduction and the
creation of village drugstores such as Botika ng Bayan
and Botika ng Baranggay.
e. Climate Change, Pests, and Pestilence
Climate change, as well as pests and diseases,
adversely affect availability, quality and prices of raw
materials for herbal medicine.
El Niño and La Niña brought on severe fluctuations
in weather conditions, resulting in either a lack of water
for irrigation or flooding which destroyed crops and
animals extensively. Also, herbal medicinal plants
raised on a commercial scale were far susceptible to
pests and diseases.
C. Analysis of Key Strengths and Weaknesses
1. Key Strengths
a. Distribution and Marketing for Herbal Medicines
and Herbal Supplements
Selected enterprises engaging in the manufacture
and marketing of herbal medicines and herbal
supplements have a wide distribution system for their
products which include multi-level marketing,
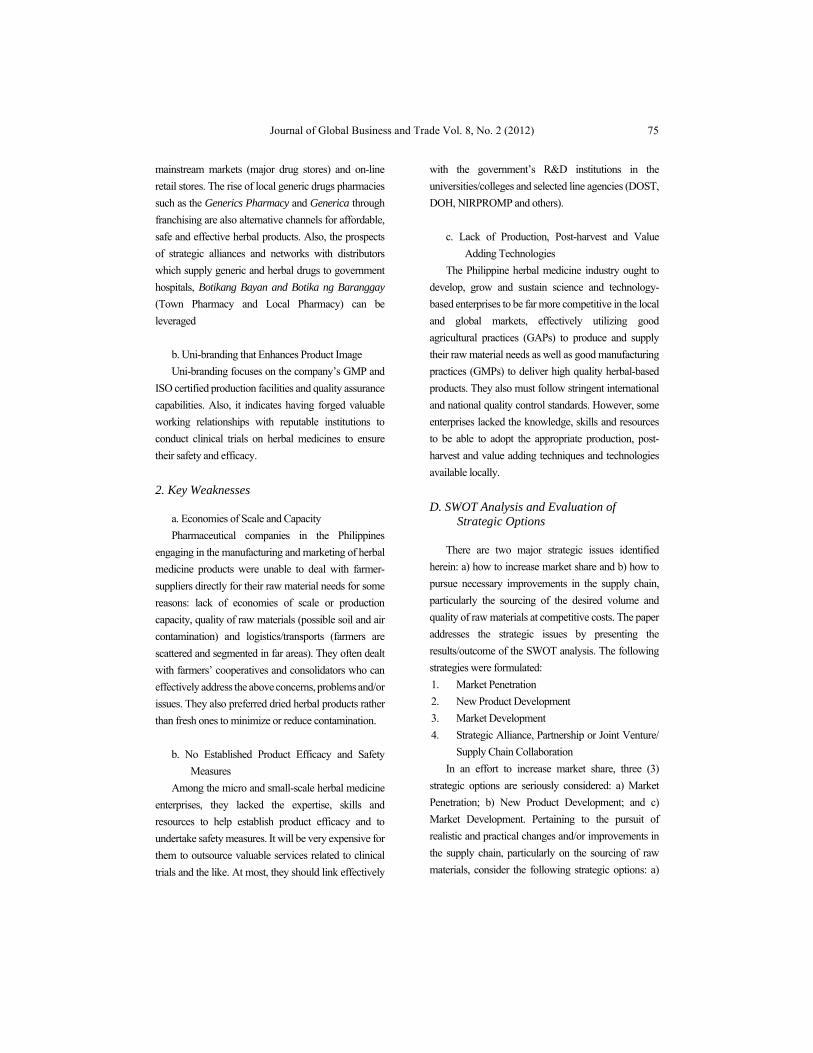
Journal of Global Business and Trade Vol. 8, No. 2 (2012)
75
mainstream markets (major drug stores) and on-line
retail stores. The rise of local generic drugs pharmacies
such as the Generics Pharmacy and Generica through
franchising are also alternative channels for affordable,
safe and effective herbal products. Also, the prospects
of strategic alliances and networks with distributors
which supply generic and herbal drugs to government
hospitals, Botikang Bayan and Botika ng Baranggay
(Town Pharmacy and Local Pharmacy) can be
leveraged
b. Uni-branding that Enhances Product Image
Uni-branding focuses on the company’s GMP and
ISO certified production facilities and quality assurance
capabilities. Also, it indicates having forged valuable
working relationships with reputable institutions to
conduct clinical trials on herbal medicines to ensure
their safety and efficacy.
2. Key Weaknesses
a. Economies of Scale and Capacity
Pharmaceutical companies in the Philippines
engaging in the manufacturing and marketing of herbal
medicine products were unable to deal with farmer-
suppliers directly for their raw material needs for some
reasons: lack of economies of scale or production
capacity, quality of raw materials (possible soil and air
contamination) and logistics/transports (farmers are
scattered and segmented in far areas). They often dealt
with farmers’ cooperatives and consolidators who can
effectively address the above concerns, problems and/or
issues. They also preferred dried herbal products rather
than fresh ones to minimize or reduce contamination.
b. No Established Product Efficacy and Safety
Measures
Among the micro and small-scale herbal medicine
enterprises, they lacked the expertise, skills and
resources to help establish product efficacy and to
undertake safety measures. It will be very expensive for
them to outsource valuable services related to clinical
trials and the like. At most, they should link effectively
with the government’s R&D institutions in the
universities/colleges and selected line agencies (DOST,
DOH, NIRPROMP and others).
c. Lack of Production, Post-harvest and Value
Adding Technologies
The Philippine herbal medicine industry ought to
develop, grow and sustain science and technology-
based enterprises to be far more competitive in the local
and global markets, effectively utilizing good
agricultural practices (GAPs) to produce and supply
their raw material needs as well as good manufacturing
practices (GMPs) to deliver high quality herbal-based
products. They also must follow stringent international
and national quality control standards. However, some
enterprises lacked the knowledge, skills and resources
to be able to adopt the appropriate production, post-
harvest and value adding techniques and technologies
available locally.
D. SWOT Analysis and Evaluation of Strategic Options
There are two major strategic issues identified
herein: a) how to increase market share and b) how to
pursue necessary improvements in the supply chain,
particularly the sourcing of the desired volume and
quality of raw materials at competitive costs. The paper
addresses the strategic issues by presenting the
results/outcome of the SWOT analysis. The following
strategies were formulated:
1. Market Penetration
2. New Product Development
3. Market Development
4. Strategic Alliance, Partnership or Joint Venture/
Supply Chain Collaboration
In an effort to increase market share, three (3)
strategic options are seriously considered: a) Market
Penetration; b) New Product Development; and c)
Market Development. Pertaining to the pursuit of
realistic and practical changes and/or improvements in
the supply chain, particularly on the sourcing of raw
materials, consider the following strategic options: a)
Opportunities and Challenges in The Emerging Global Herbal Medicine Industry
76
Strategic Alliance (informal); b) Partnership (formal)
and c) Joint Venture (with financial equities involved).
V. Conclusions and Recommendations
A. Pursuing an Effective Strategic Alliance between Pharmaceutical Companies among the SMEs and Farmer-Suppliers.
Let us prioritize supply chain related problems and
issues and offer business solutions to address these
issues. Strategic alliance (informal) or partnership
(formal) with farmer-suppliers is deemed a practical,
realistic solution. As Ochave (2012) defines such
arrangements, this is “A cooperative venture between
public-private sectors built on the expertise of each
partners that best meets clearly defined public needs
through public allocation of resources, risks and
rewards”. It involves both economic parameters (e.g.
sustainability and profitability) as well social
parameters (e.g. livelihood and income to the
community). Every key stakeholder has their “own”
specialization which they can share. Farmer-suppliers
invest resources, time and efforts, adopting GAPs from
propagation, growing and harvesting. Meanwhile, the
pharmaceutical companies have ample financial
resources; manufacturing expertise applying GMPs,
HACCP and ISO as they engaged in encapsulation,
primary and secondary packaging; and marketing skills
including branding and distribution.
B. Determining Quality Assurance Standards and Parameters at the Farm Enterprise Level.
Likewise, various challenges confront the industry
in these hard times. The questions and issues are mainly
on: How do we develop the quality assurance standards
and parameters? How can we ensure quality of raw
materials and herbal products? How can we avoid
contamination in the soil, water and air? How and where
do we source raw materials (traceability)? How do we
conduct clinical trials? This requires effective
networking and links with public and private R & D
institutions to acquire the needed knowledge, skills and
behaviors that will help ensure the quality of herbal
plants and products.
C. Utilizing Appropriate Technologies and Processes
It is also highly recommended that on-site, village
type of drying and pulverizing equipment (low costs) be
established so that contamination along the supply chain
can be avoided from sources of raw materials to
processing into herbal medicine products. More so,
testing for microbial and moisture content and other
testing to accurately detect heavy metals and toxic
elements must be carried out at the level of the farmers,
with the able support of the agricultural technicians
(ATs) and the local government units (LGUs). For all
the positive efforts done to guarantee product quality,
pharmaceutical companies must adopt “fair” marketing
practices with third party evaluation and continue the
conduct of effective technology transfer in cooperation
with the LGUs and the farmer-suppliers in order to
sustain high quality standards at the farmer’s level.
D. Enhancing the Role of Consolidators.
In areas where farmers’ cooperatives have not
existed yet and valuable resources are needed to build
one, it can be most advisable that companies deal with
the so-called “consolidators” who are most professional
and with good sense of social responsibility to transact
normal business with farmer-suppliers. The said
consolidators are also leaf processors engaged in leaf
buying and pick-up, washing, oven drying, pulverizing
and packaging. They are also expected to practice “fair”
marketing practices, particularly in setting prices.
E. Engaging into New Product Development Strategy of the Pharmaceutical Companies among the SMEs.
Marketing costs can be very high among
pharmaceutical companies based on certain
considerations such as business model, market niches,
availability of raw materials, manufacturing practices,
Journal of Global Business and Trade Vol. 8, No. 2 (2012)
77
few/limited products and actual marketing costs. With
respect to few products, companies can engage in a new
product development strategy as an offshoot of the
desired changes and/or improvement in the supply
chain. In the case of UNILAB, they have begun
manufacturing and marketing Lagundi to treat coughs,
and colds and later on, Sambong for the care of the
kidney was given a second priority next to Lagundi.
References
Ahmad, T. (2011). Bio-piracy: A threat to herbal
medicine industry. Paper presented at the “Trade
Barriers on Medicinal Plants Industry – Issues and
Challenges” Workshop, Medicinal Plant Board,
India. Beijing Zeefer Consulting Ltd. (2008). Research report
on entry into China’s medicinal herb market.
Retrieved July 3, 2012 from http://www.
reportbuyer.com/samples/2fc775da9306ae2649db
8e7d91d9b257.pdf
Chamber of Herbal Industries of the Philippines, Inc.
(2012a). About us. Retrieved on January 12, 2012
from http://chipi.org.ph/about-us
David, F.R. (2003). Strategic management: Concepts
and cases. 9th edition. Pearson Education South
Asia Pte Ltd.
Department of Health (2008). Ten herbal medicines in
the Philippines approved by DOH. Retrieved
January 25 from http://www.philippineherbal
medicine.org/doh_herbs.htm
Euromonitor International. (2010). Herbal/traditional
products: Market overview in the Philippines.
Retrieved January 25, 2012 from http://
www.reportlinker.com/p0190208-summary/
Herbal-traditional-Products-Philippines.html
Global Industry Analysts, Inc. (2012). Global herbal
supplements and remedies market to reach US$107
Billion by 2017. Retrieved June 29, 2012 from
http://www.prweb.com/releases/herbal_
supplements/herbal_remedies/prweb9260421.htm
International Federation of Organic Agriculture
Movement. (2001). Growing organic/ Philippine
market development. Retrieved January 20, 2012
from http://www.ifoam.org/growing_organic/
2_policy/case_studies/philippines_market_develop
ment.php
Jose, A.S. (2008). Financial viability of medicinal plant
farming. Retrieved January 13, 2012 from
http://www.mixph.com/2008/07/financial-
viability-of-medicinal-plant-farming.html
Manila Bulletin Publishing Corp. (2011). Local herbal
industry to get boost from emerging clinical testing.
Retrieved January 12, 2010 from http://
www.mb.com.ph/articles/309891/local-herbal-
industry-get-boost-emerging-clinical.
Montes, N.D. (2012). Store check of the Generics
Pharmacy and Mercury Drugs on September 2011
and July 4, 2012, respectively. Unpublished store
check report.
Ochave, J. (2012). Putting science into nature: Public-
private partnership opportunities in establishing a
science-based herbal industry in the Philippines.
Powerpoint presentation presented at UPLB
Biotechnology, Los Banos, Laguna, Social
Responsibility Unit of UNILAB. Sandhyarani, N. (2011). Herbal medicine in the
Philippines. Retrieved January 13, 2012 from
http://www.buzzle.com/articles/herbal-medicine-
in-the-philippines.html
Sharma, A., Shanker C., Tyagi L.K., Singh M. & Rao
C.V. (2008). Herbal medicine for market potential
in India: An overview. Academic Journal of Plant
Sciences 1 (2): 26-36.
Strickland, A. J. and Thompson, Jr., A.A. (2003).
Strategic management: Concepts and cases. 13th
Edition. McGraw-Hill Irwin.
Tilburt, J. C. and Kaptchuk, T. J. (2007). Herbal
medicine research and global health: An ethical
analysis”. Retrieved June 29, 2012 from
http://www.who.int/bulletin/volumes/86/8/07-
042820/en/index.html. Wakdikar, S. (2004). Global health care challenge:
Indian experiences and new prescriptions. National
Opportunities and Challenges in The Emerging Global Herbal Medicine Industry
78
Institute of Science Technology and Development
Studies. Paper presented at the World Expo 2004,
Bhopal, India, January 12-14, 2004. Retrieved July
4, 2012 from http://
www.ejbiotechnology.info/content/vol7/issue3/full
/5/index.html.
Wheelen, T.L. and Hunger, D.J. (2004). Strategic
management and business policy. 9th Edition.
Pearson Education South Asia Pte Ltd.
Williams, A.Jr. (2009). Report of the third global
summit on HIV-AIDS, traditional medicine and
indigenous knowledge. Retrieved July 10, 2012
from http://www.slideshare.net/andrewwilliamsjr/
2009report-of-3rd-global-summit-on-hiv-aids-
traditional-medicine-indigenous-knowledge-
africa-first
World Health Organization. (1998). Regulatory
situation of herbal medicines: A world-wide review.
Retrieved January 20, 2012 from
http://apps.who.int/medicinedocs/en/d/Jwhozip57e
/4.6.2.html
World Health Organization (2003). Annual market
sales of herbal medicines. Retrieved July 10, 2012
from http://apps.who.int/medicinedocs/en/d/
Js7916e/7.12.html
Journal of Global Business and Trade Vol. 8, No. 2 (2012)
79
Journal of Global Business and Trade
The Influence of the Selection of Fall Season Tourist Sites on Satisfaction, Intention of Recommendation and Revisitation Sang Kyum Han Namseoul University, Korea
ARTICLE INFO
ABSTRACT
Keywords: Destination Attributes, Revisit Intention, Tourist Satisfaction, Selection of Tourist Destination, Intention of Recommendation, Fall Season Tourist Site
In this study, we tried to figure out the influence of fall season tourist site selection on satisfaction, intention of recommendation and revisitation by designing a study model. On the authority of much advanced research, we created selected attribute questions and classified them into 5 factors.(Service & Resource Exploration, Rest & Relief, Sports & Leisure activities, History Cultural Experience and Sightseeing in Surroundings). According to the 5 factors drawn and the result of multiple regression analysis on overall satisfaction, positive effects were shown in 2 factors including Rest & Relief and History Cultural Experience, but not in Service & Resource Exploration, Sports & Leisure and Sightseeing in Surroundings. Moreover, the higher the satisfaction shown in multiple regression analysis, a higher chance of Revisitation and Intention to Recommend is shown. Upon the result of this study, we drew the following conclusions. For the invigoration of fall season tourist sites, the development of trails, mountain climbing oriented marketing strategies bringing rest & relief and a policy for distribution or pricing that can promote an extended stay or fall season mountain climbing in the country side are recommended.
I. Introduction
Many Korean tourists like to travel in the autumn.
Trips to mountains are very popular as high satisfaction
is shown from a trip to a site of natural landscape.
Moreover, the growth potential of fall season tourist
sites is high as those satisfied tourists show a high
tendency for revisits.
The tourists believe that they would get the greatest
satisfaction when the image they imagined of the site
matches the actual view. They choose sites that can give
such satisfaction. As you can see from this fact, the fall
season tourists select the site for a trip based upon the
properties and preferences toward certain types of sites
that have already been positioned in their minds.
Therefore, if we can set our marketing strategies
based upon these preferred priorities of tourists, we
would be able to boost the chances of their revisitation
as well as secure new tourists. This study will focus on
the establishment of a study model regarding what
The Influence of the Selection of Fall Season Tourist Sites on Satisfaction, Intention of Recommendation and Revisitation
80
influences the fall season tourist selection attributes may
have on satisfaction, intention of recommendation and
revisitation and its verification.
We will also suggest the proper marketing strategies
based on the results. The purpose of this study is
designated below.
First, the selection attributes will be defined through
the advanced study of fall season tourist sites and the
results of the advanced study on satisfaction, chances of
revisitation and intention to recommend will be used as
the standard for the analysis.
Second, the selection attributes of tourists visiting
fall season tourist sites will be classified into factors and
the hypothesis on influences of those factors on the
satisfaction, revisitation and intention of
recommendation will be setup so its study model can be
verified.
Third, based upon the selection attributes of the
tourists visiting fall season tourist sites, a strategic
marketing plan for increased demand will be suggested.
II. Theoretical Background & Advanced Research
1. Selection of Tourist Sites
Attribute importance refers to not only the elements
effecting customers' satisfaction (Cadott & Turgeon,
1988) and the properties that customers place emphasis
on (Filiatrault & Ritchie, 1998) but also the factors
determining customers' attitudes.
In this regards, a tourist site refers to a certain place
in which all attractions and facilities are combined for
the satisfaction of tourists. Its value can achieve
recognition only when it is perceived and consistently
preferred and used by tourists. Therefore, tourist sites
are comprised of many attributes that can attract and
satisfy the desires and motivations of tourists.
In the study by Haahti (1986) into the factors of
determination for tourist sites and recognition and
preferences of tourists on tourist site attributes, the 10
attribute variables of the tourists sites are defined as:
monetary value, accessibility, sports facilities, night
recreational facilities, peaceful and quiet vacation, kind
people, natural park and camping, cultural experiences,
beautiful scenery and new destinations. Goodrich (1997)
classified the variables as follows: scenery, the attitude
of local people, adequate accommodations, rest and
relaxation, interest in culture, food, water sports,
shopping facilities, recreation and golf and tennis.
Ferraio (1996) had tourists leaving South Africa
after travel evaluate the relative importance of the
attribute factors of 21 tourist sites in order to measure
the preferences of the tourists. In this research he found
that natural landscape, safari tours, tropical plants,
shopping facilities and regional events act as the major
attractions in South Africa. Inskeep (1991) classified
tourist sites into natural attraction, cultural attraction and
special attraction, and suggested a categorization that
can be operated in terms of a sightseeing plan.
As you can see from the result of the advanced study
on tourist site selection attributes, the properties of
tourist attractions are diversifying, and they have a large
impact on action inducement of those tourists.
2. Satisfaction
The concept of satisfaction has been defined by
many scholars. Oliver (1981) defined satisfaction as the
feeling induced by the mismatch between the customer
expectation and the actual experience. Dann (1996)
explained it as the complex psychological condition in
which feelings are mismatched between the expectation
and the actual experience, and any feelings on
consuming the experience built in advance are mixed
together.
On the other hand, tourist satisfaction refers to the
consequences of the interaction between the expectation
and the actual experience that a tourist had at a tourist
site. (Pizam & Reichel, 1978). It also refers to the degree
of concurrence between the existing conviction and
selected alternatives.
Geva & Goldman (1991) insist that satisfaction of
tourists can be attained when the existing conviction and
the selected alternatives match.
Journal of Global Business and Trade Vol. 8, No. 2 (2012)
81
Moreover, Lounsbury & Polik (1992) defined it as
a means of assessing the image of a tourism experience,
a kind of attitude on the overall experience.
Noe (1987) stated that physical properties,
sociocultural features, rest, transportation, commercial
service and safety facilities, convictions, situations
regarding leisure activities and intangible products have
an impact on tourist satisfaction.
Therefore, tourists make decisions for their
behavior in the buying at a defined stage based upon the
attraction and overall circumstances, including charges
and conditions, which lead to the actual visit to the site.
It is the pre-stage of the actual consumption in which the
tourist develops the expectation on the tourism
consumption activity. After the site is selected, the
tourist moves to the actual destination and makes the
consumption there. This is how tourist satisfaction is
built.
3. Intention of Revisitation
The intention of revisitation is completed in
connection with the post purchase evaluation. The post
purchase evaluation is one of the stages in post purchase
behavior of the consumer's decision making process and
it is defined as the assessment process of post purchase
satisfaction or dissatisfaction. Therefore, the intention
of revisitation and word of mouth can be regarded as
variables of a consumer satisfaction result in the study
of consumer behavior regarding customer satisfaction.
There is less chance of revisitation for dissatisfied
consumers (Newman & Webel 1973) and dissatisfied
consumers will never show an active repurchase
behavior. It is not possible to deny the effect of post
purchase satisfaction on repurchase behavior.
Moscardo (1986) studied the psychological distinction
between people who made a revisitation and those who
did not. The result showed that experiences from the
features of tourist sites have a great impact on both
satisfaction and revisitation. Mazurskey (1989) proved
in his study that the expectation of the tourist site, other
experiences in the past, social norms and satisfaction
have a significant effect on revisitation. Even in these
studies, it is fully proven that there is an insignificant
chance of dissatisfied consumers to making a return to
the site.
4. Intention to Recommend
Higher satisfaction of tourists will lead to more
positive influence on the selection of tourist sites in the
future and a higher intention of revisitation. Tourists
tend to recommend sites where they were satisfied with
the experience there by sharing these positive feelings
and impressions regarding the site. ( Yu-Jae Lee, 1997).
Gye-sup Kim and Na-ri Choi (2005) stated in their
study that the intention of revisitation is formed only
when there is a possibility of tourists making a
revisitation to the same spot and when they are willing
to recommend the place to others.
Geva & Goldman (1991) verified the influence of
tourists' satisfaction on revisitation and word of mouth
in their study of tourist behavior targeting package tour
participants. Kozak & Rimminton (2000) stated in their
study targeting tourists that visited Mallorca that higher
satisfaction for the site brought a higher chance of
revisitation and the intention of recommendation.
Until now we have taken a look at various cases of
advanced studies on tourism satisfaction influencing
revisitation. The results proved that there is a close
correlation between the two and those satisfactory
experiences are often handed down through word of
mouth.
In this study we will carry out research targeting the
visitors of fall season tourists sites in view of the proven
facts that the tourist site selection attributes will have an
impact on satisfaction and tourist satisfaction is
proportional to the chances of revisitation and the
intention to recommend.
III. Study Model & Analysis Method
1. Study Model
In this study, we have classified factors into 17
different selection attributes based on the study of
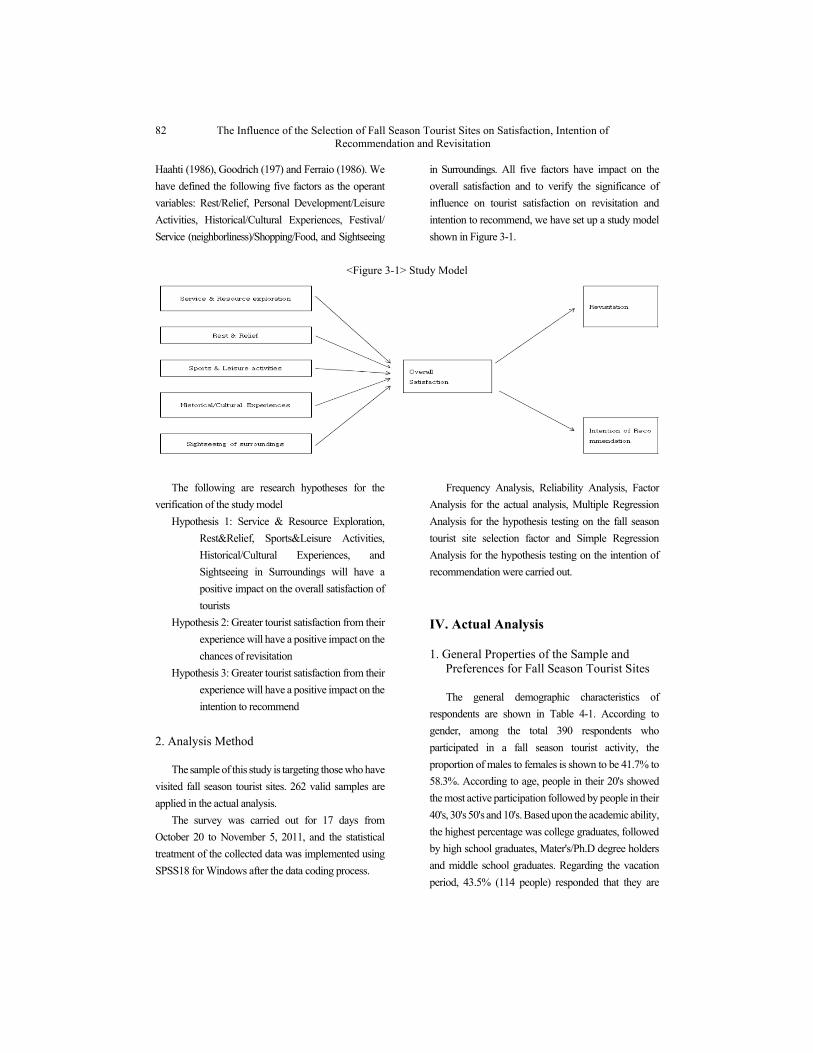
The Influence of the Selection of Fall Season Tourist Sites on Satisfaction, Intention of Recommendation and Revisitation
82
Haahti (1986), Goodrich (197) and Ferraio (1986). We
have defined the following five factors as the operant
variables: Rest/Relief, Personal Development/Leisure
Activities, Historical/Cultural Experiences, Festival/
Service (neighborliness)/Shopping/Food, and Sightseeing
in Surroundings. All five factors have impact on the
overall satisfaction and to verify the significance of
influence on tourist satisfaction on revisitation and
intention to recommend, we have set up a study model
shown in Figure 3-1.
<Figure 3-1> Study Model
The following are research hypotheses for the
verification of the study model
Hypothesis 1: Service & Resource Exploration,
Rest&Relief, Sports&Leisure Activities,
Historical/Cultural Experiences, and
Sightseeing in Surroundings will have a
positive impact on the overall satisfaction of
tourists
Hypothesis 2: Greater tourist satisfaction from their
experience will have a positive impact on the
chances of revisitation
Hypothesis 3: Greater tourist satisfaction from their
experience will have a positive impact on the
intention to recommend
2. Analysis Method
The sample of this study is targeting those who have
visited fall season tourist sites. 262 valid samples are
applied in the actual analysis.
The survey was carried out for 17 days from
October 20 to November 5, 2011, and the statistical
treatment of the collected data was implemented using
SPSS18 for Windows after the data coding process.
Frequency Analysis, Reliability Analysis, Factor
Analysis for the actual analysis, Multiple Regression
Analysis for the hypothesis testing on the fall season
tourist site selection factor and Simple Regression
Analysis for the hypothesis testing on the intention of
recommendation were carried out.
IV. Actual Analysis
1. General Properties of the Sample and Preferences for Fall Season Tourist Sites
The general demographic characteristics of
respondents are shown in Table 4-1. According to
gender, among the total 390 respondents who
participated in a fall season tourist activity, the
proportion of males to females is shown to be 41.7% to
58.3%. According to age, people in their 20's showed
the most active participation followed by people in their
40's, 30's 50's and 10's. Based upon the academic ability,
the highest percentage was college graduates, followed
by high school graduates, Mater's/Ph.D degree holders
and middle school graduates. Regarding the vacation
period, 43.5% (114 people) responded that they are
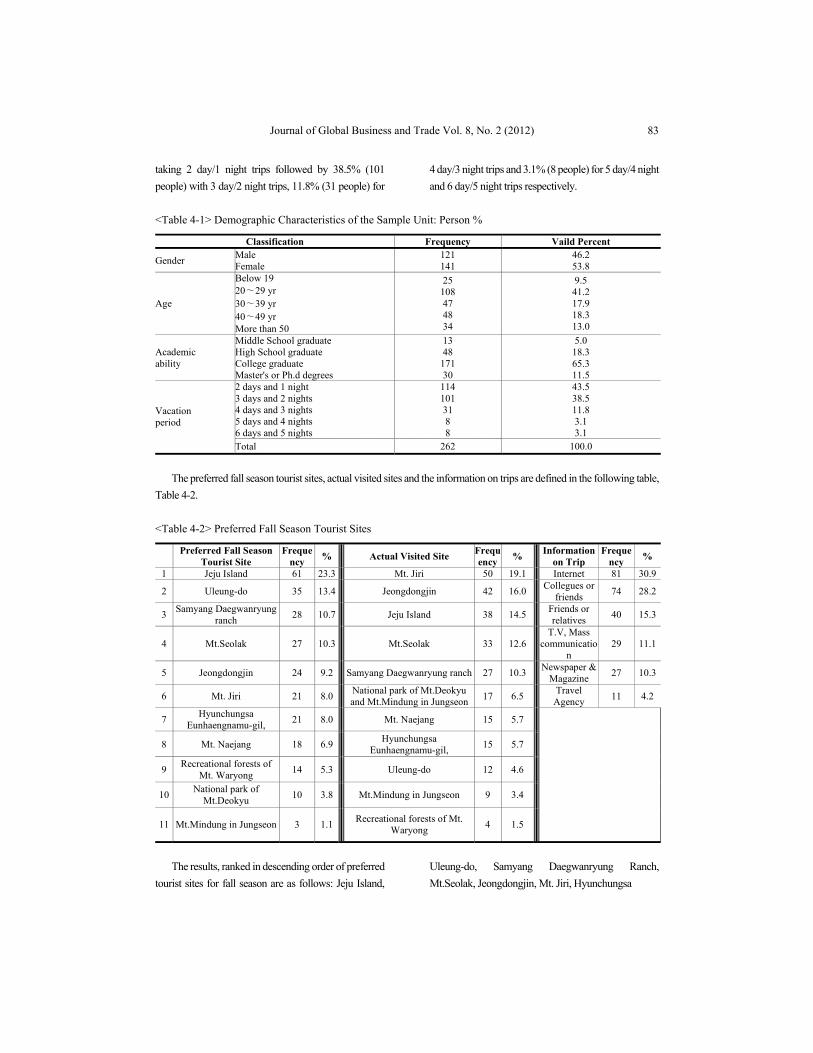
Journal of Global Business and Trade Vol. 8, No. 2 (2012)
83
taking 2 day/1 night trips followed by 38.5% (101
people) with 3 day/2 night trips, 11.8% (31 people) for
4 day/3 night trips and 3.1% (8 people) for 5 day/4 night
and 6 day/5 night trips respectively.
<Table 4-1> Demographic Characteristics of the Sample Unit: Person %
Classification Frequency Vaild Percent
Gender Male Female
121 141
46.2 53.8
Age
Below 19 20∼29 yr 30∼39 yr 40∼49 yr More than 50
25 108 47 48 34
9.5 41.2 17.9 18.3 13.0
Academic ability
Middle School graduate High School graduate College graduate Master's or Ph.d degrees
13 48
171 30
5.0 18.3 65.3 11.5
Vacation period
2 days and 1 night 3 days and 2 nights 4 days and 3 nights 5 days and 4 nights 6 days and 5 nights
114 101 31 8 8
43.5 38.5 11.8 3.1 3.1
Total 262 100.0
The preferred fall season tourist sites, actual visited sites and the information on trips are defined in the following table,
Table 4-2.
<Table 4-2> Preferred Fall Season Tourist Sites
Preferred Fall Season
Tourist Site Freque
ncy % Actual Visited Site
Frequency
% Information
on Trip Freque
ncy %
1 Jeju Island 61 23.3 Mt. Jiri 50 19.1 Internet 81 30.9
2 Uleung-do 35 13.4 Jeongdongjin 42 16.0 Collegues or
friends 74 28.2
3 Samyang Daegwanryung
ranch 28 10.7 Jeju Island 38 14.5
Friends or relatives
40 15.3
4 Mt.Seolak 27 10.3 Mt.Seolak 33 12.6 T.V, Mass
communication
29 11.1
5 Jeongdongjin 24 9.2 Samyang Daegwanryung ranch 27 10.3 Newspaper &
Magazine 27 10.3
6 Mt. Jiri 21 8.0 National park of Mt.Deokyu and Mt.Mindung in Jungseon
17 6.5 Travel
Agency 11 4.2
7 Hyunchungsa
Eunhaengnamu-gil, 21 8.0 Mt. Naejang 15 5.7
8 Mt. Naejang 18 6.9 Hyunchungsa
Eunhaengnamu-gil, 15 5.7
9 Recreational forests of
Mt. Waryong 14 5.3 Uleung-do 12 4.6
10 National park of
Mt.Deokyu 10 3.8 Mt.Mindung in Jungseon 9 3.4
11 Mt.Mindung in Jungseon 3 1.1 Recreational forests of Mt.
Waryong 4 1.5
The results, ranked in descending order of preferred
tourist sites for fall season are as follows: Jeju Island,
Uleung-do, Samyang Daegwanryung Ranch,
Mt.Seolak, Jeongdongjin, Mt. Jiri, Hyunchungsa
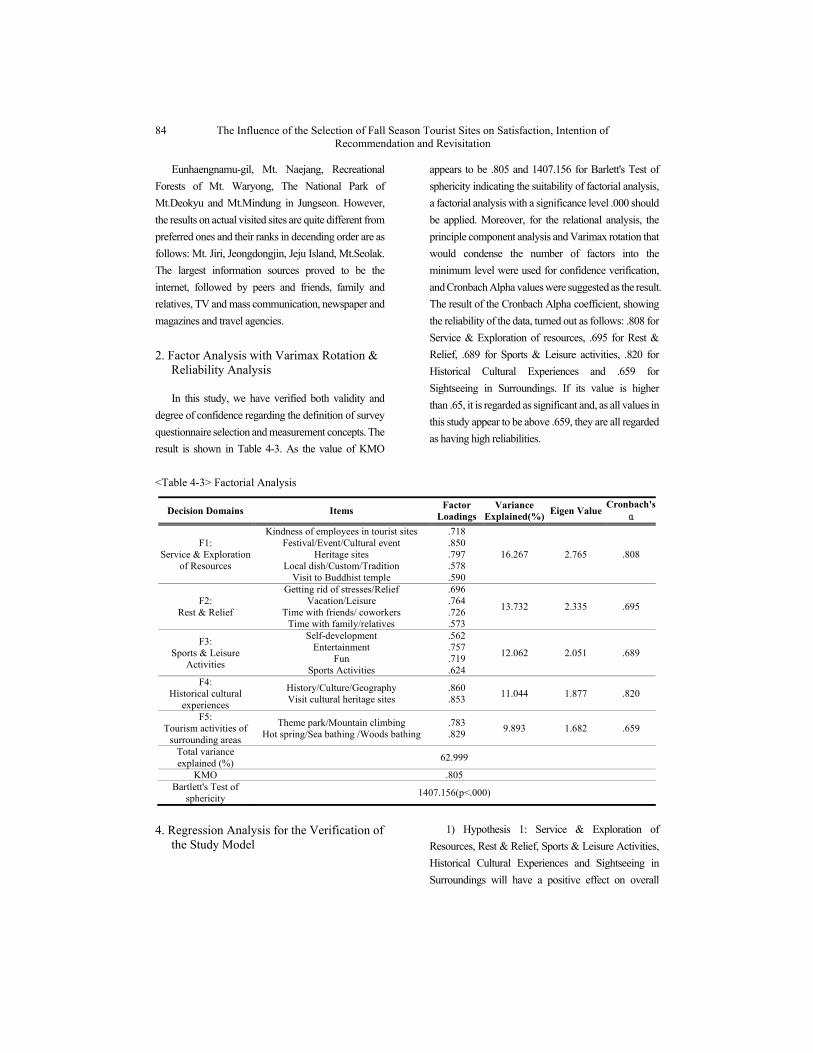
The Influence of the Selection of Fall Season Tourist Sites on Satisfaction, Intention of Recommendation and Revisitation
84
Eunhaengnamu-gil, Mt. Naejang, Recreational
Forests of Mt. Waryong, The National Park of
Mt.Deokyu and Mt.Mindung in Jungseon. However,
the results on actual visited sites are quite different from
preferred ones and their ranks in decending order are as
follows: Mt. Jiri, Jeongdongjin, Jeju Island, Mt.Seolak.
The largest information sources proved to be the
internet, followed by peers and friends, family and
relatives, TV and mass communication, newspaper and
magazines and travel agencies.
2. Factor Analysis with Varimax Rotation & Reliability Analysis
In this study, we have verified both validity and
degree of confidence regarding the definition of survey
questionnaire selection and measurement concepts. The
result is shown in Table 4-3. As the value of KMO
appears to be .805 and 1407.156 for Barlett's Test of
sphericity indicating the suitability of factorial analysis,
a factorial analysis with a significance level .000 should
be applied. Moreover, for the relational analysis, the
principle component analysis and Varimax rotation that
would condense the number of factors into the
minimum level were used for confidence verification,
and Cronbach Alpha values were suggested as the result.
The result of the Cronbach Alpha coefficient, showing
the reliability of the data, turned out as follows: .808 for
Service & Exploration of resources, .695 for Rest &
Relief, .689 for Sports & Leisure activities, .820 for
Historical Cultural Experiences and .659 for
Sightseeing in Surroundings. If its value is higher
than .65, it is regarded as significant and, as all values in
this study appear to be above .659, they are all regarded
as having high reliabilities.
<Table 4-3> Factorial Analysis
Decision Domains Items Factor
Loadings Variance
Explained(%)Eigen Value
Cronbach's α
F1: Service & Exploration
of Resources
Kindness of employees in tourist sites Festival/Event/Cultural event
Heritage sites Local dish/Custom/Tradition
Visit to Buddhist temple
.718
.850
.797
.578
.590
16.267 2.765 .808
F2: Rest & Relief
Getting rid of stresses/Relief Vacation/Leisure
Time with friends/ coworkers Time with family/relatives
.696
.764
.726
.573
13.732 2.335 .695
F3: Sports & Leisure
Activities
Self-development Entertainment
Fun Sports Activities
.562
.757
.719
.624
12.062 2.051 .689
F4: Historical cultural
experiences
History/Culture/Geography Visit cultural heritage sites
.860
.853 11.044 1.877 .820
F5: Tourism activities of
surrounding areas
Theme park/Mountain climbing Hot spring/Sea bathing /Woods bathing
.783
.829 9.893 1.682 .659
Total variance explained (%)
62.999
KMO .805 Bartlett's Test of
sphericity 1407.156(p<.000)
4. Regression Analysis for the Verification of the Study Model
1) Hypothesis 1: Service & Exploration of
Resources, Rest & Relief, Sports & Leisure Activities,
Historical Cultural Experiences and Sightseeing in
Surroundings will have a positive effect on overall
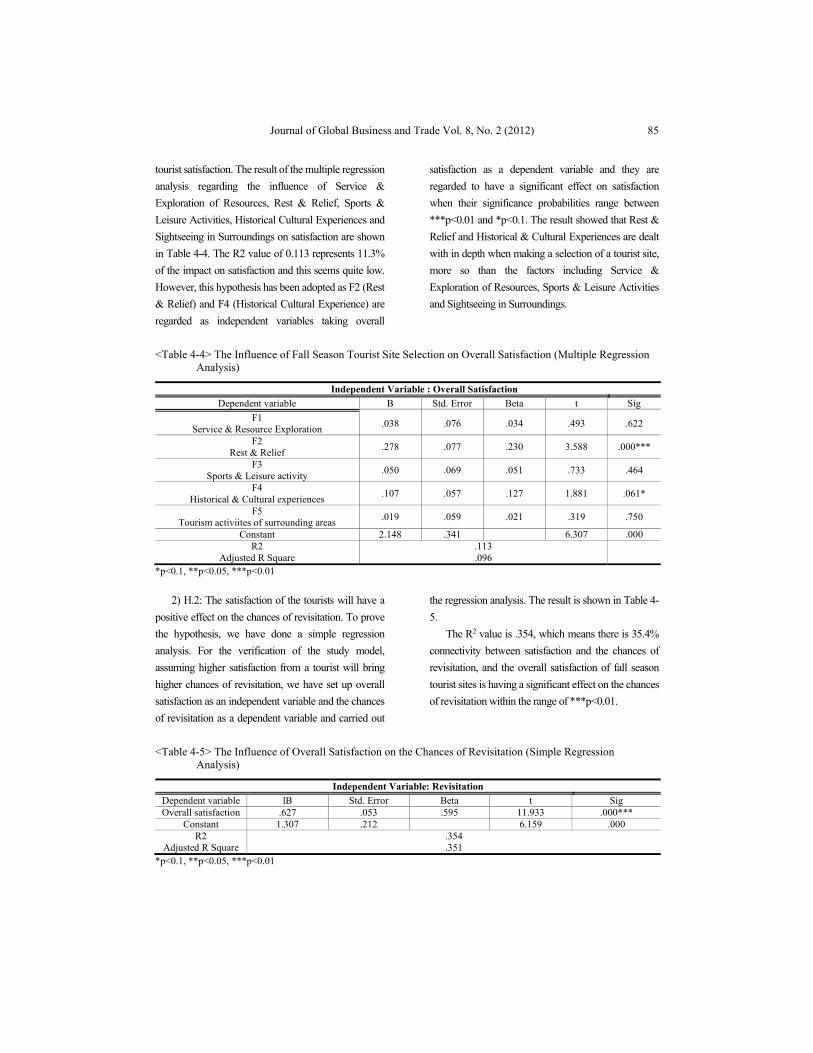
Journal of Global Business and Trade Vol. 8, No. 2 (2012)
85
tourist satisfaction. The result of the multiple regression
analysis regarding the influence of Service &
Exploration of Resources, Rest & Relief, Sports &
Leisure Activities, Historical Cultural Experiences and
Sightseeing in Surroundings on satisfaction are shown
in Table 4-4. The R2 value of 0.113 represents 11.3%
of the impact on satisfaction and this seems quite low.
However, this hypothesis has been adopted as F2 (Rest
& Relief) and F4 (Historical Cultural Experience) are
regarded as independent variables taking overall
satisfaction as a dependent variable and they are
regarded to have a significant effect on satisfaction
when their significance probabilities range between
***p<0.01 and *p<0.1. The result showed that Rest &
Relief and Historical & Cultural Experiences are dealt
with in depth when making a selection of a tourist site,
more so than the factors including Service &
Exploration of Resources, Sports & Leisure Activities
and Sightseeing in Surroundings.
<Table 4-4> The Influence of Fall Season Tourist Site Selection on Overall Satisfaction (Multiple Regression Analysis)
Independent Variable : Overall Satisfaction
Dependent variable B Std. Error Beta t Sig
F1 Service & Resource Exploration
.038 .076 .034 .493 .622
F2 Rest & Relief
.278 .077 .230 3.588 .000***
F3 Sports & Leisure activity
.050 .069 .051 .733 .464
F4 Historical & Cultural experiences
.107 .057 .127 1.881 .061*
F5 Tourism activiites of surrounding areas
.019 .059 .021 .319 .750
Constant 2.148 .341 6.307 .000 R2
Adjusted R Square .113 .096
*p<0.1, **p<0.05, ***p<0.01
2) H.2: The satisfaction of the tourists will have a
positive effect on the chances of revisitation. To prove
the hypothesis, we have done a simple regression
analysis. For the verification of the study model,
assuming higher satisfaction from a tourist will bring
higher chances of revisitation, we have set up overall
satisfaction as an independent variable and the chances
of revisitation as a dependent variable and carried out
the regression analysis. The result is shown in Table 4-
5.
The R2 value is .354, which means there is 35.4%
connectivity between satisfaction and the chances of
revisitation, and the overall satisfaction of fall season
tourist sites is having a significant effect on the chances
of revisitation within the range of ***p<0.01.
<Table 4-5> The Influence of Overall Satisfaction on the Chances of Revisitation (Simple Regression Analysis)
Independent Variable: Revisitation
Dependent variable lB Std. Error Beta t Sig Overall satisfaction .627 .053 .595 11.933 .000***
Constant 1.307 .212 6.159 .000 R2
Adjusted R Square .354 .351
*p<0.1, **p<0.05, ***p<0.01
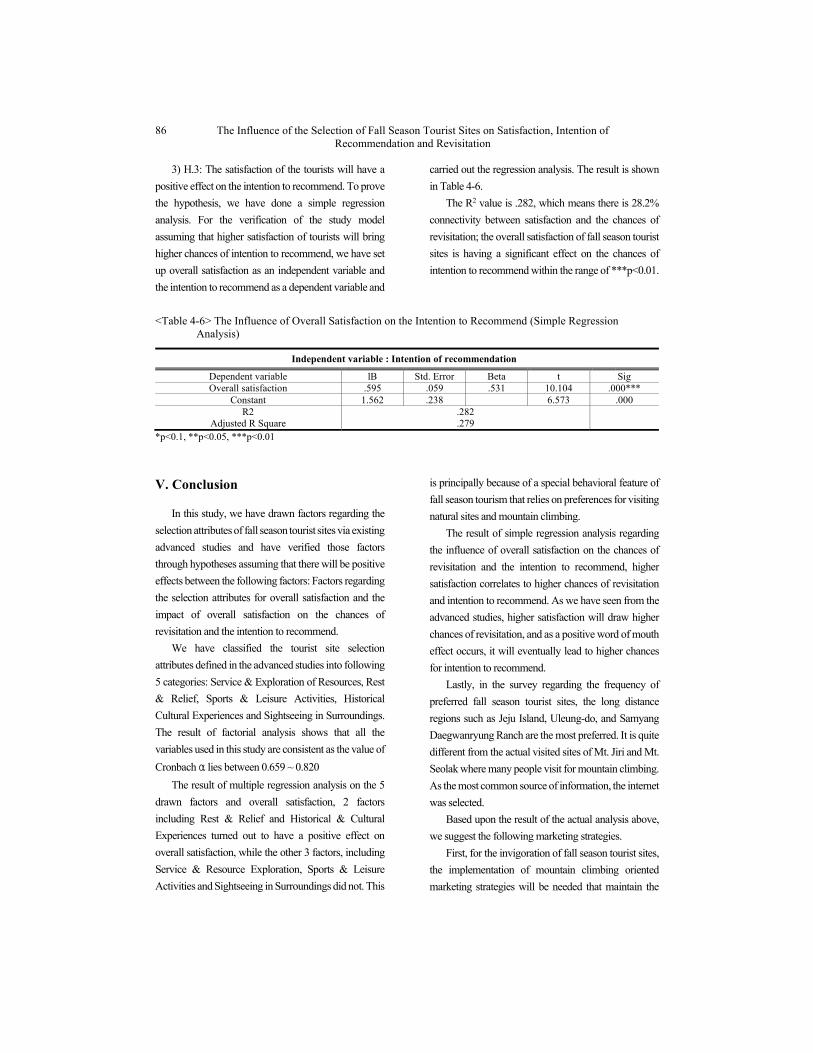
The Influence of the Selection of Fall Season Tourist Sites on Satisfaction, Intention of Recommendation and Revisitation
86
3) H.3: The satisfaction of the tourists will have a
positive effect on the intention to recommend. To prove
the hypothesis, we have done a simple regression
analysis. For the verification of the study model
assuming that higher satisfaction of tourists will bring
higher chances of intention to recommend, we have set
up overall satisfaction as an independent variable and
the intention to recommend as a dependent variable and
carried out the regression analysis. The result is shown
in Table 4-6.
The R2 value is .282, which means there is 28.2%
connectivity between satisfaction and the chances of
revisitation; the overall satisfaction of fall season tourist
sites is having a significant effect on the chances of
intention to recommend within the range of ***p<0.01.
<Table 4-6> The Influence of Overall Satisfaction on the Intention to Recommend (Simple Regression Analysis)
Independent variable : Intention of recommendation
Dependent variable lB Std. Error Beta t Sig Overall satisfaction .595 .059 .531 10.104 .000***
Constant 1.562 .238 6.573 .000 R2
Adjusted R Square .282 .279
*p<0.1, **p<0.05, ***p<0.01
V. Conclusion
In this study, we have drawn factors regarding the
selection attributes of fall season tourist sites via existing
advanced studies and have verified those factors
through hypotheses assuming that there will be positive
effects between the following factors: Factors regarding
the selection attributes for overall satisfaction and the
impact of overall satisfaction on the chances of
revisitation and the intention to recommend.
We have classified the tourist site selection
attributes defined in the advanced studies into following
5 categories: Service & Exploration of Resources, Rest
& Relief, Sports & Leisure Activities, Historical
Cultural Experiences and Sightseeing in Surroundings.
The result of factorial analysis shows that all the
variables used in this study are consistent as the value of
Cronbach α lies between 0.659 ~ 0.820
The result of multiple regression analysis on the 5
drawn factors and overall satisfaction, 2 factors
including Rest & Relief and Historical & Cultural
Experiences turned out to have a positive effect on
overall satisfaction, while the other 3 factors, including
Service & Resource Exploration, Sports & Leisure
Activities and Sightseeing in Surroundings did not. This
is principally because of a special behavioral feature of
fall season tourism that relies on preferences for visiting
natural sites and mountain climbing.
The result of simple regression analysis regarding
the influence of overall satisfaction on the chances of
revisitation and the intention to recommend, higher
satisfaction correlates to higher chances of revisitation
and intention to recommend. As we have seen from the
advanced studies, higher satisfaction will draw higher
chances of revisitation, and as a positive word of mouth
effect occurs, it will eventually lead to higher chances
for intention to recommend.
Lastly, in the survey regarding the frequency of
preferred fall season tourist sites, the long distance
regions such as Jeju Island, Uleung-do, and Samyang
Daegwanryung Ranch are the most preferred. It is quite
different from the actual visited sites of Mt. Jiri and Mt.
Seolak where many people visit for mountain climbing.
As the most common source of information, the internet
was selected.
Based upon the result of the actual analysis above,
we suggest the following marketing strategies.
First, for the invigoration of fall season tourist sites,
the implementation of mountain climbing oriented
marketing strategies will be needed that maintain the
Journal of Global Business and Trade Vol. 8, No. 2 (2012)
87
good images of natural landscapes and provide
relax/relief feelings to visitors through the development
of natural trails.
Second, the development of tourism products in
affiliation with the fall season tourist sites and the region
it belongs to will be required. In other words, we should
try to find various ways to extend a stay and provide a
higher satisfaction. Instead of solely focusing on
mountain climbing, we can even consider connecting it
to the local festivals held in the nearby towns and
perhaps provide unconventional experiences.
Third, tourists showed higher preferences for well-
known or long-distance regions. Therefore, we should
consider of setting an adequate price policy or
marketing strategy in order to disperse the straw effect
at certain sites.
This study evaluated the influences of the selection
attributes on satisfaction, the chances of revisitation and
the intention to recommend. However, it has a limitation
as it only focuses on the fall season. Therefore, in the
follow-up studies, the selection attributes for other
seasons should be examined as well.
References
1. Cadott, G. I & Turgeon, J. R., 1998, Convention site
selection research : A review, conceptual model,
and propositional framework. Journal of
Convention and Exhibition Management, 1(1) : 49-
69.
2. Dann, G., 1996, Tourism Image of a Destination : An
Alternative Analysis, In Recent Advances in
Tourism Marketing Research, D. R. Fesenmaier, J.
T. O'Leary and M. Uysal, New York, The Haworth
Press, 41-55.
3. Ferrario, E. F., 1986 Black and White holidays : The
Future of the Local Tourist Industry in South Africa.
annal of Tourism Research. 13 : 311-348.
4. Filliatrault, Pierre & J. R. Brent Ritchie, 1988, The
Impact of situational Factors on the Evaluation o f
Hospitality Services, Journal of travel Research,
26(4) : 29-37.
5. Geva Aviva & Goldman Arieh, 1991, Duality in
consumer post-purchase attitude, Journal of
Economic Psychology, 12, 141-164.
6. Goodrich J. N.,1977, Benefit bindle analysis : An
Empirical Study of International Traveler, Journal
of Travel Research, 16 : 1-3.
7. Haahti, A. J.,1986, Finland's Competitive Position as
a Destination. Annals of Tourism Research. 13 : 11-
35.
8. Inskeep, E., 1991, Tourism Planning : An Integrated
and Sustainable Development Approach. New
york : Van Nostrano Reinhold : 75-106.
9. Kim Gye-sup, Choi Na-ri, 2005, A Study of Tourist
Motivation, Tourism Satisfaction and Revisiting
Intention of Beach, Research works of the graduate
school, The graduate school of Dong-A University,
the collection of dissertation No.30 , 375-390.
10. Kozak M. & Rimmington M., 1998,
Benchmarking" Destination attractiveness and
small hospitality Business performance.
International Journal of Contemporary Hospitality
Management, 10(5) : 184-188.
11. Lee Yu-Jae, 1997, Differences in the Consumer
Satisfaction Process between Goods and Services,
8(1), KSCS : 101-118.
12. Lounsbury, J. W. & Polik. J. R., 1992, Leisure
Needs and Vacation Satisfaction. Leisure Science,
14 (2) : 105-119.
13. Mazursky, D.,1989, Past Experience and Future
Tourism Decisions, Annals of Tourism Research,
16 : 333-344.
14. Moscardo, M., 1986, Mindful Visitors, Heritage and
Tourism, Annals of Tourism Research, 23 : 24-32.
15. Newman, J. W. & R. A. Webel, 1973, Multivariate
Analysis of Brand Loyalty to Major Houshold
Appliances, Journal of Marketing Research, 10
(November) : 72-91.
16. Noe, F. P., 1987, Measurement Specification and
Leisure Satisfaction, Leisure Science, 9(3) : 155-
166.
17. Oliver, R. L., 1981, A Cognitive Model of the
Antecedents and Consequences of Satisfaction

The Influence of the Selection of Fall Season Tourist Sites on Satisfaction, Intention of Recommendation and Revisitation
88
Decision, Journal of Marketing Research, 17(3) :
460-469.
18. Pizam, A., Neumann. Y & Reichel. A., 1978,
Dimension of Tourist Satisfaction With a
destination area, Annals of Tourism Research, 5 :
312-322.
Related Documents


