Conditions affecting the moisture buffering measurement performed on compressed earth blocks Fionn McGregor * , Andrew Heath, Enrico Fodde, Andy Shea BRE Centre for Innovative Construction Materials, Department of Architecture and Civil Engineering, University of Bath, Bath, BA2 7AY, UK article info Article history: Received 23 September 2013 Received in revised form 13 January 2014 Accepted 17 January 2014 Keywords: Compressed earth block Moisture buffering Sorption isotherms Water vapour permeability Nordtest abstract Unfired clay masonry has a high potential to regulate indoor humidity and therefore create healthier living environments. The measurement of such potential on various building materials has received increasing attention and has generated the Moisture Buffering Value (MBV) concept. This work experi- mentally explored various conditions affecting the measurement and calculation of the buffering po- tential. Measurements of MBV and steady state properties (water vapour permeability and sorption isotherms) were performed on 18 samples, Compressed Earth Blocks (CEB) and Stabilised Compressed Earth Blocks (SCEB). It is quantitatively shown how the variability of experimental conditions in the dynamic measurement can change the obtained MBV (MBV practical ). The calculated buffering potential (MBV ideal ) is equally affected by the variability of the steady state properties measurements. A good agreement between calculated and measured MBV was observed for most samples when reducing this variability which was shown by using a DVS (Dynamic Vapour System) system to obtain the sorption isotherms of the material. Ó 2014 Elsevier Ltd. All rights reserved. 1. Introduction Indoor air quality (IAQ) and humidity levels in buildings have become a major concern as they can have a direct impact on the health of occupants [2,13]. Humidity buffering in a room is a combination of environmental variables (current and previous humidity levels, temperature, air exchange rate and air velocity) and material properties (moisture adsorption properties and vapour permeability). It is the combination of environmental var- iables and different materials which influence the buffering ca- pacity of an enclosure, and therefore the related benefits of humidity buffering. The potential for microporous building materials to self-regulate indoor humidity levels has been studied by Padfield [20] who identified unfired clay masonry as one of the materials having the highest potential and the present study is therefore focussed on these materials. The experimental measurement of humidity buffering is still in early stages, therefore to further investigate the performance of unfired clay masonry, the influence of different test methods and equipment has to be determined. In 1965 Kunzel measured the moisture sorption of indoor surfaces with a dynamic experiment by using the “step response” method [14]. Such method corresponds to a high relative humidity (RH) cycle for a set time span characterising the adsorption followed by a low humidity cycle to characterise desorption, the mass change of the sample being monitored during the process. This type of experiment was then continued by several authors as reported by Svennberg et al. [26]. A Japanese Industrial Standard (JIS) [12] test was developed using the same principals and the outcome of the Nordtest project also proposed the same type of testing for moisture buffering evaluation [22,23]. Recently an international ISO standard was published using the same method [10]. However, there is little in- formation in the scientific literature on different materials tested according to these methods [26]. It is therefore difficult to quantify the effect of the test methods on results for particular materials. The obtained experimental result is referred to as moisture buffering or hygric inertia value which can be presented as the MBV practical as proposed by the Nordtest. “The practical Moisture Buffer Value (MBV practical ) indicates the amount of water that is transported in or out of a material per open surface area, during a certain period of time, when it is subjected to variations in relative humidity of the surrounding air. When the moisture exchange during the period is reported per open surface area and per % RH variation, the result is the MBV practical . The unit for MBV practical is kg/(m2,% RH).” [22]. * Corresponding author. E-mail address: [email protected] (F. McGregor). Contents lists available at ScienceDirect Building and Environment journal homepage: www.elsevier.com/locate/buildenv 0360-1323/$ e see front matter Ó 2014 Elsevier Ltd. All rights reserved. http://dx.doi.org/10.1016/j.buildenv.2014.01.009 Building and Environment 75 (2014) 11e18

Welcome message from author
This document is posted to help you gain knowledge. Please leave a comment to let me know what you think about it! Share it to your friends and learn new things together.
Transcript
lable at ScienceDirect
Building and Environment 75 (2014) 11e18
Contents lists avai
Building and Environment
journal homepage: www.elsevier .com/locate/bui ldenv
Conditions affecting the moisture buffering measurement performedon compressed earth blocks
Fionn McGregor*, Andrew Heath, Enrico Fodde, Andy SheaBRE Centre for Innovative Construction Materials, Department of Architecture and Civil Engineering, University of Bath, Bath, BA2 7AY, UK
a r t i c l e i n f o
Article history:Received 23 September 2013Received in revised form13 January 2014Accepted 17 January 2014
Keywords:Compressed earth blockMoisture bufferingSorption isothermsWater vapour permeabilityNordtest
* Corresponding author.E-mail address: [email protected] (F. McG
0360-1323/$ e see front matter � 2014 Elsevier Ltd.http://dx.doi.org/10.1016/j.buildenv.2014.01.009
a b s t r a c t
Unfired clay masonry has a high potential to regulate indoor humidity and therefore create healthierliving environments. The measurement of such potential on various building materials has receivedincreasing attention and has generated the Moisture Buffering Value (MBV) concept. This work experi-mentally explored various conditions affecting the measurement and calculation of the buffering po-tential. Measurements of MBV and steady state properties (water vapour permeability and sorptionisotherms) were performed on 18 samples, Compressed Earth Blocks (CEB) and Stabilised CompressedEarth Blocks (SCEB). It is quantitatively shown how the variability of experimental conditions in thedynamic measurement can change the obtained MBV (MBVpractical). The calculated buffering potential(MBVideal) is equally affected by the variability of the steady state properties measurements. A goodagreement between calculated and measured MBV was observed for most samples when reducing thisvariability which was shown by using a DVS (Dynamic Vapour System) system to obtain the sorptionisotherms of the material.
� 2014 Elsevier Ltd. All rights reserved.
1. Introduction
Indoor air quality (IAQ) and humidity levels in buildings havebecome a major concern as they can have a direct impact on thehealth of occupants [2,13]. Humidity buffering in a room is acombination of environmental variables (current and previoushumidity levels, temperature, air exchange rate and air velocity)and material properties (moisture adsorption properties andvapour permeability). It is the combination of environmental var-iables and different materials which influence the buffering ca-pacity of an enclosure, and therefore the related benefits ofhumidity buffering.
The potential formicroporous buildingmaterials to self-regulateindoor humidity levels has been studied by Padfield [20] whoidentified unfired clay masonry as one of the materials having thehighest potential and the present study is therefore focussed onthese materials. The experimental measurement of humiditybuffering is still in early stages, therefore to further investigate theperformance of unfired clay masonry, the influence of different testmethods and equipment has to be determined. In 1965 Kunzelmeasured the moisture sorption of indoor surfaces with a dynamic
regor).
All rights reserved.
experiment by using the “step response”method [14]. Suchmethodcorresponds to a high relative humidity (RH) cycle for a set timespan characterising the adsorption followed by a low humiditycycle to characterise desorption, the mass change of the samplebeing monitored during the process. This type of experiment wasthen continued by several authors as reported by Svennberg et al.[26]. A Japanese Industrial Standard (JIS) [12] test was developedusing the same principals and the outcome of the Nordtest projectalso proposed the same type of testing for moisture bufferingevaluation [22,23]. Recently an international ISO standard waspublished using the same method [10]. However, there is little in-formation in the scientific literature on different materials testedaccording to these methods [26]. It is therefore difficult to quantifythe effect of the test methods on results for particular materials.
The obtained experimental result is referred to as moisturebuffering or hygric inertia value which can be presented as theMBVpractical as proposed by the Nordtest.
“The practical Moisture Buffer Value (MBVpractical) indicates theamount of water that is transported in or out of a material per opensurface area, during a certain period of time, when it is subjected tovariations in relative humidity of the surrounding air. When themoisture exchange during the period is reported per open surfacearea and per % RH variation, the result is the MBVpractical. The unitfor MBVpractical is kg/(m2,% RH).” [22].
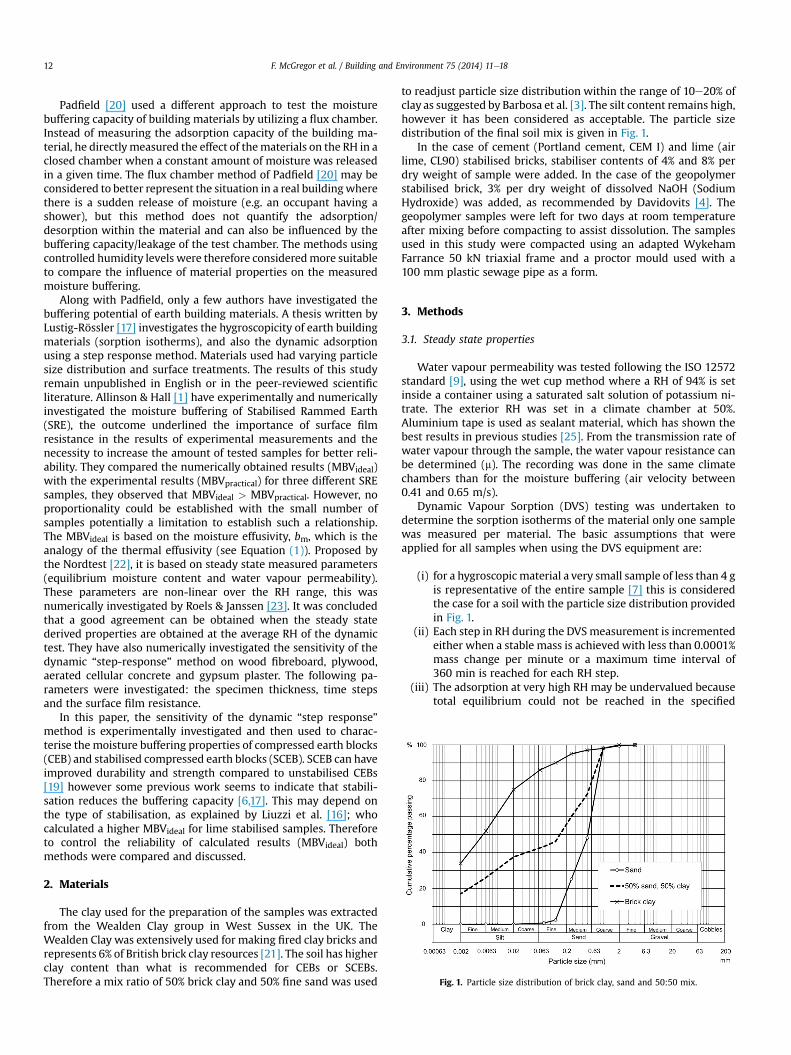
Fig. 1. Particle size distribution of brick clay, sand and 50:50 mix.
F. McGregor et al. / Building and Environment 75 (2014) 11e1812
Padfield [20] used a different approach to test the moisturebuffering capacity of building materials by utilizing a flux chamber.Instead of measuring the adsorption capacity of the building ma-terial, he directlymeasured the effect of thematerials on the RH in aclosed chamber when a constant amount of moisture was releasedin a given time. The flux chamber method of Padfield [20] may beconsidered to better represent the situation in a real buildingwherethere is a sudden release of moisture (e.g. an occupant having ashower), but this method does not quantify the adsorption/desorption within the material and can also be influenced by thebuffering capacity/leakage of the test chamber. The methods usingcontrolled humidity levels were therefore consideredmore suitableto compare the influence of material properties on the measuredmoisture buffering.
Along with Padfield, only a few authors have investigated thebuffering potential of earth building materials. A thesis written byLustig-Rössler [17] investigates the hygroscopicity of earth buildingmaterials (sorption isotherms), and also the dynamic adsorptionusing a step response method. Materials used had varying particlesize distribution and surface treatments. The results of this studyremain unpublished in English or in the peer-reviewed scientificliterature. Allinson & Hall [1] have experimentally and numericallyinvestigated the moisture buffering of Stabilised Rammed Earth(SRE), the outcome underlined the importance of surface filmresistance in the results of experimental measurements and thenecessity to increase the amount of tested samples for better reli-ability. They compared the numerically obtained results (MBVideal)with the experimental results (MBVpractical) for three different SREsamples, they observed that MBVideal > MBVpractical. However, noproportionality could be established with the small number ofsamples potentially a limitation to establish such a relationship.The MBVideal is based on the moisture effusivity, bm, which is theanalogy of the thermal effusivity (see Equation (1)). Proposed bythe Nordtest [22], it is based on steady state measured parameters(equilibrium moisture content and water vapour permeability).These parameters are non-linear over the RH range, this wasnumerically investigated by Roels & Janssen [23]. It was concludedthat a good agreement can be obtained when the steady statederived properties are obtained at the average RH of the dynamictest. They have also numerically investigated the sensitivity of thedynamic “step-response” method on wood fibreboard, plywood,aerated cellular concrete and gypsum plaster. The following pa-rameters were investigated: the specimen thickness, time stepsand the surface film resistance.
In this paper, the sensitivity of the dynamic “step response”method is experimentally investigated and then used to charac-terise the moisture buffering properties of compressed earth blocks(CEB) and stabilised compressed earth blocks (SCEB). SCEB can haveimproved durability and strength compared to unstabilised CEBs[19] however some previous work seems to indicate that stabili-sation reduces the buffering capacity [6,17]. This may depend onthe type of stabilisation, as explained by Liuzzi et al. [16]; whocalculated a higher MBVideal for lime stabilised samples. Thereforeto control the reliability of calculated results (MBVideal) bothmethods were compared and discussed.
2. Materials
The clay used for the preparation of the samples was extractedfrom the Wealden Clay group in West Sussex in the UK. TheWealden Clay was extensively used for making fired clay bricks andrepresents 6% of British brick clay resources [21]. The soil has higherclay content than what is recommended for CEBs or SCEBs.Therefore a mix ratio of 50% brick clay and 50% fine sand was used
to readjust particle size distribution within the range of 10e20% ofclay as suggested by Barbosa et al. [3]. The silt content remains high,however it has been considered as acceptable. The particle sizedistribution of the final soil mix is given in Fig. 1.
In the case of cement (Portland cement, CEM I) and lime (airlime, CL90) stabilised bricks, stabiliser contents of 4% and 8% perdry weight of sample were added. In the case of the geopolymerstabilised brick, 3% per dry weight of dissolved NaOH (SodiumHydroxide) was added, as recommended by Davidovits [4]. Thegeopolymer samples were left for two days at room temperatureafter mixing before compacting to assist dissolution. The samplesused in this study were compacted using an adapted WykehamFarrance 50 kN triaxial frame and a proctor mould used with a100 mm plastic sewage pipe as a form.
3. Methods
3.1. Steady state properties
Water vapour permeability was tested following the ISO 12572standard [9], using the wet cup method where a RH of 94% is setinside a container using a saturated salt solution of potassium ni-trate. The exterior RH was set in a climate chamber at 50%.Aluminium tape is used as sealant material, which has shown thebest results in previous studies [25]. From the transmission rate ofwater vapour through the sample, the water vapour resistance canbe determined (m). The recording was done in the same climatechambers than for the moisture buffering (air velocity between0.41 and 0.65 m/s).
Dynamic Vapour Sorption (DVS) testing was undertaken todetermine the sorption isotherms of the material only one samplewas measured per material. The basic assumptions that wereapplied for all samples when using the DVS equipment are:
(i) for a hygroscopic material a very small sample of less than 4 gis representative of the entire sample [7] this is consideredthe case for a soil with the particle size distribution providedin Fig. 1.
(ii) Each step in RH during the DVSmeasurement is incrementedeither when a stable mass is achieved with less than 0.0001%mass change per minute or a maximum time interval of360 min is reached for each RH step.
(iii) The adsorption at very high RH may be undervalued becausetotal equilibrium could not be reached in the specified
F. McGregor et al. / Building and Environment 75 (2014) 11e18 13
maximum time allocated, but this is not considered a prob-lem as these high humidity levels are unlikely to be achievedfor an extended period in a real building.
The same criteria were used for all samples to allow comparison.All the tests were carried out at 25 �C, with the exception of themoisture buffering test which was undertaken at 23 �C. Howeverthere should not be a major variation between 23 �C and 25 �C asmentionedbyKünzel [15]whoexplains that the effect of temperatureon moisture sorption between 20 �C and 70 �C can be disregarded.
3.2. Dynamic properties
Moisture buffering was measured in terms of water vapouradsorption in response to cyclic humidity variations. This was ac-cording to the recently published ISO 24353 standard [10] and theNordtest [22]. Both of the methods use gravimetric measurementsand they mainly vary in the procedure of the test, the time-stepsused, the humidity levels, and the sample sizes to use. There arevarious sets of RH levels proposed by both methods. Therefore thesoil samples were tested in different RH cycles and with varyingtime steps to compare the results. Table 1 summarises the differentcycles used.
The methods used are variations to the test methods proposedby the Nordtest, the ISO standard or the Japanese Industrial Stan-dard and were used to determine the effect of sample thickness,logging method, surface film resistance, RH levels, time steps andthe addition of stabiliser.
The MBV is calculated using the equation given by Rode et al.[22] and is based on experimental results. Previous studies [5] haveshown that the maximum cyclic moisture adsorption is lower onceit has reached a stable condition. Stable cycles are obtained whenthe samples are left to run in the step response test until the finalweight (end of cycle) of the sample was equal to the initial weight(beginning of cycle). This means the sample does not adsorb moremoisture than it will release. This equilibrium was usually reachedafter 5e10 days in the cycles depending on the initial conditions ofthe samples and was used for all testing.
3.3. Prediction of buffering capacity from steady-state properties
Previous studies have used the concept of MBVideal as proposedby the Nordtest to compare with experimental results or to deter-mine themost suitable buffering material [1,16]. These studies havementioned the limits of the MBVideal calculated from steady-statemeasured material properties when compared to experimentalresults.
Therefore the MBVideal has been calculated to compare with theexperimental results, as shown in Fig. 9. The equation given byRode et al. [22] was used to determine moisture effusivity, bm[kg/(m2 Pa s1/2)] which is provided in Table 2:
bm ¼ffiffiffiffiffiffiffiffiffiffiffiffiffiffiffiffiffiffidp$r0$
vuv4
psat
s(1)
where dp (kg/m s Pa) is the water vapour permeability, r0 (kg/m3) isthe dry density of the material, psat (Pa) is water vapour saturation
Table 1Humidity buffering control environment.
RH (%) Time step (h) Sources
85/50 8/16 Based on Nordtest and McGregor (2012)75/53 8/16 Based on ISO 24353 standard and Nordtest75/53 12/12 Based on ISO 24353 standard
pressure, at 23 �C. The moisture capacity (kg/kg) is determined bythe Equation (2):
x ¼ vuv4
(2)
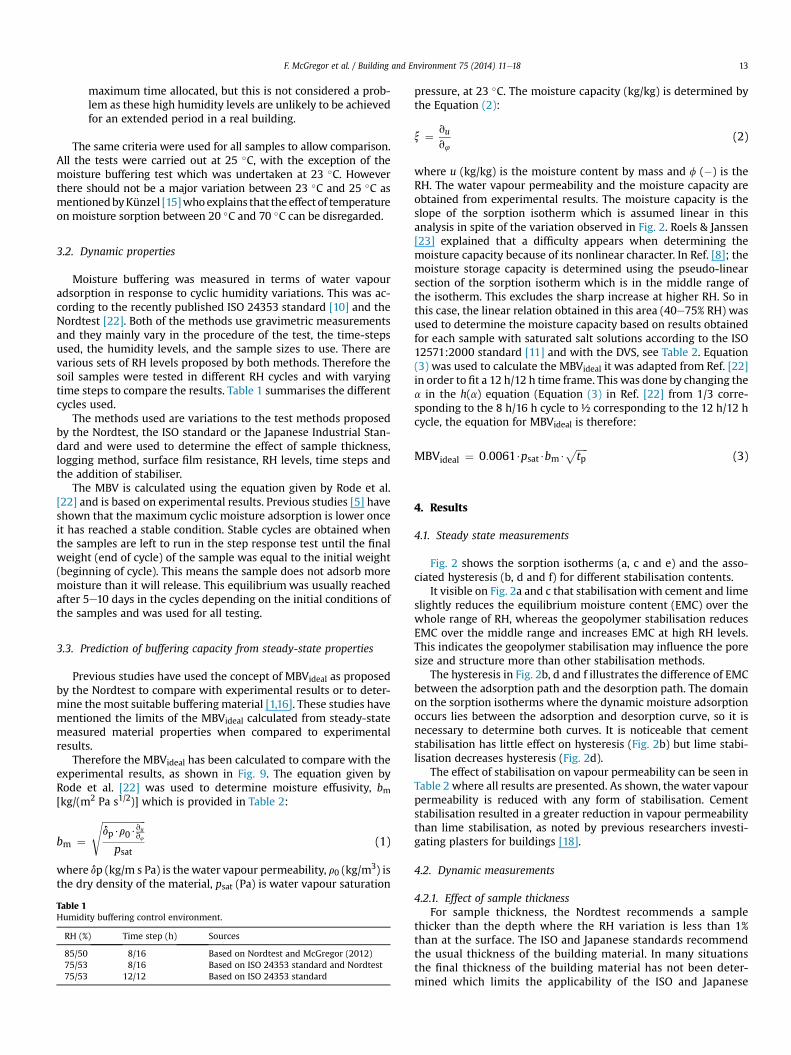
where u (kg/kg) is the moisture content by mass and f (�) is theRH. The water vapour permeability and the moisture capacity areobtained from experimental results. The moisture capacity is theslope of the sorption isotherm which is assumed linear in thisanalysis in spite of the variation observed in Fig. 2. Roels & Janssen[23] explained that a difficulty appears when determining themoisture capacity because of its nonlinear character. In Ref. [8]; themoisture storage capacity is determined using the pseudo-linearsection of the sorption isotherm which is in the middle range ofthe isotherm. This excludes the sharp increase at higher RH. So inthis case, the linear relation obtained in this area (40e75% RH) wasused to determine the moisture capacity based on results obtainedfor each sample with saturated salt solutions according to the ISO12571:2000 standard [11] and with the DVS, see Table 2. Equation(3) was used to calculate the MBVideal it was adapted from Ref. [22]in order to fit a 12 h/12 h time frame. This was done by changing thea in the h(a) equation (Equation (3) in Ref. [22] from 1/3 corre-sponding to the 8 h/16 h cycle to ½ corresponding to the 12 h/12 hcycle, the equation for MBVideal is therefore:
MBVideal ¼ 0:0061$psat$bm$ffiffiffiffiffitp
p(3)
4. Results
4.1. Steady state measurements
Fig. 2 shows the sorption isotherms (a, c and e) and the asso-ciated hysteresis (b, d and f) for different stabilisation contents.
It visible on Fig. 2a and c that stabilisationwith cement and limeslightly reduces the equilibrium moisture content (EMC) over thewhole range of RH, whereas the geopolymer stabilisation reducesEMC over the middle range and increases EMC at high RH levels.This indicates the geopolymer stabilisation may influence the poresize and structure more than other stabilisation methods.
The hysteresis in Fig. 2b, d and f illustrates the difference of EMCbetween the adsorption path and the desorption path. The domainon the sorption isotherms where the dynamic moisture adsorptionoccurs lies between the adsorption and desorption curve, so it isnecessary to determine both curves. It is noticeable that cementstabilisation has little effect on hysteresis (Fig. 2b) but lime stabi-lisation decreases hysteresis (Fig. 2d).
The effect of stabilisation on vapour permeability can be seen inTable 2 where all results are presented. As shown, the water vapourpermeability is reduced with any form of stabilisation. Cementstabilisation resulted in a greater reduction in vapour permeabilitythan lime stabilisation, as noted by previous researchers investi-gating plasters for buildings [18].
4.2. Dynamic measurements
4.2.1. Effect of sample thicknessFor sample thickness, the Nordtest recommends a sample
thicker than the depth where the RH variation is less than 1%than at the surface. The ISO and Japanese standards recommendthe usual thickness of the building material. In many situationsthe final thickness of the building material has not been deter-mined which limits the applicability of the ISO and Japanese
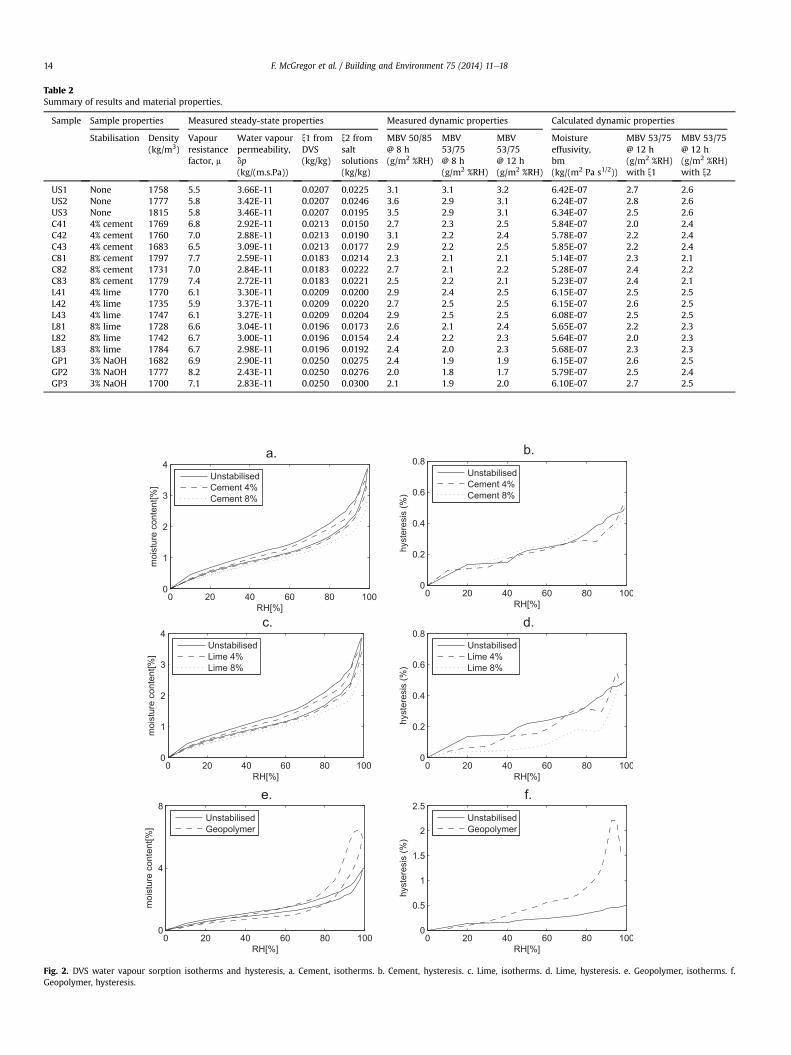
Table 2Summary of results and material properties.
Sample Sample properties Measured steady-state properties Measured dynamic properties Calculated dynamic properties
Stabilisation Density(kg/m3)
Vapourresistancefactor, m
Water vapourpermeability,dp(kg/(m.s.Pa))
x1 fromDVS(kg/kg)
x2 fromsaltsolutions(kg/kg)
MBV 50/85@ 8 h(g/m2 %RH)
MBV53/75@ 8 h(g/m2 %RH)
MBV53/75@ 12 h(g/m2 %RH)
Moistureeffusivity,bm(kg/(m2 Pa s1/2))
MBV 53/75@ 12 h(g/m2 %RH)with x1
MBV 53/75@ 12 h(g/m2 %RH)with x2
US1 None 1758 5.5 3.66E-11 0.0207 0.0225 3.1 3.1 3.2 6.42E-07 2.7 2.6US2 None 1777 5.8 3.42E-11 0.0207 0.0246 3.6 2.9 3.1 6.24E-07 2.8 2.6US3 None 1815 5.8 3.46E-11 0.0207 0.0195 3.5 2.9 3.1 6.34E-07 2.5 2.6C41 4% cement 1769 6.8 2.92E-11 0.0213 0.0150 2.7 2.3 2.5 5.84E-07 2.0 2.4C42 4% cement 1760 7.0 2.88E-11 0.0213 0.0190 3.1 2.2 2.4 5.78E-07 2.2 2.4C43 4% cement 1683 6.5 3.09E-11 0.0213 0.0177 2.9 2.2 2.5 5.85E-07 2.2 2.4C81 8% cement 1797 7.7 2.59E-11 0.0183 0.0214 2.3 2.1 2.1 5.14E-07 2.3 2.1C82 8% cement 1731 7.0 2.84E-11 0.0183 0.0222 2.7 2.1 2.2 5.28E-07 2.4 2.2C83 8% cement 1779 7.4 2.72E-11 0.0183 0.0221 2.5 2.2 2.1 5.23E-07 2.4 2.1L41 4% lime 1770 6.1 3.30E-11 0.0209 0.0200 2.9 2.4 2.5 6.15E-07 2.5 2.5L42 4% lime 1735 5.9 3.37E-11 0.0209 0.0220 2.7 2.5 2.5 6.15E-07 2.6 2.5L43 4% lime 1747 6.1 3.27E-11 0.0209 0.0204 2.9 2.5 2.5 6.08E-07 2.5 2.5L81 8% lime 1728 6.6 3.04E-11 0.0196 0.0173 2.6 2.1 2.4 5.65E-07 2.2 2.3L82 8% lime 1742 6.7 3.00E-11 0.0196 0.0154 2.4 2.2 2.3 5.64E-07 2.0 2.3L83 8% lime 1784 6.7 2.98E-11 0.0196 0.0192 2.4 2.0 2.3 5.68E-07 2.3 2.3GP1 3% NaOH 1682 6.9 2.90E-11 0.0250 0.0275 2.4 1.9 1.9 6.15E-07 2.6 2.5GP2 3% NaOH 1777 8.2 2.43E-11 0.0250 0.0276 2.0 1.8 1.7 5.79E-07 2.5 2.4GP3 3% NaOH 1700 7.1 2.83E-11 0.0250 0.0300 2.1 1.9 2.0 6.10E-07 2.7 2.5
Fig. 2. DVS water vapour sorption isotherms and hysteresis, a. Cement, isotherms. b. Cement, hysteresis. c. Lime, isotherms. d. Lime, hysteresis. e. Geopolymer, isotherms. f.Geopolymer, hysteresis.
F. McGregor et al. / Building and Environment 75 (2014) 11e1814
F. McGregor et al. / Building and Environment 75 (2014) 11e18 15
Standards. For this study, sample thicknesses of 30 mm, 50 mmand 70 mm have been tested. For this series of tests, the densityand initial (compaction) moisture content were kept as constantas possible. As no significant difference can be observed asshown in Fig. 3, it has been concluded that the thickness is not alimiting factor and that 30 mm is greater than the penetrationdepth during one daily cycle. All samples were therefore pre-pared at 30 mm to characterise the moisture buffering of thisparticular soil.
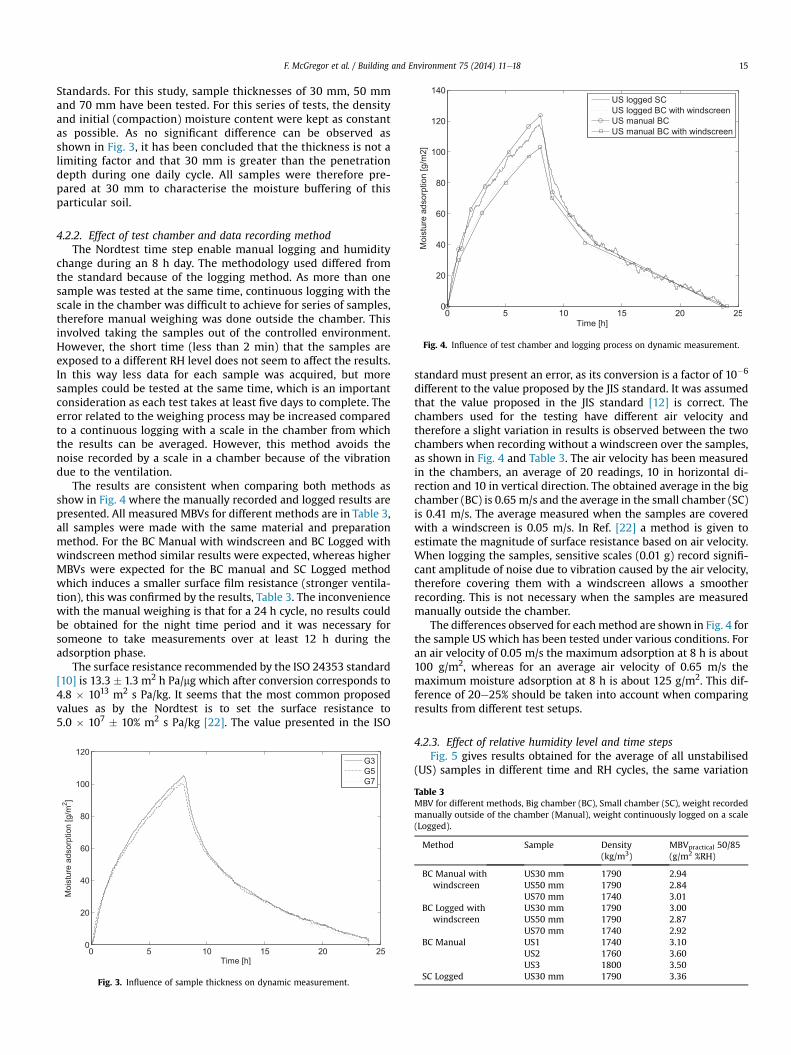
Fig. 4. Influence of test chamber and logging process on dynamic measurement.
4.2.2. Effect of test chamber and data recording methodThe Nordtest time step enable manual logging and humidity
change during an 8 h day. The methodology used differed fromthe standard because of the logging method. As more than onesample was tested at the same time, continuous logging with thescale in the chamber was difficult to achieve for series of samples,therefore manual weighing was done outside the chamber. Thisinvolved taking the samples out of the controlled environment.However, the short time (less than 2 min) that the samples areexposed to a different RH level does not seem to affect the results.In this way less data for each sample was acquired, but moresamples could be tested at the same time, which is an importantconsideration as each test takes at least five days to complete. Theerror related to the weighing process may be increased comparedto a continuous logging with a scale in the chamber from whichthe results can be averaged. However, this method avoids thenoise recorded by a scale in a chamber because of the vibrationdue to the ventilation.
The results are consistent when comparing both methods asshow in Fig. 4 where the manually recorded and logged results arepresented. All measured MBVs for different methods are in Table 3,all samples were made with the same material and preparationmethod. For the BC Manual with windscreen and BC Logged withwindscreen method similar results were expected, whereas higherMBVs were expected for the BC manual and SC Logged methodwhich induces a smaller surface film resistance (stronger ventila-tion), this was confirmed by the results, Table 3. The inconveniencewith the manual weighing is that for a 24 h cycle, no results couldbe obtained for the night time period and it was necessary forsomeone to take measurements over at least 12 h during theadsorption phase.
The surface resistance recommended by the ISO 24353 standard[10] is 13.3 � 1.3 m2 h Pa/mg which after conversion corresponds to4.8 � 1013 m2 s Pa/kg. It seems that the most common proposedvalues as by the Nordtest is to set the surface resistance to5.0 � 107 � 10% m2 s Pa/kg [22]. The value presented in the ISO
Fig. 3. Influence of sample thickness on dynamic measurement.
standard must present an error, as its conversion is a factor of 10�6
different to the value proposed by the JIS standard. It was assumedthat the value proposed in the JIS standard [12] is correct. Thechambers used for the testing have different air velocity andtherefore a slight variation in results is observed between the twochambers when recording without a windscreen over the samples,as shown in Fig. 4 and Table 3. The air velocity has been measuredin the chambers, an average of 20 readings, 10 in horizontal di-rection and 10 in vertical direction. The obtained average in the bigchamber (BC) is 0.65 m/s and the average in the small chamber (SC)is 0.41 m/s. The average measured when the samples are coveredwith a windscreen is 0.05 m/s. In Ref. [22] a method is given toestimate the magnitude of surface resistance based on air velocity.When logging the samples, sensitive scales (0.01 g) record signifi-cant amplitude of noise due to vibration caused by the air velocity,therefore covering them with a windscreen allows a smootherrecording. This is not necessary when the samples are measuredmanually outside the chamber.
The differences observed for eachmethod are shown in Fig. 4 forthe sample US which has been tested under various conditions. Foran air velocity of 0.05 m/s the maximum adsorption at 8 h is about100 g/m2, whereas for an average air velocity of 0.65 m/s themaximum moisture adsorption at 8 h is about 125 g/m2. This dif-ference of 20e25% should be taken into account when comparingresults from different test setups.
4.2.3. Effect of relative humidity level and time stepsFig. 5 gives results obtained for the average of all unstabilised
(US) samples in different time and RH cycles, the same variation
Table 3MBV for different methods, Big chamber (BC), Small chamber (SC), weight recordedmanually outside of the chamber (Manual), weight continuously logged on a scale(Logged).
Method Sample Density(kg/m3)
MBVpractical 50/85(g/m2 %RH)
BC Manual withwindscreen
US30 mm 1790 2.94US50 mm 1790 2.84US70 mm 1740 3.01
BC Logged withwindscreen
US30 mm 1790 3.00US50 mm 1790 2.87US70 mm 1740 2.92
BC Manual US1 1740 3.10US2 1760 3.60US3 1800 3.50
SC Logged US30 mm 1790 3.36
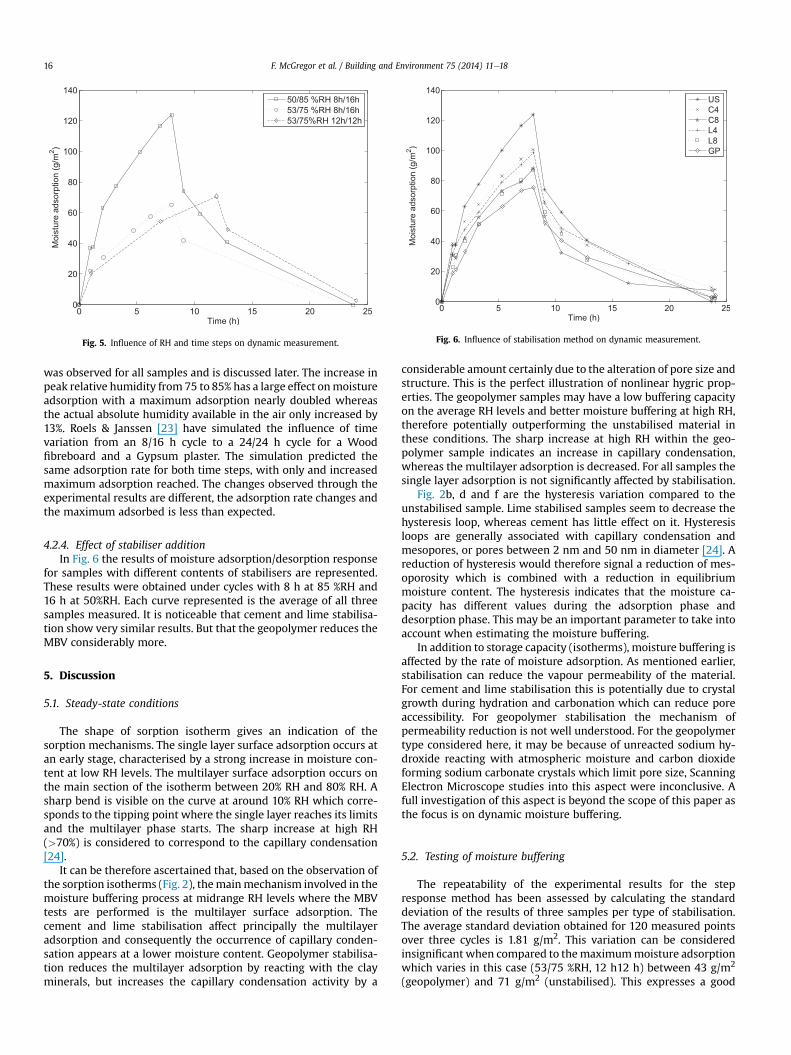
Fig. 5. Influence of RH and time steps on dynamic measurement. Fig. 6. Influence of stabilisation method on dynamic measurement.
F. McGregor et al. / Building and Environment 75 (2014) 11e1816
was observed for all samples and is discussed later. The increase inpeak relative humidity from 75 to 85% has a large effect onmoistureadsorption with a maximum adsorption nearly doubled whereasthe actual absolute humidity available in the air only increased by13%. Roels & Janssen [23] have simulated the influence of timevariation from an 8/16 h cycle to a 24/24 h cycle for a Woodfibreboard and a Gypsum plaster. The simulation predicted thesame adsorption rate for both time steps, with only and increasedmaximum adsorption reached. The changes observed through theexperimental results are different, the adsorption rate changes andthe maximum adsorbed is less than expected.
4.2.4. Effect of stabiliser additionIn Fig. 6 the results of moisture adsorption/desorption response
for samples with different contents of stabilisers are represented.These results were obtained under cycles with 8 h at 85 %RH and16 h at 50%RH. Each curve represented is the average of all threesamples measured. It is noticeable that cement and lime stabilisa-tion show very similar results. But that the geopolymer reduces theMBV considerably more.
5. Discussion
5.1. Steady-state conditions
The shape of sorption isotherm gives an indication of thesorption mechanisms. The single layer surface adsorption occurs atan early stage, characterised by a strong increase in moisture con-tent at low RH levels. The multilayer surface adsorption occurs onthe main section of the isotherm between 20% RH and 80% RH. Asharp bend is visible on the curve at around 10% RH which corre-sponds to the tipping point where the single layer reaches its limitsand the multilayer phase starts. The sharp increase at high RH(>70%) is considered to correspond to the capillary condensation[24].
It can be therefore ascertained that, based on the observation ofthe sorption isotherms (Fig. 2), themainmechanism involved in themoisture buffering process at midrange RH levels where the MBVtests are performed is the multilayer surface adsorption. Thecement and lime stabilisation affect principally the multilayeradsorption and consequently the occurrence of capillary conden-sation appears at a lower moisture content. Geopolymer stabilisa-tion reduces the multilayer adsorption by reacting with the clayminerals, but increases the capillary condensation activity by a
considerable amount certainly due to the alteration of pore size andstructure. This is the perfect illustration of nonlinear hygric prop-erties. The geopolymer samples may have a low buffering capacityon the average RH levels and better moisture buffering at high RH,therefore potentially outperforming the unstabilised material inthese conditions. The sharp increase at high RH within the geo-polymer sample indicates an increase in capillary condensation,whereas the multilayer adsorption is decreased. For all samples thesingle layer adsorption is not significantly affected by stabilisation.
Fig. 2b, d and f are the hysteresis variation compared to theunstabilised sample. Lime stabilised samples seem to decrease thehysteresis loop, whereas cement has little effect on it. Hysteresisloops are generally associated with capillary condensation andmesopores, or pores between 2 nm and 50 nm in diameter [24]. Areduction of hysteresis would therefore signal a reduction of mes-oporosity which is combined with a reduction in equilibriummoisture content. The hysteresis indicates that the moisture ca-pacity has different values during the adsorption phase anddesorption phase. This may be an important parameter to take intoaccount when estimating the moisture buffering.
In addition to storage capacity (isotherms), moisture buffering isaffected by the rate of moisture adsorption. As mentioned earlier,stabilisation can reduce the vapour permeability of the material.For cement and lime stabilisation this is potentially due to crystalgrowth during hydration and carbonation which can reduce poreaccessibility. For geopolymer stabilisation the mechanism ofpermeability reduction is not well understood. For the geopolymertype considered here, it may be because of unreacted sodium hy-droxide reacting with atmospheric moisture and carbon dioxideforming sodium carbonate crystals which limit pore size, ScanningElectron Microscope studies into this aspect were inconclusive. Afull investigation of this aspect is beyond the scope of this paper asthe focus is on dynamic moisture buffering.
5.2. Testing of moisture buffering
The repeatability of the experimental results for the stepresponse method has been assessed by calculating the standarddeviation of the results of three samples per type of stabilisation.The average standard deviation obtained for 120 measured pointsover three cycles is 1.81 g/m2. This variation can be consideredinsignificant when compared to themaximummoisture adsorptionwhich varies in this case (53/75 %RH, 12 h12 h) between 43 g/m2
(geopolymer) and 71 g/m2 (unstabilised). This expresses a good
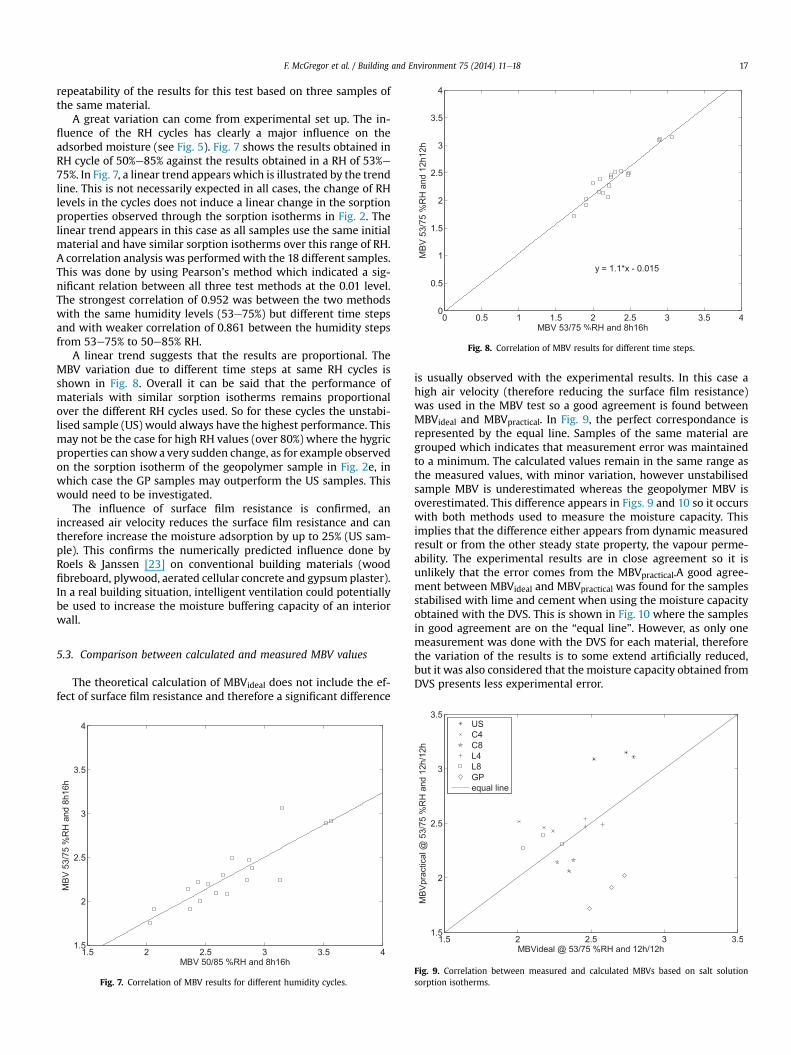
Fig. 8. Correlation of MBV results for different time steps.
F. McGregor et al. / Building and Environment 75 (2014) 11e18 17
repeatability of the results for this test based on three samples ofthe same material.
A great variation can come from experimental set up. The in-fluence of the RH cycles has clearly a major influence on theadsorbed moisture (see Fig. 5). Fig. 7 shows the results obtained inRH cycle of 50%e85% against the results obtained in a RH of 53%e75%. In Fig. 7, a linear trend appears which is illustrated by the trendline. This is not necessarily expected in all cases, the change of RHlevels in the cycles does not induce a linear change in the sorptionproperties observed through the sorption isotherms in Fig. 2. Thelinear trend appears in this case as all samples use the same initialmaterial and have similar sorption isotherms over this range of RH.A correlation analysis was performedwith the 18 different samples.This was done by using Pearson’s method which indicated a sig-nificant relation between all three test methods at the 0.01 level.The strongest correlation of 0.952 was between the two methodswith the same humidity levels (53e75%) but different time stepsand with weaker correlation of 0.861 between the humidity stepsfrom 53e75% to 50e85% RH.
A linear trend suggests that the results are proportional. TheMBV variation due to different time steps at same RH cycles isshown in Fig. 8. Overall it can be said that the performance ofmaterials with similar sorption isotherms remains proportionalover the different RH cycles used. So for these cycles the unstabi-lised sample (US) would always have the highest performance. Thismay not be the case for high RH values (over 80%) where the hygricproperties can showa very sudden change, as for example observedon the sorption isotherm of the geopolymer sample in Fig. 2e, inwhich case the GP samples may outperform the US samples. Thiswould need to be investigated.
The influence of surface film resistance is confirmed, anincreased air velocity reduces the surface film resistance and cantherefore increase the moisture adsorption by up to 25% (US sam-ple). This confirms the numerically predicted influence done byRoels & Janssen [23] on conventional building materials (woodfibreboard, plywood, aerated cellular concrete and gypsum plaster).In a real building situation, intelligent ventilation could potentiallybe used to increase the moisture buffering capacity of an interiorwall.
5.3. Comparison between calculated and measured MBV values
The theoretical calculation of MBVideal does not include the ef-fect of surface film resistance and therefore a significant difference
Fig. 7. Correlation of MBV results for different humidity cycles.
is usually observed with the experimental results. In this case ahigh air velocity (therefore reducing the surface film resistance)was used in the MBV test so a good agreement is found betweenMBVideal and MBVpractical. In Fig. 9, the perfect correspondance isrepresented by the equal line. Samples of the same material aregrouped which indicates that measurement error was maintainedto a minimum. The calculated values remain in the same range asthe measured values, with minor variation, however unstabilisedsample MBV is underestimated whereas the geopolymer MBV isoverestimated. This difference appears in Figs. 9 and 10 so it occurswith both methods used to measure the moisture capacity. Thisimplies that the difference either appears from dynamic measuredresult or from the other steady state property, the vapour perme-ability. The experimental results are in close agreement so it isunlikely that the error comes from the MBVpractical.A good agree-ment between MBVideal and MBVpractical was found for the samplesstabilised with lime and cement when using the moisture capacityobtained with the DVS. This is shown in Fig. 10 where the samplesin good agreement are on the “equal line”. However, as only onemeasurement was done with the DVS for each material, thereforethe variation of the results is to some extend artificially reduced,but it was also considered that the moisture capacity obtained fromDVS presents less experimental error.
Fig. 9. Correlation between measured and calculated MBVs based on salt solutionsorption isotherms.
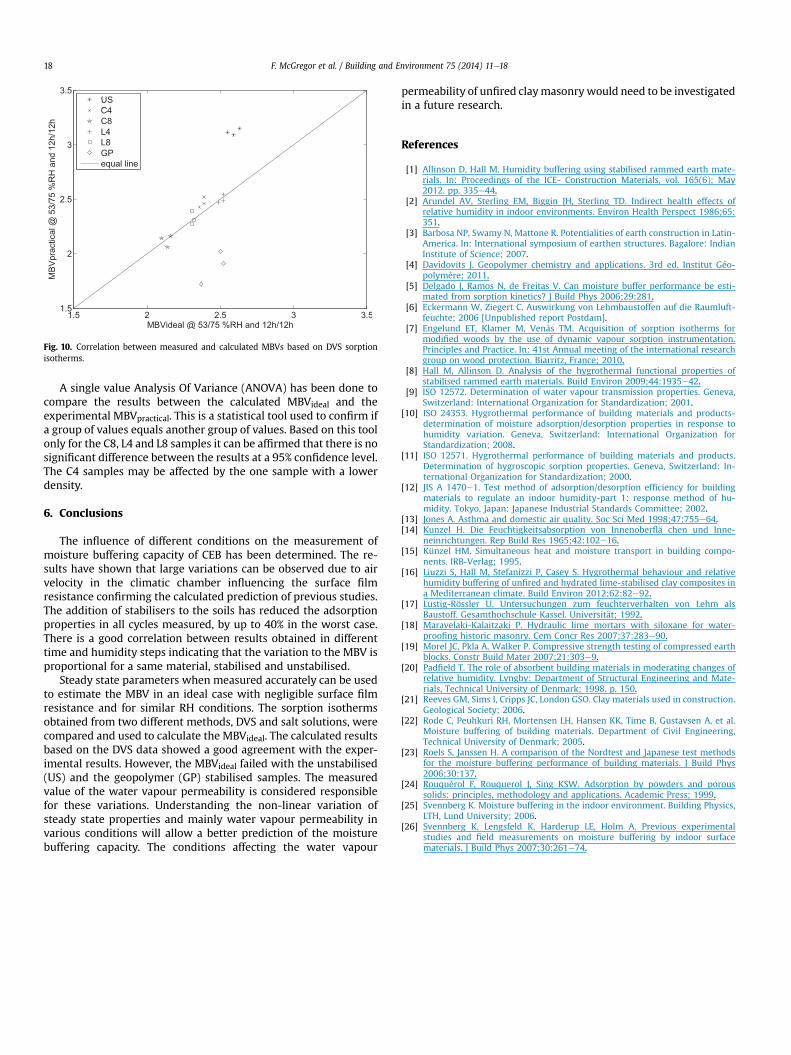
Fig. 10. Correlation between measured and calculated MBVs based on DVS sorptionisotherms.
F. McGregor et al. / Building and Environment 75 (2014) 11e1818
A single value Analysis Of Variance (ANOVA) has been done tocompare the results between the calculated MBVideal and theexperimental MBVpractical. This is a statistical tool used to confirm ifa group of values equals another group of values. Based on this toolonly for the C8, L4 and L8 samples it can be affirmed that there is nosignificant difference between the results at a 95% confidence level.The C4 samples may be affected by the one sample with a lowerdensity.
6. Conclusions
The influence of different conditions on the measurement ofmoisture buffering capacity of CEB has been determined. The re-sults have shown that large variations can be observed due to airvelocity in the climatic chamber influencing the surface filmresistance confirming the calculated prediction of previous studies.The addition of stabilisers to the soils has reduced the adsorptionproperties in all cycles measured, by up to 40% in the worst case.There is a good correlation between results obtained in differenttime and humidity steps indicating that the variation to the MBV isproportional for a same material, stabilised and unstabilised.
Steady state parameters when measured accurately can be usedto estimate the MBV in an ideal case with negligible surface filmresistance and for similar RH conditions. The sorption isothermsobtained from two different methods, DVS and salt solutions, werecompared and used to calculate the MBVideal. The calculated resultsbased on the DVS data showed a good agreement with the exper-imental results. However, the MBVideal failed with the unstabilised(US) and the geopolymer (GP) stabilised samples. The measuredvalue of the water vapour permeability is considered responsiblefor these variations. Understanding the non-linear variation ofsteady state properties and mainly water vapour permeability invarious conditions will allow a better prediction of the moisturebuffering capacity. The conditions affecting the water vapour
permeability of unfired claymasonrywould need to be investigatedin a future research.
References
[1] Allinson D, Hall M. Humidity buffering using stabilised rammed earth mate-rials. In: Proceedings of the ICE- Construction Materials, vol. 165(6); May2012. pp. 335e44.
[2] Arundel AV, Sterling EM, Biggin JH, Sterling TD. Indirect health effects ofrelative humidity in indoor environments. Environ Health Perspect 1986;65:351.
[3] Barbosa NP, Swamy N, Mattone R. Potentialities of earth construction in Latin-America. In: International symposium of earthen structures. Bagalore: IndianInstitute of Science; 2007.
[4] Davidovits J. Geopolymer chemistry and applications. 3rd ed. Institut Géo-polymère; 2011.
[5] Delgado J, Ramos N, de Freitas V. Can moisture buffer performance be esti-mated from sorption kinetics? J Build Phys 2006;29:281.
[6] Eckermann W, Ziegert C. Auswirkung von Lehmbaustoffen auf die Raumluft-feuchte; 2006 [Unpublished report Postdam].
[7] Engelund ET, Klamer M, Venås TM. Acquisition of sorption isotherms formodified woods by the use of dynamic vapour sorption instrumentation.Principles and Practice. In: 41st Annual meeting of the international researchgroup on wood protection. Biarritz, France; 2010.
[8] Hall M, Allinson D. Analysis of the hygrothermal functional properties ofstabilised rammed earth materials. Build Environ 2009;44:1935e42.
[9] ISO 12572. Determination of water vapour transmission properties. Geneva,Switzerland: International Organization for Standardization; 2001.
[10] ISO 24353. Hygrothermal performance of building materials and products-determination of moisture adsorption/desorption properties in response tohumidity variation. Geneva, Switzerland: International Organization forStandardization; 2008.
[11] ISO 12571. Hygrothermal performance of building materials and products.Determination of hygroscopic sorption properties. Geneva, Switzerland: In-ternational Organization for Standardization; 2000.
[12] JIS A 1470e1. Test method of adsorption/desorption efficiency for buildingmaterials to regulate an indoor humidity-part 1: response method of hu-midity. Tokyo, Japan: Japanese Industrial Standards Committee; 2002.
[13] Jones A. Asthma and domestic air quality. Soc Sci Med 1998;47:755e64.[14] Kunzel H. Die Feuchtigkeitsabsorption von Innenoberflä chen und Inne-
neinrichtungen. Rep Build Res 1965;42:102e16.[15] Künzel HM. Simultaneous heat and moisture transport in building compo-
nents. IRB-Verlag; 1995.[16] Liuzzi S, Hall M, Stefanizzi P, Casey S. Hygrothermal behaviour and relative
humidity buffering of unfired and hydrated lime-stabilised clay composites ina Mediterranean climate. Build Environ 2012;62:82e92.
[17] Lustig-Rössler U. Untersuchungen zum feuchterverhalten von Lehm alsBaustoff. Gesamthochschule Kassel. Universität; 1992.
[18] Maravelaki-Kalaitzaki P. Hydraulic lime mortars with siloxane for water-proofing historic masonry. Cem Concr Res 2007;37:283e90.
[19] Morel JC, Pkla A, Walker P. Compressive strength testing of compressed earthblocks. Constr Build Mater 2007;21:303e9.
[20] Padfield T. The role of absorbent building materials in moderating changes ofrelative humidity. Lyngby: Department of Structural Engineering and Mate-rials, Technical University of Denmark; 1998. p. 150.
[21] Reeves GM, Sims I, Cripps JC, London GSO. Clay materials used in construction.Geological Society; 2006.
[22] Rode C, Peuhkuri RH, Mortensen LH, Hansen KK, Time B, Gustavsen A, et al.Moisture buffering of building materials. Department of Civil Engineering,Technical University of Denmark; 2005.
[23] Roels S, Janssen H. A comparison of the Nordtest and Japanese test methodsfor the moisture buffering performance of building materials. J Build Phys2006;30:137.
[24] Rouquérol F, Rouquerol J, Sing KSW. Adsorption by powders and poroussolids: principles, methodology and applications. Academic Press; 1999.
[25] Svennberg K. Moisture buffering in the indoor environment. Building Physics,LTH, Lund University; 2006.
[26] Svennberg K, Lengsfeld K, Harderup LE, Holm A. Previous experimentalstudies and field measurements on moisture buffering by indoor surfacematerials. J Build Phys 2007;30:261e74.
Related Documents