Condition Monitoring of a Large‐ scale PV Power Plant in Australia Amit Dhoke The University of Queensland, Australia [email protected], [email protected], [email protected] 1 Paper No: 16PESGM2224

Welcome message from author
This document is posted to help you gain knowledge. Please leave a comment to let me know what you think about it! Share it to your friends and learn new things together.
Transcript

Condition Monitoring of a Large‐scale PV Power Plant in Australia
Amit DhokeThe University of Queensland, Australia
[email protected], [email protected], [email protected]
1
Paper No: 16PESGM2224

Outline
• Background• System Review• System Modelling• Methodology• Simulation Results• Conclusions
2

Global Photovoltaic (PV) Penetration
3
• PV generation in Australia increased from 12 MWp to 5 GWp during last 9 years.
* Global demand for PV installation - 2004 to 2020
Solar star PV Plant, USA – 579 MWp
* www.greentechmedia.com

How PV system works?4
Connection topologies of the PV array. (a) Series array,(b) parallel array, (c) series-parallel array, (d) total-crosstied array, (e) bridge-link array and (f) honey-comb array.
(1) http://solar.smps.us/off-grid.html (2) http://www.yourhome.gov.au/energy/photovoltaic-systems (3) https://www.researchgate.net
(1)
(2)
(3)

Research Motivation5
Fire incident occurred 1 MWp Mount Holly, North Carolina, USA
• Conventional monitoring methodsare inefficient in large-scale PVfault detection.
• Most occurring incipient faultsand blind spots remain hidden inPV system.
• UQ Centre was affected due to2011 hailstorm and resulted inblind spots.
• UQ’s Prentice Building has stringfailure issue and it was there for10 months.
Fire incident occurred in 383 KWp Bakersfield, California, USA
UQ : The University of Queensland, Brisbane, Queensland, Australia
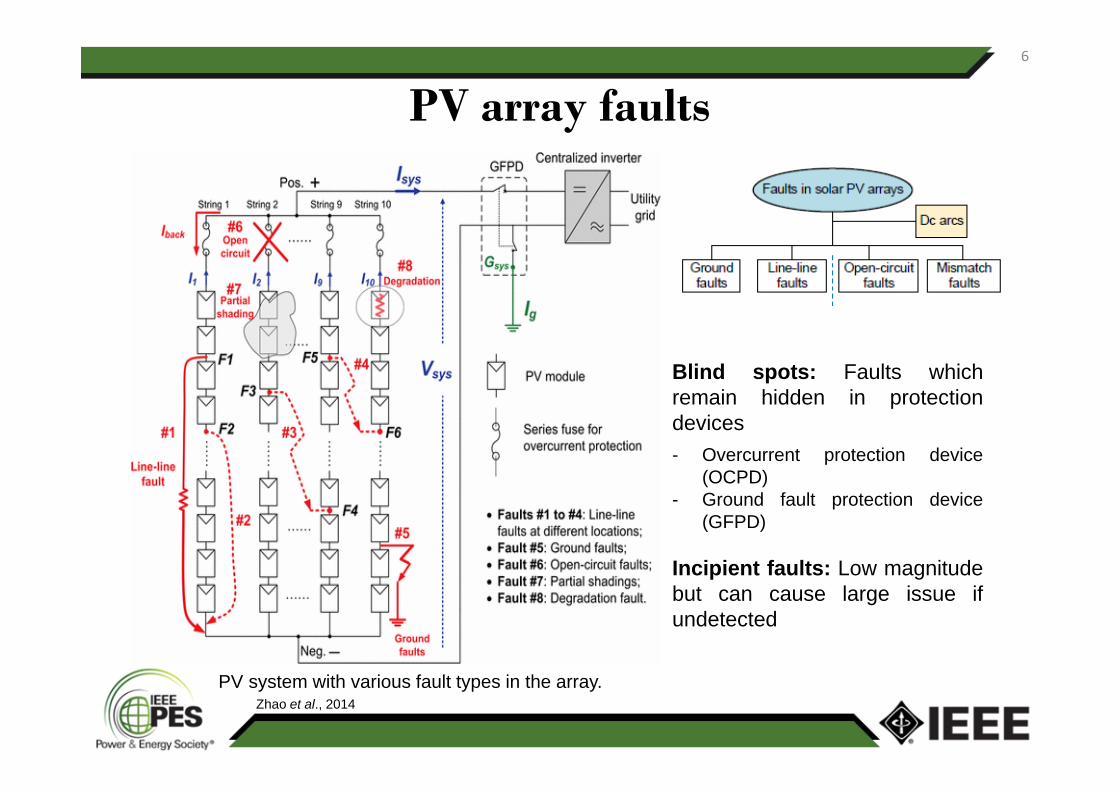
PV array faults6
PV system with various fault types in the array.
Blind spots: Faults whichremain hidden in protectiondevices- Overcurrent protection device
(OCPD)- Ground fault protection device
(GFPD)
Incipient faults: Low magnitudebut can cause large issue ifundetected
Zhao et al., 2014

PV system condition monitoring7
(1)
Block diagram of a PV array monitoring system Levels of PV system monitoring
Solar PV condition monitoring is the process of monitoring the condition of a PVsystem with the intent to analyse performance, detect operational issues and faults.
(1)
(1) http://www.renewableenergyworld.com/articles/print/rewna/solar-energy/solar-electric-facility-o-m-now-comes-the-hard-part.html

Model-based PV Output Prediction8
. ( )
. ( ) (1 ( )) / 2
[ ( ) ( ) ( ) ( ) ( )]-1
G H I D N I cos z D H I
PO AI D N I cos AO I D H I cos
AO I cos cos z cos sin z sin cos A
[ ( ) ( )] / ( )-1A s in co s s in w s in zWhere,
. .
. . .[1 ( 25)] / 1000
. .[1 ( 25)][ . ( / 1000)]
( . ) / ( ) ( . / )
oc p ocp m
m
out sc oc
sc s scp m
P I V FF
I N POAI I T
V N V T 1 ln POAI
FF a b POAI c ln POAI T d e POAI f POAI
Power calculations
Plane of Array Irradiance Calculations
GHI- Global Horizontal Irradiance DNI- Direct Normal Irradiance POAI- Plane of Array Irradiance AOI- Angle of IncidencePout- Power output Isc- Short circuit current Voc- Open circuit voltage FF- Fill factor
Block diagram of prediction model
This model has been utilised to detect faults using existing methods.
Field parameters

Proposed condition monitoring system
Condition Monitoring
Fault Detection
Irradiance
Temperature
String 1String 2
String n
GHI
Ta
String 1
String 2
String n
Health statusM
easu
red
para
met
ers
9
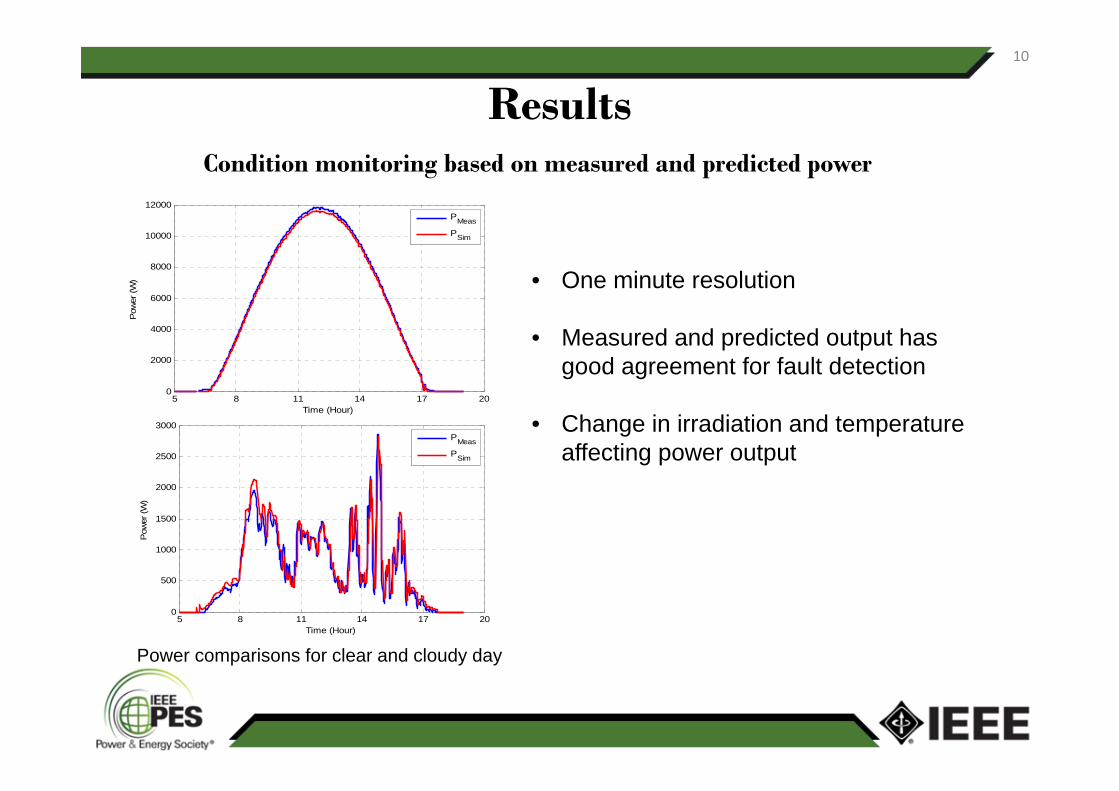
Condition monitoring based on measured and predicted power
10
5 8 11 14 17 200
2000
4000
6000
8000
10000
12000
Time (Hour)
Pow
er (W
)
PMeas
PSim
5 8 11 14 17 200
500
1000
1500
2000
2500
3000
Time (Hour)
Pow
er (W
)
PMeas
PSim
Power comparisons for clear and cloudy day
Results
• One minute resolution
• Measured and predicted output has good agreement for fault detection
• Change in irradiation and temperature affecting power output
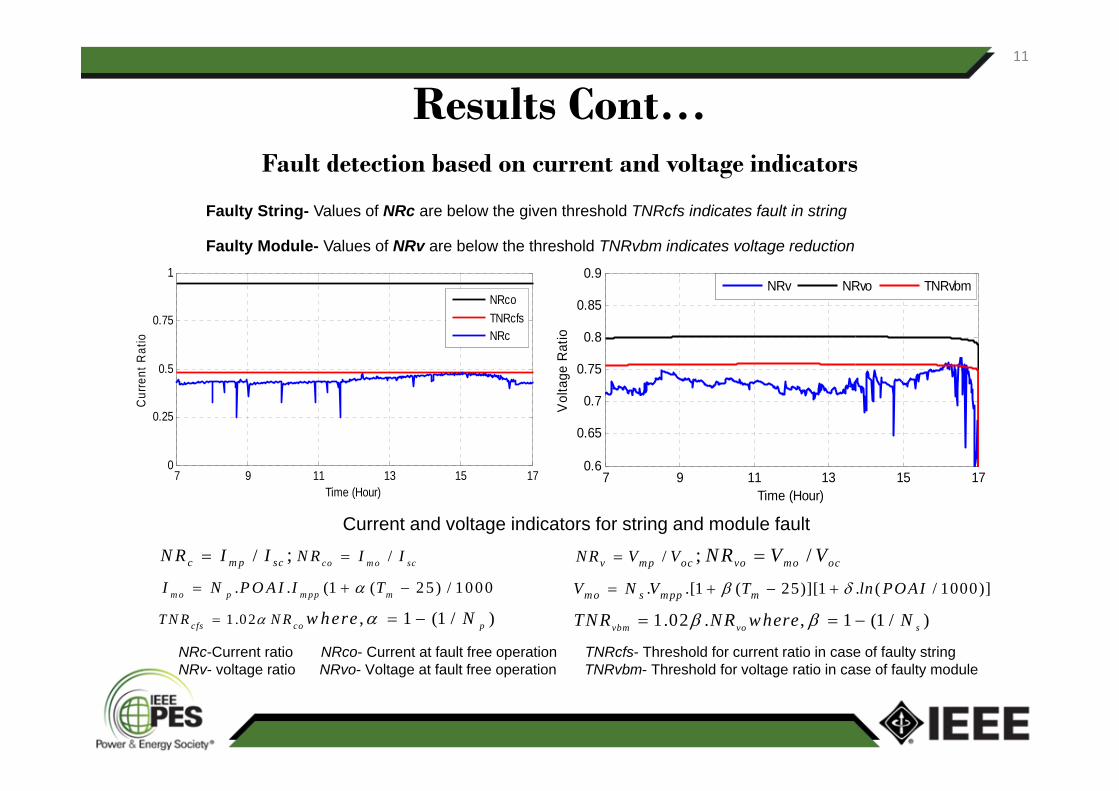
Fault detection based on current and voltage indicators
11
Faulty String- Values of NRc are below the given threshold TNRcfs indicates fault in string
Faulty Module- Values of NRv are below the threshold TNRvbm indicates voltage reduction
Results Cont…
7 9 11 13 15 170
0.25
0.5
0.75
1
Time (Hour)
Cur
rent
Rat
io
NRcoTNRcfsNRc
7 9 11 13 15 170.6
0.65
0.7
0.75
0.8
0.85
0.9
Time (Hour)
Vol
tage
Rat
io
NRv NRvo TNRvbm
Current and voltage indicators for string and module fault
1 .02
/
. . (1 ( 25) / 1000
/
, 1 (1 / )
; co m o sc
m o p m pp m
cfs co p
c m p sc
TN R N R
N R I I
I N P O A I I T
N R I I
w here N
/
. .[1 ( 25)][1 . ( / 1000)]
1.02 . , 1 (1 / )
; /
vbm vo s
v mp oc vo mo oc
mo s mpp m
NR V V
V N V T ln POAI
TNR NR where N
NR V V
NRc-Current ratio NRco- Current at fault free operation TNRcfs- Threshold for current ratio in case of faulty stringNRv- voltage ratio NRvo- Voltage at fault free operation TNRvbm- Threshold for voltage ratio in case of faulty module

Results Cont…12
Current, Voltage and Power indicators for fault-free and string fault condition
/
//
o c m o m p p
o v m o m p p
o p s im m e a s
R I I
R P PR V V
7 9 11 13 15 170
1
2
3
4
5
Time (Hour)
Rat
io
RocRovRop
7 9 11 13 15 170.6
0.9
1.2
1.5
Time (Hour)
Rat
io
RocRovRop
Roc, Rov and Rop are ratio of predicted and measured current, voltage and power respectively
Imo, Vmo and Psim are predicted current, voltage and power respectively
Impp, Vmpp and Pmeas are measured current, voltage and power respectively
Fault Free Operation- All three current, voltage and power ratios are nearly same
Faulty String- Difference in Roc and Rov caused due to string fault
Fault detection based on parameter comparison

Results Cont…13
String Mean Value (µ) Std. Deviation (σ)
String 1 8.31 5.81
String 2 4.21 2.96
5 8 11 14 17 200
3
6
9
12
15
18
Time (Hour)
Cur
rent
(A)
String 1String 2
5 8 11 14 17 200
100
200
300
400
500
Time (Hour)
Vol
tage
(V)
String 1String 2
String comparison for string fault and module fault
Mean values and standard deviation for string current
5 8 11 14 17 200
5
10
15
Time (Hours)
Cur
rent
(A)
String 1String 2
String current comparison for partial shading
Fault detection based on string comparison

Conclusions
• A string level monitoring approach is adopted to detect faultsin an existing PV plant in Australia.
• The three methods analysed includes current and voltageratio comparison with thresholds, parameter ratio comparisonand string comparison.
• String failure, module failure and partial shading faults aredetected.
• String comparison method qualitatively outperforms theother two methods.
• String comparison method can be used for real‐time faultdetection with minimum sensors.
14

Related Documents