Concurrent and lagged impacts of an anomalously warm year on autotrophic and heterotrophic components of soil respiration: a deconvolution analysis Xuhui Zhou 1 , Yiqi Luo 1 , Chao Gao 1 , Paul S. J. Verburg 2 , John A. Arnone III 2 , Anthony Darrouzet-Nardi 3 and David S. Schimel 4 1 Department of Botany and Microbiology, University of Oklahoma, Norman, OK 73019, USA; 2 Division of Earth and Ecosystem Sciences, Desert Research Institute, Reno, NV 89512, USA; 3 Ecology and Evolutionary Biology, University of Colorado, Boulder, CO 80309, USA; 4 Climate and Global Dynamics Division, National Center for Atmospheric Research, Boulder, CO 80305, USA Author for correspondence: Xuhui Zhou Tel: +1 405 325 8578 Email: [email protected] Received: 22 January 2010 Accepted: 5 March 2010 New Phytologist (2010) 187: 184–198 doi: 10.1111/j.1469-8137.2010.03256.x Key words: autotrophic respiration, Bayesian, deconvolution, EcoCELL, heterotrophic respiration, Markov chain Monte Carlo (MCMC), soil respiration, warming. Summary • Partitioning soil respiration into autotrophic (R A ) and heterotrophic (R H ) components is critical for understanding their differential responses to climate warming. • Here, we used a deconvolution analysis to partition soil respiration in a pulse warming experiment. We first conducted a sensitivity analysis to determine which parameters can be identified by soil respiration data. A Markov chain Monte Carlo technique was then used to optimize those identifiable parameters in a terrestrial ecosystem model. Finally, the optimized parameters were employed to quantify R A and R H in a forward analysis. • Our results displayed that more than one-half of parameters were constrained by daily soil respiration data. The optimized model simulation showed that warming stimulated R H and had little effect on R A in the first 2 months, but decreased both R H and R A during the remainder of the treatment and post- treatment years. Clipping of above-ground biomass stimulated the warming effect on R H but not on R A . Overall, warming decreased R A and R H significantly, by 28.9% and 24.9%, respectively, during the treatment year and by 27.3% and 33.3%, respectively, during the post-treatment year, largely as a result of decreased canopy greenness and biomass. • Lagged effects of climate anomalies on soil respiration and its components are important in assessing terrestrial carbon cycle feedbacks to climate warming. Introduction Global warming induced by rising atmospheric greenhouse gases has increased the Earth’s surface temperature by 0.76°C since 1850, and the temperature is expected to increase by another 1.1–6.4°C by the end of this century (IPCC, 2007). This projected warming has the potential to alter ecosystem carbon (C) cycling and probably turn terres- trial ecosystems (TECOs) from C sinks to sources (Cox et al., 2000; Friedlingstein et al., 2006). On a global scale, climate warming by 1°C could result in an extra 11– 34 Pg C yr )1 release to the atmosphere as a result of enhanced decomposition (Jenkinson et al., 1991; Schimel et al., 1994). Soil respiration (R S ) is the largest terrestrial flux of CO 2 to the atmosphere in the global C cycle (Raich & Schlesinger, 1992; Raich et al., 2002), and therefore is an important regulator of global change. This flux comprises autotrophic respiration (R A ) from roots and their symbionts and a heterotrophic component (R H ) during litter and soil organic matter (SOM) decomposition (Hanson et al., 2000; Kuzyakov, 2006; Subke et al., 2006). Although the partitioning of R S into R A and R H has received considerable attention, reliable and reproducible quantification of these two processes remains one of the major challenges facing global change research (Baggs, 2006). It is important to resolve this issue, as R A and R H have been shown to respond differently to temperature (Boone et al., 1998; Lavigne et al., 2003; Niinisto ¨ et al., New Phytologist Research 184 New Phytologist (2010) 187: 184–198 www.newphytologist.com Ó The Authors (2010) Journal compilation Ó New Phytologist Trust (2010)

Welcome message from author
This document is posted to help you gain knowledge. Please leave a comment to let me know what you think about it! Share it to your friends and learn new things together.
Transcript
Concurrent and lagged impacts of an anomalously warmyear on autotrophic and heterotrophic components ofsoil respiration: a deconvolution analysis
Xuhui Zhou1, Yiqi Luo1, Chao Gao1, Paul S. J. Verburg2, John A. Arnone III2, Anthony Darrouzet-Nardi3 and
David S. Schimel4
1Department of Botany and Microbiology, University of Oklahoma, Norman, OK 73019, USA; 2Division of Earth and Ecosystem Sciences, Desert
Research Institute, Reno, NV 89512, USA; 3Ecology and Evolutionary Biology, University of Colorado, Boulder, CO 80309, USA; 4Climate and Global
Dynamics Division, National Center for Atmospheric Research, Boulder, CO 80305, USA
Author for correspondence:Xuhui Zhou
Tel: +1 405 325 8578Email: [email protected]
Received: 22 January 2010
Accepted: 5 March 2010
New Phytologist (2010) 187: 184–198doi: 10.1111/j.1469-8137.2010.03256.x
Key words: autotrophic respiration,Bayesian, deconvolution, EcoCELL,heterotrophic respiration, Markov chainMonte Carlo (MCMC), soil respiration,warming.
Summary
• Partitioning soil respiration into autotrophic (RA) and heterotrophic (RH)
components is critical for understanding their differential responses to climate
warming.
• Here, we used a deconvolution analysis to partition soil respiration in a pulse
warming experiment. We first conducted a sensitivity analysis to determine which
parameters can be identified by soil respiration data. A Markov chain Monte Carlo
technique was then used to optimize those identifiable parameters in a terrestrial
ecosystem model. Finally, the optimized parameters were employed to quantify RA
and RH in a forward analysis.
• Our results displayed that more than one-half of parameters were constrained
by daily soil respiration data. The optimized model simulation showed that
warming stimulated RH and had little effect on RA in the first 2 months, but
decreased both RH and RA during the remainder of the treatment and post-
treatment years. Clipping of above-ground biomass stimulated the warming effect
on RH but not on RA. Overall, warming decreased RA and RH significantly, by
28.9% and 24.9%, respectively, during the treatment year and by 27.3% and
33.3%, respectively, during the post-treatment year, largely as a result of
decreased canopy greenness and biomass.
• Lagged effects of climate anomalies on soil respiration and its components are
important in assessing terrestrial carbon cycle feedbacks to climate warming.
Introduction
Global warming induced by rising atmospheric greenhousegases has increased the Earth’s surface temperature by0.76�C since 1850, and the temperature is expected toincrease by another 1.1–6.4�C by the end of this century(IPCC, 2007). This projected warming has the potential toalter ecosystem carbon (C) cycling and probably turn terres-trial ecosystems (TECOs) from C sinks to sources (Coxet al., 2000; Friedlingstein et al., 2006). On a global scale,climate warming by 1�C could result in an extra 11–34 Pg C yr)1 release to the atmosphere as a result ofenhanced decomposition (Jenkinson et al., 1991; Schimelet al., 1994). Soil respiration (RS) is the largest terrestrial
flux of CO2 to the atmosphere in the global C cycle (Raich& Schlesinger, 1992; Raich et al., 2002), and therefore is animportant regulator of global change. This flux comprisesautotrophic respiration (RA) from roots and their symbiontsand a heterotrophic component (RH) during litter and soilorganic matter (SOM) decomposition (Hanson et al.,2000; Kuzyakov, 2006; Subke et al., 2006).
Although the partitioning of RS into RA and RH hasreceived considerable attention, reliable and reproduciblequantification of these two processes remains one of themajor challenges facing global change research (Baggs,2006). It is important to resolve this issue, as RA and RH
have been shown to respond differently to temperature(Boone et al., 1998; Lavigne et al., 2003; Niinisto et al.,
NewPhytologistResearch
184 New Phytologist (2010) 187: 184–198
www.newphytologist.com� The Authors (2010)
Journal compilation � New Phytologist Trust (2010)
2004; Zhou et al., 2007). Understanding the differentialcontrols of RA and RH would provide us with greater insightinto feedbacks between terrestrial C cycling and climatewarming (Cox et al., 2000; Friedlingstein et al., 2006).However, current results from modeling, mesocosm andfield experiments, and transect studies are highly contradic-tory (Lin et al., 1999, 2001; Lavigne et al., 2003; Eliassonet al., 2005; Zhou et al., 2007). For example, Lin et al.(1999, 2001) observed that RH was more sensitive than RA
to warming in experimental forest mesocosms. A transectstudy by Lavigne et al. (2003), however, indicated that theresponse of RS to temperature was controlled more by RA
than RH in balsam fir ecosystems. In girdling and trenchingexperiments, the temperature sensitivity of RA, indicated byQ10 (a relative increase in respiration for every 10�C rise intemperature), was higher than that of RH, indicating thatRA was more sensitive than RH to temperature change(Hogberg et al., 2001; Zhou et al., 2007). The potentialchange in RS associated with climate warming will largelydepend on the relative contribution of autotrophic andheterotrophic components (Buchmann, 2000; Zhou et al.,2007). Therefore, an understanding of the controls on thepartitioning of RS is critical to elucidate the nature andextent of feedbacks between climate change and soil pro-cesses and to predict ecosystem responses to environmentalchange (Melillo et al., 2002; Luo, 2007).
Recent climate change trends and modeling studies haveindicated an increase in the frequency and intensity ofextreme weather events, such as extreme heat waves,droughts and floods (Diffenbaugh et al., 2005; Jentschet al., 2007). These anomalous events may have effects onecosystems that could carry over into following years – a lageffect (Arnone et al., 2008; Sherry et al., 2008). Laggedeffects of an anomalous year might play an important rolein RS and its components in the following years, probablyresulting in persistent responses to the anomaly and subse-quent positive or negative feedback between the atmosphereand climate change (Cox et al., 2000). In the past, most ofthe research related to lag responses has focused on theeffects of precipitation on plant biomass production with alag time from one to several years (Andersen et al., 1997;Potter et al., 1999; Wiegand et al., 2004; Sherry et al.,2008). To the best of our knowledge, no studies have exam-ined lagged effects of warming on RS and its components(RA and RH). An understanding of the lagged effects of cli-mate warming is urgently needed to improve the predictionof ecosystem C cycling and to appreciate feedbacks betweenclimate change and the atmosphere after an anomalouslywarm year (Reichstein et al., 2007).
The relative contribution of RA or RH to RS varies greatlyfrom as little as 10% to as much as 90% for both forest andnonforest ecosystems (Hanson et al., 2000; Bond-Lambertyet al., 2004; Subke et al., 2006). Much of this variabilityhas been attributed to differences in measurement
techniques and partitioning methods (Hanson et al., 2000;Bond-Lamberty et al., 2004; Subke et al., 2006). Commonexperimental approaches for the separation of RH from RA
include both intrusive methods (e.g. trenching and rootexclusions) and nonintrusive methods using isotopic tech-niques (Luo & Zhou, 2006). Each method has a unique setof limitations and merits (Rochette et al., 1999; Jassal &Black, 2006). For example, intrusive methods disturb soiland sever the intimately linked processes of C flow fromfine roots to mycorrhizal symbionts and the wider soil com-munity. Isotopic methods require distinguishable signaturesources, which are often not available in many ecosystems(Hanson et al., 2000; Luo & Zhou, 2006).
Deconvolution analysis was first introduced by Luo et al.(2001b) to partition components of RS on the basis ofdistinctive response times of various C processes to aperturbation. The approach has the potential to untanglesoil biocomplexity. This kinetics-based approach focuseson system-level performance and underlying processeswith data–model integration (Luo et al., 2001b). When ameasurable quantity represents a convolved product ofseveral processes with distinguishable characteristics, decon-volution analysis can differentiate these complex processesaccording to their distinctive response times and estimate Ctransfer coefficients between C pools. Soil respiration isthe product of multiple rhizosphere processes, includingroot exudation, root respiration, and litter and SOMdecomposition. Different processes have different responsetimes (or residence times) – the time of C remaining inan ecosystem from entrance via photosynthesis to exit viarespiration – to perturbation. Therefore, observed RS
responses to a perturbation can be separated so as to probethe underlying processes in a manner that the observationsalone cannot achieve.
In this study, we employed a deconvolution approach toan analysis of RS observed in the EcoCELL facility at theDesert Research Institute, Nevada, USA, to examine theimpacts of a warming treatment and their lagged effects oncomponents of RS (Verburg et al., 2005; Arnone et al.,2008). Deconvolution analysis first differentiates C fluxpathways in ecosystems and then quantifies autotrophic andheterotrophic fluxes in response to a 1-yr warming treat-ment and lagged effects in the following year. Thus, thismethod allows us to evaluate the relative responses of theconstituent processes to climate change. Specifically, we firstconducted a sensitivity analysis with all parameters to deter-mine which parameters can be identified by observationsof soil respiration. A Markov chain Monte Carlo (MCMC)technique was then applied to a TECO model to optimizethe identifiable parameters (i.e. C transfer coefficients andparameters of temperature and moisture effects) and analyzetheir uncertainties. The model was validated againstmeasured RS under control and warming treatments, andwas subsequently used to deconvolve the effects of warming
NewPhytologist Research 185
� The Authors (2010)
Journal compilation � New Phytologist Trust (2010)
New Phytologist (2010) 187: 184–198
www.newphytologist.com
and post-treatment on RA and RH using a forward analysis.Uncertainties of modeled soil respiration and its compo-nents were assessed from samples of a Metropolis–Hastingssimulation. In the EcoCELL facility at the Desert ResearchInstitute, Nevada, warming largely decreased RS, canopygreenness and net primary productivity (NPP) in an anom-alously warm year (Verburg et al., 2005; Arnone et al.,2008), which was consistent with other experimental studiesshowing that warming reduced soil respiration (Saleskaet al., 1999; Wan et al., 2007; Lellei-Kovacs et al., 2008)and plant productivity (Tingey et al., 1996; De Boecket al., 2007; Klein et al., 2007) in a variety of ecosystems.Based on higher Q10 for RA than RH, as already mentioned,and experimental results in the literature and EcoCELLs(Boone et al., 1998; Hogberg et al., 2001; Rey et al., 2002;Lavigne et al., 2003; Verburg et al., 2005; Arnone et al.,2008; Lellei-Kovacs et al., 2008), we hypothesized thatwarming would decrease RA more than RH in an anoma-lously warm year. We also hypothesized that the laggedeffect would occur on both RA and RH with a time scale ofat least 1 yr.
Materials and Methods
Model description and data sources
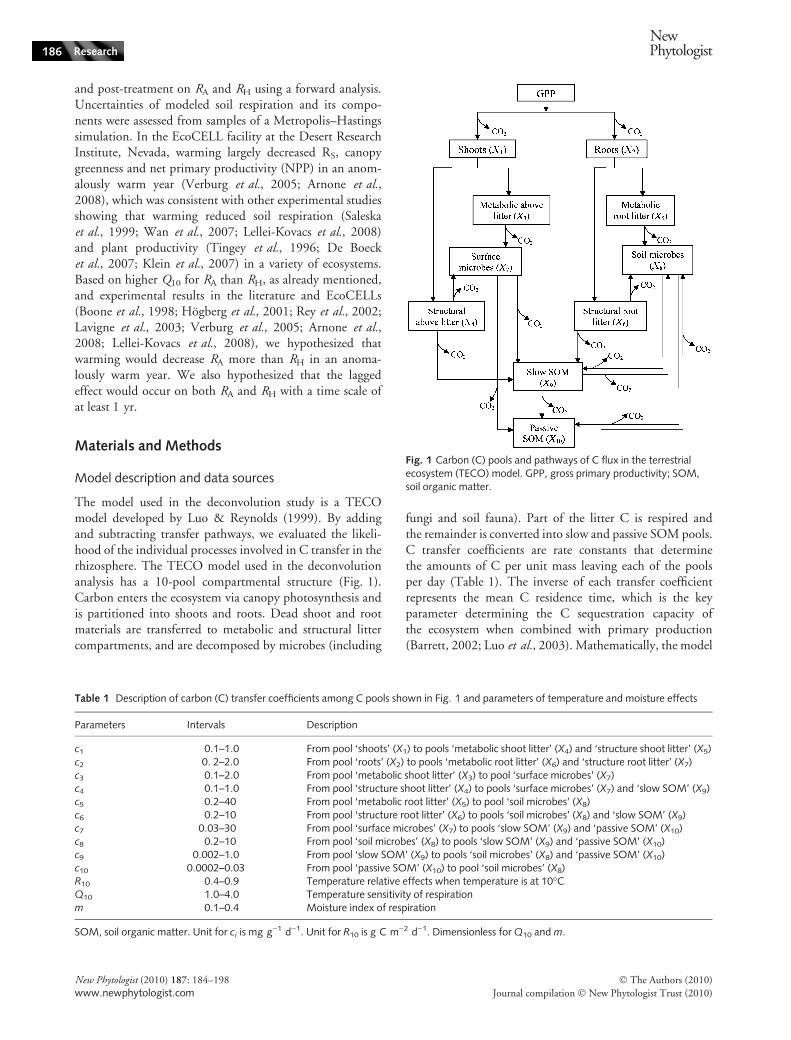
The model used in the deconvolution study is a TECOmodel developed by Luo & Reynolds (1999). By addingand subtracting transfer pathways, we evaluated the likeli-hood of the individual processes involved in C transfer in therhizosphere. The TECO model used in the deconvolutionanalysis has a 10-pool compartmental structure (Fig. 1).Carbon enters the ecosystem via canopy photosynthesis andis partitioned into shoots and roots. Dead shoot and rootmaterials are transferred to metabolic and structural littercompartments, and are decomposed by microbes (including
fungi and soil fauna). Part of the litter C is respired andthe remainder is converted into slow and passive SOM pools.C transfer coefficients are rate constants that determinethe amounts of C per unit mass leaving each of the poolsper day (Table 1). The inverse of each transfer coefficientrepresents the mean C residence time, which is the keyparameter determining the C sequestration capacity ofthe ecosystem when combined with primary production(Barrett, 2002; Luo et al., 2003). Mathematically, the model
Fig. 1 Carbon (C) pools and pathways of C flux in the terrestrialecosystem (TECO) model. GPP, gross primary productivity; SOM,soil organic matter.
Table 1 Description of carbon (C) transfer coefficients among C pools shown in Fig. 1 and parameters of temperature and moisture effects
Parameters Intervals Description
c1 0.1–1.0 From pool ‘shoots’ (X1) to pools ‘metabolic shoot litter’ (X4) and ‘structure shoot litter’ (X5)c2 0. 2–2.0 From pool ‘roots’ (X2) to pools ‘metabolic root litter’ (X6) and ‘structure root litter’ (X7)c3 0.1–2.0 From pool ‘metabolic shoot litter’ (X3) to pool ‘surface microbes’ (X7)c4 0.1–1.0 From pool ‘structure shoot litter’ (X4) to pools ‘surface microbes’ (X7) and ‘slow SOM’ (X9)c5 0.2–40 From pool ‘metabolic root litter’ (X5) to pool ‘soil microbes’ (X8)c6 0.2–10 From pool ‘structure root litter’ (X6) to pools ‘soil microbes’ (X8) and ‘slow SOM’ (X9)c7 0.03–30 From pool ‘surface microbes’ (X7) to pools ‘slow SOM’ (X9) and ‘passive SOM’ (X10)c8 0.2–10 From pool ‘soil microbes’ (X8) to pools ‘slow SOM’ (X9) and ‘passive SOM’ (X10)c9 0.002–1.0 From pool ‘slow SOM’ (X9) to pools ‘soil microbes’ (X8) and ‘passive SOM’ (X10)c10 0.0002–0.03 From pool ‘passive SOM’ (X10) to pool ‘soil microbes’ (X8)R10 0.4–0.9 Temperature relative effects when temperature is at 10�CQ10 1.0–4.0 Temperature sensitivity of respirationm 0.1–0.4 Moisture index of respiration
SOM, soil organic matter. Unit for ci is mg g)1 d)1. Unit for R10 is g C m)2 d)1. Dimensionless for Q10 and m.
186 Research
NewPhytologist
� The Authors (2010)
Journal compilation � New Phytologist Trust (2010)
New Phytologist (2010) 187: 184–198
www.newphytologist.com
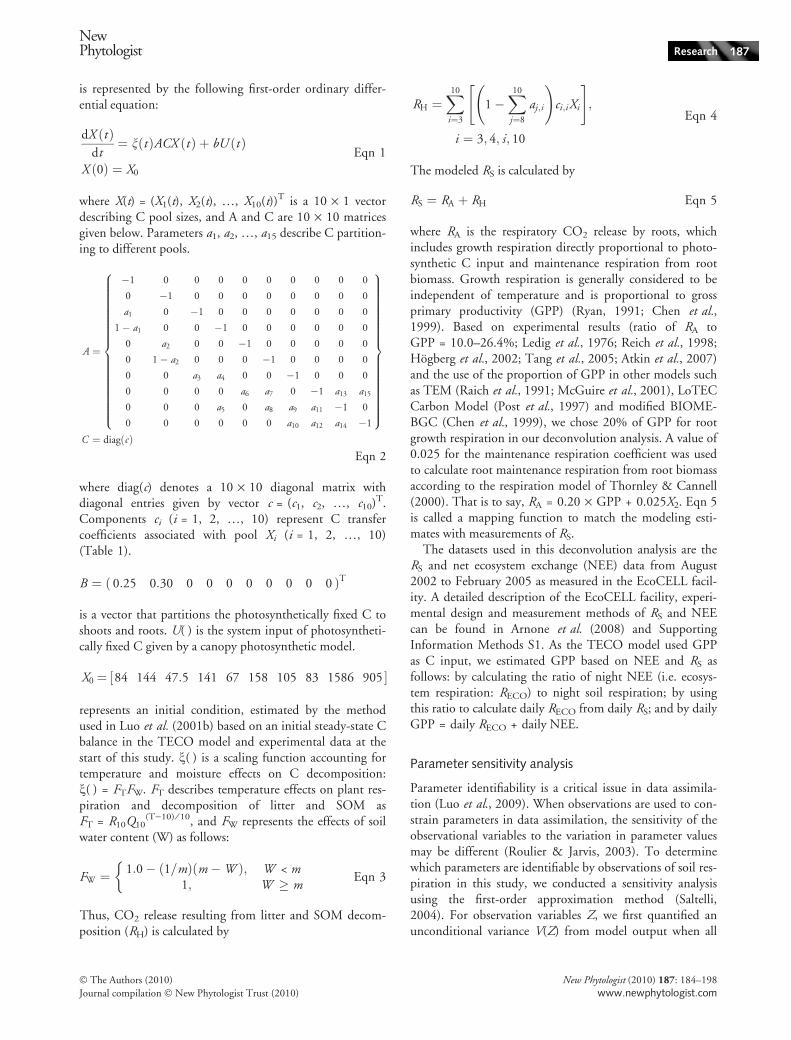
is represented by the following first-order ordinary differ-ential equation:
dX ðt Þdt¼ nðt ÞACX ðt Þ þ bU ðt Þ
X ð0Þ ¼ X0
Eqn 1
where X(t) = (X1(t), X2(t), …, X10(t))T is a 10 · 1 vectordescribing C pool sizes, and A and C are 10 · 10 matricesgiven below. Parameters a1, a2, …, a15 describe C partition-ing to different pools.
A ¼
�1 0 0 0 0 0 0 0 0 0
0 �1 0 0 0 0 0 0 0 0
a1 0 �1 0 0 0 0 0 0 0
1� a1 0 0 �1 0 0 0 0 0 0
0 a2 0 0 �1 0 0 0 0 0
0 1� a2 0 0 0 �1 0 0 0 0
0 0 a3 a4 0 0 �1 0 0 0
0 0 0 0 a6 a7 0 �1 a13 a15
0 0 0 a5 0 a8 a9 a11 �1 0
0 0 0 0 0 0 a10 a12 a14 �1
8>>>>>>>>>>>>>>>>>>><>>>>>>>>>>>>>>>>>>>:
9>>>>>>>>>>>>>>>>>>>=>>>>>>>>>>>>>>>>>>>;
C ¼ diagðcÞEqn 2
where diag(c) denotes a 10 · 10 diagonal matrix withdiagonal entries given by vector c = (c1, c2, …, c10)T.Components ci (i = 1, 2, …, 10) represent C transfercoefficients associated with pool Xi (i = 1, 2, …, 10)(Table 1).
B ¼ ð 0:25 0:30 0 0 0 0 0 0 0 0 ÞT
is a vector that partitions the photosynthetically fixed C toshoots and roots. U(Æ) is the system input of photosyntheti-cally fixed C given by a canopy photosynthetic model.
X0 ¼ ½84 144 47:5 141 67 158 105 83 1586 905 �
represents an initial condition, estimated by the methodused in Luo et al. (2001b) based on an initial steady-state Cbalance in the TECO model and experimental data at thestart of this study. n(Æ) is a scaling function accounting fortemperature and moisture effects on C decomposition:n(Æ) = FTFW. FT describes temperature effects on plant res-piration and decomposition of litter and SOM asFT = R10Q10
(T)10) ⁄ 10, and FW represents the effects of soilwater content (W) as follows:
FW ¼1:0� ð1=mÞðm �W Þ; W < m
1; W � m
�Eqn 3
Thus, CO2 release resulting from litter and SOM decom-position (RH) is calculated by
RH ¼X10
i¼3
1�X10
j¼8
aj ;i
!ci;iXi
" #;
i ¼ 3; 4; _s; 10
Eqn 4
The modeled RS is calculated by
RS ¼ RA þ RH Eqn 5
where RA is the respiratory CO2 release by roots, whichincludes growth respiration directly proportional to photo-synthetic C input and maintenance respiration from rootbiomass. Growth respiration is generally considered to beindependent of temperature and is proportional to grossprimary productivity (GPP) (Ryan, 1991; Chen et al.,1999). Based on experimental results (ratio of RA toGPP = 10.0–26.4%; Ledig et al., 1976; Reich et al., 1998;Hogberg et al., 2002; Tang et al., 2005; Atkin et al., 2007)and the use of the proportion of GPP in other models suchas TEM (Raich et al., 1991; McGuire et al., 2001), LoTECCarbon Model (Post et al., 1997) and modified BIOME-BGC (Chen et al., 1999), we chose 20% of GPP for rootgrowth respiration in our deconvolution analysis. A value of0.025 for the maintenance respiration coefficient was usedto calculate root maintenance respiration from root biomassaccording to the respiration model of Thornley & Cannell(2000). That is to say, RA = 0.20 · GPP + 0.025X2. Eqn 5is called a mapping function to match the modeling esti-mates with measurements of RS.
The datasets used in this deconvolution analysis are theRS and net ecosystem exchange (NEE) data from August2002 to February 2005 as measured in the EcoCELL facil-ity. A detailed description of the EcoCELL facility, experi-mental design and measurement methods of RS and NEEcan be found in Arnone et al. (2008) and SupportingInformation Methods S1. As the TECO model used GPPas C input, we estimated GPP based on NEE and RS asfollows: by calculating the ratio of night NEE (i.e. ecosys-tem respiration: RECO) to night soil respiration; by usingthis ratio to calculate daily RECO from daily RS; and by dailyGPP = daily RECO + daily NEE.
Parameter sensitivity analysis
Parameter identifiability is a critical issue in data assimila-tion (Luo et al., 2009). When observations are used to con-strain parameters in data assimilation, the sensitivity of theobservational variables to the variation in parameter valuesmay be different (Roulier & Jarvis, 2003). To determinewhich parameters are identifiable by observations of soil res-piration in this study, we conducted a sensitivity analysisusing the first-order approximation method (Saltelli,2004). For observation variables Z, we first quantified anunconditional variance V(Z) from model output when all
NewPhytologist Research 187
� The Authors (2010)
Journal compilation � New Phytologist Trust (2010)
New Phytologist (2010) 187: 184–198
www.newphytologist.com
parameters in matrices A and C, and temperature and mois-ture effects, pi, freely vary over their entire initial ranges.Then we fixed pi (i = 1, 2, …, k; k = 28 in this study) atone of the r (= 100) evenly distributed values, p�i , within itsPrior range. For each fixed value p�i , we randomly sampledM (= 1000) times of the other parameters, p1, …, pi–1, pi+1,…, p28 within their prior ranges using a Monte Carlomethod. From the M samples, we estimated a conditionalexpectation m E ðZ pi ¼ p�i
�� Þ, r of which were used to esti-mate variance V(E(Z|pi)). This procedure was repeated foreach of pi. A sensitivity index Si was calculated for eachparameter pi (i = 1, 2, …, 28):
Si ¼V ðE ðZ pij ÞÞ
V ðZ Þ Eqn 6
To compare Si for all the parameters, we normalized Si
by:
Ii ¼SiffiffiffiffiffiffiffiffiffiffiffiffiffiffiffiffiffiPri¼1 S 2
i
p Eqn 7
where Ii is the normalized sensitivity index. The higher thevalue of Ii, the more sensitive the observational variable tothe parameter. In this study, parameters were considered tobe sensitive to soil respiration if Ii > 0.01.
Deconvolution analysis
In the deconvolution study, a Bayesian probabilistic inver-sion approach was employed to optimize the selectedparameters identified from the sensitivity analysis. Ourinversion analyses were performed for each EcoCELL undercontrol (Eco 2 and 4), warming (Eco 1 and 3) and post-treatment (Eco 1 and 3) conditions. In this study, theselected parameters included C transfer coefficients (ci,i = 1, 2, …, 10) and parameters of temperature and mois-ture effects (R10, Q10 and m). The off-diagonal elements inmatrix A in Eqn 2, a1, a2, …, a15, were fixed, as well as c3
and c4 (see Methods S1 for fixed values), as these parame-ters were not identifiable by soil respiration as determinedfrom the sensitivity analysis. A detailed description of theBayes’ theorem has been given by McCarthy (2007) and Xuet al. (2006). Here, we only provide a brief overview.
The Bayes’ theorem states that the posterior probabilitydensity function (PPDF) p(c|Z) of model parameters c canbe obtained from a prior knowledge of parameters c, repre-sented by a prior probability density function (PDF) p(c),and information contained in soil respiration, representedby a likelihood function p(Z|c). To apply Bayes’ theorem,we first specified the prior PDF p(c) by giving a set of limit-ing intervals for parameters c with uniform distribution(Table 1), and then constructed the likelihood functionp(Z|c) on the basis of the assumption that errors in theobserved data followed Gaussian distributions. The
likelihood function p(Z|c) was specified according to distri-butions of observation errors (e(t)).
pðZ cj Þ / exp1
2r2
Xt2obsðZiÞ
½Ziðt Þ � uiX ðt Þ�2
8<:
9=; Eqn 8
where constant r2 is the error variance of soil respiration,Z(t) is the observed soil respiration at time t and uX(t) isthe modeled value, which is a product of X(t) from Eqn 1and c from Eqn 2. Then, with Bayes’ theorem, the PPDFof parameters c is given by
pðc Zj Þ / pðZ cj ÞpðcÞ Eqn 9
To draw samples from p(c|Z), a Metropolis–Hastings(M–H) algorithm, which is a MCMC technique revealinghigh-dimensional probability PPDFs of random variablesvia a sampling procedure (Metropolis et al., 1953;Hastings, 1970; Gelfand & Smith, 1990), was employed toconstruct PPDFs of model parameters on the basis of theirprior information, model structure and datasets. (SeeMethods S1 for a detailed description of the M–H algo-rithm, as well as an estimate of maximum likelihood estima-tors (MLEs) and means and cross-correlations betweenparameters.)
The inverse analysis described above was used to evaluateparameter values by deconvolving the observed responses ofRS to warming, and the forward analysis was designed togenerate RS and its components from a given model struc-ture and set of parameter values (Luo et al., 2001b). Giventhe model structure and MLEs or means of the parametersfrom the inverse analysis, we simulated the quantity of Creleased from each of the 10 pools for each EcoCELL undercontrol and warming conditions. We estimated RS and itscomponents (i.e. RA and RH) according to Eqns 3 and 4. RS
is experimentally measurable, whereas RA and RH are diffi-cult to measure in the field but represent the processes weaimed to quantify. The model was employed to estimateparameters and simulate RS for the control EcoCELLs dur-ing the 3-yr study period, consisting of the pretreatmentperiod, one warming year and one post-treatment year, aswell as the pretreatment period in to-be-warmedEcoCELLs. During the pretreatment period (August 2002to February 2003), we used the estimated parameters fromthe control to simulate RS. Uncertainties of modeled soilrespiration and its components were evaluated from all sam-ples of the M–H simulation.
Statistical analysis
As we estimated the parameters and modeled RS, RA and RH
for each EcoCELL, statistical analysis was performed todetermine the treatment effects of measured RS and mod-eled RS, RA and RH using a mixed model approach with
188 Research
NewPhytologist
� The Authors (2010)
Journal compilation � New Phytologist Trust (2010)
New Phytologist (2010) 187: 184–198
www.newphytologist.com
treatment and time as fixed factors. In 2003, we alsoperformed a similar analysis for measured RS and modeledRS, RA and RH in the first 2 months and the rest of thetreatment, respectively. We used paired Student’s t-teststo compare observed with modeled values of RS. The signi-ficance of the effects of warming and post-treatment on Ctransfer coefficients (ci, i = 1, 2, 5, …, 10) and parametersof temperature and moisture effects (R10, Q10 and m) wasexamined by a t-test method as described by Zhou et al.(2006).
Results
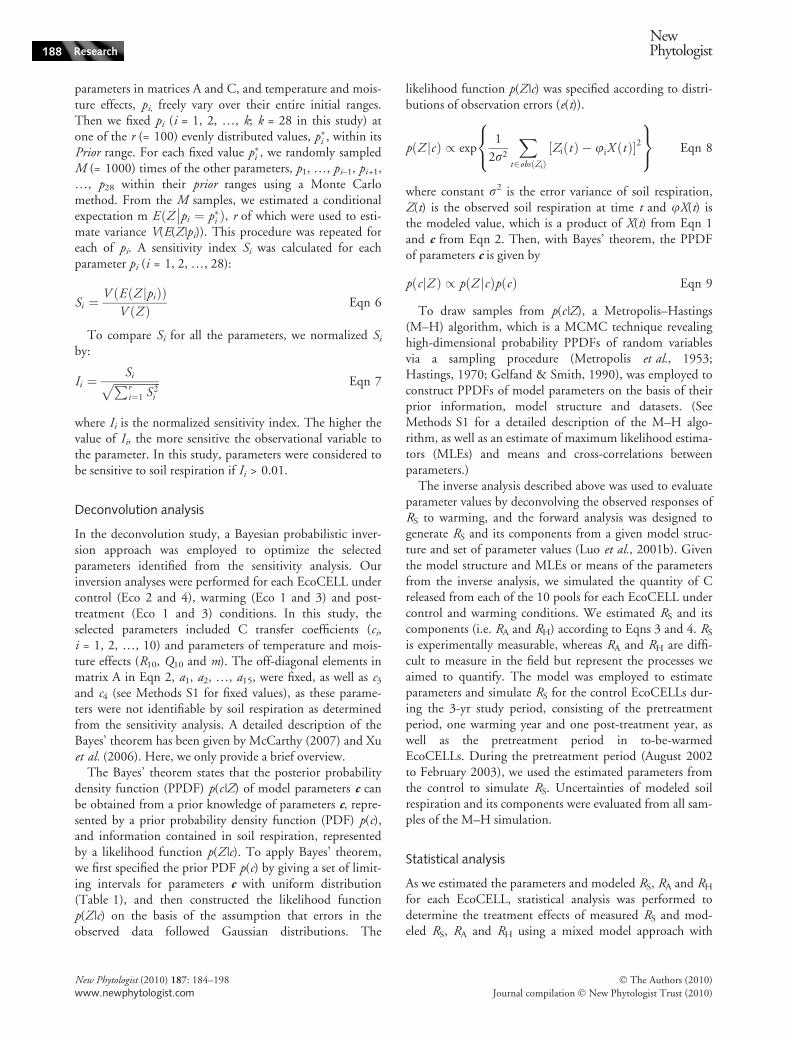
The sensitivity analysis showed that soil respiration is verysensitive to C transfer parameters c9 (slow SOM) and tem-perature sensitivity Q10, with normalized sensitivity indices(Ii) of nearly 1.0, and to parameters c1 (shoot) and c2 (root),with Ii of greater than 0.2 (Table 2). Normalized sensitivityindices of c5 (metabolic root litter), c6 (structural root lit-ter), c7 (surface microbes), c8 (soil microbes), R10 (basal res-piration at 10�C) and m (moisture index) were between0.01 and 0.05. However, soil respiration had no sensitivityto C transfer coefficients c3 and c4 (metabolic and structuralabove litter), and all C partitioning parameters in matrix A(a1, a2, …, a15). Our analysis suggested that parameters a1,a2, …, a15, c3 and c4 were not identifiable by soil respirationand we therefore used fixed values for the rest of this study.Consequently, the eight transfer coefficients and threeparameters of temperature and moisture effects were esti-mated in this study.
Parameters c2, c5, c6, c7, c9, R10, Q10 and m wereconstrained to different degrees within their prespecifiedranges under control and warming conditions, and para-meters c1 and c10 were poorly constrained (Fig. S2). Underpost-treatment conditions, only parameters c2, c9, R10 andQ10 were constrained to some degree. Comparison ofparameter distributions showed that parameters c5, c6, c7, c8
and R10 were significantly higher under warming thancontrol, whereas warming lowered parameters c2 and c9
(Fig. 2). The post-treatment year following 1 yr of warm-ing did not affect significantly the estimated parameters(Fig. 2).
For these constrained parameters, MLEs were identifiedby observing the parameter values corresponding to thepeaks of their marginal distributions (Figs S2 and 2). Forthose unconstrained parameters for which we could not cal-culate MLEs, we calculated the sample means to determinethe mean estimates. The standard deviations (SDs) of allparameters were estimated from the PPDFs of 80 000 sam-ples (Fig. S2) to quantify parameter uncertainty (Fig. 2).Among the parameters, the poorly constrained parametersc1 and c10 had the largest variability relative to their range(Fig. 2). The cross-correlation analysis showed that the 11parameters were not significantly correlated, except for thepairs c7–c9 and c8–c9 with correlation coefficients of 0.30and 0.28, respectively (data not shown).
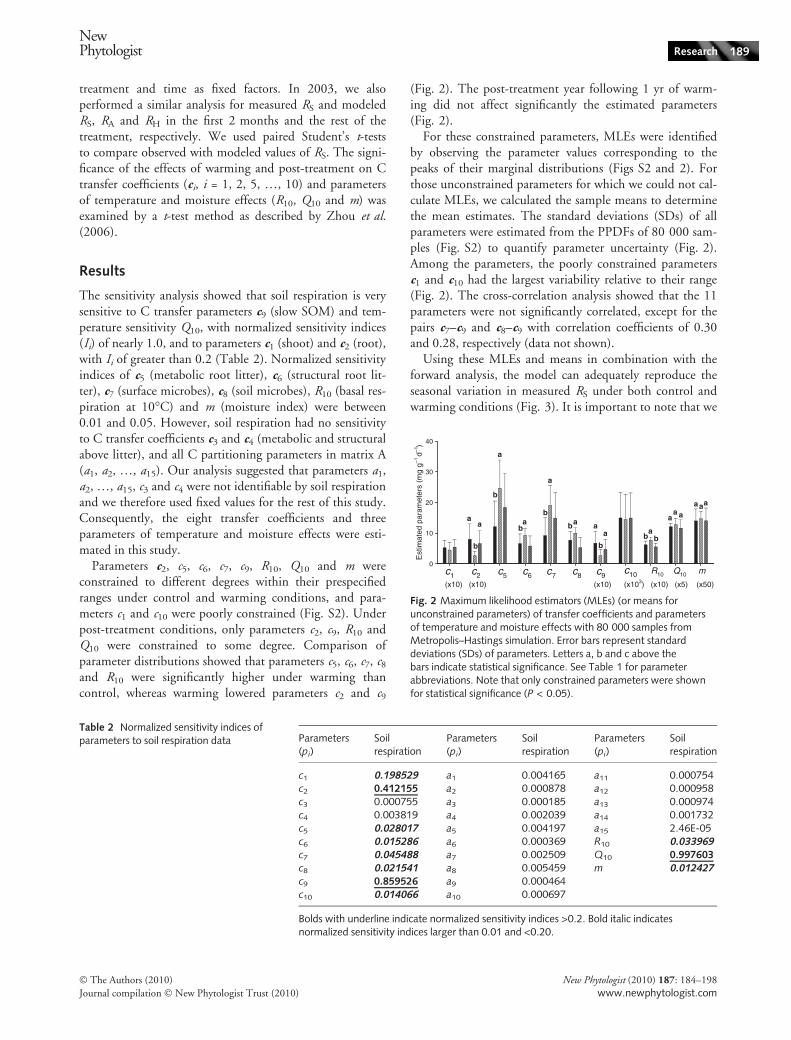
Using these MLEs and means in combination with theforward analysis, the model can adequately reproduce theseasonal variation in measured RS under both control andwarming conditions (Fig. 3). It is important to note that we
Table 2 Normalized sensitivity indices ofparameters to soil respiration data Parameters
(pi)Soilrespiration
Parameters(pi)
Soilrespiration
Parameters(pi)
Soilrespiration
c1 0.198529 a1 0.004165 a11 0.000754c2 0.412155 a2 0.000878 a12 0.000958c3 0.000755 a3 0.000185 a13 0.000974c4 0.003819 a4 0.002039 a14 0.001732c5 0.028017 a5 0.004197 a15 2.46E-05c6 0.015286 a6 0.000369 R10 0.033969c7 0.045488 a7 0.002509 Q10 0.997603c8 0.021541 a8 0.005459 m 0.012427c9 0.859526 a9 0.000464c10 0.014066 a10 0.000697
Bolds with underline indicate normalized sensitivity indices >0.2. Bold italic indicatesnormalized sensitivity indices larger than 0.01 and <0.20.
Est
imat
ed p
aram
eter
s (m
g g–1
d–1
)
0
10
20
30
40
c1 c2 c5 c6 c7 c8 c9(x10) (x10) (x10)
c10 R10 Q10 m
(x103) (x10) (x5) (x50)
a
a
b
b
a ab
a
bab a
b
a abb
aaa
aaa
Fig. 2 Maximum likelihood estimators (MLEs) (or means forunconstrained parameters) of transfer coefficients and parametersof temperature and moisture effects with 80 000 samples fromMetropolis–Hastings simulation. Error bars represent standarddeviations (SDs) of parameters. Letters a, b and c above thebars indicate statistical significance. See Table 1 for parameterabbreviations. Note that only constrained parameters were shownfor statistical significance (P < 0.05).
NewPhytologist Research 189
� The Authors (2010)
Journal compilation � New Phytologist Trust (2010)
New Phytologist (2010) 187: 184–198
www.newphytologist.com
used parameters from the control treatment for the pretreat-ment period of the warming treatment. Plotting modeled(y) against measured (x) RS results in regression linesy = 0.920x + 0.233 with a determinant coefficient R2 =0.91 for the control, and y = 0.883x + 0.259 with R2 =0.92 for warming (inserted figures). The warming treatmentshowed larger uncertainty in 2004 than the control becausesoil respiration measurements showed a large differencebetween the two warmed EcoCELLs during this period(Figs 3, S1).
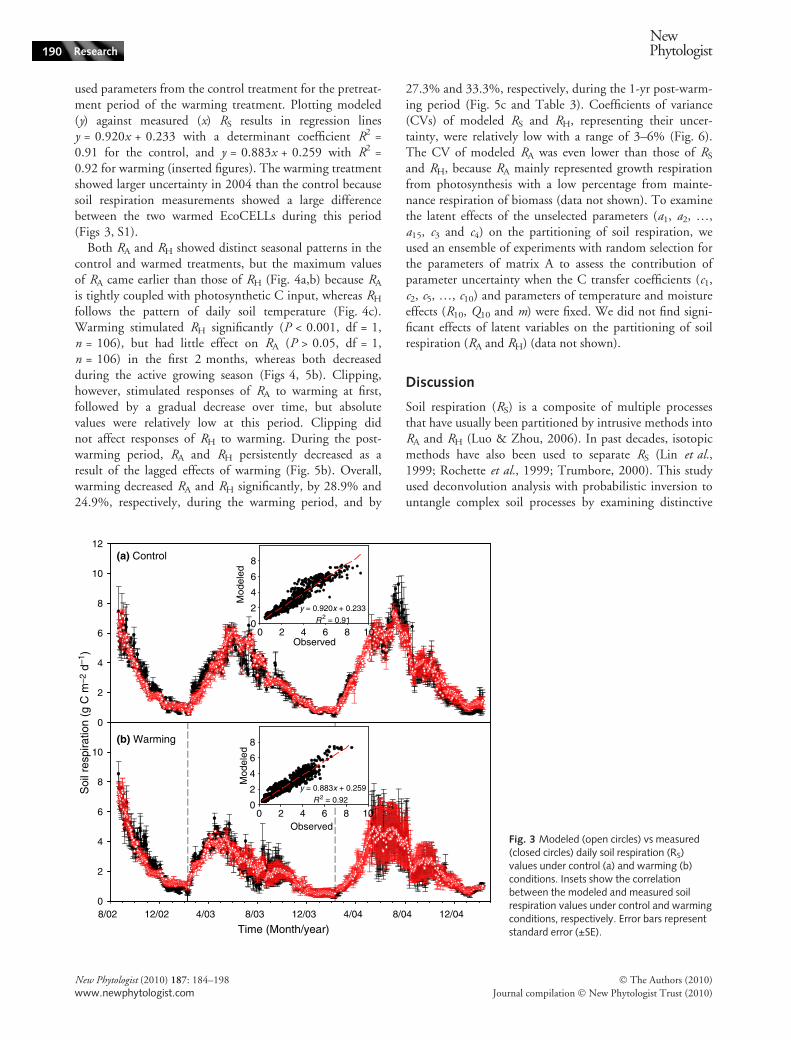
Both RA and RH showed distinct seasonal patterns in thecontrol and warmed treatments, but the maximum valuesof RA came earlier than those of RH (Fig. 4a,b) because RA
is tightly coupled with photosynthetic C input, whereas RH
follows the pattern of daily soil temperature (Fig. 4c).Warming stimulated RH significantly (P < 0.001, df = 1,n = 106), but had little effect on RA (P > 0.05, df = 1,n = 106) in the first 2 months, whereas both decreasedduring the active growing season (Figs 4, 5b). Clipping,however, stimulated responses of RA to warming at first,followed by a gradual decrease over time, but absolutevalues were relatively low at this period. Clipping didnot affect responses of RH to warming. During the post-warming period, RA and RH persistently decreased as aresult of the lagged effects of warming (Fig. 5b). Overall,warming decreased RA and RH significantly, by 28.9% and24.9%, respectively, during the warming period, and by
27.3% and 33.3%, respectively, during the 1-yr post-warm-ing period (Fig. 5c and Table 3). Coefficients of variance(CVs) of modeled RS and RH, representing their uncer-tainty, were relatively low with a range of 3–6% (Fig. 6).The CV of modeled RA was even lower than those of RS
and RH, because RA mainly represented growth respirationfrom photosynthesis with a low percentage from mainte-nance respiration of biomass (data not shown). To examinethe latent effects of the unselected parameters (a1, a2, …,a15, c3 and c4) on the partitioning of soil respiration, weused an ensemble of experiments with random selection forthe parameters of matrix A to assess the contribution ofparameter uncertainty when the C transfer coefficients (c1,c2, c5, …, c10) and parameters of temperature and moistureeffects (R10, Q10 and m) were fixed. We did not find signi-ficant effects of latent variables on the partitioning of soilrespiration (RA and RH) (data not shown).
Discussion
Soil respiration (RS) is a composite of multiple processesthat have usually been partitioned by intrusive methods intoRA and RH (Luo & Zhou, 2006). In past decades, isotopicmethods have also been used to separate RS (Lin et al.,1999; Rochette et al., 1999; Trumbore, 2000). This studyused deconvolution analysis with probabilistic inversion tountangle complex soil processes by examining distinctive
0
2
4
6
8
10
12
Observed0 2 4 6 8 10
Mod
eled
0
2
4
6
8
Time (Month/year)8/02 12/02 4/03 8/03 12/03 4/04 8/04 12/04
Soi
l res
pira
tion
(g C
m–2
d–1
)
0
2
4
6
8
10
Observed0 2 4 6 8 10
Mod
eled
0
2
4
6
8
y = 0.920x + 0.233
R2 = 0.91
(b) Warming
(a) Control
y = 0.883x + 0.259
R2 = 0.92
Fig. 3 Modeled (open circles) vs measured(closed circles) daily soil respiration (RS)values under control (a) and warming (b)conditions. Insets show the correlationbetween the modeled and measured soilrespiration values under control and warmingconditions, respectively. Error bars representstandard error (±SE).
190 Research
NewPhytologist
� The Authors (2010)
Journal compilation � New Phytologist Trust (2010)
New Phytologist (2010) 187: 184–198
www.newphytologist.com
response times of various C processes to warming as well aspost-warming conditions. Our analysis suggests that:warming decreased significantly both RA and RH as a resultof decreases in canopy greenness and NPP, but clippingstimulated the responses of RA to warming in experimentalgrassland ecosystems in the EcoCELL facility; lagged effectsof warming were important for RS and its components; andkinetics-based deconvolution analysis is a useful techniqueto examine the responses of components of observed RS toclimate change.
Warming effects on RA and RH
Partitioning RS into RA and RH remains one of the majorchallenges facing global change ecosystem research witheither experimental or modeling methods. Few studies haveexamined the effects of warming on these two fluxes (Linet al., 1999; Rochette et al., 1999; Trumbore, 2000;Melillo et al., 2002; Eliasson et al., 2005; Zhou et al.,2007), but numerous studies have investigated the responses
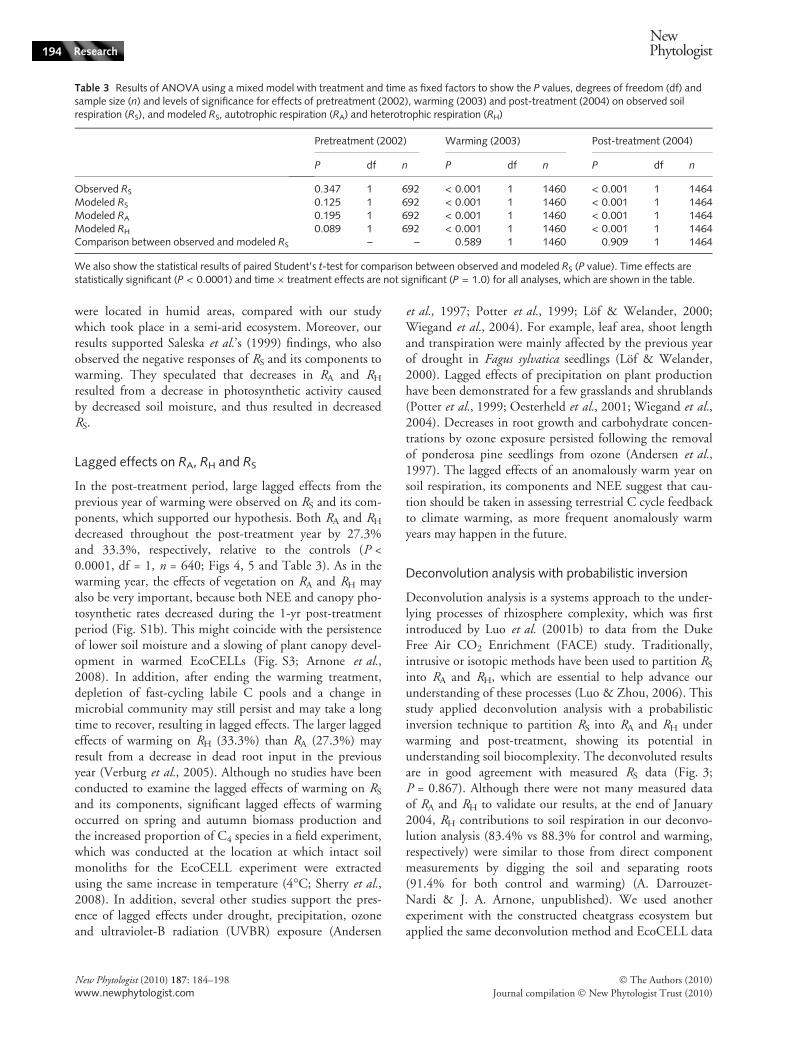
of total RS to warming (Peterjohn et al., 1994; Rustadet al., 2001; Melillo et al., 2002; Niinisto et al., 2004;Zhou et al., 2006). Our deconvolution analysis found thatwarming stimulated RH significantly in the first 2 months(Figs 4, 5). However, RA was not affected significantly bywarming during this period (P > 0.05, df = 1, n = 106;Figs 2, 6). The warming-induced transient stimulation inRH probably resulted from enhanced oxidation of soil Ccompounds, especially labile C (e.g. faster turnover),followed by lowered substrate availability under warmingconditions, referred to as substrate depletion (Lin et al.,2001; Melillo et al., 2002; Eliasson et al., 2005; Zhouet al., 2007). In addition, changes in microbial communitymay contribute to warming-induced stimulation in RH inthe first 2 months (Fig. 6a; Bradford et al., 2008). RH over-estimation in the first 2 months may have exacerbated theresponses to warming (Figs 4, 5). However, the responsesof plants to warming may be slower than those of soilmicrobes, causing insignificant effects on RA (Jonassonet al., 1999; Shaver et al., 2000).
Time (month/year)8/02 12/02 4/03 8/03 12/03 4/04 8/04 12/04
Soi
l tem
pera
ture
(o C
)
0
5
10
15
20
25
30
Can
opy
gree
nnes
s (%
)
0
20
40
60
80
100
120
0
1
2
3
4
5
Res
pira
tion
(g C
m–2
d–1
)
0
1
2
3
4
5Autotrophic respirationHeterotrophic respiration
(b) Warming
(a) Control
Pre-treatment Warming Post-treatment
Clipping
Clipping
Clipping
Clipping
Clipping
Clipping(c) ST and Green
Fig. 4 Modeled autotrophic (closed circles)and heterotrophic (open circles) respirationvalues under control (a) and warming (b)treatments from August 2002 to February2005. (c) The soil temperature (ST) andcanopy greenness (Green) under control andwarming treatments for the same period.Error bars represent standard error (±SE).
NewPhytologist Research 191
� The Authors (2010)
Journal compilation � New Phytologist Trust (2010)
New Phytologist (2010) 187: 184–198
www.newphytologist.com
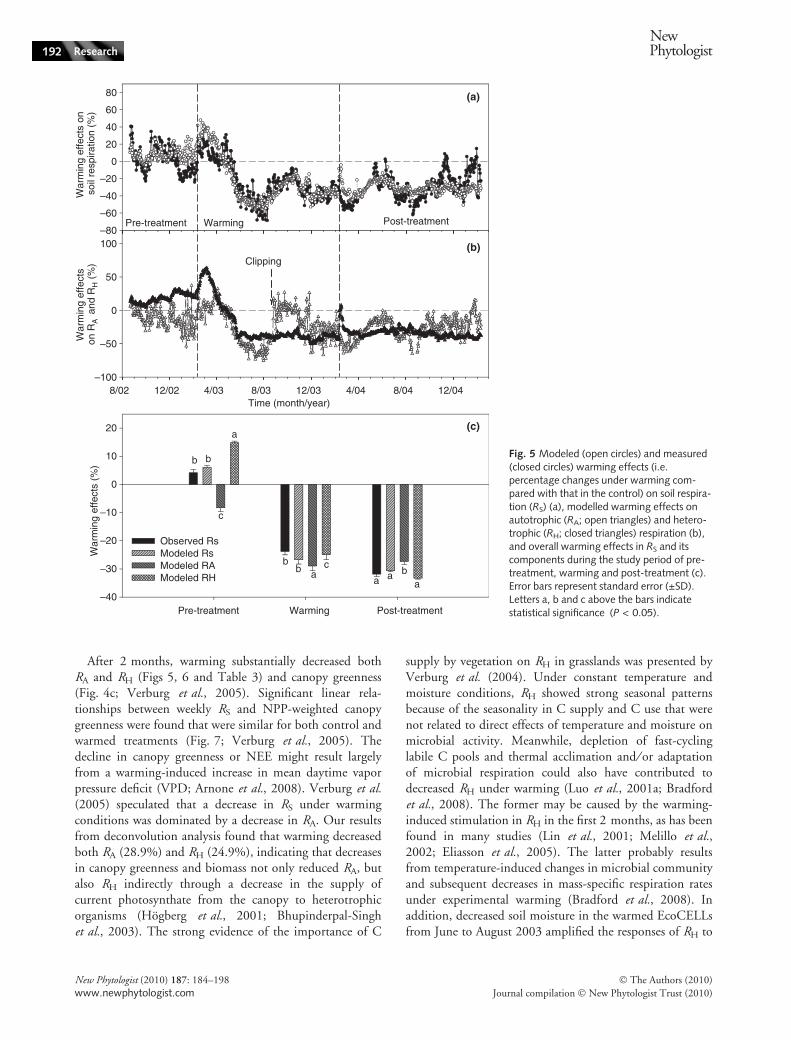
After 2 months, warming substantially decreased bothRA and RH (Figs 5, 6 and Table 3) and canopy greenness(Fig. 4c; Verburg et al., 2005). Significant linear rela-tionships between weekly RS and NPP-weighted canopygreenness were found that were similar for both control andwarmed treatments (Fig. 7; Verburg et al., 2005). Thedecline in canopy greenness or NEE might result largelyfrom a warming-induced increase in mean daytime vaporpressure deficit (VPD; Arnone et al., 2008). Verburg et al.(2005) speculated that a decrease in RS under warmingconditions was dominated by a decrease in RA. Our resultsfrom deconvolution analysis found that warming decreasedboth RA (28.9%) and RH (24.9%), indicating that decreasesin canopy greenness and biomass not only reduced RA, butalso RH indirectly through a decrease in the supply ofcurrent photosynthate from the canopy to heterotrophicorganisms (Hogberg et al., 2001; Bhupinderpal-Singhet al., 2003). The strong evidence of the importance of C
supply by vegetation on RH in grasslands was presented byVerburg et al. (2004). Under constant temperature andmoisture conditions, RH showed strong seasonal patternsbecause of the seasonality in C supply and C use that werenot related to direct effects of temperature and moisture onmicrobial activity. Meanwhile, depletion of fast-cyclinglabile C pools and thermal acclimation and ⁄ or adaptationof microbial respiration could also have contributed todecreased RH under warming (Luo et al., 2001a; Bradfordet al., 2008). The former may be caused by the warming-induced stimulation in RH in the first 2 months, as has beenfound in many studies (Lin et al., 2001; Melillo et al.,2002; Eliasson et al., 2005). The latter probably resultsfrom temperature-induced changes in microbial communityand subsequent decreases in mass-specific respiration ratesunder experimental warming (Bradford et al., 2008). Inaddition, decreased soil moisture in the warmed EcoCELLsfrom June to August 2003 amplified the responses of RH to
War
min
g ef
fect
s (%
)
–40
–30
–20
–10
0
10
20
Observed RsModeled RsModeled RAModeled RH
8/02 12/02 4/03 8/03 12/03 4/04 8/04 12/04
War
min
g ef
fect
s on
RA
and
RH
(%
)
–100
–50
0
50
100
Time (month/year)
War
min
g ef
fect
s on
so
il re
spira
tion
(%)
–80
–60
–40
–20
0
20
40
60
80 (a)
(b)
(c)
Pre-treatment Warming Post-treatment
Clipping
ab
b c
aaa
b
a
bb
c
Pre-treatment Warming Post-treatment
Fig. 5 Modeled (open circles) and measured(closed circles) warming effects (i.e.percentage changes under warming com-pared with that in the control) on soil respira-tion (RS) (a), modelled warming effects onautotrophic (RA; open triangles) and hetero-trophic (RH; closed triangles) respiration (b),and overall warming effects in RS and itscomponents during the study period of pre-treatment, warming and post-treatment (c).Error bars represent standard error (±SD).Letters a, b and c above the bars indicatestatistical significance (P < 0.05).
192 Research
NewPhytologist
� The Authors (2010)
Journal compilation � New Phytologist Trust (2010)
New Phytologist (2010) 187: 184–198
www.newphytologist.com
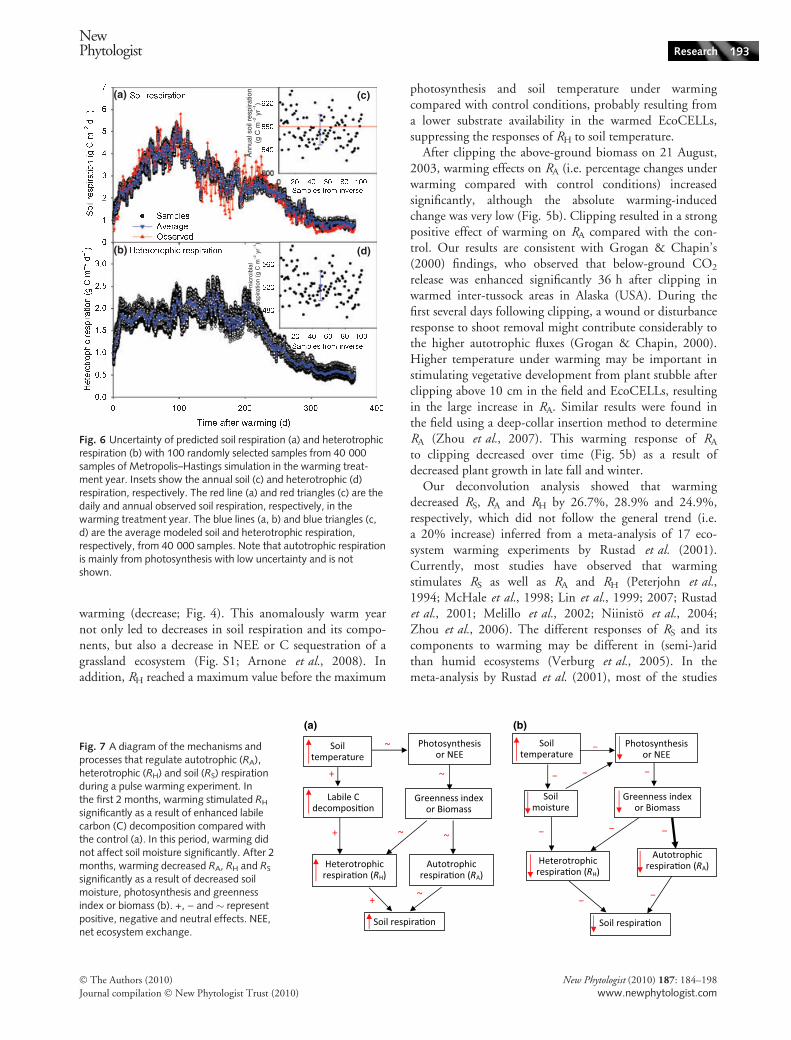
warming (decrease; Fig. 4). This anomalously warm yearnot only led to decreases in soil respiration and its compo-nents, but also a decrease in NEE or C sequestration of agrassland ecosystem (Fig. S1; Arnone et al., 2008). Inaddition, RH reached a maximum value before the maximum
photosynthesis and soil temperature under warmingcompared with control conditions, probably resulting froma lower substrate availability in the warmed EcoCELLs,suppressing the responses of RH to soil temperature.
After clipping the above-ground biomass on 21 August,2003, warming effects on RA (i.e. percentage changes underwarming compared with control conditions) increasedsignificantly, although the absolute warming-inducedchange was very low (Fig. 5b). Clipping resulted in a strongpositive effect of warming on RA compared with the con-trol. Our results are consistent with Grogan & Chapin’s(2000) findings, who observed that below-ground CO2
release was enhanced significantly 36 h after clipping inwarmed inter-tussock areas in Alaska (USA). During thefirst several days following clipping, a wound or disturbanceresponse to shoot removal might contribute considerably tothe higher autotrophic fluxes (Grogan & Chapin, 2000).Higher temperature under warming may be important instimulating vegetative development from plant stubble afterclipping above 10 cm in the field and EcoCELLs, resultingin the large increase in RA. Similar results were found inthe field using a deep-collar insertion method to determineRA (Zhou et al., 2007). This warming response of RA
to clipping decreased over time (Fig. 5b) as a result ofdecreased plant growth in late fall and winter.
Our deconvolution analysis showed that warmingdecreased RS, RA and RH by 26.7%, 28.9% and 24.9%,respectively, which did not follow the general trend (i.e.a 20% increase) inferred from a meta-analysis of 17 eco-system warming experiments by Rustad et al. (2001).Currently, most studies have observed that warmingstimulates RS as well as RA and RH (Peterjohn et al.,1994; McHale et al., 1998; Lin et al., 1999; 2007; Rustadet al., 2001; Melillo et al., 2002; Niinisto et al., 2004;Zhou et al., 2006). The different responses of RS and itscomponents to warming may be different in (semi-)aridthan humid ecosystems (Verburg et al., 2005). In themeta-analysis by Rustad et al. (2001), most of the studies
(a)
(b)
(c)
(d)A
nnua
l soi
l res
pira
tion
(g C
m–2
yr–1
)m
icro
ibia
l re
spira
tion
(g C
m–2
yr–1
)
Fig. 6 Uncertainty of predicted soil respiration (a) and heterotrophicrespiration (b) with 100 randomly selected samples from 40 000samples of Metropolis–Hastings simulation in the warming treat-ment year. Insets show the annual soil (c) and heterotrophic (d)respiration, respectively. The red line (a) and red triangles (c) are thedaily and annual observed soil respiration, respectively, in thewarming treatment year. The blue lines (a, b) and blue triangles (c,d) are the average modeled soil and heterotrophic respiration,respectively, from 40 000 samples. Note that autotrophic respirationis mainly from photosynthesis with low uncertainty and is notshown.
(a) (b)
Fig. 7 A diagram of the mechanisms andprocesses that regulate autotrophic (RA),heterotrophic (RH) and soil (RS) respirationduring a pulse warming experiment. Inthe first 2 months, warming stimulated RH
significantly as a result of enhanced labilecarbon (C) decomposition compared withthe control (a). In this period, warming didnot affect soil moisture significantly. After 2months, warming decreased RA, RH and RS
significantly as a result of decreased soilmoisture, photosynthesis and greennessindex or biomass (b). +, ) and � representpositive, negative and neutral effects. NEE,net ecosystem exchange.
NewPhytologist Research 193
� The Authors (2010)
Journal compilation � New Phytologist Trust (2010)
New Phytologist (2010) 187: 184–198
www.newphytologist.com
were located in humid areas, compared with our studywhich took place in a semi-arid ecosystem. Moreover, ourresults supported Saleska et al.’s (1999) findings, who alsoobserved the negative responses of RS and its components towarming. They speculated that decreases in RA and RH
resulted from a decrease in photosynthetic activity causedby decreased soil moisture, and thus resulted in decreasedRS.
Lagged effects on RA, RH and RS
In the post-treatment period, large lagged effects from theprevious year of warming were observed on RS and its com-ponents, which supported our hypothesis. Both RA and RH
decreased throughout the post-treatment year by 27.3%and 33.3%, respectively, relative to the controls (P <0.0001, df = 1, n = 640; Figs 4, 5 and Table 3). As in thewarming year, the effects of vegetation on RA and RH mayalso be very important, because both NEE and canopy pho-tosynthetic rates decreased during the 1-yr post-treatmentperiod (Fig. S1b). This might coincide with the persistenceof lower soil moisture and a slowing of plant canopy devel-opment in warmed EcoCELLs (Fig. S3; Arnone et al.,2008). In addition, after ending the warming treatment,depletion of fast-cycling labile C pools and a change inmicrobial community may still persist and may take a longtime to recover, resulting in lagged effects. The larger laggedeffects of warming on RH (33.3%) than RA (27.3%) mayresult from a decrease in dead root input in the previousyear (Verburg et al., 2005). Although no studies have beenconducted to examine the lagged effects of warming on RS
and its components, significant lagged effects of warmingoccurred on spring and autumn biomass production andthe increased proportion of C4 species in a field experiment,which was conducted at the location at which intact soilmonoliths for the EcoCELL experiment were extractedusing the same increase in temperature (4�C; Sherry et al.,2008). In addition, several other studies support the pres-ence of lagged effects under drought, precipitation, ozoneand ultraviolet-B radiation (UVBR) exposure (Andersen
et al., 1997; Potter et al., 1999; Lof & Welander, 2000;Wiegand et al., 2004). For example, leaf area, shoot lengthand transpiration were mainly affected by the previous yearof drought in Fagus sylvatica seedlings (Lof & Welander,2000). Lagged effects of precipitation on plant productionhave been demonstrated for a few grasslands and shrublands(Potter et al., 1999; Oesterheld et al., 2001; Wiegand et al.,2004). Decreases in root growth and carbohydrate concen-trations by ozone exposure persisted following the removalof ponderosa pine seedlings from ozone (Andersen et al.,1997). The lagged effects of an anomalously warm year onsoil respiration, its components and NEE suggest that cau-tion should be taken in assessing terrestrial C cycle feedbackto climate warming, as more frequent anomalously warmyears may happen in the future.
Deconvolution analysis with probabilistic inversion
Deconvolution analysis is a systems approach to the under-lying processes of rhizosphere complexity, which was firstintroduced by Luo et al. (2001b) to data from the DukeFree Air CO2 Enrichment (FACE) study. Traditionally,intrusive or isotopic methods have been used to partition RS
into RA and RH, which are essential to help advance ourunderstanding of these processes (Luo & Zhou, 2006). Thisstudy applied deconvolution analysis with a probabilisticinversion technique to partition RS into RA and RH underwarming and post-treatment, showing its potential inunderstanding soil biocomplexity. The deconvoluted resultsare in good agreement with measured RS data (Fig. 3;P = 0.867). Although there were not many measured dataof RA and RH to validate our results, at the end of January2004, RH contributions to soil respiration in our deconvo-lution analysis (83.4% vs 88.3% for control and warming,respectively) were similar to those from direct componentmeasurements by digging the soil and separating roots(91.4% for both control and warming) (A. Darrouzet-Nardi & J. A. Arnone, unpublished). We used anotherexperiment with the constructed cheatgrass ecosystem butapplied the same deconvolution method and EcoCELL data
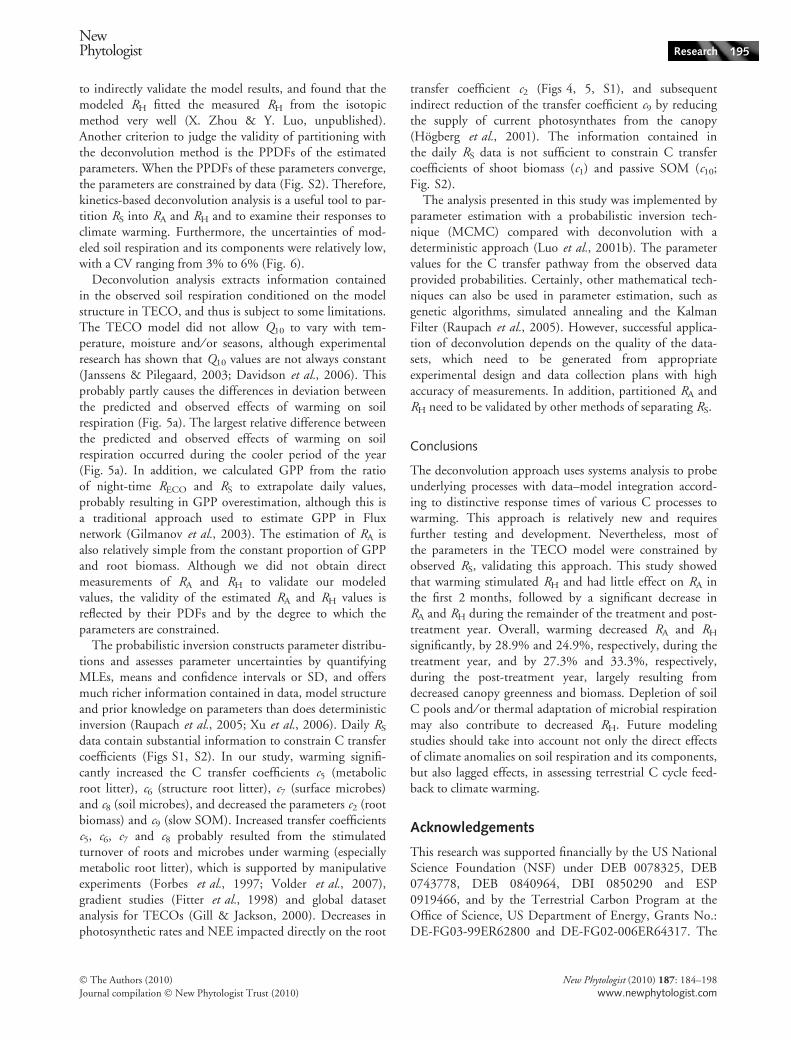
Table 3 Results of ANOVA using a mixed model with treatment and time as fixed factors to show the P values, degrees of freedom (df) andsample size (n) and levels of significance for effects of pretreatment (2002), warming (2003) and post-treatment (2004) on observed soilrespiration (RS), and modeled RS, autotrophic respiration (RA) and heterotrophic respiration (RH)
Pretreatment (2002) Warming (2003) Post-treatment (2004)
P df n P df n P df n
Observed RS 0.347 1 692 < 0.001 1 1460 < 0.001 1 1464Modeled RS 0.125 1 692 < 0.001 1 1460 < 0.001 1 1464Modeled RA 0.195 1 692 < 0.001 1 1460 < 0.001 1 1464Modeled RH 0.089 1 692 < 0.001 1 1460 < 0.001 1 1464Comparison between observed and modeled RS – – 0.589 1 1460 0.909 1 1464
We also show the statistical results of paired Student’s t-test for comparison between observed and modeled RS (P value). Time effects arestatistically significant (P < 0.0001) and time · treatment effects are not significant (P = 1.0) for all analyses, which are shown in the table.
194 Research
NewPhytologist
� The Authors (2010)
Journal compilation � New Phytologist Trust (2010)
New Phytologist (2010) 187: 184–198
www.newphytologist.com
to indirectly validate the model results, and found that themodeled RH fitted the measured RH from the isotopicmethod very well (X. Zhou & Y. Luo, unpublished).Another criterion to judge the validity of partitioning withthe deconvolution method is the PPDFs of the estimatedparameters. When the PPDFs of these parameters converge,the parameters are constrained by data (Fig. S2). Therefore,kinetics-based deconvolution analysis is a useful tool to par-tition RS into RA and RH and to examine their responses toclimate warming. Furthermore, the uncertainties of mod-eled soil respiration and its components were relatively low,with a CV ranging from 3% to 6% (Fig. 6).
Deconvolution analysis extracts information containedin the observed soil respiration conditioned on the modelstructure in TECO, and thus is subject to some limitations.The TECO model did not allow Q10 to vary with tem-perature, moisture and ⁄ or seasons, although experimentalresearch has shown that Q10 values are not always constant(Janssens & Pilegaard, 2003; Davidson et al., 2006). Thisprobably partly causes the differences in deviation betweenthe predicted and observed effects of warming on soilrespiration (Fig. 5a). The largest relative difference betweenthe predicted and observed effects of warming on soilrespiration occurred during the cooler period of the year(Fig. 5a). In addition, we calculated GPP from the ratioof night-time RECO and RS to extrapolate daily values,probably resulting in GPP overestimation, although this isa traditional approach used to estimate GPP in Fluxnetwork (Gilmanov et al., 2003). The estimation of RA isalso relatively simple from the constant proportion of GPPand root biomass. Although we did not obtain directmeasurements of RA and RH to validate our modeledvalues, the validity of the estimated RA and RH values isreflected by their PDFs and by the degree to which theparameters are constrained.
The probabilistic inversion constructs parameter distribu-tions and assesses parameter uncertainties by quantifyingMLEs, means and confidence intervals or SD, and offersmuch richer information contained in data, model structureand prior knowledge on parameters than does deterministicinversion (Raupach et al., 2005; Xu et al., 2006). Daily RS
data contain substantial information to constrain C transfercoefficients (Figs S1, S2). In our study, warming signifi-cantly increased the C transfer coefficients c5 (metabolicroot litter), c6 (structure root litter), c7 (surface microbes)and c8 (soil microbes), and decreased the parameters c2 (rootbiomass) and c9 (slow SOM). Increased transfer coefficientsc5, c6, c7 and c8 probably resulted from the stimulatedturnover of roots and microbes under warming (especiallymetabolic root litter), which is supported by manipulativeexperiments (Forbes et al., 1997; Volder et al., 2007),gradient studies (Fitter et al., 1998) and global datasetanalysis for TECOs (Gill & Jackson, 2000). Decreases inphotosynthetic rates and NEE impacted directly on the root
transfer coefficient c2 (Figs 4, 5, S1), and subsequentindirect reduction of the transfer coefficient c9 by reducingthe supply of current photosynthates from the canopy(Hogberg et al., 2001). The information contained inthe daily RS data is not sufficient to constrain C transfercoefficients of shoot biomass (c1) and passive SOM (c10;Fig. S2).
The analysis presented in this study was implemented byparameter estimation with a probabilistic inversion tech-nique (MCMC) compared with deconvolution with adeterministic approach (Luo et al., 2001b). The parametervalues for the C transfer pathway from the observed dataprovided probabilities. Certainly, other mathematical tech-niques can also be used in parameter estimation, such asgenetic algorithms, simulated annealing and the KalmanFilter (Raupach et al., 2005). However, successful applica-tion of deconvolution depends on the quality of the data-sets, which need to be generated from appropriateexperimental design and data collection plans with highaccuracy of measurements. In addition, partitioned RA andRH need to be validated by other methods of separating RS.
Conclusions
The deconvolution approach uses systems analysis to probeunderlying processes with data–model integration accord-ing to distinctive response times of various C processes towarming. This approach is relatively new and requiresfurther testing and development. Nevertheless, most ofthe parameters in the TECO model were constrained byobserved RS, validating this approach. This study showedthat warming stimulated RH and had little effect on RA inthe first 2 months, followed by a significant decrease inRA and RH during the remainder of the treatment and post-treatment year. Overall, warming decreased RA and RH
significantly, by 28.9% and 24.9%, respectively, during thetreatment year, and by 27.3% and 33.3%, respectively,during the post-treatment year, largely resulting fromdecreased canopy greenness and biomass. Depletion of soilC pools and ⁄ or thermal adaptation of microbial respirationmay also contribute to decreased RH. Future modelingstudies should take into account not only the direct effectsof climate anomalies on soil respiration and its components,but also lagged effects, in assessing terrestrial C cycle feed-back to climate warming.
Acknowledgements
This research was supported financially by the US NationalScience Foundation (NSF) under DEB 0078325, DEB0743778, DEB 0840964, DBI 0850290 and ESP0919466, and by the Terrestrial Carbon Program at theOffice of Science, US Department of Energy, Grants No.:DE-FG03-99ER62800 and DE-FG02-006ER64317. The
NewPhytologist Research 195
� The Authors (2010)
Journal compilation � New Phytologist Trust (2010)
New Phytologist (2010) 187: 184–198
www.newphytologist.com
experiments comply with the current laws of the USA inwhich they were performed.
References
Andersen CP, Wilson R, Plocher M, Hogsett WE. 1997. Carry-over
effects of ozone on root growth and carbohydrate concentrations of
ponderosa pine seedlings. Tree Physiology 17: 805–811.
Arnone JA, Verburg PSJ, Johnson DW, Larsen JD, Jasoni RL, Lucchesi
AJ, Batts CM, von Nagy C, Coulombe WG, Schorran DE et al. 2008.
Prolonged suppression of ecosystem carbon dioxide uptake after an
anomalously warm year. Nature 455: 383–386.
Atkin OK, Scheurwater I, Pons TL. 2007. Respiration as a percentage of
daily photosynthesis in whole plants is homeostatic at moderate, but not
high, growth temperatures. New Phytologist 174: 367–380.
Baggs EM. 2006. Partitioning the components of soil respiration: a
research challenge. Plant and Soil 284: 1–5.
Barrett DJ. 2002. Steady state turnover time of carbon in the Australian
terrestrial biosphere. Global Biogeochemical Cycles 16: 1108. doi:
1110.1029/2002GB001860.
Bhupinderpal-Singh , Nordgren A, Lofvenius MO, Hogberg MN,
Mellander PE, Hogberg P. 2003. Tree root and soil heterotrophic
respiration as revealed by girdling of boreal Scots pine forest: extending
observations beyond the first year. Plant, Cell & Environment 26: 1287–
1296.
Bond-Lamberty B, Wang CK, Gower ST. 2004. A global relationship
between the heterotrophic and autotrophic components of soil
respiration? Global Change Biology 10: 1756–1766.
Boone RD, Nadelhoffer KJ, Canary JD, Kaye JP. 1998. Roots exert a
strong influence on the temperature sensitivity of soil respiration. Nature396: 570–572.
Bradford MA, Davies CA, Frey SD, Maddox TR, Melillo JM, Mohan JE,
Reynolds JF, Treseder KK, Wallenstein MD. 2008. Thermal
adaptation of soil microbial respiration to elevated temperature. EcologyLetters 11: 1316–1327.
Buchmann N. 2000. Biotic and abiotic factors controlling soil respiration
rates in Picea abies stands. Soil Biology & Biochemistry 32: 1625–1635.
Chen JM, Liu J, Cihlar J, Goulden ML. 1999. Daily canopy
photosynthesis model through temporal and spatial scaling for remote
sensing applications. Ecological Modelling 124: 99–119.
Cox PM, Betts RA, Jones CD, Spall SA, Totterdell IJ. 2000. Acceleration
of global warming due to carbon-cycle feedbacks in a coupled climate
model. Nature 408: 184–187.
Davidson EA, Janssens IA, Luo YQ. 2006. On the variability of
respiration in terrestrial ecosystems: moving beyond Q10. Global ChangeBiology 12: 154–164.
De Boeck HJ, Lemmens CMHM, Gielen B, Bossuyt H, Malchair S,
Carnol M, Merckx R, Ceulemans R, Nijs I. 2007. Combined effects of
climate warming and plant diversity loss on above- and below-ground
grassland productivity. Environmental and Experimental Botany 60: 95–
104.
Diffenbaugh NS, Pal JS, Trapp RJ, Giorgi F. 2005. Fine-scale processes
regulate the response of extreme events to global climate change.
Proceedings of the National Academy of Sciences, USA 102: 15774–15778.
Eliasson PE, McMurtrie RE, Pepper DA, Stromgren M, Linder S, Agren
GI. 2005. The response of heterotrophic CO2 flux to soil warming.
Global Change Biology 11: 167–181.
Fitter AH, Graves JD, Self GK, Brown TK, Bogie DS, Taylor K. 1998.
Root production, turnover and respiration under two grassland types
along an altitudinal gradient: influence of temperature and solar
radiation. Oecologia 114: 20–30.
Forbes PJ, Black KE, Hooker JE. 1997. Temperature-induced alteration
to root longevity in Lolium perenne. Plant and Soil 190: 87–90.
Friedlingstein P, Cox P, Betts R, Bopp L, Von Bloh W, Brovkin V,
Cadule P, Doney S, Eby M, Fung I et al. 2006. Climate–carbon cycle
feedback analysis: results from the (CMIP)-M-4 model intercomparison.
Journal of Climate 19: 3337–3353.
Gelfand AE, Smith AFM. 1990. Sampling-based approaches to calculating
marginal densities. Journal of the American Statistical Association 85:
398–409.
Gill RA, Jackson RB. 2000. Global patterns of root turnover for terrestrial
ecosystems. New Phytologist 147: 13–31.
Gilmanov TG, Verma SB, Sims PL, Meyers TP, Bradford JA, Burba GG,
Suyker AE. 2003. Gross primary production and light response
parameters of four Southern Plains ecosystems estimated using
long-term CO2-flux tower measurements. Global Biogeochemical Cycles17: 1071, doi:1010.1029/2002GB002023.
Grogan P, Chapin FS. 2000. Initial effects of experimental warming on
above- and belowground components of net ecosystem CO2 exchange in
arctic tundra. Oecologia 125: 512–520.
Hanson PJ, Edwards NT, Garten CT, Andrews JA. 2000. Separating root
and soil microbial contributions to soil respiration: a review of methods
and observations. Biogeochemistry 48: 115–146.
Hastings WK. 1970. Monte-Carlo sampling methods using Markov
Chains and their applications. Biometrika 57: 97–109.
Hogberg P, Nordgren A, Agren GI. 2002. Carbon allocation between tree
root growth and root respiration in boreal pine forest. Oecologia 132:
579–581.
Hogberg P, Nordgren A, Buchmann N, Taylor AFS, Ekblad A, Hogberg
MN, Nyberg G, Ottosson-Lofvenius M, Read DJ. 2001. Large-scale
forest girdling shows that current photosynthesis drives soil respiration.
Nature 411: 789–792.
IPCC. 2007. Climate change 200: the physical science basis. Cambridge,
UK: Cambridge University Press.
Janssens IA, Pilegaard K. 2003. Large seasonal changes in Q10 of soil
respiration in a beech forest. Global Change Biology 9: 911–918.
Jassal RS, Black TA. 2006. Estimating heterotrophic and autotrophic soil
respiration using small-area trenched plot technique: theory and
practice. Agricultural and Forest Meteorology 140: 193–202.
Jenkinson DS, Adams DE, Wild A. 1991. Model estimates of CO2
emissions from soil in response to global warming. Nature 351: 304–
306.
Jentsch A, Kreyling J, Beierkuhnlein C. 2007. A new generation of
climate-change experiments: events, not trends. Frontiers in Ecology andthe Environment 5: 365–374.
Jonasson S, Michelsen A, Schmidt IK, Nielsen EV. 1999. Responses in
microbes and plants to changed temperature, nutrient, and light regimes
in the arctic. Ecology 80: 1828–1843.
Klein JA, Harte J, Zhao XQ. 2007. Experimental warming, not grazing,
decreases rangeland quality on the Tibetan Plateau. EcologicalApplications 17: 541–557.
Kuzyakov Y. 2006. Sources of CO2 efflux from soil and review of
partitioning methods. Soil Biology & Biochemistry 38: 425–448.
Lavigne MB, Boutin R, Foster RJ, Goodine G, Bernier PY, Robitaille G.
2003. Soil respiration responses to temperature are controlled more by
roots than by decomposition in balsam fir ecosystems. Canadian Journalof Forest Research-Revue Canadienne de Recherche Forestiere 33: 1744–
1753.
Ledig FT, Drew AP, Clark JG. 1976. Maintenance and constructive
respiration, photosynthesis, and net assimilation rate in seedlings of
Pitch Pine (Pinus rigida Mill). Annals of Botany 40: 289–300.
Lellei-Kovacs E, Kovacs-Lang E, Kalapos T, Botta-Dukat Z, Barabas S,
Beier C. 2008. Experimental warming does not enhance soil respiration
in a semiarid temperate forest–steppe ecosystem. Community Ecology 9:
29–37.
Lin GH, Ehleringer JR, Rygiewicz PT, Johnson MG, Tingey DT. 1999.
Elevated CO2 and temperature impacts on different components of soil
196 Research
NewPhytologist
� The Authors (2010)
Journal compilation � New Phytologist Trust (2010)
New Phytologist (2010) 187: 184–198
www.newphytologist.com
CO2 efflux in Douglas-fir terracosms. Global Change Biology 5: 157–
168.
Lin GH, Rygiewicz PT, Ehleringer JR, Johnson MG, Tingey DT. 2001.
Time-dependent responses of soil CO2 efflux components to elevated
atmospheric [CO2] and temperature in experimental forest mesocosms.
Plant and Soil 229: 259–270.
Lof M, Welander NT. 2000. Carry-over effects on growth and
transpiration in Fagus sylvatica seedlings after drought at various stages
of development. Canadian Journal of Forest Research-Revue Canadiennede Recherche Forestiere 30: 468–475.
Luo YQ. 2007. Terrestrial carbon-cycle feedback to climate warming.
Annual Review of Ecology Evolution and Systematics 38: 683–712.
Luo YQ, Reynolds JF. 1999. Validity of extrapolating field CO2
experiments to predict carbon sequestration in natural ecosystems.
Ecology 80: 1568–1583.
Luo YQ, Wan SQ, Hui DF, Wallace LL. 2001a. Acclimatization of soil
respiration to warming in a tall grass prairie. Nature 413: 622–625.
Luo YQ, Weng ES, Wu XW, Gao C, Zhou XH, Zhang L. 2009.
Parameter identifiability, constraint, and equifinality in data assimilation
with ecosystem models. Ecological Applications 19: 571–574.
Luo YQ, White LW, Canadell JG, DeLucia EH, Ellsworth DS, Finzi A,
Lichter J, Schlesinger WH. 2003. Sustainability of terrestrial carbon
sequestration: a case study in Duke Forest with inversion approach.
Global Biogeochemical Cycles 17: 1021, doi:1010.1029/2002GB001923.
Luo YQ, Wu LH, Andrews JA, White L, Matamala R, Schafer KVR,
Schlesinger WH. 2001b. Elevated CO2 differentiates ecosystem carbon
processes: deconvolution analysis of Duke Forest FACE data. EcologicalMonographs 71: 357–376.
Luo Y, Zhou X. 2006. Soil respiration and the environment. San Diego,
CA, USA: Academic Press ⁄ Elsevier.
McCarthy MA. 2007. Bayesian methods for ecology. Cambridge, UK; New
York, NY, USA: Cambridge University Press.
McGuire AD, Sitch S, Clein JS, Dargaville R, Esser G, Foley J, Heimann
M, Joos F, Kaplan J, Kicklighter DW et al. 2001. Carbon balance of
the terrestrial biosphere in the twentieth century: analyses of CO2,
climate and land use effects with four process-based ecosystem models.
Global Biogeochemical Cycles 15: 183–206.
McHale PJ, Mitchell MJ, Bowles FP. 1998. Soil warming in a northern
hardwood forest: trace gas fluxes and leaf litter decomposition. CanadianJournal of Forest Research-Revue Canadienne de Recherche Forestiere 28:
1365–1372.
Melillo JM, Steudler PA, Aber JD, Newkirk K, Lux H, Bowles FP,
Catricala C, Magill A, Ahrens T, Morrisseau S. 2002. Soil warming
and carbon-cycle feedbacks to the climate system. Science 298: 2173–
2176.
Metropolis N, Rosenbluth AW, Rosenbluth MN, Teller AH, Teller E.
1953. Equation of state calculations by fast computing machines.
Journal of Chemical Physics 21: 1087–1092.
Niinisto SM, Silvola J, Kellomaki S. 2004. Soil CO2 efflux in a boreal
pine forest under atmospheric CO2 enrichment and air warming. GlobalChange Biology 10: 1363–1376.
Oesterheld M, Loreti J, Semmartin M, Sala OE. 2001. Inter-annual
variation in primary production of a semi-arid grassland related to
previous-year production. Journal of Vegetation Science 12: 137–142.
Peterjohn WT, Melillo JM, Steudler PA, Newkirk KM, Bowles FP, Aber
JD. 1994. Responses of trace gas fluxes and N availability to
experimentally elevated soil temperatures. Ecological Applications 4: 617–
625.
Post WM, King AW, Wullschleger SD. 1997. Historical variations in
terrestrial biospheric carbon storage. Global Biogeochemical Cycles 11:
99–109.
Potter CS, Klooster S, Brooks V. 1999. Interannual variability in
terrestrial net primary production: exploration of trends and controls on
regional to global scales. Ecosystems 2: 36–48.
Raich JW, Potter CS, Bhagawati D. 2002. Interannual variability in
global soil respiration, 1980–94. Global Change Biology 8: 800–812.
Raich JW, Rastetter EB, Melillo JM, Kicklighter DW, Steudler PA,
Peterson BJ, Grace AL, Moore B, Vorosmarty CJ. 1991. Potential net
primary productivity in South America – application of a global-model.
Ecological Applications 1: 399–429.
Raich JW, Schlesinger WH. 1992. The global carbon-dioxide flux in soil
respiration and its relationship to vegetation and climate. Tellus Series B-Chemical and Physical Meteorology 44: 81–99.
Raupach MR, Rayner PJ, Barrett DJ, DeFries RS, Heimann M,
Ojima DS, Quegan S, Schmullius CC. 2005. Model-data synthesis
in terrestrial carbon observation: methods, data requirements
and data uncertainty specifications. Global Change Biology 11:
378–397.
Reich PB, Walters MB, Tjoelker MG, Vanderklein D, Buschena C.
1998. Photosynthesis and respiration rates depend on leaf and root
morphology and nitrogen concentration in nine boreal tree species
differing in relative growth rate. Functional Ecology 12: 395–405.
Reichstein M, Ciais P, Papale D, Valentini R, Running S, Viovy N,
Cramer W, Granier A, Ogee J, Allard V et al. 2007. Reduction of
ecosystem productivity and respiration during the European summer
2003 climate anomaly: a joint flux tower, remote sensing and modelling
analysis. Global Change Biology 13: 634–651.
Rey A, Pegoraro E, Tedeschi V, De Parri I, Jarvis PG, Valentini R. 2002.
Annual variation in soil respiration and its components in a coppice oak
forest in Central Italy. Global Change Biology 8: 851–866.
Rochette P, Flanagan LB, Gregorich EG. 1999. Separating soil
respiration into plant and soil components using analyses of the
natural abundance of carbon-13. Soil Science Society of America Journal63: 1207–1213.
Roulier S, Jarvis N. 2003. Modeling macropore flow effects on pesticide
leaching: inverse parameter estimation using microlysimeters. Journal ofEnvironmental Quality 32: 2341–2353.
Rustad LE, Campbell JL, Marion GM, Norby RJ, Mitchell MJ, Hartley
AE, Cornelissen JHC, Gurevitch J, GCTE-NEWS. 2001. A meta-
analysis of the response of soil respiration, net nitrogen mineralization,
and aboveground plant growth to experimental ecosystem warming.
Oecologia 126: 543–562.
Ryan MG. 1991. A simple method for estimating gross carbon budgets for
vegetation in forest ecosystems. Tree Physiology 9: 255–266.
Saleska SR, Harte J, Torn MS. 1999. The effect of experimental
ecosystem warming on CO2 fluxes in a montane meadow. GlobalChange Biology 5: 125–141.
Saltelli A. 2004. Sensitivity analysis in practice: a guide to assessing scientificmodels. Hoboken, NJ, USA: Wiley.
Schimel DS, Braswell BH, Holland EA, Mckeown R, Ojima DS, Painter
TH, Parton WJ, Townsend AR. 1994. Climatic, edaphic, and biotic
controls over storage and turnover of carbon in soils. GlobalBiogeochemical Cycles 8: 279–293.
Shaver GR, Canadell J, Chapin FS, Gurevitch J, Harte J, Henry G,
Ineson P, Jonasson S, Melillo J, Pitelka L et al. 2000. Global warming
and terrestrial ecosystems: a conceptual framework for analysis.
BioScience 50: 871–882.
Sherry RA, Weng ES, Arnone JA, Johnson DW, Schimel DS, Verburg
PS, Wallace LL, Luo YQ. 2008. Lagged effects of experimental
warming and doubled precipitation on annual and seasonal
aboveground biomass production in a tallgrass prairie. Global ChangeBiology 14: 2923–2936.
Subke JA, Inglima I, Cotrufo MF. 2006. Trends and methodological
impacts in soil CO2 efflux partitioning: A meta-analytical review. GlobalChange Biology 12: 921–943.
Tang JW, Baldocchi DD, Xu L. 2005. Tree photosynthesis modulates soil
respiration on a diurnal time scale. Global Change Biology 11: 1298–
1304.
NewPhytologist Research 197
� The Authors (2010)
Journal compilation � New Phytologist Trust (2010)
New Phytologist (2010) 187: 184–198
www.newphytologist.com
Thornley JHM, Cannell MGR. 2000. Modelling the components of
plant respiration: representation and realism. Annals of Botany 85:
55–67.
Tingey DT, McVeety BD, Waschmann R, Johnson MG, Phillips DL,
Rygiewicz PT, Olszyk DM. 1996. A versatile sun-lit controlled-
environment facility for studying plant and soil processes. Journal ofEnvironmental Quality 25: 614–625.
Trumbore S. 2000. Age of soil organic matter and soil respiration:
radiocarbon constraints on belowground C dynamics. EcologicalApplications 10: 399–411.
Verburg PSJ, Arnone JA, Obrist D, Schorran DE, Evans RD, Leroux-
Swarthout D, Johnson DW, Luo YQ, Coleman JS. 2004. Net
ecosystem carbon exchange in two experimental grassland ecosystems.
Global Change Biology 10: 498–508.
Verburg PSJ, Larsen J, Johnson DW, Schorran DE, Arnone JA. 2005.
Impacts of an anomalously warm year on soil CO2 efflux in
experimentally manipulated tallgrass prairie ecosystems. Global ChangeBiology 11: 1720–1732.
Volder A, Gifford RM, Evans JR. 2007. Effects of elevated atmospheric
CO2, cutting frequency, and differential day ⁄ night atmospheric
warming on root growth and turnover of Phalaris swards. Global ChangeBiology 13: 1040–1052.
Wan S, Norby RJ, Ledford J, Weltzin JF. 2007. Responses of soil
respiration to elevated CO2, air warming, and changing soil water
availability in a model old-field grassland. Global Change Biology 13:
2411–2424.
Wiegand T, Snyman HA, Kellner K, Paruelo JM. 2004. Do grasslands
have a memory: modeling phytomass production of a semiarid South
African grassland. Ecosystems 7: 243–258.
Xu T, White L, Hui DF, Luo YQ. 2006. Probabilistic inversion of a
terrestrial ecosystem model: analysis of uncertainty in parameter
estimation and model prediction. Global Biogeochemical Cycles 20:
GB2007. doi: 2010.1029/2005GB002468.
Zhou XH, Sherry RA, An Y, Wallace LL, Luo YQ. 2006. Main and
interactive effects of warming, clipping, and doubled precipitation on
soil CO2 efflux in a grassland ecosystem. Global Biogeochemical Cycles20: GB1003. doi: 1010.1029/2005GB002526.
Zhou X, Wan SQ, Luo YQ. 2007. Source components and interannual
variability of soil CO2 efflux under experimental warming and clipping
in a grassland ecosystem. Global Change Biology 13: 761–775.
Supporting Information
Additional supporting information may be found in theonline version of this article.
Methods S1 EcoCELL experimental system, measurementmethods of soil respiration (RS) and net ecosystem exchange(NEE), Metropolis–Hastings algorithm and model para-meter estimation for maximum likelihood estimators(MLEs), means and cross-correlations.
Fig. S1 Measured daily values of soil respiration and netecosystem exchange (NEE) at a pulse warming experimentin the EcoCELL facility of Desert Research Institute,Nevada, from August 2002 to February 2005.
Fig. S2 Inversion results showing the histograms of 10 esti-mated C transfer coefficients and three parameters of tem-perature and moisture effects with 40 000 samples fromMetropolis–Hastings simulation under control, warmingand post-treatment for each EcoCELL.
Fig. S3 Measured daily soil moisture at a pulse warmingexperiment in the EcoCELL facility of Desert ResearchInstitute, Nevada, from August 2002 to February 2005.
Please note: Wiley-Blackwell are not responsible for thecontent or functionality of any supporting information sup-plied by the authors. Any queries (other than missing mate-rial) should be directed to the New Phytologist CentralOffice.
198 Research
NewPhytologist
� The Authors (2010)
Journal compilation � New Phytologist Trust (2010)
New Phytologist (2010) 187: 184–198
www.newphytologist.com
Related Documents