1211 TRANSPORTATION RESEARCH RECORD Concrete Bridge Design and Maintenance: Steel Corrosion in Concrete TRANSPORTATION RESEARCH BOARD NA TI ON AL RESEARCH COUNCIL WASHINGTON, D.C. 1989

Welcome message from author
This document is posted to help you gain knowledge. Please leave a comment to let me know what you think about it! Share it to your friends and learn new things together.
Transcript
1211 TRANSPORTATION RESEARCH RECORD
Concrete Bridge Design and Maintenance: Steel Corrosion in Concrete
TRANSPORTATION RESEARCH BOARD NA TI ON AL RESEARCH COUNCIL
WASHINGTON, D.C. 1989
Transportation Research Record 1211 Price: $15.50
mode 1 highway transportation
subject areas 25 structures design and performance 33 construction 40 maintenance
PUBLICATIONS STAFF Director of Publications: Nancy A. Ackerman Senior Editor: Edylhe T. Crump Associate Editors: Naomi C. Kassabian
Ruth S. Pitt Alison G. Tobias
Production Editor: Kieran P. O'Leary Graphics Coordinator: Karen L. White Office Manager: Phyllis D. Barber Production Assistant: Betty L. Hawkins
Printed in the United States of America
Library or Congress Cataloging-in-Publication Data National Research Council. Transportation Research Board .
Concrete bridge design and maintenance : steel corrosion in concrete.
p. cm.-(Transportation research record, ISSN 0361-1981 1211)
ISBN 0-309-04808-7 1. Bridges, Concrete-Corrosion. 2. Reinforced concrcte
Corrosion. 3. Reinforcing bars-Corrosion. I. National Research Council (U.S.). Transportation Research Board. II. Series. TE7.H5 no. 1211 [TG414] 388 s-dc20 [624'.2] 89-13695
CIP
Sponsorship of Transportation Research Record 1211
GROUP 2-DESIGN AND CONSTRUCTION OF TRANSPORTATION FACILITIES Raymond A. Forsyth, California Department of Transportation
Concrete Section Thomas J. Pasko, Jr., Federal Highway Administration
Committee on Chemical Additions and Admixtures for Concrete William F. Boles, Bernard C. Brown, John W. Bugler, Ramon L. Carrasquillo, Henry H. Duval, Jr., Richard D. Gaynor, W. J. Head, Inam Jawed, Daniel P. Johnston, Louis A. Kuhlmann, T. J. Larsen, Michael F. Pistilli, Joseph H. Pound, V. Ramakrishnan, Lawrence R. Roberts, Philip A. Rosskopf, Raymond J. Schutz, Maris A. Sermolins, A. Haleem Tahir
GROUP ~PERATION, SAFETY, AND MAINTENANCE OF TRANSPORTATION FACILITIES Chairman: James I. Taylor, University of Notre Dame
Maintenance Section
Committee on Structures Maintenance Chairman: Robert N. Kamp, Byrd Tallamy MacDonald & Lewis Bernard R. Appleman, William G. Byers, Ian J. Dussek, Gill M. Gautreau, Keith Giles, Ray W. James, Eldon D. Klein, Robert H. Krier, Jimmy D. Lee, Patrick McCarthy, Daniel D. McGeehan, Wallace T. McKee/, Jr., Daniel S. O'Connor, Jack W, Roberts, George P. Romack, Arunprakash M. Shirole, Lloyd M. Smith, Robert A. P. Sweeney, Alden L. West
Committee on Corrosion Chairman: Andrew D. Halverson, Minnesota Department of
Transportation John A. Apostolos, John E. Bennett, Kenneth J. Boedecker, John P. Broomfield, Kenneth C. Clear, Gerardo G. Clemena, Carl F. Crumpton, Robert J. Girard, Robert H. Heidersbach, Jr., Donald R. Jackson, Daniel P. Johnston, Carl E. Locke, Jr. , David G. Manning, A. P. Moser, Arnold M. Rosenberg, Ellen G. Segan, Robert G. Tracy, Yash Paul Virmani, Ronald W. Zurilla
Adrian G. Clary, Transportation Research Board staff
Sponsorship is indicated by a footnote at the end of each paper. The organizational units, officers, and members are as of December 31, 1988.
NOTICE: The Transportation Research Board does not endorse products or manufacturers. Trade and manufacturers' names appear in this Record because they are considered essential to its object.
Transportation Research Board publications are available by ordering directly from TRB. They may also be obtained on a regular basis through organizational or individual affiliation with TRB; affiliates or library subscribers are eligible for substantial discounts. For further information, write to the Transportation Research Board, National Research Council, 2101 Constitution Avenue, N.W., Washington, D.C. 20418.
Transportation Research Record 1211
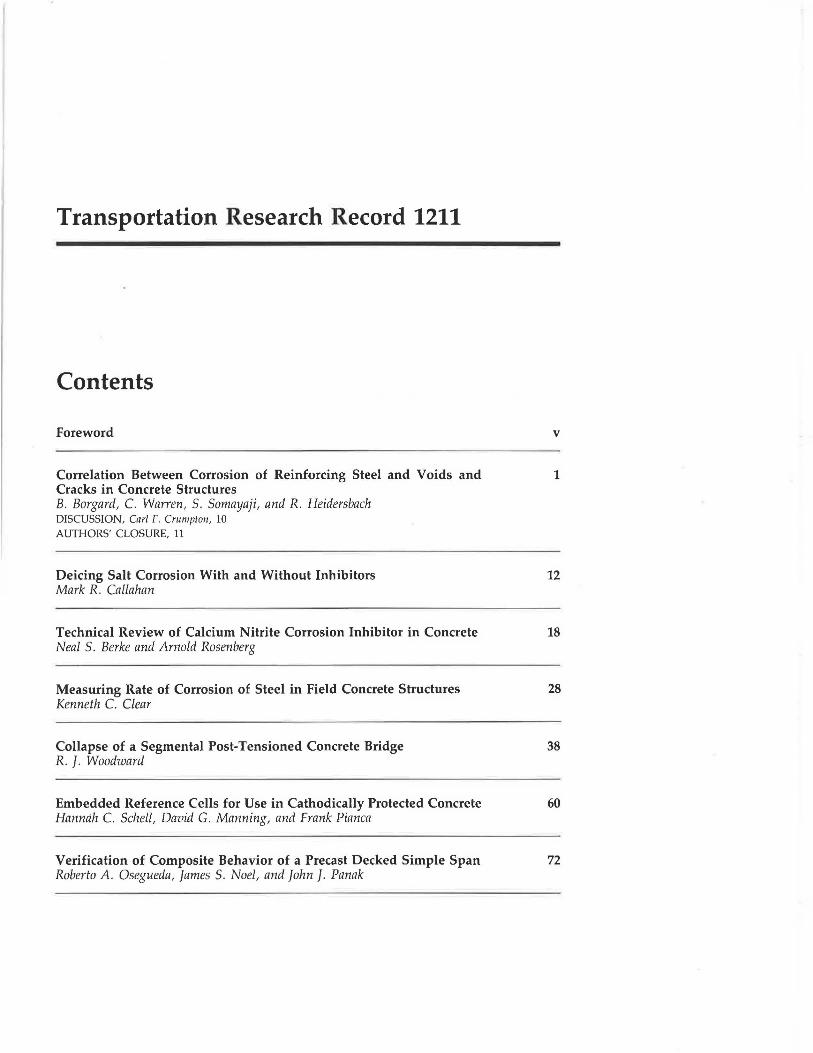
Contents
Foreword
Correlation Between Corrosion of Reinforcing Steel and Voids and Cracks in Concrete Structures B. Borgard, C. Warren, S. Somayaji, and R. Heidersbach DISCUSSION, Carl F. Crumpton, 10 AUTHORS' CLOSURE, 11
Deicing Salt Corrosion With and Without Inhibitors Mark R. Callahan
Technical Review of Calcium Nitrite Corrosion Inhibitor in Concrete Neal S. Berke and Arnold Rosenberg
Measuring Rate of Corrosion of Steel in Field Concrete Structures Kenneth C. Clear
Collapse of a Segmental Post-Tensioned Concrete Bridge R. J. Woodward
Embedded Reference Cells for Use in Cathodically Protected Concrete Hannah C. Schell, David G. Manning, and Frank Pianca
Verification of Composite Behavior of a Precast Decked Simple Span Roberto A. Osegueda, James S. Noel , and John J. Panak
v
1
12
18
28
38
60
72

Detection of Flaws in Bars and Cables in Concrete Bridge Structures Al Ghorbanpoor and Theodore E. Shew
Dynamic Optimization Model for Bridge Management Systems Yi Jiang and Kumares C. Sinha
84
92
Foreword
The nine papers in this Record, which deal with various means and methods for extending the life of concrete structures, should be of interest to engineers working in design, construction, maintenance, and materials.
Borgard et al. discuss the relationship between cracking patterns and corrosion of the reinforcing steel in concrete structures. They describe in detail the corrosion found in several concrete structures, including parking garages, walls, bridge decks, and pavement overlays and propose a causal relationship between the cracking patterns and the corrosion. Crumpton offers a different interpretation of the findings.
Callahan reports on an Iowa research project that sought to determine whether any of four alternative deicing chemicals could inhibit the corrosion of reinforcing steel in concrete structures. A diluted solution of each of the deicing chemicals was applied to a steel sample by immersion and to a reinforced concrete block by ponding; a diluted solution of NaCl was also applied. Test results are compared.
Berke and Rosenberg present a historical review of the literature on the use of calcium nitrite as an additive to concrete mix to reduce corrosion in reinforcing steel and to improve the concrete's compressive strength and freeze-thaw durability.
Clear presents results of an effort using the linear polarization technique to measure the rate of steel corrosion in concrete structures. Resulting information is discussed, as well as how it can be used to project future distress and its rate of change.
An investigation into the collapse of a 33-year-old, segmental, post-tensioned concrete bridge in Wales is described in the paper by Woodward. This account discusses the bridge's structural characteristics and its inspection history. Findings of the investigation have resulted in concern about the condition of other post-tensioned concrete bridges in which tendons pass through joints.
Schell et al. describe the use of embedded reference cells to measure steel's electrical potential in cathodically protected, reinforced concrete members. Electrical potential must be measured accurately to monitor the level of cathodic protection provided for the reinforcing steel. The indoor and outdoor laboratory and field tests performed to evaluate the suitability of a number of embedded reference cells are described.
Described by Osegueda et al. are the results of a study conducted to verify that a simple span bridge redecked with precast concrete panels connected by steel studs to the supporting beam system can act as a full-composite structure. The construction and installation procedures of the precast deck and the procedures used to obtain field measurements are discussed, as are findings on the evaluation of a full-composite finite element model used to identify the degree of composite interaction achieved.
Ghorbanpoor and Shew focus on the use of a nondestructive evaluative technique using the Magnetic Field Disturbance (MFD) system to detect flaws in reinforcing and prestressing steel in concrete bridges. The authors describe the laboratory and field studies performed, the limitations of the equipment used, and the accuracy of the results obtained in terms of a percent loss of the steel cross-sectional area.
Jiang and Sinha describe a bridge management system to help bridge managers to make consistent and cost-effective decisions related to maintenance, rehabilitation, and replacement of bridges systemwide. The procedure uses dynamic programming, integer linear programming, and Markov chain.
v

TRANSPORT A T!ON RESEARCH RECORD 1211
Correlation Between Corrosion of Reinforcing Steel and Voids and Cracks in Concrete Structures
B. BoRGARD, C. WARREN, S. SoMAYAJI, AND R. HEIDERSBACH
The corrosion of metals in concrete is a multibillion-dollar problem in the United States. Most of the corrosion-in-concrete literature claims that deicing salts, or other sources of environmental chlorides, permeate concrete structures and lead to corrosion, which causes subsequent cracking of the overlying concrete. This report presents the results of analyses of corroded reinforced concrete structures and correlates structural loading patterns, cracking, and corrosion. The results of these analyses support the conclusion that, for the structures analyzed, the corrosion was a consequence of cracking.
The corrosion of metals in concrete and similar cementitious materials has been a matter of concern for decades. Some of the earliest National Bureau of Standards (NBS) reports discussed corrosion in concrete (1,2), and a 1940s NBS report dealt with corrosion in masonry buildings (3).
Industrial practice through the 1960s was to assume that "quality concrete" would limit or prevent corrosion. Emphasis was placed on following quality control procedures, maintaining adequate depth of cover (2.5 cm or more, depending on the authority in question) ( 4), and using concrete with low water :cement ratios and high cement factors (5).
Although there were isolated failures of metals in concrete (5-8), and some limited research reports (9), interest in this subject was at a low level until problems associated with the United States interstate highway program began to attract attention in the early 1970s (10). Since that time virtually all concrete-related corrosion research in the United States has been directed at highway bridges and structures. The focus of this effort is justified by the magnitude of the highway problem, which has been estimated to require billions of dollars in the United States (11,12).
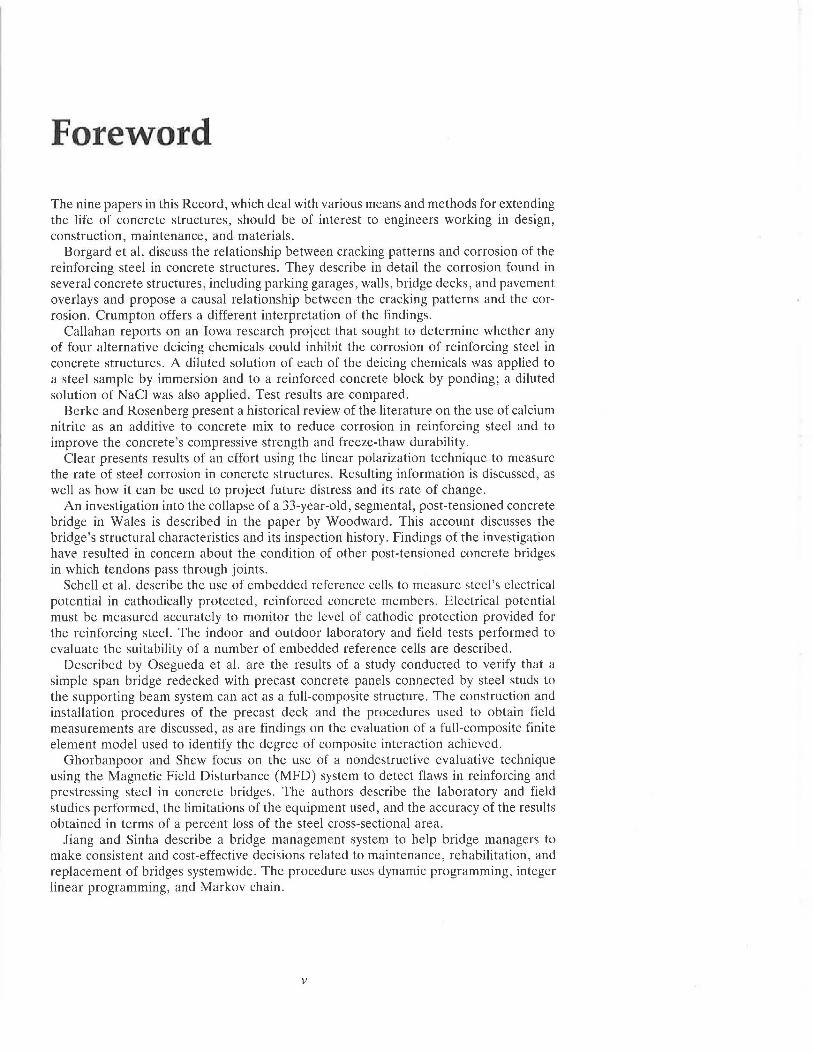
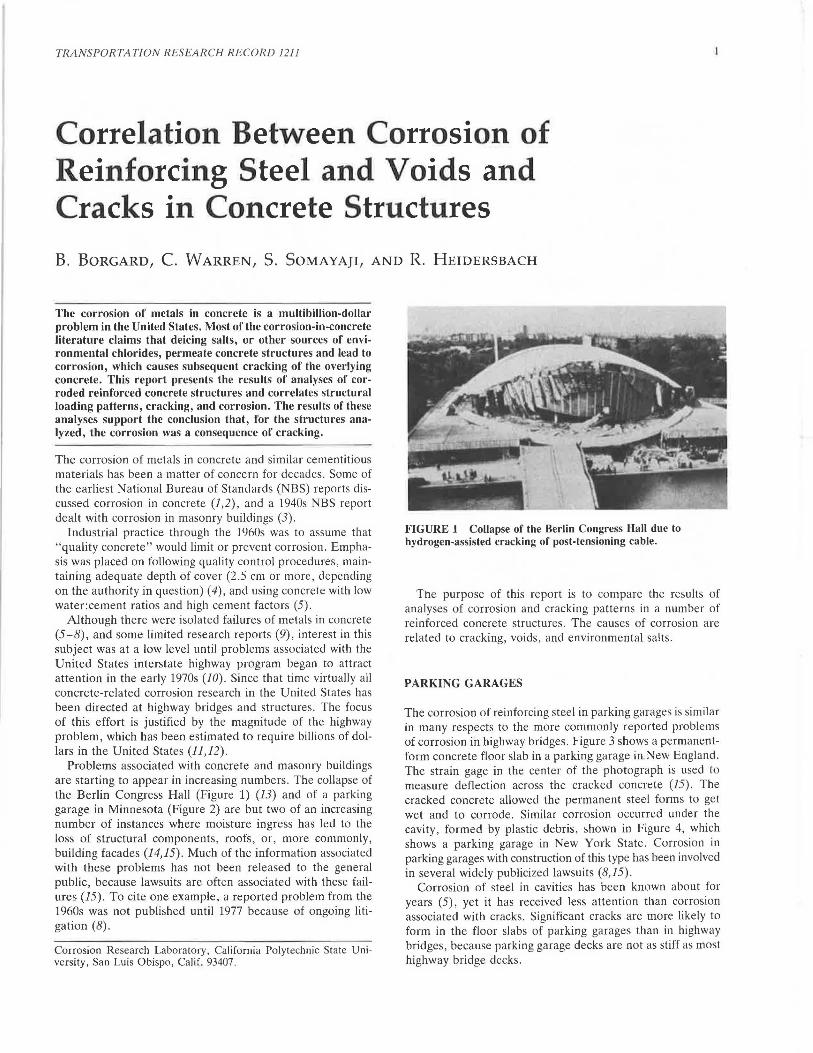
Problems associated with concrete and masonry buildings are starting to appear in increasing numbers. The collapse of the Berlin Congress Hall (Figure 1) (13) and of a parking garage in Minnesota (Figure 2) are but two of an increasing number of instances where moisture ingress has led to the loss of structural components, roofs, or, more commonly, building facades (14,15). Much of the information associated with these problems has not been released to the general public, because lawsuits are often associated with these fa ilures (15). To cite one example, a reported problem from the 1960s was not published until 1977 because of ongoing litigation (8).
Corrosion Research Laboratory , California Polytechnic State University, San Luis Obispo, Calif. 93407.
--~
FIGURE 1 Collapse of the Berlin Congress Hall due to hydrogen-assisted cracking of post-tensioning cable.
The purpose of this report is to compare the results of analyses of corrosion and cracking patterns in a number of reinforced concrete structures. The causes of corrosion are related to cracking, voids , and environmental salts .
PARKING GARAGES
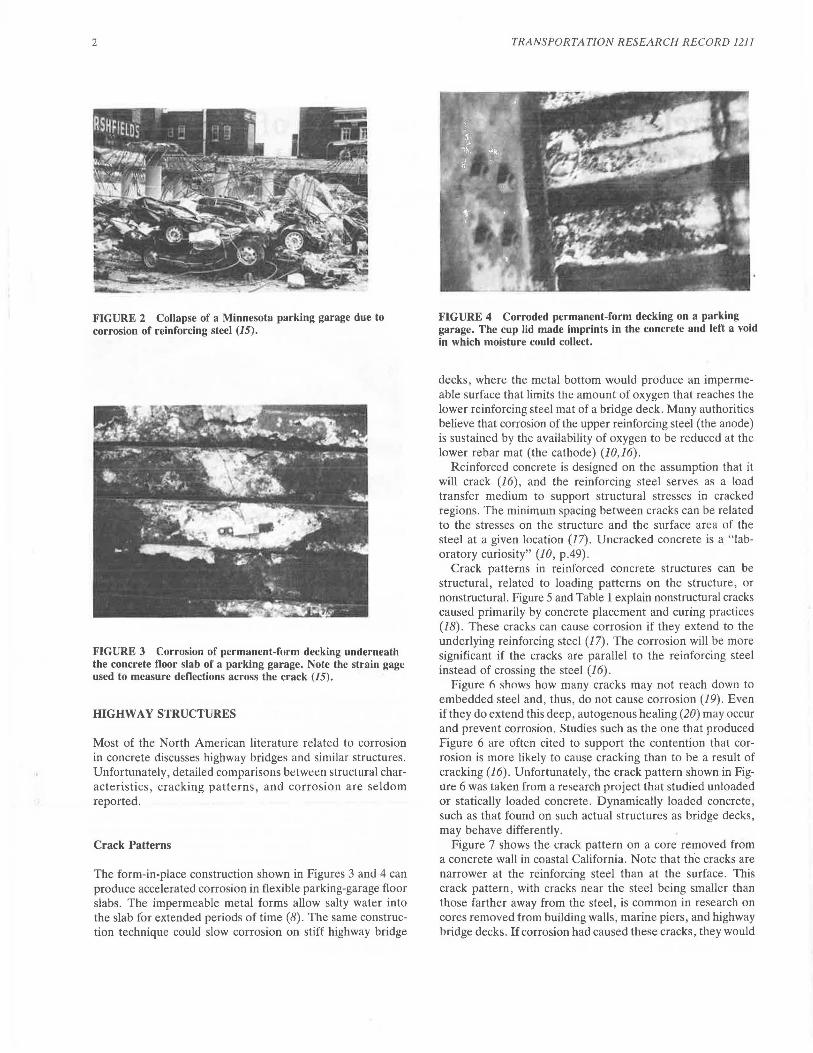
The corrosion of reinforcing steel in parking garages is similar in many respects to the more commonly reported problems of corrosion in highway bridges. Figure 3 shows a permanentform concrete floor slab in a parking garage in.New England. The strain gage in the center of the photograph is used to measure deflection across the cracked concrete (15). The cracked concrete allowed the permanent steel forms to get wet and to corrode. Similar corrosion occurred under the cavity , formed by plastic debris, shown in Figure 4, which shows a parking garage in New York State. Corrosion in parking garages with construction of this type has been involved in several widely publicized lawsuits (8,15).
Corrosion of steel in cavities has been known about for years (5), yet it has received less attention than corrosion associated with cracks. Significant cracks are more likely to form in the floor slabs of parking garages than in highway bridges , because parking garage decks are not as stiff as most highway bridge decks.
2
FIGURE 2 Collapse of a Minnesota parking garage due to corrosion of reinforcing steel (15).
FIGURE 3 Corrosion of permanent-form decking underneath the concrete floor slab of a parking garage. Note the strain gage used to measure deflections across the crack (15).
HIGHWAY STRUCTURES
Most of the North American literature related to corrosion in concrete discusses highway bridges and similar structures. Unfortunately, detailed comparisons between structural characteristics , cracking patterns, and corrosion are seldom reported.
Crack Patterns
The form-in-place construction shown in Figures 3 and 4 can produce accelerated corrosion in flexible parking-garage floor slabs. The impermeable metal forms allow salty water into the slab for extended periods of time (8) . The same construction technique could slow corrosion on stiff highway bridge
TRANSPORTATION RESEARCH RECORD 1211
FIGURE 4 Corroded permanent-form decking on a parking garage. The cup lid made imprints in the concrete and left a void in which moisture could collect.
decks , where the metal bottom would produce an impermeable surface that limits the amount of oxygen that reaches the lower reinforcing steel mat of a bridge deck. Many authorities believe that corrosion of the upper reinforcing steel (the anode) is sustained by the availability of oxygen to be reduced at the lower rebar mat (the cathode) (10,16).
Reinforced concrete is designed on the assumption that it will crack (16), and the reinforcing steel serves as a load transfer medium to support structural stresses in cracked regions. The minimum spacing between cracks can be related to the stresses on the structure and the surface area of the steel at a given location (17). Uncracked concrete is a "laboratory curiosity" (10, p.49) .
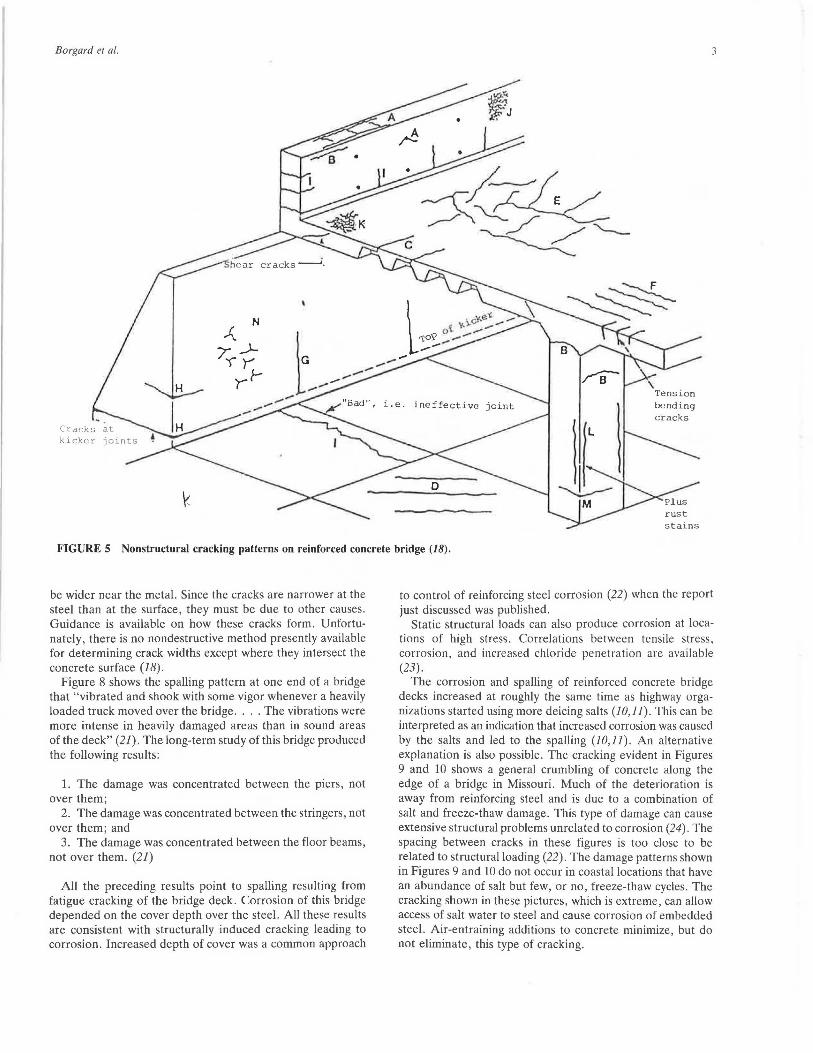
Crack patterns in reinforced concrete structures can be structural, related to loading patterns on the structure, or nonstructural. Figure 5 and Table 1 explain nonstructural cracks causeu primarily by concrete placement and curing practices (J 8). These cracks can cause corrosion if they extend to the underlying reinforcing steel (17). The corrosion will be more significant if the cracks are parallel to the reinforcing steel instead of crossing the steel (16) .
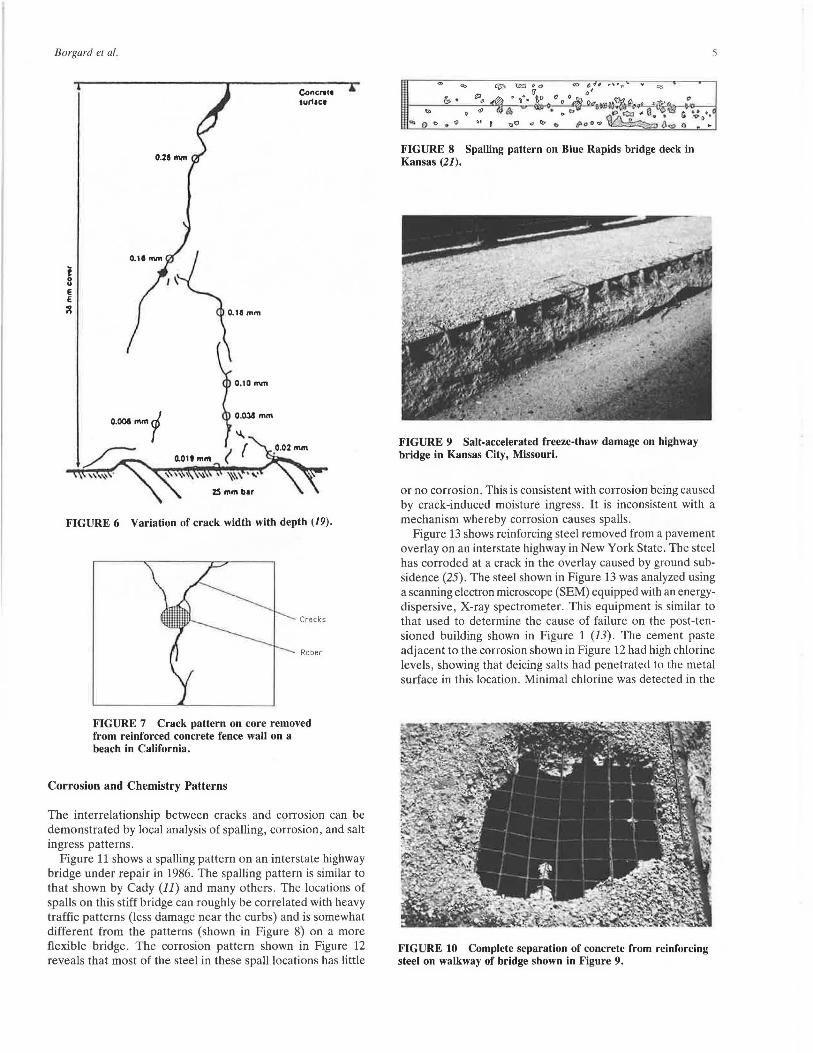
Figure 6 shows how many cracks may not reach down to embedded steel and, thus, do not cause corrosion (19). Even if they do extend this deep, autogenous healing (20) may occur and prevent corrosion. Studies such as the one that produced Figure 6 are often cited to support the contention that corrosion is more likely to cause cracking than to be a result of cracking (16). Unfortunately , the crack pattern shown in Figure 6 was taken from a research project that studied unloaded or statically loaded concrete. Dynamically loaded concrete, such as that found on such actual structures as bridge decks, may behave differently.
Figure 7 shows the crack pattern on a core removed from a concrete wall in coastal California. Note that the cracks are narrower at the reinforcing steel than at the surface. This crack pattern, with cracks near the steel being smaller than those farther away from the steel, is common in research on cores removed from building walls, marine piers, and highway bridge decks. If corrosion had caused these cracks, they would
Borgard et al.
FIGURE 5 Nonstructural cracking patterns on reinforced concrete bridge (18).
be wider near the metal. Since the cracks are narrower at the steel than at the surface, they must be due to other causes. Guidance is available on how these cracks form. Unfortunately, there is no nondestructive method presently available for determining crack widths except where they intersect the concrete surface (18).
Figure 8 shows the spalling pattern at one end of a bridge that "vibrated and shook with some vigor whenever a heavily loaded truck moved over the bridge .... The vibrations were more intense in heavily damaged areas than in sound areas of the deck" (21). The long-term study of this bridge produced the following results:
1. The damage was concentrated between the piers, not over them;
2. The damage was concentrated between the stringers, not over them; and
3. The damage was concentrated between the floor beams, not over them. (21)
All the preceding results point to spalling resulting from fatigue cracking of the bridge deck. Corrosion of this bridge depended on the cover depth over the steel. All these results are consistent with structurally induced cracking leading to corrosion. Increased depth of cover was a common approach
to control of reinforcing steel corrosion (22) when the report just discussed was published.
Static structural loads can also produce corrosion at locations of high stress. Correlations between tensile stress, corrosion, and increased chloride penetration are available (23).
The corrosion and spalling of reinforced concrete bridge decks increased at roughly the same time as highway organizations started using more deicing salts (10,11). This can be interpreted as an indication that increased corrosion was caused by the salts and led to the spalling (10,11). An alternative explanation is also possible. The cracking evident in Figures 9 and 10 shows a general crumbling of concrete along the edge of a bridge in Missouri. Much of the deterioration is away from reinforcing steel and is due to a combination of salt and freeze-thaw damage. This type of damage can cause extensive structural problems unrelated to corrosion (24). The spacing between cracks in these figures is too close to be related to structural loading (22). The damage patterns shown in Figures 9 and 10 do not occur in coastal locations that have an abundance of salt but few, or no, freeze-thaw cycles. The cracking shown in these pictures, which is extreme, can allow access of salt water to steel and cause corrosion of embedded steel. Air-entraining additions to concrete minimize, but do not eliminate, this type of cracking.
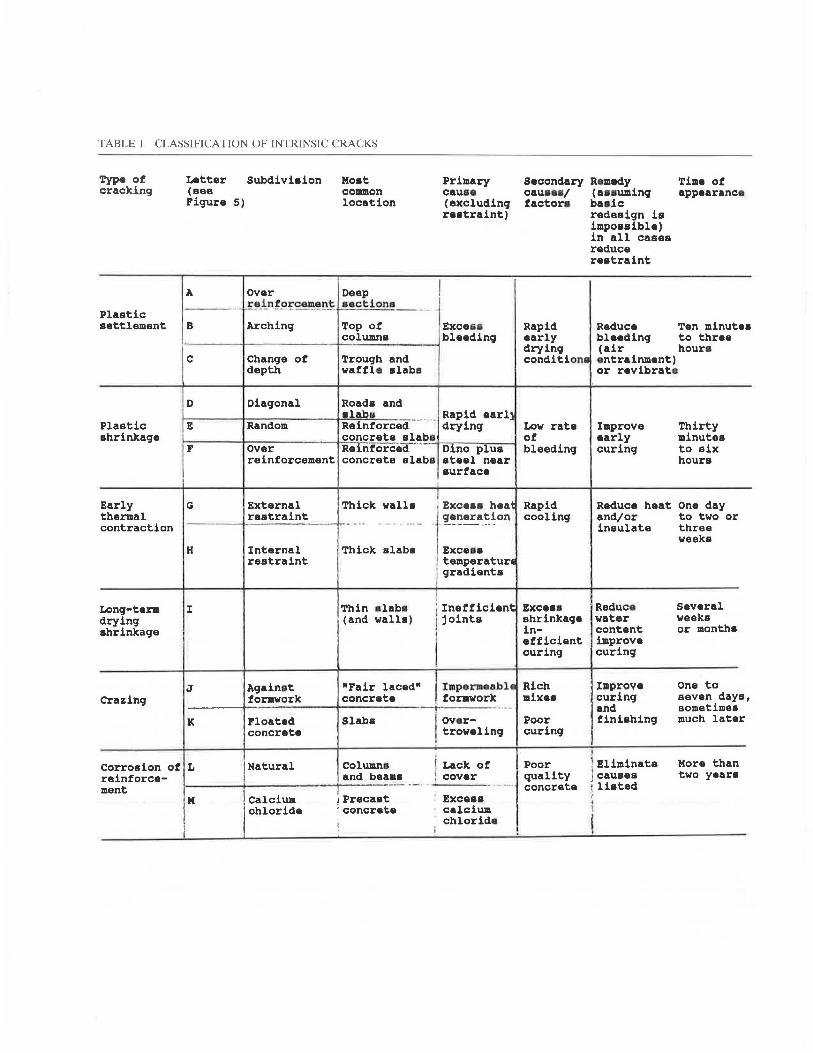
TABLE 1 CLASSIFICATION OF INTRINSIC CRACKS
Type of cracking
Plastic settlement
Plastic shrinka9e
Early thermal contraction
Long-term drying shrinka9e
Letter Subdivision (aee
Moat co111111on location
Primary cauae (excluding restraint)
Figure 5)
A
B Arching Top of Exce&a
over Deep I reinfq!:c~.!!:l~ ..!_!ctions _ _ ~
i-----+--------+-c-~lumna bleeding
c Change of Trough and depth waffle alaba I
D Dia9onal Road• and r=-----;----,,------+-•~l=a~b~s~-·~--~ Rapid earll E Random Reinforced drying
F
G
concrete slabs over Reinforced ... _ _,._D.,......in_o_p~1l_u_s__,
reinforcement concrete slabs ateel near surface
External restraint
Thick walla I , Exceaa heat
- - ---t-------""i"- - . ·-- ·j ~-!~~a~~on H
I
Internal restraint
Thick alaba
Thin elaba (and walls)
Exceaa I tamperatur1 / qradianta
I j inefficient I joints
I
Secondary cauaea/ factor•
Rapid early dryin9 condition•
Low rate of bleeding
Rapid cooling
Excaaa shrinkage inefficient curing
J Againat formwork
"Fair laced" concrete
Imperineable Rich Crazing
K
Corrosion of L reinforcement
j" I
Floated concrete
Natural
Calcium chloride
Slaba
Columns and beama
1 Precaat i concrete
!
formwork mixes
I over-, troweling
i Lack of 1 cover ----·~·-~-
Exceaa calcium chloride
Poor curing
Poor quality concrete
Remedy (uauming bade redesign ia impoasible) in all casea reduce restraint
Time of appearance
Reduce Ten minutea
J
bleedin9 to three (air hours entrainment) or revibrato
Improve early curing
Reduce heat and/or insulate
Reduce water content improve curing
Improve curing and finiahin9
Thirty minutes to six hours
One day to two or three weeka
Several weeks or months
one to seven days, sometimes much later
. Eliminate J causes listed
More than two yeara
Borgard et al.
0.28"""
Concrtlt 1ur11c1
FIGURE 6 Variation of crack width with depth (19).
Cnicks
Rebor
FIGURE 7 Crack pattern on core removed from reinforced concrete fence wall on a beach in California.
Corrosion and Chemistry Patterns
The interrelationship between cracks and corrosion can be demonstrated by local analysis of spalling, corrosion, and salt ingress patterns.
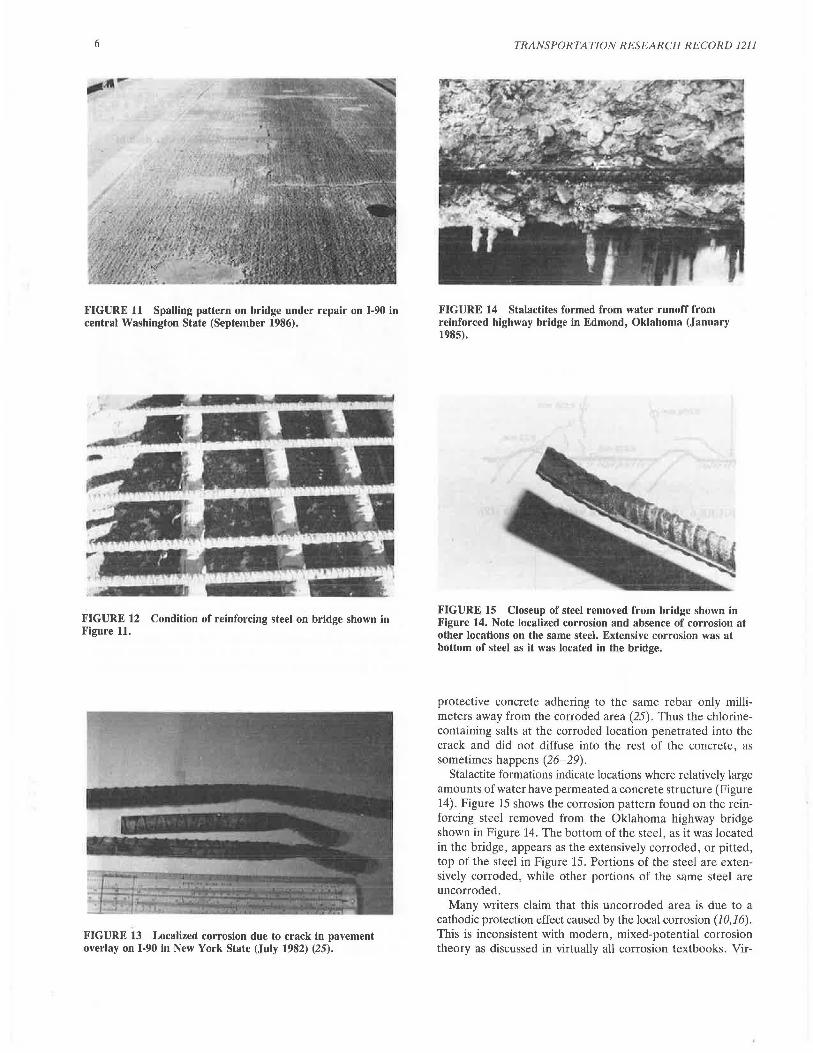
Figure 11 shows a spalling pattern on an interstate highway bridge under repair in 1986. The spalling pattern is similar to that shown by Cady (11) and many others . The locations of spalls on this stiff bridge can roughly be correlated with heavy traffic patterns (less damage near the curbs) and is somewhat different from the patterns (shown in Figure 8) on a more flexible bridge. The corrosion pattern shown in Figure 12 reveals that most of the steel in these spall locations has little
Cit 0 0 0 "'' 8
FIGURE 8 Spalling pattern on Blue Rapids bridge deck in Kansas (21).
FIGURE 9 Salt-accelerated freeze-thaw damage on highway bridge in Kansas City, Missouri.
5
or no corrosion. This is consistent with corrosion being caused by crack-induced moisture ingress. It is inconsistent with a mechanism whereby corrosion causes spalls.
Figure 13 shows reinforcing steel removed from a pavement overlay on an interstate highway in New York State. The steel has corroded at a crack in the overlay caused by ground subsidence (25). The steel shown in Figure 13 was analyzed using a scanning electron microscope (SEM) equipped with an energydispersive, X-ray spectrometer. This equipment is similar to that used to determine the cause of failure on the post-tensioned building shown in Figure 1 (13). The cement paste adjacent to the corrosion shown in Figure 12 had high chlorine levels, showing that deicing salts had penetrated to the metal surface in this location. Minimal chlorine was detected in the
FIGURE IO Complete separation of concrete from reinforcing steel on walkway of bridge shown in Figure 9.
6
FIGURE 11 Spalling pattern on bridge under repair on I-90 in central Washington State (September 1986).
FIGURE 12 Condition of reinforcing steel on bridge shown in Figure 11.
FIGURE 13 Localized corrosion due to crack in pavement overlay on I-90 in New York State (July 1982) (25).
TRANSPORTATION RESEARCH RECORD 1211
FIGURE 14 Stalactites formed from water runoff from reinforced highway bridge in Edmond, Oklahoma (January 1985).
FIGURE 15 Closeup of steel removed from bridge shown in Figure 14. Note localized corrosion and absence of corrosion at other locations on the same steel. Extensive corrosion was at bottom of steel as it was located in the bridge.
protective concrete adhering to the same rebar only millimeters away from the corroded area (25). Thus the chlorinecontaining salts at the corroded location penetrated into the crack and did not diffuse into the rest of the concrete, as sometimes happens (26-29).
Stalactite formations indicate locations where relatively large amounts of water have permeated a concrete structure (Figure 14). Figure 15 shows the corrosion pattern found on the reinforcing steel removed from the Oklahoma highway bridge shown in Figure 14. The bottom of the steel, as it was located in the bridge, appears as the extensively corroded, or pitted, top of the steel in Figure 15. Portions of the steel are extensively corroded, while other portions of the same steel are uncorroded.
Many writers claim that this uncorroded area is due to a cathodic protection effect caused by the local corrosion (10,16). This is inconsistent with modern, mixed-potential corrosion theory as discussed in virtually all corrosion textbooks. Vir-
Borgard et al.
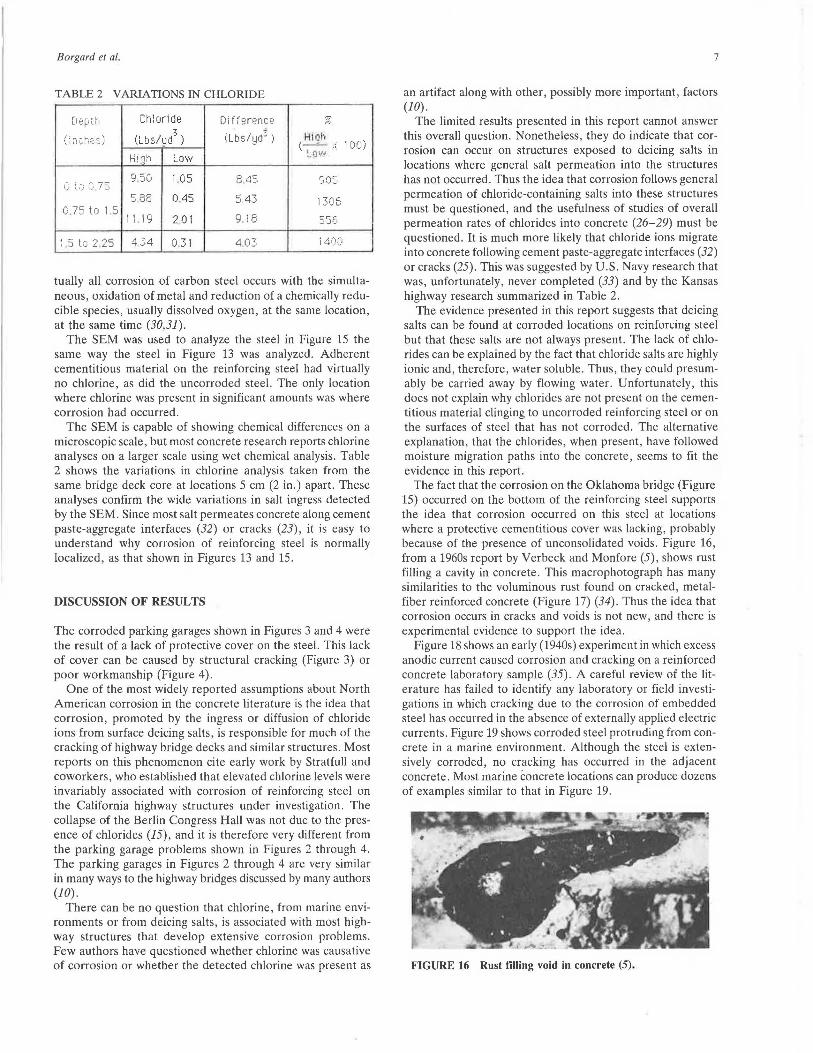
TABLE 2 VARIATIONS IN CHLORIDE
D80i.t·1 Chloride Difference .,, (t;.~
7
( Lt1s/ 1~ dt) Hi l)h (; n1:.:1es) (Lbs/~,{) (-' - .... I 00 ) ,",
H1or1 Low Low
9 50 1.05 a a:. 905 1.) '·'·'
() 75 5 BB 0.45 " 43 1306 ..J
0.75 to 1.5 I 1 19 9. 18 I 2.01 556
. 5 t.c: 2.25 4 34 0 31 4.03 i 40.:: '
tually all corrosion of carbon steel occurs with the simultaneous, oxidation of metal and reduction of a chemically reducible species, usually dissolved oxygen, at the same location, at the same time (30,31).
The SEM was used to analyze the steel in Figure 15 the same way the steel in Figure 13 was analyzed. Adherent cementitious material on the reinforcing steel had virtually no chlorine, as did the uncorroded steel. The only location where chlorine was present in significant amounts was where corrosion had occurred.
The SEM is capable of showing chemical differences on a microscopic scale, but most concrete research reports chlorine analyses on a larger scale using wet chemical analysis. Table 2 shows the variations in chlorine analysis taken from the same bridge deck core at locations 5 cm (2 in.) apart. These analyses confirm the wide variations in salt ingress detected by the SEM. Since most salt permeates concrete along cement paste-aggregate interfaces (32) or cracks (23), it is easy to understand why corrosion of reinforcing steel is normally localized, as that shown in Figures 13 and 15.
DISCUSSION OF RESULTS
The corroded parking garages shown in Figures 3 and 4 were the result of a lack of protective cover on the steel. This lack of cover can be caused by structural cracking (Figure 3) or poor workmanship (Figure 4).
One of the most widely reported assumptions about North American corrosion in the concrete literature is the idea that corrosion, promoted by the ingress or diffusion of chloride ions from surface deicing salts , is responsible for much of the cracking of highway bridge decks and similar structures. Most reports on this phenomenon cite early work by Stratfull and coworkers, who established that elevated chlorine levels were invariably associated with corrosion of reinforcing steel on the California highway structures under investigation. The collapse of the Berlin Congress Hall was not due to the presence of chlorides (15), and it is therefore very different from the parking garage problems shown in Figures 2 through 4. The parking garages in Figures 2 through 4 are very similar in many ways to the highway bridges discussed by many authors (JO) .
There can be no question that chlorine, from marine environments or from deicing salts , is associated with most highway structures that develop extensive corrosion problems. Few authors have questioned whether chlorine was causative of corrosion or whether the detected chlorine was present as
7
an artifact along with other , possibly more important , factors (10) .
The limited results presented in this report cannot answer this overall question. Nonetheless, they do indicate that corrosion can occur on structures exposed to deicing salts in locations where general salt permeation into the structures has not occurred. Thus the idea that corrosion follows general permeation of chloride-containing salts into these structures must be questioned, and the usefulness of studies of overall permeation rates of chlorides into concrete (26-29) must be questioned. It is much more likely that chloride ions migrate into concrete following cement paste-aggregate interfaces (32) or cracks (25). This was suggested by U.S. Navy research that was, unfortunately, never completed (33) and by the Kansas highway research summarized in Table 2.
The evidence presented in this report suggests that deicing salts can be found at corroded locations on reinforcing steel but that these salts are not always present. The lack of chlorides can be explained by the fact that chloride salts are highly ionic and, therefore, water soluble. Thus, they could presumably be carried away by flowing water. Unfortunately, this does not explain why chlorides are not present on the cementitious material clinging to uncorroded reinforcing steel or on the surfaces of steel that has not corroded. The alternative explanation, that the chlorides , when present, have followed moisture migration paths into the concrete, seems to fit the evidence in this report.
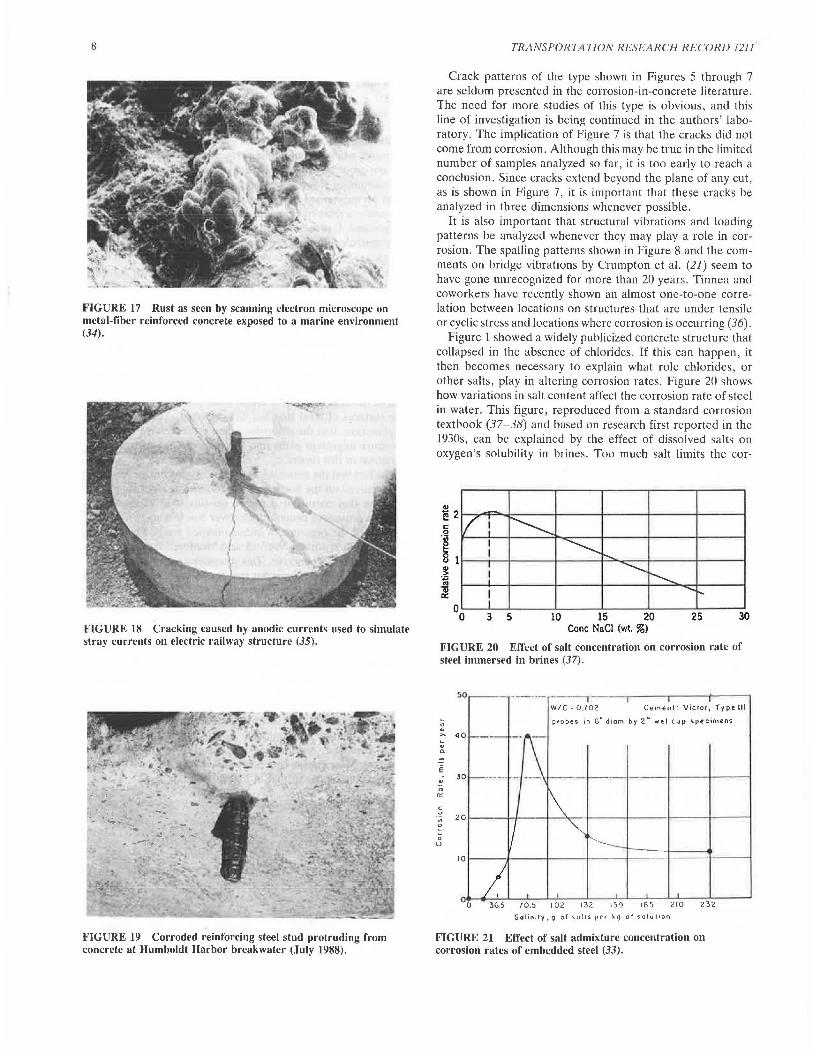
The fact that the corrosion on the Oklahoma bridge (Figure 15) occurred on the bottom of the reinforcing steel supports the idea that corrosion occurred on this steel at locations where a protective cementitious cover was lacking, probably because of the presence of unconsolidated voids. Figure 16, from a 1960s report by Verbeck and Monfore (5), shows rust filling a cavity in concrete. This macrophotograph has many similarities to the voluminous rust found on cracked, metalfiber reinforced concrete (Figure 17) (34). Thus the idea that corrosion occurs in cracks and voids is not new, and there is experimental evidence to support the idea.
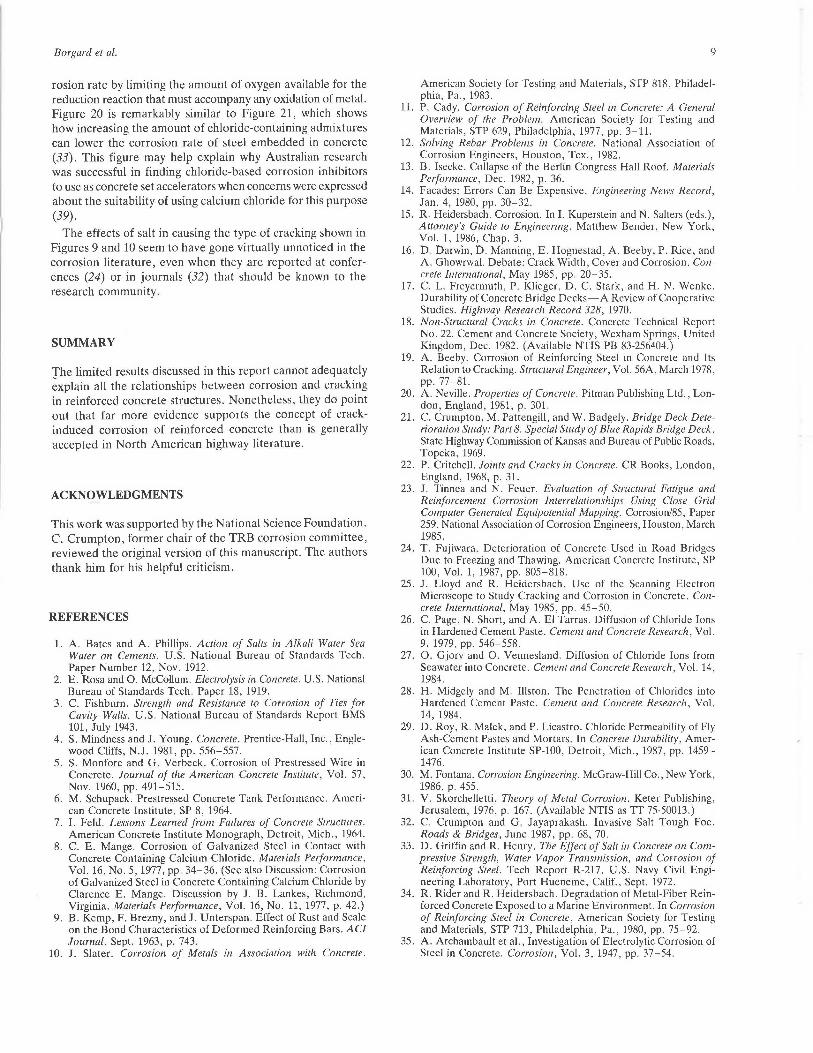
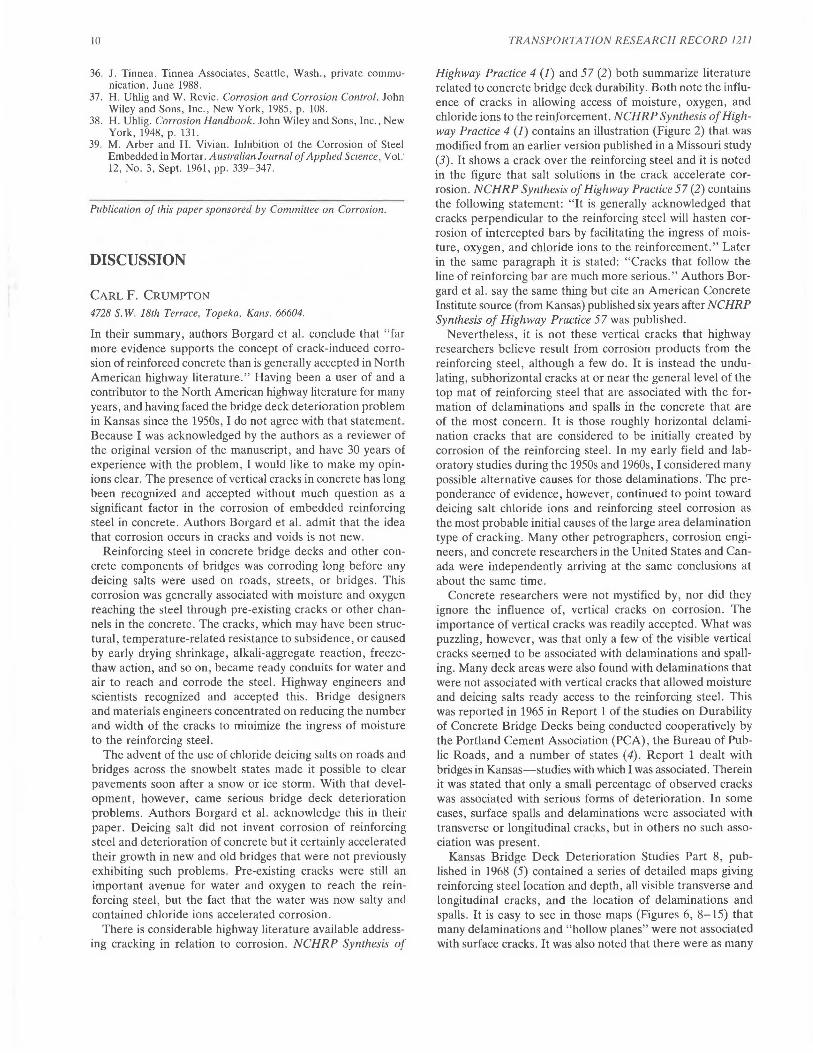
Figure 18 shows an early (1940s) experiment in which excess anodic current caused corrosion and cracking on a reinforced concrete laboratory sample (35) . A careful review of the literature has failed to identify any laboratory or field investigations in which cracking due to the corrosion of embedded steel has occurred in the absence of externally applied electric currents . Figure 19 shows corroded steel protruding from concrete in a marine environment. Although the steel is extensively corroded, no cracking has occurred in the adjacent concrete. Most marine concrete locations can produce dozens of examples similar to that in Figure 19.
FIGURE 16 Rust filling void in concrete (5) .
8
FIGURE 17 Rust as seen by scanning electron microscope on metal-fiber reinforced concrete exposed to a marine environment (34).
FIGURE 18 Cracking caused by anodic currents used to simulate stray currents on electric railway structure (35).
FIGURE 19 Corroded reinforcing steel stud protruding from concrete at Humboldt Harbor breakwater (July 1988).
TRANSPORTATION RESEARCH RECORD 1211
Crack patterns of the type shown in Figures 5 through 7 are seldom presented in the corrosion-in-concrete literature. The need for more studies of this type is obvious, and this line of investigation is being continued in the authors' laboratory. The implication of Figure 7 is that the cracks did not come from corrosion. Although this may he true in the limited number of samples analyzed so far, it is too early to reach a conclusion. Since cracks extend beyond the plane of any cut, as is shown in Figure 7, it is important that these cracks be analyzed in three dimensions whenever possible.
It is also important that structural vibrations and loading patterns be analyzed whenever they may play a role in corrosion. The spalling patterns shown in Figure 8 and the comments on bridge vibrations by Crumpton et al. (21) seem to have gone unrecognized for more than 20 years. Tinnea and coworkers have recently shown an almost one-to-one correlation between locations on structures that are under tensile or cyclic stress and locations where corrosion is occurring (36).
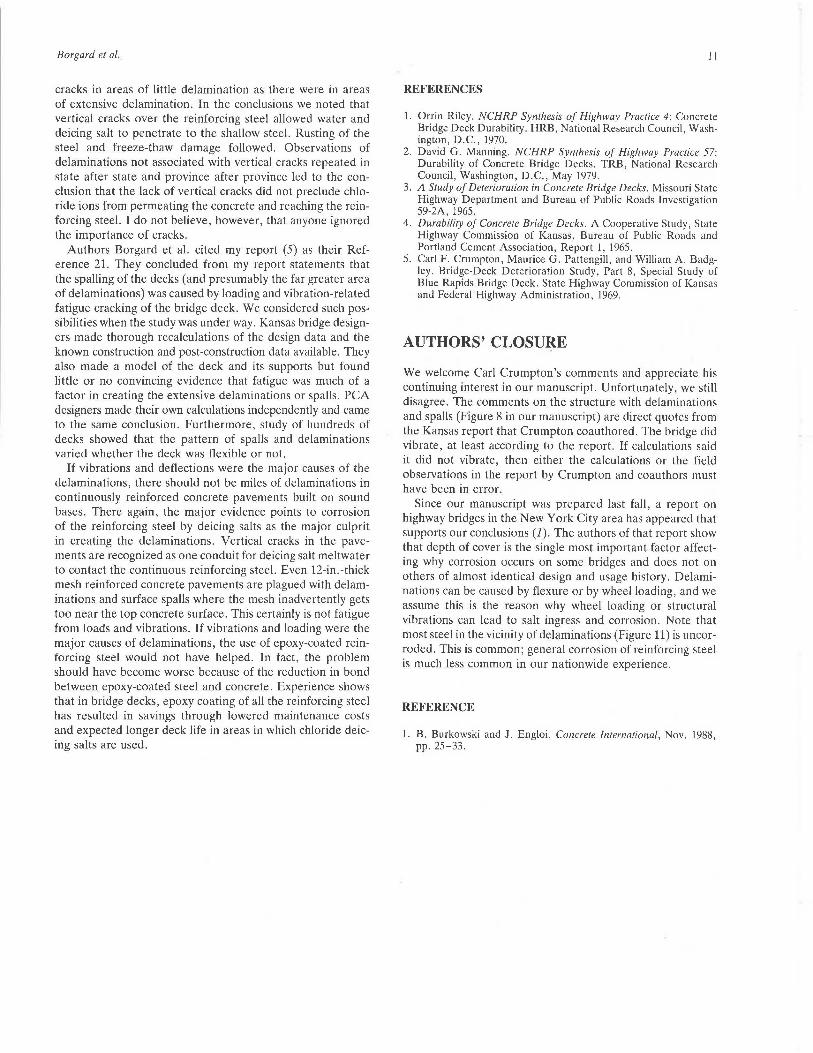
Figure 1 showed a widely publicized concrete structure that collapsed in the absence of chlorides. If this can happen, it then becomes necessary to explain what role chlorides, or other salts, play in altering corrosion rates. Figure 20 shows how variations in salt content affect the corrosion rate of steel in water. This figure, reproduced from a standard corrosion textbook (37-38) and based on research first reported in the 1930s, can be explained by the effect of dissolved salts on oxygen's solubility in brines. Too much salt limits the cor-
-I/ i ~ I
I ~ I !'..... I ............... I r---......_ J
I ....... ~ I
3 5 10 15 20 25 30 Cone NaCl (wt. %)
FIGURE 20 Effect of salt concentration on corrosion rate of steel immersed in brines (37).
" u ~
u
"' E
u
" "' c 0
0
0
u
so - ---- ·---i ---.-- --.----t------, W/C ~ 0 .702 Cemenl: Victor, Type Ill
probes in G" diam by 2" wet cup specimens
40 - - -
30 ·- ---1----1-----1
20
10 1----·l---+---~----+---r--~1-----1
0 365 70.5 102 132 159 185 210 232
Solinity,g of salls per kg of solul1on
FIGURE 21 Effect of salt admixture concentration on corrosion rates of embedded steel (33).
Borgard el al.
rosion rate by limiting the amount of oxygen available for the reduction reaction that must accompany any oxidation of metal. Figure 20 is remarkably similar to Figure 21, which shows how increasing the amount of chloride-containing admixtures can lower the corrosion rate of steel embedded in concrete (33). This figure may help explain why Australian research was successful in finding chloride-based corrosion inhibitors to use as concrete set accelerators when concerns were expressed about the suitability of using calcium chloride for this purpose (39).
The effects of salt in causing the type of cracking shown in Figures 9 and 10 seem to have gone virtually unnoticed in the corrosion literature, even when they are reported at conferences (24) or in journals (32) that should be known to the research community.
SUMMARY
The limited results discussed in this report cannot adequately ~xplain all the relationships between corrosion and cracking in reinforced concrete structures. Nonetheless, they do point out that far more evidence supports the concept of crackinduced corrosion of reinforced concrete than is generally accepted in North American highway literature.
ACKNOWLEDGMENTS
This work was supported by the Na ti on al Science Foundation. C. Crumpton, former chair of the TRB corrosion committee, reviewed the original version of this manuscript. The authors thank him for his helpful criticism.
REFERENCES
1. A. Bates and A. Phillips. Action of Salts in Alkali Water Sea Water on Cements. U.S. National Bureau of Standards Tech. Paper Number 12, Nov. 1912.
2. E. Rosa and 0. McCollum. Electrolysis in Concrete. U.S. National Bureau of Standards Tech. Paper 18, 1919.
3. C. Fishburn. Strength and Resistance to Corrosion of Ties for Cavity Walls. U.S. National Bureau of Standards Report BMS 101, July 1943.
4. S. Mindness and J. Young. Concrete. Prentice-Hall, Inc., Englewood Cliffs, N.J. 1981, pp. 556-557.
5. S. Monfore and G. Verbeck. Corrosion of Prestressed Wire in Concrete. Journal of the American Concrete Institute, Vol. 57, Nov. 1960, pp. 491-515.
6. M. Schupack. Prestressed Concrete Tank Performance. American Concrete Institute, SP 8, 1964.
7. I. Feld. Lessons Learned from Failures of Concrete Structures. American Concrete Institute Monograph, Detroit, Mich., 1964.
8. C. E. Mange. Corrosion of Galvanized Steel in Contact with Concrete Containing Calcium Chloride. Materials Performance, Vol. 16, No. 5, 1977, pp. 34-36. (See also Discussion: Corrosion of Galvanized Steel in Concrete Containing Calcium Chloride by Clarence E. Mange. Discussion by J. B. Lankes, Richmond, Virginia. Materials Performance, Vol. 16, No. 11, 1977, p. 42.)
9. B. Kemp, F. Brezny, and J. Unterspan. Effect of Rust and Scale on the Bond Characteristics of Deformed Reinforcing Bars. AC! Journal, Sept. 1963, p. 743.
10. J. Slater. Corrosion of Metals in Association with Concrete.
9
American Society for Testing and Materials, STP 818, Philadelphia, Pa., 1983.
11. P. Cady. Corrosion of Reinforcing Steel in Concrete: A General Overview of the Problem. American Society for Testing and Materials, STP 629, Philadelphia, 1977, pp. 3-11.
12. Solving Rebar Problems in Concrete. National Association of Corrosion Engineers, Houston, Tex., 1982.
13. B. Isecke. Collapse of the Berlin Congress Hall Roof. Materials Performance, Dec. 1982, p. 36.
14. Facades: Errors Can Be Expensive. Engineering News Record, Jan. 4, 1980, pp. 30-32.
15. R. Heidersbach. Corrosion. In I. Kuperstein and N. Salters (eds.), Attorney's Guide to Engineering. Matthew Bender, New York, Vol. 1, 1986, Chap. 3.
16. D. Darwin, D. Manning, E. Hognestad, A. Beeby, P. Rice, and A. Ghowrwal. Debate: Crack Width, Cover and Corrosion. Concrete International, May 1985, pp. 20-35.
17. C. L. Freyermuth, P. Klieger, D. C. Stark, and H. N. Wenke. Durability of Concrete Bridge Decks-A Review of Cooperative Studies. Highway Research Record 328, 1970.
18. Non-Structural Cracks in Concrete. Concrete Technical Report No. 22. Cement and Concrete Society, Wexham Springs, United Kingdom, Dec. 1982. (Available NTIS PB 83-256404.)
19. A. Beeby. Corrosion of Reinforcing Steel in Concrete and Its Relation to Cracking. Structural Engineer, Vol. 56A, March 1978, pp. 77-81.
20. A. Neville. Properties of Concrete. Pitman Publishing Ltd., London, England, 1981, p. 301.
21. C. Crumpton, M. Pattengill, and W. Badgely. Bridge Deck Deterioration Study: Part 8. Special Study of Blue Rapids Bridge Deck. State Highway Commission of Kansas and Bureau of Public Roads, Topeka, 1969.
22. P. Critchell. Joints and Cracks in Concrete. CR Books, London, England, 1968, p. 31.
23. J. Tinnea and N. Feuer. Evaluation of Structural Fatigue and Reinforcement Corrosion Interrelationships Using Close Grid Computer Generated Equipotential Mapping. Corrosion/85, Paper 259. National Association of Corrosion Engineers, Houston, March 1985.
24. T. Fujiwara. Deterioration of Concrete Used in Road Bridges Due to Freezing and Thawing. American Concrete Institute, SP 100, Vol. 1, 1987, pp. 805-818.
25. J. Lloyd and R. Heidersbach. Use of the Scanning Electron Microscope to Study Cracking and Corrosion in Concrete. Concrete International, May 1985, pp. 45-50.
26. C. Page, N. Short, and A. El Tarras. Diffusion of Chloride Ions in Hardened Cement Paste. Cement and Concrete Research, Vol. 9, 1979, pp. 546-558.
27. 0. Gjorv and 0. Vennesland. Diffusion of Chloride Ions from Seawater into Concrete. Cement and Concrete Research, Vol. 14, 1984.
28. H. Midgely and M. Illston. The Penetration of Chlorides into Hardened Cement Paste. Cement and Concrete Research, Vol. 14, 1984.
29. D. Roy, R. Malek, and P. Licastro. Chloride Permeability of Fly Ash-Cement Pastes and Mortars . In Concrete Durability, American Concrete Institute SP-100, Detroit, Mich., 1987, pp. 1459-1476.
30. M. Fontana. Corrosion Engineering. McGraw-Hill Co., New York, 1986, p. 455.
31. V. Skorchelletti. Theory of Metal Corrosion. Keter Publishing, Jerusalem, 1976, p. 167. (Available NTIS as TT 75-50013.)
32. C. Crumpton and G. Jayaprakash. Invasive Salt Tough Foe. Roads & Bridges, June 1987, pp. 68, 70.
33. D. Griffin and R. Henry. The Effect of Salt in Concrete on Compressive Strength, Water Vapor Transmission, and Corrosion of Reinforcing Steel. Tech Report R-217. U.S. Navy Civil Engineering Laboratory, Port Hueneme, Calif., Sept. 1972.
34. R. Rider and R. Heidersbach. Degradation of Metal-Fiber Reinforced Concrete Exposed to a Marine Environment. In Corrosion of Reinforcing Steel in Concrete, American Society for Testing and Materials, STP 713, Philadelphia, Pa., 1980, pp. 75-92.
35. A. Archambault et al., Investigation of Electrolytic Corrosion of Steel in Concrete. Corrosion, Vol. 3, 1947, pp. 37-54.
10
36. J. Tinnea. Tinnea Associates, Seattle, Wash., private communication, June 1988.
37. H . Uhlig and W. Revie. Corrosion and Corrosion Control. John Wiley and Sons, Inc., New York, 1985 , p. 108.
38. H. Uhlig. Corrosion Handbook. John Wiley and Sons, Inc., New York, 1948, p. 131.
39. M. Arber and H. Vivian. Inhibition ot the Corrosion of Steel Embedded in Mortar. Australian Journal of Applied Science, Vol: 12, No. 3, Sept. 1961, pp. 339-347.
Publication of this paper sponsored by Committee on Corrosion.
DISCUSSION
CARL F. CRUMPTON
4728 S. W. 18th Terrace, Topeka, Kans. 66604.
In their summary, authors Borgard et al. conclude that "far more evidence supports the concept of crack-induced corrosion of reinforced concrete than is generally accepted in North American highway literature." Having been a user of and a contributor to the North American highway literature for many years, and having faced the bridge deck deterioration problem in Kansas since the 1950s, I do not agree with that statement. Because I was acknowledged by the authors as a reviewer of the original version of the manuscript, and have 30 years of experience with the problem, I would like to make my opinions clear. The presence of vertical cracks in concrete has long been recognized and accepted without much question as a significant factor in the corrosion of embedded reinforcing steel in concrete. Authors Borgard et al. admit that the idea that corrosion occurs in cracks and voids is not new.
Reinforcing steel in concrete bridge decks and other concrete components of bridges was corroding long before any deicing salts were used on roads, streets, or bridges. This corrosion was generally associated with moisture and oxygen reaching the steel through pre-existing cracks or other channels in the concrete. The cracks, which may have been structural, temperature-related resistance to subsidence, or caused by early drying shrinkage, alkali-aggregate reaction, freezethaw action, and so on, became ready conduits for water and air to reach and corrode the steel. Highway engineers and scientists recognized and accepted this. Bridge designers and materials engineers concentrated on reducing the number and width of the cracks to minimize the ingress of moisture to the reinforcing steel.
The advent of the use of chloride deicing salts on roads and bridges across the snowbelt states made it possible to clear pavements soon after a snow or ice storm. With that development, however, came serious bridge deck deterioration problems. Authors Borgard et al. acknowledge this in their paper. Deicing salt did not invent corrosion of reinforcing steel and deterioration of concrete but it certainly accelerated their growth in new and old bridges that were not previously exhibiting such problems. Pre-existing cracks were still an important avenue for water and oxygen to reach the reinforcing steel, but the fact that the water was now salty and contained chloride ions accelerated corrosion.
There is considerable highway literature available addressing cracking in relation to corrosion . NCHRP Synthesis of
TRANSPORTATION RESEARCH RECORD 1211
Highway Practice 4 (1) and 57 (2) both summarize literature related to concrete bridge deck durability. Both note the influence of cracks in allowing access of moisture, oxygen, and chloride ions to the reinforcement. NCH RP Synthesis of Highway Practice 4 (1) contains an illustration (Figure 2) that was modified from an earlier version published in a Missouri study (3). It shows a crack over the reinforcing steel and it is noted in the figure that salt solutions in the crack accelerate corrosion. NCH RP Synthesis uf Highwuy Pruclh:e 57 (2) wnlains the following statement: "It is. generally acknowledged that cracks perpendicular to the reinforcing steel will hasten corrosion of intercepted bars by facilitating the ingress of moisture, oxygen, and chloride ions to the reinforcement." Later in the same paragraph it is stated: "Cracks that follow the line of reinforcing bar are much more serious." Authors Borgard et al. say the same thing but cite an American Concrete Institute source (from Kansas) published six years after NCHRP Synthesis of Highway Practice 57 was published.
Nevertheless, it is not these vertical cracks that highway researchers believe result from corrosion products from the reinforcing steel, although a few do. It is instead the undulating, subhorizontal cracks at or near the general level of the top mat of reinforcing steel that are associated with the formation of delaminations and spalls in the concrete that are of the most concern. It is those roughly horizontal delamination cracks that are considered to be initially created by corrosion of the reinforcing steel. In my early field and laboratory studies during the 1950s and 1960s, I considered many possible alternative causes for those delaminations . The preponderance of evidence, however, continued to point toward deicing salt chloride ions and reinforcing steel corrosion as the most probable initial causes of the large area delamination type of cracking. Many other petrographers, corrosion engineers, and concrete researchers in the United States and Canada were independently arriving at the same conclusions at about the same time.
Concrete researchers were not mystified by, nor did they ignore the influence of, vertical cracks on corrosion. The importance of vertical cracks was readily accepted . What was puzzling, however, was that only a few of the visible vertical cracks seemed to be associated with delaminations and spalling. Many deck areas were also found with delaminations that were not associated with vertical cracks that allowed moisture and deicing salts ready access to the reinforcing steel. This was reported in 1965 in Report 1 of the studies on Durability of Concrete Bridge Decks being conducted cooperatively by the Portland Cement Association (PCA), the Bureau of Public Roads, and a number of states (4). Report 1 dealt with bridges in Kansas-studies with which I was associated. Therein it was stated that only a small percentage of observed cracks was associated with serious forms of deterioration. In some cases, surface spalls and delaminations were associated with transverse or longitudinal cracks, but in others no such association was present.
Kansas Bridge Deck Deterioration Studies Part 8, published in 1968 (5) contained a series of detailed maps giving reinforcing steel location and depth, all visible transverse and longitudinal cracks, and the location of delaminations and spalls. It is easy to see in those maps (Figures 6, 8-15) that many delaminations and "hollow planes" were not associated with surface cracks. It was also noted that there were as many
Borgard et al.
cracks in areas of little delamination as there were in areas of extensive delamination. In the conclusions we noted that vertical cracks over the reinforcing steel allowed water and deicing salt to penetrate to the shallow steel. Rusting of the steel and freeze-thaw damage followed. Observations of delaminations not associated with vertical cracks repeated in state after state and province after province led to the conclusion that the lack of vertical cracks did not preclude chloride ions from permeating the concrete and reaching the reinforcing steel. I do not believe, however, that anyone ignored the importance of cracks.
Authors Borgard et al. cited my report (5) as their Reference 21. They concluded from my report statements that the spalling of the decks (and presumably the far greater area of delaminations) was caused by loading and vibration-related fatigue cracking of the bridge deck. We considered such possibilities when the study was under way. Kansas bridge designers made thorough recalculations of the design data and the known construction and post-construction data available. They also made a model of the deck and its supports but found little or no convincing evidence that fatigue was much of a factor in creating the extensive delaminations or spalls. PCA designers made their own calculations independently and came to the same conclusion. Furthermore, study of hundreds of decks showed that the pattern of spalls and delaminations varied whether the deck was flexible or not.
If vibrations and deflections were the major causes of the delaminations, there should not be miles of delaminations in continuously reinforced concrete pavements built on sound bases. There again, the major evidence points to corrosion of the reinforcing steel by deicing salts as the major culprit in creating the delaminations. Vertical cracks in the pavements are recognized as one conduit for deicing salt meltwater to contact the continuous reinforcing steel. Even 12-in.-thick mesh reinforced concrete pavements are plagued with delaminations and surface spalls where the mesh inadvertently gets too near the top concrete surface. This certainly is not fatigue from loads and vibrations. If vibrations and loading were the major causes of delaminations, the use of epoxy-coated reinforcing steel would not have helped. In fact, the problem should have become worse because of the reduction in bond between epoxy-coated steel and concrete. Experience shows that in bridge decks, epoxy coating of all the reinforcing steel has resulted in savings through lowered maintenance costs and expected longer deck life in areas in which chloride deicing salts are used.
JI
REFERENCES
1. Orrin Riley. NCHRP Synthesis of Highway Practice 4: Concrete Bridge Deck Durability. HRB, National Research Council, Washington, D.C., 1970.
2. David G. Manning. NCHRP Synthesis of Highway Practice 57: Durability of Concrete Bridge Decks. TRB, National Research Council, Washington, D.C., May 1979.
3. A Study of Deterioration in Concrete Bridge Decks. Missouri State Highway Department and Bureau of Public Roads Investigation 59-2A, 1965.
4. Durability of Concrete Bridge Decks. A Cooperative Study, State Highway Commission of Kansas, Bureau of Public Roads and Portland Cement Association, Report 1, 1965.
5. Carl F. Crumpton, Maurice G. Pattengill, and William A. Badgley. Bridge-Deck Deterioration Study, Part 8, Special Study of Blue Rapids Bridge Deck. State Highway Commission of Kansas and Federal Highway Administration, 1969.
AUTHORS' CLOSUI;{E
We welcome Carl Crumpton's comments and appreciate his continuing interest in our manuscript. Unfortunately, we still disagree. The comments on the structure with delaminations and spalls (Figure 8 in our manuscript) are direct quotes from the Kansas report that Crumpton coauthored. The bridge did vibrate, at least according to the report. If calculations said it did not vibrate, then either the calculations or the field observations in the report by Crumpton and coauthors must have been in error.
Since our manuscript was prepared last fall, a report on highway bridges in the New York City area has appeared that supports our conclusions (1). The authors of that report show that depth of cover is the single most important factor affecting why corrosion occurs on some bridges and does not on others of almost identical design and usage history. Delaminations can be caused by flexure or by wheel loading, and we assume this is the reason why wheel loading or structural vibrations can lead to salt ingress and corrosion. Note that most steel in the vicinity of delaminations (Figure 11) is uncorroded. This is common; general corrosion of reinforcing steel is much less common in our nationwide experience.
REFERENCE
1. B. Burkowski and J. Engloi. Concrete International, Nov. 1988, pp. 25-33.
12 TRANSPORTATION RESEARCH RECORD 1211
Deicing Salt Corrosion With and Without Inhibitors
MARK R. CALLAHAN
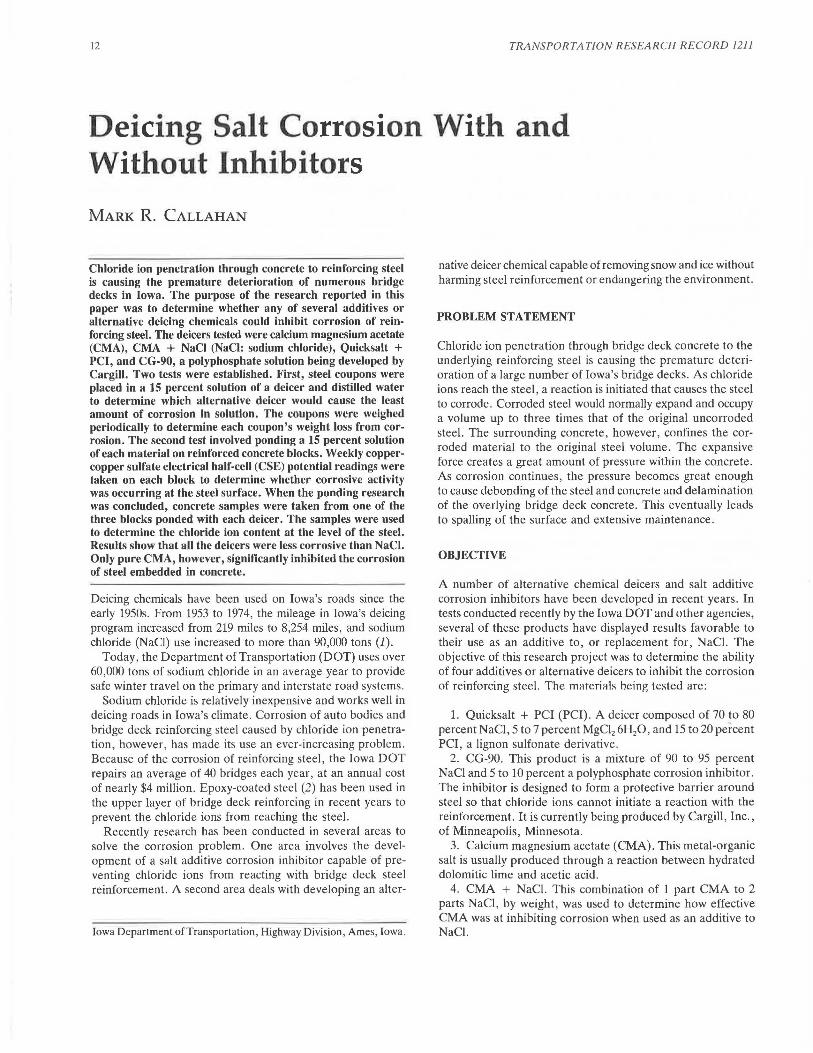
Chloride ion penetration through concrete to reinforcing steel is causing the premature deterioration of numerous bridge decks in Iowa. The purpose of the research reported in this paper was to determine whether any of several additives or alternative deicing chemicals could inhibit corrosion of reinforcing steel. The deicers tested were calcium magnesium acetate (CMA), CMA + NaCl (NaCl: sodium chloride), Quicksall + PCI, and CG-90, a polyphosphate solution being developed by Cargill. Two tests were established. First, steel coupons were placed in a 15 percent solution of a deicer and distilled water to determine which alternative deicer would cause the least amount of corrosion In solution. The coupons were weighed periodically to determine each coupon's weight loss from corrosion. The second test involved ponding a 15 percent solution of each material on reinforced concrete blocks. Weekly coppercopper sulfate electrical half-cell (CSE) potential readings were taken on each block to determine whether corrosive activity was occurring at the steel surface. When the ponding research was concluded, concrete samples were taken from one of the three blocks ponded with each deicer. The samples were used lo determine the chloride ion content at the level of the steel. Results show that all the deicers were less corrosive than NaCl. Only pure CMA, however, significantly inhibited the corrosion of steel embedded in concrete.
Deicing chemicals have been used on Iowa's roads since the early 1950s. From 1953 to 1974, the mileage in Iowa's deicing program increased from 219 miles to 8,254 miles, and sodium chloride (NaCl) use increased to more than 90,000 tons (1).
Today, the Department of Transportation (DOT) uses over 60,000 tons of sodium chloride in an average year to provide safe winter travel on the primary and interstate road systems.
Sodium chloride is relatively inexpensive and works well in deicing roads in Iowa's climate . Corrosion of auto bodies and bridge deck reinforcing steel caused by chloride ion penetration, however, has made its use an ever-increasing problem. Because of the corrosion of reinforcing steel, the Iowa DOT repairs an average of 40 bridges each year, at an annual cost of nearly $4 million. Epoxy-coated steel (2) has been used in the upper layer of bridge deck reinforcing in recent years to prevent the chloride ions from reaching the steel.
Recently research has been conducted in several areas to solve the corrosion problem. One area involves the development of a salt additive corrosion inhibitor capable of preventing chloride ions from reacting with bridge deck steel reinforcement. A second area deals with developing an alter-
Iowa Department of Transportation, Highway Division, Ames, lowa .
native deicer chemical capable of removing snow and ice without harming steel reinforcement or endangering the environment.
PROBLEM STATEMENT
Chloride ion penetration through bridge deck concrete to the underlying reinforcing steel is causing the premature deterioration of a large number of Iowa's bridge decks. As chloride ions reach the steel, a reaction is initiated that causes the steel to corrode. Corroded steel would normally expand and occupy a volume up to three times that of the original uncorroded steel. The surrounding concrete, however, confines the corroded material to the original steel volume. The expansive force creates a great amount of pressure within the concrete. As corrosion continues, the pressure becomes great enough to cause de bonding of the steel and concrete and delamination of the overlying bridge deck concrete. This eventually leads to spalling of the surface and extensive maintenance.
OBJECTIVE
A number of alternative chemical deicers and salt additive corrosion inhibitors have been developed in recent years. In tests conducted recently by the Iowa DOT and olher agem:ies, several of these products have displayed results favorable to their use as an additive to, or replacement for, NaCl. The objective of this research project was to determine the ability of four additives or alternative deicers to inhibit the corrosion of reinforcing steel. The materials heing tested are:
1. Quicksalt + PCI (PCI). A deicer composed of 70 to 80 percent NaCl, 5 to 7 percent MgCl2 6H20, and 15 to 20 percent PCI , a lignon sulfonate derivative.
2. CG-90. This product is a mixture of 90 to 95 percent NaCl and 5 to 10 percent a polyphosphate corrosion inhibitor. The inhibitor is designed to form a protective barrier around steel so that chloride ions cannot initiate a reaction with the reinforcement. It is currently being produced by Cargill, lnc., of Minneapolis, Minnesota.
3. Calcium magnesium acetate (CMA). This metal-organic salt is usually produced through a reaction between hydrated dolomitic lime and acetic acid.
4. CMA + NaCl. This combination of 1 part CMA to 2 parts NaCl, by weight, was used to determine how effective CMA was at inhibiting corrosion when used as an additive to NaCl.
Callahan
TESTING
Two separate tests were run on each material. The first involved partially immersing reinforcing steel coupons Numbers 3 and 4 in a distilled water solution containing 15 percent, by weight, of a material being tested. The CMA-NaCl solution contained 5 percent CMA and 10 percent NaCl. For control specimens, a Number 3 bar was placed in a container of tap water from the city of Ames, Iowa, water supply and bars Numbers 3 and 4 were placed in a 15 percent NaCl solution and a 15 percent CaCl2 solution. The coupons were weighed at 2-month intervals to determine the amount of weight loss due to corrosion. A copper wire brush was used to remove the corroded material before weighing.
Results of the coupon immersion test are listed in Table 1. After more than 4 months of testing, it was determined that the CG-90 was most effective in preventing weight loss caused by corrosion of the coupons. Weight losses of only 0.35 percent and 0.46 percent were recorded for the Numbers 3 and 4 coupons, respectively. Surprisingly, the coupons in the NaCl solution exhibited the second least amount of weight loss with 0.57 percent (Number 3) and 0.58 percent (Number 4). The coupons in the CMA and the CMA + NaCl solutions displayed the greatest amounts of weight loss. The coupons in CMA + NaCl lost 0.93 and 0.94 percent for the Numbers 3 and 4 bars, respectively, while the coupons in pure CMA lost 1.64 and 1.16 percent.
From these results, only CG-90 was shown to be capable of inhibiting corrosion in a distilled water solution. The results of this immersion test do not necessarily indicate how a material will perform in the field. A material that prevents corrosion in a solution may not be capable of penetrating through concrete to protect reinforcing steel from corrosion due to the presence of chloride ions.
The second test was patterned after an earlier study (3).
TABLE 1 COUPON IMMERSION TEST RESULTS
13
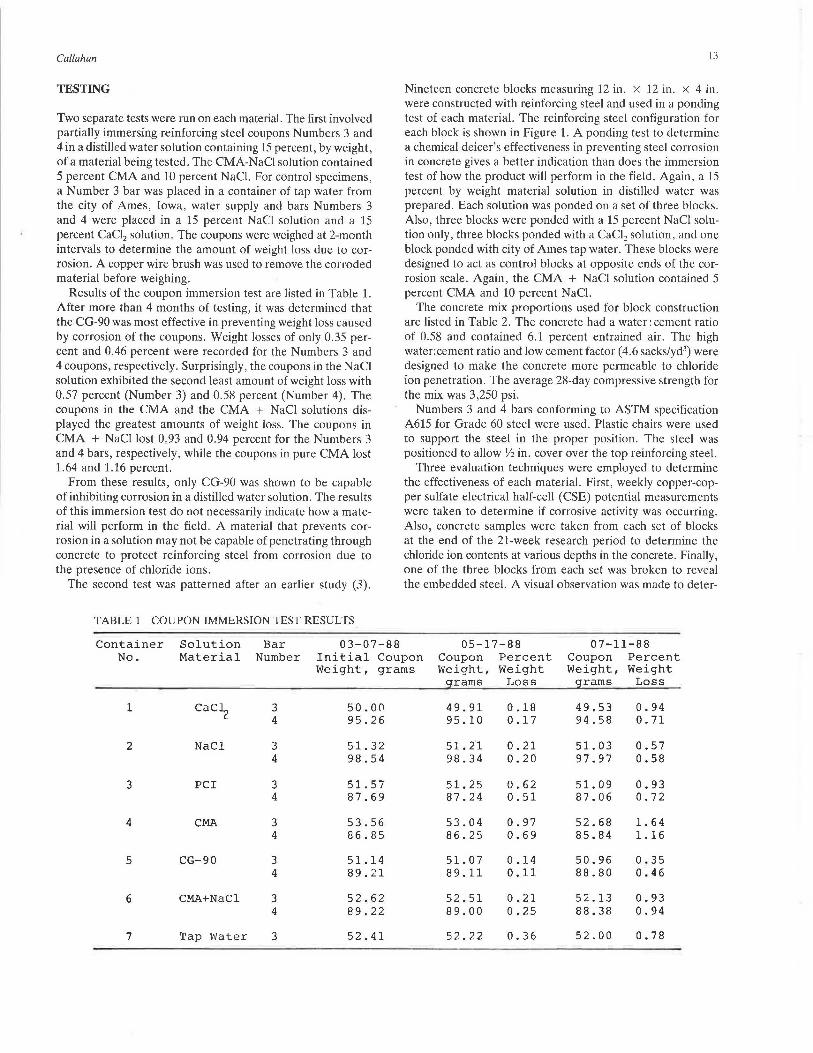
Nineteen concrete blocks measuring 12 in. x 12 in. x 4 in. were constructed with reinforcing steel and used in a ponding test of each material. The reinforcing steel configuration for each block is shown in Figure 1. A ponding test to determine a chemical deicer's effectiveness in preventing steel corrosion in concrete gives a better indication than does the immersion test of how the product will perform in the field. Again, a 15 percent by weight material solution in distilled water was prepared. Each solution was ponded on a set of three blocks. Also, three blocks were ponded with a 15 percent NaCl solution only, three blocks ponded with a CaCl2 solution, and one block ponded with city of Ames tap water. These blocks were designed to act as control blocks at opposite ends of the corrosion scale. Again, the CMA + NaCl solution contained 5 percent CMA and 10 percent NaCl.
The concrete mix proportions used for block construction are listed in Table 2. The concrete had a water: cement ratio of 0.58 and contained 6.1 percent entrained air. The high water:cement ratio and low cement factor ( 4.6 sacks/yd3
) were designed to make the concrete more permeable to chloride ion penetration. The average 28-day compressive strength for the mix was 3,250 psi.
Numbers 3 and 4 bars conforming to ASTM specification A615 for Grade 60 steel were used. Plastic chairs were used to support the steel in the proper position. The steel was positioned to allow Y2 in. cover over the top reinforcing steel.
Three evaluation techniques were employed to determine the effectiveness of each material. First, weekly copper-copper sulfate electrical half-cell (CSE) potential measurements were taken to determine if corrosive activity was occurring. Also, concrete samples were taken from each set of blocks at the end of the 21-week research period to determine the chloride ion contents at various depths in the concrete. Finally, one of the three blocks from each set was broken to reveal the embedded steel. A visual observation was made to deter-
Container No.
Solution Material
Bar Number
03-07-88 Initial Coupon Weight, grams
05-17-88 Coupon Percent Weight, Weight
grams Loss
07-11-88 Coupon Percent Weight, Weight
grams Loss
1 CaC~ 3 50.00 49.91 0.18 49.53 0.94 4 95.26 95.10 0.17 94.58 0. 71
2 NaCl 3 51.32 51.21 0.21 51. 03 0.57 4 98.54 98.34 0.20 97.97 0.58
3 PCI 3 51.57 51.25 0.62 51. 09 0.93 4 87.69 87.24 0.51 87.06 0. 72
4 CMA 3 53.56 53.04 0.97 52.68 1. 64 4 86.85 86.25 0.69 85.84 1.16
5 CG-90 3 51.14 51. 07 0.14 50.96 0 . 35 4 89.21 89.11 0.11 88.80 0.46
6 CMA+NaCl 3 52.62 52.51 0.21 52.13 0.93 4 89.22 89.00 0.25 88.38 0.94
7 Tap Water 3 52.41 52.22 0.36 52.00 0.78
14
Plastic chair
1 • '---'-'--1-----1----t....__ ---~-z:
FRONT ELCVATION
-1+4 bar
12"
RIGHT ELEVAl;C,\
FIGURE 1 Steel reinforcement placement.
mine the degree of corrosion that had occurred. The chloride ion content measurements and the visual observations were made to verify the CSE readings.
Each Monday morning the solutions were ponded on the blocks. Ponding was continuous until Friday morning (appruximatdy 100 hours), when the solutions were removed. The blocks were then washed clean of any surface chemicals and placed in an oven at 100°F. After drying over the weekend (about 68 hours), copper-copper sulfate electrical half-cell (CSE) potential readings were taken each Monday before
TABLE 2 CONCRETE MIX DESIGN
TRANSPORTATION RESEARCH RECORD 1211
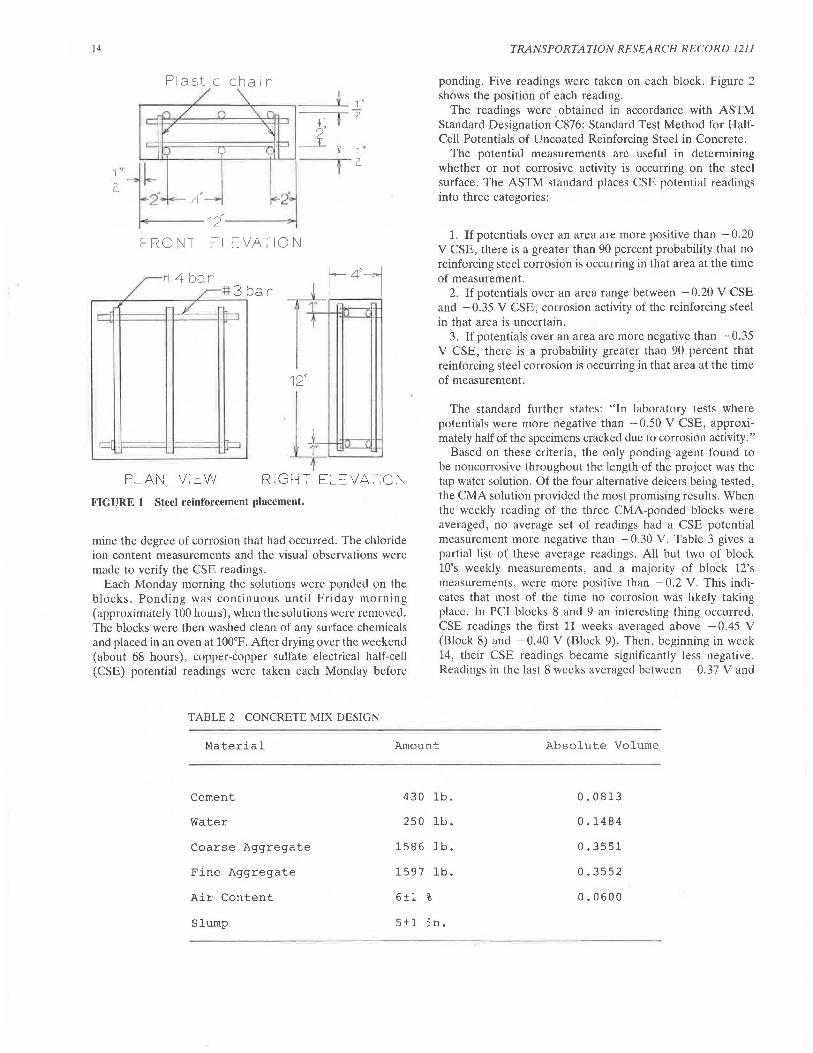
ponding. Five readings were taken on each block. Figure 2 shows the position of each reading.
The readings were . obtained in accordance with ASTM Standard Designation C876: Standard Test Method for HalfCell Potentials of Uncoated Reinforcing Steel in Concrete.
The potential measurements arc useful in determining whether or not corrosive activity is occurring on the steel surface. The ASTM standard places CSE potential readings into three categories:
1. If potentials over an area are more positive than -0.20 V CSE, there is a greater than 90 percent probability that no reinforcing steel corrosion is occurring in that area at the time of measurement.
2. If potentials over an area range between - 0.20 V CSE and -0.35 V CSE, corrosion activity of the reinforcing steel in that area is uncertain.
3. If potentials over an area are more negative than - 0.35 V CSE, there is a probability greater than 90 percent that reinforcing steel corrosion is occurring in that area at the time of measurement.
The standard further st:ites: "Tn l:ihorntory tests where potentials were more negative than -0.50 V CSE, approximately half of the specimens cracked due to corrosion activity."
Based on these criteria, the only ponding agent found to be noncorrosive throughout the length of the project was the tap water solution. Of the four alternative deicers being tested, the CMA solution provided the most promising results. When the weekly reading of the three CMA-ponded blocks were averaged, no average set of readings had a CSE potential measurement more negative than -0.30 V. Table 3 gives a partial list of these average readings. All but two of block lO's weekly measurements, and a majority of block 12's measurements, were more positive than -0.2 V. This indicates that most of the time no corrosion was likely taking place. In PCI blocks 8 and 9 an interesting thing occurred. CSE readings the first 11 weeks averaged above - 0.45 V (Block 8) and - 0.40 V (Block 9). Then, beginning in week 14, their CSE readings became significantly less negative. Readings in the last 8 weeks averaged between - 0.37 V and
Material Amount Absolute Volume
Cement 430 lb. 0.0813
Water 250 lb. 0.1484
Coarse Aggregate 1586 lb. 0.3551
Fine Aggregate 1597 lb. 0.3552
Air Content 6!1 % 0.0600
Slump 5±1 in.
Callahan 15
r- 2"-1 ·- - 4" --1 -t-2"
t- 6 4•
L 5 0
1 4 0 0
I FIGURE 2 Copper-copper sulfate electrical potential reading locations.
- 0.44 V for Block 8 and between -0.29 V and -0.34 V for Block 9.
Cracking of both blocks was observed in the second week of ponding. The high initial readings were probably caused by penetration of chloride ion through these cracks to the reinforcement. The PCI apparently could not penetrate to the reinforcement until after week 11. Once it did reach the steel , however, its results were better than those of all other materials except CMA. Because of the possibility that the cracking may have influenced the testing, a second set of three PCI blocks was made. These blocks also cracked, however, soon after ponding was initiated. CSE potential readings on these blocks were similar to those tested previously. Readings more negative than - 0.35 V were common in two of the three blocks.
A majority of readings of the CaC12 solution blocks averaged between -0.40 V and -0.50 V, while the majority of readings of the CMA + NaCl blocks were between - 0.45 V and -0.50 V. Of the four ponding solutions tested, the CG-90 material produced the largest negative CSE readings. Average CSE readings more negative than -0.55 V were common. These values were very close to what was obtained from the NaCl blocks.
Tests run on the material supplied by Cargill revealed that the material contained only 0.16 percent phosphates. At Cargill's request , a second set of blocks was ponded with the material now containing 1.6 percent phosphates . The increased phosphate content had little effect on the CSE results , however. Average readings more negative than -0.50 V were obtained on two of the three blocks .
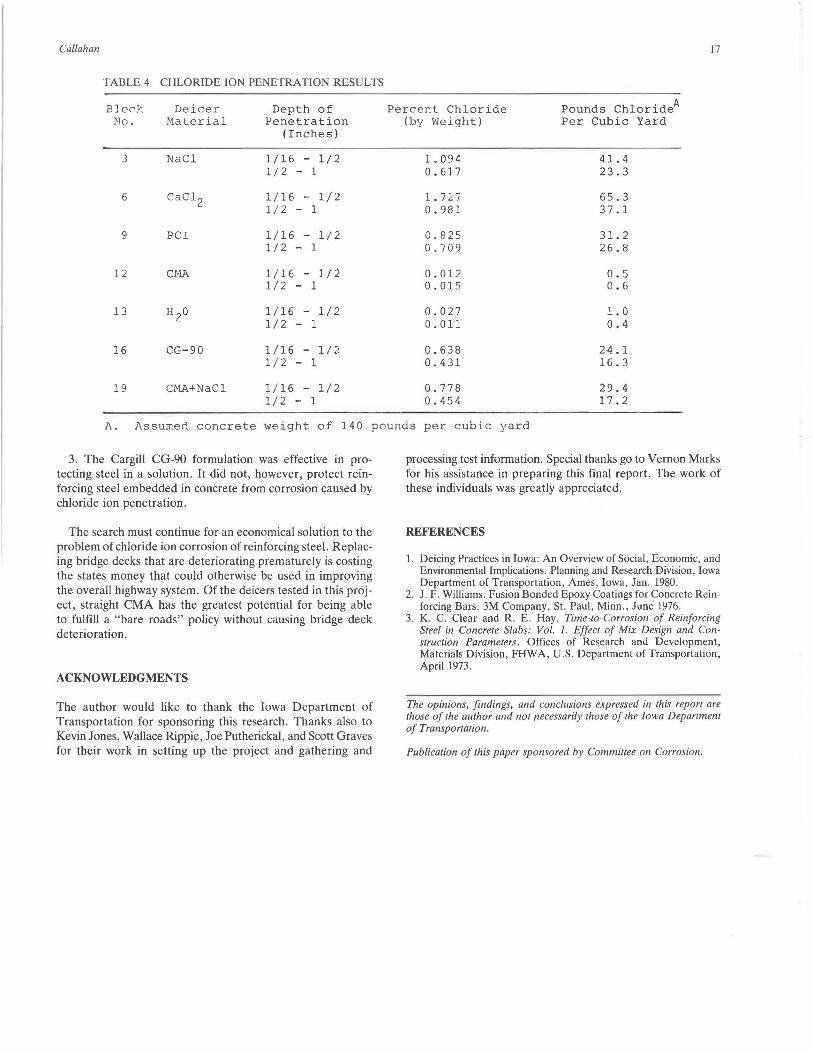
At the end of the 21-week ponding period, concrete samples were taken to determine the amount of chloride ions present at two depths in the concrete . Measured from the ponded surface of the concrete block, the two depths evaluated were from n in. to 1 in . (concrete cover) and from ! in . to 1 in . (level of reinforcing steel). The samples were obtained from blocks 3 (NaCl), 6 (CaCl2) , 9 (PCI) , 12 (CMA), 13 (H20), 16 (CG-90), and 19 (CMA + NaCl). Results of the chloride penetration work are provided in Table 4.
The penetration results verify that chloride ions were available at the level of the steel for a corrosive reaction to occur.
The CMA and tap water chloride ion penetration results are, as expected, very low. Since no material containing chloride ions was added to the solutions, any chloride ions present were in the concrete materials prior to. ponding.
Visual inspection of portions of the reinforcing steel revealed that corrosion was occurring in all but the pure CMA-ponded blocks . By comparing the upper-level steel to the bottomlevel steel, it was observed that substantial corrosion had occurred in the upper-level steel. This was true in all but the pure CMA block. (The one H20 block was not broken, but all indications are that corrosion had not taken place.)
The chloride ion penetration results substantiate findings of the CSE potential reading . Having very few chloride ions present to react with the reinforcing steel, the CMA and tap water CSE potential readings indicated that corrosion was not occurring. The high chloride ion contents of the other solutions corresponded to potential readings, indicating that corrosion was likely taking place .
It should be noted that the chloride ion concentrations
16 TRANSPORTATION RESEARCH RECORD 1211
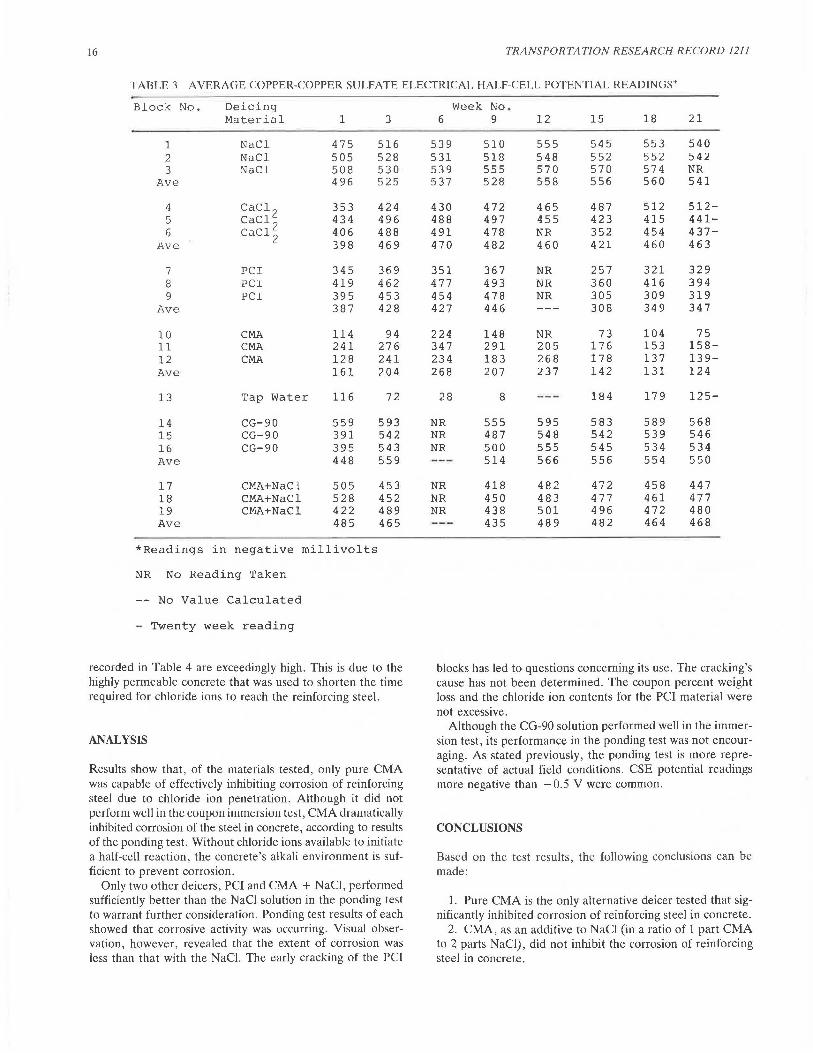
TARUO: 1 AVERAGE COPPER-COPPER SULFATE ELECTRICAL HALF-CELL POTENTIAL READINGS*
Block No. Deicing Material 1 3
1 NaCl 475 516 2 NaCl 505 528 3 NaCl 508 530
Ave 496 525
4 Cacl2
353 424 5 CaC1
2 434 496
6 CaC12
406 488 Ave 398 469
7 PCI 345 369 8 PCI 419 462 9 PCI 395 453
Ave 387 428
10 CMA 114 94 11 CMA 241 276 12 CMA 128 241 Ave 161 204
13 Tap Water 116 72
14 CG-90 559 593 15 CG-90 391 542 16 CG-90 395 543 Ave 448 559
17 CMA+NaCl 505 453 18 CMA+NaCl 528 452 19 CMA+NaCl 422 489 Ave 485 465
*Readings in negative millivolts
NR No Reading Taken
No Value Calculated
- Twenty week reading
recorded in Table 4 are exceedingly high. This is due to the highly permeable concrete that was used to shorten the time required for chloride ions to reach the reinforcing steel.
ANALYSIS
Results show that, of the materials tested, only pure CMA was capable of effectively inhibiting corrosion of reinforcing steel due to chloride ion penetration. Although it did not perform wdl in tht: cuupun i11u111;:1siu11 lt:sl, CMA dramatically inhibited corrosion of the steel in concrete, according to results of the ponding test. Without chloride ions available to initiate a half-cell reaction, the concrete's alkali environment is sufficient to prevent corrosion.
Only two other deicers, PCI and CMA + NaCl, performed sufficiently better than the NaCl solution in the ponding test to warrant further consideration. Ponding test results of each showed that corrosive activity was occurring. Visual observation, however, revealed that the extent of corrosion was less than that with the NaCl. The early cracking of the PCI
Week 6
539 531 539 537
430 488 491 470
351 477 454 427
224 347 234 268
28
NR NR NR
NR NR NR
No. 9
510 518 555 528
472 497 478 482
367 493 478 446
148 291 183 207
8
555 487 500 514
418 450 438 435
12
555 548 570 558
465 455 NR 460
NR NR NR
NR 205 268 237
595 548 555 566
482 483 501 489
15 18 21
545 553 540 55:! ~~;! ~4:!
570 574 NR 556 560 541
487 512 512-423 415 441-352 454 437-421 460 463
257 321 329 360 416 394 305 309 319 308 349 347
73 104 75 176 153 158-178 137 139-142 131 124
184 179 125-
583 589 568 542 539 546 545 534 534 556 554 550
472 458 447 477 461 477 496 472 480 482 464 468
blocks has led to questions concerning its use. The cracking's cause has not been determined. The coupon percent weight loss and the chloride ion contents for the PCI material were not excessive.
Although the CG-90 solution performed well in the immersion test, its performance in the ponding test was not encouraging. As stated previously, the ponding test is more representative of actual field conditions. CSE potential readings more negative than - 0.5 V were common.
CONCLUSIONS
Based on the test results, the following conclusions can be made:
1. Pure CMA is the only alternative deicer tested that significantly inhibited corrosion of reinforcing steel in concrete.
2. CMA, as an additive to NaCl (in a ratio of 1 part CMA to 2 parts NaCl), did not inhibit the corrosion of reinforcing steel in concrete.
Callahan 17
TABLE 4 CHLORIDE ION PENETRATION RESULTS
Elcrk Deicer Depth of Percer.t Chloride Pounds ChlorideA No. Material Penetration (by Weight) Per Cubic Yard
(Inches)
3 NaCl 1/16 - 1/2 1.094 41. 4 1/2 - 1 0.617 23.3
6 cac12 1/16 - 1/2 1. 727 65.3 1/2 - 1 0.981 37.1
9 PCI 1/16 - 1/2 0.825 31. 2 1/2 - 1 0.709 26.8
12 CMA 1/16 - 1/2 0.012 0.5 1/2 - 1 0.015 0 . 6
13 H 2o 1/16 - 1/2 0.027 1. 0 1/2 - 1 0. 011 0.4
16 CG-90 1 /16 - 1/2 C.638 24.1 1/2 - 1 0.431 16.3
19 CMA+NaCl 1/16 - 1/2 0.778 29.4 1/2 - 1 0.454 17.2
A. Assumed concrete weight of 140 pounds per cubic yard
3. The Cargill CG-90 formulation was effective in protecting steel in a solution. It did not, however, protect reinforcing steel embedded in concrete from corrosion caused by chloride ion penetration.
The search must continue for an economical solution to the problem of chloride ion corrosion ofreinforcing steel. Replacing bridge decks that are deteriorating prematurely is costing the states money that could otherwise be used in improving the overall highway system. Of the deicers tested in this project, straight CMA has the greatest potential for being able to fulfill a "bare roads" policy without causing bridge deck deterioration.
ACKNOWLEDGMENTS
The author would like to thank the Iowa Department of Transportation for sponsoring this research. Thanks also to Kevin Jones , Wallace Rippie, Joe Putherickal, and Scott Graves for their work in setting up the project and gathering and
processing test information. Special thanks go to Vernon Marks for his assistance in preparing this final report. The work of these individuals was greatly appreciated.
REFERENCES
1. Deicing Practices in Iowa: An Overview of Social, Economic, and Environmental Implications. Planning and Research Division, Iowa Department of Transportation , Ames, Iowa, Jan. 1980.
2. J . F. Williams. Fusion Bonded Epoxy Coatings for Concrete Rein· forcing Bars. 3M Company, St. Paul, Minn., June 1976.
3. K. C. Clear and R. E. Hay. Time-to-Corrosion of Reinforcing Steel in Concrete Slabs: Vol. 1. Effect of Mix Design and Construction Parameters. Offices of Research and Development, Materials Division, FHWA, U .S. Department of Transportation, April 1973.
The opinions, findings, and conclusions expressed in this report are those of the author and not necessarily those of the Iowa Department of Transportation.
Publication of this paper sponsored by Committee on Corrosion .
18 TRANSPORTATION RESEARCH RECORD 1211
Technical Review of Calcium Nitrite Corrosion Inhibitor in Concrete
NEAL S. BERKE AND ARNOLD ROSENBERG
Calcium nitrite has been used as a corrosion inhibitor against chloride attack and as a set accelerator in concrete for more than 20 years. Considerable data are available concerning its effects on corrosion inhibition, setting times, freeze-thaw resistance, strength, and other properties. Although much of the data have been published in the open literature, a t'ullscale review is not available. This paper reviews past and present research on the properties of calcium nitrite in concrete. While the bulk of the data have been generated by W.R. Grace & Co., considerable information is available from outside sources, including the U.S. Federal Highway Administration (FHWA), departments of transportation, universities, and independent test laboratories. It is shown that calcium nitrite is an effective corrosion inhibitor for steel in concrete, based upon extensive corrosion testing in laboratory and field concrete specimens. The effects of mix design and concrete cover on corrosion resistance with calcium nitrite are also discussed. Furthermore, in most cases, calcium nitrite improves the compressive strength of the concrete mix and, with proper air entrainment, is freeze-thaw durable. In conclusion, the data generated in the last 20 years show that calcium nitrite is a proven corrosion-inhibiting admixture to be used to protect concrete structures in a chloride environment.
Steel-reinforced concrete is a widely used construction material. The concrete provides. fl. protective environment for the steel, and the steel provides the concrete with tensile strength. When reinforced concrete is subjected to chloride-containing salt, however, corrosion of the steel reinforcement can occur. The corrosion of the steel eventually leads to significant deterioration of the reinforced concrete.
The effects of corrosion are staggering. Approximately half of the 500,000-plus bridges in the U.S. highway system are in need of repair (J). The Strategic Highway Research Program pointed out that $450 to $500 million per year can be saved by correcting corrosion problems in extant bridges (2) .
Most bridge failures are due to deicing salts. However, bridges in marine environments arc also susceptible to severe corrosion due to chloride ingress. The severity of the marine environment is such that damage may be evident in as little as 5 years (3).
This paper reviews the development of calcium nitrite as a corrosion inhibitor to protect steel in concrete from chlorideinduced corrosion. Additionally, the beneficial effects of calcium nitrite on concrete, such as improved properties of mechanics and durability, are discussed.
W.R. Grace and Company, 62 Whittemore Ave., Cambridge, Mass. 02140.
HISTORY OF DEVELOPMENT
In 1961 the need for a noncorrosive accelerator for concrete became apparent. The main impetus was the definitive paper by Monfore and Verbeck ( 4) in which they showed that admixed calcium chloride caused the Regina, Saskatchewan, waterpipe failure. This followed closely a similar study by Evans (5), in which he found that chloride caused corrosion of steel in prestressed concrete.
The most obvious approach seemed to be a salt that would accelerate concrete's setting time but also act as a corrosion inhibitor. Treadaway and Russell (6) studied sodium nitrite and sodium benzoate. Craig and Wood (7) studied potassium chromate, sodium benzoate, and sodium nitrite. These papers and others agreed that sodium nitrite offered the best protection for concrete from chloride-induced corrosion but that the strength of the concrete was reduced when any of these materials were used. Figure 1 shows the reduction of strength with various inhibitors (7). Further, the risk of the alkaliaggregate reaction was worsened by the addition of a sodium salt.
Further studies revealed that to maintain or improve the strength of the concrete, the cation system of concrete, namely calcium, could not be changed. Thus, in 1964 a noncorrosive accelerator based on calcium formate and a small amount of sodium nitrite was introduced; it did not result in loss of strength (8). The calcium formate/10 percent sodium nitrite
iii ~
7.0
- 6.0 ::c I; --- ....
•••• It ••••• ..... ---ffi 5.0 a: ---Iii ~ 4.0 iii Cf) w g: 3.0
~ 0 (J 2.0
• • • • • • SODIUM NITRITE
- POTASSIUM CHROMATE
- - - SODIUM BENZOATE
2% CaCl2 INCWDED IN ALL CASES
1.0--------------------.. 0 2 4
% CHEMICAL CORROSION INHIBITOR
FIGURE 1 Effects of some corrosion inhibitors on compressive strength (7).
6
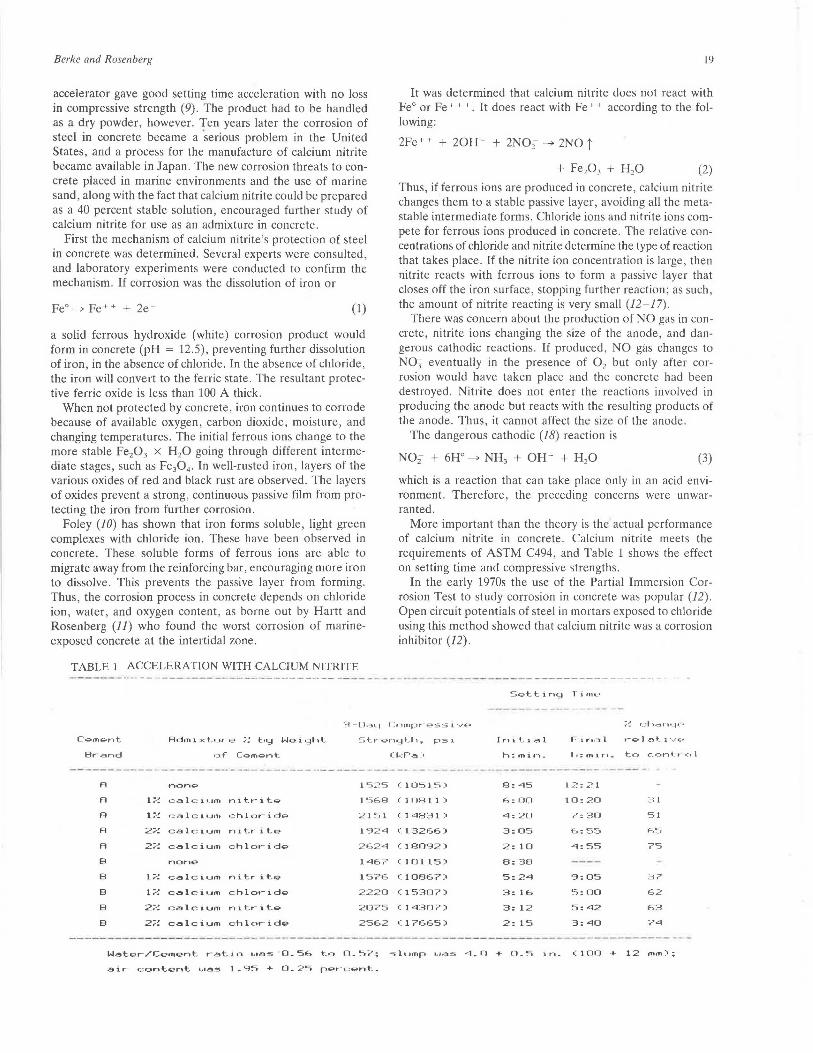
Berke and Rosenberg
accelerator gave good setting time acceleration with no loss in compressive strength (9). The product had to be handled as a dry powder, however. Ten years later the corrosion of steel in concrete became a "serious problem in the United States, and a process for the manufacture of calcium nitrite became available in Japan. The new corrosion threats to concrete placed in marine environments and the use of marine sand, along with the fact that calcium nitrite could be prepared as a 40 percent stable solution, encouraged further study of calcium nitrite for use as an admixture in concrete.
First the mechanism of calcium nitrite's protection of steel in concrete was determined. Several experts were consulted, and laboratory experiments were conducted to confirm the mechanism. If corrosion was the dissolution of iron or
(1)
a solid ferrous hydroxide (white) corrosion product would form in concrete (pH = 12.5) , preventing further dissolution of iron, in the absence of chloride. In the absence of chloride , the iron will convert to the ferric state. The resultant protective ferric oxide is less than 100 A thick.
When not protected by concrete, iron continues to corrode because of available oxygen, carbon dioxide, moisture, and changing temperatures. The initial ferrous ions change to the more stable Fe20 3 x H20 going through different intermediate stages, such as Fe30 4 • In well-rusted iron, layers of the various oxides of red and black rust are observed. The layers of oxides prevent a strong, continuous passive film from protecting the iron from further corrosion.
Foley (10) has shown that iron forms soluble , light green complexes with chloride ion. These have been observed in concrete. These soluble forms of ferrous ions are able to migrate away from the reinforcing bar, encouraging more iron to dissolve. This prevents the passive layer from forming. Thus, the corrosion process in concrete depends on chloride ion, water, and oxygen content , as borne out by Hartt and Rosenberg (11) who found the worst corrosion of marineexposed concrete at the intertidal zone.
TABLE 1 ACCELERATION WITH CALCIUM NITRITE
19
It was determined that calcium nitrite does not react with Fe0 or Fe +++ . It does react with Fe + • according to the following:
2Fe+ + + 20H - + 2N02- -4 2NO j
(2)
Thus, if ferrous ions are produced in concrete, calcium nitrite changes them to a stable passive layer, avoiding all the metastable intermediate forms. Chloride ions and nitrite ions compete for ferrous ions produced in concrete. The relative concentrations of chloride and nitrite determine the type of reaction that takes place. If the nitrite ion concentration is large, then nitrite reacts with ferrous ions to form a passive layer that closes off the iron surface, stopping further reaction; as such, the amount of nitrite reacting is very small (12-17).
There was concern about the production of NO gas in concrete, nitrite ions changing the size of the anode, and dangerous cathodic reactions . If produced, NO gas changes to N03 eventually in the presence of 0 2 but only after corrosion would have taken place and the concrete had been destroyed. Nitrite does not enter the reactions involved in producing the anode but reacts with the resulting products of the anode . Thus, it cannot affect the size of the anode.
The dangerous cathodic (18) reaction is
(3)
which is a reaction that can take place only in an acid environment. Therefore, the preceding concerns were unwarranted.
More important than the theory is the actual performance of calcium nitrite in concrete. Calcium nitrite meets the requirements of ASTM C494, and Table l shows the effect on setting time and compressive strengths.
In the early 1970s the use of the Partial Immersion Corrosion Test to study corrosion in concrete was popular (12). Open circuit potentials of steel in mortars exposed to chloride using this method showed that calcium nitrite was a corrosion inhibitor (12).
St:? tting Time
:i - 0-'=1~ 1 C ompre ss iv(?
Cem~nt Adin1 x tur · Q ~~~by We i·~ht In1.t1al rin.~ l r lfi?laLi·-..- ~ ·
Bra nd ( kp~ · · h:min_ h: min .. t o cont,.•=• I
A no nil? 1 5:~5 (1051 5 ) 8:45 12: ~~ 1
A l -_, cal c 1um n1t .... -it-.. 1 'S68 ( I 081 l ) 6:0[1 10:20 31
A l -_, calcium c:hlorid~ 2 1 5 1 ( l 48:31 ) 4: 2 0 7:30 51
A 2;:.;: ca l c i•Jm nitr-1 te 1 924 (13266) 3:05 6:55 65
A 2-, ,,_ c.elcium chloride 2624 ( 1809.2) 2: 10 4:55 75
B non~ 146 7 (10115) 8:38
B l;:.;: calcium nitritQ 1 576 (10867) 5:24 9:05 37
B l;:.;: calci•Jm chloride 2220 (15307) 3: 16 5:00 62
B 2;:.;: calcium nitritg. 2 0 7 5 (14307) 3: 12 5:42 63
B 2;:.;: calcium chloridQ 2562 (17665) 2: 1 5 3:40 74
Watgr/Cement ratio was 0-56 to 0_57; 5 lump wa5 4_0 + 0_5 in_ (100 + 12 mm);
air content was \_95 + 0-25 p~rcQnt-
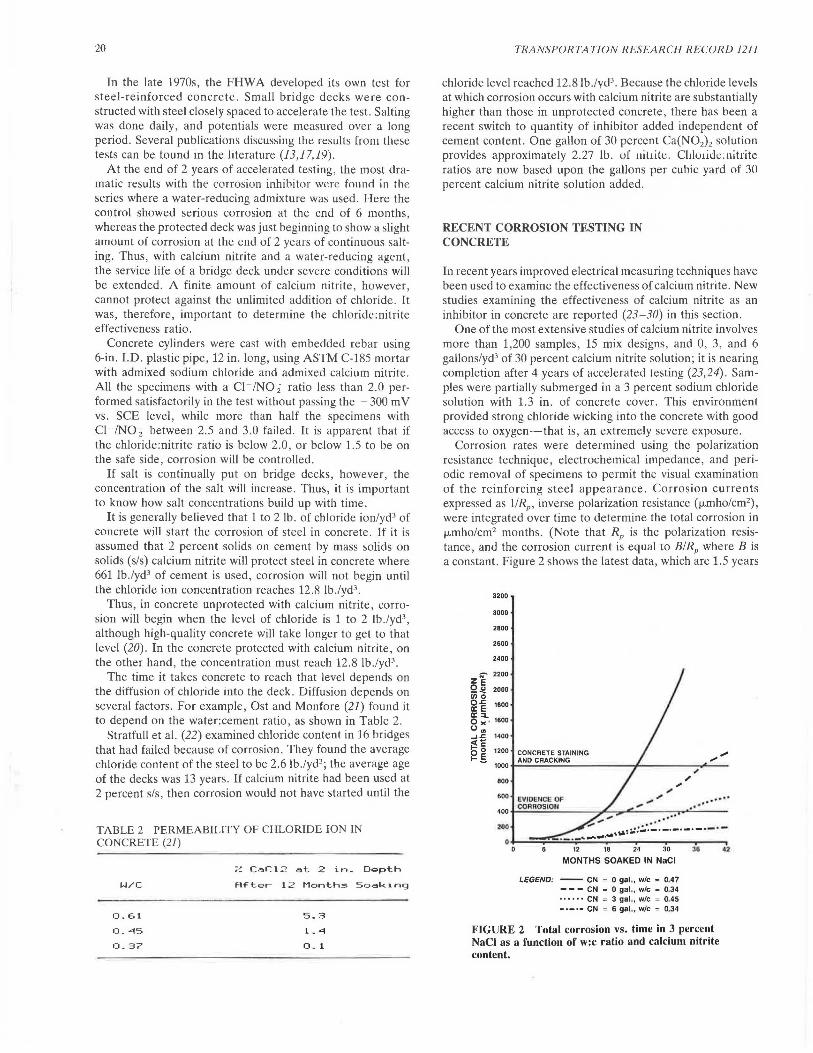
20
Tn the late 1970s, the FHWA developed its own test for steel-reinforced concrete. Small bridge decks were constructed with steel closely spaced to accelerate the test. Salting was done daily, and potentials were measured over a long period. Several publications discussing lhe results from these tests can be tound m the literature (13,17,19).
At the end of 2 years of accelerated testing, the most dramatic results with the corrosion inhibitor were frrnnci in the series where a water-reducing admixture was used . Here the control showed serious corrosion at the end of 6 months, whereas the protected deck was just beginning to show a slight amount of corrosion al lhe end of 2 years of continuous salting. Thus, with calcium nitrite and a water-reducing agent , the service life of a bridge deck under severe conditions will be extended. A finite amount of calcium nitrite , however, cannot protect against the unlimited addition of chloride. It was, therefore, important to determine the chloride :nitrite effectiveness ratio.
Concrete cylinders were cast with embedded rebar using 6-in. l.D. plastic pipe, 12 in . long, using ASTM C-185 mortar with admixed sodium chloride and admixed calcium nitrite. All the specimens with a c1 - 1N02 ratio less than 2.0 performed satisfactorily in the test without passing the - 300 m V vs. SCE level, while more than half the specimens with c1-1No 2 between 2.5 and 3.0 failed . It is apparent that if the chloride:nitrite ratio is below 2.0, or below 1.5 to be on the safe side, corrosion will be controlled .
If salt is continually put on bridge decks, however, the concentration of the salt will increase. Thus, it is important to know how salt concentrations build up with time.
It is generally believed that 1 to 2 lb . of chloride ion/yd3 of concrete will start the corrosion of steel in concrete . If it is assumed that 2 percent solids on cement by mass solids on solids (s/s) calcium nitrite will protect steel in concrete where 661 lb ./yd3 of cement is used , corrosion will not begin until the chloride ion concentration reaches 12.8 lb./yd3 .
Thus, in concrete unprotected with calcium nitrite, corrosion will begin when the level of chloride is 1 to 2 lb ./yd3, although high-quality concrete will take longer to get to that level (20) . In the concrete protected with calcium nitrite, on the other hand, the concentration must reach 12.8 lb./yd3 .
The time it takes concrete to reach that level depends on the diffusion of chloride into the deck. Diffusion depends on several factors. For example, Ost and Monfore (21) found it to depend on the water:cement ratio, as shown in Table 2.
Stratfull et al. (22) examined chloride content in 16 bridges that had failed because of corrosion. They found the average chloride content of the steel to be 2.6 lb./yd3
; the average age of the decks was 13 years. If calcium nitrite had been used at 2 percent s/s, then corrosion would not have started until the
TABLE 2 PERMEABILITY OF CHLORIDE ION IN CONCRETE (21)
W/C
0.61
0.45
0.37
% CaC12 at 2 in. Qgpth
A~ter 1 2 Month~ Soaking
5 .3
1 - 4
Q _ l
TRANSPORTATION RESEARCH RECORD 1211
chloride level reached 12.8 lb./yd3• Because the chloride levels
at which corrosion occurs with calcium nitrite are substantially higher than those in unprotected concrete, there has been a recent switch to quantity of inhibitor added independent of cement content. One gallon of 30 percent Ca(N02)i solution provides approximately 2.27 llJ. u[ 11il1ile . Cltlu1ide :nitrite ratios are now based upon the gallons per cubic yard of 30 percent calcium nitrite solution added.
RECENT CORROSION TESTING IN CONCRETE
In recent years improved electrical measuring techniques have been used to examine the effectiveness of calcium nitrite. New studies examining the effectiveness of calcium nitrite as an inhibitor in concrete are reported (23-30) in this section.
One of the most extensive studies of calcium nitrite involves more than 1,200 samples, 15 mix designs, and 0, 3, and 6 gallons/yd3 of 30 percent calcium nitrite solution; it is nearing completion after 4 years of accelerated testing (23,24). Samples were partially submerged in a 3 percent sodium chloride solution with 1.3 in. of concrete cover. This environment provided strong chloride wicking into the concrete with good access to oxygen-that is, an extremely severe exposure.
Corrosion rates were determined using the polarization resistance technique , electrochemical impedance, and periodic removal of specimens to permit the visual examination of the reinforcing steel appearance. Corrosion currents expressed as l/RP, inverse polarization resistance (µmho/cm2
),
were integrated over time to determine the total corrosion in µmho/cm 2 months. (Note that RP is the polarization resistance, and the corrosion current is equal to BIRP where Bis a constant. Figure 2 shows the latest data, which are 1.5 years
3200
3000
2800
2600
2400
~ 2200 ZE Q ~ 2000 UIO ~~ 1800
~ ; . 1600 011> ..J~ 1400
t! E Q l 1200 CONCRETE STAINING ~ - AND CRACKING
BOO
5oo EVIDENCE OF
400 CORROSIOll
200
... .... .... ···
o+-...;;;;;~.::.;.;::.:.;;=.=;.._.,......~-.-~-.-~--r~---.
0 12 18 24 30
MONTHS SOAKED IN NaCl
LEGEND: -- CN = 0 gal. , w/c = 0.47 - - - CN = O gal. , w/c = 0.34 • • • • • • CN = 3 gal., w/c = 0.45 -·-·- CN = 6 gal •• w/c = 0.34
36
FIGURE 2 Total corrosion vs. time in 3 percent NaCl as a function of w:c ratio and calcium nitrite content.
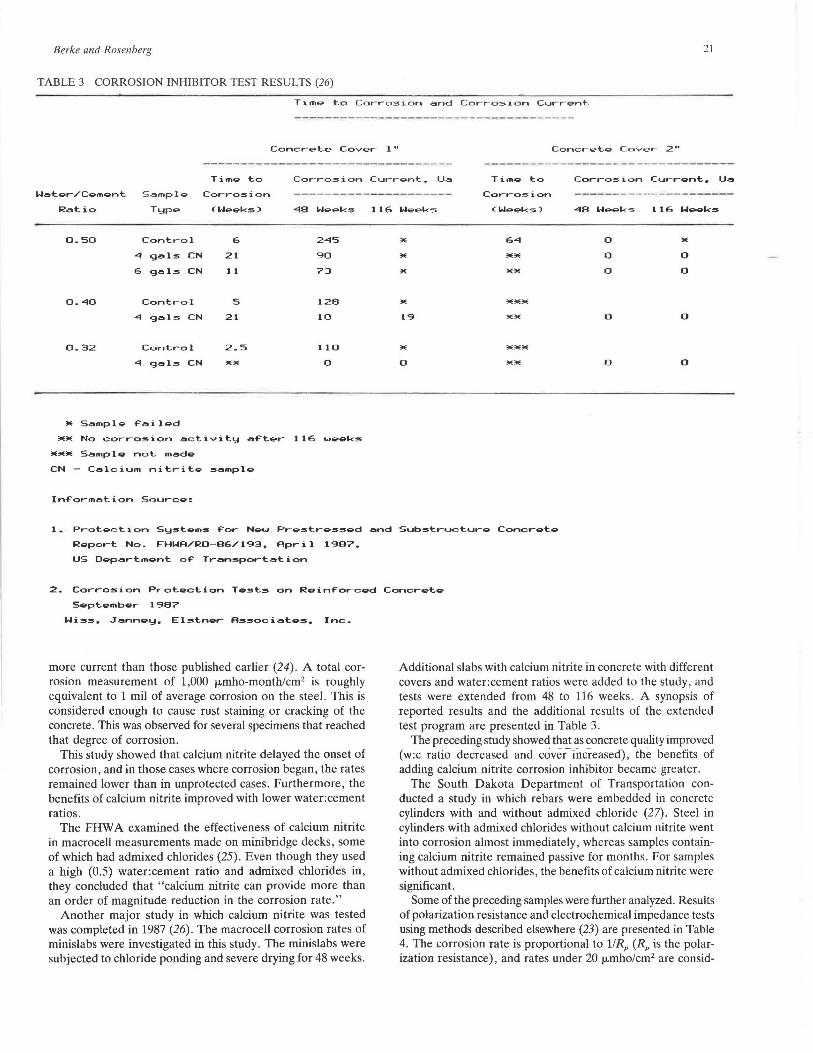
Berke and Rosenberg 21
TABLE 3 CORROSION INHIBITOR TEST RESULTS (26)
Timg to Corro3ion and Corrosion CurrQnt
~~~-----------~~~~
Timg to
Water/CQmgnt Sample Corrosion
Corro5ion CurrQnt, Ua Tim.., to Corrosion Currgnt, Ua
Ratio Typ<>
0.50 Control 6 245
4 gal5 CN 21 90
6 gal!5 CN l l 73
0.40 Control 5 128
4 gals CN 21 10
0.32 Control 2.5 110
4 gal,,. CN .... 0
M Sampl,.. rai lQd
*~No corro5ion activity aFtQr 116 WQek5
*** Samplq not madQ
CN - Calcium nitritQ sample
InFormation Sourcv:
Corrosion
llE 64 0 ""' ""' ""'""' 0 0
""' ** 0 0
""' *** 19 ""* 0 0
* *** 0 >E:>E 0 0
1. ProtQction Sy5toms For New PrQstr9~sQd and Substructurg Concrote
RQport No. FHMA/R0-86/193, April 1987,
US Ogpartmont oF Transport~tion
2. Corrosion Protection Tosts on ReinForcod ConcrQto
SQptQmbQr 1907
Wi5s. Jannoy, El~tncw- A55ociate5. Inc.
more current than those published earlier (24) . A total corrosion measurement of 1,000 µmho-month/cm 2 is roughly equivalent to 1 mil of average corrosion on the steel. This is considered enough to cause rust staining or cracking of the concrete. This was observed for several specimens that reached that degree of corrosion.
This study showed that calcium nitrite delayed the onset of corrosion, and in those cases where corrosion began, the rates remained lower than in unprotected cases. Furthermore, the benefits of calcium nitrite improved with lower water:cement ratios.
The FHW A examined the effectiveness of calcium nitrite in macrocell measurements made on minibridge decks, some of which had admixed chlorides (25). Even though they used a high (0.5) water:cement ratio and admixed chlorides in, they concluded that "calcium nitrite can provide more than an order of magnitude reduction in the corrosion rate."
Another major study in which calcium nitrite was tested was completed in 1987 (26). The macrocell corrosion rates of minislabs were investigated in this study. The minislabs were subjected to chloride ponding and severe drying for 48 weeks.
Additional slabs with calcium nitrite in concrete with different covers and water: cement ratios were added to the study, and tests were extended from 48 to 116 weeks. A synopsis of reported results and the additional results of the extended test program are presented in Table 3.
The preceding study showed that as concrete quality improved (w:c ratio decreased and cciver-focreased), the benefits of adding calcium nitrite corrosion inhibitor became greater.
The South Dakota Department of Transportation conducted a study in which rebars were embedded in concrete cylinders with and without admixed chloride (27). Steel in cylinders with admixed chlorides without calcium nitrite went into corrosion almost immediately, whereas samples containing calcium nitrite remained passive for months. For samples without admixed chlorides, the benefits of calcium nitrite were significant.
Some of the preceding samples were further analyzed. Results of polarization resistance and electrochemical impedance tests using methods described elsewhere (23) are presented in Table 4. The corrosion rate is proportional to l!RP (RP is the polarization resistance), and rates under 20 µmho/cm2 are consid-
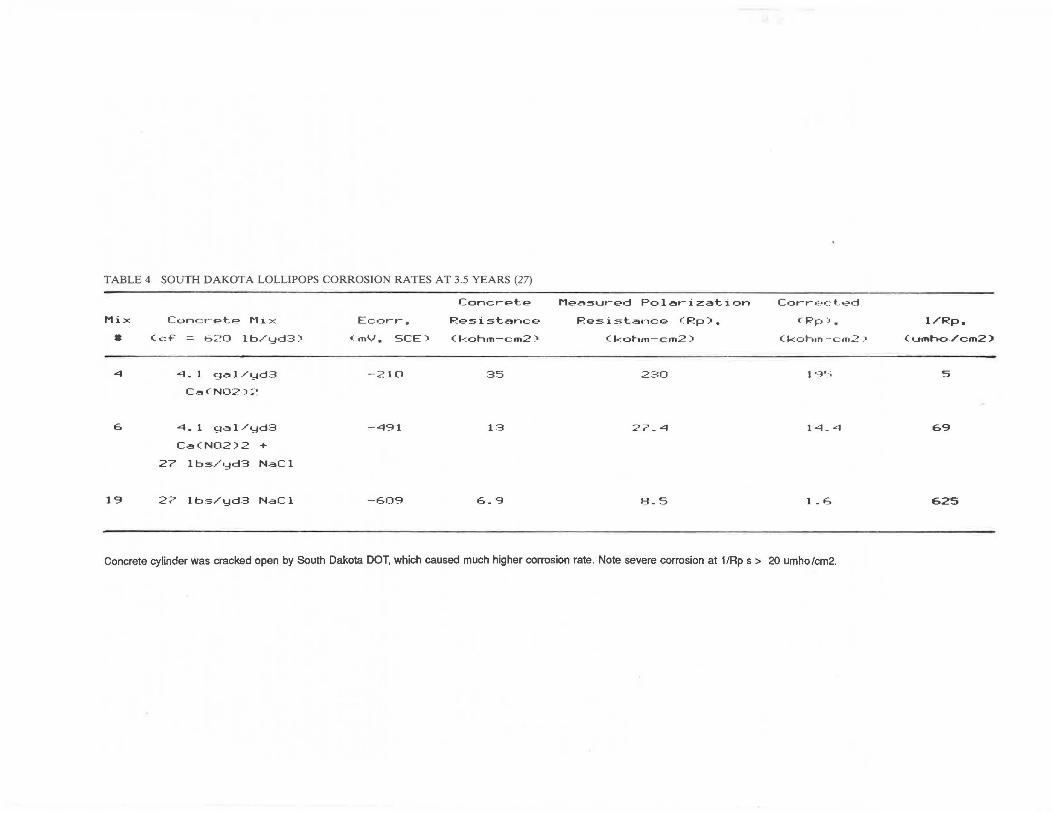
TABLE 4 sourn DAKOTA LOLLIPOPS CORROSION RATES AT 3.5 YEARS (27)
Mix
• 4
6
19
ConcretE> Mix
(cF = 620 lb/yd3)
4.1 gal/yd3
c~rN02)2
4 - 1 9·" 1 / yd3
Ca(N02)2 +
27 1 b:5/•:1d3 Nae l
27 lbs/yd3 NaCl
Ec•:>rr,
o:mv. SCE)
-210
-491
-609
Concrete
Resistance
(l-::ohm-cm2)
35
13
6.9
Mea:5ured Polarization
RE>sistancE> CRp),
(kohm-cm2)
2?.0
27 .. 4
8.5
Corr..;.•:::- t .t.?d
( l<'p),
( koh1n -~ c1T12)
l ':J':;
14. ~1
1 - 6
Concrete cylinder was cracked open by South Dakota DOT, which caused much higher corrosion rate. Note severe corrosion at 1/Rp s > 20 umho/cm2.
l/Rp,
(umho./cm2)
5
69
625
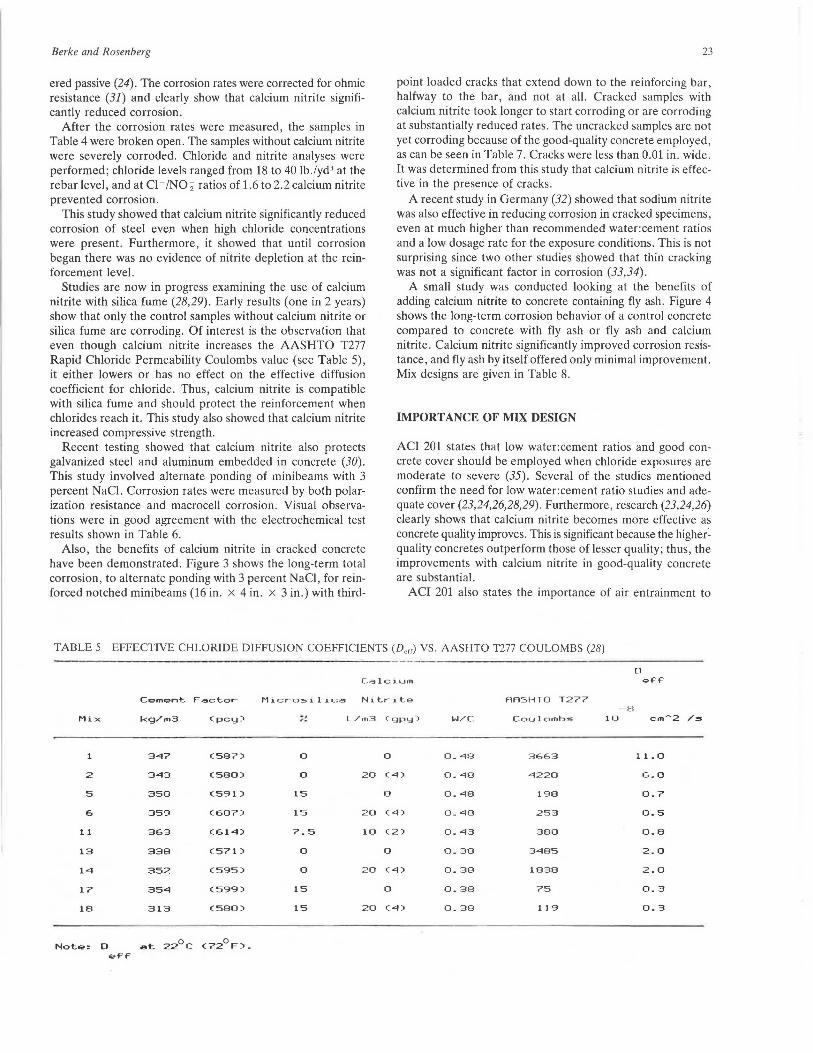
Berke and Rosenberg
ered passive (24). The corrosion rates were corrected for ohmic resistance (31) and clearly show that calcium nitrite significantly reduced corrosion.
After the corrosion rates were measured, the samples in Table 4 were broken open. The samples without calcium nitrite were severely corroded. Chloride and nitrite analyses were performed; chloride levels ranged from 18 to 40 lb./yd3 at the rebar level, and at c1-1NO;: ratios of 1.6 to 2.2 calcium nitrite prevented corrosion.
This study showed that calcium nitrite significantly reduced corrosion of steel even when high chloride concentrations were present. Furthermore, it showed that until corrosion began there was no evidence of nitrite depletion at the reinforcement level.
Studies are now in progress examining the use of calcium nitrite with silica fume (28,29). Early results (one in 2 years) show that only the control samples without calcium nitrite or silica fume are corroding. Of interest is the observation that even though calcium nitrite increases the AASHTO T277 Rapid Chloride Permeability Coulombs value (see Table 5), it either lowers or has no effect on the effective diffusion coefficient for chloride. Thus, calcium nitrite is compatible with silica fume and should protect the reinforcement when chlorides reach it. This study also showed that calcium nitrite increased compressive strength.
Recent testing showed that calcium nitrite also protects galvanized steel and aluminum embedded in concrete (30). This study involved alternate ponding of minibeams with 3 percent NaCl. Corrosion rates were measured by both polarization resistance and macrocell corrosion. Visual observations were in good agreement with the electrochemical test results shown in Table 6.
Also, the benefits of calcium nitrite in cracked concrete have been demonstrated. Figure 3 shows the long-term total corrosion, to alternate ponding with 3 percent NaCl, for reinforced notched minibeams (16 in . x 4 in. x 3 in.) with third-
23
point loaded cracks that extend down to the reinforcing bar, halfway to the bar, and not at all. Cracked samples with calcium nitrite took longer to start corroding or are corroding at substantially reduced rates. The uncracked samples are not yet corroding because of the good-quality concrete employed, as can be seen in Table 7. Cracks were less than 0.01 in. wide. It was determined from this study that calcium nitrite is effective in the presence of cracks.
A recent study in Germany (32) showed that sodium nitrite was also effective in reducing corrosion in cracked specimens, even at much higher than recommended water:cement ratios and a low dosage rate for the exposure conditions. This is not surprising since two other studies showed that thin cracking was not a significant factor in corrosion (33,34).
A small study was conducted looking at the benefits of adding calcium nitrite to concrete containing fly ash. Figure 4 shows the long-term corrosion behavior of a control concrete compared to concrete with fly ash or fly ash and calcium nitrite. Calcium nitrite significantly improved corrosion resistance, and fly ash by itself offered only minimal improvement. Mix designs are given in Table 8.
IMPORTANCE OF MIX DESIGN
ACI 201 states that low water:cement ratios and good concrete cover should be employed when chloride exposures are moderate to severe (35). Several of the studies mentioned confirm the need for low water: cement ratio studies and adequate cover (23,24,26,28,29). Furthermore, research (23,24,26) clearly shows that calcium nitrite becomes more effective as concrete quality improves. This is significant because the higher~ quality concretes outperform those of lesser quality; thus, the improvements with calcium nitrite in good-quality concrete are substantial.
ACI 201 also states the importance of air entrainment to
TABLE 5 EFFECTIVE CHLORIDE DIFFUSION COEFFICIENTS (D, rr) VS. AASHTO T277 COULOMBS (28)
[1
Cal c ium <?FF
C19'mqnt Factor Microsilica Nitrite AAS HTO T277 - 8
Mix kg/m3 (pcy:> -· '· L / m3 <gpy) W/ C Coulomb~ 10 cm-2 /5
1 347 (587) 0 0 0_48 3 663 11. 0
2 343 (580) 0 20 (4) 0.48 4 2 20 6.0
5 350 (591) 15 0 0.48 198 0.7
6 359 (607) 15 20 (4) 0.48 253 0.5
11 363 (614) 7.5 10 (2) 0.43 380 0.8
13 338 (571) 0 0 0.38 :3485 2.0
14 352 (595) 0 2 0 (4) 0.38 1838 2.0
17 354 (599) 15 0 0.38 75 0.3
18 313 (580) 15 20 (4) 0.38 1J9 0.3
NotQ: D at 22°c (72°F). QFF
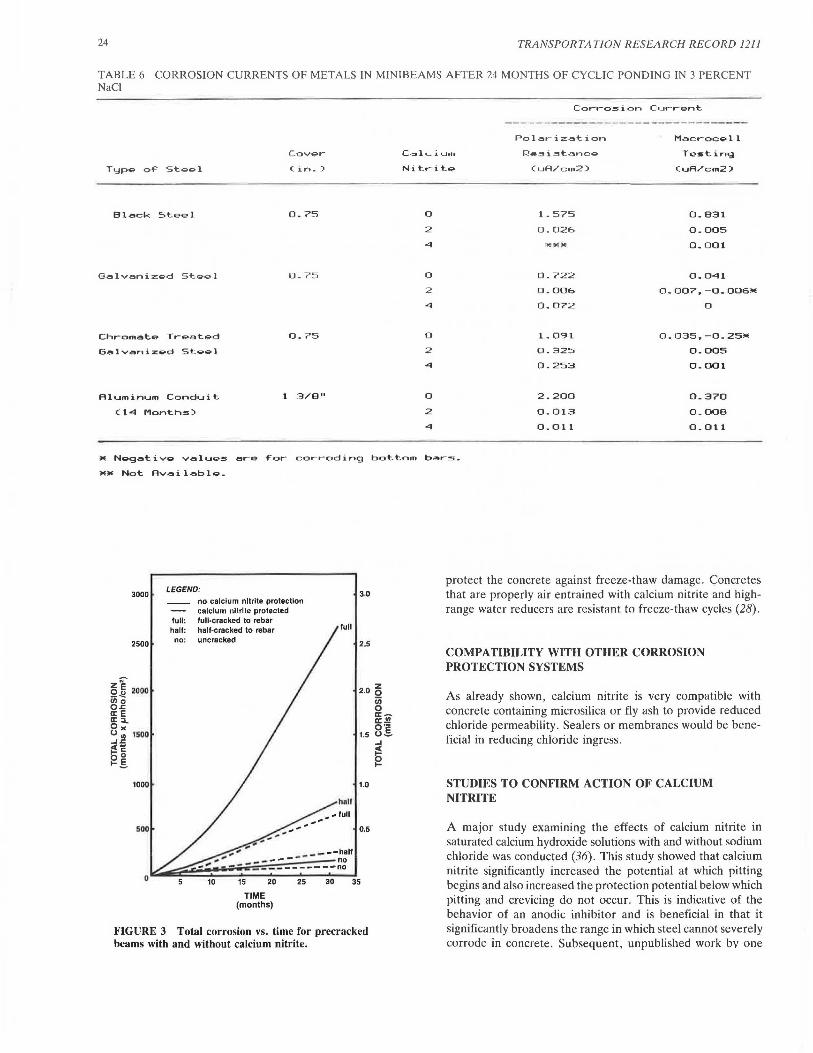
24 TRANSPORTA TION RESEARCH RECORD 1211
TABLE 6 CORROSION CURRENTS OF METALS IN MINIBEAMS AFTER 24 MONTHS OF CYCLIC PONDING IN 3 PE RCENT NaCl
Typ9 of' Steel
Black Steel
Chrom~tg Tr~ated
GalvanizQd St&&I
Aluminum Conduit
(14 Month5)
Cover
(in.)
0.75
0.75
0.75
1 3/8"
C.=::1 l L. i U1t1
Nitrit~
0
2
4
0
2
4
0
2
4
0
2
4
Corro5ion Current
Polarization
(uA/cm2 )
1.575
0.026
0.722
0.006
0.072
1. 091
0.325
0.253
2.200
0.013
0.011
Macrocell
Tc-:sting
(uA/cm2)
0.831
0.005
0.001
0.041
0.007.-0.006JIE
0
O.CJ35,-0.25W
0.005
0.001
0.370
0.000
0.011
M Nggativ9 valu~s ar9 ~or corroding bottom bars.
WW Not Availabl&.
3000
2500
~ ~ 2000 iiio o.c a: E a: :i.. o,. CJ., 1500 .... .c ~c 00 1-§.
1000
500
LEGEND:
no calcium nitrite protection calcium nitrite protected
lull : lull-cracked to rebar hall: hall-cracked to rebar no: uncracked
lull
half
3.0
2.5
2.0 ~ iii 0 a:-a: .!!
1.5 8!
1.0
0.5
.... ~ ~
____ -·hall
----- no
10
--------------no 15 20
TIME (months)
25 30 35
FIGURE 3 Total corrosion vs. time for precracked beams with and without calcium nitrite.
protect the concrete against freeze-thaw damage. Concretes that are properly air entrained with calcium nitrite and bighrange water reducers are resistilnt to freeze-thaw cycles (28).
COMPATIBILITY WITH OTHER CORROSION PROTECTION SYSTEMS
As already shown, calcium nitrite is very compatible with concrete containing microsilica or fly ash to provide reduced chloride permeability. Sealers or membranes would be beneficial in reducing chloride ingress .
STUDIES TO CONFIRM ACTION OF CALCIUM NITRITE
A major study exammmg the effects of calcium nitrite in saturated calcium hydroxide solutions with and without sodium chloride was conducted (36). This study showed that calcium nitrite significantly increased the potential at which pitting begins and also increased the protection potential below which pitting and crevicing do not occur. This is indicative of the behavior of an anodic inhibitor and is beneficial in that it significantly broadens the range in which steel cannot severely corrode in concrete. Subsequent, unpublished work by one
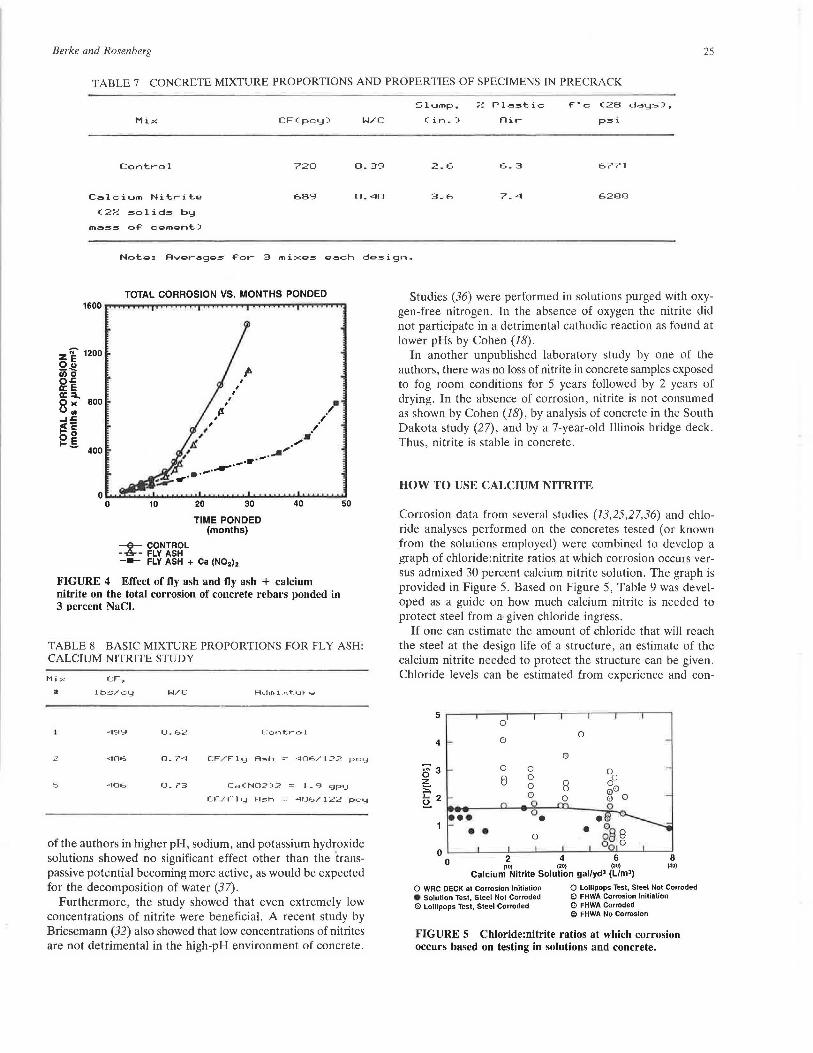
Berke and Rosenberg 25
TABLE 7 CONCRETE MIXTURE PROPORTIONS AND PROPERTIES OF SPECIMENS IN PRECRACK
Slump,. % Pla:5tic:: F"c (28 days),.
Mix CF(pc•oJ) W/C (in.) Air psi
Control 720 0.39 2.6 6.3 6771
Calcium Nitrit.g 689 0.40 3.6 7.4 6288
(2% solids by
ma~~ oF cemgnt)
Not~: Averagg~ For 3 mixes gach design.
ze Ou ii) 'a o.c a: E a: ::i.. 0 )( 0111 ....1.c gg I-.§.
TOTAL CORROSION VS. MONTHS PONDED
--&- CONTROL --&-- FLY ASH
TIME PONDED (months)
-- FLY ASH + Ca (N02),
FIGURE 4 Effect of fly ash and fly ash + calcium nitrite on the total corrosion of concrete rebars ponded in 3 percent NaCl.
50
TABLE 8 BASIC MIXTURE PROPORTIONS FOR FLY ASH: CALCIUM NITRITE STUDY
Mix CF,.
II lb.s/cy W/C
0.62
2 0.74
5 ""106 0. 73
Ad.nixturg
Control
CF/Fly A~h = 406/122 pcy
CaCN02)2 = 1.9 gpy
CF/Fly Ash = 406/122 pcy
of the authors in higher pH, sodium, and potassium hydroxide solutions showed no significant effect other than the transpassive potential becoming more active, as would be expected for the decomposition of water (37).
Furthermore, the study showed that even extremely low concentrations of nitrite were beneficial. A recent study by Briesemann (32) also showed that low concentrations of nitrites are not detrimental in the high-pH environment of concrete.
Studies (36) were performed in solutions purged with oxygen-free nitrogen. In the absence of oxygen the nitrite did not participate in a detrimental cathodic reaction as found at lower pHs by Cohen (18).
In another unpublished laboratory study by one of the authors, there was no loss of nitrite in concrete samples exposed to fog room conditions for 5 years followed by 2 years of drying. In the absence of corrosion, nitrite is not consumed as shown by Cohen (18), by analysis of concrete in the South Dakota study (27), and by a 7-year-old Illinois bridge deck. Thus, nitrite is stable in concrete.
HOW TO USE CALCIUM NITRITE
Corrosion data from several studies (13,25,27,36) and chloride analyses performed on the concretes tested (or known from the solutions employed) were combined to develop a graph of chloride: nitrite ratios at which corrosion occurs versus admixed 30 percent calcium nitrite solution. The graph is provided in Figure 5. Based on Figure 5, Table 9 was developed as a guide on how much calcium nitrite is needed to protect steel from a· given chloride ingress.
If one can estimate the amount of chloride that will reach the steel at the design life of a structure, an estimate of the calcium nitrite needed to protect the structure can be given. Chloride levels can be estimated from experience and con-
0 0
4
®
83 0 0
8 0 ~ 0 8 :;:' 2 - © 0 ~ 0
••• o • 1 - • • 0
0 L-~..L...~.......12~__,J~~4'--~-'---"~6~--'~---:_8
0 (10) (20) (:JO) (40)
Calcium Nitrite Solution gal/yd' (Lim')
0 WRC DECK at Corrosion lnitialion e Solulion Test, Steel Nol Corroded G Lollipops Test, Steel Corroded
O Lollipops Test, Steel Not Corroded 8 FHWA Corrosion Initiation e FHWA Corroded 0 FHWA No Corrosion
FIGURE 5 Chloride:nitrite ratios at which corrosion occurs based on testing in solutions and concrete.
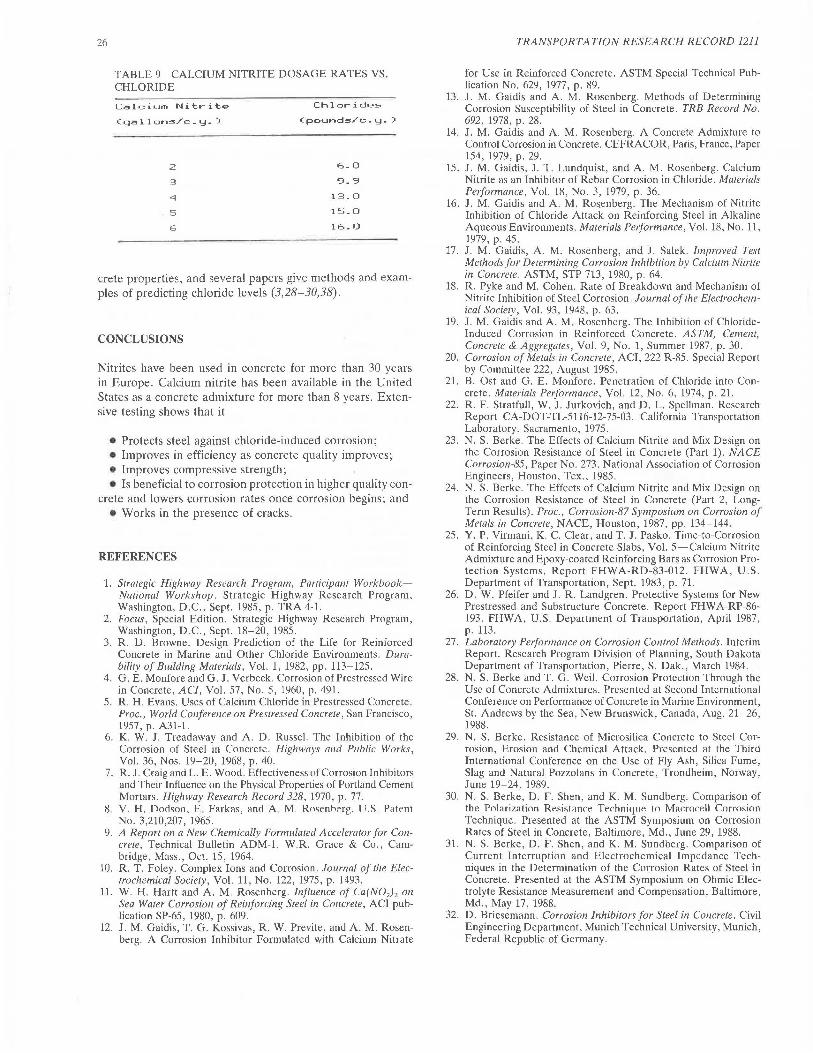
26
TABLE 9 CALCIUM NITRITE DOSAGE RATES VS. CHLORIDE
Calcium Nitrite
(gal lon~/c. Y-)
2
:3
4
5
6
Chlorides
(pounds/c.y.)
6.0
9.9
13.0
15.0
16.0
crete properties, and several papers give methods and examples of predicting chloride levels (3,28-30,38).
CONCLUSIONS
Nitrites have been used in concrete for more than 30 years in Europe. Calcium nitrite has been available in the United States as a concrete admixture for more than 8 years. Extensive testing shows that it
• Protects steel against chloride-induced corrosion; • Improves in efficiency as concrete quality improves; • Improves compressive strength; • Is beneficial to corrosion protection in higher quality con
crete and lowers corrosion rates once corrosion begins; and • Works in the presence of cracks.
REFERENCES
1. Strategic Highway Research Program, Participant WorkbookNational Workshop. Strategic Highway Research Program, Washington, D.C., Sept. 1985, p. TRA 4-1.
2. Focus, Special Edition. Strategic Highway Research Program, Washington, D .C., Sept. 18-20, 1985.
3. R. D. Browne. Design Prediction of the Life for Reinforced Concrete in Marine and Other Chloride Environments. Durability of Building Materials, Vol. 1, 1982, pp. 113-125.
4. G. E. Monfore and G. J. Verbeck. Corrosion of Prestressed Wire in Concrete, AC!, Vol. 57, No. 5, 1960, p. 491.
5. R. H. Evans. Uses of Calcium Chloride in Prestressed Concrete. Proc., World Conference on Prestressed Concrete, San Francisco, 1957, p. A31-l.
6. K. W. J. Treadaway and A. D. Russel. The Inhibition of the Corrosion of Steel in Concrete. Highways and Public Works, Vol. 36, Nos. 19-20, 1968, p. 40.
7. R. J. Craig and L. E. Wood. Effectiveness of Corrosion Inhibitors and Their Influence on the Physical Properties of Portland Cement Mortars. Highway Research Record 328, 1970, p. 77.
8. V. H. Dodson, E . Farkas, and A M. Rosenberg. U.S. Patent No. 3,210,207, 1965.
9. A Report on a New Chemically Formulated Accelerator for Concrete, Technical Bulletin ADM-1. W.R. Grace & Co., Cambridge, Mass., Oct. 15, 1964.
10. R. T. Foley. Complex Ions and Corrosion. Journal of the Electrochemical Society, Vol. 11, No. 122, 1975, p. 1493.
11. W. H. Hartt and A. M. Rosenberg. Influence of Ca(N0,) 2 on Sea Water Corrosion of Reinforcing Steel in Concrete, ACI publication SP-65, 1980, p. 609.
12. J. M. Gaidis, T. G. Kossivas, R. W. Previte, and A. M. Rosenberg. A Corrosion Inhibitor Formulated with Calcium Nitrate
TRANSPORTATION RESEARCH RECORD 1211
for Use in Reinforced Concrete. ASTM Special Technical Publication No. 629, 1977, p. 89.
13. J. M. Gaidis and A. M. Rosenberg. Methods of Determining Corrosion Susceptibility of Steel in Concrete. TRB Record No. 692, 1978, p. 28.
14. J. M. Gaidis and A. M. Rosenberg. A Concrete Admixture to Control Corrosion in Concrete. CErRACOR, Paris, France, Paper 154, 1979, p. 29.
15. J. M. Gaidis, J. T. Lundquist, and A. M. Rosenberg. Calcium Nitrite as an Inhibitor of Rebar Corrosion in Chloride. Materials Performance, Vol. 18, No. 3, 1979, p. 36.
16. J. M. Gaidis and A. M. Ro~enberg. The Mechanism of Nitrite Inhibition of Chloride Attack on Reinforcing Steel in Alkaline Aqueous Environments. Materials Pe1formance, Vol. 18, No. 11, 1979, p. 45.
17. J. M. Gaidis, A. M. Rosenberg, and J. Salek. Improved Test Methods for Determining Corrosion Inhibition by Calcium Nitrite in Concrete. ASTM, STP 713, 1980, p. 64.
18. R. Pyke and M. Cohen. Rate of Breakdown and Mechanism of Nitrite Inhibition of Steel Corrosion. Journal of the Electrochemical Society, Vol. 93, 1948, p. 63.
19. J. M. Gaidis and A. M. Rosenberg. The Inhibition of ChlorideInduced Corrosion in Reinforced Concrete. ASTM, Cement, Concrete & Aggregates, Vol. 9, No. 1, Summer 1987, p. 30.
20. Corrosion of Metals in Concrete, ACI, 222 R-85. Special Report by Committee 222, August 1985.
21. B. Ost and G. E. Monfore. Penetration of Chloride into Concrete. Materials Performance, Vol. 12, No. 6, 1974, p. 21.
22. R. F. Stratfull, W. J. Jurkovich, and D. L. Spellman. Research Report CA-DOT-TL-5116-12-75-03. California Transportation Laboratory, Sacramento, 1975.
23. N. S. Berke. The Effects of Calcium Nitrite and Mix Design on the Corrosion Resistance of Steel in Concrete (Part 1). NACE Corrosion-85, Paper No. 273. National Association of Corrosion Engineers, Houston, Tex., 1985.
24. N. S. Berke. The Effects of Calcium Nitrite and Mix Design on the Corrosion Resistance of Steel in Concrete (Part 2, LongTerm Results). Proc., Corrosion-87 Symposium on Corrosion of Metals in Concrete, NACE, Houston, 1987, pp. 134-144.
25. Y. P. Virmani, K. C. Clear, and T. J. Pasko. Time-to-Corrosion of Reinforcing Steel in Concrete Slabs, Vol. 5-Calcium Nitrite Admixture and Epoxy-coated Reinforcing Bars as Corrosion Protection Systems. Report FHWA-RD-83-012. FHWA, U.S. Department of Transportation, Sept. 1983, p. 71.
26. D. W. Pfeifer and J. R. Landgren. Protective Systems for New Prestressed and Substructure Concrete. Report FHWA-RP-86-193. FHWA, U.S. Department of Transportation, April 1987, p. 113.
27. Laboratory Performance on Corrosion Control Methods. Interim Report. Research Program Division of Planning, South Dakota Department of Transportation, Pierre, S. Dak., March 1984.
28. N. S. Berke and T. G. Weil. Corrosion Protection Through the Use of Concrete Admixtures. Presented at Second International Conference on Performance of Concrete in Marine Environment, St. Andrews by the Sea, New Brunswick, Canada, Aug. 21-26, 1988.
29. N. S. Berke. Resistance of Microsilica Concrete to Steel Corrosion, Erosion and Chemical Attack. Presented at the Third International Conference on the Use of Fly Ash, Silica Fume, Slag and Natural Pozzolans in Concrete, Trondheim, Norway, June 19-24, 1989.
30. N. S. Berke, D. F. Shen, and K. M. Sundberg. Comparison of the Polari7ation Resistance Technique to Macrocell Corrosion Technique. Presented at the ASTM Symposium on Corrosion Rates of Steel in Concrete, Baltimore, Md., June 29, 1988.
31. N. S. Berke, D. F. Shen, and K. M. Sundberg. Comparison of Current Interruption and Electrochemical Impedance Techniques in the Determination of the Corrosion Rates of Steel in Concrete. Presented at the ASTM Symposium on Ohmic Electrolyte Resistance Measurement and Compensation, Baltimore, Md., May 17, 1988.
32. D. Briesemann. Corrosion Inhibitors for Steel in Concrete. Civil Engineering Department, Munich Technical University, Munich, Federal Republic of Germany.
Berke and Rosenberg
33. A. W. Bee by. Cracking, Cover, and Corrosion of Reinforcement . Concrete International, Vol. 5, No. 2, 1983, pp. 35-40.
34. P. S. Marga! and K. Gurusamy. Cement & Concrete Research, Vol. 17, 1987, pp. 385-396.
35. Guide to Durable Concrete, ACI 201. American Concrete Institute, Detroit.
36. N. S. Berke. The Use of Anodic Polarization to Determine the Effectiveness of Calcium Nitrite as an Anodic Inhibitor. In Corrosion Effect of Stray Currents and the Techniques for Evaluating Corrosion of Rebars in Concrete (V. Chaker, ed.), ASTM STP 906. American Society for Testing and Materials, Philadelphia, Pa. 1986, pp. 78-91.
27
37. M. Pourbaix. Atlas of Electrochemical Equilibria in Aqueous Solutions. National Association of Corrosion Engineers, Houston, Tex., 1974.
38. C. J . Pereira and L. L. Hegedus. Diffusion and Reaction of Chloride Ions in Porous Concrete. Presented at the 8th International Symposium on Chemical Reaction Engineering, Edinburgh, Scotland, Sept. 10-13, 1984.
Publication of this paper sponsored by Committee on Chemical Additions and Admixtures for Concrete.
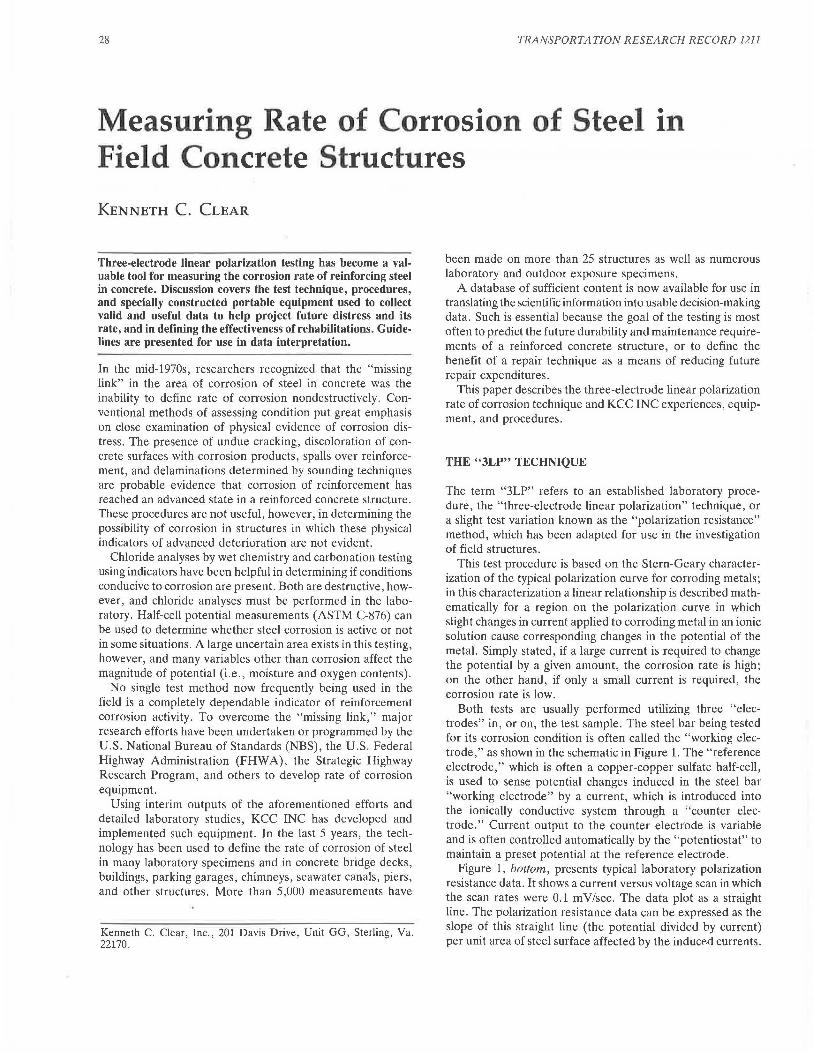
28 TRANSPORTATION RESEARCH RECORD 1211
Measuring Rate of Corrosion of Steel in Field Concrete Structures
KENNETH c. CLEAR
Three-electrode linear polarization testing has become a valuable tool for measuring the corrosion rate of reinforcing steel in concrete. Discussion covers the test technique, procedures, and specially constructed portable equipment used to collect valid and useful data to help project future distress and its rate, and in defining the effectiveness of rehabilitations. Guidelines are presented for use in data interpretation.
In the mid-1970s, researchers recognized that the "missing link" in the area of corrosion of steel in concrete was the inability to define rate of corrosion nondestructively. Conventional methods of assessing condition put great emphasis on close examination of physical evidence of corrosion distress. The presence of undue cracking, discoloration of concrete surfaces with corrosion products, spalls over reinforcement and delaminations determined by sounding techniques are ~robable evidence that corrosion of reinforcement has reached an advanced state in a reinforced concrete structure. These procedures are not useful, however, in determining the possibility of corrosion in structures in which these physical indicators of advanced deterioration are not evident.
Chloride analyses by wet chemistry and carbonation testing using indicators have been helpful in determining if conditions conducive to corrosion are present. Both are destructive, however, and chloride analyses must be performed in the laboratory.Half-cell potential measurements (ASTM C-876) can be used to determine whether steel corrosion is active or not in some situations. A large uncertain area exists in this testing, however, and many variables other than corrosion affect the magnitude of potential (i.e., moisture and oxygen contents).
No single test method now frequently being used in the field is a completely dependable indicator of reinforcement corrosion activity. To overcome the "missing link," major research efforts have been undertaken or programmed by the U.S. National Bureau of Standards (NBS), the U.S. Federal Highway Administration (FHWA), the Strategic Highway Research Program, and others to develop rate of corrosion equipment.
Using interim outputs of the aforementioned efforts and detailed laboratory studies, KCC INC has developed and implemented such equipment. In the last 5 years, the technology has been used to define the rate of corrosion of steel in many laboratory specimens and in concrete bridge decks, buildings, parking garages, chimneys, seawater canals, piers, and other structures. More than 5,000 measurements have
Kenneth C. Clear, Inc., 201 Davis Drive, Unit GG, Sterling, Va. 22170.
been made on more than 25 structures as well as numerous laboratory and outdoor exposure specimens.
A database of sufficient content is now available for use in translating the scientific information into usable decision-making data. Such is essential because the goal of the testing is most often to predict the future durability and maintenance requirements of a reinforced concrete structure, or to define the benefit of a repair technique as a means of reducing future repair expenditures.
This paper describes the three-electrode linear polarization rate of corrosion technique and KCC INC experiences, equipment, and procedures.
THE "3LP" TECHNIQUE
The term "3LP" refers to an established laboratory procedure, the "three-electrode linear polarization" technique, or a slight test variation known as the "polarization resistance" method, which has been adapted for use in the investigation of field structures.
This test procedure is based on the Stern-Geary characterization of the typical polarization curve for corroding metals; in this characterization a linear relationship is described mathematically for a region on the polarization curve in which slight changes in current applied to corroding metal in an ionic solution cause corresponding changes in the potential of the metal. Simply stated, if a large current is required to change the potential by a given amount, the corrosion rate is high; on the other hand, if only a small current is required, the corrosion rate is low.
Both tests are usually performed utilizing three "electrodes" in, or on, the test sample. The steel bar being tested for its corrosion condition is often called the "working electrode," as shown in the schematic in Figure 1. The "reference electrode," which is often a copper-copper sulfate half-cell, is used to sense potential changes induced in the steel bar "working electrode" by a current, which is introduced into the ionically conductive system through a "counter electrode." Current output to the counter electrode is variable and is often controlled automatically by the "potentiostat" to maintain a preset potential at the reference electrode.
Figure 1, bottom, presents typical laboratory polarization resistance data. It shows a current versus voltage scan in which the scan rates were 0.1 mV/sec. The data plot as a straight line. The polarization resistance data can be expressed as the slope of this straight line (the potential divided by current) per unit area of steel surface affected by the inducP-d currents.
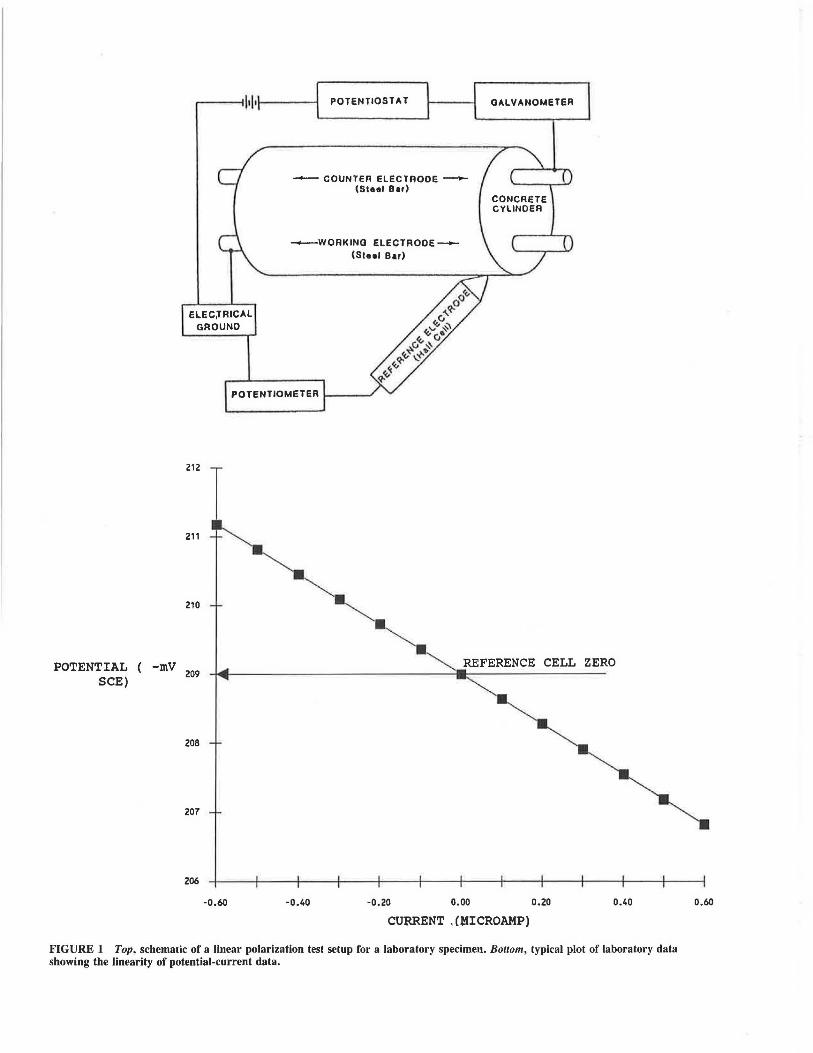
ELEC,TRICAL GROUND
POTENTIOSTA T
- COUNTER ELECTRODE -(Steel Bar)
---woRKINQ ELECTROoe(Stnl Bar)
GALVANOMETER
CONCRETE CYLINDER
POTENTIOMETER 1----'
212
211
210
POTENTIAL ( -mv 209
SCE)
208
207
206
-0.60 -0.40 -0.20 0.00 0.20
CURRENT . (~ICROAMP)
0.40
FIGURE 1 Top, schematic of a linear polarization test setup for a laboratory specimen. Bottom, typical plot of laboratory data showing the linearity of potential-current data.
0.60
30
In electrical terminology, a potential (in volts) divided by a current (in amperes) yield~ a 1esislam:e (iu uhms). This a1.:wunls for one name of the test technique (polarization resistance) and the units in which the data are expressed.
The polarization resistance data can be further defined using the Stern-Geary equation to calculate the corrosion current (in microamps) per square centimeter of bar surface area or milliamps per square foot of bar surface area. When the test is performed and corrosion current densities are calculated, the test procedure is usually termed a "linear polarization" test. Although obtaining corrosion current density appears to be a highly desirable end result of testing activity, the accuracy of the current density at the face of the tested bar is affected by the validity of the Stern-Geary constants used in the calculation and the assumptions made about the area of steel influenced by current from the counter electrode. Only the latter assumption is a variable for polarization resistance measurements.
3LP EXAMPLE
As already noted, the following equation (Stern-Geary) is used to define corrosion rate (ICORR in milliamps (mA) per square foot of steel surface):
ICORR = (13a x f3c) (/l I test) 2.3(f3a + f3c) (fl E test)
(sq ft of steel)
where
f3a = anodic Tafel slope f3c = cathodic Tafel slope
fl I test
t:. E te t
I= E=
slope of !IE plot (i.e., inverse of polarization re istance), change in current in mA, change in potential in m V.
ICORR is expressed in milliamps per unit of steel surface because corrosion is an eleclri1.:al phenomenon and Lhe factor being defined is the corrosion current at one point in time; mA per square foot of steel surface was used. If a constant rate over time is assumed, ICORR for steel can be converted to MDD (milligrams per square decimeter per year) by multiplying it by 2.691, or to MPY (mils per year) by multiplying ICORR by 0.492. It is known that 1 amp of corrosion current flowing for 1 hour will consume 1.04 g of iron. Thus, calculations of corrosion rate in terms of metal loss per year are possible if monitoring with time is performed or an assumption is made that the corrosion rate has been or will be constant in the past or future.
In laboratory or outdoor exposure studies, it is relatively easy to define the steel surface under test because often only a single piece of steel is present and a surface-applied, "portable" counter electrode can be sized and positioned so that the entire steel surface (or only a specific portion of it) receives current. For example, the following I CORR values were defined at 1 year of age on two test slabs: one known to be saltcontaminated and to contain corroding steel, and the other known to be essentially salt-free with noncorroding rebar:
Slab A-corroding: ICORR = 2.093 mA/sq ft
Slab B-no corrosion: ICORR = 0.024 mA/sq ft
TRANSPORTATION RESEARCH RECORD 1211
If these corrosion currents remained constant for 1 year, they would translate to iron consumption of 19 .1 g/sq ft per year for slab A and 0.22 g/sq ft per year for slab B; and to metal loss on the no. 4 rebar of 1.03 mils per year (MPY) on slab A and 0.01 MPY on slab B.
The 3LP technique was validated as a means of estimating rate of corrosion of steel in concrete in laboratory work performed by Escalante at NBS under contract with the FHWA (1,2). A study was performed in which steel rods of known weight were embedded in concretes with and without chloride and then subjected to various exposures (continuous or alternate immersion in chloride-containing or chloride-free solutions) for 115 to 148 days. 3LP measurements were made 5 days per week, and predicted weight losses were calculated. The specimens were then examined, and actual weight loss was determined. The overall correlation coefficient (for x = gravimetric weight loss) was 0. 75, and the 3LP test slightly underestimated the corrosion weight loss (predicted = 0.93 * actual). Considering the many variables and assumptions involved, such correlation is excellent. In these tests, the steel in salt-free concrete yielded average ICORR values of 0.01 and 0.04 mA/sq ft, while the steel in salty concrete yielded average ICORR values of 0.10 to 2.12 mA/sq ft of steel.
Corrosion Rate Testing in the Field and Equipment
The NBS 3LP field work was conducted with a portable, computer-based apparatus that was specifically designed and built for FHWA use on bridge decks. The slope of the polarization resistance curve was established from two points: the point at 0 current and potential, and the point found to be the average current applied over a 3.5-min "holding period" while a constant polarization of -10 mV from static was maintained. During the 3.5-min holding period, current was applied to the counter electrode in cycles of 2.2 sec "on" and 0.4 sec "off." The reference potentials (at or near -10 m V) were measured during the 0.4-sec current shutoff period to avoid the considerable interference with the potential measurement caused by currents emanating from the counter electrode (i.e., IR drop error). Potential measurements were taken about 75 msec after current shutoff, and calculations were made assuming Tafel slopes of 150 mV per decade (formula constant = 32.6).
Three bridge decks between 17 and 54 years of age and subject to de-icing salt were studied by the NBS researchers. ICORR average values of0.19, 0.41, and 0.71 mA/sq ft were found on these decks, which were said to be in good condition except for some cracking. Unfortunately, no correlation was provided between rate of corrosion results and the findings of other techniques (i.e., delamination, chlorides, etc.).
The greatest advantage of the NBS prototype device is that it is configured for "turnkey" operation; the apparatus controls the test period, takes the current and potential data, and delivers final calculated values. It minimizes operator-caused variables in the test. Unfortunately, parts of the prototype machine are outdated, and the particular computer NBS used is not available. Thus, it was impossible simply to reproduce the NBS device. Further, several other aspects of the device were cumbersome, and the bases for some assumptions were
Clear
unclear. Examples include the need to "buck" the galvanic potential between the counter electrode and the rebar to 0 prior to test, and the assumption that the steel being affected was twice that beneath the counter electrode. Also , there is some question about the proper Stern-Geary formula constants. Additional large studies will be required to address all the unknowns. In the interim, however, data are needed on the effect of repairs and the estimation of time until major maintenance. It is toward these goals that KCC INC has been working.
Equipment was fabricated to perform the test in a manner similar to that of NBS. It was modified as necessary to meet the needs ofthe various structures, test situations, and improving knowledge. Initially, AC-powered equipment that produced a half-wave DC pulse was utilized, and a battery-operated oscilloscope was used in a nulling mode to measure the halfcell potential during the off periods. This was replaced by battery-operated equipment with pulsing DC output because of the portability and electrical noise requirements and the desire for variable on and off periods. The oscilloscope was eliminated through use of a gating voltmeter that measures only during a select portion of each off period. Galvanic current flow between the counter electrode and the structure reinforcement was initially a problem. Therefore, a special circuit was developed that automatically blocks this current while passing the test pulse. The device was constructed so that two pulses of variable characteristics were available. The "fast" mode uses a 60-hertz square wave with a 50 percent duty cycle, while the "slow" mode simulates the NBS waveform described earlier. A timer (digital clock) was included to allow control of the test period to facilitate E log I testing and use of the NBS holding period if desired. Various counter electrodes (CE) composed of steel, platinum, copper, and carbon have been used. In most instances when a portable CE is used, a sponge-encased copper mesh about 3 in. wide and 7 in. long is used. In such instances, it is assumed that the steel under test is only that beneath the CE. The most commonly used portable reference cell is copper-copper sulfate, placed in a "hole" in the center of the copper mesh CE. When embedded probes are used, the CE is usually steel and the reference cell is graphite, and both are embedded in a concrete or mortar cylinder. Figure 2 presents photographs of the various components of the 3LP device.
It was obvious from the NBS work and initial KCC INC efforts that the 3LP technique was a viable means of differentiating between structures with passive and rapidly corroding re bar. It was also obvious, however, that the exact test and equipment parameters were not yet completely known. It was therefore concluded that a manually operated device with versatility (i.e., one that could use various polarization schemes and times, power application rates, or holding periods and also run E log /tests to establish Tafel slopes) was needed. Present equipment is thus manual; the current is applied by turning a knob at a user-defined rate.
KCC INC no longer defines Tafel constants in the field in all instances. Rather, the extensive database and defined average values (formula constant = 41) that are used in !CORR calculations, except in new or unusual circumstances, have been summarized. As a result, a preprogrammed portable calculator (with printer, if desired) is often used in the field to allow immediate on-site calculations of polarization resis-
31
tance, !CORR, MDD (milligrams per square decimeter per year), and MPY (mils per year).
During the last 2 years, tests have been run using various modes of operation . As a result of these experiences, the following procedure is now preferred:
1. Set up equipment by wetting sponge, positioning the counter electrode over the rebar to be tested, connecting the rebar ground lead, and confirming that the half-cell potential is stable and nulling it to 0. Define the rebar affected using the structure's plans and bar locator.
2. Reset the timer, and turn on the current, choosing "fast" (60 Hz) pulsing (the timer starts automatically).
3. Slowly increase the current 10 the counter electrode until the half-cell potential meter reads 4.0 m V ( - 4 m V of polarization). Total time should be 0.5 to 0.8 min.
4. Read and record the current on the digital meter to the nearest 0.0001 mA.
5. Continue, repeating item ·3 until a half-cell offset of 8 mV is achieved. Total time should be 1.0 to 1.6 min.
6. Read and record the current. 7. Continue repeating item 3 until a half-cell offset of 12
mV is achieved. Total time should be 1.5 to 2.4 min. 8. Read and record the current. 9. Reduce current to zero, reset the timer, and confirm
that the potential returns to between - 2 and + 2 m V (usually within 2 min). While this is occurring, input the data into the preprogrammed calculator and calculate results.
Test time per location is typically 10 mi·n, divided as follows: item 1 (setup), 6 min; items 2 through 6 (testing), 2 min; and item 7 (confirmation and calculation), 2 min.
At times, other catbodic polarization sequences (examples: 2, 4, 6, 8, and 10 mV or 5, 10, and 15 mV) are used and generally have yield d similar results. Also, testing to date indicates that similar results are obtained at the 60-hertz and the slower NBS pulse rates. Note, however, that no "hold time," as defined by NBS, is used and the total "powered" test time is typically only 2 min. KCC INC experiences with "hold times" have indicated that current continually decreases and steady state is not achieved.
Typical Field Results
Typical result obtained by KC l on field structure during the past 4 years are discu sed next. Figure pre enl · data obtained in 1983 and 1984 on the interior portions of a multistory concrete building containing lightweight concrete with up to 2 percent calcium chloride dihydrate by weight of cement. Active corrosion in tiled areas had resulted in delamination and spalling, whereas no damage had occurred in carpeted areas. All half-cell potentials were more positive than - 200 mV CSE; thus, the ASTM C876 technique provided no help in assessing the corrosion state. The "trial area" shown in the figure represents monitoring with time after tile was removed to determine whether or not corrosion rates would decrease quickly as a result of drying. These data should not be translated directly to ICORR because the equipment at that time was not as accurate as that used today (actual corrosion rate was underestimated). The data can be compared among them-
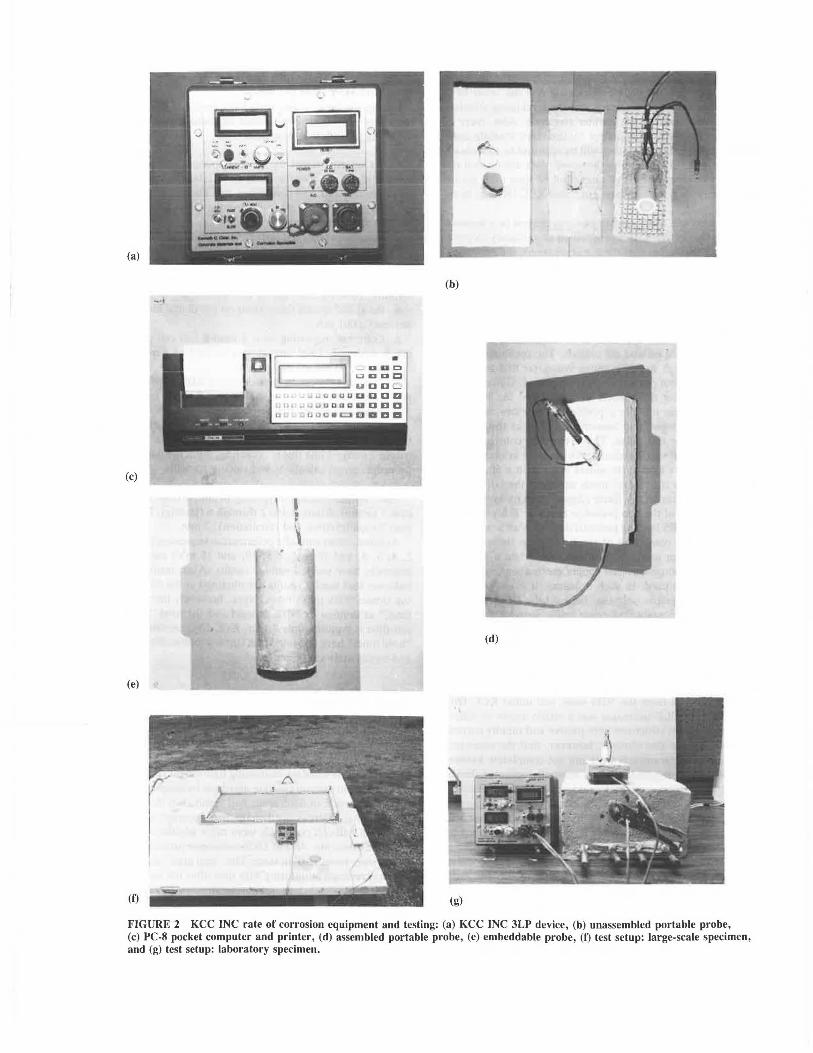
-
(a)
(b)
-t
(c)
(d)
(e)
(f) lg)
FIGURE 2 KCC INC rate of corrosion equipment and testing: (a) KCC INC 3LP device, (b) unassembled portable probe, (c) PC-8 pocket computer and printer, (d) assembled portable probe, (e) embeddable probe, (f) test setup: large-scale specimen, and (g) test setup: laboratory specimen.
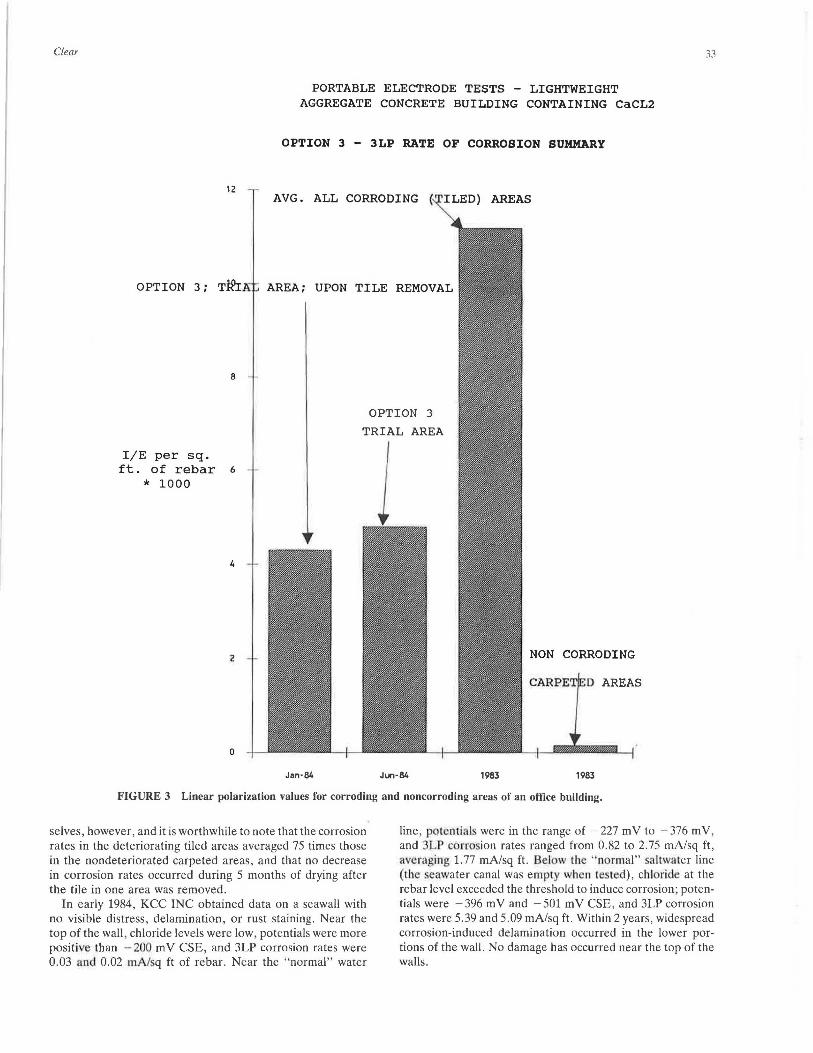
Clear 33
PORTABLE ELECTRODE TESTS - LIGHTWEIGHT AGGREGATE CONCRETE BUILDING CONTAINING CaCL2
OPTION 3 - 3LP RATE OF CORROSION SUMMARY
12 AVG . ALL CORRODING f ILED) AREAS
OPTION 3; T~A AREA; UPON TILE REMOVAL
8
OPTION 3
TRIAL AREA
I/E per sq. ft. of rebar 6
* 1000
4
2
0
Jan·84 Jun-84
NON CORRODING
D AREAS
1983 1983
FIGURE 3 Linear polarization values for corroding and noncorroding areas of an office building.
selves, however, and it is worthwhile to note that the corrosion rates in the deteriorating tiled areas averaged 75 times those in the nondeteriorated carpeted areas, and that no decrease in corrosion rates occurred during 5 months of drying after the tile in one area was removed.
In early 1984, KCC INC obtained data on a seawall with no visible distress, delamination, or rust staining. Near the top of the wall , chloride levels were low, potentials were more positive than - 200 m V CSE, and 3LP corrosion rates were 0.03 and 0.02 mA/sq ft of rebar. Near the "normal" water
line , p tential · were in the range of -227 mV to -376 mV, and 3LP c rro ion rates ranged from 0.82 to 2.75 mA/sq ft, averaging 1.77 mA/sq ft. Below the " normal" saltwater line (the seawater canal was empty when tested) , chloride at the rebar level exceeded the threshold to induce corrosion; potentials were - 396 m V and - 501 m V CSE , and 3LP corrosion rates were 5.39 and 5.09 mA/sq ft. Within 2 years, widespread corrosion-induced delamination occurred in the lower portions of the wall. No damage has occurred near the top of the walls.
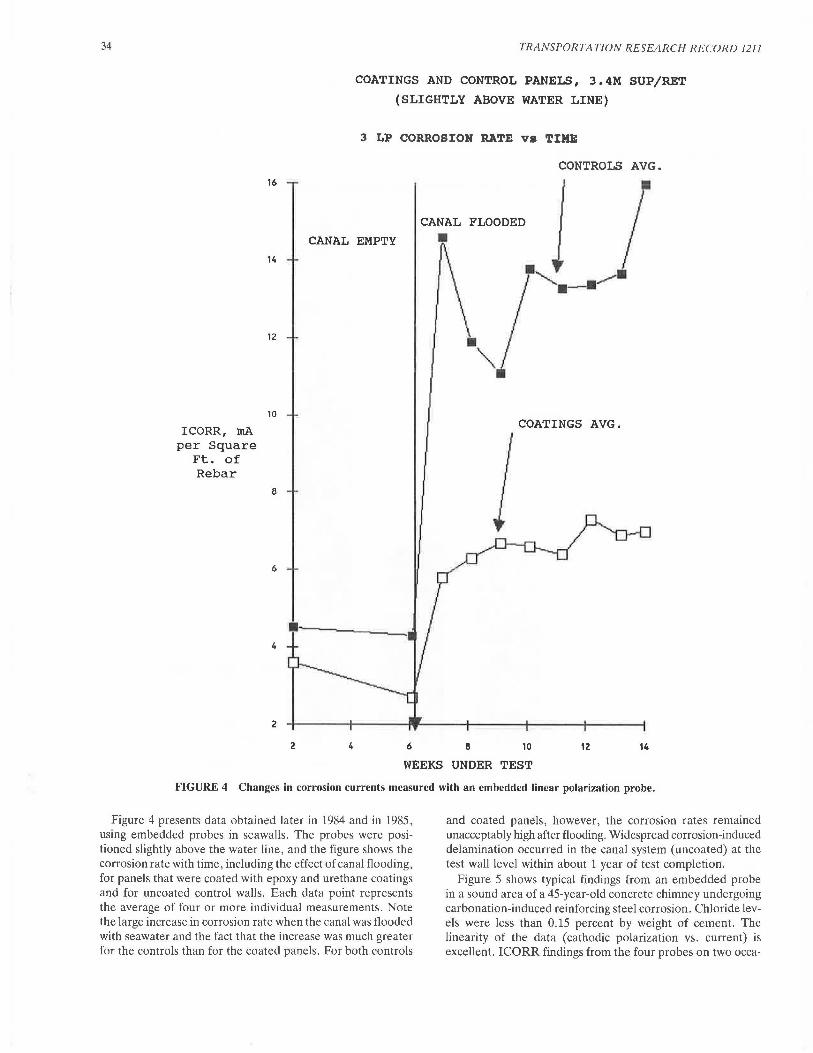
34 TRANSPORTATION RESEARCH RECORD 1211
COATINGS AND CONTROL PANELS, 3.4M SUP/RET
(SLIGHTLY ABOVE WATER LINE)
3 LP CORROSION RATE vs TIME
ICORR, mA per Square
Ft. of Rebar
16
14
12
10
8
6
4
2
CANAL EMPTY
2 4
CANAL FLOODED
•
• "" •
CONTROLS AVG.
""' ...,....... -~·
COATINGS AVG.
6 8 10 12 14
WEEKS UNDER TEST
FIGURE 4 Changes in corrosion currents measured with an embedded linear polarization probe.
Figure 4 presents data obtained later in 1984 and in 1985, using embedded probes in seawalls. The probes were positioned slightly above the water line, and the figure shows the corrosion rate with time, including the effect of canal flooding, for panels that were coated with epoxy and urethane coatings and for uncoated control walls. Each data point represents the average of four or more individual measurements. Note the large increase in corrosion rate when the canal was flooded with seawater and the fact that the increase was much greater for the controls than for the coated panels. For both controls
and coated panels, however, the corrosion rates remained unacceptably high after flooding. Widespread corrosion-induced delamination occurred in the canal system (uncoated) at the test wall level within about 1 year of test completion.
Figure 5 shows typical findings from an embedded probe in a sound area of a 45-year-old concrete chimney undergoing carbonation-induced reinforcing steel corrosion. Chloride levels were less than 0.15 percent by weight of cement. The linearity of the data (cathodic polarization vs. current) is excellent. ICORR findings from the four probes on two occa-
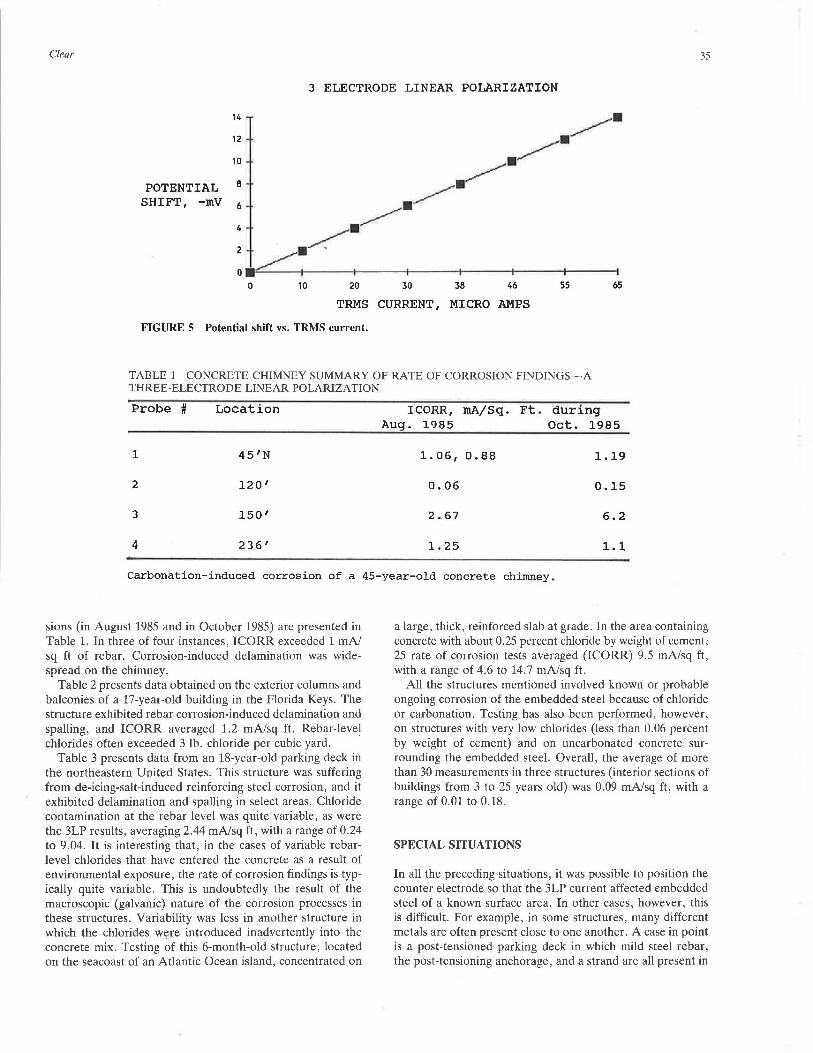
Clear 35
3 ELECTRODE LINEAR POLARIZATION
POTENTIAL SHIFT, -mv
0 10 20 30 36 46 55 65
TRMS CURRENT, MICRO AMPS
FIGURE 5 Potential shift vs. TRMS current.
TABLE 1 CONCRETE CHIMNEY SUMMARY OF RATE OF CORROSION FINDINGS-A THREE-ELECTRODE LINEAR POLARIZATION
Probe # Location I CORR, mA/Sq. Ft. during Aug. 1985 Oct. 1985
1 45'N 1. 06, 0.88 1.19
2 120' 0.06 0.15
3 150' 2.67 6.2
4 236' 1. 25 1.1
Carbonation-induced corrosion of a 45-year-old concrete chimney.
sions (in August 1985 and in October 1985) are presented in Table 1. In three of four instances, ICORR exceeded 1 mA/ sq ft of rebar. Corrosion-induced delamination was widespread on the chimney.
Table 2 presents data obtained on the exterior columns and balconies of a 17-year-old building in the Florida Keys. The structure exhibited rebar corrosion-induced delamination and spalling, and ICORR averaged 1.2 mA/sq ft. Rebar-level chlorides often exceeded 3 lb. chloride per cubic yard.
Table 3 presents data from an 18-year-old parking deck in the northeastern United States. This structure was suffering from de-icing-salt-induced reinforcing steel corrosion, and it exhibited delamination and spalling in select areas. Chloride contamination at the rebar level was quite variable, as were the 3LP results, averaging 2.44 mA/sq ft, with a range of 0.24 to 9.04. It is interesting that, in the cases of variable rebarlevel chlorides that have entered the concrete as a result of environmental exposure, the rate of corrosion findings is typically quite variable. This is undoubtedly the result of the macroscopic (galvanic) nature of the corrosion processes in these structures. Variability was less in another structure in which the chlorides were introduced inadvertently into the concrete mix. Testing of this 6-month-old structure, located on the seacoast of an Atlantic Ocean island, concentrated on
a large, thick, reinforced slab at grade. In the area containing concrete with about 0.25 percent chloride by weight of cement, 25 rate of corrosion tests averaged (ICORR) 9.5 mA/sq ft, with a range of 4.6 to 14.7 mA/sq ft.
All the structures mentioned involved known or probable ongoing corrosion of the embedded steel because of chloride or carbonation. Testing has also been performed, however, on structures with very low chlorides (less than 0.06 percent by weight of cement) and on uncarbonated concrete surrounding the embedded steel. Overall, the average of more than 30 measurements in three structures (interior sections of buildings from 3 to 25 years old) was 0.09 mA/sq ft, with a range of 0.01 to 0.18.
SPECIAL SITUATIONS
In all the preceding situations, it was possible to position the counter electrode so that the 3LP current affected embedded steel of a known surface area. In other cases, however, this is difficult. For example, in some structures, many different metals are often present close to one another. A case in point is a post-tensioned parking deck in which mild steel rebar, the post-tensioning anchorage, and a strand are all present in
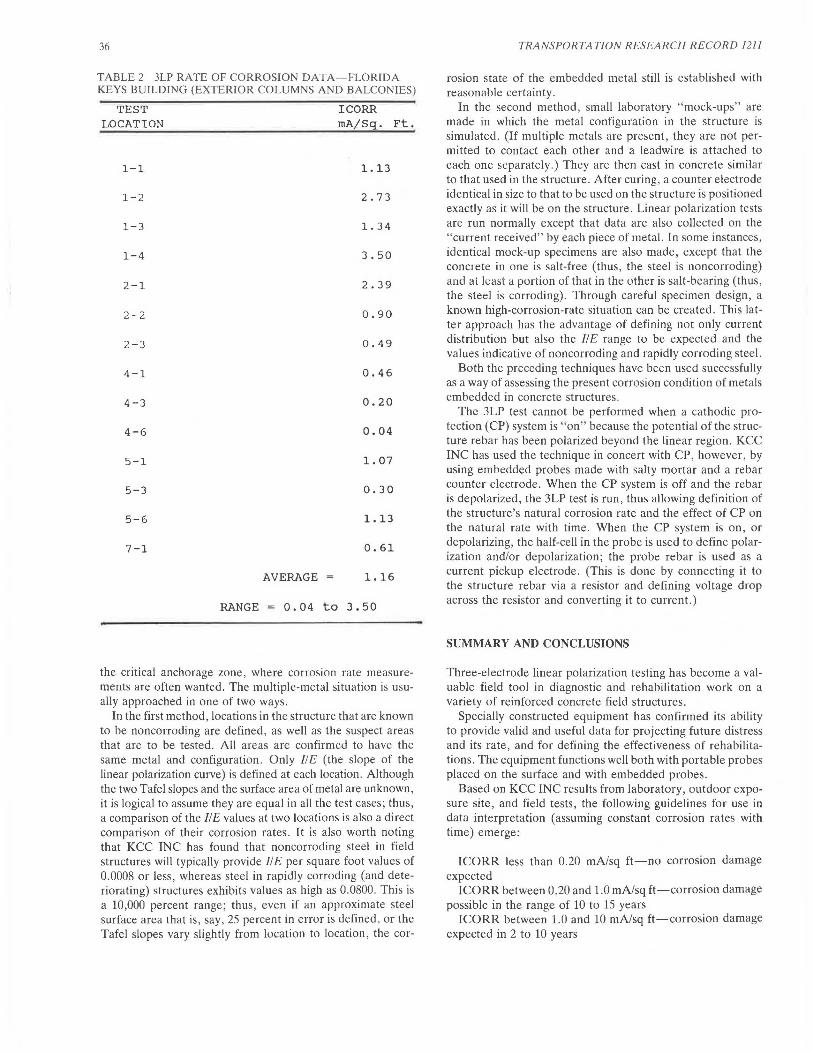
36
TABLE 2 3LP RATE OF CORROSION DATA-FLORIDA KEYS BUILDING (EXTERIOR COLUMNS AND BALCONIES)
TEST LOCATION
1-1
1-2
1-3
1-4
2-1
2-2
2-3
4-1
4-3
4-6
5-1
5-3
5-6
7-1
AVERAGE =
I CORR rnA/Sq. Ft.
1.13
2.73
1. 34
3.50
2.39
0.90
0.49
0. 46
0.20
0.04
1. 07
o. 30
1.13
0.61
1.16
RANGE= 0.04 to 3 . 50
the critical anchorage zone, where corrosion rate measurements are often wanted. The multiple-metal situation is usually approached in one of two ways.
In the first method , locations in the structure that are known to be noncorroding are defined , as well as the suspect areas that are to be tested. All areas are confirmed to have the same metal and configuration. Only !IE (the slope of the linear polarization curve) is defined at each location. Although the two Tafel slopes and the surface area of metal are unknown, it is logical to assume they are equal in all the test cases; thus, a comparison of the // E values at two locations is also a direct comparison of their corrosion rates. It is also worth noting that KCC INC has found that noncorroding steel in field structures will typically provide II E per square foot values of 0.0008 or less , whereas steel in rapidly corroding (and deteriorating) structures exhibits values as high as 0.0800. This is a 10,000 percent range; thus, even if an approximate steel surface area that is, say, 25 percent in error is defined, or the Tafel slopes vary slightly from location to location, the cor-
TRANSPORTATION RESEARCH RECORD 121 1
rosion state of the embedded metal still is established with reasonable certainty .
In the second method, small laboratory " mock-ups" are made in which the metal configuration in the structure is simulated. (If multiple metals are present, they are not permitted to contact each other and a leadwire is attached to each one separately.) They are then cast in concrete similar to that used in the structure. After curing, a counter electrode identical in size to that to be used on the structure is positioned exactly as it will be on the structure. Linear polarization tests are run normally except that data are also collected on the "current received" by each piece of metal. In some instances , identical mock-up specimens are also made, except that the concrete in one is salt-free (thus, the steel is noncorroding) and at least a portion of that in the other is salt-bearing (thus, the steel is corroding) . Through careful specimen design, a known high-corrosion-rate situation can be created. This latter approach has the advantage of defining not only current distribution but also the II E range to be expected and the values indicative of noncorroding and rapidly corroding steel.
Both the preceding techniques have been used successfully as a way of assessing the present corrosion condition of metals embedded in concrete structures.
The 3LP test cannot be performed when a cathodic protection (CP) system is "on" because the potential of the structure rebar has been polarized beyond the linear region. KCC INC has used the technique in concert with CP, however, by using embedded probes made with salty mortar and a rebar counter electrode. When the CP system is off and the rebar is depolarized, the 3LP test is run, thus allowing definition of the structure's natural corrosion rate and the effect of CP on the natural rate with time. When the CP system is on, or depolarizing, the half-cell in the probe is used to define polarization and/or depolarization; the probe rebar is used as a current pickup electrode. (This is done by connecting it to the structure rebar via a resistor and defining voltage drop across the resistor and converting it to current.)
SUMMARY AND CONCLUSIONS
Three-electrode linear polarization testing has become a valuable field tool in diagnostic and rehabilitation work on a variety of reinforced concrete field structures.
Specially constructed equipment has confirmed its ability to provide valid and useful data for projecting future distress and its rate, and for defining the effectiveness of rehabilitations. The equipment functions well both with portable probes placed on the surface and with embedded probes.
Based on KCC INC results from laboratory, outdoor exposure site, and field tests, the following guidelines for use in data interpretation (assuming constant corrosion rates with time) emerge:
ICORR less than 0.20 mA/sq ft-no corrosion damage expected
ICORR between 0.20 and 1.0 mA/sq ft-corrosion damage possible in the range of 10 to 15 years
ICORR between 1.0 and 10 mA/sq ft-corrosion damage expected in 2 to 10 years
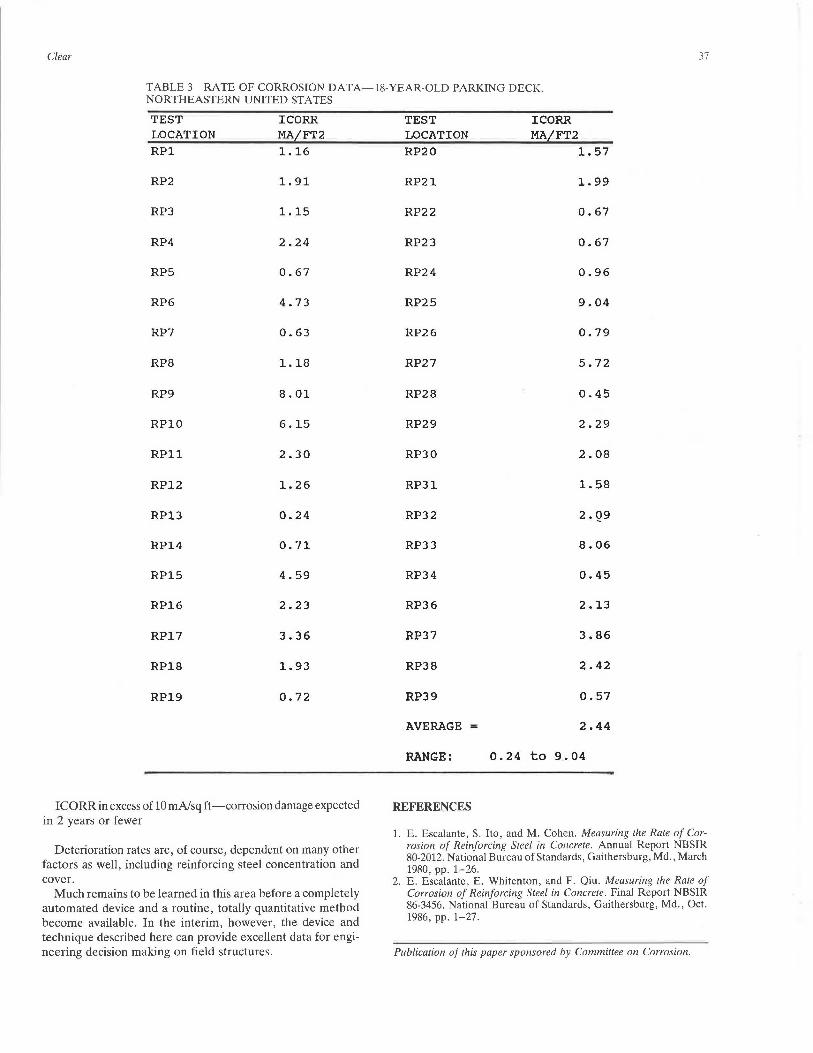
Clear 37
TABLE 3 RATE OF CORROSION DATA-18-YEAR-OLD PARKING DECK NORTHEASTERN UNITED STATES ,
TEST I CORR LOCATION MAi::'. FT2 RPl 1.16
RP2 1. 91
RP3 1.15
RP4 2.24
RPS 0.67
RP6 4.73
RP? 0.63
RPS 1.18
RP9 8.01
RPlO 6.15
RPll 2.30
RP12 1.26
RP13 0.24
RP14 0.71
RP15 4.59
RP16 2.23
RP17 3.36
RP18 1.93
RP19 o. 72
I CORR in excess of 10 mA/sq ft-corrosion damage expected in 2 years or fewer
Deterioration rates are, of course, dependent on many other factors as well, including reinforcing steel concentration and cover.
Much remains to be learned in this area before a completely automated device and a routine, totally quantitative method become available. In the interim, however, the device and technique described here can provide excellent data for engineering decision making on field structures.
TEST I CORR LOCATION MAi::'. FT2 RP20 1.57
RP21 1.99
RP22 0.67
RP23 0.67
RP24 0.96
RP25 9.04
RP26 0.79
RP27 5. 72
RP28 0.45
RP29 2.29
RP30 2.08
RP31 1.58
RP32 2.Q9
RP33 8.06
RP34 0.45
RP36 2.13
RP37 3.86
RP38 2.42
RP39 0.57
AVERAGE 2.44
RANGE: 0.24 to 9.04
REFERENCES
1. E. Escalante, S. Ito, and M. Cohen. Measuring the Rate of Corrosion of Reinforcing Steel in Concrete. Annual Report NBSIR 80-2012. National Bureau of Standards, Gaithersburg, Md., March 1980, pp. 1-26.
2. E. Escalante, E. Whitenton, and F. Qiu. Measuring the Rate of Corrosion of Reinforcing Steel in Concrete. Final Report NBSIR 86-3456. National Bureau of Standards, Gaithersburg, Md., Oct. 1986, pp. 1-27.
Publication of this paper sponsored by Commillee on Corrosion.
38 TRANSPORTATION RESEARCH RECORD 1211
Collapse of a Segmental Post-Tensioned Concrete Bridge
R. J. WOODWARD
This paper describes an investigation into the collapse of a single-span, segmental post-tensioned concrete bridge. The structure consisted of precast units stressed together both longitudinally and transversely. It was built in 1953 and collapsed at approximately 7:00 A.M. on December 4, 1985. There had been no evidence of distress before failure, and there was no traffic on the bridge when it collapsed. The investigation showed that the bridge had deteriorated because of corrosion of the tendons where they passed through the segmental joints. Corrosion had occurred because the tendons had been inadequately protected at the joints, and this had enabled chlorides to enter the ducts. It is believed that de-icing sails we1·e the major source of chlorides, although it is possible that dune sand had been included in the mortar used to fill the transverse joints. The results cause concern about the condition of other post-tensioned concrete bridges in which tendons pass through joints.
Segmental post-tensioned concrete bridges are made of a number of units stressed together. The individual units may be either precast or cast in situ, and they are stressed together in such a way that the whole section remains in compression under both dead and live loading.
Since the 1940s there has been rapid growth in the construction of segmental post-tensioned concrete bridges. Some of the first bridges of this type built in the United Kingdom were made of small precast units. A number of footbridges and at least one highway bridge are known to have been constructed in this manner (1). Following the first application of segmental construction, various methods have been developed to enable longer spans to be built using both precast and cast-in-place segments (2). A large number of such bridges now exist on trunk roads and motorways in the United Kingdom and many more worldwide.
Segmental construction is popular for numerous reasons. It can be used for long-span structures, over long stretches of water or difficult terrain, and in congested urban areas where traffic disruption can be kept to a minimum. Structures can be produced to take up any required horizontal or vertical curvature, and the accuracy of the section and profile can be closely controlled during construction. It is possible to use the formwork repeatedly and thereby achieve a greater economy. Precast units can be produced under factory conditions, inspected, and if necessary rejected without seriously interfering with the progress of the work. They also have disad-
Transport and Road Research Laboratory, Crowthorne, Berkshire, England.
vantages, however. The materials have to be handled twice. There are additional costs in aligning and jointing the units. Special plants are often required for erection and handling, and construction stresses make the design calculations more complex. But these problems have not deterred bridge engineers from using this type of construction.
During the last decade there has been increasing concern about the ingress of chlorides into concrete bridge decks as a result of the application of de-icing salt, and the consequent risk of corrosion to the reinforcement. The joints between segments in segmental structures may be more vulnerable to the penetration of chlorides than dense, high-quality concrete; hence, these structures could be most at risk. It was assumed, however, that this presented a serviceability problem rather than one likely to cause sudden structural failure (3). This assumption was proved incorrect when a segmental, posttensioned concrete bridge built in 1953 collapsed without warning early one morning in December 1985 (4).
This paper describes the bridge and its inspection history, gives an account of the investigations performed to determine the cause of failure, and discusses the implications for other slruclures of this type.
BRIDGE DETAILS
Location
The bridge was located in South Wales and carried an unclassified road over the River Afan approximately 6 km upstream from Port Talbot. It was situated at the bottom of a 1 in 6 hill, although until 1975 it had been separated from the hill by a humpback bridge over an unused railway line. Despite its low classification, the road is heavily trafficked and is on one of the local highway authority's primary winter gritting routes.
History
Most records on the bridge have been lost as a consequence of the local government reorganization in 1974. It was ascertained, however, that it was built in 1953 when it replaced a steel lattice girder bridge that was dropped into the river and used as falsework. Other surviving material included preliminary design calculations and a drawing showing the general arrangement of the structure.
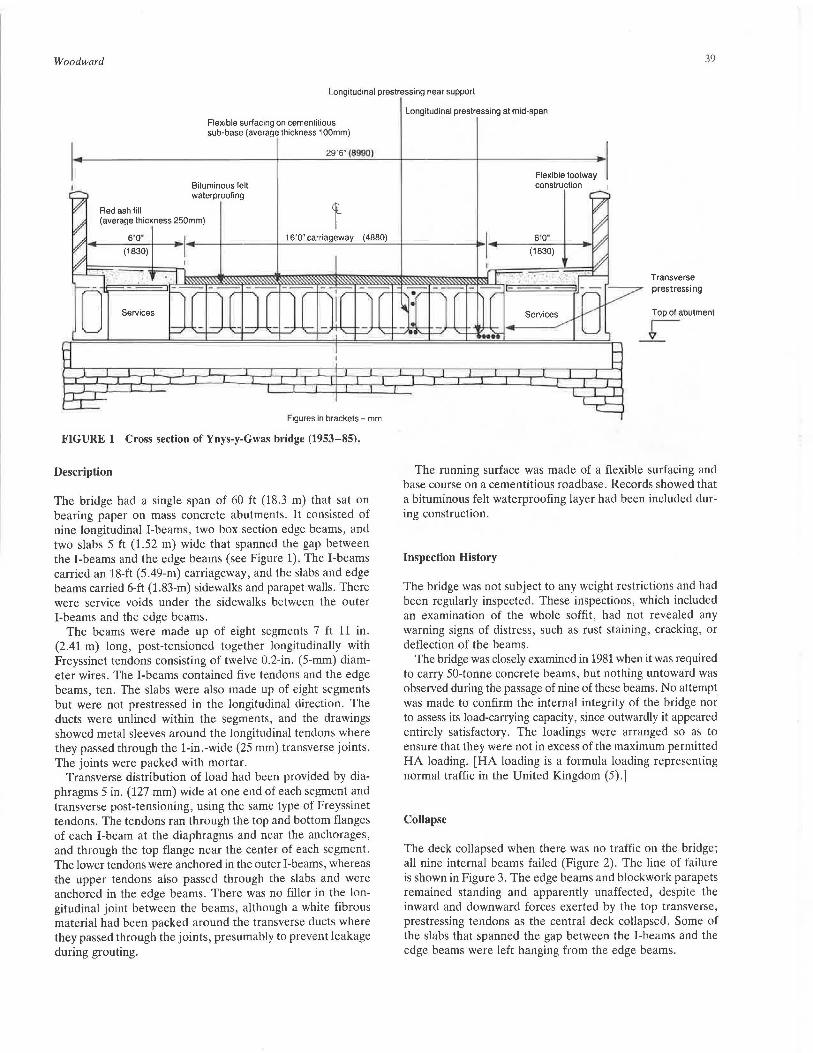
Woodward 39
Longitudinal prestressing near support
Red ash fill
Flexible surfacing on cemenlilious sub-base (average thickness 1 OOmm)
Bituminous felt waterproofing
29'6" (8990)
(average thickness 250mm)
16'0" carriageway (4880)
Services
Figures in brackets - mm
FIGURE 1 Cross section of Ynys-y-Gwas bridge (1953-85).
Description
The bridge had a single span of 60 ft (18.3 m) that sat on bearing paper on mass concrete abutments. It consisted of nine longitudinal I-beams, two box section edge beams, and two slabs 5 ft (1.52 m) wide that spanned the gap between the I-beams and the edge beams (see Figure 1). The I-beams carried an 18-ft (5.49-m) carriageway, and the slabs and edge beams carried 6-ft (1.83-m) sidewalks and parapet walls. There were service voids under the sidewalks between the outer I-beams and the edge beams.
The beams were made up of eight segments 7 ft 11 in. (2.41 m) long, post-tensioned together longitudinally with Freyssinet tendons consisting of twelve 0.2-in. (5-mm) diameter wires. The I-beams contained five tendons and the edge beams, ten. The slabs were also made up of eight segments but were not prestressed in the longitudinal direction. The ducts were unlined within the segments, and the drawings showed metal sleeves around the longitudinal tendons where they passed through the 1-in.-wide (25 mm) transverse joints. The joints were packed with mortar.
Transverse distribution of load had been provided by diaphragms 5 in. (127 mm) wide at one end of each segment and transverse post-tensioning, using the same type of Freyssinet tendons. The tendons ran through the top and bottom flanges of each I-beam at the diaphragms and near the anchorages, and through the top flange near the center of each segment. The lower tendons were anchored in the outer I-beams, whereas the upper tendons also passed through the slabs and were anchored in the edge beams. There was no filler in the longitudinal joint between the beams, although a white fibrous material had been packed around the transverse ducts where they passed through the joints, presumably to prevent leakage during grouting.
Longitudinal prestressing at mid-span
Flexible footway construction
6'0"
(1830)
Transverse prestressi ng
Top of abutment
r_2._
The running surface was made of a flexible surfacing and base course on a cementitious roadbase. Records showed that a bituminous felt waterproofing layer had been included during construction.
Inspection History
The bridge was not subject to any weight restrictions and had been regularly inspected. These inspections, which included an examination of the whole soffit, had not revealed any warning signs of distress, such as rust staining, cracking, or deflection of the beams.
The bridge was closely examined in 1981 when it was required to carry 50-tonne concrete beams, but nothing untoward was observed during the passage of nine of these beams. No attempt was made to confirm the internal integrity of the bridge nor to assess its load-carrying capacity, since outwardly it appeared entirely satisfactory. The loadings were arranged so as to ensure that they were not in excess of the maximum permitted HA loading. [HA loading is a formula loading representing normal traffic in the United Kingdom (5).]
Collapse
The deck collapsed when there was no traffic on the bridge; all nine internal beams failed (Figure 2). The line of failure is shown in Figure 3. The edge beams and blockwork parapets remained standing and apparently unaffected, despite the inward and downward forces exerted by the top transverse, prestressing tendons as the central deck collapsed. Some of the slabs that spanned the gap between the I-beams and the edge beams were left hanging from the edge beams.
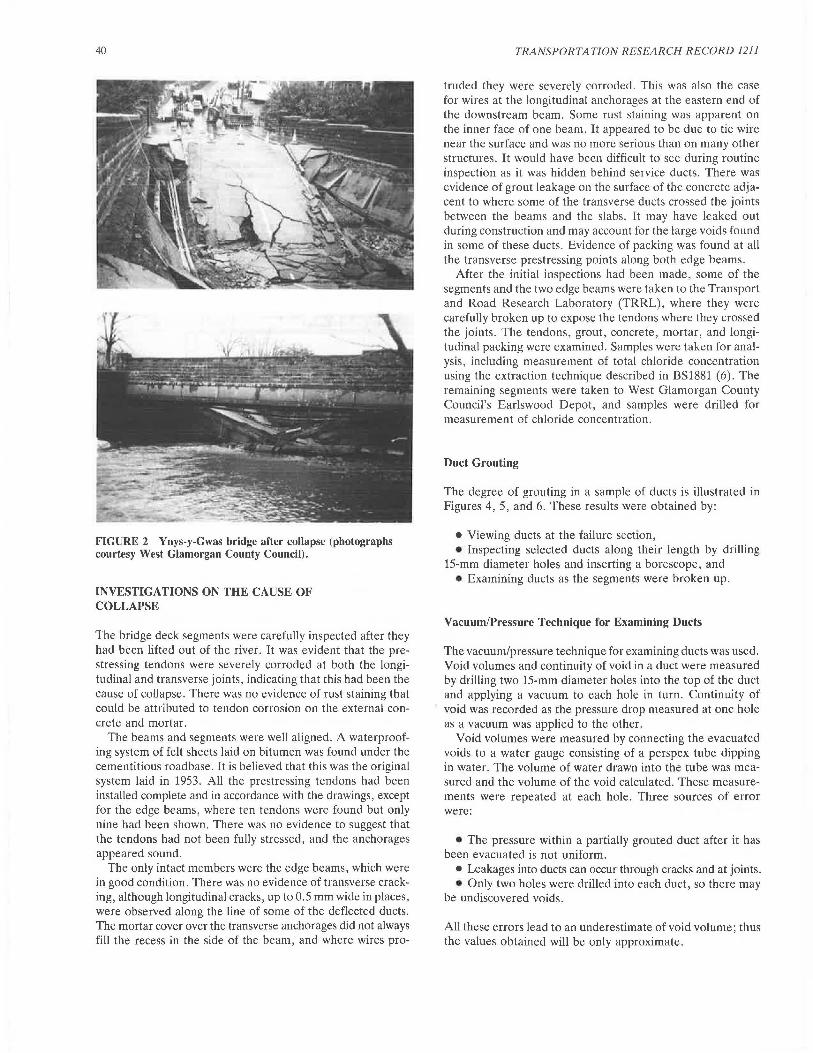
40
FIGURE 2 Ynys-y-Gwas bridge after collapse (photographs courtesy West Glamorgan County Council).
INVESTIGATIONS ON THE CAUSE OF COLLAPSE
The bridge deck segments were carefully inspected after they had been lifted out of the river. It was evident that the prestressing tendons were severely corroded at both the longitudinal and transverse joints, indicating that this had been the cause of collapse. There was no evidence of rust staining that could be attributed to tendon corrosion on the external concrete and mortar.
The beams and segments were well aligned. A waterproofing system of felt sheets laid on bitumen was found under the cementitious roadbase. It is believed that this was the original system laid in 1953. All the prestressing tendons had been installed complete and in accordance with the drawings, except for the edge beams, where ten tendons were found but only nine had been shown. There was no evidence to suggest that the tendons had not been fully stressed, and the anchorages appeared sound.
The only intact members were the edge beams, which were in good condition. There was no evidence of transverse cracking, although longitudinal cracks, up to 0.5 mm wide in places, were observed along the line of some of the deflected ducts. The mortar cover over the transverse anchorages did not always fill the recess in the side of the beam, and where wires pro-
TRANSPORTATION RESEARCH RECORD 1211
trnded they were severely corroded. This was also the c;ise for wires at the longitudinal anchorages at the eastern end of the downstream beam. Some rust staining was apparent on the inner face of one beam. It appeared to be due to tie wire near the surface and was no more serious than on many other structures. It would have been difficult to see during routine inspection as it was hidden behind service ducts. There was evidence of grout leakage on the surface of the concrete adjacent to where some of the transverse ducts crossed the joints between the beams and the slabs. It may have leaked out during construction and may account for the large voids found in some of these ducts. Evidence of packing was found at all the transverse prestressing points along both edge beams.
After the initial inspections had been made, some of the segments and the two edge beams were taken to the Transport and Road Research Laboratory (TRRL), where they were carefully broken up to expose the tendons where they crossed the joints. The tendons, grout, concrete, mortar, and longitudinal packing were examined. Samples were taken for analysis, including measurement of total chloride concentration using the extraction technique described in BS1881 (6). The remaining segments were taken to West Glamorgan County Council's Earlswood Depot, and samples were drilled for measurement of chloride concentration.
Duct Grouting
The degree of grouting in a sample of ducts is illustrated in Figures 4, 5, and 6. These results were obtained by:
• Viewing ducts at the failure section, • Inspecting selected ducts along their length by drilling
15-mm diameter holes and inserting a borescope, and • Examining ducts as the segments were broken up.
Vacuum/Pressure Technique for Examining Ducts
The vacuum/pressure technique for examining ducts was used. Void volumes and continuity of void in a duct were measured by drilling two 15-mm diameter holes into the top of the duct and applying a vacuum to each hole in turn. Continuity of void was recorded as the pressure drop measured at one hole as a vacuum was applied to the other.
Void volumes were measured by connecting the evacuated voids to a water gauge consisting of a perspex tube dipping in water. The volume of water drawn into the tube was measured and the volume of the void calculated. These measurements were repeated at each hole. Three sources of error were:
• The pressure within a partially grouted duct after it has been evacuated is not uniform.
• Leakages into ducts can occur through cracks and at joints. • Only two holes were drilled into each duct, so there may
be undiscovered voids.
All these errors lead to an underestimate of void volume; thus the values obtained will be only approximate.
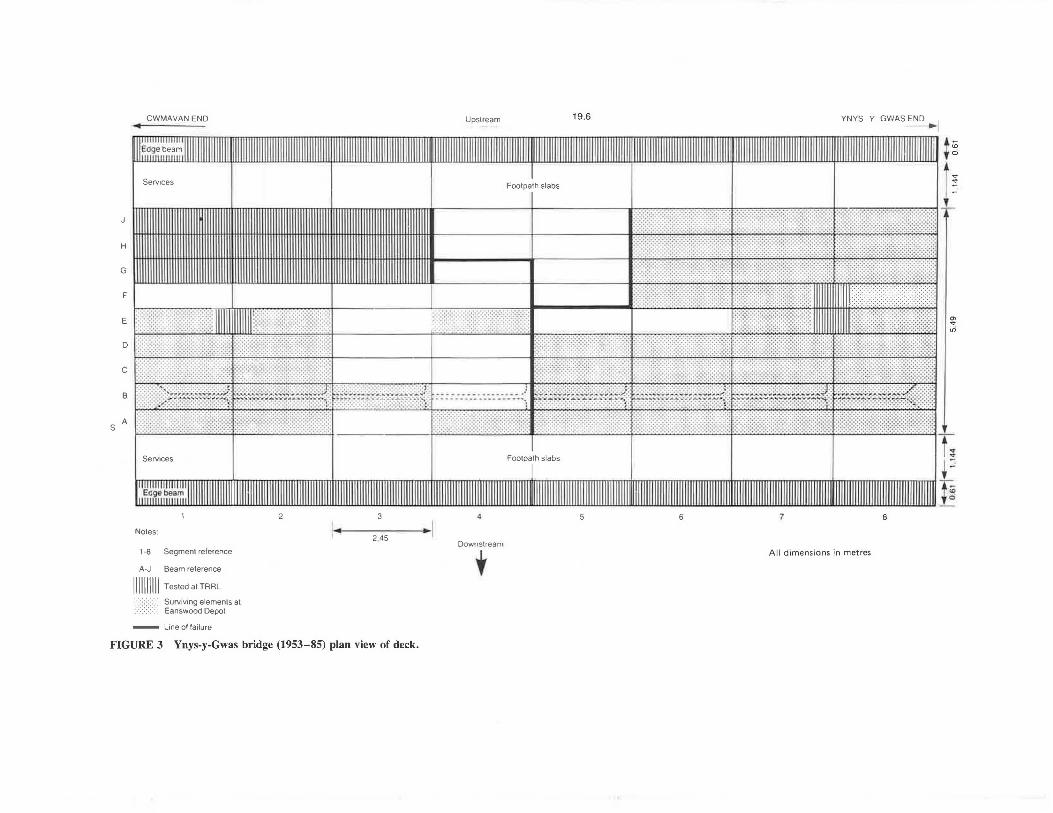
CWMAVAN END Upslream 19.6 YNYS Y GWA~I
Se Mees Foolpath slabs
J::~::JIIf!Itit:~JtlJ;~]I\lil~]J!!~~:~J::lIIf :tttlf ::J::! H ]\J!J@El\llf llil]l@JtIIIi?lIJIIIf If l1f tt\f
1,: i i I : 11 \, I ' ' ' i 1111 111!!11! II@! iif Wi G
F
E ft:i:::t::::i:y:: c·y:::I)·:C?@tmti: J::J::::r:::::::::::::::::::
'. 1:1::~~]: i ~~,l ii 1: 11 ~ ! ,1~ II i~' ........... .... .. ................ ··---·-···· ···-· --.
' 1:\~Mff ~Wf:~~~#:N:ffi~~~~~~f#:~?:~f.~~f:W~!if:~~~f:~~f:i\~~%~~~~!!W~t:\W~~tMW: {il1
s A 1;m:\:fttrn::m:r:1:tlFitt:11111itl 1::tii111t%tt:tJttttmttt<~n:1:f fJittt:rtmt:irn:m:tttJJt:t:1111:tt11t11Jl Services
Notes:
1 ·8 Segment reference
A-J Beam reference
111 1111111 Tested at TRRL
Surviving elemenls at Eariswood Depot
Line of failure
I 3
I I 2 45
FIGURE 3 Ynys-y-Gwas bridge (1953-85) plan view of deck.
4 5 6 8
Downstream
t All dimensions in metres
:~ "' "'
"' "' "'
"' "'
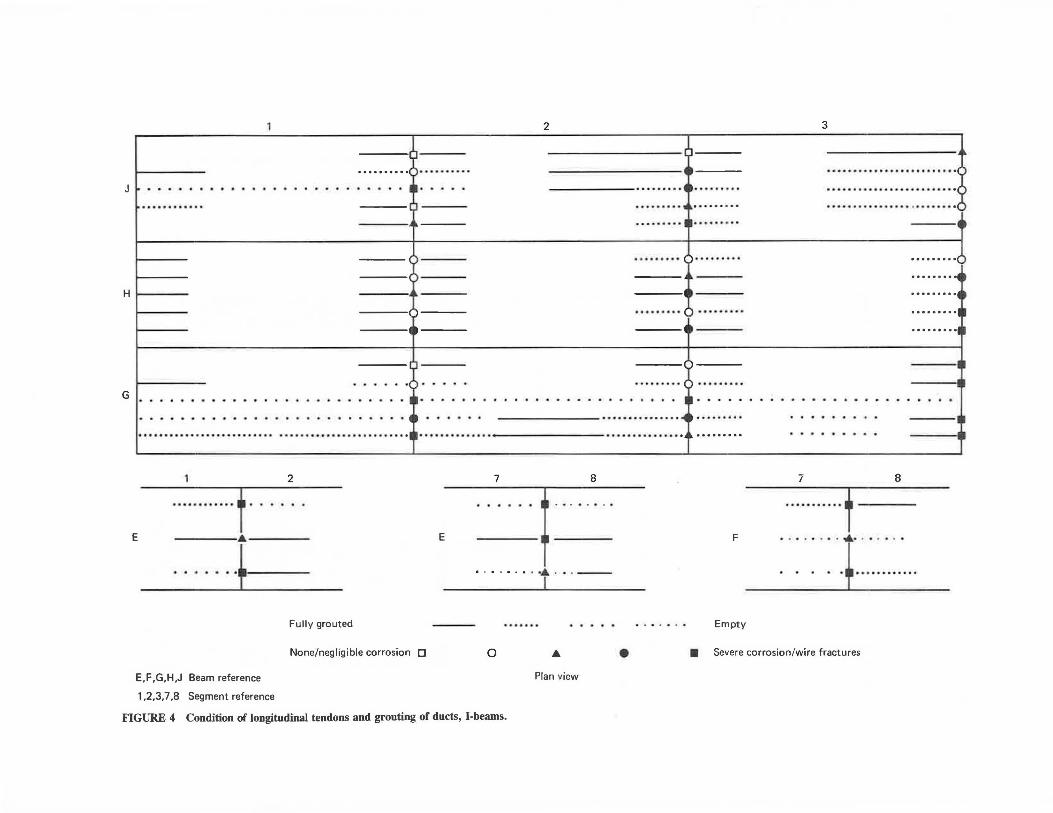
I
··········<;>·········· J ~ •••••••••••••••••••••••••••
--0-----·---
)--
HI-----
.)
....... G
2
~ ......... ~ ........ . ......... ., ........ . ·········•········· •.•....•. t)··· ......
---·---......... 6 ........ . -·-
. . . .. . . . ............... . .. :·:.:.: :z: ·:·:. :·: ~···············~········· . . . . . . . . . . ..
.......................... .... .. ................... .............. . .......................... .
2 7 8
_···1-··· ······· ··•·· ·-I
E
···········t -·-·······~!-
E F
Fully grouted Empty
3
: : : : : :: ::: : : : :: : ::: : : : : J -· ::::::::·10 ......... ......... ·········
--· 7 8
···········t :·:·: ·: .r.-.:.-. ......
None/negligible corrosion D 0 ... • • Severe corrosion/wire fractures
E,F ,G,H,J Beam reference
1,2,3,7 ,8 Segment reference
FIGURE 4 Condition of longitudinal tendons and grouting of ducts, I-beams.
Plan view
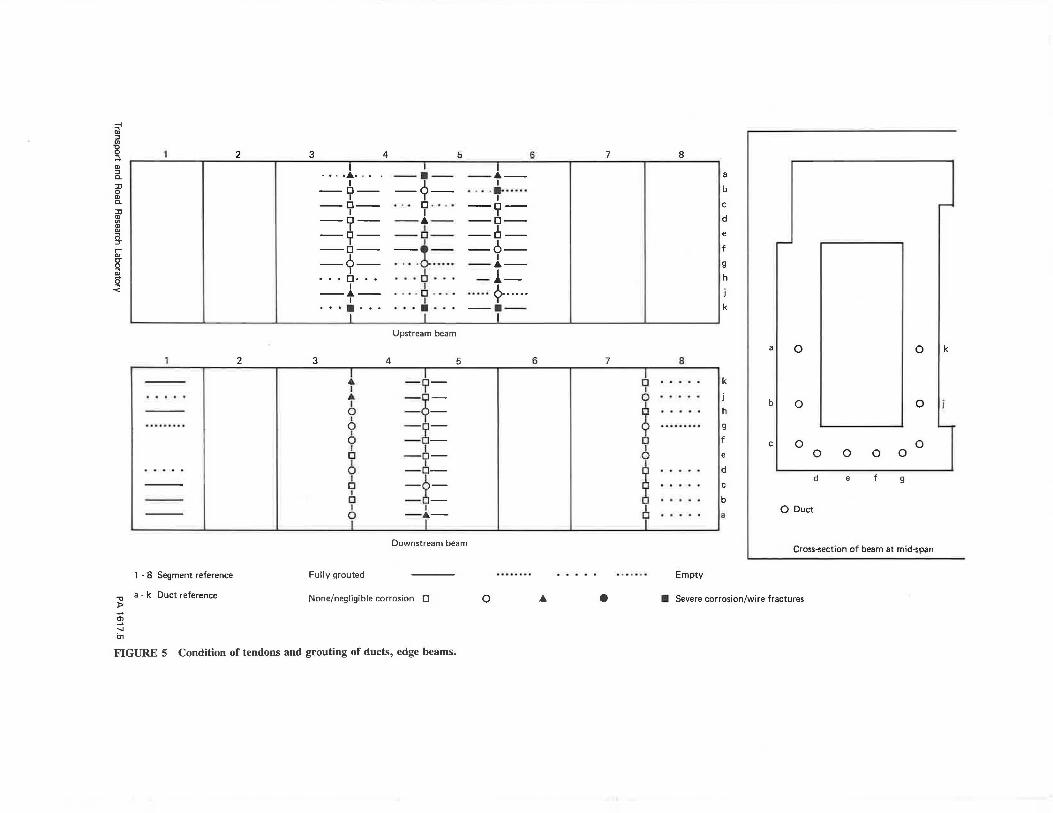
:;I "' ill ~ 1 2 3 4 5 6 7 8
"' 5.. .•. ·•·.. --·-- ---·--~ --0-- __ ,i_ __ • . • . .:.. ••••• °' I '( I c. --0-- .. · O · · .. --o--::c I I I ~ --o-- ---·-- --0--m I I l n -9- -o- -o-~ -o- - ·- -0-[ --9-- .... 0,..... --1--g ... O· ••••. c!J. •. -l.--< --+-- .... 9 ......... <?-····· . . . . . .•... --·--
Upstream beam
2 3 4 5 6 7 8 I I 6 --- • -'?- .... . I I ..... • -~-
0 ..... I 6 --- 0 -- ..... I I ......... 0 -'?- i ......... 6 - o-I I I
0 -iyi- 0 I . . ... 0
=*-~ .....
I -- 0 ..... I -- 0 --I I ? -- ? -·- .....
I
Downstream beam
1 · 8 Segment reference Fully grouted Empty
b
c d
e
f
g
h
j
k
k
j
h
g
f
e
d
c
b
a
a
bl
c
0 0 I k
0 0
0 0 0 0 0 0
d e g
0 Duct
Cross-section of beam at mid-span
.,, a · k Duct reference )>
None/negligible corrosion 0 0 • • • Severe corrosion/wire fractures
"' .... "' FIGURE 5 Condition of tendons and grouting of ducts, edge beams.
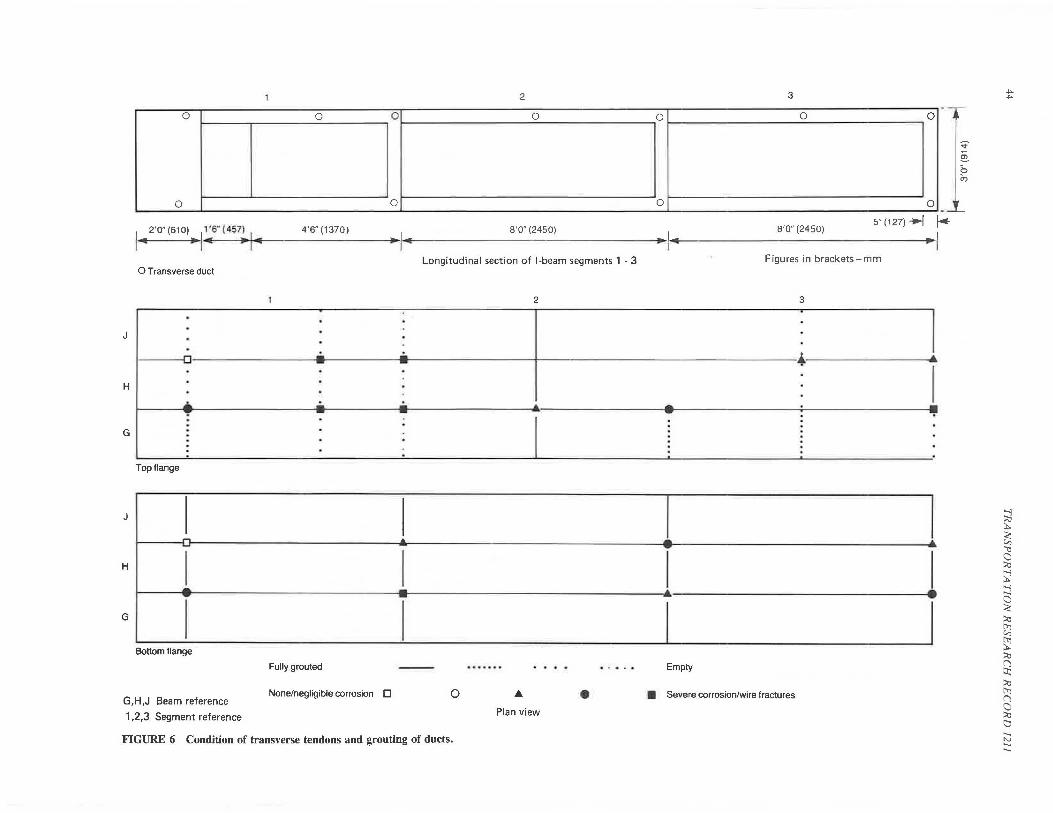
2 3
0 0 0 0 0 0 0
0 0 0 0
I 2'0"(610) i1·s·(457J 4'6"(1370) 8 'o"(2450l 8,0 .. (2450) 5"(127)-.l j. .. • ..... ,.. •l I
0 Transverse duct
J I .
0
H I . . . • GL .
Top flange
J I -
H I --G I
Bottom flange
G,H,J Beam reference
1,2,3 Segment reference
Longitudinal section of I-beam segments 1 - 3 Figures in brackets-mm
2 3
. -'- -'-- --------~~---~~~~~--~~~~~~~~~~~~+~~~~~---
• • .. - . -. .
I ..
l I I -- -I
Fully grouted Empty
None/negligible corrosion D 0 A • • Severe corrosion/wire fractures
Plan view
FIGURE 6 Condition of transverse tendons and grouting of ducts.
~
~ 0
"'
""'" ""'"
;J ~
~ '"i:I a ::ti
~ ::j a <: ::ti
~ ~ ::ti
g ::ti t'1 (j a ::ti 1:1 .._ N .._ .._
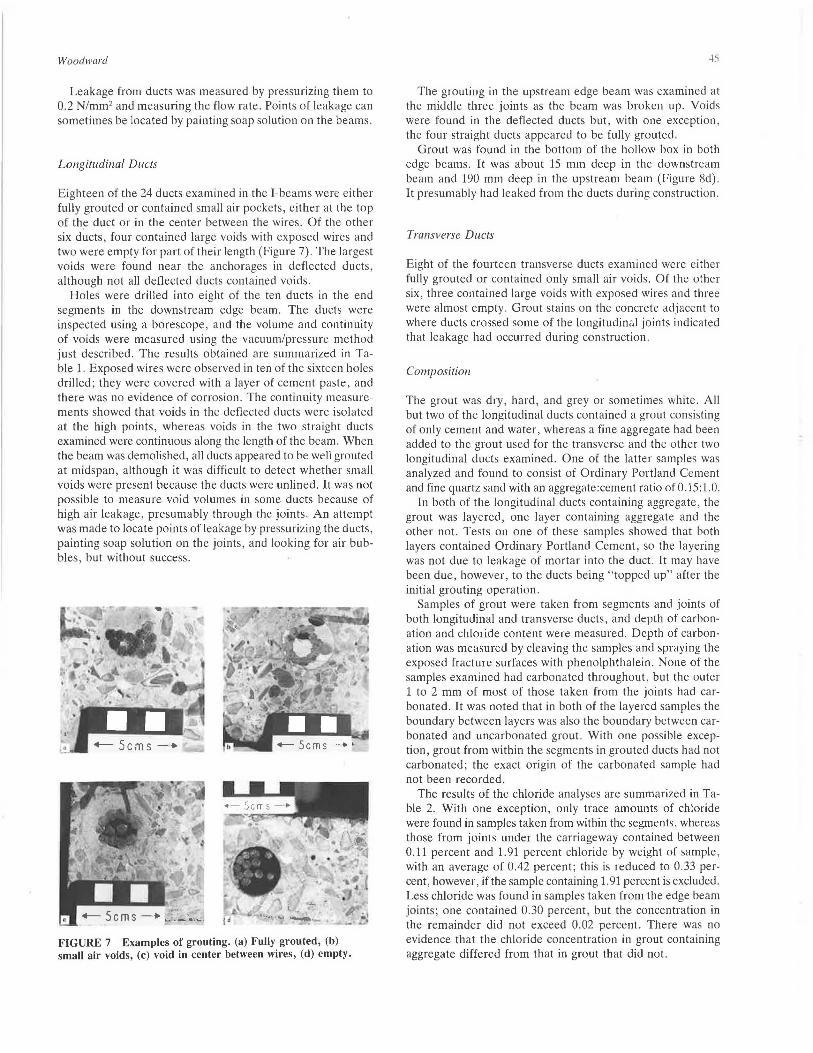
Woodward
Leakage from ducts was measured by pressurizing them to 0.2 N/mm2 and measuring the flow rate. Points of leakage can sometimes be located by painting soap solution on the beams.
Longitudinal Ducts
Eighteen of the 24 ducts examined in the I-beams were either fully grouted or contained small air pockets, either at the top of the duct or in the center between the wires. Of the other six ducts , four contained large voids with exposed wires and two were empty for part of their length (Figure 7). The largest voids were found near the anchorages in deflected ducts, although not all deflected ducts contained voids.
Holes were drilled into eight of the ten ducts in the end segments in the downstream edge beam. The ducts were inspected using a borescope, and the volume and continuity of voids were measured using the vacuum/pressure method just described. The results obtained are summarized in Table 1. Exposed wires were observed in ten of the sixteen holes drilled ; they were covered with a layer of cement paste, and there was no evidence of corrosion . The continuity measurements showed that voids in the deflected ducts were isolated at the high points, whereas voids in the two straight ducts examined were continuous along the length of the beam. When the beam was demolished, all ducts appeared to be well grouted at midspan, although it was difficult to detect whether small voids were present because the ducts were unlined. It was not possible to measure void volumes in some ducts because of high air leakage, presumably through the joints. An attempt was made to locate points of leakage by pressurizing the ducts, painting soap solution on the joints, and looking for air bubbles, but without success.
FIGURE 7 Examples of grouting. (a) Fully grouted, (b) small air voids, (c) void in center between wires, (d) empty.
45
The grouting in the upstream edge beam was examined at the middle three joints as the beam was broken up. Voids were found in the deflected ducts but, with one exception, the four straight ducts appeared to be fully grouted.
Grout was found in the bottom of the hollow box in both edge beams. It was about 15 mm deep in the downstream beam and 190 mm deep in the upstream beam (Figure 8d). It presumably had leaked from the ducts during construction.
Transverse Ducts
Eight of the fourteen transverse ducts examined were either fully grouted or contained only small air voids. Of the other six, three contained large voids with exposed wires and three were almost empty. Grout stains on the concrete adjacent to where ducts crossed some of the longitudinal joints indicated that leakage had occurred during construction.
Composition
The grout was dry , hard , and grey or sometimes white. All but two of the longitudinal ducts contained a grout consisting of only cement and water, whereas a fine aggregate had been added to the grout used for the transverse and the other two longitudinal ducts examined. One of the latter samples was analyzed and found to consist of Ordinary Portland Cement and fine quartz sand with an aggregate:cement ratio of0.15:1.0 .
In both of the longitudinal ducts containing aggregate, the grout was layered, one layer containing aggregate and the other not. Tests on one of these samples showed that both layers contained Ordinary Portland Cement, so the layering was not due to leakage of mortar into the duct. It may have been due, however , to the ducts being "topped up" after the initial grouting operation.
Samples of grout were taken from segments and joints of both longitudinal and transverse ducts, and depth of carbonation and chloride content were measured. Depth of carbonation was measured by cleaving the samples and spraying the exposed fracture surfaces with phenolphthalein. None of the samples examined had carbonated throughout, but the outer 1 to 2 mm of most of those taken from the joints had carbonated. It was noted that in both of the layered samples the boundary between layers was also the boundary between carbonated and uncarbonated grout. With one possible exception, grout from within the segments in grouted ducts had not carbonated; the exact origin of the carbonated sample had not been recorded.
The results of the chloride analyses are summarized in Table 2. With one exception, only trace amounts of chloride were found in samples taken from within the segments, whereas those from joints under the carriageway contained between 0.11 percent and 1.91 percent chloride by weight of sample , with an average of 0.42 percent; this is reduced to 0.33 percent, however, if the sample containing 1. 91 percent is excluded. Less chloride was found in samples taken from the edge beam joints; one contained 0.30 percent, but the concentration in the remainder did not exceed 0.02 percent. There was no evidence that the chloride concentration in grout containing aggregate differed from that in grout that did not.
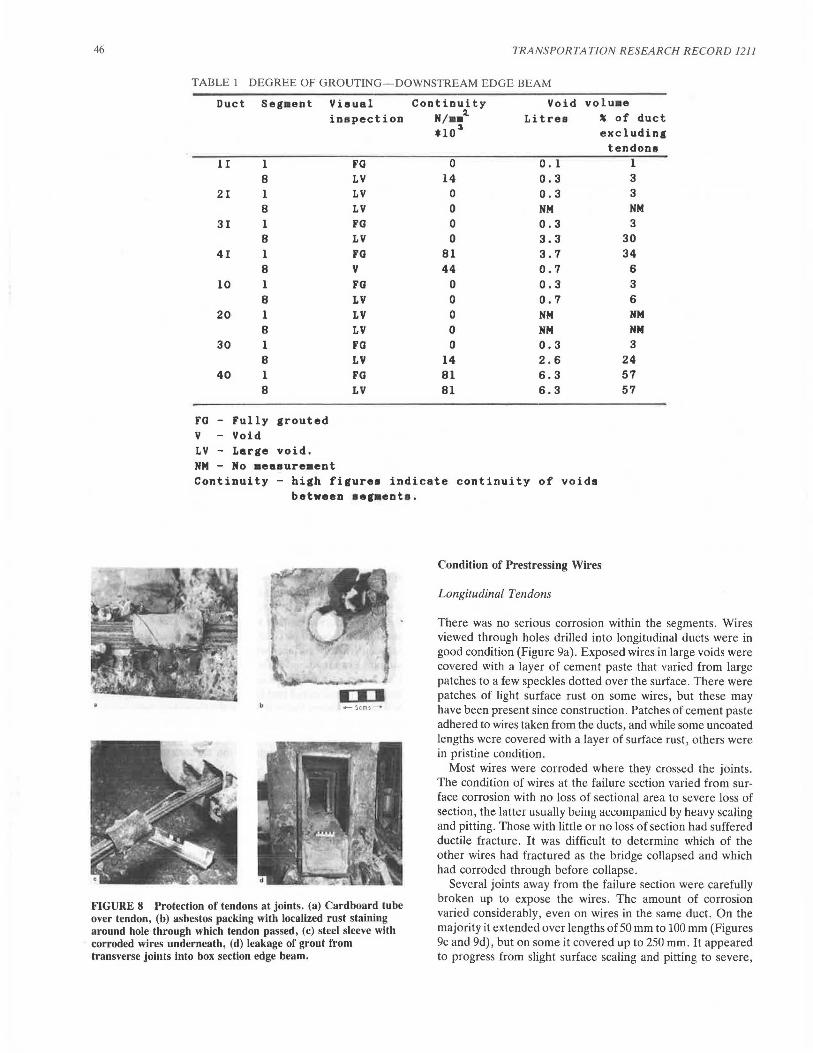
46 TR ANSPORTATION RESEA RCH R ECORD 1211
TABLE 1 DEGREE OF GROUTING-DOWNSTREAM EDGE BEAM
Duct Seg•ent Visual Continuity Void volu•e inspection N/••'J.. Litres ' of duct
*103 excluding tendons
lI 1 FG 0 0.1 1 8 LV 14 0.3 3
21 1 LY 0 0.3 3 8 LY 0 NM NM
31 1 FG 0 0.3 3 8 LY 0 3.3 30
41 l FG 81 3.7 34 8 y 44 0.7 6
10 1 FG 0 0.3 3 8 LY 0 0.7 6
20 l LY 0 NM NM 8 LY 0 NM NM
30 1 FG 0 0.3 3 8 LY 14 2.6 24
40 1 FG 81 6.3 57 8 LY 81 6.3 57
FG - Fully grouted y - Void LY - Large void. NM - No •easure•ent Continuity - high figures indicate continuity of voids
between •eg•ent•.
-scms-
FIGURE 8 Protection of tendons at joints. (a) Cardboard tube over tendon, (b) asbestos packing with localized rust staining around hole through which tendon passed, (c) steel sleeve with corroded wires underneath, (d) leakage of grout from transverse joints into box section edge beam.
Condition of Prestressing Wires
Longitudinal Tendons
There was no serious corrosion within the segments. Wires viewed through holes drilled into longitudinal ducts were in good condition (Figure 9a). Exposed wires in large voids were covered with a layer of cement paste that varied from large patches to a few speckles dotted over the surface. There were patches of light surface rust on some wires, but these may have been present since construction. Patches of cement paste adhered to wires taken from the ducts, and while some uncoated lengths were covered with a layer of surface rust, others were in pristine condition.
Most wires were corroded where they crossed the joints. The condition of wires at the failure section varied from surface corrosion with no loss of sectional area to severe loss of section, the latter usually bt:iug au;umpanit:u by heavy scaling and pitting. Those with little or no loss of section had suffered ductile fracture. It was difficult to determine which of the other wires had fractured as the bridge collapsed and which had corroded through before collapse.
Several joints away from the failure section were carefully broken up to expose the wires . The amount of corrosion varied considerably, even on wires in the same duct. On the majority it extended over lengths of 50 mm to 100 mm (Figures 9c and 9d), but on some it covered up to 250 mm. It appeared to progress from slight surface scaling and pitting to severe,
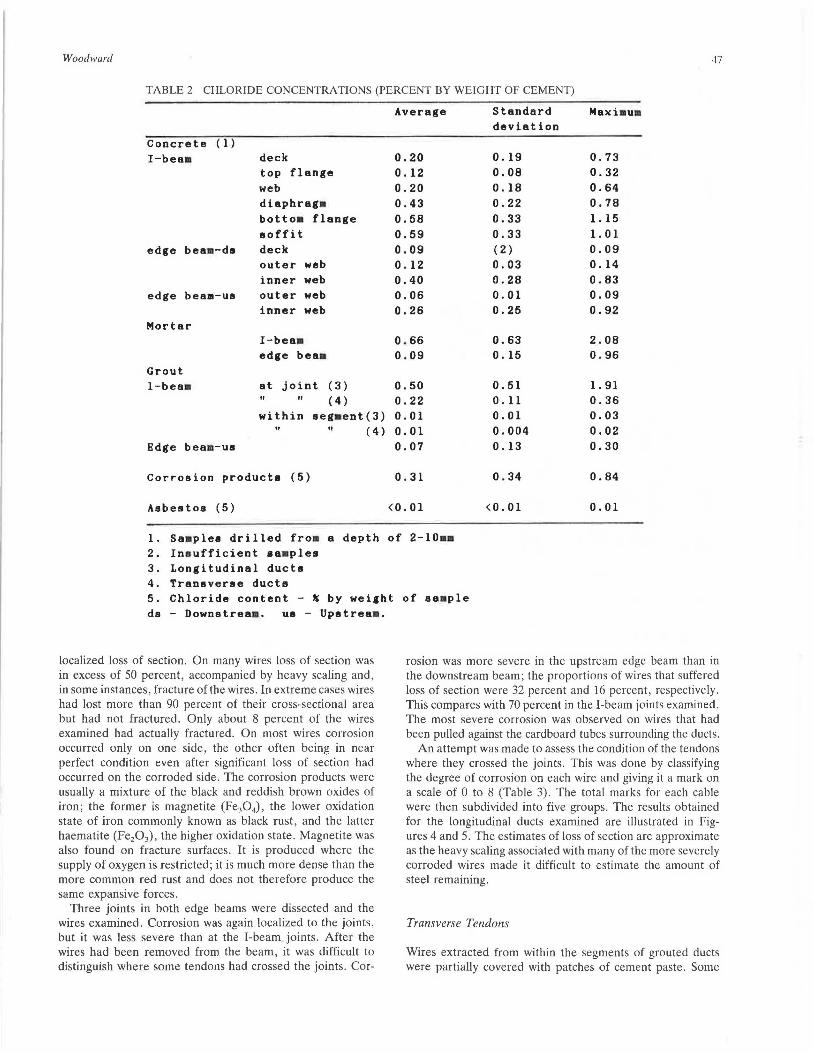
Woodward .i7
TABLE 2 CHLORIDE CONCENTRATIONS (PERCENT BY WEIGHT OF CEMENT)
Average Standard Maxi 11u11 deviation
Concrete ( 1 ) I-beaa deck 0 . 20 0.19 0.73
top flange 0.12 0.08 0.32 web 0.20 0. 18 0 . 64 diaphraga 0 . 43 0 . 22 0.78 bot to• flange 0.58 0.33 1.15 soffit 0.59 0.33 1. 01
edge beam-de deck 0.09 ( 2) 0.09 outer web 0.12 0.03 0.14 inner web 0.40 0.28 0.83
edge bea11-u11 outer web 0.06 0 . 01 0.09 inner web 0.26 0.25 0.92
Mortar I-beaa 0.66 0.63 2.08 edge bea11 0.09 0.15 0.96
Grout I-bea• at joint ( 3) 0.50 0.51 1. 91
" " (4) 0.22 0.11 0.36 within seg11ent(3) 0.01 0 . 01 0.03
" " (4) 0.01 0.004 0.02 Edge beam-us 0.07 0.13 0.30
Corrosion products (5) 0.31 0 . 34 0.84
Asbestos (5) <0.01 <0.01 0.01
1. Sa11ples drilled from a depth of 2-101111 2. In s ufficient sa11ples 3. Longitudinal ducts 4. Transverse ducts 5. Chloride content - ~ by weight of sa11ple ds - Downstreaa . us - Up11trea11 .
localized loss of section. On many wires loss of section was in excess of 50 percent, accompanied by heavy scaling and , in some instances, fracture of the wires. In extreme cases wires had lost more than 90 percent of their cross-sectional area but had not fractured. Only about 8 percent of the wires examined had actually fractured. On most wires corrosion occurred only on one side, the other often being in near perfect condition even after significant loss of section had occurred on the corroded side. The corrosion products were usually a mixture of the black and reddish brown oxides of iron; the former is magnetite (Fe30 4), the lower oxidation state of iron commonly known as black rust, and the latter haematite (Fe20 3), the higher oxidation state . Magnetite was also found on fracture surfaces. It is produced where the supply of oxygen is restricted; it is much more dense than the more common red rust and does not therefore produce the same expansive forces.
Three joints in both edge beams were dissected and the wires examined. Corrosion was again localized to the joints, but it was less severe than at the I-beam joints. After the wires had been removed from the beam, it was difficult to distinguish where some tendons had crossed the joints. Cor-
rosion was more severe in the upstream edge beam than in the downstream beam; the proportions of wires that suffered loss of section were 32 percent and 16 percent, respectively. This compares with 70 percent in the I-beam joints examined. The most severe corrosion was observed on wires that had been pulled against the cardboard tubes surrounding the ducts.
An attempt was made to assess the condition of the tendons where they crossed the joints. This was done by classifying the degree of corrosion on each wire and giving it a mark on a scale of 0 to 8 (Table 3). The total marks for each cable were then subdivided into five groups. The results obtained for the longitudinal ducts examined are illustrated in Figures 4 and 5. The estimates of loss of section are approximate as the heavy scaling associated with many of the more severely corroded wires made it difficult to estimate the amount of steel remaining.
Transverse Tendons
Wires extracted from within the segments of grouted ducts were partially covered with patches of cement paste . Some
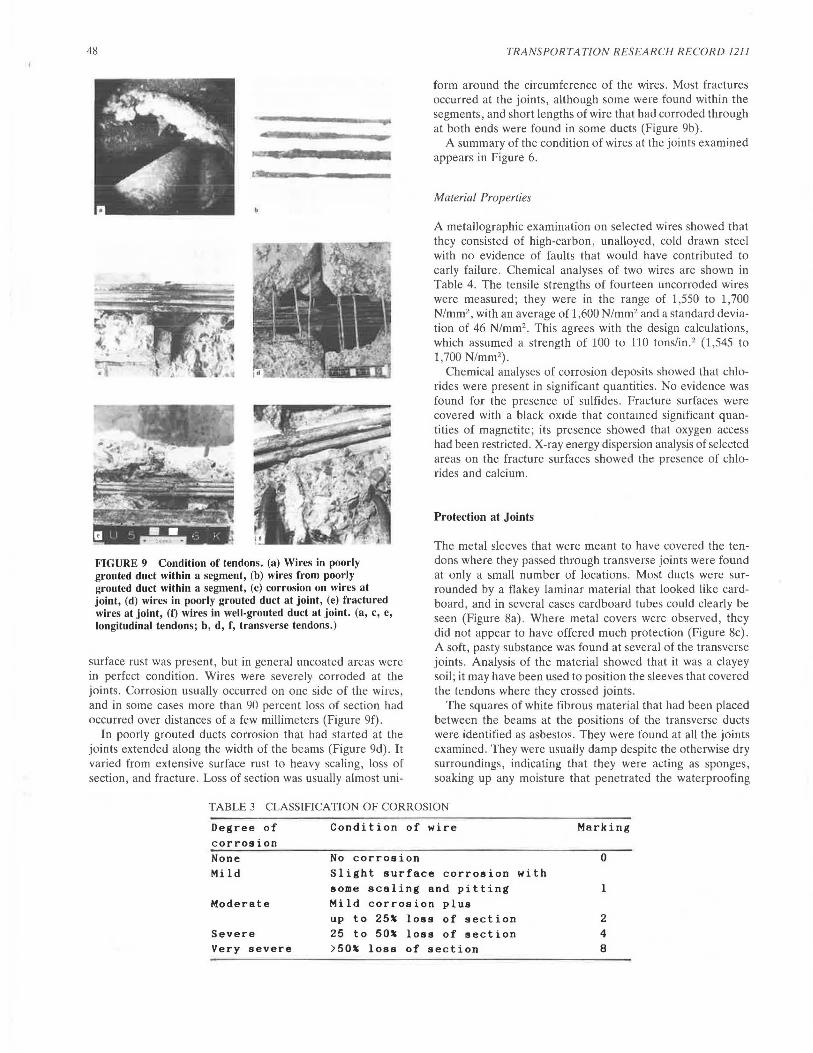
48
FIGURE 9 Condition of tendons. (a) Wires in poorly grouted duct within a segment, (b) wires from poorly grouted duct within a segment, (c) corrosion on wires at joint, (d) wires in poorly grouted duct at joint, (e) fractured wires at joint, (f) wires in well-grouted duct at joint. (a, c, e, longitudinal tendons; b , d, f, transverse tendons. )
surface rust was present, but in general uncoated areas were in perfect condition. Wires were severely corroded at the joints . Corrosion usually occurred on one side of the wires, and in some cases more than 90 percent loss of section had occurred over distances of a few millimeters (Figure 9f).
In poorly grouted ducts corrosion that had started at the joints extended along the width of the beams (Figure 9d). It varied from extensive surface rust to heavy scaling, loss of section, and fracture . Loss of section was usually almost uni-
TRANSPORTATION RESEARCH RECORD 12/I
form around the circumference of the wires. Most fractures occurred at the joints, although some were found within the segments , and short lengths of wire that had corroded through at both ends were found in some ducts (Figure 9b ).
A summary of the condition of wires at the joints examined appears in Figure 6.
Material Properties
A metallographic examination on selected wires showed that they consisted of high-carbon, unalloyed, cold drawn steel with no evidence of faults that would have contributed to early failure. Chemical analyses of two wires are shown in Table 4. The tensile strengths of fourteen uncorroded wires were measured; they were in the range of 1,550 to 1,700 N/mm2
, with an average of 1,600 N/mm2 and a standard deviation of 46 N/mm2 • This agrees with the design calculations, which assumed a strength of 100 to 110 tons/in. 2 (1 ,545 to 1,700 N/mm2).
Chemical analyses of corrosion deposits showed that chlorides were present in significant quantities. No evidence was found for the presence of sulfides. Fracture surfaces were covered with a black oxide that contained significant quantities of magnetite ; its presence showed that oxygen access had been restricted. X-ray energy dispersion analysis of selected areas on the fracture surfaces showed the presence of chlorides and calcium.
Protection at Joints
The metal sleeves that were meant to have covered the tendons where they passed through transverse joints were found at only a small number of locations. Most ducts were surrounded by a flakey laminar material that looked like cardboard, and in several cases cardboard tubes could clearly be seen (Figure 8a). Where metal covers were observed, they did not appear to have offered much protection (Figure 8c). A soft, pasty substance was found at several of the transverse joints. Analysis of the material showed that it was a clayey soil; it may have been used to position the sleeves that covered the lemlons where they crossed joints.
The squares of white fibrous material that had been placed between the beams at the positions of the transverse ducts were identified as asbestos. They were found at all the joints examined. They were usually damp despite the otherwise dry surroundings, indicating that they were acting as sponges, soaking up any moisture that penetrated the waterproofing
TABLE 3 CLASSIFICATION OF CORROSION
Degree of Condition of wire Marking
corrosion None No corrosion 0 Mild Slight surface corrosion with
some scaling and pitting 1 Moderate Mild corrosion plus
up to 25% loss of section 2 Severe 25 to 50% loss of section 4 Very severe >50% loss of section 8
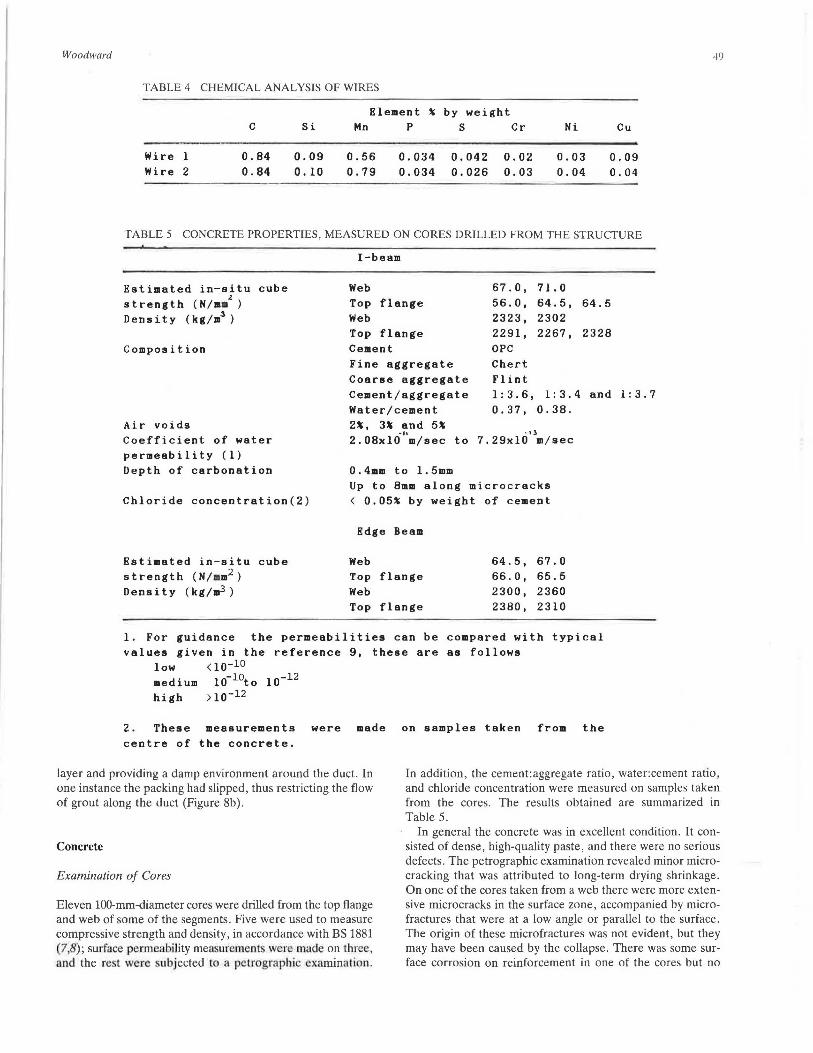
Woodward
TABLE 4 CHEMICAL ANALYSIS OF WIRES
Element ' by weight c Si Mn p s Cr Ni Cu
Wire l 0.84 0.09 0.56 0.034 0.042 0.02 0.03 0.09 Wire 2 0.84 0.10 0.79 0.034 0.026 0.03 0.04 0.04
TABLE 5 CONCRETE PROPERTIES, MEASURED ON CORES DRILLED FROM THE STRUCTURE
Estimated in-situ cube strength (N/m• z) Density (kg/m3
)
Composition
Air voids Coefficient of water permeability (1) Depth of carbonation
Chloride concentration(2)
Estimated in-situ cube strength (N/ mm2 )
Density (kg/m3)
I-beam
Web Top flange Web Top flange Cement
67.0, 56 . 0, 2323, 2291, OPC Chert Flint
71. 0 64.5, 64.5 2302 2267, 2328
Fine aggregate Coarse aggregate Cement/aggregate Water/cement
1:3.6, 1:3.4 and 1:3.7 0.37, 0.38.
2%, 3% and 5% ... - • l 2.08xl0 m/sec to 7 . 29xl0 m/sec
0 . 4mm to l.5mm Up to 8mm along microcracks < 0.05% by weight of cement
Edge Beam
Web Top flange Web Top flange
64.5, 67.0 66 . 0, 65.5 2300, 2360 2380, 2310
1 . For guidance the permeabilities can be compared with typical values given in the reference 9, these are as follows
low < 10-lO medium l0-10to l0-12
high >10-12
2 . These measurements were made on samples taken from the centre of the concrete.
49
layer and providing a damp environment around the duct. In one instance the packing had slipped, thus restricting the flow of grout along the duct (Figure 8b) .
In addition , the cement:aggregate ratio, water:cement ratio, and chloride concentration were measured on samples taken from the cores. The results obtained are summarized in Table 5.
Concrete
Examination of Cores
Eleven 100-mm-diameter cores were drilled from the top flange and web of some of the segments. Five were used to measure compressive strength and density, in accordance with BS 1881 (7,8); surface permeability measurement were made on three, and the rest were subjected to a petregraphi examination.
In general the concrete was in excellent condition . It consisted of dense, high-quality paste, and there were no serious defects . The petrographic examination revealed minor microcracking that was attributed to long-term drying shrinkage. On one of the cores taken from a web there were more extensive microcracks in the surface zone, accompanied by microfractures that were at a low angle or parallel to the surface. The origin of these microfractures was not evident, but they may have been caused by the collapse. There was some surface corrosion on reinforcement in one of the cores but no
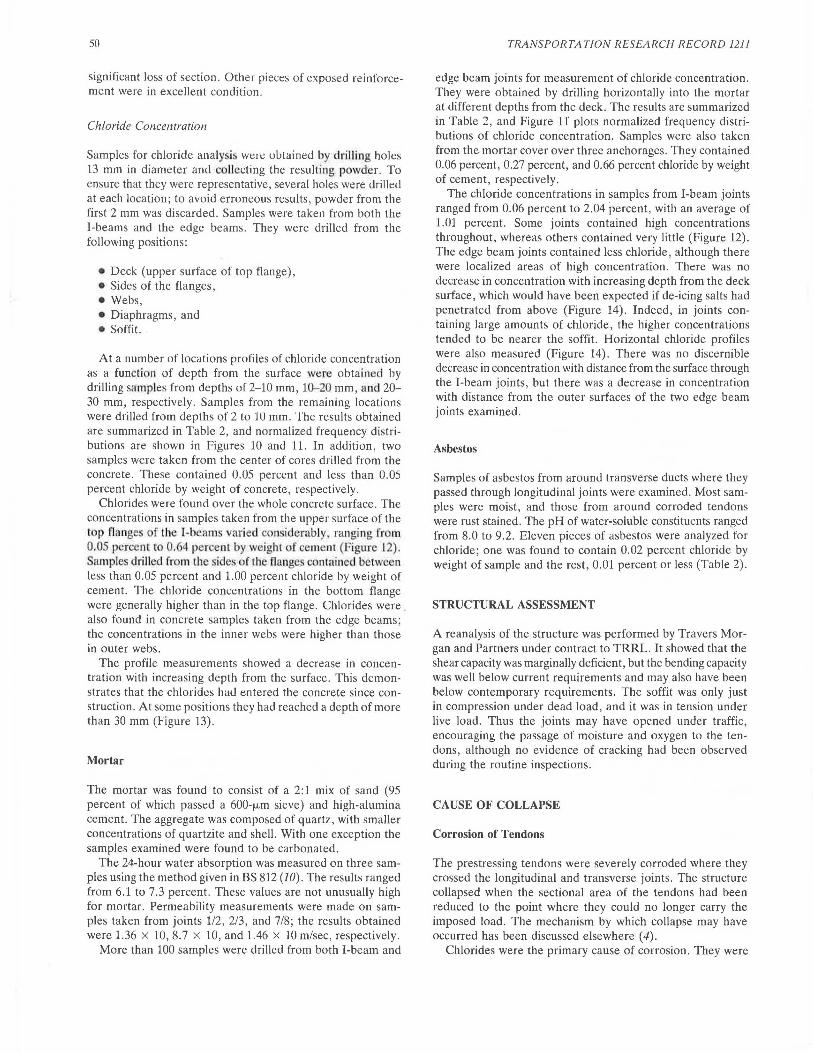
50
significant loss of section. Other pieces of exposed reinforcement were in excellent condition .
Chloride Concentration
Samples for chloride analysi wen~ obtained by drilling holes 13 mm in diameter and collecting the resulting powder. To ensure that they were representative, several holes were dri\\erl at each location; to avoid erroneous results, powder from the first 2 mm was discarded. Samples were taken from both the I-beams and the edge beams. They were drilled from the following positions:
• Deck (upper surface of top flange), • Sides of the flanges, •Webs, • Diaphragms, and • Soffit.
At a number of locations profiles of chloride concentration as a function of depth from the surface were obtained by drilling samples from depths of 2-10 mm, 10-2 mm, and 20-30 mm, respectively. Samples from the remaining locations were drilled from depths of 2 to 10 mm. The results obtained are summarized in Table 2, and normalized frequency distributions are shown in Figures 10 and 11. In addition, two samples were taken from the center of cores drilled from the concrete. These contained 0.05 percent and less than 0.05 percent chloride by weight of concrete, respectively.
Chlorides were found over the whole concrete surface. The concentrations in samples taken from the upper surface of the top flanges f the I-beams varied considerab ly, ranging from 0.05 percent to 0.64 percent by weight of cement Figure 12 .
ample. drilled from the sid of the flang contained bet we n less than 0.05 percent and 1.00 percent chloride by weight of cement. The chloride concentrations in the bottom flange were generally higher than in the top flange. Chlorides were . also found in concrete samples taken from the edge beams; the concentrations in the inner webs were higher than those in outer webs.
The profile measurements showed a decrease in concentration with increasing depth from the surface. This demonstrates that the chlorides had entered the concrete since construction. At some positions they had reached a depth of more than 30 mm (Figure 13).
Mortar
The mortar was found to consist of a 2: 1 mix of sand (95 percent of which passed a 600-µm sieve) and high-alumina cement. The aggregate was composed of quartz, with smaller concentrations of quartzite and shell. With one exception the samples examined were found to be carbonated.
The 24-hour water absorption was measured on three samples using the method given in BS 812 (10). The results ranged from 6.1 to 7.3 percent. These values are not unusually high for mortar. Permeability measurements were made on samples taken from joints 1/2, 2/3, and 7/8; the results obtained were 1.36 x 10, 8. 7 x 10, and 1.46 x 10 m/sec, respectively.
More than 100 samples were drilled from both I-beam and
TRANSPORTATION RESEARCH RECORD 1211
edge beam joints for measurement of chloride concentration. They were obtained by drilling horizontally into the mortar at different depths from the deck. The results are summarized in Table 2, and Figure 11 plots normalized frequency distributions of chloride concentration. Samples were also taken from the mortar cover over three anchorages. They contained 0.06 percent, 0.27 percent, and 0.66 percent chloride by weight of cement, respectively .
The chloride concentrations in samples from I-beam joints ranged from 0.06 percent to 2.04 percent, with an average of 1.01 percent. Some joints contained high concentrations throughout, whereas others contained very little (Figure 12). The edge beam joints contained less chloride, although there were localized areas of high concentration. There was no decrease in concentration with increasing depth from the deck surface, which would have been expected if de-icing salts had penetrated from above (Figure 14). Indeed, in joints containing large amounts of chloride, the higher concentrations tended to be nearer the soffit. Horizontal chloride profiles were also measured (Figure 14). There was no discernible decrease in concentration with distance from the surface through the I-beam joints, but there was a decrease in concentration with distance from the outer surfaces of the two edge beam joints examined.
Asbestos
Samples of asbestos from around transverse ducts where they passed through longitudinal joints were examined. Most samples were moist, and those from around corroded tendons were rust stained. The pH of water-soluble constituents ranged from 8.0 to 9.2. Eleven pieces of asbestos were analyzed for chloride; one was found to contain 0 .02 percent chloride by weight of sample and the rest, 0.01 percent or less (Table 2).
STRUCTURAL ASSESSMENT
A reanalysis of the structure was performed by Travers Morgan and Partners under contract to TRRL. It showed that the shear capacity was marginally deficient, but the bending capacity was well below current requirements and may also have been below contemporary requirements. The soffit was only just in compression under dead load, and it was in tension under live load. Thus the joints may have opened under traffic, encouraging the passage of moisture and oxygen to the tendons, although no evidence of cracking had been observed during the routine inspections.
CAUSE OF COLLAPSE
Corrosion of Tendons
The prestressing tendons were severely corroded where they crossed the longitudinal and transverse joints. The structure collapsed when the sectional area of the tendons had been reduced to the point where they could no longer carry the imposed load. The mechanism by which collapse may have occurred has been discussed elsewhere (4).
Chlorides were the primary cause of corrosion. They were
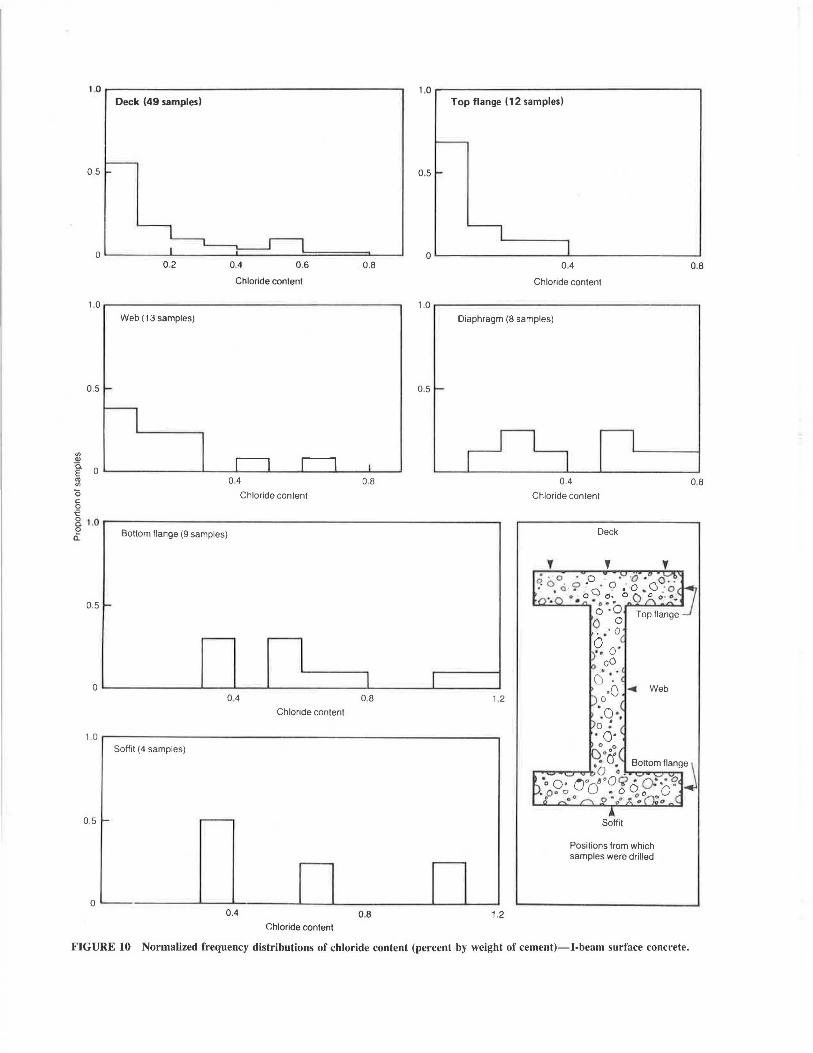
1.0 -------------------------Deck (49 samples)
05
0.2 0.4 0.6 0.8
Chloride content
1 0------------------------~ Web ( 13 samples)
0.5
04 0.8
Chloride content
Bottom flange (9 samples)
0.5 -.....---
I 0 I
04 OB Chloride content
1-0 Sottit (4 samples)
0.5 - ..-
~
0 ~ 0.4 0.8
Chloride content
1 .0---------------------~ Top flange (12 samples)
0.5
a.__ __________ .__ _________ __,
0.4
Chloride content
0.8
1.0---------------------~
0.5
Diaphragm (8 samples)
I 1 2
..-
1.2
0.4
Chloride content
Deck
Sottit
Positions from which samples were drilled
0.8
FIGURE 10 Normalized frequency distributions of chloride content (percent by weight of cement)-1-beam surface concrete.
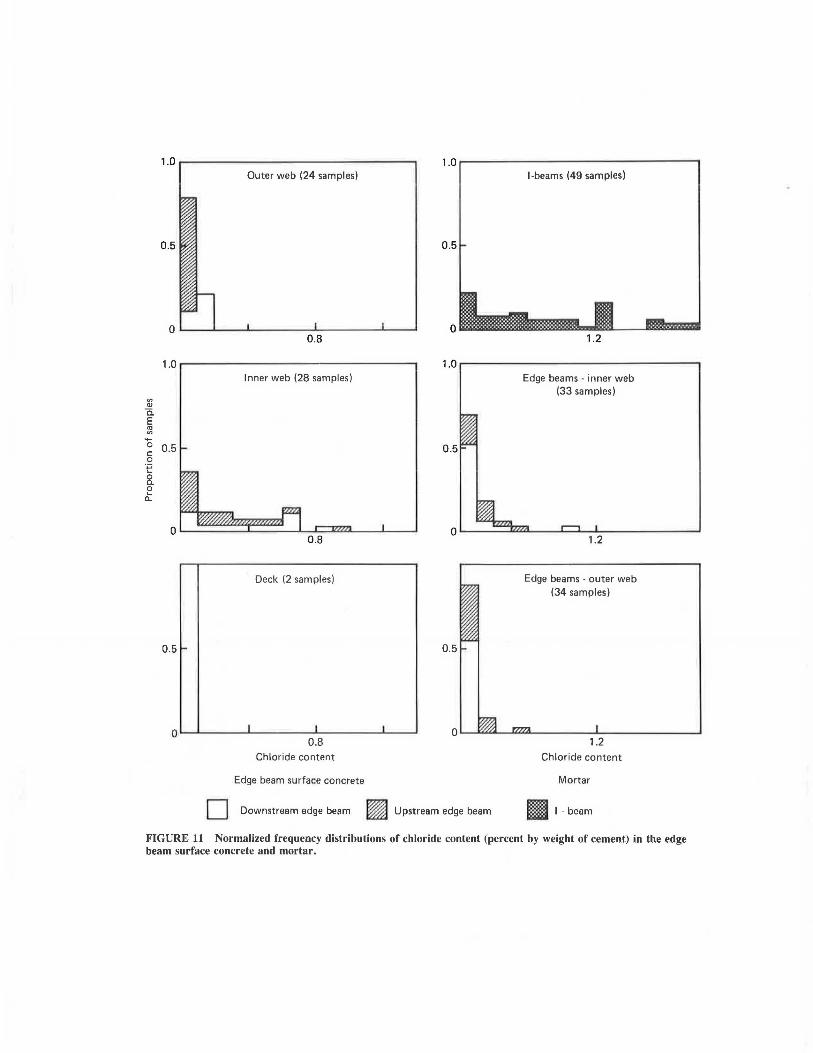
1.0 ------------------. 1.0----------------, Outer web (24 samples) I-beams (49 samples)
0 .5 0 .5
0 0 0.8 1.2
1.0 1.0 Inner web (28 samples) Edge beams - inner web
(33 samples) "' Q)
c. E "' "' ..... 0 0.5 0.5 c 0
·.;:::;
~ 0 a:
0 0 0 .8 1 .2
Deck (2 samples) Edge beams - outer web (34 samples)
0.5 ... 0.5
0 I I I 0
0 .8 1 .2 Chloride content Chloride content
Edge beam surface concrete Mortar
D Downstream edge beam ~ Upstream edge beam DD I - beam
FIGURE 11 Normalized frequency distributions of chloride content (percent by weight of cement) in the edge beam surface concrete and mortar.
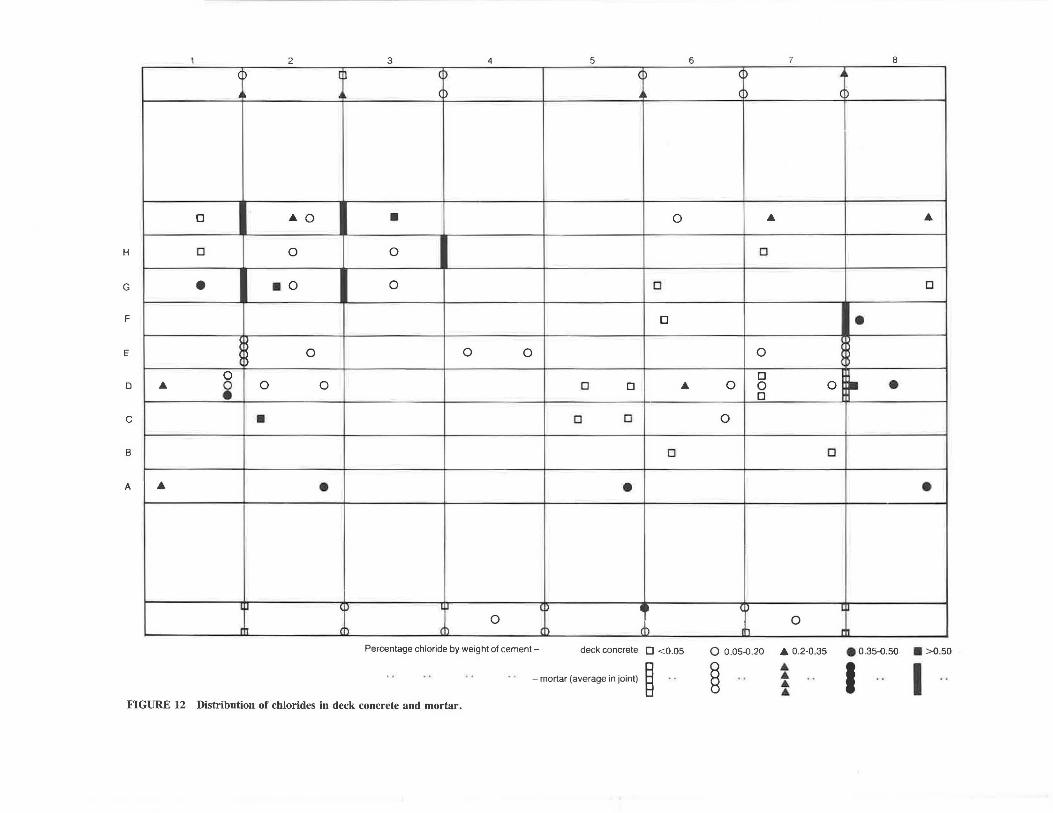
2 3 4 5 6
() [~ 0 () .. ~~ () '
0 I &O • 0
H 0 0 0
G • I •O I 0 0
F 0
H 0 0 0 I l E
I )
0 D & i 0 0 0 0 &
c • 0 0
B D
A & • •
1µ () 1µ ()
" 0 rn /) m () ()
Percentage chloride by weight of cement - deck concrete D <0.05
- mortar (average in joint) ~ FIGURE 12 Distribution of chlorides in deck concrete and mortar.
<D
()
&
0
0
0 0 0
D
0
I )
lh
0 0.05-0.20
~
7
0
& 0.2-0.35
& & & &
8
·~ ()
&
0
•
0 • •
D
•
LU
n
• 0 .35-0.50 • >0.50
I ·· I
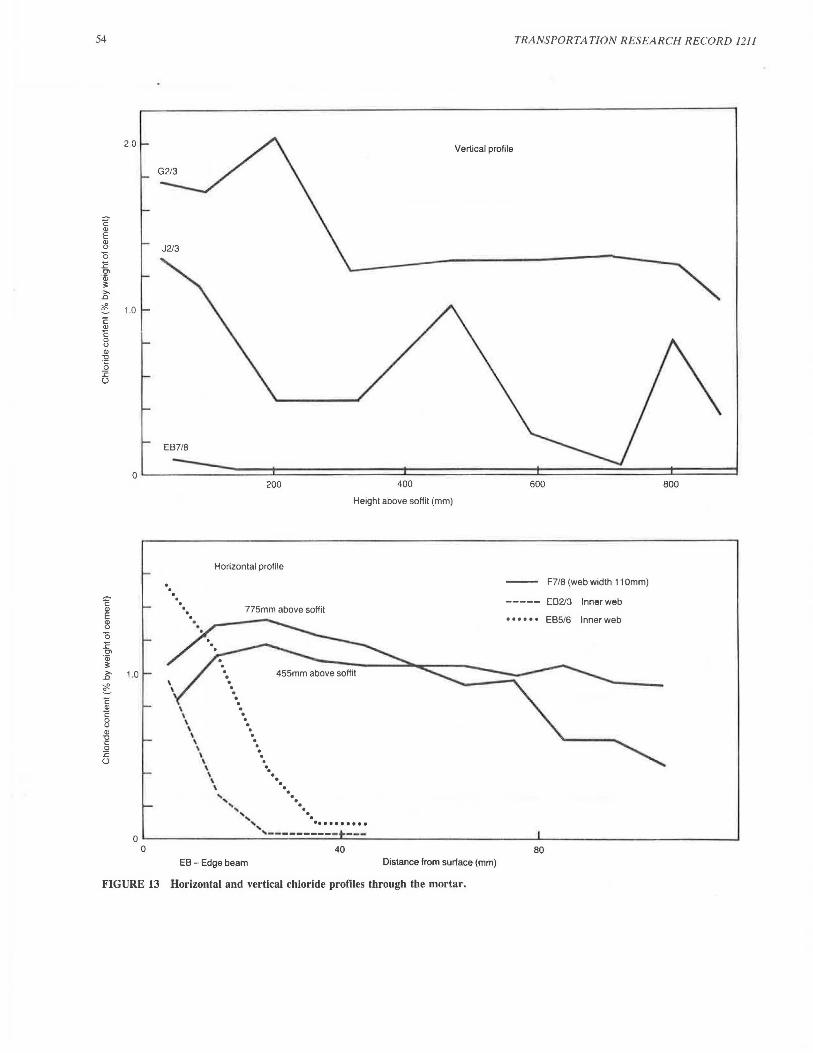
54
c Q)
E Q)
" 0 .E 0\ Qi ~ >-
.D
'#. c Q)
c 0
" Q) "O ·g :c (.)
0 c Q)
E Q)
" 0 .E 0\ ·a; ~ >-
.D
'#. c Q)
c 0
" Q) "O "§ :c (.)
20
1.0
1.0
200 400
Height above soffit (mm)
Horizontal profile
\ \ \ \ \ \ \ \ \ \ \ \ \
775mm above soffit
. . . . . . . . . . . . . . . . . . ' . ............... ·· ...
', ......... . ,__________ ---
Vertical profile
TRANSPORTATION RESEARCH RECORD 1211
600
F7/8 (web width 11 Omm)
[02/3 Inner web
EB5/6 Inner web
800
0'--~~~~~~~~~~~~~--"~~~~~~~~~~~~~~-'-~~~~~~~~~~~~~~--
0 40 80 EB - Edge beam Distance from surface (mm)
FIGURE 13 Horizontal and vertical chloride profiles through the mortar.
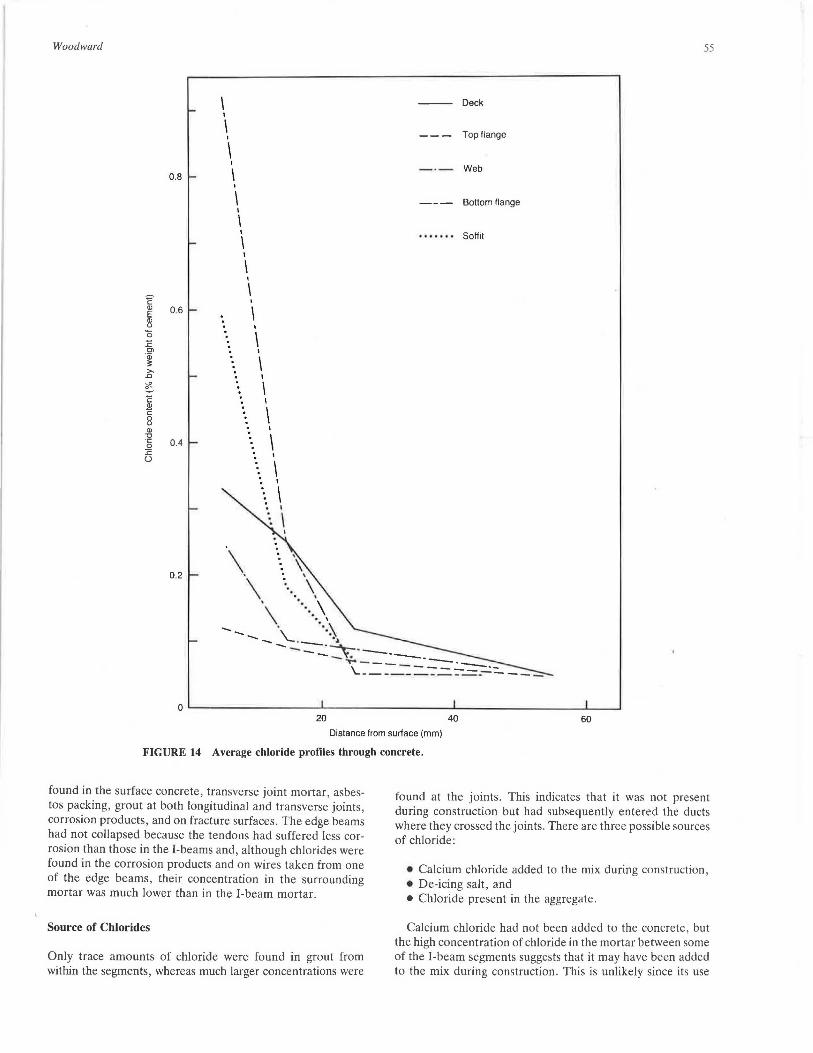
Woodward
c Ql E Ql u 0 .E Cl 'iii ~ >.0
~ c .9l c 0 u Ql
"O ·g :c u
0.8
0.6
0.4
0.2
\ I
\ I
\ I
\ I
I I
\ I
\ I
\ I
\
·. \
\ I
\ I : \
. :
\. \ ,
I
\ \ \ I
\
\ '• \ ..... ' ·.\ ......................... '-·-- · ...
55
Deck
Top flange
- ·- Web
Bottom flange
....... Sottit
..... .:\:" ---- ... ____ ... -- . --.. ___ '-~-=== =--=--=-=---:-·-=... ---
Distance from surface (mm)
FIGURE 14 Average chloride profiles through concrete.
found in the surface concrete, transverse joint mortar, asbes· tos packing, grout at both longitudinal and transverse joints, corrosion products, and on fracture surfaces. The edge beams had not collapsed because the tendons had suffered less cor· rosion than those in the I-beams and, although chlorides were found in the corrosion products and on wires taken from one of the edge beams, their concentration in the surrounding mortar was much lower than in the I-beam mortar.
Source of Chlorides
Only trace amounts of chloride were found in grout from within the segments, whereas much larger concentrations were
found at the joints. This indicates that it was not present during construction but had subsequently entered the ducts where they crossed the joints. There are three possible sources of chloride:
• Calcium chloride added to the mix during construction, • De-icing salt, and • Chloride present in the aggregate.
Calcium chloride had not been added to the concrete, but the high concentration of chloride in the mortar between some of the I-beam segments suggests that it may have been added to the mix during construction. This is unlikely since its use
56
in high-alumina cement is not recommended and would serve no useful purpose.
Chlorides were found over the whole concrete surface, and their concentration decreased with depth from the surface. This shows that they had diffused in after construction and almost certainly originated from de-icing salt that had penetrated from the deck through the longitudinal joints between the beams. The higher concentration measured in the concrete in the inner webs of the edge beams compared with the outer webs suggests that de-icing salt had also passed through the joints between the edge beams and the sidewalk slabs . This percolation of chlorides between the beams accounts for those found in the asbestos packing and grout at transverse joints.
The presence of de-icing salt over the entire concrete surface implies that it must also have diffused into the mortar, and this would have occurred through the webs as well as from above. The horizontal chloride profiles through the inner web of an edge beam mortar joint decreased in concentration with depth from the surface , showing that chlorides had penelraled afler conslruelion. Similar profiles were not found through the I-beam mortar; this may have been because the webs in these joints were thinner than those in the edge beam and chlorides were able to penetrate from both sides.
The mortar in some I-beam joints contained a much higher chloride concentration than the surrounding deck concrete. This could be attributed to differential permeability. There were other joints, however, where the chloride concentration in the mortar was less than surrounding concrete. A possible explanation is that de-icing salt was not the sole source of chlorides. For example, it is possible that dune sand was added to the mix used for the mortar. The evidence is not conclusive, but dune sand was frequently used in the early 1950s, the bridge site is only a few miles from the sea, and the aggregate used for the mortar was found to contain quartz with a few fragments of shell, which is consistent with the use of dune sand.
The chloride concentration in dune sand is very variable depending on its origin and subsequent treatment. Only a small quantity of sand would have been required, and if this had been stored on site for some time, most of the chlorides in the sand at the top of the pile may have been washed away by the rain. Indeed it is known that severe storms occurred at the time of construction. This could account for the wide variations in chloride concentration in the joints. On the other hand, there was no evidence of chlorides in grout from within the segments even where sand had been added, and it is likely that the sand used would have been from the same source as that used for the mortar. Only six pieces of grout containing sand were analyzed, however, and they may not have been a representative sample.
To summarize, while it is possible that dune sand was used, it is almost certain that most of the chlorides originated from de-icing salt.
Effect of Chlorides
Although the presence of chlorides is a major cause of corrosion, it is difficult to quantify their effect. Chloride salts are
TRANSPORT A TJON RESEARCH RECORD 1211
present to some extent in most structural concrete, and much research has been directed at attempting to define a safe threshold value below which the nsk ot corros10n is negligible . Unfortunately, the threshold value is dependent upon a number of factors, including the type of cement, cement content, degree of carbonation, permeability, and the ratio of soluble to insoluble chloride.
Various limits have heen put on allowable chloride concentrations in reinforced concrete. The United Kingdom Specification for Highway Works (11) requires that the total chloride content shall not exceed 0.30 percent by weight of cement, whereas ACI Committee 201 recommended a limit of 0.2 percent (12). The latter figure was based on research done for the Federal Highway Administration (FHWA) and assumed that 75 percent of the chlorides would be water soluble. Limits for prestressed concrete have been more restrictive, and the United Kingdom Specification for Highway Works gives a limit of 0.1 percent.
In practice the greater the chloride concentration, the greater the risk of corrosion. Data from a corroded bridge in the United Kingdom have been analyzed to calculate the number of times corrosion was associated with a given value of chloride concentration (13). It was found that a concentration of 0.2 percent represented a probability of corrosion of less than 10 percent, although it was pointed out that such figures are likely to vary from bridge to bridge and may also vary with age.
The chloride concentration at the level of the steel in the precast units was well below 0.2 percent; this, along with the good quality of the concrete, suggests a low risk of corrosion, consistent with the observations. The isolated cases in which corrosion was observed may have been due to local increases in chloride concentration or pockets of poor-quality concrete. The chloride concentration in grout at the I-beam joints was much higher, ranging from 0.11 percent to 1.91 percent, although 53 percent of the samples tested contained less than 0.3 percent.
The average chloride concentration (by weight of cement) of all samples taken from the surface 10 mm of the precast concrete was 0.31 percent, with a maximum of 1.15 percent. This is less than has been found on many other bridges in the United Kingdom. Vassie (13) has recently performed a survey of the chloride concentration in eight reinforced concrete trunk road bridges after 50 years' service. Samples were drilled from the surface to a depth of 25 mm. The mean chloride concentration in each bridge varied from 0.33 percent to 1.2 percent. If samples had been drilled to a depth of only 10 mm, the concentrations would presumably have been considerably higher. Other investigators have reported chloride concentrations in excess of 5 percent (14).
Factors Contributing to Corrosion
The effect of chlorides on corrosion is illustrated in Figure 15, which shows increasing corrosion as the chloride content in grout adjacent to the tendons increases. There is considerable scatter on these results, and this is partly because the chloride content measured is an average value and the concentration adjacent to the steel may differ from this. In
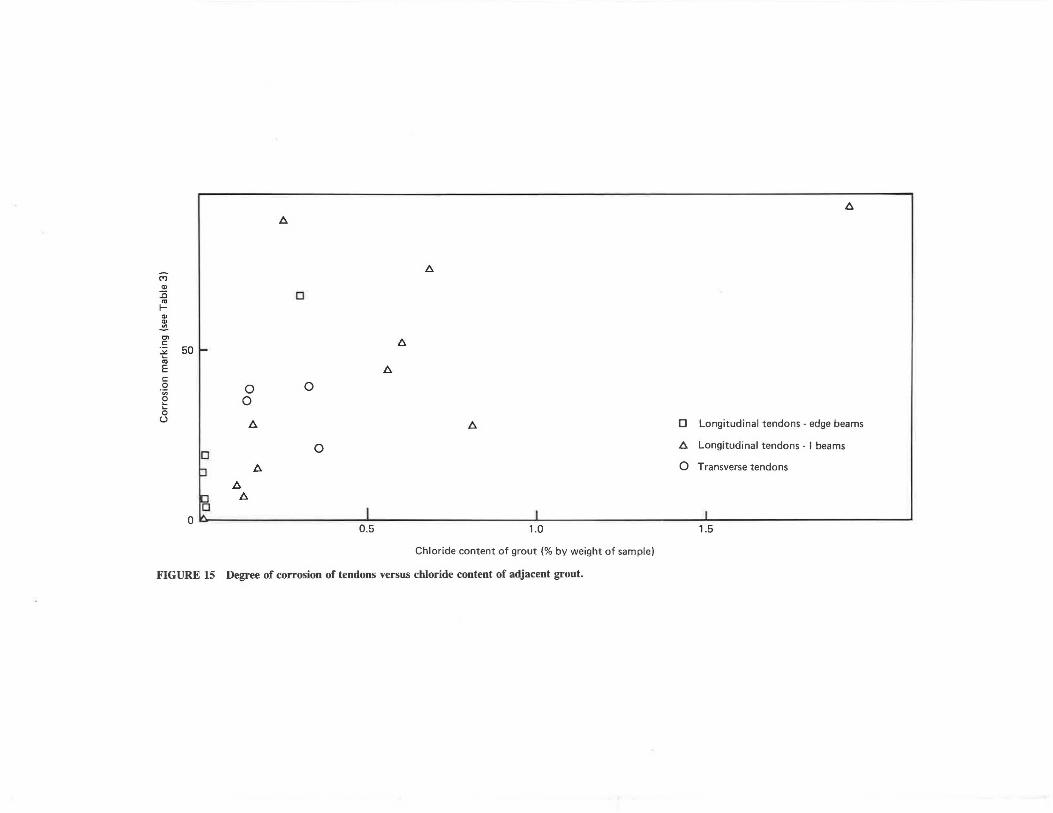
A
A (") ., 1i "'
D I-., ~ Cl c A ~ 50 ....
"' E A c
.Q I e 0 0
0
5 (.) I A A
D 0
~ A
A A
0 I I 0.5 1.0
Chloride content of grout (% by weight of sample)
FIGURE 15 Degree of corrosion of tendons versus chloride content of adjacent grout.
A
D Longitudinal tendons · edge beams
A Longitudinal tendons· I beams
0 Transverse tendons
I 1.5
58
addition, there were numerous other factors that contributed to corrosion, some of which are discussed below:
• The absence of an in situ deck: This makes it possible for moisture (as well as chlorides) to enter the segmental joints and penetrate to the tendons.
• Ineffective waterproofing: The bridge records indicated that a waterproofing layer was applied during construction, but this had not prevented the ingress of chlorides into the concrete. The variation in chloride concentration showed that its performance varied over the deck.
• Inadequate protection at the transverse joints: The tendons were protected by grout, steel, or cardboard sleeves and 40 to 50 mm of mortar. The mortar was well compacted and of reasonable quality, but a 40- to 50-mm covering would not give the same level of protection as good-quality dense concrete. It was between a hundred and a thousand times more permeable, which would make it easier for oxygen and moisture to penetrate to the steel. The use of high-alumina cement may have exacerbated this effect as porosity increases after conversion, although the mortar samples tested were only partially converted. This was illustrated during the vacuum pressure measurements when it was found that it was difficult to maintain a vacuum in ducts containing large voids. This had not been the case during previous work on monolithic beams (15).
• Underdesign: It is probable that the segmental joints had opened under live load, and this may have accelerated further the passage of moisture and oxygen to the steel, especially at midspan.
• Inadequate protection at the longitudinal joints: The squares of asbestos packing were the only protection given to transverse tendons, and these appeared to act as sponges soaking up moisture.
• Carbonation of the grout: Inadequate protection at the joints resulted in carbonation of the outer surface of the grout. Corrosion was usually more severe where tendons were pulled against the sides of the duct and embedded in carbonated grout.
• Poor grouting: The large voids present in some of the transverse ducts allowed corrosion at the joints to extend ;:ilone; the lene;th of the tenrlon
• The damp environment provided by the river beneath the structure.
Condition of Structure-Excluding Corrosion
The structure possessed numerous redeeming features. The concrete in the segments was a good-quality dense material with no serious defects. The mortar in the transverse joints was well compacted. Most longitudinal and some of the transverse ducts were well grouted; indeed, the incidence of voids in the longitudinal ducts examined was less than has been found in more recent structures (15). With the exception of partially grouted transverse ducts, wires from within the segments were in excellent condition. Exposed wires in partially grouted ducts were covered with a layer of cement paste. Surface rust was observed on some wires, but this may have been present since construction. Where cement paste had not
TRANSPORTATION RESEARCH RECORD 1211
adhered to the wires, the exposed steel was often in pristine condition, after more than 30 years in service.
IMPLICATIONS
The absence of visual evidence of corrosion in the form of cracking and spalling at joints adjacent to grouted ducts is of major concern. Evidence of corrosion was not visible because corrosion was localized at the joints. The low level of metal loss and high density of some of the corrosion products (magnetite) would have produced limited expansive forces that must have been accommodated by the surrounding material. The absence of such evidence is consistent with the very localized rust staining on the asbestos packing shown on Figure 8. In partially grouted ducts the corrosion products would not have produced expansive forces. It would therefore appear that routine visual inspection is inadequate for detecting corrosion at joints in segmental bridges. Structures at risk could be identified by checking to determine whether they contain features similar to those on the Ynys-y-Gwas bridge. For example:
• Segmental construction, • Narrow infilled joints between segments, • Absence of a reinforced concrete deck slab, • Transverse stressing, •Location, • Regular winter gritting, and • Date of construction.
Where structures are identified as being at risk, those techniques that can be used to determine whether the tendons are corroding should be ascertained. At present this cannot be done directly, so inspections must take full advantage of available investigatory techniques for assessing the corrosion risk. These include measurement of chloride concentration at and near the joints, load testing to determine whether segments are opening under load, and drilling holes into ducts to observe the condition of the tendons. This latter technique must be used with caution. Other techniques, such as eiectrocfo potenti;:il ;:inrl resistivity smveys, th;it ~;in provicle 11sefol information on reinforced structures are less appropriate for tendons in ducts. They may detect corrosion of adjacent reinforcement, although this would not have been the case at Ynys-y-Gwas. In the longer term, improved inspection and testing techniques are needed (3,16).
To avoid the occurrence of corrosion problems in the future, a greater emphasis must be put on the protection given to prestressing systems in new structures, especially those of segmental construction. In addition more thought needs to be given to designing structures in which the tendons can be inspected.
CONCLUSIONS
The structure collapsed because of corrosion of the tendons where they crossed the joints. Failure occurred when the sectional area of the steel had been reduced to the point where
Woodward
it could no longer carry the imposed load. The bridge had been regularly inspected, but there had been no evidence of deterioration before failure.
Chlorides were the primary cause of corrosion. They were found over the whole concrete surface and in the transverse joint mortar, asbestos packing, grout at both longitudinal and transverse joints, corrosion products, and on fracture surfaces on the tendons. Most chlorides almost certainly originated from de-icing salt that had penetrated through the longitudinal joints between the beams. It had diffused into the mortar, both vertically from the deck and horizontally through the webs. The concentrations in both the concrete and mortar were very variable, however, and the high concentrations throughout some joints indicated that chlorides had been present in the aggregate used for the mortar. The bridge site was near the sea, and dune sand may have been used, although the evidence is not conclusive.
The maximum chloride concentration in the surface concrete was 1.15 percent by weight of cement, and the average was 0.31 percent. This is lower than has been found in other structures in the United Kingdom. In addition to the presence of chlorides, corrosion had been exacerbated by the following:
• Lack of an in situ slab over the beams, • Ineffective waterproofing, • Inadequate protection to the tendons, • Opening of the segments under live load, • Poor workmanship, and • Dampness of the environment over the river.
The concrete in the precast units was a high-strength dense material with a low permeability to water, and the reinforcement in the units was in good condition. Exposed tendons within the segments in partially grouted, longitudinal ducts were covered with a layer of cement paste, and there was no evidence of corrosion. This shows that where protection against corrosion is adequate, post-tensioned concrete can provide long-term durability.
To date no other bridges of similar construction have been identified in the United Kingdom. It is known, however, that there are about a hundred segmental bridges without an in situ deck and possibly many more worldwide. The vulnerability of the tendons to chloride corrosion needs to be assessed. In the longer term, improved inspection and testing techniques for prestressed structures need to be developed.
At present the advantages of quick and efficient construction procedures have led to an increase in the number of segmental bridges being built. The findings reported in this paper, however, illustrate how vulnerable joints in segmental construction can be to salt attack; and this must have implications for modern-day segmental construction. Greater emphasis is needed on the protection given to prestressing systems and the design of structures in which tendons can be inspected.
ACKNOWLEDGMENTS
The author would like to thank H. Lewis and K. Sullivan of West Glamorgan County Council and A. J.C. Gent ofTRRL
59
for their assistance. The author would also like to express gratitude to G. P. Tilly, Head of the Structures Group at TRRL, and G. L. John, County Engineer and Surveyor, and F. W. Williams, Assistant County Engineer, West Glamorgan County Council, for their interest and support in this investigation.
REFERENCES
1. E. W. H. Gifford. Recent Developments in Highway Bridge Design in Hampshire. Proceedings of the Institution for Civil Engineers, 1952, pp. 461-497.
2. K. M. Hurd. Segmental Box Girder Construction. Concrete International, Vol. 7, No. 9, 1986, pp. 19-27.
3. Corrosion of Reinforcement and Prestressing Tendons in Concrete Bridges. Sixth report of the Committee for the period ending 30 June 1985. Standing Committee on Structural Safety, London, England, 1985, pp. 11-12.
4. R. J. Woodward and F. W. Williams. Collapse of Ynys-y-Gwas Bridge, West Glamorgan. Proceedings of the Institution for Civil Engineers, Part 1, 84, Aug. 1988, pp. 46-58.
5. Steel Concrete and Composite Bridges: Specification for Loads. BS5400. Part 2. British Standards Institution, London, England, 1978.
6. Methods of Testing Concrete: Analysis of Hardened Concrete. BS1881. Part 6. British Standards Institution, London, England, 1971.
7. Methods of Testing Concrete: Method of Determination of Density of Hardened Concrete. BS1881. Part 114. British Standards Institution, London, England, 1983.
8. Methods of Testing Concrete: Method of Determination of the Compressive Strength of Concrete Cores. BS1881. Part 120. British Standards Institution, London, England, 1983.
9. Permeability Testing of Concrete-A Review of Methods and Experience: Permeability of Concrete and Its Control. Proc., The Concrete Society, London, England, 1985, pp. 1-68.
10. Methods for Sampling and Testing of Mineral Aggregates, Sands and Fillers. BS812. Part 2. British Standards Institution, London, England, 1975.
11. Specification for Highway Works: Structural Concrete . Part 5. Department of Transport, HMSO, London, England, August 1986.
12. ACI Committee 201. Guide to Durable Concrete. American Concrete Institute, Detroit, Mich., 1977.
13. P. R. V. Vassie. The Chloride Concentration and Resistivity of Eight Reinforced Concrete Bridge Decks After 50 Years Service. Department of Transport TRRL Research Report 93. Transport and Road Research Laboratory, Crowthorne, England, 1987.
14. K. Ambrose. Chloride Contamination of Camsley Lane Viaduct. Construction Repairs & Maintenance, September 1985, pp. 7-9.
15. R. J. Woodward. Conditions Within Ducts in Post-tensioned Concrete Bridges. Department of Transport TRRL Laboratory Report 980. Transport and Road Research Laboratory, Crowthorne, England, 1981.
16. Collapse of Ynys-y-Gwas Bridge, West Glamorgan: Corrosion of Tendons in Prestressed Concrete. Seventh report of the Committee for the two years ending July 1987. Standing Committee on Structural Safety, London, England, 1987, pp. 9-12; 15-16.
Crown copyright. The views expressed in this paper are not necessarily those of the Department of Transport. Extracts from the text may be reproduced, except for commercial purposes, provided the source is acknowledged. The work described in this paper forms part of the program of the United Kingdom Transport and Road Research Laboratory (TRRL), and the paper is published by permission of the Director.
Publication of this paper sponsored by Committee on Corrosion.
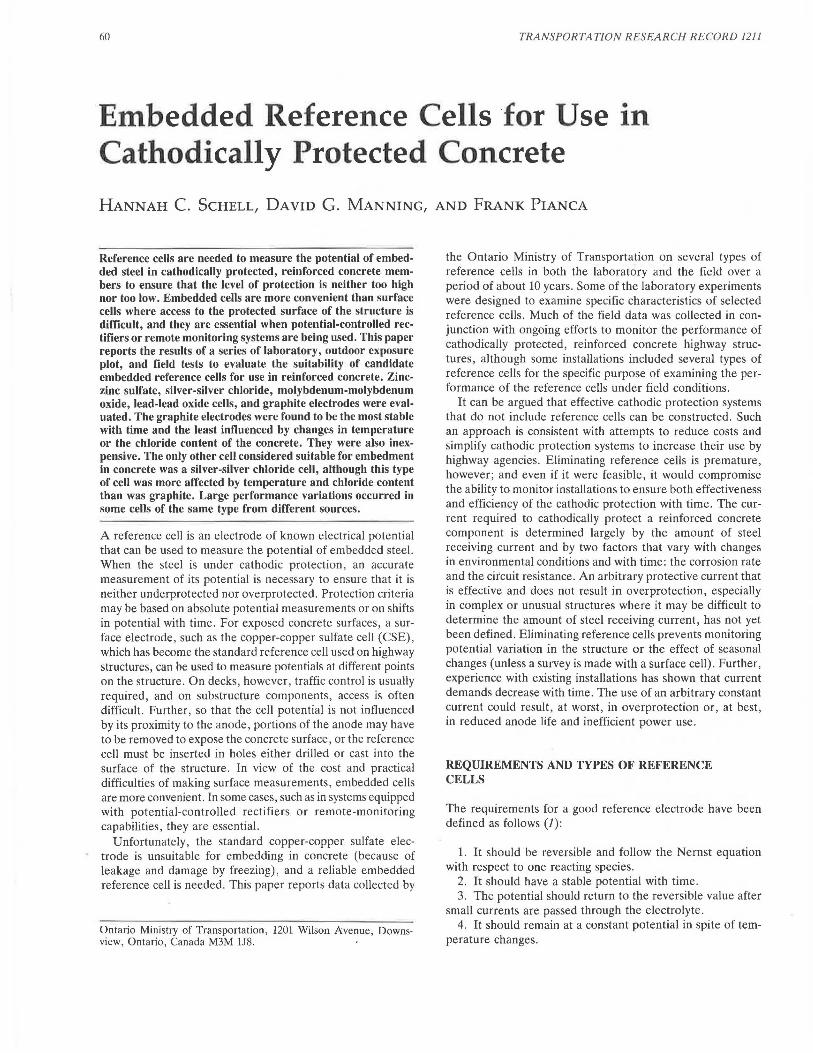
60 TRANSPORTATION RESEARCH RECORD 1211
Embedded Reference Cells 'for Use Cathodically Protected Concrete
• In
HANNAH c. SCHELL, DAVID G. MANNING, AND FRANK PIANCA
Reference cells are needed to measure the potential of embedded steel in cathodically protected, reinforced concrete members to ensure that the level of protection is neither too high nor too low. Embedded cells are more convenient than surface cells where access to the protected surface of the structure is difficult, and they are essential when potential-controlled rectifiers or remote monitoring systems are being used. This paper reports the results of a series of laboratory, outdoor exposure plot, and field tests lo evaluate lhe suitability of candidate embedded reference cells for use in reinforced concrete. Zinczinc sulfate, silver-silver chloride, molybdenum-molybdenum oxide, lead-lead oxide cells, and graphite electrodes were evaluated. The graphite electrodes were found to be the most stable with time and the least influenced by changes in temperature or the chloride content of the concrete. They were also inexpensive. The only other cell considered suitable for embedment in concrete was a silver-silver chloride cell, although this type of cell was more affected by temperature and chloride content than was graphite. Large performance variations occurred in some cells of the same type from different sources.
A reference cell is an electrode of known electrical potential that can be used to measure the potential of embedded steel. When the steel is under cathodic protection, an accurate measurement of its potential is necessary to ensure that it is neither underprotected nor overprotected. Protection criteria may be based on absolute potential measurements or on shifts in potential with time. For exposed concrete surfaces, a surface electrode, such as the copper-copper sulfate cell (CSE), which has become the standard reference cell used on highway structures, can be used to measure potentials ::it c1ifferent points on the structure . On decks, however, traffic control is usually required, and on substructure components, access is often difficult. Further, so that the cell potential is not influenced by its proximity to the anode , portions of the anode may have to be removed to expose the concrete surface, or the reference cell must be inserted in holes either drilled or cast into the surface of the structure. In view of the cost and practical difficulties of making surface measurements , embedded cells are more convenient . In some cases, such as in systems equipped with potential-controlled rectifiers or remote-monitoring capabilities, they are essential.
Unfortunately, the standard copper-copper sulfate electrode is unsuitable for embedding in concrete (because of leakage and damage by freezing), and a reliable embedded reference cell is needed. This paper reports data collected by
Ontario Ministry of Transportation, 1201 Wilson Avenue, Downsview, Ontario , Canada M3M 1J8.
the Ontario Ministry of Transportation on several types of reference cells in both the laboratory and the field over a period of about 10 years. Some of the laboratory experiments were designed to examine specific characteristics of selected reference cells. Much of the field data was collected in conjunction with ongoing efforts to monitor the performance of cathodically protected, reinforced concrete highway structures, although some installations included several types of reference cells for the specific purpose of examining the performance of the reference cells under field conditions.
It can be argued that effective cathodic protection systems that do not include reference cells can be constructed . Such an approach is consistent with attempts to reduce costs and simplify cathodic protection systems to increase their use by highway agencies. Eliminating reference cells is premature, however; and even if it were feasible, it would compromise the ability to monitor installations to ensure both effectiveness and efficiency of the cathodic protection with time. The current required to cathodically protect a reinforced concrete component is determined largely by the amount of steel receiving current and by two factors that vary with changes in environmental conditions and with time : the corrosion rate and the circuit resistance. An arbitrary protective current that is effective and does not result in overprotection, especially in complex or unusual structures where it may be difficult to determine the amount of steel receiving current , has not yet been defined . Eliminating reference cells prevents monitoring potential variation in the structure or the effect of seasonal changes (unless a survey is made with a surface cell). Further, experience with existing installations has shown that current demands decrease with time. The use of an arbitrary constant current could result, at worst, in overprotection or, at best, in reduced anode life and inefficient power use.
REQUIREMENTS AND TYPES OF REFERENCE CELLS
The requirements for a good reference electrode have been defined as follows (1):
l. It should be reversible and follow the Nernst equation with respect to one reacting species.
2. It should have a stable potential with time. 3. The potential should return to the reversible value after
small currents are passed through the electrolyte. 4. It should remain at a constant potential in spite of tem
perature changes.
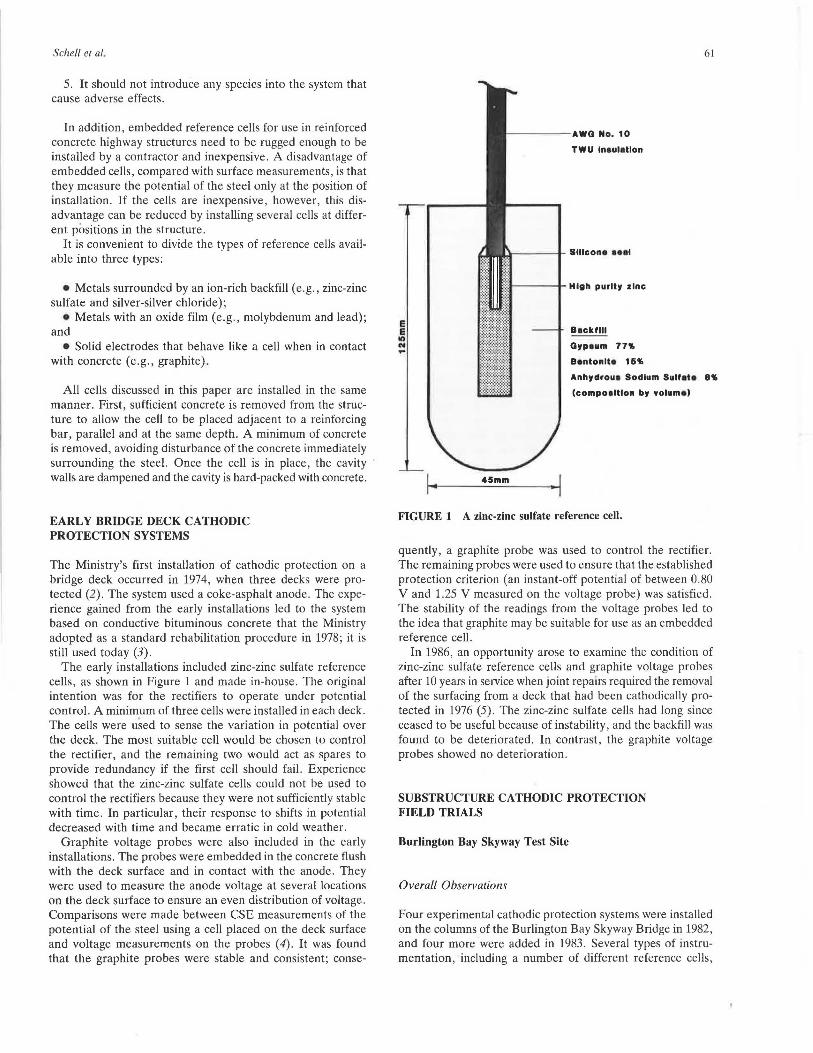
Schell er al.
5. It should not introduce any species into the system that cause adverse effects.
In addition, embedded reference cells for use in reinforced concrete highway structures need to be rugged enough to be installed by a contractor and inexpensive. A disadvantage of embedded cells, compared with surface measurements, is that they measure the potential of the steel only at the position of installation. If the cells are inexpensive, however, this disadvantage can be reduced by installing several cells at different positions in the structure.
It is convenient to divide the types of reference cells available into three types:
• Metals surrounded by an ion-rich backfill (e.g., zinc-zinc sulfate and silver-silver chloride);
•Metals with an oxide film (e.g., molybdenum and lead) ; and
• Solid electrodes that behave like a cell when in contact with concrete (e.g., graphite) .
All cells discussed in this paper are installed in the same manner. First, sufficient concrete is removed from the structure to allow the cell to be placed adjacent to a reinforcing bar, parallel and at the same depth. A minimum of concrete is removed, avoiding disturbance of the concrete immediately surrounding the steel. Once the cell is in place, the cavity walls are dampened and the cavity is hard-packed with concrete.
EARLY BRIDGE DECK CATHODIC PROTECTION SYSTEMS
The Ministry's first installation of cathodic protection on a bridge deck occurred in 1974, when three decks were protected (2). The system used a coke-asphalt anode. The experience gained from the early installations led to the system based on conductive bituminous concrete that the Ministry adopted as a standard rehabilitation procedure in 1978; it is still used today (3).
The early installations included zinc-zinc sulfate reference cells, as shown in Figure 1 and made in-house. The original intention was for the rectifiers to operate under potential control. A minimum of three cells were installed in each deck . The cells were used to sense the variation in potential over the deck. The most suitable cell would be chosen to control the rectifier, and the remaining two would act as spares to provide redundancy if the first cell should fail. Experience showed that the zinc-zinc sulfate cells could not be used to control the rectifiers because they were not sufficiently stable with time. In particular, their response to shifts in potential decreased with time and became erratic in cold weather.
Graphite voltage probes were also included in the early installations. The probes were embedded in the concrete flush with the deck surface and in contact with the anode. They were used to measure the anode voltage at several locations on the deck surface to ensure an even distribution of voltage. Comparisons were made between CSE measurements of the potential of the steel using a cell placed on the deck surface and voltage measurements on the probes ( 4). It was found that the graphite probes were stable and consistent; conse-
e e Ill tot ,..
----- AWG No. 10
TWU lnauletlon
Beckflll
Gyp.um 77'11\
Bentonlte 15'11\
61
Anhydrou• Sodium Sulfet• 8'11\
(compoeltlon by volume)
I· 45mm
FIGURE 1 A zinc-zinc sulfate reference cell.
quently, a graphite probe was used to control the rectifier. The remaining probes were used to ensure that the established protection criterion (an instant-off potential of between 0.80 V and 1.25 V measured on the voltage probe) was satisfied. The stability of the readings from the voltage probes led to the idea that graphite may be suitable for use as an embedded reference cell.
In 1986, an opportunity arose to examine the condition of zinc-zinc sulfate reference cells and graphite voltage probes after 10 years in service when joint repairs required the removal of the surfacing from a deck that had been cathodically protected in 1976 (5). The zinc-zinc sulfate cells had long since ceased to be useful because of instability, and the backfill was found to be deteriorated. In contrast, the graphite voltage probes showed no deterioration.
SUBSTRUCTURE CATHODIC PROTECTION FIELD TRIALS
Burlington Bay Skyway Test Site
Overall Observations
Four experimental cathodic protection systems were installed on the columns of the Burlington Bay Skyway Bridge in 1982, and four more were added in 1983. Several types of instrumentation , including a number of different reference cells,
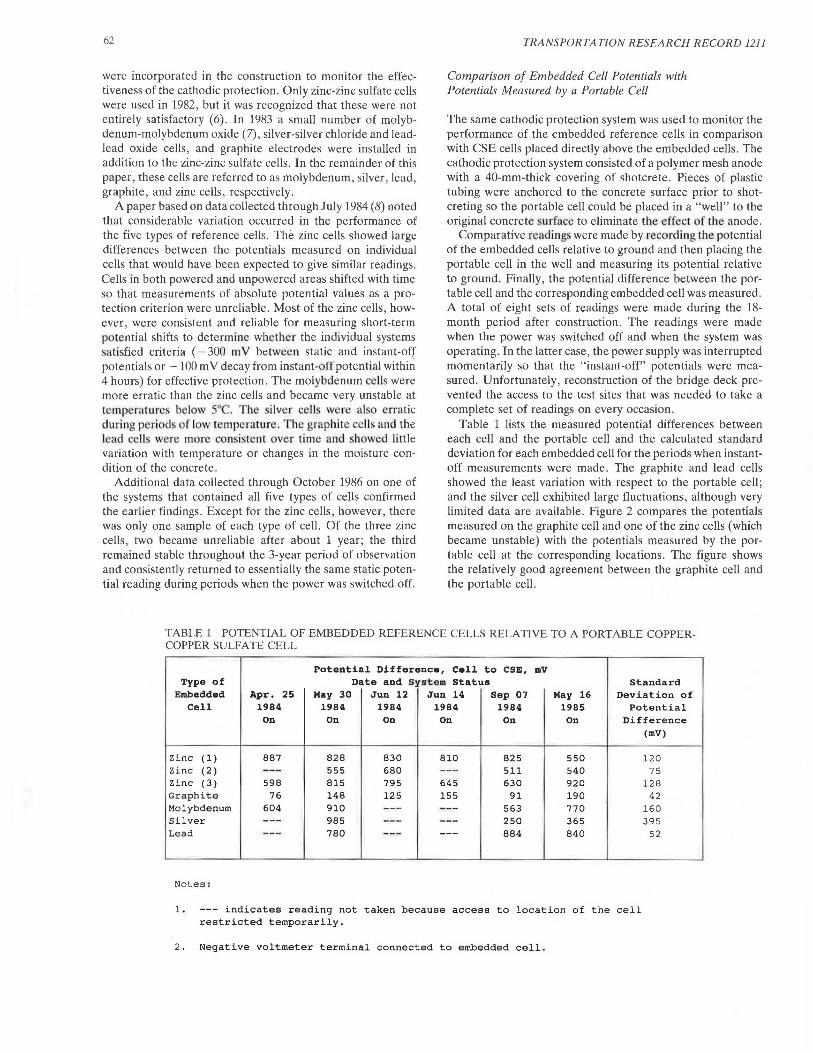
62
were incorporated in the construction to monitor the effectiveness of the cathodic protection. Only zinc-zinc sulfate cells were used in 1982, but it was recognized that these were not entirely satisfactory (6). In 1983 a small number of molybdenum-molybdenum oxide (7), silver-silver chloride and leadlead oxide cells, and graphite electrodes were installed in addition to the zinc-zinc sulfate cells. In the remainder of this paper, these cells are referred to as molybdenum, silver, lead, graphite, and zinc cells, respectively.
A paper based on data collected through July 1984 (8) noted that considerable variation occurred in the performance of the five types of reference cells. The zinc cells showed large differences between the potentials measured on individual cells that would have been expected to give similar readings. Cells in both powered and unpowered areas shifted with time so that measurements of absolute potential values as a protection criterion were unreliable. Most of the zinc cells, however, were consistent and reliable for measuring short-term potential shifts to determine whether the individual systems satisfied criteria ( - 300 m V between static and instant-off potentials or -100 m V decay from instant-off potential within 4 hours) for effective protection. The molybdenum cells were more erratic than the zinc cells and became very unstable at temperature below 5° . he ilve r cell. were also erratic during period of low temperature. be graphite cells and the lead cell were more consistent over time and h wed little variation with temperature or changes in the moisture condition of the concrete.
Additional data collected through October 1986 on one of the systems that contained all five types of cells confirmed the earlier findings. Except for the zinc cells, however, there was only one sample of each type of cell. Of the three zinc cells, two became unreliable after about 1 year ; the third remained stable throughout the 3-year period of observation and consistently returned to essentially the same static potential reading during periods when the power was switched off.
TRANSPORTATION RESEARCH RECORD 1211
Comparison of Embedded Cell Potentials with Potentials Measured by a Portable Cell
The same cathodic protection system was used to monitor the performance of the embedded reference cells in comparison with CSE cells placed directly above the embedded cells . The cathodic protection system consisted of a polymer mesh anode with a 40-mm-thick covering of shotcrete. Pieces of plastic tubing were anchored to the concrete surface prior to shotcreting so the portable cell could be placed in a "well" to the original concrete surface to eliminate the effect of the anode.
Comparative readings were made by recording the potential of the embedded cells relative to ground and then placing the portable cell in the well and measuring its potential relative to ground. Finally, the potential difference between the portable cell and the corresponding embedded cell was measured. A total of eight sets of readings were made during the 18-month period after construction. The readings were made when the power was switched off and when the system was operating. In the latter case, the power supply was interrupted momentarily so that the "instant-off" potentials were measured. Unfortunately , reconstruction of the bridge deck prevented the access to the test sites that was needed to take a complete set of readings on every occasion.
Table 1 lists the measured potential differences between each cell and the portable cell and the calculated standard deviation for each embedded cell for the periods when instantoff measurements were made . The graphite and lead cells showed the least variation with respect to the portable cell; and the silver cell exhibited large fluctuations, although very limited data are available. Figure 2 compares the potentials measured on the graphite cell and one of the zinc cells (which became unstable) with the potentials measured by the portable cell at the corresponding locations. The figure shows the relatively good agreement between the graphite cell and the portable cell.
TABLE 1 POTENTIAL OF EMBEDDED REFERENCE CELLS RELATIVE TO A PORTABLE COPPERCOPPER SULFATE CELL
Potential Difference, Cell to CSE, mV Type of Date and system status Standard
Embedded Apr. 25 May 30 Jun 12 Jun 14 Sep 07 May 16 Deviation of Cell 1984 1984 1984 1984 1984 1985 Potential
On On On On On On Difference (mV)
Zinc (1) 887 828 830 810 825 550 120 Zinc ( 2) --- 555 680 - -- 511 540 75 Zinc (3) 598 815 795 645 630 920 128 Graphite 76 148 125 155 91 190 42 Molybdenum 604 910 --- --- 563 770 160 Silver --- 985 --·- --- 250 365 395 Lead --- 780 --- --- 884 8 40 52
Notes:
1. indicates reading not taken because access to location of t he c e ll restricted temporarily.
2 . Negative voltmeter terminal connected to embedded cell .
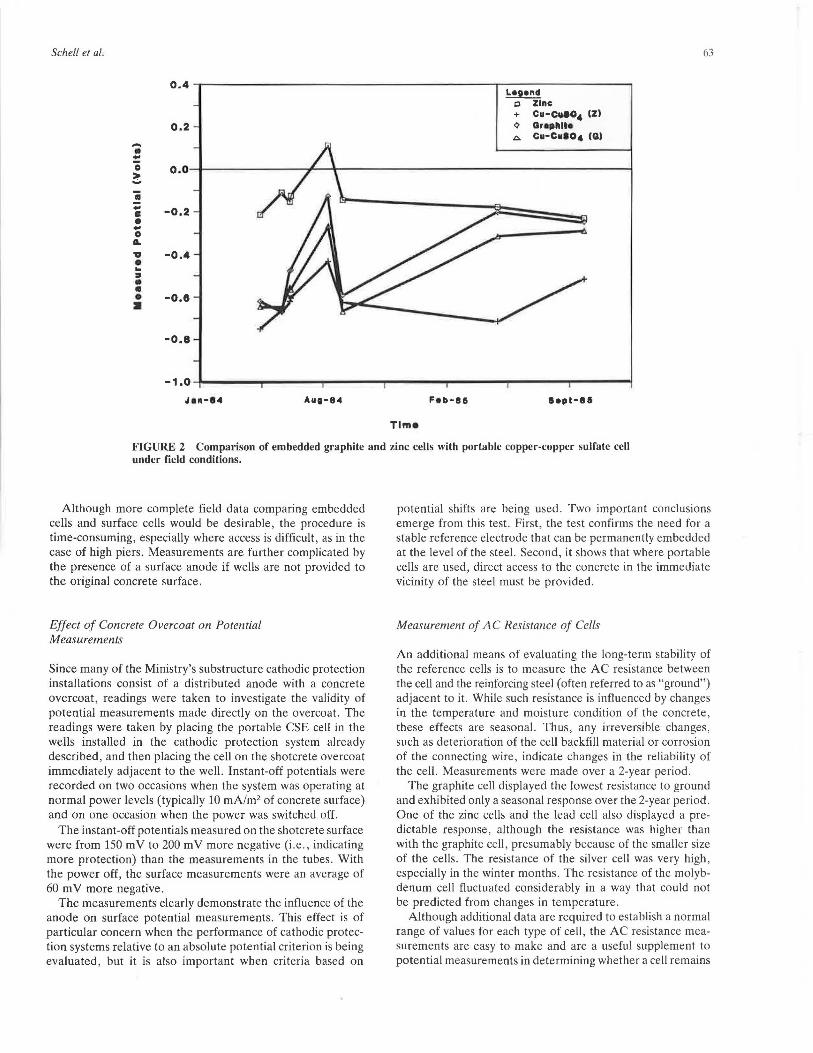
Schell et al.
0.4
0.2
-• :: 0 o.o ? Ill .. -0.2 t:: • .. 0 a. ,, -0.4 • .. :::i • Ill
• -0.8 :I
-0.8
-1.0
.l•n-14 Aug-14 Feb-1111
Time
Legend c Zinc + cu-Cd04 (ZI f:/ Graplllt• o. Cu-Cu804 (G)
lapt-1111
63
FIGURE 2 Comparison of embedded graphite and zinc cells with portable copper-copper sulfate cell under field conditions.
Although more complete field data comparing embedded cells and surface cells would be desirable, the procedure is time-consuming, especially where access is difficult, as in the case of high piers. Measurements are further complicated by the presence of a surface anode if wells are not provided to the original concrete surface.
Effect of Concrete Overcoat on Potential Measurements
Since many of the Ministry's substructure cathodic protection installations consist of a distributed anode with a concrete overcoat, readings were taken to investigate the validity of potential measurements made directly on the overcoat. The readings were taken by placing the portable CSE cell in the wells installed in the cathodic protection system already described, and then placing the cell on the shotcrete overcoat immediately adjacent to the well. Instant-off potentials were recorded on two occasions when the system was operating at normal power levels (typically 10 mA/m2 of concrete surface) and on one occasion when the power was switched off.
The instant-off potentials measured on the shotcrete surface were from 150 mV to 200 mV more negative (i.e., indicating more protection) than the measurements in the tubes. With the power off, the surface measurements were an average of 60 m V more negative.
The measurements clearly demonstrate the influence of the anode on surface potential measurements. This effect is of particular concern when the performance of cathodic protection systems relative to an absolute potential criterion is being evaluated, but it is also important when criteria based on
potential shifts are being used. Two important conclusions emerge from this test. First, the test confirms the need for a stable reference electrode that can be permanently embedded at the level of the steel. Second, it shows that where portable cells are used, direct access to the concrete in the immediate vicinity of the steel must be provided.
Measurement of AC Resistance of Cells
An additional means of evaluating the long-term stability of the reference cells is to measure the AC resistance between the cell and the reinforcing steel (often referred to as "ground") adjacent to it. While such resistance is influenced by changes in the temperature and moisture condition of the concrete, these effects are seasonal. Thus, any irreversible changes, such as deterioration of the cell backfill material or corrosion of the connecting wire, indicate changes in the reliability of the cell. Measurements were made over a 2-year period.
The graphite cell displayed the lowest resistance to ground and exhibited only a seasonal response over the 2-year period. One of the zinc cells and the lead cell also displayed a predictable response, although the resistance was higher than with the graphite cell , presumably because of the smaller size of the cells. The resistance of the silver cell was very high, especially in the winter months. The resistance of the molybdenum cell fluctuated considerably in a way that could not be predicted from changes in temperature.
Although additional data are required to establish a normal range of values for each type of cell, the AC resistance measurements are easy to make and are a useful supplement to potential measurements in determining whether a cell remains
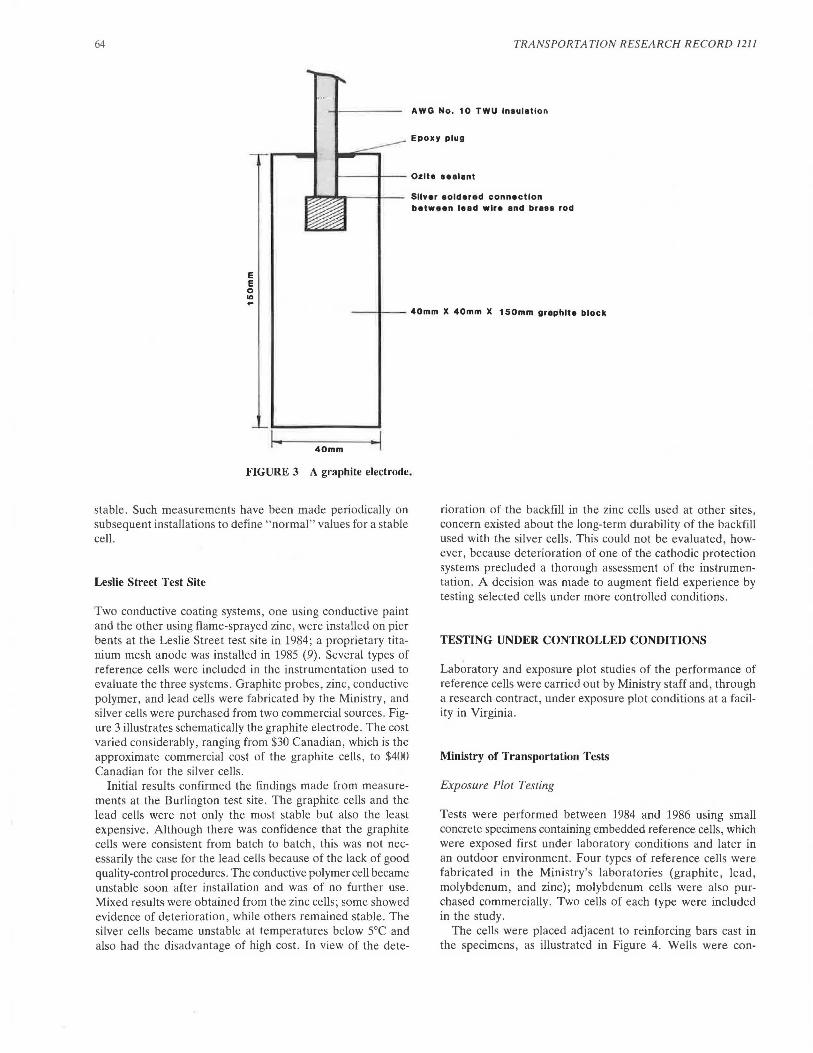
64 TRANSPORTATION RESEARCH RECORD 1211
AWG No. 1 O TWU insulation
Epoxy plug
~,.,.~---+-- Sliver aoldara d connection
E E 0 Ill ...
batwaan laad wlra and braes rod
_ __,...____ 40mm X 40mm X 1 SOmm graphlta block
1 ... 40mm --1
FIGURE 3 A graphite electrode.
stable. Such measurements have been made periodically on subsequent installations to define " normal" values for a stable cell.
Leslie Street Test Site
Two conductive coating systems, one using conductive paint and the other using flame-sprayed zinc, were installed on pier bents at the Leslie Street test site in 1984; a proprietary titanium mesh anode was installed in 1985 (9). Several types of reference cells were included in the instrumentation used to evaluate the three systems. Graphite probes, zinc , conductive polymer, and lead cells were fabricated by the Ministry, and silver cells were purchased from two commercial sources. Figure 3 illustrates schematically the graphite electrode. The cost varied considerably, ranging from $30 Canadian, which is the approximate commercial cost of the graphite cells, to $400 Canadian for the silver cells.
Initial results confirmed the findings made from measurements at the Burlington test site. The graphite cells and the lead cells were not only the most stable but also the least expensive. Although there was confidence that the graphite cells were consistent from batch to batch, this was not necessarily the case for the lead cells because of the lack of good quality-control procedures. The conductive polymer cell became unstable soon after installation and was of no further use. Mixed results were obtained from the zinc cells; some showed evidence of deterioration, while others remained stable. The silver cells became unstable at temperatures below 5°C and also had the disadvantage of high cost. In view of the dete-
rioration of the backfill in the zinc cells used at other sites, concern existed about the long-term durability of the backfill used with the silver cells. This could not be evaluated, however, because deterioration of one of the cathodic protection systems precluded a thorough assessment of the instrumentation. A decision was made to augment field experience by testing selected cells under more controlled conditions.
TESTING UNDER CONTROLLED CONDITIONS
Laboratory and exposure plot studies of the performance of reference cells were carried out by Ministry staff and, through a research contract , under exposure plot conditions at a facility in Virginia.
Ministry of Transportation Tests
Exposure Plot Testing
Tests were performed between 1984 and 1986 using small concrete specimens containing embedded reference cells, which were exposed first under laboratory conditions and later in an outdoor environment. Four types of reference cells were fabricated in the Ministry 's laboratories (graphite, lead, molybdenum, and zinc); molybdenum cells were also purchased commercially. Two cells of each type were included in the study.
The cells were placed adjacent to reinforcing bars cast in the specimens, as illustrated in Figure 4. Wells were con-
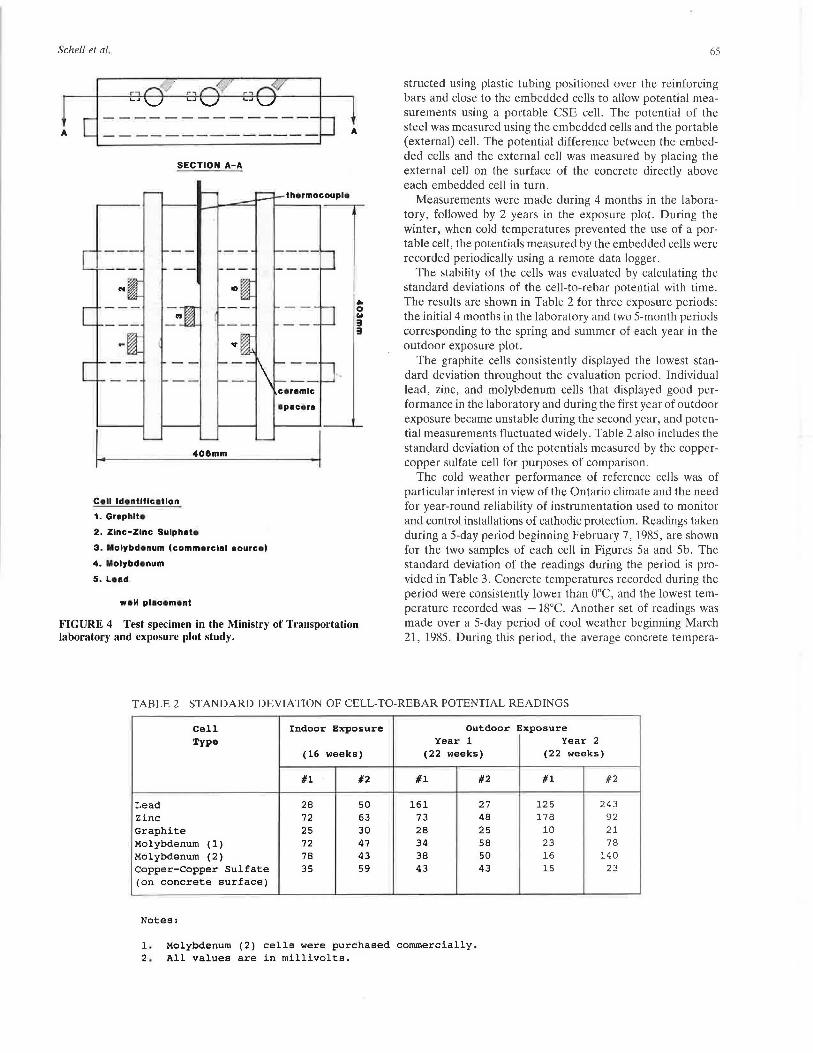
Schell et al.
A
SECTION A-A
..,
1. 406mm
Ce ll Identification
1. Grephlt•
2. Zinc-Zinc Sulph•t•
3. Molybdenum (commerclal eource )
4. Molybd• num
s. Le ed
w• ll pl• c• m• nt
thermocouple
• pacere
. I
1 A
• 0 w :II :II
FIGURE 4 Test specimen in the Ministry of Transportation laboratory and exposure plot study.
65
structed using plastic tubing positioned over the reinforcing bars and close to the embedded cells to allow potential measurements using a portable CSE cell. The potential of the steel was measured using the embedded cells and the portable (external) cell. The potential difference between the embedded cells and the external cell was measured by placing the external cell on the surface of the concrete directly above each embedded cell in turn.
Measurements were made during 4 months in the laboratory, followed by 2 years in the exposure plot. During the winter, when cold temperatures prevented the use of a portable cell, the potentials measured by the embedded cells were recorded periodically using a remote data logger.
The stability of the cells was evaluated by calculating the standard deviations of the cell-to-rebar potential with time. The results are shown in Table 2 for three exposure periods: the initial 4 months in the laboratory and two 5-month periods corresponding to the spring and summer of each year in the outdoor exposure plot.
The graphite cells consistently displayed the lowest standard deviation throughout the evaluation period. Individual lead, zinc, and molybdenum cells that displayed good performance in the laboratory and during the first year of outdoor exposure became unstable during the second year, and potential measurements fluctuated widely. Table 2 also includes the standard deviation of the potentials measured by the coppercopper sulfate cell for purposes of comparison.
The cold weather performance of reference cells was of particular interest in view of the Ontario climate and the need for year-round reliability of instrumentation used to monitor and control installations of cathodic protection. Readings taken during a 5-day period beginning February 7, 1985, are shown for the two samples of each cell in Figures 5a and 5b. The standard deviation of the readings during the period is provided in Table 3. Concrete temperatures recorded during the period were consistently lower than 0°C, and the lowest temperature recorded was - 18°C. Another set of readings was made over a 5-day period of cool weather beginning March 21, 1985. During this period, the average concrete tempera-
TABLE 2 STANDARD DEVIATION OF CELL-TO-REBAR POTENTIAL READINGS
Cell Indoor Exposure Outdoor Type Year 1
(16 weeks) (22 weeks)
#1 #2 #1 #2
Lead 28 50 161 27 Zinc 72 63 73 48 Graphite 25 30 28 25 Molybdenum (l) 72 47 34 58 Molybdenum (2) 78 43 38 50 Copper-Copper Sulfate 35 59 43 43 (on concrete surface)
Notes:
1 . Molybdenum (2) cells were purchased commercially . 2 - All values are in millivolts.
Exposure Year 2
(22 weeks)
#1 #2
125 243 178 92
10 21 23 78 16 140 15 23
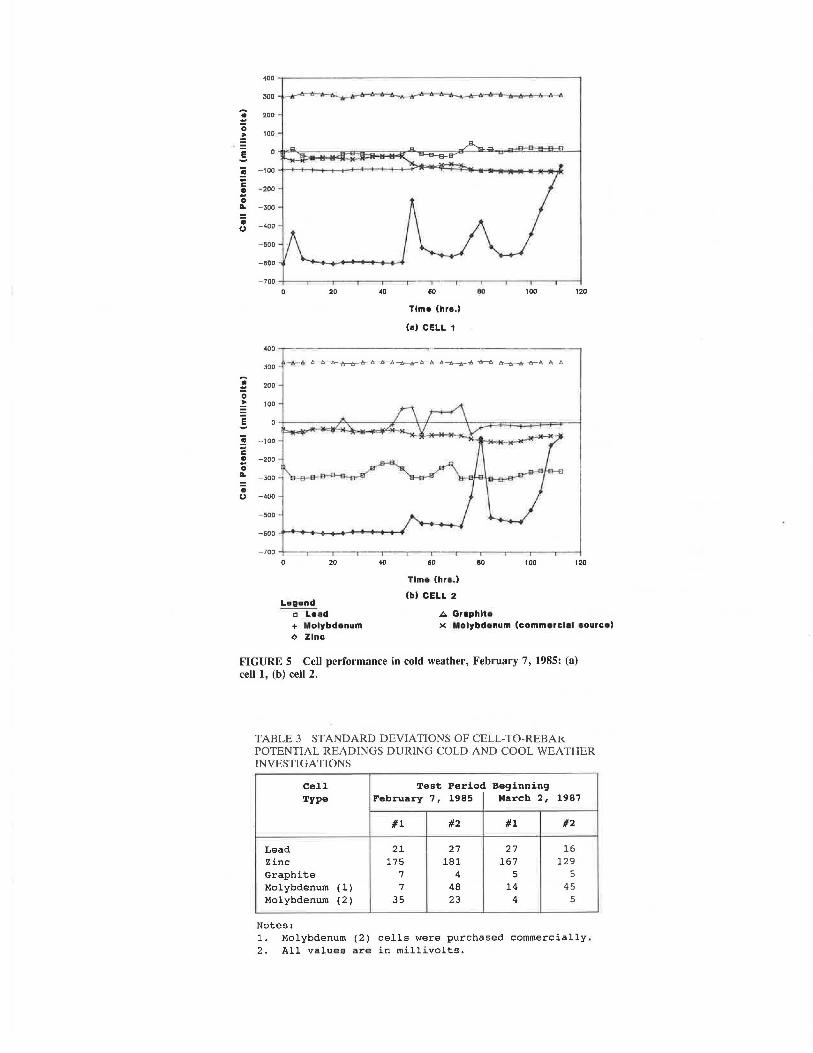
~ 0
~ · = ! ! c ! 0 II.
i u
: 0
~ E
~ " ! 0 II.
i u
200
100
20 40 60 80 100 120
Time (hre.)
(11) CELL 1
400 ~~~~~~~~~~~~ ~~~~~~~~~~~~
300 ~· /\ b--~ tr-lr-ll-tr--tr-b--A fl~~ ~A A b.
200
100
-100
-200
-300
-400
-500
-600 ................. _ ........ _ ............ __ __
Le gend ----c-Lied
20
+ Molybdenum <> Zinc
40 60
Time (hre.)
(b) CELL 2
80
A Graphite
100 120
x Molybdenum (commercl•I -&ource)
FIGURES Cell performance in cold weather, February 7, 1985: (a) cell 1, (b) cell 2.
TABLE 3 STANDARD DEVIATIONS OF CELL-TO-REBAK POTENTIAL READINGS DURING COLD AND COOL WEATHER INVESTIGATIONS
Cell Test Period Beginning Type February 7, 1985 March 2, 1987
#1 #2 #1 #2
Lead 21 27 27 16 Zinc 175 181 167 129 Graphite 7 4 5 5 Molybdenum (l) 7 48 14 45 Molybdenum (2) 35 23 4 5
Notes: 1. Molybdenum (2) cells were purchased commercially. 2. All values are in millivolts.
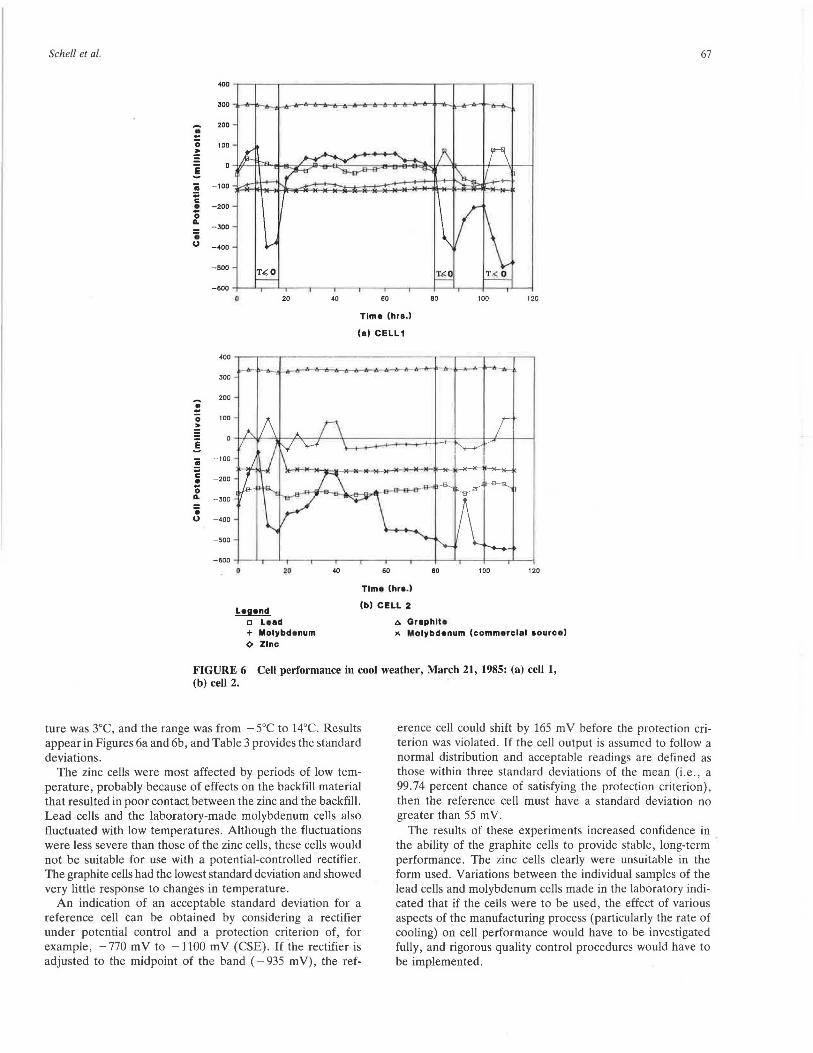
Schell et al. 67
400
300
~ 200
0 100
E ! ~
-100
c: • -200
0 II.
-300
'i u -400
-~00
-600
20 40 60 80 100 120
Tim• (hre .)
(e) CELL1
~ 0
" ! ~ c: • 0 II.
'i u
20 40 60 80 100 120
Legend
Tim• (hre.)
(b) CELL 2
c Leed + Molybdenum <> Zinc
A Graphite " Molybdenum (commerclel 1ource)
FIGURE 6 Cell performance in cool weather, March 21, 1985: (a) cell 1, (b) cell 2.
ture was 3°C, and the range was from - 5°C to 14°C. Results appear in Figures 6a and 6b, and Table 3 provides the standard deviations.
The zinc cells were most affected by periods of low temperature, probably because of effects on the backfill material that resulted in poor contact between the zinc and the backfill. Lead cells and the laboratory-made molybdenum cells also fluctuated with low temperatures. Although the fluctuations were less severe than those of the zinc cells, these cells would not be suitable for use with a potential-controlled rectifier. The graphite cells had the lowest standard deviation and showed very little response to changes in temperature.
An indication of an acceptable standard deviation for a reference cell can be obtained by considering a rectifier under potential control and a protection criterion of, for example, -770 mV to -1100 mV (CSE). If the rectifier is adjusted to the midpoint of the band ( - 935 m V), the ref-
erence cell could shift by 165 m V before the protection criterion was violated. If the cell output is assumed to follow a normal distribution and acceptable readings are defined as those within three standard deviations of the mean (i.e., a 99.74 percent chance of satisfying the protection criterion), then the reference cell must have a standard deviation no greater than 55 mV.
The results of these experiments increased confidence in the ability of the graphite cells to provide stable, long-term performance. The zinc cells clearly were unsuitable in the form used. Variations between the individual samples of the lead cells and molybdenum cells made in the laboratory indicated that if the cells were to be used, the effect of various aspects of the manufacturing process (particularly the rate of cooling) on cell performance would have to be investigated fully, and rigorous quality control procedures would have to be implemented.
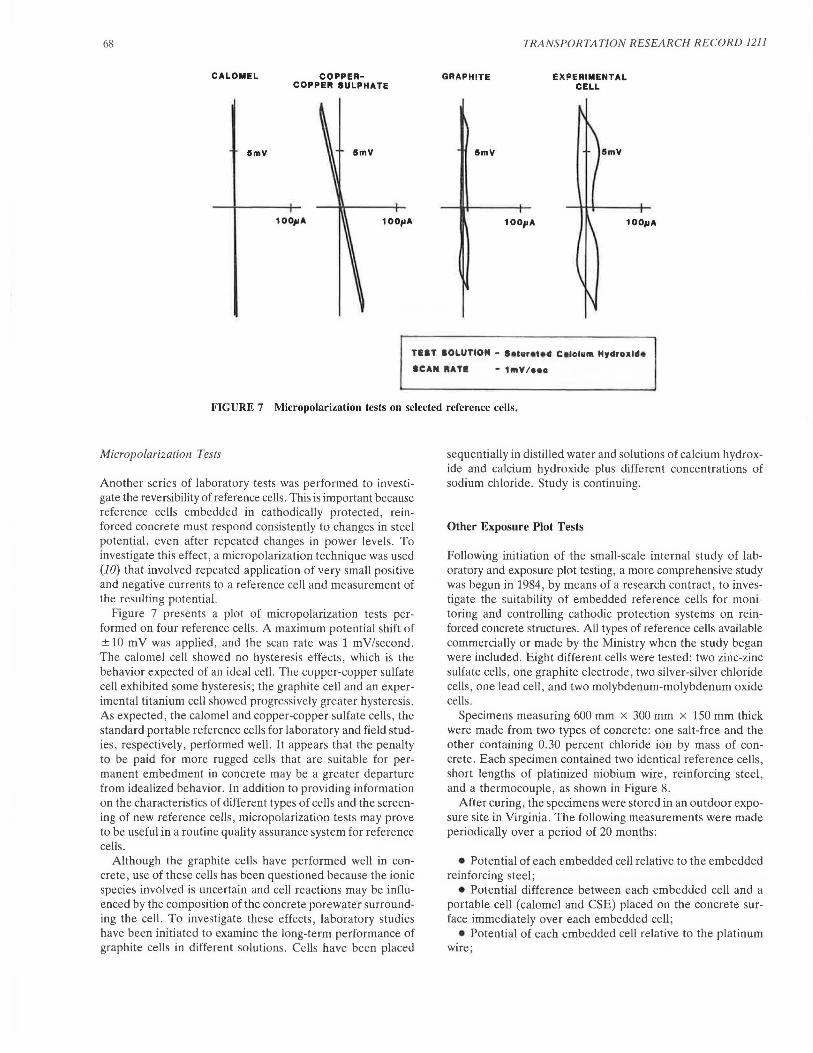
68
CALOMEL
5mV
COPPERCOPPER SULPHATE
5mV
100f1A
GRAPHITE
5mV
TRANSPORTATION RESEARCH RECORD 1211
1 OOpA
EXPERIMENTAL CELL
100pA
TEST SOLUTION - Saturat•cl C•lolum HJclroJlld•
ICAlt RATI! - 1mV/Hc
FIGURE 7 Micropolarization tests on selected reference cells.
Micropolarization Tests
Another series of laboratory tests was performed to investigate the reversibility of reference cells. This is important because reference cells embedded in cathodically protected, reinforced concrete must respond consistently to changes in steel potential, even after repeated changes in power levels . To investigate this effect, a micropolarization technique was used (10) that involved repeated application of very small positive and negative currents to a reference cell and measurement of the resulting pntential.
Figure 7 presents a plot of micropolarization tests performed on four reference cells. A maximum potential shift of ± 10 mV was applied, and the scan rate was 1 mV/second. The calomel cell showed no hysteresis effects, which is the behavior expected of an ideal cell. The rnppe1-rnpper sulfate cell exhibited some hysteresis; the graphite cell and an experimental titanium cell showed progressively greater hysteresis. As expected, the calomel and copper-copper sulfate cells, the standard portable reference cells for laboratory and field studies , respectively, performed well. It appears that the penalty to be paid for more rugged cells that are suitable for permanent embedment in concrete may be a greater departure from idealized behavior. In addition to providing information on the characteristics of different types of cells and the screening of new reference cells, micropolarization tests may prove to be useful in a routine quality assurance system for reference cells.
Although the graphite cells have performed well in concrete , use of these cells has been questioned because the ionic species involved is uncertain and cell reactions may be influenced by the composition of the concrete porewater surrounding the cell. To investigate these effects , laboratory studies have been initiated to examine the long-term performance of graphite cells in different solutions. Cells have been placed
sequentially in distilled water and solutions of calcium hydroxide and calcium hydroxide plus different concentrations of sodium chloride. Study is continuing.
Other Exposure Plot Tests
Following initiation of the small-scale internal study of laboratory and exposure plot testing, a more comprehensive study was begun in 1984, by means of a research contract, to investigate the suitability of embedded reference cells for moni toring and controlling cathodic protection systems on reinforced concrete structures. All types of reference cells available commercially or made by the Ministry when the study began were included. Eight different cells were tested : two zinc-zinc sulfate cells, one graphite electrode, two silver-silver chloride cells , one lead cell , and two molybdenum-molybdenum oxide cells.
Specimens measuring 600 mm x 300 mm x 150 mm thick were made from two types of concrete: one salt-free and the other containing 0.30 percent chloride ion by mass of concrete. Each specimen contained two identical reference cells, short lengths of platinized niobium wire , reinforcing steel , and a thermocouple, as shown in Figure 8.
After curing, the specimens were stored in an outdoor exposure site in Virginia. The following measurements were made periodically over a period of 20 months:
• Potential of each embedded cell relative to the embedded reinforcing steel ;
• Potential difference between each embedded cell and a portable cell (calomel and CSE) placed on the concrete surface immediately over each embedded cell;
• Potential of each embedded cell relative to the platinum wire;
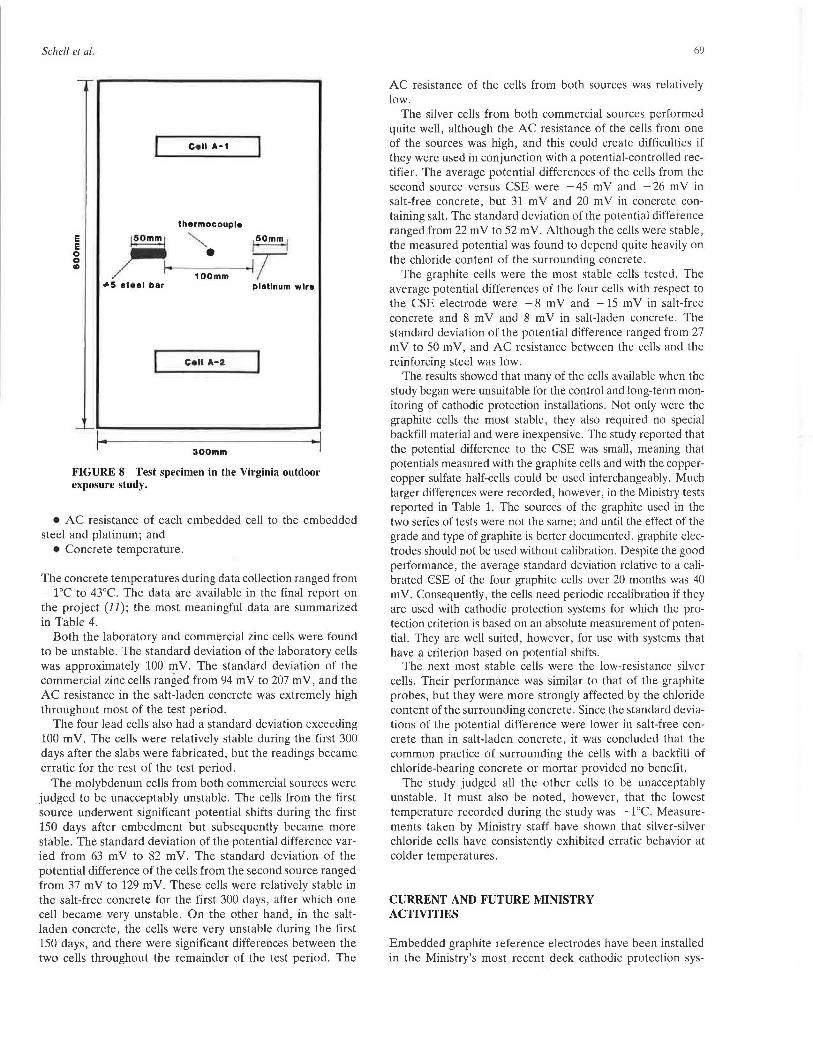
Schell el al.
Cell A-1
thermocouple
E
ri ""' 1somm l
E 0 •
~ 0
I· <O
100mm +5 steel bar platlnum wire
Cell A•2
, .. 300mm
FIGURE 8 Test specimen in the Virginia outdoor exposure study.
• AC resistance of each embedded cell to the embedded steel and platinum; and
• Concrete temperature.
The concrete temperatures during data collection ranged from -1°C to 43°C. The data are available in the final report on the project (11); the most meaningful data are summarized in Table 4.
Both the laboratory and commercial zinc cells were found to be unstable. The standard deviation of the laboratory cells was approximately 100 mV. The standard deviation of the commercial zinc cells ranged from 94 m V to 207 m V, and the AC resistance in the salt-laden concrete was extremely high throughout most of the test period.
The four lead cells also had a standard deviation exceeding 100 m V. The cells were relatively stable during the first 300 days after the slabs were fabricated, but the readings became erratic for the rest of the test period.
The molybdenum cells from both commercial sources were judged to be unacceptably unstable. The cells from the first source underwent significant potential shifts during the first 150 days after embedment but subsequently became more stable. The standard deviation of the potential difference varied from 63 mV to 82 mV. The standard deviation of the potential difference of the cells from the second source ranged from 37 mV to 129 mV. These cells were relatively stable in the salt-free concrete for the first 300 days, after which one cell became very unstable. On the other hand, in the saltladen concrete, the cells were very unstable during the first 150 days, and there were significant differences between the two cells throughout the remainder of the test period. The
69
AC resistance of the cells from both sources was relatively low.
The silver cells from both commercial sources performed quite well, although the AC resistance of the cells from one of the sources was high, and this could create difficulties if they were used in conjunction with a potential-controlled rectifier. The average potential differences of the cells from the second source versus CSE were - 45 m V and - 26 m V in salt-free concrete, but 31 mV and 20 mV in concrete containing salt. The standard deviation of the potential difference ranged from 22 mV to 52 mV. Although the cells were stable, the measured potential was found to depend quite heavily on the chloride content of the surrounding concrete.
The graphite cells were the most stable cells tested. The average potential differences of the four cells with respect to the CSE electrode were - 8 m V and -15 m V in salt-free concrete and 8 mV and 8 mV in salt-laden concrete. The standard deviation of the potential difference ranged from 27 mV to 50 mV, and AC resistance between the cells and the reinforcing steel was low.
The results showed that many of the cells available when the study began were unsuitable for the control and long-term monitoring of cathodic protection installations. Not only were the graphite cells the most stable, they also required no special backfill material and were inexpensive. The study reported that the potential difference to the CSE was small, meaning that potentials measured with the graphite cells and with the coppercopper sulfate half-cells could be used interchangeably. Much larger differences were recorded, however, in the Ministry tests reported in Table 1. The sources of the graphite used in the two series of tests were not the same; and until the effect of the grade and type of graphite is better documented, graphite electrodes should not be used without calibration. Despite the good performance, the average standard deviation relative to a calibrated CSE of the four graphite cells over 20 months was 40 m V. Consequently, the cells need periodic recalibration if they are used with cathodic protection systems for which the protection criterion is based on an absolute measurement of potential. They are well suited, however, for use with systems that have a criterion based on potential shifts.
The next most stable cells were the low-resistance silver cells. Their performance was similar to that of the graphite probes, but they were more strongly affected by the chloride content of the surrounding concrete. Since the standard deviations of the potential difference were lower in salt-free concrete than in salt-laden concrete, it was concluded that the common practice of surrounding the cells with a backfill of chloride-bearing concrete or mortar provided no benefit.
The study judged all the other cells to be unacceptably unstable. It must also be noted, however, that the lowest temperature recorded during the study was - 1°C. Measurements taken by Ministry staff have shown that silver-silver chloride cells have consistently exhibited erratic behavior at colder temperatures.
CURRENT AND FUTURE MINISTRY ACTIVITIES
Embedded graphite reference electrodes have been installed in the Ministry's most recent deck cathodic protection sys-
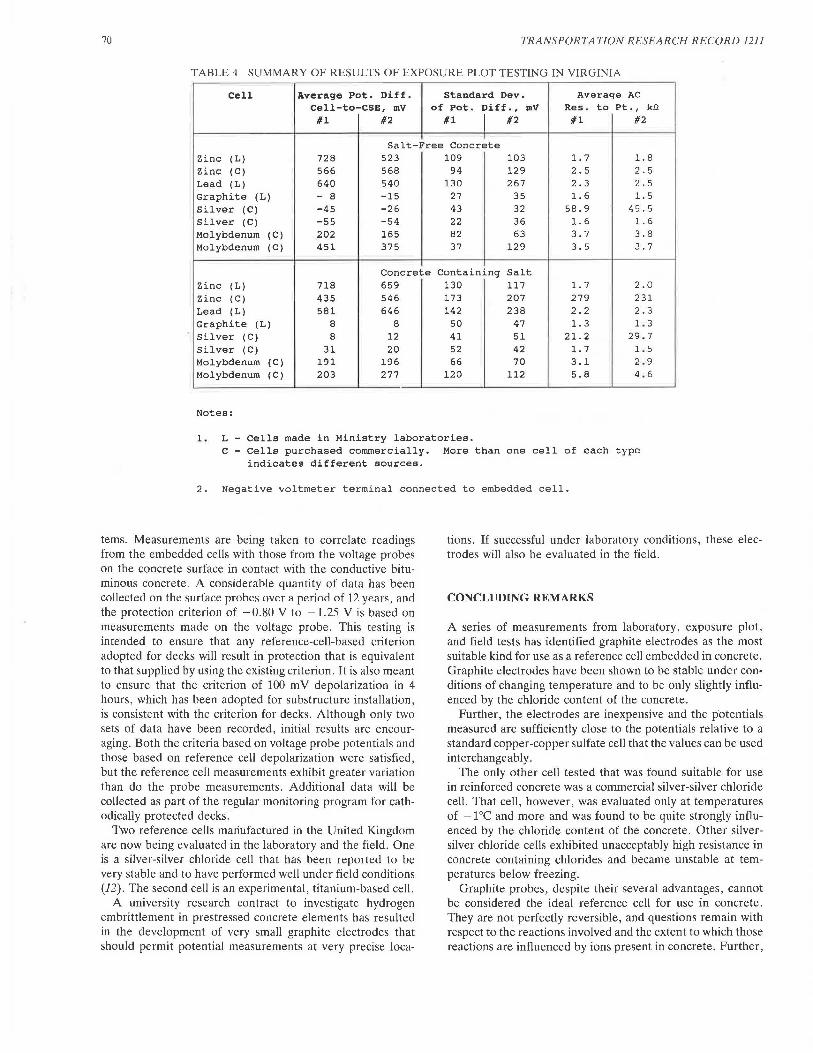
70 TRANSPORTATION RESEARCH RECORD 1211
TABLE 4 SUMMARY OF RESULTS OF EXPOSURE PLOT TESTING IN VIRGINIA
Cell Average Pot, Diff. Standard Dev. Averaqe AC Cell-to-CSE, mV of Pot. Diff,, mV Res. to Pt,, kn
#1 #2 #1 I #2 #1 #2
I
Salt-Free Concrete Zinc (L) 728 523 109 103 1. 7 1. 8 Zinc (C) 566 568 94 129 2. 5 2.5 Lead (L) 640 540 130 267 2.3 2.5 Graphite (L) - 8 -15 27 35 1. 6 1. 5 Silver (C) -45 -26 43 32 58.9 45.5 Silver (C) -55 -54 22 36 1. 6 1. 6 Molybdenum (C) 202 165 82 63 3.7 3.8 Molybdenum (C) 451 375 37 129 3.5 3.7
Concrete Containing Salt Zinc (L) 718 659 130 117 1. 7 2.0 Zinc (C) 435 546 173 207 279 231 Lead (L) 581 646 142 238 2.2 2.3 Graphite (L) 8 8 50 47 1. 3 1. 3 Silver (C) 8 12 41 51 21. 2 29 . 7 Silver (C) 31 20 52 42 1. 7 1. 5 Molybdenum (C) 191 196 66 70 3.1 2 . 9 Molybdenum (C) 203 277 120 112 5.8 4 . 6
Notes:
1. L - Cells made in Ministry laboratories. C - Cells purchased commercially. More than one cell of each type
indicates different sources.
2. Negative voltmeter terminal connected to embedded cell.
terns. Measurements are being taken to correlate readings from the embedded cells with those from the voltage probes on the concrete surface in contact with the conductive bituminous concrete. A considerable quantity of data has been collected on the surface pro hes over a period of 1 ?. years, anrl the protection criterion of -0.80 V to -1.25 V is based on measurements made on the voltage probe. This testing is intended to ensure that any reference-cell-based criterion adopted for decks will result in protection that is equivalent to that supplied by using the existing criterion. It is also meant to ensure that the criterion of 100 mV depolarization in 4 hours, which has been adopted for substructure installation, is consistent with the criterion for decks. Although only two sets of data have been recorded, initial results are encouraging. Both the criteria based on voltage probe potentials and those based on reference cell depolarization were satisfied, but the reference cell measurements exhibit greater variation than do the probe measurements. Additional data will be collected as part of the regular monitoring program for cathodically protected decks.
Two reference cells mariufactured in the United Kingdom are now being evaluated in the laboratory and the field. One is a silver-silver chloride cell that has been reported to be very stable and to have performed well under field conditions (12). The second cell is an experimental, titanium-based cell.
A university research contract to investigate hydrogen embrittlement in prestressed concrete elements has resulted in the development of very small graphite electrodes that should permit potential measurements at very precise loca-
tions. If successful under laboratory conditions, these electrodes will also be evaluated in the field.
C.ONCT,TJDTNG RF.MARKS
A series of measurements from laboratory, exposure plot, and field tests has identified graphite electrodes as the most suitable kind for use as a reference cell embedded in concrete. Graphite electrodes have been shown to be stable under conditions of changing temperature and to be only slightly influenced by the chloride content of the concrete.
Further, the electrodes are inexpensive and the potentials measured are sufficiently close to the potentials relative to a standard copper-copper sulfate cell that the values can be used interchangeably.
The only other cell tested that was found suitable for use in reinforced concrete was a commercial silver-silver chloride cell. That cell, however, was evaluated only at temperatures of -1°C and more and was found to be quite strongly influenced by the chloride content of the concrete. Other silversilver chloride cells exhibited unacceptably high resistance in concrete containing chlorides and became unstable at temperatures below freezing.
Graphite probes, despite their several advantages, cannot be considered the ideal reference cell for use in concrete. They are not perfectly reversible, and questions remain with respect to the reactions involved and the extent to which those reactions are influenced by ions present in concrete. Further,
Schell et al.
the standard deviation of potential measurements made with respect to a standard surface electrode indicated that graphite electrodes are better suited for use in conjunction with protection criteria based on potential shift rather than on absolute potentials unless they are calibrated periodically. Consequently, graphite electrodes are being installed and evaluated at the same time that the suitability of other reference cells is being evaluated.
REFERENCES
1. R. F. Stratfull, ed. A Manual for the Corrosion Control of Bridge Decks. Report FHWA-CrEng-1. FHWA, U.S. Department of Transportation, 1984.
2. H. J. Fromm and G. P. Wilson. Cathodic Protection of Bridge Decks: A Study of Three Bridge Decks in Ontario. In Transportation Research Record 604, TRB, National Research Council, Washington, D.C., 1976, pp. 38-47.
3. D. G. Manning and D. K. Bye. Bridge Deck Rehabililalion Manual: Part Two. Con/ract Preparalion. Publication SP-017. Ontario Ministry of Transportation, Downsview, Ontario, Canada, 1984.
4. H. J. Fromm. Measurement of Polarized Potentials in Concrete Bridge Decks. In Transportation Research Record 692. TRB, National Research Council, Washington, D.C., 1978, w.n-~. .
5. H. C. Schell, D. G. Manning , and F. Pianca. A Decade of Bndge Deck Cathodic Protection in Ontario. Corrosion 87, Paper 123 . National Association of Corrosion Engineers. 1987.
71
6. H. C. Schell, D. G. Manning, and K. C. Clear. Cathodic Protection of Bridge Substructures-Burlington Bay Skyway Test Site : Initial Performance of Systems 1 to 4. In Transportation Research Record 962 , TRB, National Research Council, Washington, D.C., 1984, pp. 38-50.
7. C. E . Locke and C. Dehghanian. Embeddable Reference Electrodes for Chloride-Contaminated Concrete. Materials Performance, Vol. 18, No. 2, 1979, pp. 70-73.
8. D . G . Manning and H. C. Schell. Early Performance of Eight Experimental Cathodic Protection Systems at the Burlington Skyway Test Site. In Transportation Research Record 1041 , TRB, National Research Council, Washington, D.C., 1985, pp . 23-32. .
9. D. G. Manning and H . C. Schell. Substructure Cathodic Protection in Ontario: Field Trials 1982-1986. In Transportation Research Record 1113 , TRB, National Research Council, Washington, D.C., 1987, pp. 47-53.
10. D. J . G . Ives and G . J . Janz. Reference Electrodes: Theory and Practice . Academic Press, New York, 1961.
11. K. C. Clear. Embedded Reference Cells to Monitor and Control Cathodic Protection Systems. Report ME-87-18. Ontario Ministry of Transportation, Downsview, Ontario, Canada, 1987.
12. K. G . C. Berkeley and S. Pathmanaban. Practical Potential Monitoring in Concrete . In U.K. Corrosion 87, Institution of Corrosion Science and Technology, Birmingham, England , 1987, pp. 115-131.
Publication of this paper sponsored by Commillee on Corrosion .
72 TRANSPORTATION RESEARCH RECORD 1211
Verification of Composite Behavior of a Precast Decked Simple Span
ROBERTO A. OSEGUEDA, JAMES S. NOEL, AND JOHN J. PANAK
This paper documents the reconstruction of a simple span bridge redecked with full-depth, full-width precast concrete panels connected to act in a composite way with supporting stringers. It also reports the results of full-scale load tests and of an analysis conducted to evaluate the composite behavior of the precast decked span. Eight precast concrete panels, each 6 ft 3 in. x 45 ft x 8 in. thick, were used to form the deck. The panels were cast with holes and positioned on top of supporting stringers with bearing pads measuring 2 in. x 6 in. x 1 in. thick. Steel stud connectors were welded to the top flanges through the holes. Keyways between adjacent panels and deck-stringer gaps were sealed to retain epoxy mortar that was poured through the deck openings. The panels were placed in an operation lasting about 5 hours. Welding the studs, sealing the connections, and pouring the epoxy mortar took about 20 hours. Full-scale load tests were conducted on the redecked span by placing a 13-ton vehicle at different locations while live-load deflections were recorded. A full-composite, finite element model of the bridge was used to correlate the measured deflections. The comparison of measured and full-composite deflections of the model indicates that the span behaves in a full-composite manner.
One recent innovation in the rehabilitation of deteriorated decks is the use of precast concrete panels that are placed transversely on steel stringers (J-6). The recent reconstruction of the Woodrow Wilson Memorial Bridge demonstrated how the use of precast panels minimizes traffic interference (5). The deck of the six-lane, 5,900-ft-long bridge was replaced in a period of 12 months without the flow of traffic being stopped (5 ,6); the bulk of the work was done in 10-hour night shifts in which portions of the old deck were removed and replaced with panels that were connected using a high-earlystrength grouting material. This material developed a compressive strength of 4,000 psi in one hour and allowed for all six traffic lanes to be open during the daytime (5).
In the precast method, the panels are connected to each other and to the supporting beams to form a monolithic deck. Shear and normal force transfer between panels is usually accomplished with grouted keyways (1,2 ,4,6). Proper vertical alignment and uniform bearing on the beam floor have been obtained by placing a bed of thick mortar before setting the panels (1), by using bearing pads and placing the grout after
R. A. Osegueda, Civil Engineering Department, University of Texas at El Paso, El Paso, Tex. 79968. J. S. Noel, Civil Engineering Department, Texas A&M University, College Station, Tex. 77843. J. J. Panak, Bridge Division, Texas State Department of Highways and Public Transportation, 11th and Brazos, Austin, Tex. 78701.
setting the panels ( 4), or by using bolt-leveling panel supports that are adjusted while the mortar bed is being placed (3).
Connection details for assuring composite action between the precast deck and the stringer floor were originally reported elsewhere (J) and first used in the experimental reconstruction of two bridges by the New York Thruway Authority (3). These details included stud or channel connectors welded to the top flanges or friction bolts attached to the flanges through field-perforated holes. The connectors were typically placed through block-out holes after the panels were set. The holes were subsequently filled with a nonshrinking grout or epoxy mortar. These experimental bridges have been in service for about 14 years, and no major problems have been reported (3).
Following the efforts of the New York Thruway Authority, precast decked bridges have now been built in Alabama, California, Indiana, Maryland, Massachusetts, New York, Pennsylvania, Virginia, and West Virginia (6). Most of these bridges have a common element: they include grout or epoxy mortar placed at the precast deck-stringer gaps, at the shear keyways between panels, and at the holes around shear connectors or tie anchors.
One of the key questions about such bridges is whether composite action is being achieved and, ifit is, what the extent is of the precast deck-stringer interaction.
In recent laboratory studies, a one-third-scale model of a 60-ft-long, simple span bridge was built and tested under static and repetitive loadings (7-9). The model was first subjected to stritic HS-7.0 service lo<tds (7). It w<ts concluded that, at these loads, the horizontal shear for composite action between the precast deck and the stringers is mostly transferred by the cured mortar. Then, in an effort to study the influence of highway loads on the epoxy-mortar connections, 2 million cycles of equivalent HS-20 truck loads were applied to the model (8). No changes in the composite sectional properties occurred. Finally, the model was loaded to its ultimate flexural capacity (9); the adhesive bond in the deck-stringer gaps held up to 95 percent of the full-composite flexural capacity but failed in a brittle manner. After the bond failure, the shear connectors began to take loads and the system behaved in a ductile mode. These laboratory efforts culminated in the precast redecking of a simple span of the SPUR 326 overpass over the AT&SF Railroad in downtown Lubbock, Texas.
This paper serves two objectives: (1) to report the construction and installation procedures of the precast deck of a 50-ft simple span of the SPUR 326 bridge and (2) to evaluate the degree of composite interaction achieved between the
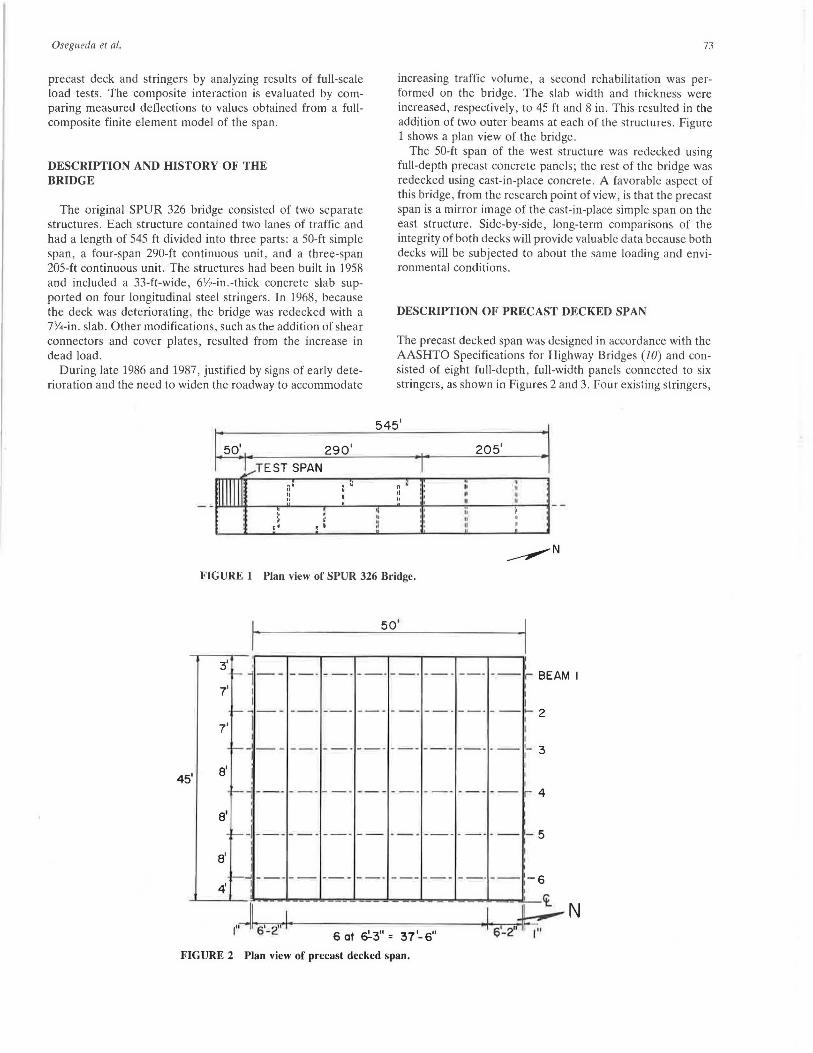
Osegueda et al.
precast deck and stringers by analyzing results of full-scale load tests. The composite interaction is evaluated by comparing measured deflections to values obtained from a fullcomposite finite element model of the span.
DESCRIPTION AND HISTORY OF THE BRIDGE
The original SPUR 326 bridge consisted of two separate structures. Each structure contained two lanes of traffic and had a length of 545 ft divided into three parts: a 50-ft simple span, a four-span 290-ft continuous unit, and a three-span 205-ft continuous unit. The structures had been built in 1958 and included a 33-ft-wide, 6V2-in.-thick concrete slab supported on four longitudinal steel stringers. In 1968, because the deck was deteriorating, the bridge was redecked with a 7%-in. slab. Other modifications, such as the addition of shear connectors and cover plates, resulted from the increase in dead load.
During late 1986 and 1987, justified by signs of early deterioration and the need to widen the roadway to accommodate
1:50' 290' : °!'"TEST SPAN .. ' ~
" ' " " ,, ' .. I
) I ,. 'I
TJ
increasing traffic volume, a second rehabilitation was performed on the bridge. The slab width and thickness were increased, respectively, to 45 ft and 8 in. This resulted in the addition of two outer beams at each of the structures. Figure 1 shows a plan view of the bridge.
The 50-ft span of the west structure was redecked using full-depth precast concrete panels; the rest of the bridge was redecked using cast-in-place concrete. A favorable aspect of this bridge, from the research point of view, is that the precast span is a mirror image of the cast-in-place simple span on the east structure. Side-by-side, long-term comparisons of the integrity of both decks will provide valuable data because both decks will be subjected to about the same loading and environmental conditions.
DESCRIPTION OF PRECAST DECKED SPAN
The precast decked span was designed in accordance with the AASHTO Specifications for Highway Bridges (JO) and consisted of eight full-depth, full-width panels connected to six stringers, as shown in Figures 2 and 3. Four existing stringers,
545'
:1 2051
·1· n' ,, ·: ,,
' "
FIGURE 1 Plan view of SPUR 326 Bridge.
50 1
~ I - 1-- --· --· --·--· --· --· --r BEAM I
7' I I I -.- - --- --- --- - - - -- · - - · --- 1- 2
1' I : I I
-'-- ---- ----- ------------'- 3 I I
45' I
' I
8'
-j --· - -· - - · --- --· - -· · - - -- r 4 '
8' I
-1-----· --·-- · - · --··-· · - - 5 I
8' ..; _____ --- --·
I --- --- --· -- -s p ct.
I Q'-2"~ N 6 at &-3" = 37 1-611
4'
FIGURE 2 Plan view of precast decked span.
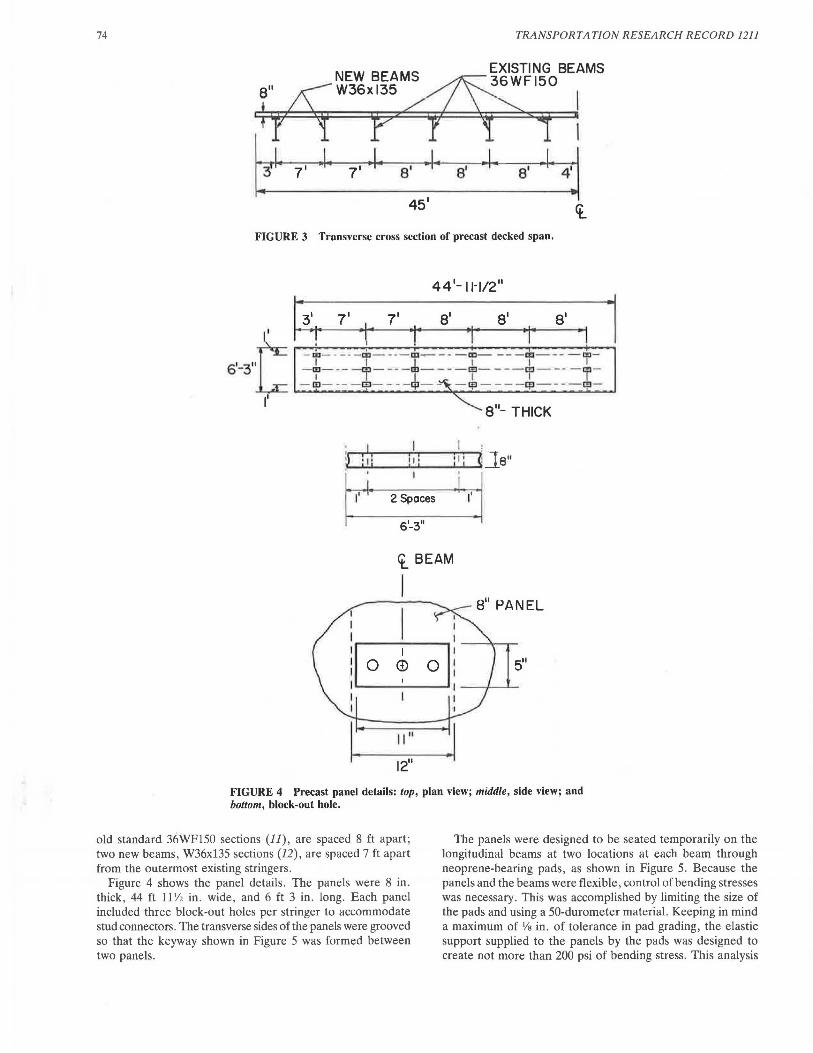
74 TRANSPORTATION RESEARCH RECORD 1211
NEW BEAMS EXISTING BEAMS
8" ;s::w36xl35 ~Fi5o I ·:r/1 r?--r===i= $, ., l:~I· 7' .!. 7' .1. 8' .1. Ft .1 8' .1. 4j
45 1
ct. FIGURE 3 Transverse cross section of preeast decked span.
44'-11-112 11
1 ~3' 7' ·1-
7' 8' 8' 8' I "I" ·1 • ·1· ·1 I
1' I 6'-3"f1= .-_- m.;...: ----~---~ .... 'f'-_-~-~--_ ..... I-----~ -+---__ ---_ .... +---~--- -;-=--.
k - 1!'1----a:i----~-- - ----cp----1?1 -
1' 8 11
- THICK
2 Spaces
6'-3"
ct BEAM
I I
I
I I
I
0 Ii 0 © 5"
11 11
12"
FIGURE 4 Precast panel details: top , plan view; middle, side view; and bottom, block-out hole.
old standard 36WF150 sections (11), are spaced 8 ft apart; two new beams, W36xl35 sections (12), are spaced 7 ft apart from the outermost existing stringers.
The panels were designed to be seated temporarily on the longitudinal beams at two locations at each beam through neoprene-bearing pads, as shown in Figure 5. Because the panels and the beams were flexible, control of bending stresses was necessary. This was accomplished by limiting the size of the pads and using a 50-durometer material. Keeping in mind a maximum of 1/s in. of tolerance in pad grading, the elastic support supplied to the panels by the pads was designed to create not more than 200 psi of bending stress. This analysis
Figure 4 shows the panel details. The panels were 8 in . thick, 44 ft 11 V2 in . wide, and 6 ft 3 in . long. Each panel included three block-out holes per stringer to accommodate stud connectors. The transverse sides of the panels were grooved so that the keyway shown in Figure 5 was formed between two panels.
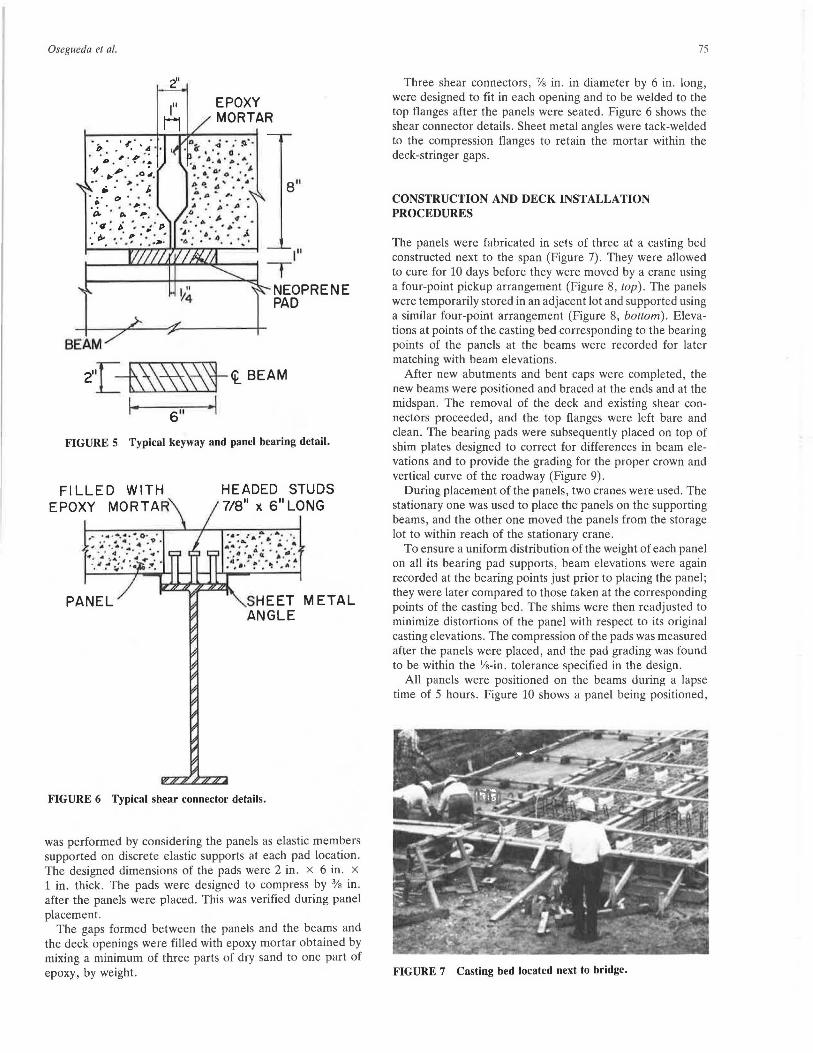
Osegueda et al.
'i.'
... , . . I> • • • .d • • . . . ; . ,. ..
I>. • .... • , ,P . •
• I> • ,o.,, ··'*: ': ··j. 8 11 ·. ~ · . °: ·. ~ .: c. . 0. • ~ . •
··~ : Ji, · .. . ·,, .·.i.- • : , -~ · ' . . · ' ......
BEAM
211
[ -t\\\~1-<f. BEAM
I· 6 11 ·I FIGURE 5 Typical keyway and panel bearing detail.
Fl LLED WITH EPOXY MORTAR
PANEL
HEADED STUDS 7/8 11 x 6 11 LONG
SHEET METAL ANGLE
FIGURE 6 Typical shear connector details.
was performed by considering the panels as elastic members supported on discrete elastic supports at each pad location. The designed dimensions of the pads were 2 in. x 6 in. x 1 in. thick. The pads were designed to compress by 3/s in. after the panels were placed. This was verified during panel placement.
The gaps formed between the panels and the beams and the deck openings were filled with epoxy mortar obtained by mixing a minimum of three parts of dry sand to one part of epoxy, by weight.
75
Three shear connectors, 7/s in. in diameter by 6 in. long, were designed to fit in each opening and to be welded to the top flanges after the panels were seated. Figure 6 shows the shear connector details. Sheet metal angles were tack-welded to the compression flanges to retain the mortar within the deck-stringer gaps .
CONSTRUCTION AND DECK INSTALLATION PROCEDURES
The panels were fabricated in sets of three at a casting bed constructed next to the span (Figure 7). They were allowed to cure for 10 days before they were moved by a crane using a four-point pickup arrangement (Figure 8, top) . The panels were temporarily stored in an adjacent lot and supported using a similar four-point arrangement (Figure 8, bottom). Elevations at points of the casting bed corresponding to the bearing points of the panels at the beams were recorded for later matching with beam elevations.
After new abutments and bent caps were completed, the new beams were positioned and braced at the ends and at the midspan. The removal of the deck and existing shear connectors proceeded, and the top flanges were left bare and clean. The bearing pads were subsequently placed on top of shim plates designed to correct for differences in beam elevations and to provide the grading for the proper crown and vertical curve of the roadway (Figure 9).
During placement of the panels, two cranes were used. The stationary one was used to place the panels on the supporting beams, and the other one moved the panels from the storage lot to within reach of the stationary crane.
To ensure a uniform distribution of the weight of each panel on all its bearing pad supports, beam elevations were again recorded at the bearing points just prior to placing the panel; they were later compared to those taken at the corresponding points of the casting bed . The shims were then readjusted to minimize distortions of the panel with respect to its original casting elevations. The compression of the pads was measured after the panels were placed, and the pad grading was found to be within the Ys-in. tolerance specified in the design.
All panels were positioned on the beams during a lapse time of 5 hours. Figure 10 shows a panel being positioned ,
FIGURE 7 Casting bed located next to bridge.
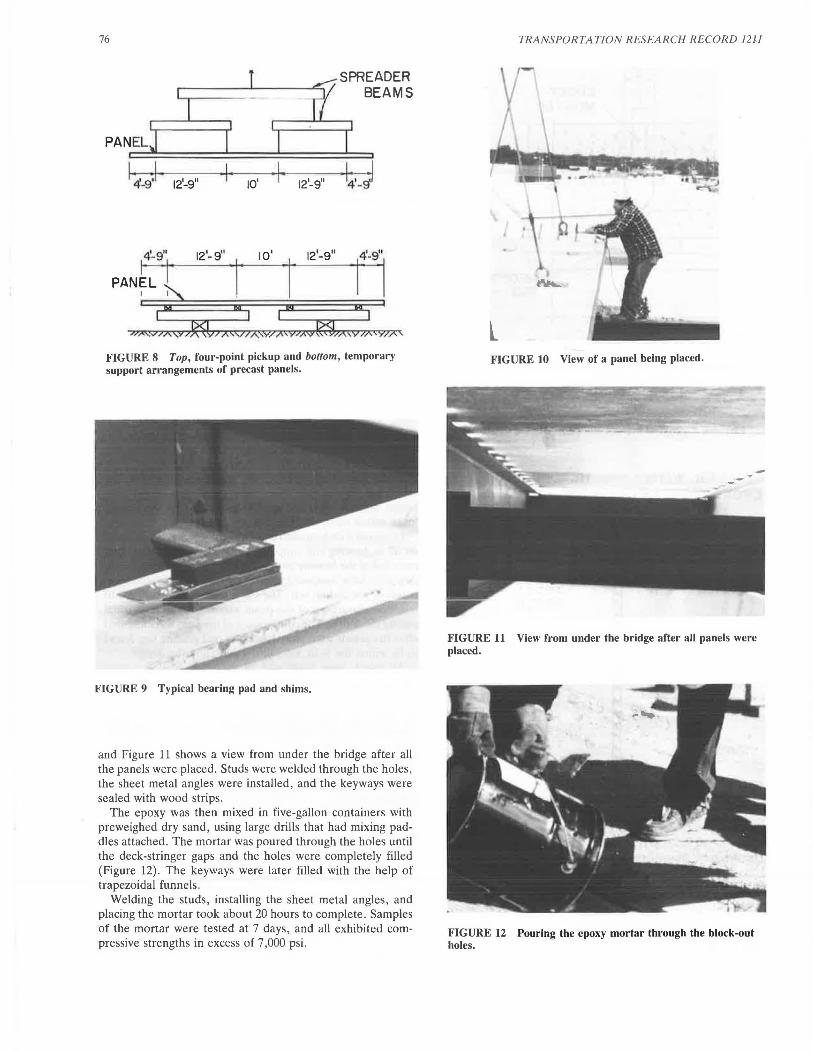
76
PANEL
12'-9" I· 10' 12'-9"
SPREADER BEAMS
PANrt!· 12·- · .. ' 10· ' 12·-9" i4 .... ,
,::::~,,??/AW/;==~4<<;;,:," FIGURE 8 Top, four-point pickup and bottom, temporary support arrangements of precast panels.
FIGURE 9 Typical bearing pad and shims.
and Figure 11 shows a view from under the bridge after all the panels were placed. Studs were welded through the holes, the sheet metal angles were installed, and the keyways were sealed with wood strips.
The epoxy was then mixed in five-gallon containers with preweighed dry sand, using large drills that had mixing paddles attached. The mortar was poured through the holes until the deck-stringer gaps and the holes were completely filled (Figure 12). The keyways were later filled with the help of trapezoidal funnels .
Welding the studs, installing the sheet metal angles, and placing the mortar took about 20 hours to complete. Samples of the mortar were tested at 7 days, and all exhibited compressive strengths in excess of 7 ,000 psi.
TRANSPORTA TION RESEARCH RECORD 12U
FIGURE 10 View of a panel being placed.
FIGURE 11 View from under the bridge after all panels were placed.
FIGURE 12 Pouring the epoxy mortar through the block-out holes.
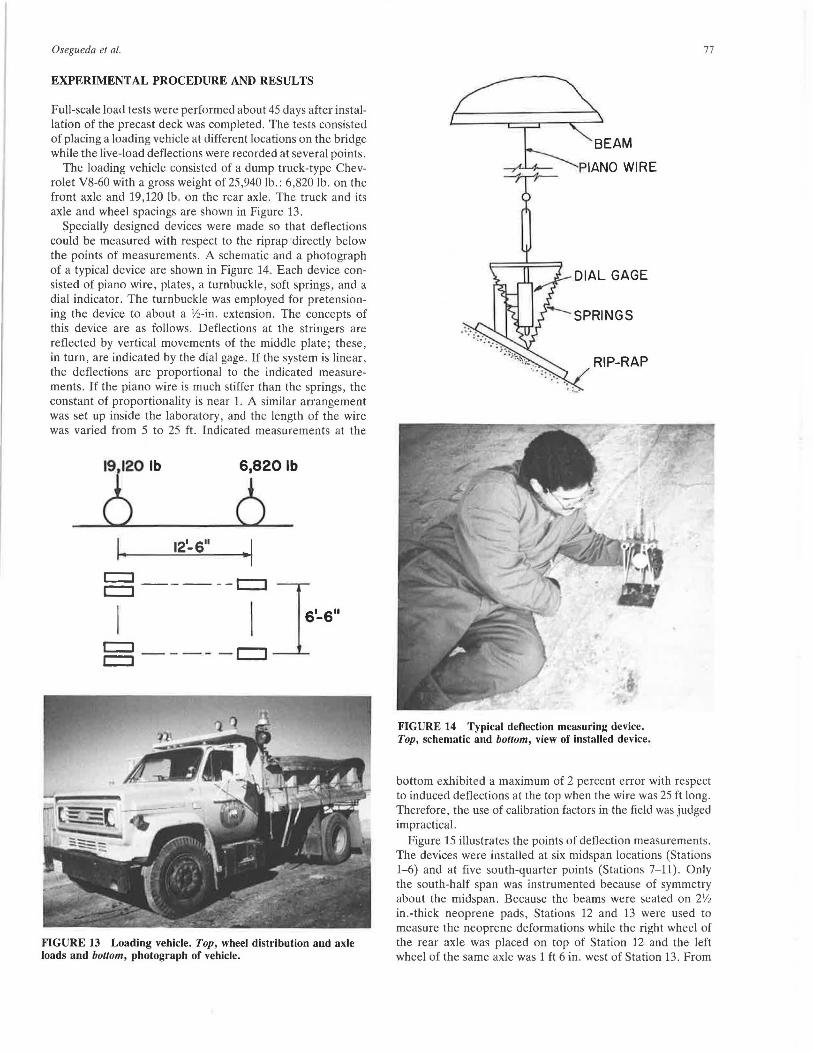
Osegueda et al.
EXPERIMENTAL PROCEDURE AND RESULTS
Full-scale load tests were performed about 45 days after installation of the precast deck was completed . The tests consisted of placing a loading vehicle at different locations on the bridge while the live-load deflections were recorded at several points.
The loading vehicle consisted of a dump truck-type Chevrolet V8-60 with a gross weight of 25,940 lb. : 6,820 lb. on the front axle and 19,120 lb. on the rear axle. The truck and its axle and wheel spacings are shown in Figure 13.
Specially designed devices were made so that deflections could be measured with respect to the riprap directly below the points of measurements. A schematic and a photograph of a typical device are shown in Figure 14. Each device consisted of piano wire, plates, a turnbuckle, soft springs, and a dial indicator. The turnbuckle was employed for pretensioning the device to about a V2-in. extension. The concepts of this device are as follows. Deflections at the stringers are reflected by vertical movements of the middle plate; these, in turn, are indicated by the dial gage. If the system is linear, the deflections are proportional to the indicated measurements. If the piano wire is much stiffer than the springs, the constant of proportionality is near 1. A similar arrangement was set up inside the laboratory, and the length of the wire was varied from 5 to 25 ft. Indicated measurements at the
6,820 lb
6 1. 121-6 11
·I
FIGURE 13 Loading vehicle. Top, wheel distribution and axle loads and bottom, photograph of vehicle.
BEAM
PIANO WIRE
RIP-RAP
FIGURE 14 Typical deflection measuring device. Top, schematic and bottom, view of installed device.
77
bottom exhibited a maximum of 2 percent error with respect to induced deflections at the top when the wire was 25 ft long. Therefore, the use of calibration factors in the field was judged impractical.
Figure 15 illustrates the points of deflection measurements. The devices were installed at six midspan locations (Stations 1-6) and at five south-quarter points (Stations 7-11). Only the south-half span was instrumented because of symmetry about the midspan. Because the beams were seated on 21/2 in.-thick neoprene pads, Stations 12 and 13 were used to measure the neoprene deformations while the right wheel of the rear axle was placed on top of Station 12 and the left wheel of the same axle was 1 ft 6 in. west of Station 13. From
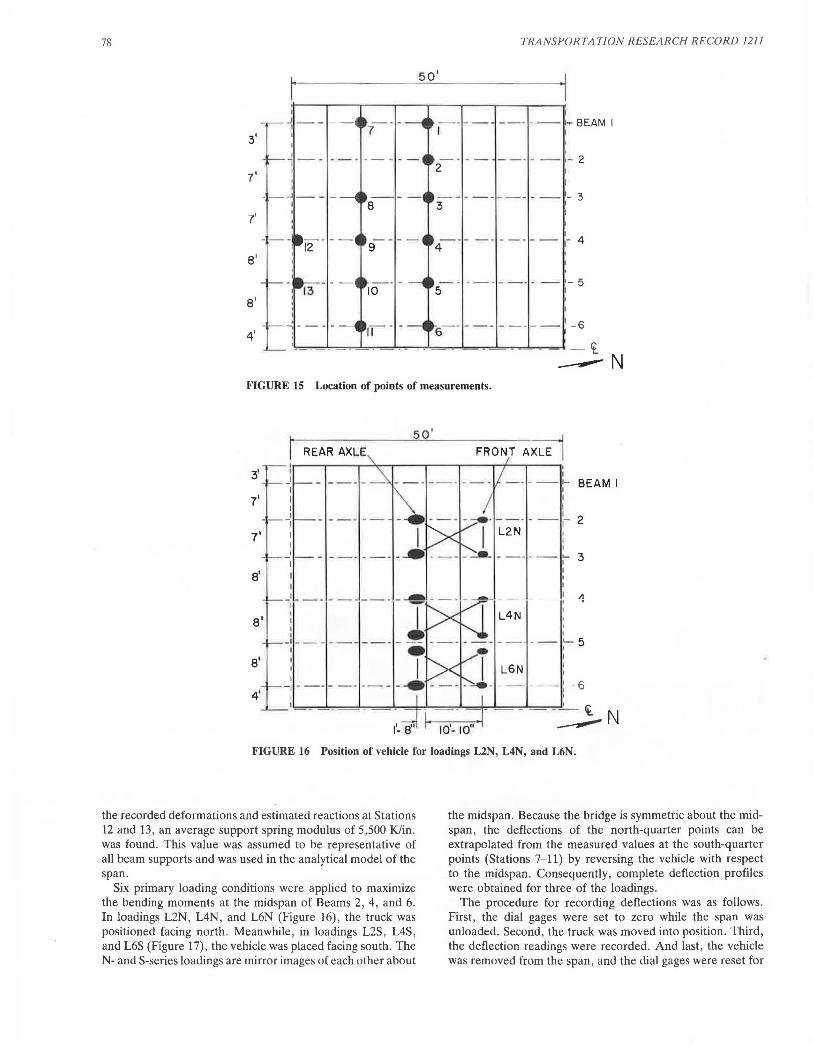
78 TRANSPOR TATION RESEARCH R ECORD 1211
501
I
- · --· --- - -- 1~ BEAM I I
--·- - - 2
-- - --'- 3 I
I
- ---- -- - 4
·-· - - · · - -5 I
-6
"'="'"'="~..,...,,,,,,,....,....,=""'_,,__,...,,,=-. ___ ,,,.,.,,........,, ........ .._.. - 't. ___.. N
FIGURE 15 Location of points of measurements.
3'
7'
7'
a'
8'
a'
4'
_I I I I I
-I
I
REAR AXLE
_, _ _
501
FRONT AXLE i BEAM I
2
3
L6N
:-6 I
10'- 10"
- - - --'- Cf. __,,,-N
FIGURE 16 Position of vehicle for loadings L2N, L4N, and L6N.
the recorded deformations and estimated reactions at Stations 12 and 13, an average support spring modulus of 5,500 K/in . was found. This value was assumed to be representative of all beam supports and was used in the analytical model of the span.
Six primary loading conditions were applied to maximize the bending moments at the midspan of Beams 2, 4, and 6. In loadings L2N, L4N, and L6N (Figure 16), the truck was positioned facing north. Meanwhile, in loadings L2S , L4S, and L6S (Figure 17), the vehicle was placed facing south. The N- and S-series loadings are mirror images of each other about
the midspan. Because the bridge is symmetric about the midspan, the deflections of the north-quarter points can be extrapolated from the measured values at the south-quarter points (Stations 7-11) by reversing the vehicle with respect to the midspan. Consequently , complete deflection profiles were obtained for three of the loadings.
The procedure for recording deflections was as follows . First, the dial gages were set to zero while the span was unloaded. Second, the truck was moved into position. Third, the deflection readings were recorded. And last, the vehicle was removed from the span, and the dial gages were reset for
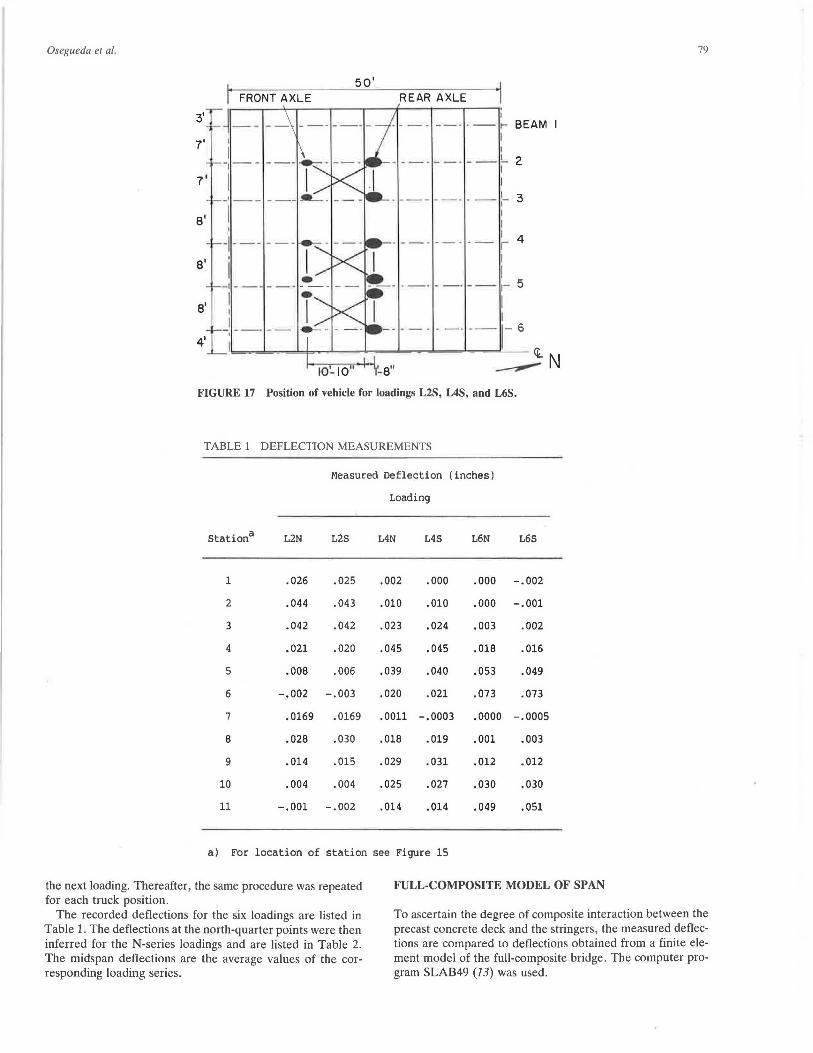
Osegueda et al. 79
I' FRONT AXLE
50 1
REAR AXLE
3' ~-- I
. --- --· ·--r- BEAM
7' I I
-, -- - - - · -- · ___ I_,
2 I
7 ' I I
-·-- 3
a' I
+- ---· 4
8' I
I
8'
- -- --4' '
FIGURE 17 Position of vehicle for loadings L2S, L4S, and L6S.
TABLE 1 DEFLECTION MEASUREMENTS
Measured Deflection (inches)
Loading
Station a L2N L2S L4N L4S L6N L6S
1 .026 .025 .002 .000 .000 -.002
2 .044 .043 .010 .010 .000 -.001
3 .042 .042 .023 .024 .003 .002
4 .021 .020 .045 .045 .018 .016
5 .008 .006 .039 .040 .053 .049
6 -.002 -.003 .020 .021 .073 .073
7 .0169 .0169 .0011 -.0003 .0000 - .0005
8 .028 .030 .018 .019 . 001 .003
9 .014 .015 .029 .031 .012 .012
10 .004 .004 .025 .027 .030 .030
11 -.001 -.002 .014 .014 .049 .051
a) For location of station see Figure 15
the next loading. Thereafter, the same procedure was repeated for each truck position.
The recorded deflections for the six loadings are listed in Table 1. The deflections at the north-quarter points were then inferred for the N-series loadings and are listed in Table 2. The midspan deflections are the average values of the corresponding loading series.
FULL-COMPOSITE MODEL OF SPAN
To ascertain the degree of composite interaction between the precast concrete deck and the stringers, the measured deflections are compared to deflections obtained from a finite element model of the full-composite bridge. The computer program SLAB49 (13) was used.
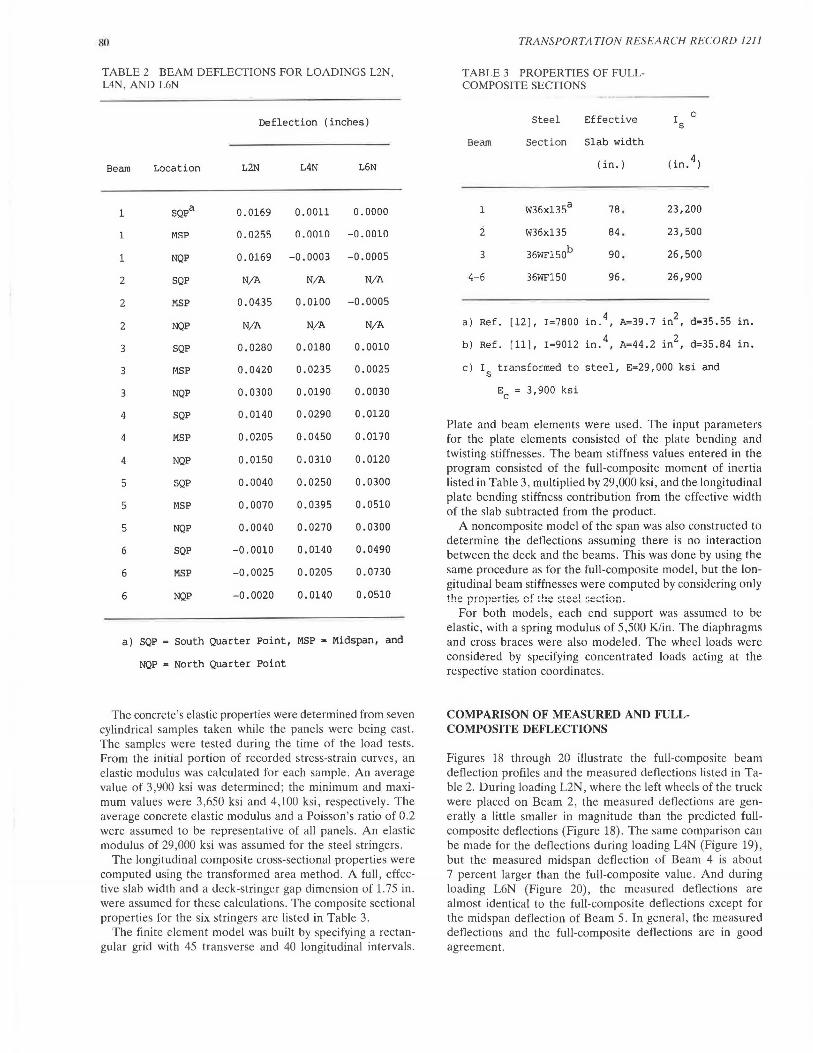
80
TABLE 2 BEAM DEFLECTIONS FOR LOADINGS L2N, L4N, AND L6N
Deflection (inches)
Beam Location L2N L4N L6N
1 SQ Pa 0.0169 0.0011 0.0000
1 MSP 0.0255 0.0010 -0.0010
1 NQP 0.0169 -0.0003 -0.0005
2 SQP N/A N/A N/A
2 MSP 0.0435 0.0100 -0.0005
2 NQP N/A N/A N/A
3 SQP 0.0280 0.0180 0.0010
3 MSP 0.0420 0.0235 0.0025
3 NQP 0.0300 0.0190 0.0030
4 SQP 0.0140 0.0290 0.0120
4 MSP 0.0205 0.0450 0.0170
4 NQP 0.0150 0.0310 0.0120
5 SQP 0.0040 0.0250 0.0300
5 MSP 0.0070 0.0395 0.0510
5 NQP 0.0040 0.0270 0.0300
6 SQP -0.0010 0. 0140 0.0490
6 MSP -0.0025 0.0205 0.0730
6 NQP -0.0020 0. 0140 0.0510
a) SQP = south Quarter Point, MSP = Midspan, and
NQP = North Quarter Point
The concrete's elastic properties were determined from seven cylindrical samples taken while the panels were being cast. The samples were tested during the time of the load tests. From the initial portion of recorded stress-strain curves, an elastic modulus was calculated for each sample . An average value of 3,900 ksi was determined; the minimum and maximum values were 3,650 ksi and 4,100 ksi, respectively. The average concrete elastic modulus and a Poisson's ratio of 0.2 were assumed to be representative of all panels. An elastic modulus of 29,000 ksi was assumed for the steel stringers.
The longitudinal composite cross-sectional properties were computed using the transformed area method. A full, effective slab width and a deck-stringer gap dimension of 1.75 in. were assumed for these calculations. The composite sectional properties for the six stringers are listed in Table 3.
The finite element model was built by specifying a rectangular grid with 45 transverse and 40 longitudinal intervals.
TRANSPORTATION RESEARCH RECORD 1211
TABLE 3 PROPERTIES OF FULLCOMPOSITE SECTIONS
Steel Effective
Beam Section Slab width
I c s
(in.) (in. 4)
1 W36x135a 78. 23,200
i W36xl35 84. 23,500
3 36WF150b 90. 26,500
4-6 36WF150 96. 26,900
a) Ref. [12], I=7800 . 4 in. , A=39.7 . 2 in , d=35.55
b) Ref. [ 11], I=9012 in. 4 A=44.2 . 2 d=35.84 , in ,
c) I s transformed to steel, E=29,000 ksi and
EC = 3,900 ksi
in.
in.
Plate and beam elements were used. The input parameters for the plate elements consisted of the plate bending and twisting stiffnesses. The beam stiffness values entered in the program consisted of the full-composite moment of inertia listed in Table 3, multiplied by 29,000 ksi, and the longitudinal plate bending stiffness contribution from the effective width of the slab subtracted from the product.
A noncomposite model of the span was also constructed to determine the deflections assuming there is no interaction between the deck and the beams. This was done by using the same procedure as for the full-composite model, but the longitudinal beam stiffnesses were computed by considering only
For both models, each end support was assumed to be elastic, with a spring modulus of 5,500 K/in. The diaphragms and cross braces were also modeled. The wheel loads were considered by specifying concentrated loads acting at the respective station coordinates.
COMPARISON OF MEASURED AND FULLCOMPOSITE DEFLECTIONS
Figures 18 through 20 illustrate the full-composite beam deflection profiles and the measured deflections listed in Table 2. During loading L2N, where the left wheels of the truck were placed on Beam 2, the measured deflections are generally a little smaller in magnitude than the predicted fullcomposite deflections (Figure 18) . The same comparison can be made for the deflections during loading L4N (Figure 19), but the measured midspan deflection of Beam 4 is about 7 percent larger than the full-composite value. And during loading L6N (Figure 20), the measured deflections are almost identical to the full-composite deflections except for the midspan deflection of Beam 5. In general, the measured deflections and the full-composite deflections are in good agreement.
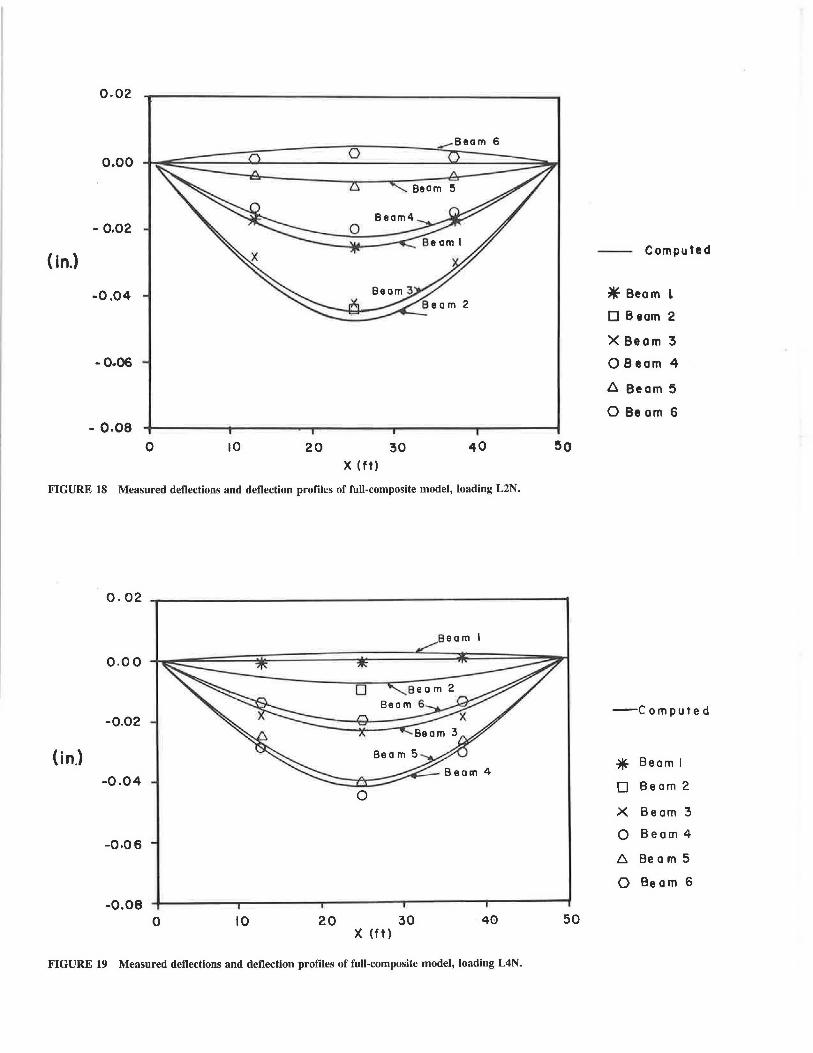
0.02
o.oo
- 0.02
{in.)
-0.04
-0.06
- o.oe
x (ft) FIGURE 18 Measured deflections and deflection profiles of full-composite model, loading L2N.
0.02
-0.02
{in.l -0.04
0
-O.Q6
-0.08 0 10 20 30 40
x (ft)
FIGURE 19 Measured deflections and deflection profiles of full-composite model, loading L4N.
50
-- Computed
*Beam L
0 Beam 2
X Beam 3
0 Beam 4
A Beam 5
0 Be om 6
-computed
* Beam I
D Beam 2
x Beam 3
0 Beam 4
A Be am 5
0 Beam 6
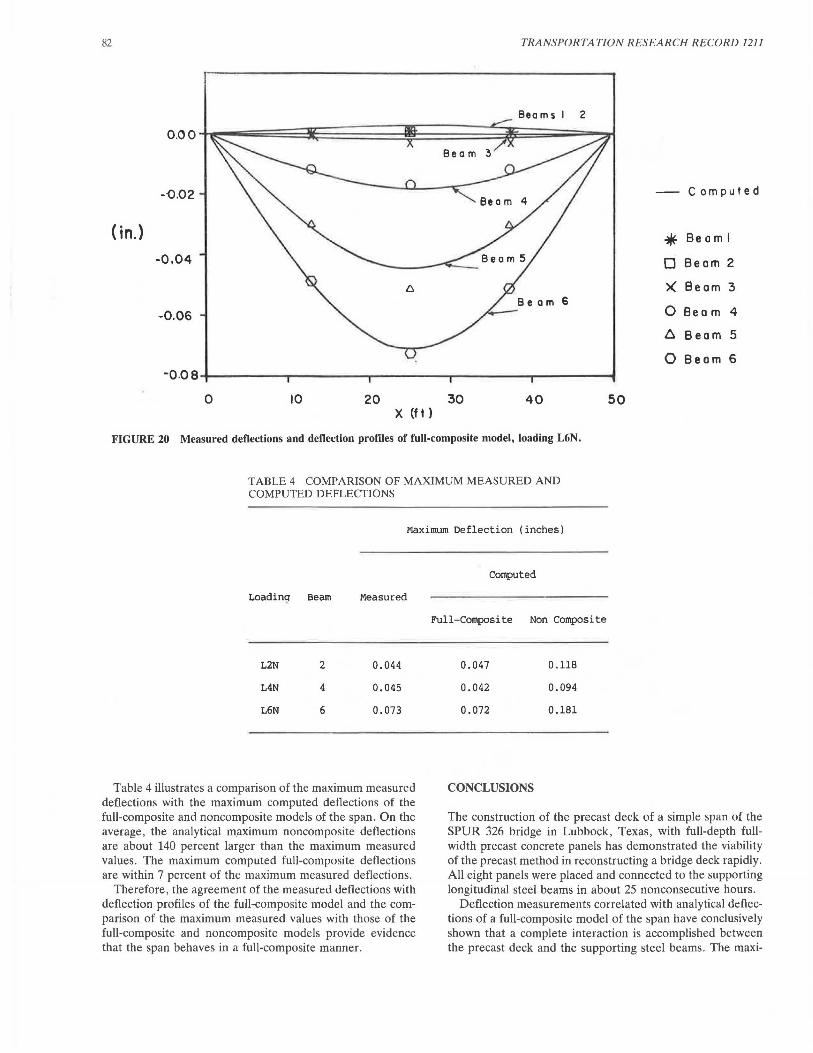
82 TRANSPORTATION RESEARCH RECORD 1211
Beams I 2
-- Computed
(in.)
* Beam I
D Beam 2
x Seam 3
0 Beam 4
t:::,. Beam 5
0 Beam 6
0 10 20 30 40 50 x (ft)
FIGURE 20 Measured deflections and deflection profiles of full-composite model, loading L6N.
TABLE 4 COMPARISON OF MAXIMUM MEASURED AND COMPUTED DEFLECTIONS
Maximum Deflection (inches)
Loading Beam
L2N
L4N
L6N
2
4
6
Measured
0.044
0.045
0.073
Table 4 illustrates a comparison of the maximum measured deflections with the maximum computed deflections of the full-composite and noncomposite models of the span. On the average, the analytical maximum noncomposite deflections are about 140 percent larger than the maximum measured values. The maximum computed full-composite deflections are within 7 percent of the maximum measured deflections.
Therefore, the agreement of the measured deflections with deflection profiles of the full-composite model and the comparison of the maximum measured values with those of the full-composite and noncomposite models provide evidence that the span behaves in a full-composite manner.
Computed
Full-Composite Non Composite
0.047
0.042
0.072
CONCLUSIONS
0.118
0.094
0.181
The construction of the precast deck of a simple span of the SPUR 326 bridge in Lubbock, Texas, with full-depth fullwidth precast concrete panels has demonstrated the viability of the precast method in reconstructing a bridge deck rapidly. All eight panels were placed and connected to the supporting longitudinal steel beams in about 25 nonconsecutive hours.
Deflection measurements correlated with analytical deflections of a full-composite model of the span have conclusively shown that a complete interaction is accomplished between the precast deck and the supporting steel beams . The maxi-
Osegueda et al.
mum deflections measured during field load tests were found to be within 7 percent of those computed using a full-composite model of the span. Furthermore, the maximum deflections of a noncomposite model were found to be 140 percent larger than those measured.
The use of small, deformable neoprene pads as temporary supports to the panels until placement of the epoxy mortar was demonstrated to be a viable method of controlling the bending stresses in the panels during placement. The large deformations of the pads allow for a more uniform distribution of the panels' weight onto all bearing supports.
Some improvements on the construction method suggested as a result of observing the field construction follow:
1. Separate neoprene pads at each panel edge rather than a common pad would allow simpler grading of the panels and would accommodate slight variations in panel thicknesses.
2. Ready-made sealers, such as caulking strips or rods, would be easier to use and take less time to install than sheet metal angles.
3. A commercially available mortar mixer would provide better epoxy grout mixing equipment.
4. A field grading control procedure that would allow input of actual beam elevations at each pad support, the corresponding form elevations, the top of the panel elevations when in the form, the calculated beam deflections, and the planned final roadway elevations would simplify the field grading process.
ACKNOWLEDGMENTS
This study was executed by the Texas Transportation Institute, The Texas A&M University System, and was sponsored by the Texas State Department of Highways and Public Transportation (SDHPT) in cooperation with the U .S. Department of Transportation, Federal Highway Administration (FHWA). The Bridge Division of the SDHPT performed the design of the reconstruction of the SPUR 326 Bridge. The authors gratefully recognize the contractors, J.D . Abrams Construction Co. and MCS Construction Co., for scheduling their construction program around research and testing activities.
REFERENCES
1. M. Biswas, J. S. B. Iffland , R. E. Schofield , and A. E . Gregory . Bridge Replacements with Precast oncrcre Panels . In peciol Report 148: Precost Bridge Deck Replacem alll Applications . TRB , Na iional Research ouncil, Washington , D .C., 1974, pp. 136-.14 .
2. C . V. Knudsen. Re-decking of a Bridge with Precast Concrete. Civil Engineering-A CE, Vol. 50, April 1980, pp. 75-77.
3. C. Slavis. Preca t Concrete Deck Modules for Bridge Deck Reconstruction. In Transportation R esearch Record 871, TRB , National Research Council , Washington , D .C., 1982, pp. 30-32.
4. R. H. Berger. Full-Depth Modular Precast , Prestressed Bridge Decks. In Transportation Research Record 903, TRB , National Research Council , Washington, D .C., 1983 , pp . 52- 59.
5. J . G. Lutz and D . J. Scalia. Deck Widening and Replacement of Woodrow Wilson Memorial Bridge. Journal of Prestressed Concrete Institute , Vol. 29 , No. 3, 1984, pp . 74-93.
6. M . M . Sprinkel. N HRP 'y111hesis of Hig/11va • Practice 119: Prefabricmetl Britlge Elements and Systems. TRB, National Research Counci l, Wa hington , D . ., Aug. 19 5, pp . 6-12.
7. R. A . Osegueda and J. S. Noel. Positive Moment Tests / or Precast Concrete Ponel-Decked om11osite Bridges. Research Report 324-1. Texas Transportation Institute, Texas A&M University System, a llege Station , Texas, Sept . 1987.
8. R. A. Osegueda and J. S. Noel. Repetitive Load Test on 0 111-posite !'recast Decked Bridges. Re.search Repori 324-3. Texas Tran purta tion In titute , Texn A&M Univ rsity System, College Sta tion , Texas, Apri l 19 6.
9. R. A . Osegueda and J. S. Noel. Rapid Bridge Deck Rep/ace111e111: A Field Dem o11stmtio11 am/ Load Tes/ . Research Report 324-SF. Texas Transportation Institute , Texas A&M University System, College Suu ion, Texas , May 198 .
10. Standard Sp cific111io11s for Highivay Bridges. Americnn Association of rate Hlghwny and T ra nsporta tion Official , Washington, D .C., 1983.
11 . Steel Construction Manual , 4th ed. American Institute of Steel Construction, New York, 1963.
12. Steel Construction Manual , 8th ed . American Institute of Steel Construction, New York , 1980.
13 . J. J. Panak and H . Matlock. A Discrete Element Meth od of Analysis for Orthogonal Slab a11d Grid Bridge Floor Sysre111s. Research Report 56-25. Center of Highway Research, Univcr ·lty of Texas at Austin , May 1972.
Publication of this paper sponsored by Commillee on Structures Main· tenance.
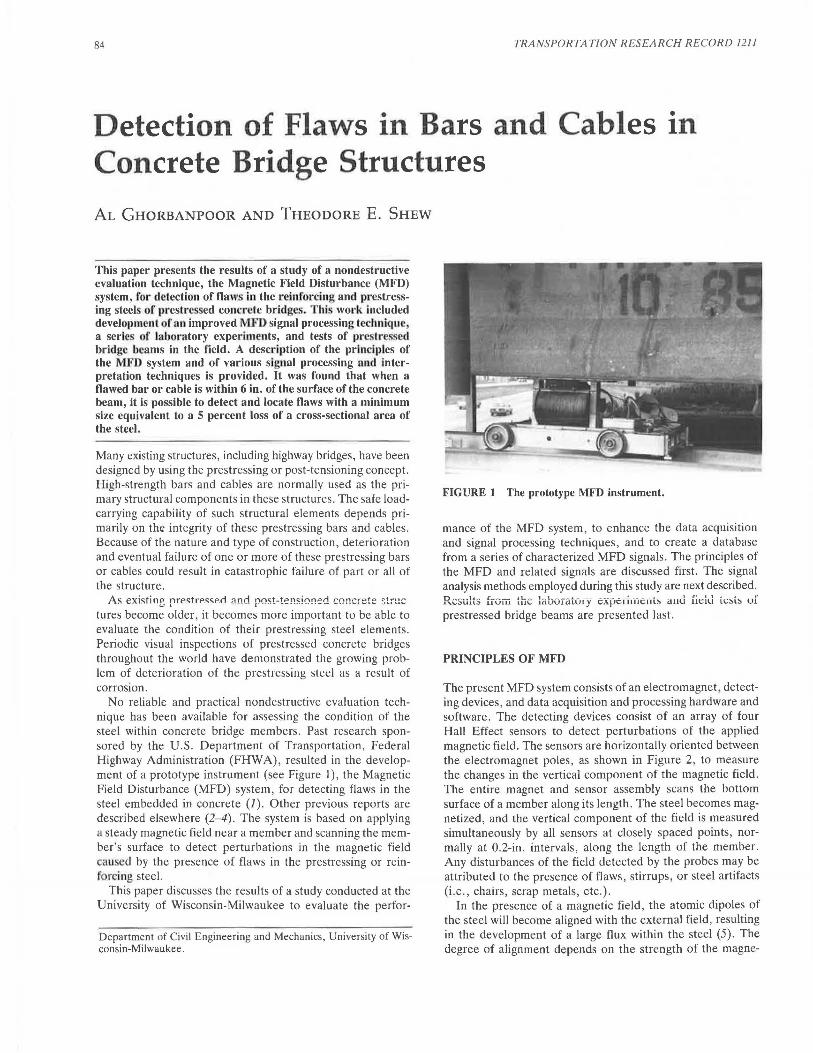
84 TRANSPORTATION R ESEAR CH RECORD 1211
Detection of Flaws in Bars and Cables Concrete Bridge Structures
• In
AL GHORBANPOOR AND THEODORE E. SHEW
This paper presents the results of a study of a nondestructive evaluation technique, the Magnetic Field Disturbance (MFD) system, for detection of flaws in the reinforcing and (lrestressing steel of prestrcssed concrete bridges. This work included development of 1111 improved lFD signal processin •technique, a series of laboratory experiments, and tests of prcstressed bridge beams in the field. A description of the principles of the MFD system and of various signal processing and interpretation techniques is provided. It was found that when a flawed bar or cable is within 6 in. of the surface of the concrete beam, it is possible to detect and locate flaws with a minimum size equivalent to a S percent loss of a cross-sectional area of the steel.
Many existing structures, including highway bridges, have been designed by using the prestressing or post-tensioning concept. High-strength bars and cables are normally used as the primary structural components in these structures. The safe loadcarrying capability of such structural elements depends primarily on the integrity of these prestressing bars and cables . Because of the nature and type of construction, deterioration and eventual failure of one or more of these prestressing bars or cables could result in catastrophic failure of part or all of the structure.
As existine rrF:c;;tressed Rnd post-t~!1s!or!ed ccncrete ~true tures become older, it becomes more important to be able to evaluate the condition of their prestressing steel elements . Periodic visual inspections of prestressed concrete bridges throughout the world have demonstrated the growing problem of deterioration of the prestressing steel as a result of corrosion .
No reliable and practical nondestructive evaluation technique has been available for assessing the condition of the steel within concrete bridge members . Past research sponsored by the U.S. Department of Transportation, Federal Highway Administration (FHWA) , resulted in the development of a prototype instrument (see Figure 1) , the Magnetic Field Disturbance (MFD) system, for detecting flaws in the steel embedded in concrete (1). Other previous reports are described elsewhere (2-4). The system is based on applying a steady magnetic field near a member and scanning the member's surface to detect perturbations in the magnetic field caused by the presence of flaws in the prestressing or reinforcing steel.
This paper discusses the results of a study conducted at the University of Wisconsin-Milwaukee to evaluate the perfor-
Department of Civil Engineering and Mechanics, University of Wisconsin-Milwaukee .
FIGURE 1 The prototype MFD instrument.
mance of the MFD system, to enhance the data acquisition and signal processing techniques, and to create a database from a series of characterized MFD signals . The principles of the MFD and related signals are discussed first. The signal analysis methods employed during this study are next described. Result:; frvm the laboratOi"),- cxpc1i1neut~ a11J ficlJ test~ ul prestressed bridge beams are presented last.
PRINCIPLES OF MFD
The present MFD system consists of an electromagnet, detecting devices, and data acquisition and processing hardware and software. The detecting devices consist of an array of four Hall Effect sensors to detect perturbations of the applied magnetic field. The sensors are horizontally oriented between the electromagnet poles , as shown in Figure 2, to measure the changes in the vertical component of the magnetic field. The entire magnet and sensor assembly scans the bottom surface of a member along its length. The steel becomes magnetized, and the vertical component of the field is measured simultaneously by all sensors at closely spaced points , normally at 0.2-in. intervals, along the length of the member. Any disturbances of the field detected by the probes may be attributed to the presence of flaws, stirrups, or steel artifacts (i .e., chairs, scrap metals , etc.).
In the presence of a magnetic field, the atomic dipoles of the steel will become aligned with the external field , resulting in the development of a large flux within the steel (5). The degree of alignment depends on the strength of the magne-
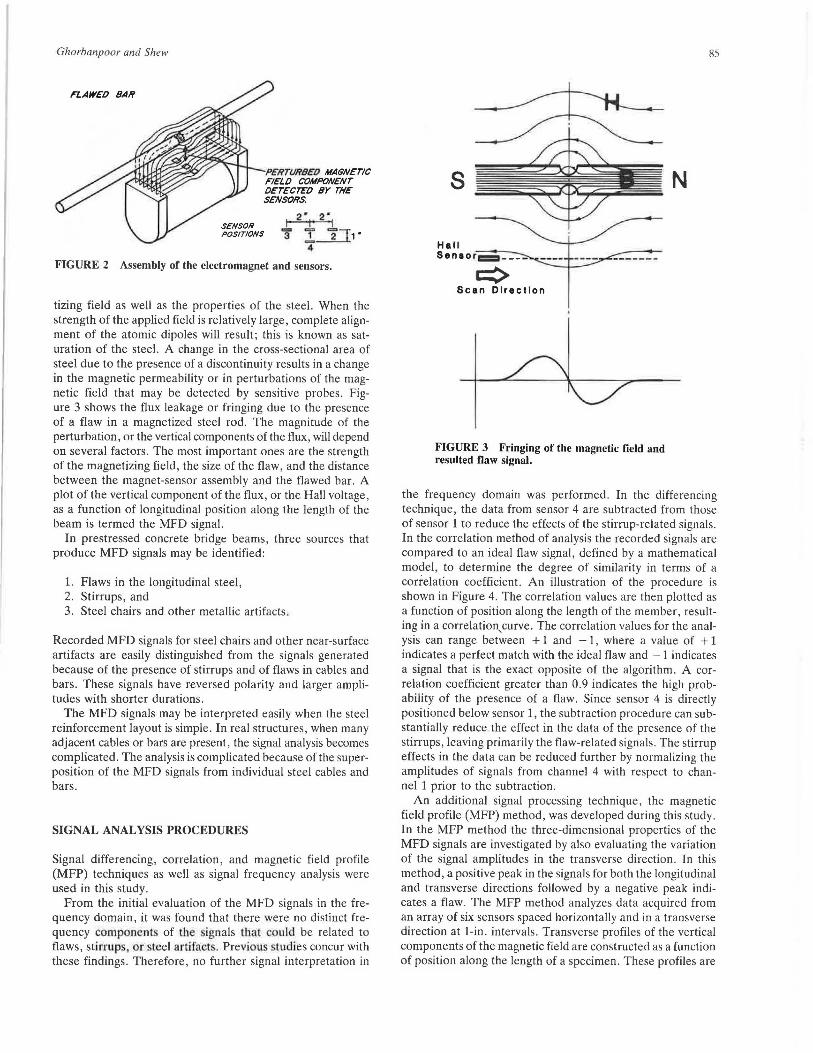
Ghorbanpoor and Shew
FLAWED BAR
PER TURBED MAGNETIC FIELD COMPONENT DETECTE'D er THE SENSORS.
SENSOR POSITIONS
I 2 "1 2"1 ~ c::=i c:;;-1 3 ..t.~1·
4
FIGURE 2 Assembly of the electromagnet and sensors.
tizing field as well as the properties of the steel. When the strength of the applied field is relatively large, complete alignment of the atomic dipoles will result; this is known as saturation of the steel. A change in the cross-sectional area of steel due to the presence of a discontinuity results in a change in the magnetic permeability or in perturbations of the magnetic field that may be detected by sensitive probes. Figure 3 shows the flux leakage or fringing due to the presence of a flaw in a magnetized steel rod. The magnitude of the perturbation, or the vertical components of the flux, will depend on several factors. The most important ones are the strength of the magnetizing field, the size of the flaw, and the distance between the magnet-sensor assembly and the flawed bar. A plot of the vertical component of the flux, or the Hall voltage, as a function of longitudinal position along the length of the beam is termed the MFD signal.
In prestressed concrete bridge beams, three sources that produce MFD signals may be identified:
1. Flaws in the longitudinal steel, 2. Stirrups, and 3. Steel chairs and other metallic artifacts.
Recorded MFD signals for steel chairs and other near-surface artifacts are easily distinguished from the signals generated because of the presence of stirrups and of flaws in cables and bars. These signals have reversed polarity and larger amplitudes with shorter durations.
The MFD signals may be interpreted easily when the steel reinforcement layout is simple. In real structures, when many adjacent cables or bars are present, the signal analysis becomes complicated. The analysis is complicated because of the superposition of the MFD signals from individual steel cables and bars.
SIGNAL ANALYSIS PROCEDURES
Signal differencing, correlation, and magnetic field profile (MFP) techniques as well as signal frequency analysis were used in this study.
From the initial evaluation of the MFD signals in the frequency domain, it was found that there were no distinct frequency component of the signals that could be related to flaws, stirrups, or steel artifacts. Previous studies concur with these findings. Therefore, no further signal interpretation in
s
Hall Senaorc::::::::::1--- -
c:> Scan Direction
FIGURE 3 Fringing of the magnetic field and resulted flaw signal.
85
N
the frequency domain was performed. In the differencing technique, the data from sensor 4 are subtracted from those of sensor 1 to reduce the effects of the stirrup-related signals. In the correlation method of analysis the recorded signals are compared to an ideal flaw signal, defined by a mathematical model, to determine the degree of similarity in terms of a correlation coefficient. An illustration of the procedure is shown in Figure 4. The correlation values are then plotted as a function of position along the length of the member, resulting in a correlation, curve. The correlation values for the analysis can range between + 1 and - 1, where a value of + 1 indicates a perfect match with the ideal flaw and -1 indicates a signal that is the exact opposite of the algorithm. A correlation coefficient greater than 0.9 indicates the high probability of the presence of a flaw. Since sensor 4 is directly positioned below sensor 1, the subtraction procedure can substantially reduce the effect in the data of the presence of the stirrups, leaving primarily the flaw-related signals. The stirrup effects in the data can be reduced further by normalizing the amplitudes of signals from channel 4 with respect to channel 1 prior to the subtraction.
An additional signal processing technique, the magnetic field profile (MFP) method, was developed during this study. In the MFP method the three-dimensional properties of the MFD signals are investigated by also evaluating the variation of the signal amplitudes in the transverse direction. In this method, a positive peak in the signals for both the longitudinal and transverse directions followed by a negative peak indicates a flaw. The MFP method analyzes data acquired from an array of six sensors spaced horizontally and in a transverse direction at 1-in. intervals . Transverse profiles of the vertical components of the magnetic field are constructed as a function of position along the length of a specimen. These profiles are
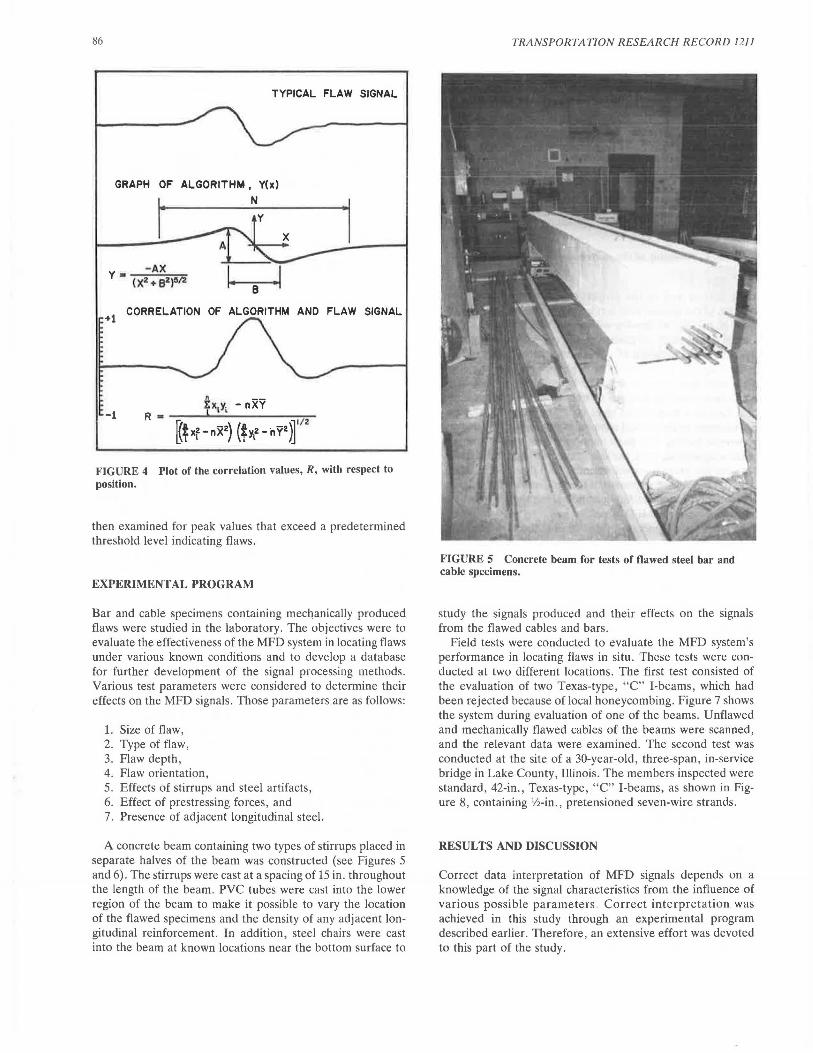
86
TYPICAL FLAW SIGNAL
GRAPH OF ALGORITHM, Y(x)
1 ·
N
·1
Y • - AX
1. .1 (X2 + 82)!!12 B
+l CORRELATION OF ALGORITHM AND FLAW SIGNAL
-1
FIGURE 4 Plot of the correlation values, R, with respect to position.
then examined for peak values that exceed a predetermined threshold level indicating flaws.
EXPERIMENTAL PROGRAM
Bar and cable specimens containing mechanically produced flaws were studied in the laboratory . The objectives were to evaluate the effectiveness of the MFD system in locating flaws under various known conditions and to develop a database for further development of the signal processing methods. Various test parameters were considered to determine their effects on the MFD signals. Those parameters are as follows:
1. Size of flaw, 2. Type of flaw, 3. Flaw depth, 4. Flaw orientation, 5. Effects of stirrups and steel artifacts, 6. Effect of prestressing forces, and 7. Presence of adjacent longitudinal steel.
A concrete beam containing two types of stirrups placed in separate halves of the beam was constructed (see Figures 5 and 6). The stirrups were cast at a spacing of 15 in. throughout the length of the beam. PVC tubes were cast into the lower region of the beam to make it possible to vary the location of the flawed specimens and the density of any adjacent longitudinal reinforcement. In addition, steel chairs were cast into the beam at known locations near the bottom surface to
TRANSPORTATION RESEARCH RECORD 1211
FIGURE 5 Concrete beam for tests of flawed steel bar and cable specimens.
study the signals produced and their effects on the signals from the flawed cables and bars .
Field tests were conducted to evaluate the MFD system's performance in locating flaws in situ. These tests were condudeu al lwo uifforent locations. The first test consisted of the evaluation of two Texas-type , "C" I-beams , which had been rejected because of local honeycombing. Figure 7 shows the system during evaluation of one of the beams. Unflawed and mechanically flawed cables of the beams were scanned, and the relevant data were examined. The second test was conducted at the site of a 30-year-old, three-span , in-service bridge in Lake County, Illinois . The members inspected were standard, 42-in ., Texas-type, " C" I-beams, as shown in Figure 8, containing Vi-in., pretensioned seven-wire strands.
RES UL TS AND DISCUSSION
Correct data interpretation of MFD signals depends on a knowledge of the signal characteristics from the influence of various possible parameters . Correct interpretation was achieved in this study through an experimental program described earlier. Therefore , an extensive effort was devoted to this part of the study.
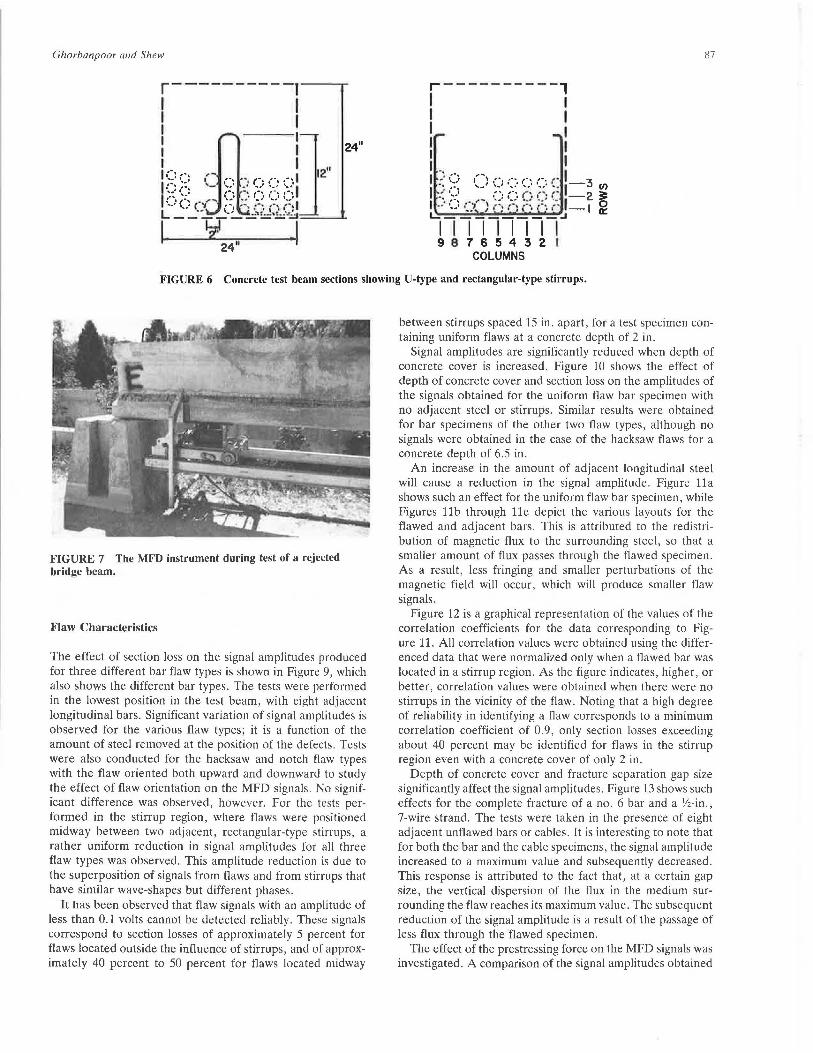
Ghorbanpoor and Shew
r----------, I I I I
! :] I I II
1{-· •.• -~ I 12 ":' ·..... \. .... -~ ... , , .. , _,., •""'\ I''·· ----·-···-····1 I;.-..:· .. :~ . ........ <:~ ..... ~ () () :.:~
•·· C· c ., • -, •·• :··.· •. , r• I L .. \.. ~"-.1 ............. --u-------1 Z'24" .1
24"
r----------1 I I I I I I I I : I I _: Cl ('\ .. , , .. ,. ••.. (. I .,.
-, ,:" ...... ' •,_, • ..... • .... ' • .... • .... ,-~ Cl)
I . .I ' l .. ,., (' ,. ,. 2 > ... ::, .,. ..... ' ..... : ........ / • .. ) • ... ,- ~ I .: · ... C~ ) r·· r: f' ·1 ,-· - I ~ 1....::--------:J I I I I I I I I I 9 8 7 6 5 4 3 2 I
COLUMNS
87
FIGURE 6 Concrete test beam sections showing U-type and rectangular-type stirrups.
FIGURE 7 The MFD instrument during test of a rejected bridge beam.
Flaw Characteristics
The effect of section loss on the signal amplitudes produced for three different bar flaw types is shown in Figure 9, which also shows the different bar types. The tests were performed in the lowest position in the test beam, with eight adjacent longitudinal bars. Significant variation of signal amplitudes is observed for the various flaw types; it is a function of the amount of steel removed at the position of the defects. Tests were also conducted for the hacksaw and notch flaw types with the flaw oriented both upward and downward to study the effect of flaw orientation on the MFD signals. No significant difference was observed, however. For the tests performed in the stirrup region, where flaws were positioned midway between two adjacent, rectangular-type stirrups, a rather uniform reduction in signal amplitudes for all three flaw types was observed. This amplitude reduction is due to the superposition of signals from flaws and from stirrups that have similar wave-shapes but different phases.
It has been observed that flaw signals with an amplitude of less than 0.1 volts cannot be detected reliably. These signals correspond to section losses of approximately 5 percent for flaws located outside the influence of stirrups, and of approximately 40 percent to 50 percent for flaws located midway
between stirrups spaced 15 in. apart, for a test specimen containing uniform flaws at a concrete depth of 2 in.
Signal amplitudes are significantly reduced when depth of concrete cover is increased. Figure 10 shows the effect of depth of concrete cover and section loss on the amplitudes of the signals obtained for the uniform flaw bar specimen with no adjacent steel or stirrups. Similar results were obtained for bar specimens of the other two flaw types, although no signals were obtained in the case of the hacksaw flaws for a concrete depth of 6.5 in.
An increase in the amount of adjacent longitudinal steel will cause a reduction in the signal amplitude. Figure lla shows such an effect for the uniform flaw bar specimen, while Figures llb through lle depict the various layouts for the flawed and adjacent bars. This is attributed to the redistribution of magnetic flux to the surrounding steel, so that a smaller amount of flux passes through the flawed specimen. As a result, less fringing and smaller perturbations of the magnetic field will occur, which will produce smaller flaw signals.
Figure 12 is a graphical representation of the values of the correlation coefficients for the data corresponding to Figure 11. All correlation values were obtained using the differenced data that were normalized only when a flawed bar was located in a stirrup region. As the figure indicates, higher, or better, correlation values were obtained when there were no stirrups in the vicinity of the flaw. Noting that a high degree of reliability in identifying a flaw corresponds to a minimum correlation coefficient of 0.9, only section losses exceeding about 40 percent may be identified for flaws in the stirrup region even with a concrete cover of only 2 in.
Depth of concrete cover and fracture separation gap size significantly affect the signal amplitudes. Figure 13 shows such effects for the complete fracture of a no. 6 bar and a V2-in., 7-wire strand. The tests were taken in the presence of eight adjacent unflawed bars or cables. It is interesting to note that for both the bar and the cable specimens, the signal amplitude increased to a maximum value and subsequently decreased. This response is attributed to the fact that, at a certain gap size, the vertical dispersion of the flux in the medium surrounding the flaw reaches its maximum value. The subsequent reduction of the signal amplitude is a result of the passage of less flux through the flawed specimen.
The effect of the prestressing force on the MFD signals was investigated. A comparison of the signal amplitudes obtained
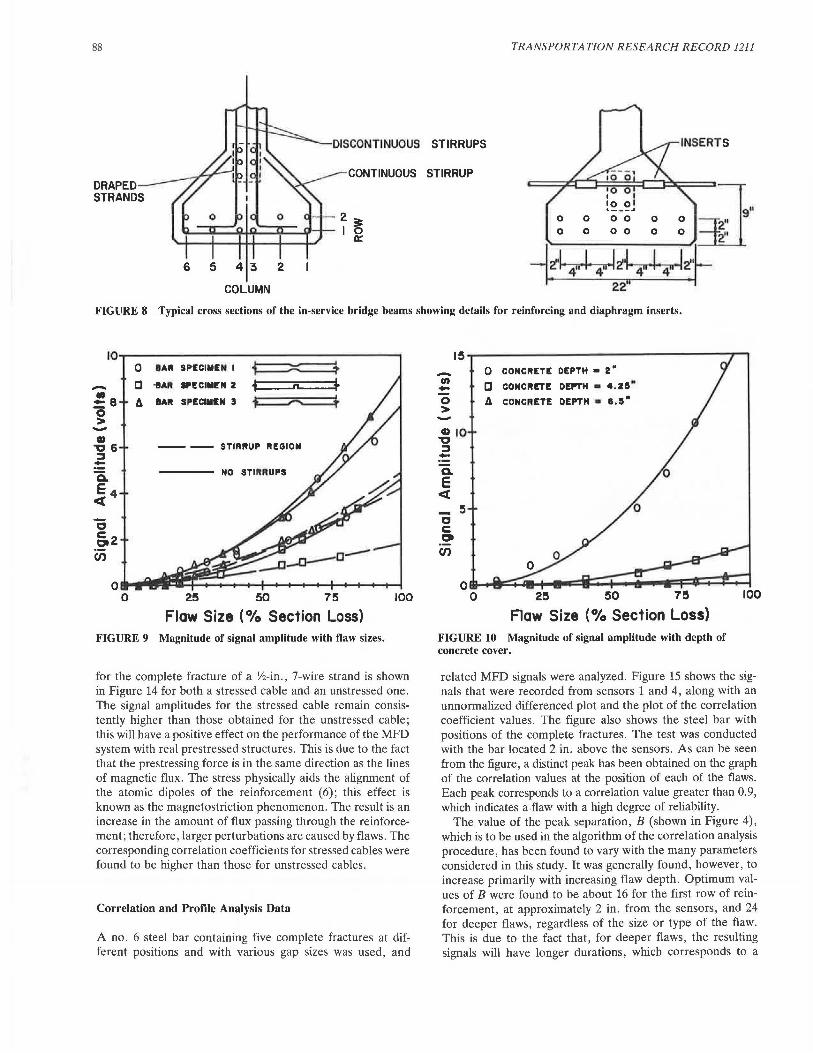
88 TRANSPORTATION RESEARCH RECORD 1211
DISCONTINUOUS STIRRUPS
CONTINUOUS STIRRUP DRAPED STRANDS
6 5 4 3 2
COLUMN
0 0 0 0 9"
0 0 0 0 0 0
_J2·l 4" I 4" l2·l 4"'''4" l~"F I 22"
FIGURE 8 Typical cross sections of the in-service bridge beams showing details for reinforcing and diaphragm inserts.
-!! 8 0 > -
a 6.2 en
0 IAR SPECIMEN I
C ·IAR IPECIMEN 2
6 IAR SPECIMEN :S
-- -- STIRRUP REGION
NO STIRRUPS
o~~~~:::__i--+-_J 0 25 50 75 100
Flaw Size ( 0/o Section Loss) FIGURE 9 Magnitude of signal amplitude with flaw sizes.
for the complete fracture of a 'lz-in., 7-wire strand is shown in Figure 14 for both a stressed cable and an unstressed one. The signal amplitudes for the stressed cable remain consistently higher than those obtained for the unstressed cable; this will have a positive effect on the performance of the MFD system with real prestressed structures. This is due to the fact that the prestressing force is in the same direction as the lines of magnetic flux. The stress physically aids the alignment of the atomic dipoles of the reinforcement ( 6); this effect is known as the magnetostriction phenomenon. The result is an increase in the amount of flux passing through the reinforcement; therefore, larger perturbations are caused by flaws. The corresponding correlation coefficients for stressed cables were found to be higher than those for unstressed cables.
Correlation and Profile Analysis Data
A no. 6 steel bar containing five complete fractures at different positions and with various gap sizes was used, and
-en -0 > -
I !5 0 CONCRETE DEPTH • 2"
C CONC .. IETE DEl'TH • 4. 25 •
6 CONCRETE DEPTH • e.s.
t>IO '"IC ::J -a. E <t
!5 a c Ct
en
od.-~~+-a~i;:i:::;+::::;..;....-.=F=I!::;:::~ 0 2!5 !50 7!5 100
Flaw Size (0/o Section Loss) FIGURE IO Magnitude of signal amplitude with depth of concrete cover.
related MFD signals were analyzed. Figure 15 shows the signals that were recorded from sensors 1 and 4, along with an unnormalized differenced plot and the plot of the correlation coefficient values. The figure also shows the steel bar with positions of the complete fractures. The test was conducted with the bar located 2 in. above the sensors. As can be seen from the figure, a distinct peak has been obtained on the graph of the correlation values at the position of each of the flaws. Each peak corresponds to a correlation value greater than 0.9, which indicates a flaw with a high degree of reliability.
The value of the peak separation, B (shown in Figure 4), which is to be used in the algorithm of the correlation analysis procedure, has been found to vary with the many parameters considered in this study. It was generally found, however, to increase primarily with increasing flaw depth. Optimum values of B were found to be about 16 for the first row of reinforcement, at approximately 2 in. from the sensors, and 24 for deeper flaws, regardless of the size or type of the flaw. This is due to the fact that, for deeper flaws, the resulting signals will have longer durations, which corresponds to a
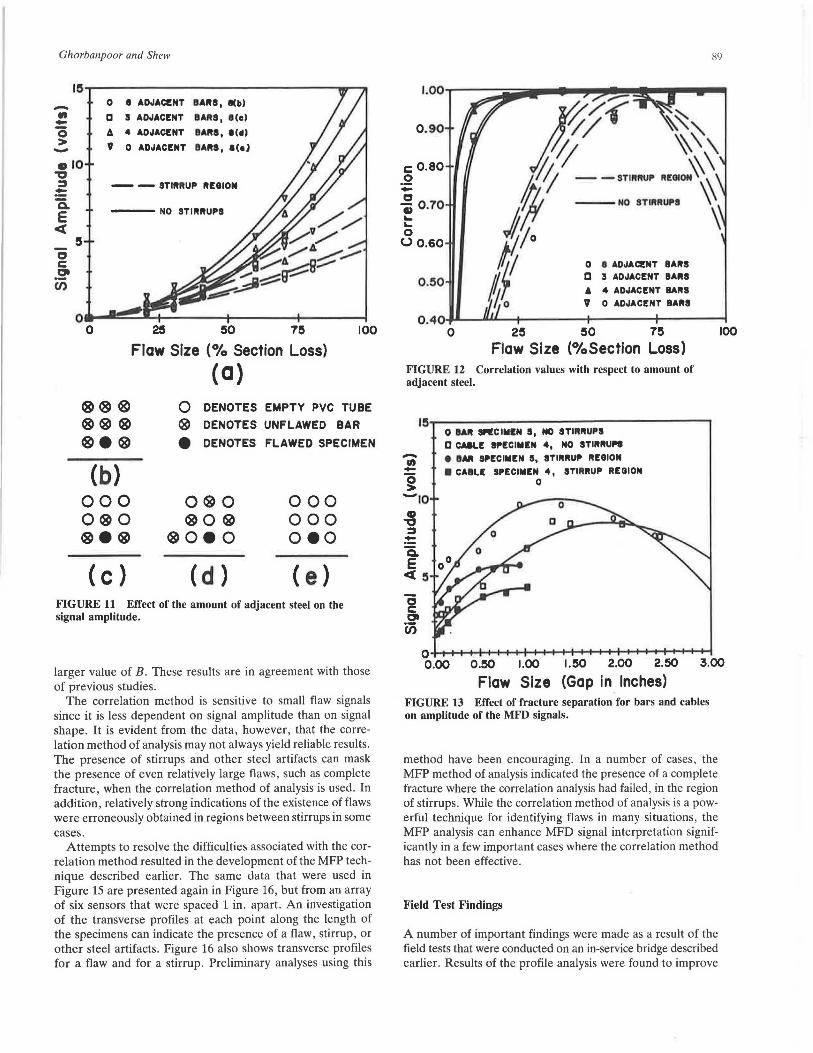
Ghorbanpoor and Shew
-.. -0 > -
0 I ADJA~NT llAIH, l(b)
D :S ADJACENT 8AftS, l(o)
6 4 ADJACENT 9AltS, 1(11)
9 0 ADJACENT 9Alt9, l(e)
- - STlftftUP ftHION
--- NO STlftltUPS
2!5 50 7!5
Flaw Size (0/o Section Loss)
(a)
100
0 DENOTES EMPTY PVC TUBE
® DENOTES UNFLAWED BAR
(b) 000 0®0 ®•®
(c)
• DENOTES FLAWED SPECIMEN
O®O ®O®
®OeO
( d)
000 000 oeo
( e) FIGURE 11 Effect of the amount of adjacent steel on the signal amplitude.
larger value of B. These results are in agreement with those of previous studies.
The correlation method is sensitive to small flaw signals since it is less dependent on signal amplitude than on signal shape. It is evident from the data, however, that the correlation method of analysis may not always yield reliable results. The presence of stirrups and other steel artifacts can mask the presence of even relatively large flaws , such as complete fracture, when the correlation method of analysis is used. In addition, relatively strong indications of the existence of flaws were erroneously obtained in regions between stirrups in some cases.
Attempts to resolve the difficulties associated with the correlation method resulted in the development of the MFP technique described earlier. The same data that were used in Figure 15 are presented again in Figure 16, but from an array of six sensors that were spaced 1 in. apart. An investigation of the transverse profiles at each point along the length of the specimens can indicate the presence of a flaw, stirrup, or other steel artifacts. Figure 16 also shows transverse profiles for a flaw and for a stirrup. Preliminary analyses using this
0.90
c0.80 .2 -0 ti 0.70 ~ ~
0 (.) 0.60
0.50
89
0.40 ..... --'"~-+-------1~---+-----t 0 2!5 50 7!5 100
Flaw Size (0/oSection Loss) FIGURE 12 Correlation values with respect to amount of adjacent steel.
0 !Aft RCIMIN S, NO STlltftUl'S D CMLE SPECIMEN 4, NO STlftftUPS
I Hit SPECIMEN 5, STlftftUP ftEGION
• CAILE SPECIMEN 4, STlftftUP REGION 0
o+..-+-+-+4-i1-t-+-1-+-+-+-+-............. -+-+-t-+-+-+-+-1t-t--t-t-t'"1 0.00 0.!50 1.00 1.50 2.00 2.50 3.00
Flaw Size (Gap in Inches) FIGURE 13 Effect of fracture separation for bars and cables on amplitude of the MFD signals.
method have been encouraging. In a number of cases, the MFP method of analysis indicated the presence of a complete fracture where the correlation analysis had failed, in the region of stirrups. While the correlation method of analysis is a powerful technique for identifying flaws in many situations , the MFP analysis can enhance MFD signal interpretation significantly in a few important cases where the correlation method has not been effective.
Field Test Findings
A number of important findings were made as a result of the field tests that were conducted on an in-service bridge described earlier. Results of the profile analysis were found to improve
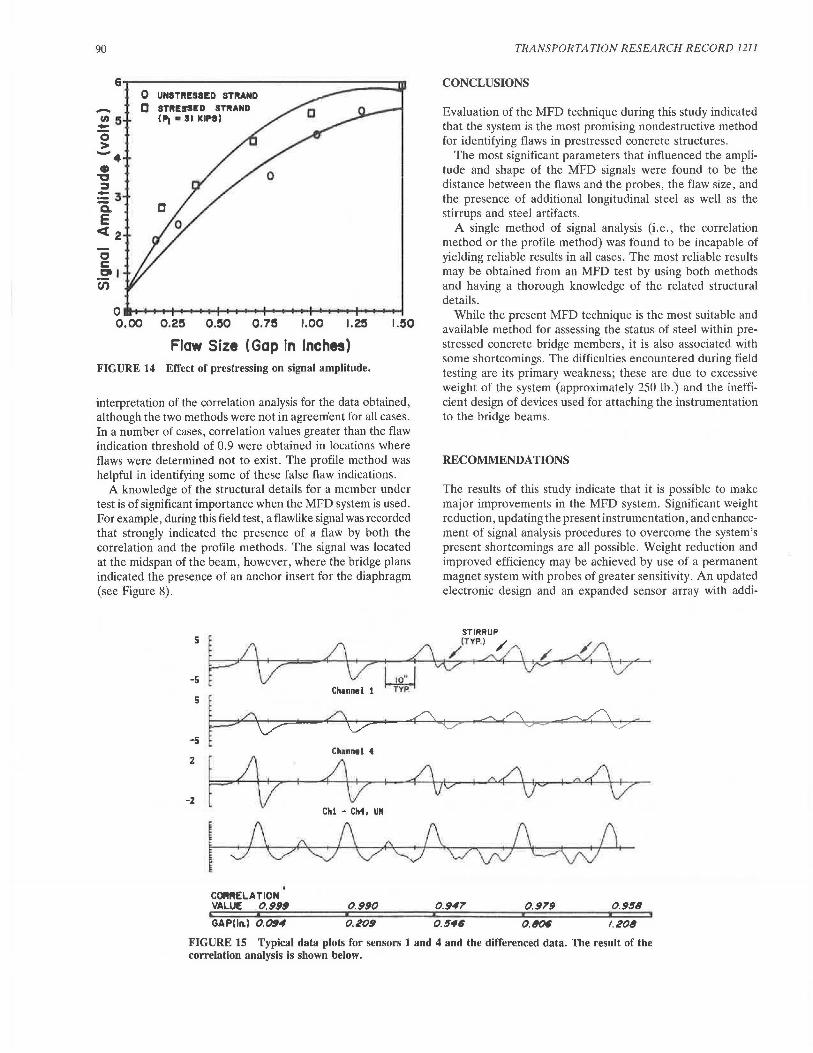
90
-!? !5 0 > -4 • .,, :J :3 Q. E <t 2
c c et I c;;
0 UNSTft!SSED STftAND 0 STftESS!D STftAND
("t •:SI KIPS)
o .......... +..,......._ ................ -.-..................... ~ ............................... .-i 0.00 0.2!5 0.!50 0;7!5 1.00 1.2!5 l.!50
Flaw Size (Gap In Inches) FIGURE 14 Effect of prestressing on signal amplitude.
interpretation of the correlation analysis for the data obtained, although the two methods were not in agreerrient for all cases. In a number of cases, correlation values greater than the flaw indication threshold of 0.9 were obtained in locations where flaws were determined not to exist. The profile method was helpful in identifying some of these false flaw indications.
A knowledge of the structural details for a member under test is of significant importance when the MFD system is used. For example, during this field test, a flawlike signal was recorded that strongly indicated the presence of a flaw by both the correlation and the profile methods. The signal was located at the midspan of the beam, however, where the bridge plans indicated the presence of an anchor insert for the diaphragm (see Figure 8).
TRANSPORTATION RESEARCH RECORD 1211
CONCLUSIONS
Evaluation of the MFD technique during this study indicated that the system is the most promising nondestructive method for identifying flaws in prestressed concrete structures.
The most significant parameters that influenced the amplitude and shape of the MFD signals were found to be the distance between the flaws and the probes, the flaw size, and the presence of additional longitudinal steel as well as the stirrups and steel artifacts.
A single method of signal analysis (i.e., the correlation method or the profile method) was found to be incapable of yielding reliable results in all cases. The most reliable results may be obtained from an MFD test by using both methods and having a thorough knowledge of the related structural details.
While the present MFD technique is the most suitable and available method for assessing the status of steel within prestressed concrete bridge members, it is also associated with some shortcomings. The difficulties encountered during field testing are its primary weakness; these are due to excessive weight of the system (approximately 250 lb.) and the inefficient design of devices used for attaching the instrumentation to the bridge beams.
RECOMMEND A TIO NS
The results of this study indicate that it is possible to make major improvements in the MFD system. Significant weight reduction, updating the present instrumentation, and enhancement of signal analysis procedures to overcome the system's present shortcomings are all possible. Weight reduction and improved efficiency may be achieved by use of a permanent magnet system with probes of greater sensitivity. An updated electronic design and an expanded sensor array with addi-
STIRRUP
LJ (TYP.) / ~ \71 461/\4~,
I CORRELATION VALUE 0.99!1
GA P(ln.) 0. O!l4
w Channe I 1 TYP.
?\y I
ChanMI 4
Chi - Ch1, UN
0.990
0.209
0.947 0.979 0.948
0.446 0.8()(1 1.208
FIGURE 15 Typical data plots for sensors 1 and 4 and the differenced data. The result of the correlation analysis is shown below.
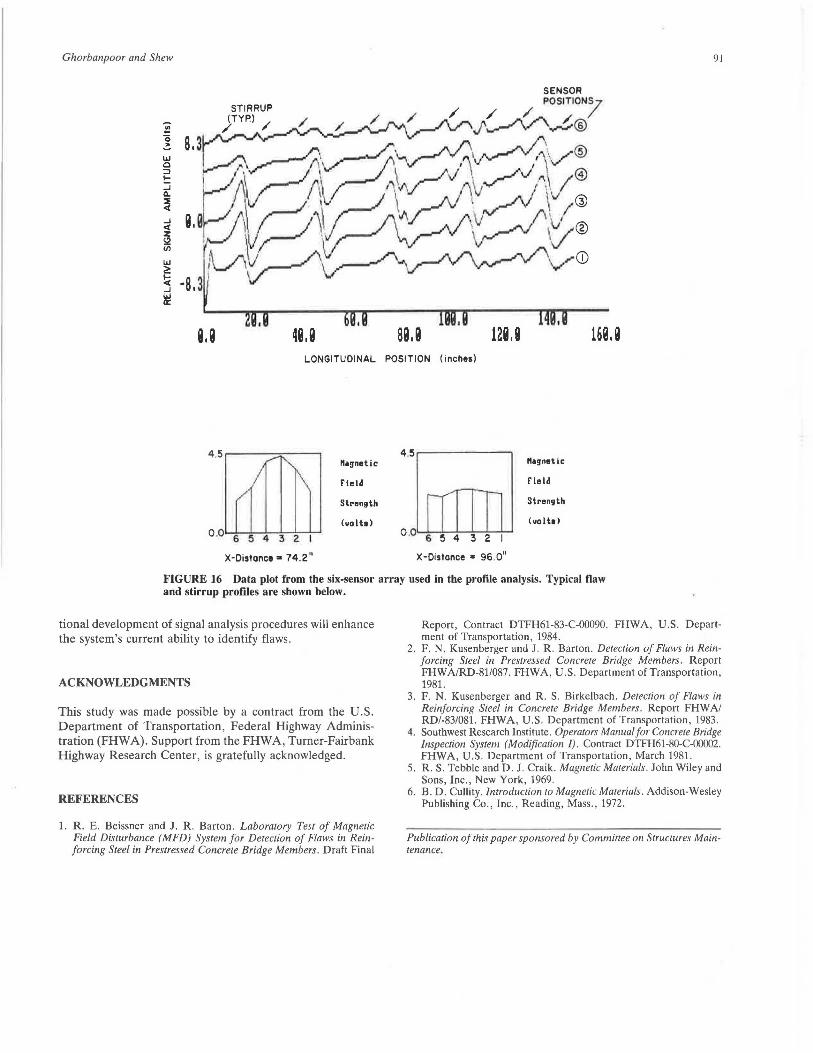
Ghorbanpoor and Shew 91
9.8 49.9 89.9 129.9 169.9 LONGITUDINAL POSITION (inches)
4 .5 ,.------- -. "agnetic "agnetic
Field Field
Strength Strength
(volts) (uolta)
X-Distance,. 74.2" X-Oistance = 96.0"
FIGURE 16 Data plot from the six-sensor array used in the profile analysis. Typical flaw and stirrup profiles are shown below.
tional development of signal analysis procedures will enhance the system's current ability to identify flaws.
ACKNOWLEDGMENTS
This study was made possible by a contract from the U.S. Department of Transportation, Federal Highway Administration (FHWA). Support from the FHWA, Turner-Fairbank Highway Research Center, is gratefully acknowledged.
REFERENCES
1. R. E. Beissner and J. R. Barton. Laboratory Test of Magnetic Field Disturbance (MFD) System for Detection of Flaws in Reinforcing Steel in Prestressed Concrete Bridge Members. Draft Final
Report, Contract DTFH61-83-C-00090. FHWA, U.S. Department of Transportation, 1984.
2. F. N. Kusenberger and J. R. Barton. Detection of Flaws in Reinforcing Steel in Preslressed Concrete Bridge Members. Report FHWA/RD-81/087. FHWA, U.S. Department of Transportation, 1981.
3. F. N. Kusenberger and R. S. Birkelbach. Detection of Flaws in Reinforcing Steel in Concrete Bridge Members. Report FHWA/ RD/-83/081. FHWA, U.S. Department of Transportation, 1983.
4. Southwest Research Institute. Operators Manual for Concrete Bridge Inspection System (Modification I) . Contract DTFH61-80-C-00002. FHWA, U.S. Department of Transportation, March 1981.
5. R. S. Tebble and D. J. Craik. Magnetic Materials. John Wiley and Sons, Inc., New York, 1969.
6. B. D. Cullity. Introduction to Magnetic Materials. Addison-Wesley Publishing Co., Inc., Reading, Mass., 1972.
Publication of this paper sponsored by Committee on Structures Maintenance.
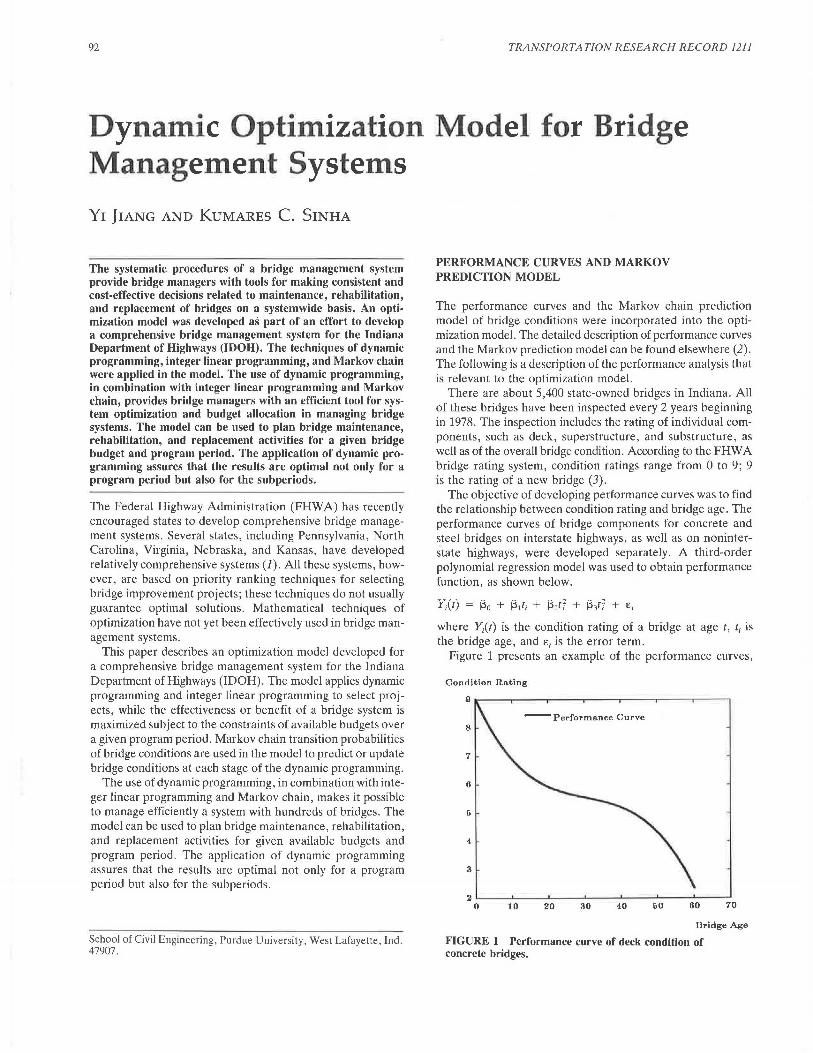
92 TRANSPORTATION RESEARCH RECORD 1211
Dynamic Optimization Model for Bridge Management Systems
YI JIANG AND KUMARES c. SINHA
The systematic procedures of a bridge management system provide bridge managers with tools for making consistent and cost-effective decisions related to maintenance, rehabilitation, and replacement of bridges on a systemwide basis. An optimization model was developed as part of an effort to develop a comprehensive bridge management system for the Indiana Department of Highways (IDOH). The techniques of dynamic programming, integer linear programming, and Markov chain were applied in the model. The use of dynamic programming, in combination with integer linear programming and Markov chain, provides bridge managers with an efficient tool for system optimization and budget allocation in managing bridge systems. The model can be used to plan bridge maintenance, rehabilitation, and replacement activities for a given bridge budget and program period. The application of dynamic programming assures that the results are optimal not only for a program period but also for the subperiods.
The Federal Highway Administration (FHWA) has recently encouraged states to develop comprehensive bridge management systems. Several states, including Pennsylvania, North Carolina, Virginia, Nebraska, and Kansas, have developed relatively comprehensive systems (1). All these systems, however, are based on priority ranking techniques for selecting bridge improvement projects; these techniques do not usually guarantee optimal solutions. Mathematical techniques of optimization have not yet been effectively used in bridge management systems.
This paper describes an optimization model developed for a comprehensive bridge management system for the Indiana Department of Highways (IDOH). The model applies dynamic programming and integer linear programming to select projects, while the effectiveness or benefit of a bridge system is maximized subject to the constraints of available budgets over a given program period. Markov chain transition probabilities of bridge conditions are used in the model to predict or update bridge conditions at each stage of the dynamic programming.
The use of dynamic programming, in combination with integer linear programming and Markov chain, makes it possible to manage efficiently a system with hundreds of bridges. The model can be used to plan bridge maintenance, rehabilitation, and replacement activities for given available budgets and program period. The application of dynamic programming assures that the results are optimal not only for a program period but also for the subperiods.
School of Civil Engineering, Purdue University, West Lafayette, Ind. 47907.
PERFORMANCE CURVES AND MARKOV PREDICTION MODEL
The performance curves and the Markov chain prediction model of bridge conditions were incorporated into the optimization model. The detailed description of performance curves and the Markov prediction model can be found elsewhere (2). The following is a tlescriplion of lhe performance analysis that is relevant to the optimization model.
There are about 5,400 state-owned bridges in Indiana. All of these bridges have been inspected every 2 years beginning in 1978. The inspection includes the rating of individual components, such as deck, superstructure, and substructure, as well as of the overall bridge condition. According to the FHWA bridge rating system, condition ratings range from 0 to 9; 9 is the rating of a new bridge (3).
The objective of developing performance curves was to find the relationship between condition rating and bridge age. The performance curves of bridge components for concrete and steel bridges on interstate highways, as well as on noninterstate highways, were developed separately. A third-order polynomial regression model was used to obtain performance function, as shown below.
where Y;(t) is the condition rating of a bridge at age t, t; is the bridge age, and E; is the error term.
Figure 1 presents an example of the performance curves,
Condition Rating
--Performance Curve 8
7
6
5
4
3
2 '--~--'-~~-'-~~..__~--'~~--'-~~_,._~__.
0 10 20 30 40 60 60 70
Bridge Age
FIGURE 1 Performance curve of deck condition of concrete bridges.
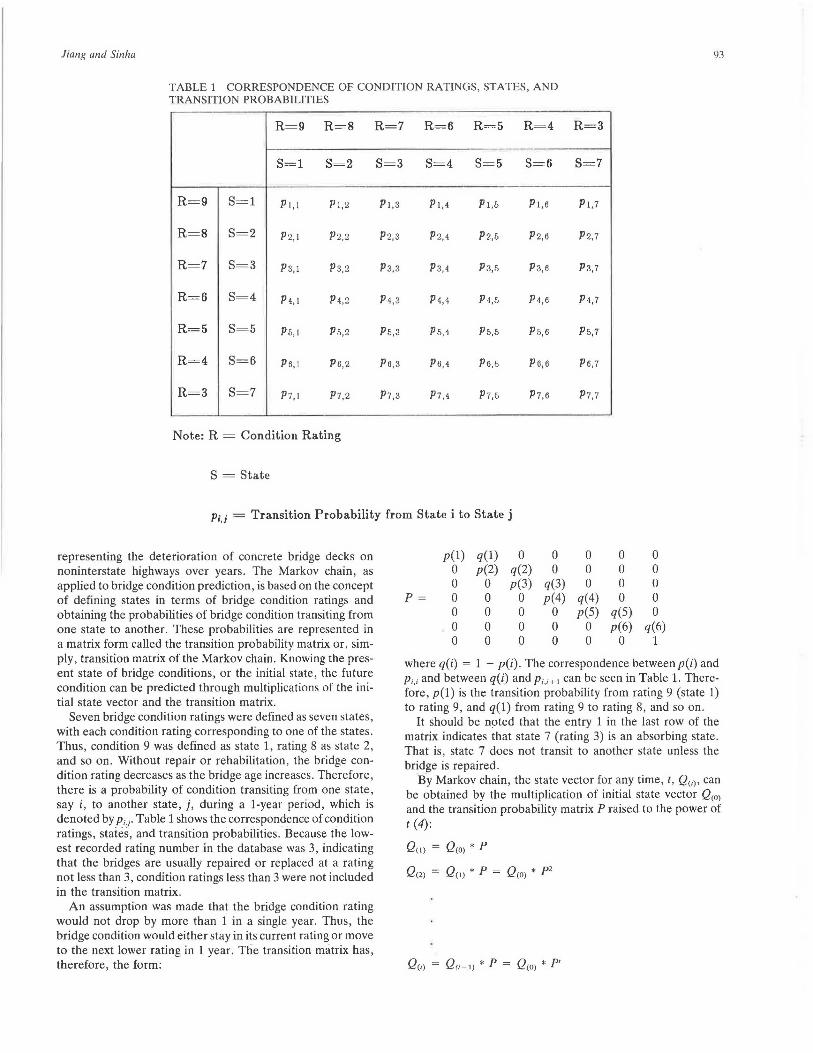
Jiang and Sinha 93
TABLE 1 CORRESPONDENCE OF CONDITION RATINGS , STATES, AND TRANSITION PROBABILITIES
R=9 R=8 R=7 R=6 R=5 R=4 R=3
S=l S=2 S=3 S=4 S=5 S=6 S=7
R=9 S=l PI,! P1,2 PI,3 PI,4 P1,& PI,6 p 1.7
R=8 S=2 P 2, 1 P 2,2 P2,3 P 2,4 P2,& P 2,6 P2,1
R=7 S=3 P 3,1 P3,2 P 3,3 P 3, 4 P3,& P3,6 P3,7
R=6 S=4 P4,I P4,2 P4, 3 P4,4 P4,5 P4,6 P4,7
R=5 S=5 P&,1 P&,2 P&, 3 P&,4 P&,5 P&,6 P&,1
R=4 S=6 P6,1 P6,2 PB, 3 P6,4 P6,& P6,6 P6,7
R=3 S=7 P7,I P1,2 P7,3 P7,4 P1,& P7,6 P1,1
Note: R = Condition Rating
S =State
P. · = Transition Probability from State i to State j '·'
representing the deterioration of concrete bridge decks on noninterstate highways over years. The Markov chain, as applied to bridge condition prediction, is based on the concept of defining states in terms of bridge condition ratings and obtaining the probabilities of bridge condition transiting from one state to another. These probabilities are represented in a matrix form called the transition probability matrix or, simply, transition matrix of the Markov chain. Knowing the present state of bridge conditions, or the initial state, the future condition can be predicted through multiplications of the initial state vector and the transition matrix.
Seven bridge condition ratings were defined as seven states, with each condition rating corresponding to one of the states . Thus , condition 9 was defined as state 1, rating 8 as state 2, and so on. Without repair or rehabilitation, the bridge condition rating decreases as the bridge age increases. Therefore, there is a probability of condition transiting from one state, say i, to another state, j, during a 1-year period, which is denoted by P;J· Table 1 shows the correspondence of condition ratings, states, and transition probabilities. Because the lowest recorded rating number in the database was 3, indicating that the bridges are usually repaired or replaced at a rating not less than 3, condition ratings less than 3 were not included in the transition matrix.
An assumption was made that the bridge condition rating would not drop by more than 1 in a single year. Thus, the bridge condition would either stay in its current rating or move to the next lower rating in 1 year. The transition matrix has, therefore, the form:
p(l) q(l) 0 0 0 0 0 0 p(2) q(2) 0 0 0 0 0 0 p(3) q(3) 0 0 0
P= 0 0 0 p(4) q(4) 0 0 0 0 0 0 p(5) q(S) 0 0 0 0 0 0 p(6) q(6) 0 0 0 0 0 0 1
where q(i) = 1 - p(i). The correspondence between p(i) and P;,; and between q(i) and p;.;+ 1 can be seen in Table 1. Therefore, p(l) is the transition probability from rating 9 (state 1) to rating 9, and q(l) from rating 9 to rating 8, and so on.
It should be noted that the entry 1 in the last row of the matrix indicates that state 7 (rating 3) is an absorbing state. That is, state 7 does not transit to another state unless the bridge is repaired.
By Markov chain, the state vector for any time, t, Q<,l• can be obtained by the multiplication of initial state vector Qco> and the transition probability matrix Praised to the power of t (4):
Q(l) = Q(O) * p
Q(2) = Q(!) * p = Q(O) * p 2
Q(t) = Q(t - 1) * p = Q(O) * pt
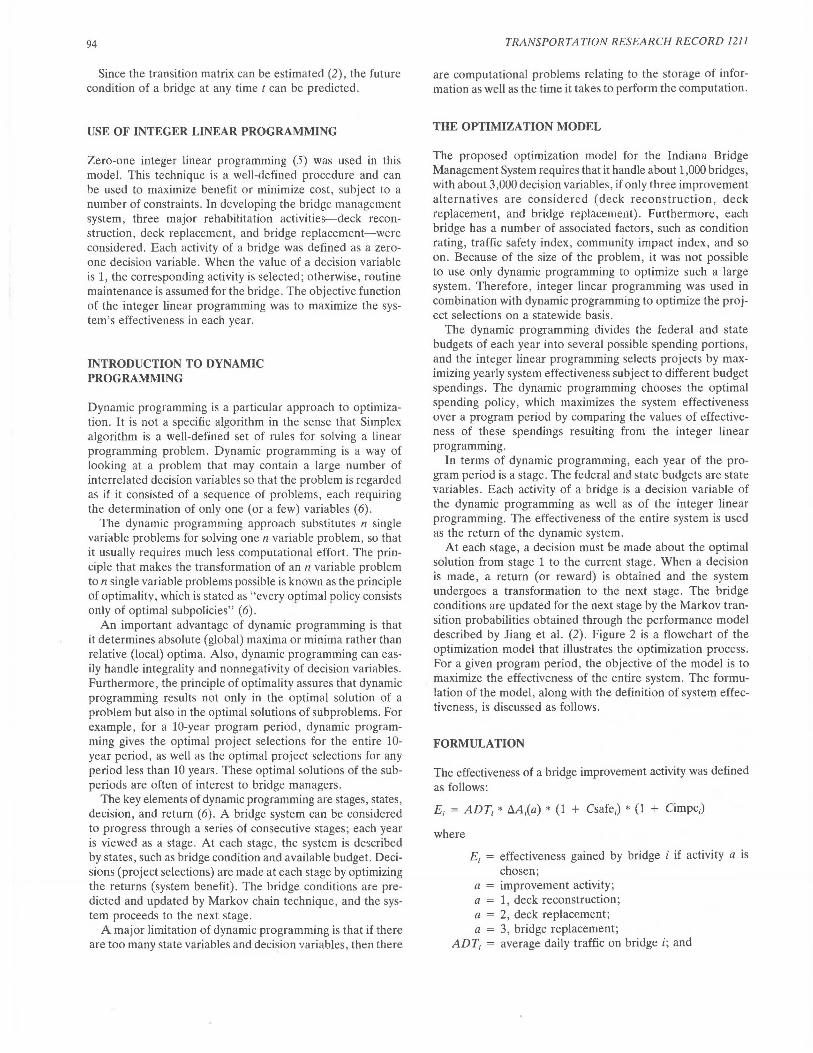
94
Since the transition matrix can be estimated (2), the future condition of a bridge at any time t can be predicted.
USE OF INTEGER LINEAR PROGRAMMING
Zero-one integer linear programming (5) was used in this model. This technique is a well-defined procedure and can be used to maximize benefit or minimize cost, subject to a number of constraints. In developing the bridge management system, three major rehabilitation activities-deck reconstruction, deck replacement, and bridge replacement-were considered. Each activity of a bridge was defined as a zeroone decision variable. When the value of a decision variable is 1, the corresponding activity is selected; otherwise, routine maintenance is assumed for the bridge. The objective function of the integer linear programming was to maximize the system's effectiveness in each year.
INTRODUCTION TO DYNAMIC PROGRAMMING
Dynamic programming is a particular approach to optimization. It is not a specific algorithm in the sense that Simplex algorithm is a well-defined set of rules for solving a linear programming problem. Dynamic programming is a way of looking at a problem that may contain a large number of interrelated decision variables so that the problem is regarded as if it consisted of a sequence of problems, each requiring the determination of only one (or a few) variables (6).
The dynamic programming approach substitutes n single variable problems for solving one n variable problem, so that it usually requires much less computational effort. The principle that makes the transformation of an n variable problem ton single variable problems possible is known as the principle of optimality, which is stated as "everv optimal oolicv consists only of optimal subpolicies" (6). . . · .
An important advantage of dynamic programming is that it determines absolute (global) maxima or minima rather than relative (local) optima. Also, dynamic programming can easily handle integrality and nonnegativity of decision variables. Furthermore, the principle of optimality assures that dynamic programming results not only in the optimal solution of a problem but also in the optimal solutions of subproblems. For example, for a 10-year program period, dynamic programming gives the optimal project selections for the entire 10-year period, as well as the optimal project selections for any period less than 10 years. These optimal solutions of the subperiods are often of interest to bridge managers.
The key elements of dynamic programming are stages, states, decision, and return (6). A bridge system can be considered to progress through a series of consecutive stages; each year is viewed as a stage. At each stage, the system is described by states, such as bridge condition and available budget. Decisions (project selections) are made at each stage by optimizing the returns (system benefit). The bridge conditions are predicted and updated by Markov chain technique, and the system proceeds to the next stage.
A major limitation of dynamic programming is that if there are too many state variables and decision nriables, then there
TRANSPORTATION RESEARCH RECORD 1211
are computational problems relating to the storage of information as well as the time it takes to perform the computation.
THE OPTIMIZATION MODEL
The proposed optimization model for the Indiana Bridge Management System requires that it handle about 1,000 bridges, with about 3,000 decision variables, if only three improvement alternatives are considered (deck reconstruction, deck replacement, and bridge replacement). Furthermore, each bridge has a number of associated factors, such as condition rating, traffic safety index, community impact index, and so on. Because of the size of the problem, it was not possible to use only dynamic programming to optimize such a large system. Therefore, integer linear programming was used in combination with dynamic programming to optimize the project selections on a statewide basis.
The dynamic programming divides the federal and state budgets of each year into several possible spending portions, and the integer linear programming selects projects by maximizing yearly system effectiveness subject to different budget spendings. The dynamic programming chooses the optimal spending policy, which maximizes the system effectiveness over a program period by comparing the values of effectiveness of these spendings resulting from the integer linear programming.
In terms of dynamic programming, each year of the program period is a stage. The federal and state budgets are state variables. Each activity of a bridge is a decision variable of the dynamic programming as well as of the integer linear programming. The effectiveness of the entire system is used as the return of the dynamic system.
At each stage, a decision must be made about the optimal solution from stage 1 to the current stage. When a decision is made, a return (or reward) is obtained and the system undergoes a transformation to the next stage. The bridge conditions are updated for the next stage by the Markov transition probabilities obtained through the performance model described by Jiang et al. (2). Figure 2 is a flowchart of the optimization model that illustrates the optimization process. For a given program period, the objective of the model is to maximize the effectiveness of the entire system. The formulation of the model, along with the definition of system effectiveness, is discussed as follows.
FORMULATION
The effectiveness of a bridge improvement activity was defined as follows:
E; = ADT; * M;(a) * (1 + Csafe;) • (1 + Cimpc;)
where
E; = effectiveness gained by bridge i if activity a is chosen;
a = improvement activity; a = 1, deck reconstruction; a = 2, deck replacement; a = 3, bridge replacement;
ADT; = average daily traffic on bridge i; and
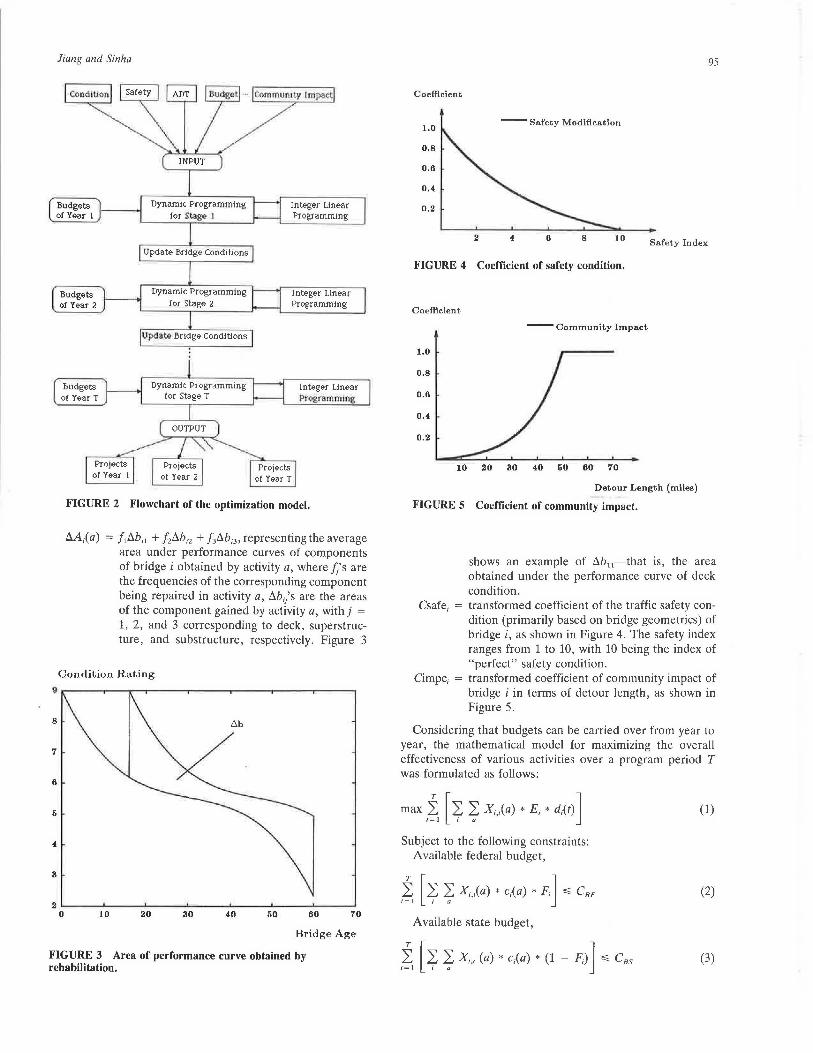
Jiang and Sinha
Budgets of Year 1
Dynamic Programming for Stage I
Integer Linear Programming
8
7
6
6
4
3
Budgets of Year 2
Budgets of Year T
Projects of Year l
Update Bridge Conditions
Dynamic Programming for Stage 2
Update Bridge Conditions
Dynamic Programming for Stage T
OUTPUT
Projects of Year 2
Integer Linear Programming
Integer Linear Programming
FIGURE 2 Flowchart of the optimization model.
M;(a) = f11:!,.b11 + f21:!,.b12 + f31:!,.b 13 , representing the average area under performance curves of components of bridge i obtained by activity a, where f/s are the frequencies of the corresponding component being repaired in activity a, l:!,.b1/s are the areas of the component gained by activity a, with j = 1, 2, and 3 corresponding to deck, superstructure, and substructure, respectively. Figure 3
Condition Rating
2 L----'-----'----'-----'------4------'-----' 0 10 20 30 40 60 60 70
Bridge Age
FIGURE 3 Area of performance curve obtained by rehabilitation.
95
Coefficient
1.0 --Safety Modification
0.8
0.6
0.4
0.2
2 4 6 8 10 Safety Index
FIGURE 4 Coefficient of safety condition.
Coefficient
--Community Impact
1.0
0.8
0.6
0.4
0.2
10 20 30 40 60 60 70
Detour Length {miles)
FIGURE S Coefficient of community impact.
Csafe1
Cimpc1
shows an example of l:!,.b 11-that is, the area obtained under the performance curve of deck condition. transformed coefficient of the traffic safety condition (primarily based on bridge geometrics) of bridge i, as shown in Figure 4. The safety index ranges from 1 to 10, with 10 being the index of "perfect" safety condition. transformed coefficient of community impact of bridge i in terms of detour length, as shown in Figure 5.
Considering that budgets can be carried over from year to year, the mathematical model for maximizing the overall effectiveness of various activities over a program period T was formulated as follows:
(1)
Subject to the following constraints: Available federal budget,
(2)
Available state budget,
I~ [ ~ ~ xi,t (a) * c,(a) * (1 - F;) J "" Cas (3)
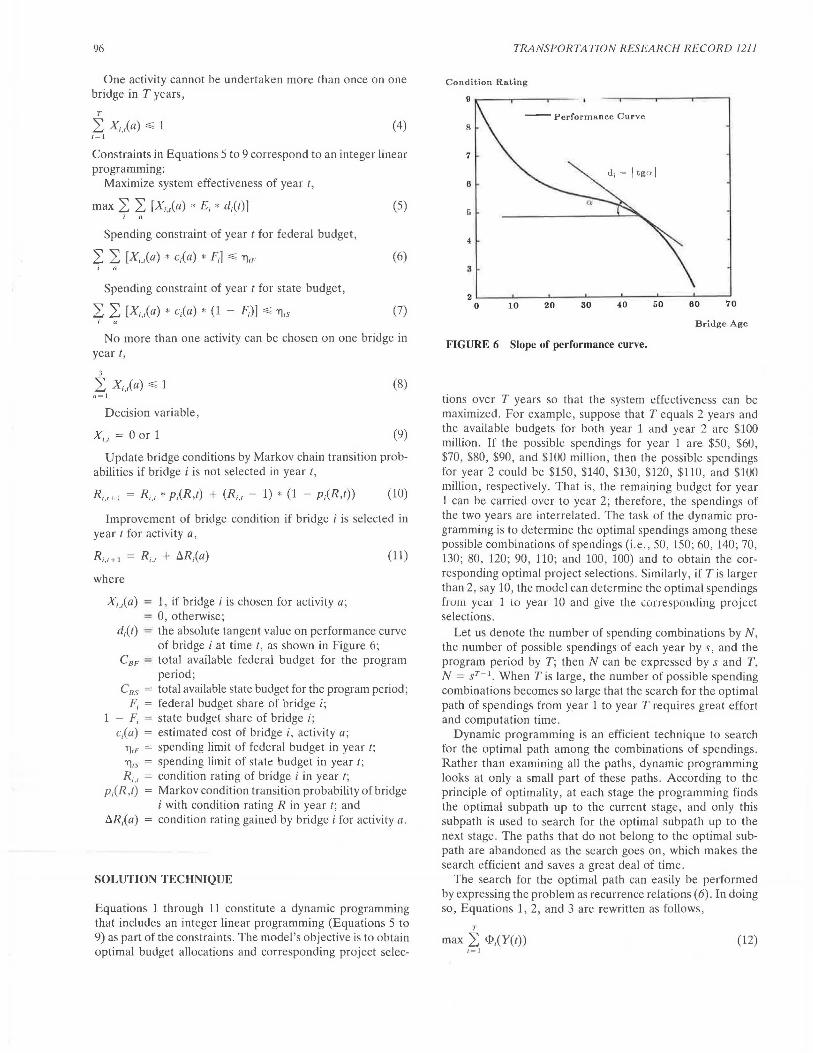
96
One activity cannot be undertaken more than once on one bridge in T years,
T
2: Xja),,:; 1 (4) r=l
Constraints in Equations 5 to 9 correspond to an integer linear programming:
Maximize system effectiveness of year t,
max L ,Z: [X;,,(£1) • E; * d;(I)] ;
Spending constraint of year t for federal budget ,
L L [Xja) * c,(a) * F;] ,,:; ll1F
Spending constraint of year t for state budget,
L L [Xja) * C;(a) * (1 - rJ] ,,:; ll1s I a
(5)
(6)
(7)
No more than one activity can be chosen on one bridge in year t ,
3
2: Xja),,:; 1 (8) n=l
Decision variable,
X;, 1 = 0 or 1 (9)
Update bridge conditions by Markov chain transition probabilities if bridge i is not selected in year t,
R;,1+ I = R;,1 * p;(R,t) + (R;,1 - 1) * (1 - P;(R,t)) (10)
Improvement of bridge condition if bridge i is selected in year t for activity a,
R;,1+ 1 = R; ,1 + !:i.R;(a)
where
X; ,1(a) = 1, if bridge i is chosen for aclivily a; = 0, otherwise;
(11)
d,(t) = the absolute tangent value on performance curve of bridge i at time t, as shown in Figure 6;
C8 F = total available federal budget for the program period ;
C85 = total available state budget for the program period; F; = federal budget share of bridge i;
1 - F; = state budget share of bridge i; c;(a) = estimated cost of bridge i, activity a;
lliF = spending limit of federal budget in year t; 1115 = spending limit of state budget in year t; R; ,1 = condition rating of bridge i in year t;
p;(R ,t) = Markov condition transition probability of bridge i with condition rating R in year t; and
!:i.R;(a) = condition rating gained by bridge i for activity a.
SOLUTION TECHNIQUE
Equations 1 through 11 constitute a dynamic programming that includes an integer linear programming (Equations 5 to 9) as part of the constraints. The model's objective is to obtain optimal budget allocations and corresponding project selec-
TRANSPORTATION RESEARCH RECORD 1211
Condition Rating
-- Performance Curve 8
7
6
6
3
zt__~-'-~~-'-~---''--~-'-~~'--~-'--~~ 0 10 zo 30 40 60 60 70
Bridge Age
FIGURE 6 Slope of performance curve.
tions over T years so that the system effectiveness can be maximized. For example, suppose that T equals 2 years and the available budgets for both year 1 and year 2 are $100 million. If the possible spendings for year 1 are $50 , $60, $70, $80, $90, and $100 million, then the possible spendings for year 2 could be $150, $140, $130, $120, $110, and $100 million, respectively. That is, the remaining budget for year 1 can be carried over to year 2; therefore, the spendings of the two years are interrelated. The task of the dynamic programming is to determine the optimal spendings among these possible combinations of spendings (i.e., 50, 150; 60, 140; 70, 130; 80, 120; 90, 110; and 100, 100) and to obtain the corresponding optimal project selections. Similarly, if Tis larger than 2, say 10, the model can determine the optimal spendings fwl!l yea1 1 lo year 10 and give the corresponding project selections.
Let us denote the number of spending combinations by N, the number of possible spendings of each year by s, and the program period by T; then N can be expressed by s and T, N = sT- t. When Tis large, the number of possible spending combinations becomes so large that the search for the optimal path of spendings from year 1 to year T requires great effort and computation time.
Dynamic programming is an efficient technique to search for the optimal path among the combinations of spendings. Rather than examining all the paths, dynamic programming looks at only a small part of these paths. According to the principle of optimality, at each stage the programming finds the optimal subpath up to the current stage, and only this subpath is used to search for the optimal subpath up to the next stage. The paths that do not belong to the optimal subpath are abandoned as the search goes on , which makes the search efficient and saves a great deal of time.
The search for the optimal path can easily be performed by expressing the problem as recurrence relations (6). In doing so, Equations 1, 2, and 3 are rewritten as follows,
T
max L <P1(Y(t)) (12) 1 = l
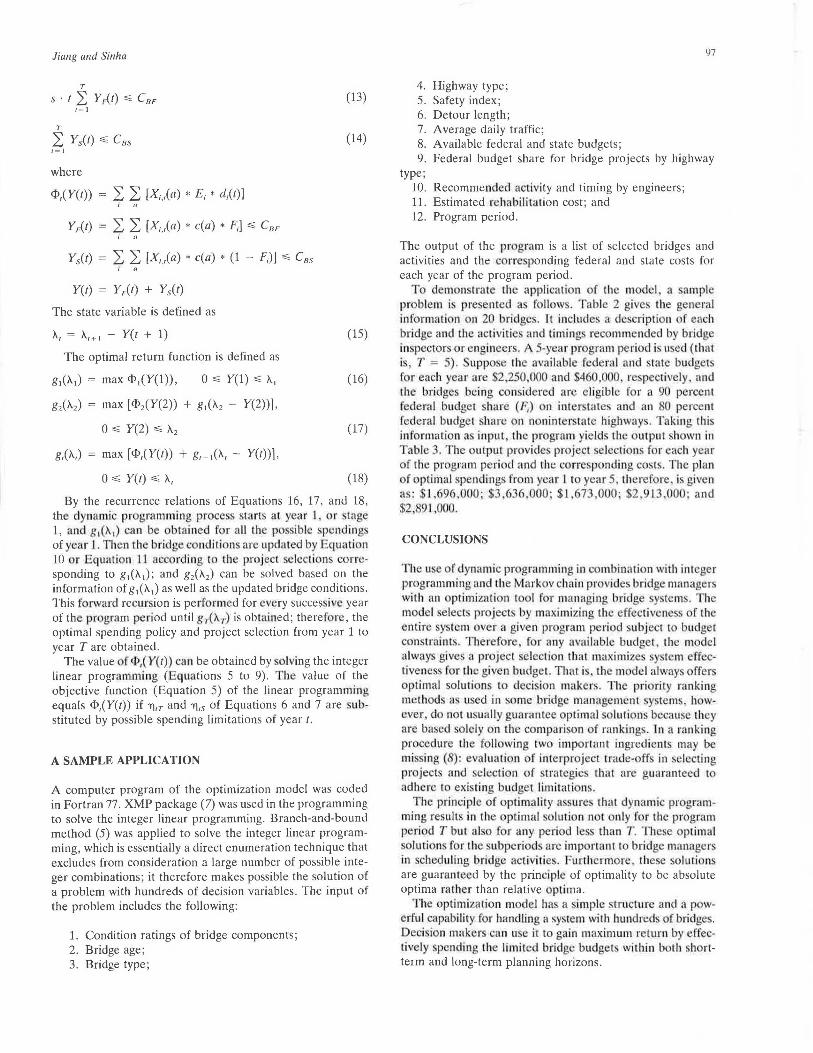
Jiang and Sinha
T
s. t L Yr{t) :S; CBF t=l
T
L Ys(t) :S; Cns l = I
where
<P,(Y(t)) L L [Xja) * E; * d;(t)] ;
L L [X;,r(a) * c(a) * F;] :S; CnF I a
Y5 (t) L L [X;)a) * c(a) * (1 - F;)] :S; C8 s
The state variable is defined as
A, = A,+ I - Y(t + 1)
The optimal return function is defined as
0 :S; Y(l) :S; >..,
max [<P2 (Y(2)) + g 1(>.. 2 - Y(2))],
0 :S; Y(2) :S; A.2
g,(>..,) max [<P,(Y(t)) + g,_,(>.., - Y(t))],
0 :S; Y(t) :S; >..,
(13)
(14)
(15)
(16)
(17)
(18)
By the recurrence relations of Equations 16, 17, and 18, the dyna mic programming proce s starts ac ear l , or tage 1, and g 1(>.. 1) can be obtai ned for all the possible spendings of year J. Then the bridge condit ions are updated by Equati n 10 or Equa tion l .l according to che project. selections concsponding to g,(>.. 1); and g2 (11. 2) can be solved based on the information of g 1(>.. 1) as well as the updated bridge conditions. This forwa rd recllrsion is performed for every successive year of the program period until g1 >...,) is obtained; therefore, the optimal spending policy and project selection from year 1 to year Tare obtained.
The value of q>,( Y(t)) can be obtained by olving the integer linear programming (Equations 5 to 9). T he value of the objective function (Equation 5) of the linear programming equals <P,(Y(t)) if TJ,T and TJ1s of Equations 6 and 7 are substituted by possible spending limitations of year t.
A SAMPLE APPLICATION
A computer program of the optimization model was coded in Fortran 77. XMP package (7) was used in the programming to solve the integer linear programming. Branch-and-bound method (5) was applied to solve the integer linear programming, which is essentially a direct enumeration technique that excludes from consideration a large number of possible integer combinations; it therefore makes possible the solution of a problem with hundreds of decision variables. The input of the problem includes the following:
1. Condition ratings of bridge components; 2. Bridge age; 3. Bridge type;
97
4. Highway type; 5. Safety index; 6. Detour length; 7 . Average daily traffic; 8. Available federal and state budgets; 9. Federal budget share for bridge projects by highway
type; 10. Recommended activity and timing by engineers; 11. Estimated rchabi lirntion cost; and 12. Program period .
The output of the program is a list of selected bridges and activities and the corre. ponding federal and state costs for each year of the program period.
To demon Irate the application of the model, a ample problem is pre entcd as follow . Table 2 gi cs the general information on 20 bridges. lt includes a de ·cription of each bridge and !he activitie and timing recommended by bridge inspector or engineer . A 5-year program p riod i used (that is T = 5). Suppose the availabl federa l and tat budget for each year are $2,250.000 and $460,0 0 respectively. and the bridges being con idercd are eligible for a 90 percent federal budget hare (F,) on imer ·tate and an 80 per cnt federa l budget sha re on nonintcr tale highways. Taking tJ1i · information a input, the program yield. the output hown in Table 3. The output provide · project ·electi ns f reach year of th program period and the corresponding cosL. The plan
f optimal spendings from year 1 to year 5, therefore is given as: $ 1,696,000; $3 636.000; $1 ,673 ,000: $2,9 l .O 0 ; and $2, '91,000.
CONCLUSIONS
T he use of dynamic pr gramming in combinaLio.n with integer programming and the Markov chain provides bridge manager with an optimization lool for managing bridge ys tem '. The m del e lects projects by maximizing the effecrivenc s of the en tire sy t · m over a given program period subject co budget constraints. Ther f re, for any available budget. the m del always give a project selccti n that maximizes system effectiveness for the given budget. That is. the model always offers optimal solut ion L decision makers. The pri rity nlnking method as u t:d in ome bridge managemen t sy. tern , ho\ -ever. do not usually guarantee optimal olutions because they are ba ed s lely n the comparison of rankings. In n rnnking procedure the following two importan t ingredi nt. may b mi sing 8): evaluari n of interprojcct trade-offs in selecting projects and selection of strategie cha t are guaranteed to adhere to exi. ting budget limitations.
The pri nciple of optimality as ures that dynami programming results in the optimal solution not on ly for the program period T but a ls .for any period less than T. The e primal olution for the ubperi d are importa nt to bridge manager '
in schedul ing bridge act ivities. Furthermore, lhe. e sol utions are guaranreed by the principle of optimality to be absolute optima rather than relative optima.
T he ptimizat ion mode l ha a lmple structure and a powerful capability for hand ling a system with hundreds f bridge . Deci ·ion maker can u e it to gain maxi mum return by effectiv ly spending the limited bridge budgets with in both shortterm and long-term planning horizons.
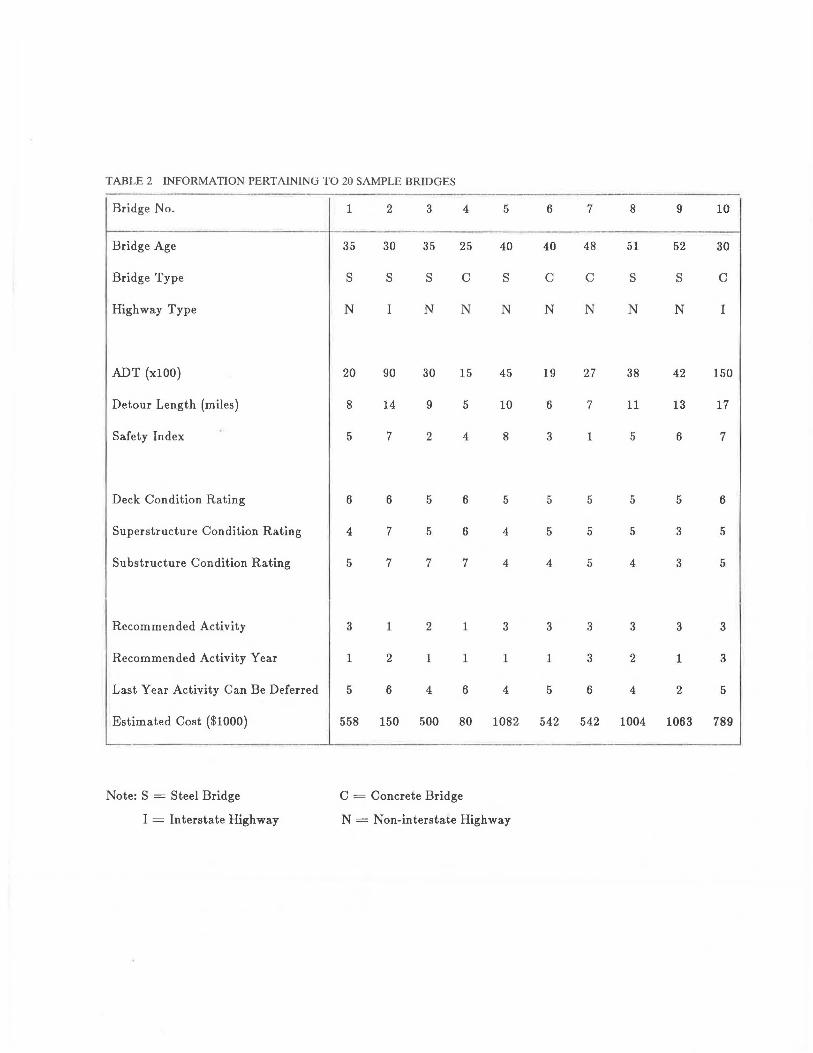
TABLE 2 INFORMATION PERTAINING TO 20 SAMPLE BRIDGES
Bridge No. 1 2 3 4 5 6 7 8 9 10
Bridge Age 35 30 35 25 40 40 48 51 52 30
Bridge Type s s s c s c c s s c
Highway Type N I N N N N N N N I
ADT (xlOO) 20 90 30 15 45 19 27 38 42 150
Detour Length (miles) 8 14 9 5 10 6 7 11 13 17
Safety Index 5 7 2 4 8 3 1 5 6 7
Deck Condition Rating 6 6 5 6 5 5 5 5 5 6
Superstructure Condition Rating 4 7 5 6 4 5 5 5 3 5
Substructure Condition Rating 5 7 7 7 4 4 5 4 3 5
Recommended Activity 3 1 2 1 3 3 3 3 3 3
Recommended Activity Year 1 2 1 1 1 1 3 2 1 3
Last Year Activity Can Be Deferred 5 6 4 6 4 5 6 4 2 5
Estimated Cost ($1000) 558 150 500 80 1082 542 542 1004 1063 789
Note: S = Steel Bridge C = Concrete Bridge
I= Interstate Highway N = Non-interstate Highway
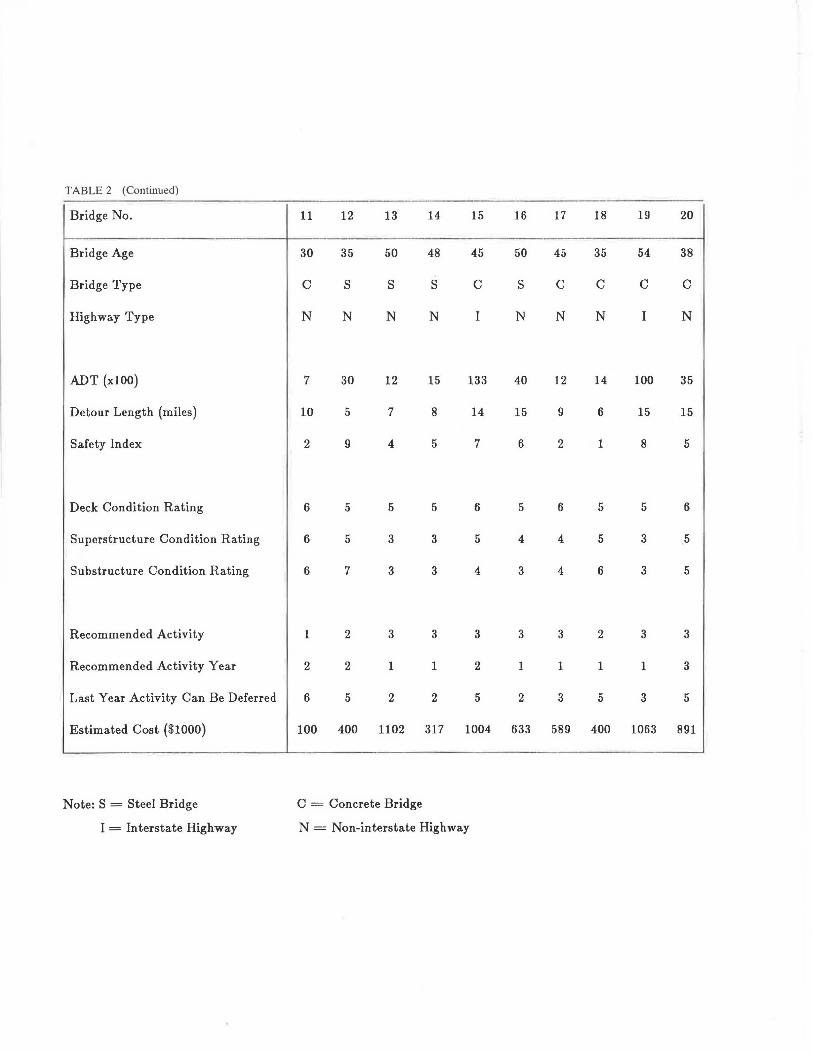
TABLE 2 (Continued)
Bridge No. 11 12 13 14 15 16 17 18 19 20
Bridge Age 30 35 50 48 45 50 45 35 54 38
Bridge Type c s s s c s c c c c
Highway Type N N N N I N N N I N
ADT (xlOO) 7 30 12 15 133 40 12 14 100 35
Detour Length (miles) 10 5 7 8 14 15 9 6 15 15
Safety Index 2 9 4 5 7 6 2 1 8 5
Deck Condition Rating 6 5 5 5 6 5 6 5 5 6
Superstructure Condition Rating 6 5 3 3 5 4 4 5 3 5
Substructure Condition Rating 6 7 3 3 4 3 4 6 3 5
Recommended Activity 1 2 3 3 3 3 3 2 3 3
Recommended Activity Year 2 2 1 1 2 1 1 1 1 3
Last Year Activity Can Be Deferred 6 5 2 2 5 2 3 5 3 5
Estimated Cost ($1000) 100 400 1102 317 1004 633 589 400 1063 891
Note: S = Steel Bridge C = Concrete Bridge
I = Interstate Highway N = Non-interstate Highway
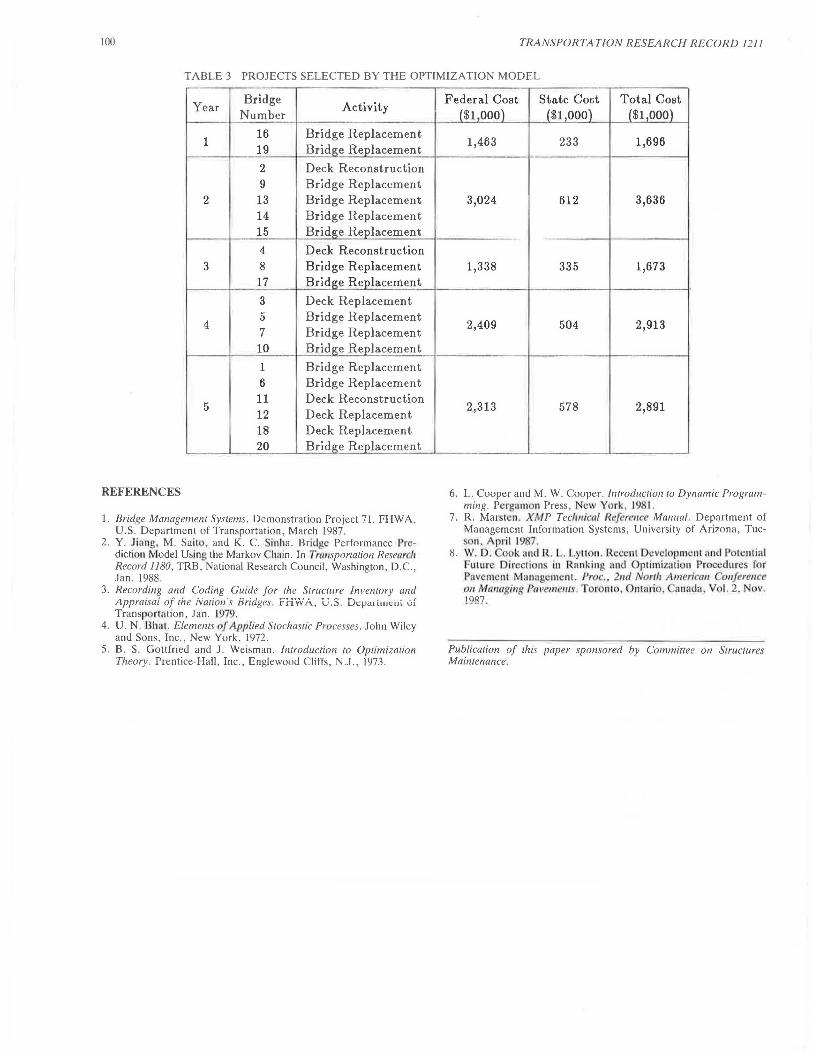
100 TRANSPORTATlON RESEARCH RECORD 1211
TABLE 3 PROJECTS SELECTED BY THE OPTIMIZATION MODEL
Year Bridge
Activity Number
1 16 Bridge Replacement 19 Bridge Renlacement
2 Deck Reconstruction 9 Bridge Replacement
2 13 Bridge Replacement i4 Bridge Replacement 15 Bridii::e Replacement
4 Deck Reconstruction 3 8 Bridge Replacement
17 Bridge Renlacerrtent
3 Deck Replacement
4 5 Bridge Replacement 7 Bridge Replacement
10 Bridge Renlacement
1 Bridge Replacement 6 Bridge Replacement
5 11 Deck Reconstruction 12 Deck Replacement 18 Deck Replacement 20 Bridii::e Replacement
REFERENCES
1. Bridge Managemenl Sys/ems. Demonstrat ion Project 71. FHWA, U.S. Department of Transportation, March 1987.
2. Y. Jia ng, M. Saito , and K. C. ' inha. Bridge Performance Prediction Model Using the Markov hain. In Tn111spor1ation Reswrch Record 1180, TRB, National Research Council, Washington, D .C., Jan. 1988.
3. Recording and Coding Guide for the S1ructure Inven tory and Appraisai of 1he Nacion's Bridges. FHWA, u.S. Dq.M il111c11i of Transp riation, Jan. 1979.
4. U. N. Bhllt. Elemen/s of Ap11lied Stochastic Processes. John Wiley and Sons, Inc., New York, 1972.
5. B. S. Gottfried and J. Weisman. fnlroduction /o Oplimization Theory. Prentice-Hall , Inc., Englewood Cliffs , N .J., 1973.
Federal Cost State Cost Total Cost ($1,000) {$1 000) /$1,000)
1,463 233 1,696
3,024 612 3,636
1,338 335 1,673
2,409 504 2,913
2,313 578 2,891
6. L. Cooper and M. W. Cooper. Introduction 10 Dynamic Programming. Pergamon Press, New York, 1981.
7. R. Marste n. XMP Tecflnical n 'fer1:111:e Manual. Department of Management Information Systems, University of Arizona, Tucson. April 1987.
8. W. D . ook and R. L. Lyll n. Recent Development nnd Potentia l ·uture Dircciioo in Ranking and Optimization Procedure for
Pavement Management. Proc., 2nd Nol'll1 American 011fere11ce 011 Mmwgi11 • J>ave111e111s. Toronto. Ontario, u mada . V I. 2 . ov. !987.
Publication of !his paper sponsored by Commitlee on Structures Mainlenance.
Related Documents