CONFIDENTIAL Date: 5-Jun-15 Earnings expanding on larger fleet and stronger markets; EBITDA +180% y/y in 2015e Positive market outlook; the tide has turned and we expect tanker earnings to remain firm Discounted tanker bet; Target increased to SEK 25 (20) Earnings expanding on larger fleet and stronger markets CCOR reported EBITDA of SEK 82m for 1q15; up almost 60% y/y on a market turnaround as its fleet of 10x P-MAXes sailed in around USD 20,000 per day relative to USD 16,000 per day one year ago. We expect EBITDA to expand further in 2q on the back of a continued strong market and see further growth in 2h15 owing to the addition of a chartered-in Suezmax and the delivery of one IMO2MAX newbuilding in April and one in 4q. Positive market outlook; the tide has turned We repeat our positive view on the product tanker market. Market indices suggest that MRs have sailed in around USD 22,000 per day YTD; backed by a firm crude tanker market and high refinery throughout. Going forward, we expect a further globalization of product trades to add significantly demand as low cost producers in the MEG and USG gain further market shares, resulting in more long-haul trades. Meanwhile, newbuilding contracting remains slow and the backlog is shrinking. We estimate that net fleet growth through 2017 of ~14% will be more than outpaced by ~18% demand growth and see the potential for continued firm product tanker rates. Discounted tanker bet; Target increased to SEK 25 (20) We estimate NAV, given its current fleet, of SEK 27. However, while product tanker earnings have lifted off, ship values remain unaffected. We argue this is about to change and see the potential for a significant NAV expansion. We set our target to SEK 25 (20), reflecting 8x 2016 EBITDA and 10x 2016 earnings. Trading at EV/EBITDA 2015/2016 9x/7x and at P/NAV 0.65x we find CCOR attractively priced and repeat Buy. 1 Concordia Maritime: Discounted tanker pearl Buy Target SEK 25 (20) Financial analyst: Erik Folkeson +47 23 23 82 57 [email protected] Price SEK 18

Welcome message from author
This document is posted to help you gain knowledge. Please leave a comment to let me know what you think about it! Share it to your friends and learn new things together.
Transcript
CONFIDENTIAL
Date:
5-Jun-15
Earnings expanding on larger fleet and stronger markets; EBITDA +180% y/y in 2015e
Positive market outlook; the tide has turned and we expect tanker earnings to remain firm
Discounted tanker bet; Target increased to SEK 25 (20)
Earnings expanding on larger fleet and stronger markets
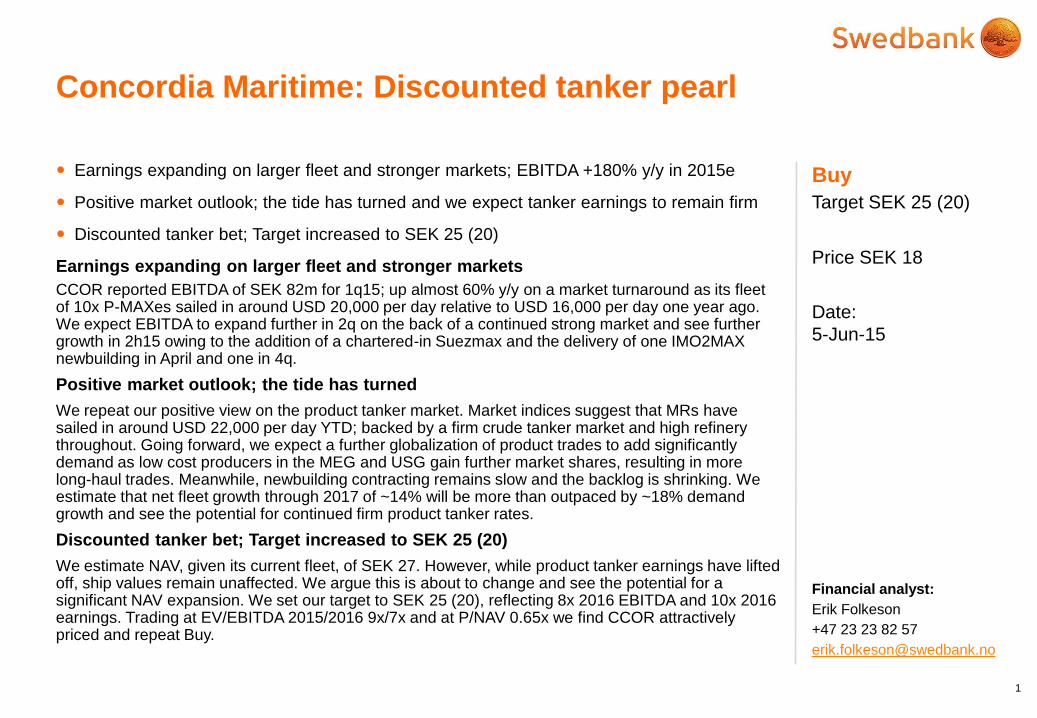
CCOR reported EBITDA of SEK 82m for 1q15; up almost 60% y/y on a market turnaround as its fleetof 10x P-MAXes sailed in around USD 20,000 per day relative to USD 16,000 per day one year ago. We expect EBITDA to expand further in 2q on the back of a continued strong market and see further growth in 2h15 owing to the addition of a chartered-in Suezmax and the delivery of one IMO2MAX newbuilding in April and one in 4q.
Positive market outlook; the tide has turned
We repeat our positive view on the product tanker market. Market indices suggest that MRs havesailed in around USD 22,000 per day YTD; backed by a firm crude tanker market and high refinery throughout. Going forward, we expect a further globalization of product trades to add significantly demand as low cost producers in the MEG and USG gain further market shares, resulting in more long-haul trades. Meanwhile, newbuilding contracting remains slow and the backlog is shrinking. We estimate that net fleet growth through 2017 of ~14% will be more than outpaced by ~18% demand growth and see the potential for continued firm product tanker rates.
Discounted tanker bet; Target increased to SEK 25 (20)
We estimate NAV, given its current fleet, of SEK 27. However, while product tanker earnings have liftedoff, ship values remain unaffected. We argue this is about to change and see the potential for a significant NAV expansion. We set our target to SEK 25 (20), reflecting 8x 2016 EBITDA and 10x 2016 earnings. Trading at EV/EBITDA 2015/2016 9x/7x and at P/NAV 0.65x we find CCOR attractively priced and repeat Buy.
1
Concordia Maritime: Discounted tanker pearl
Buy
Target SEK 25 (20)
Financial analyst:
Erik Folkeson
+47 23 23 82 57
Price SEK 18
CONFIDENTIAL
Market turnaround started 3q14
Suezmax tanker chartered in fro
one year on a 50% basis from
1q15, deal is deep in the money
1st IMO2MAX newbuilding
delivered April 2015
Another 50% Suezmax charter to
be delivered to CCOR in August
2015
2nd IMO2MAX to be delivered
4q15
2
CCOR EBITDA and SWN 2q15 estimate Comments
CCOR earnings expanding on fleet additions and market
turnaround
0
20
40
60
80
100
120
1q12 3q12 4q12 3q13 4q13 1q14 2q14 3q14 4q14 1q15 2q15e
SE
Km
CONFIDENTIAL
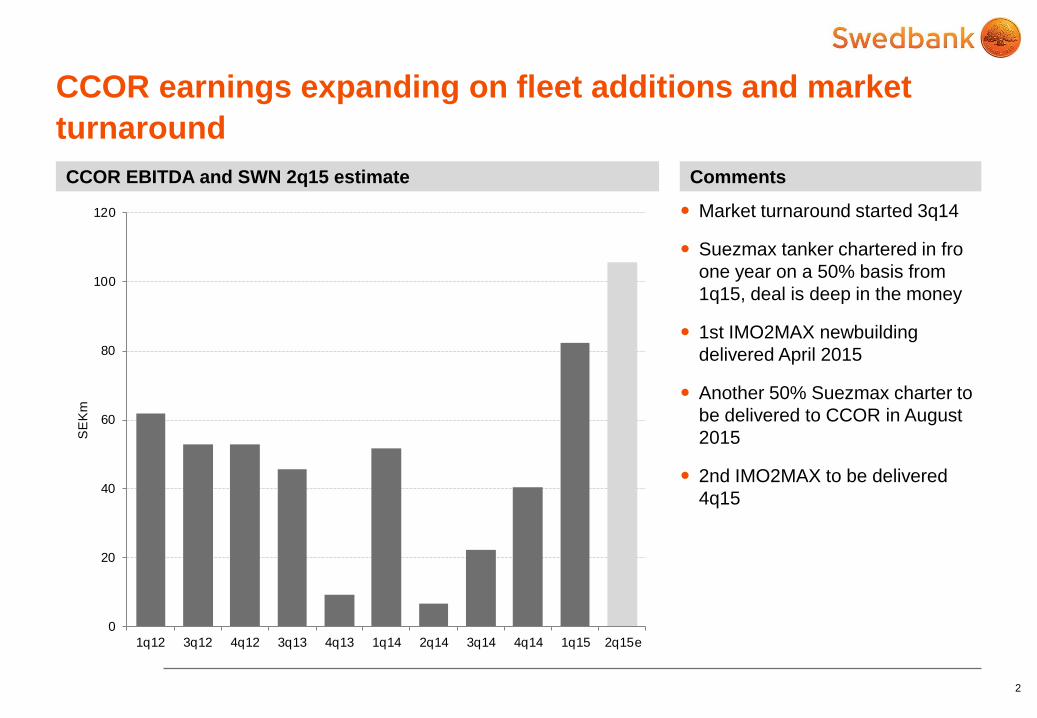
P-MAX
– Wide-beam MR, larger cargo intake and higher earnings potential
– 10x in fleet. 2x on TC to Stena Bulk, 8x commercially operated by Stena Bulk, Stena Weco and Exxon. Trading both clean and dirty products
– Spot income of USD 19,600 per day in 1q15; ~10% short of MR earnings achieved by top performing peers
IMO2MAX
– MR IMO 2
– 2x NBs; one delivered in April, 2nd unit to follow in 4q15
– Commercially operated by Stena Weco
Suezmaxes
– 1x owned vessel, commercially olperated by Stena Sonangol. 1q15 TCE USD 44,200 per day; best in class
– 2x chartered-in vessels, on a joint basis together with Stena Bulk. Charter agreements believed to be deep in the money
3
CCOR fleet and employment Comments
Source:
Well positioned for continued firm tanker markets with 86%
spot capacity for 2015, 100% for 2016
jan. 15 jul. 15 jan. 16 jul. 16 jan. 17 jul. 17
Stena Premium, P-MAX, 2011
Stena Penguin, P-MAX, 2010
Stena Progress, P-MAX, 2009
Stena Polaris, P-MAX, 2010
Stena Perros, P-MAX, 2008
Stena President, P-MAX, 2007
Stena Primorsk, P-MAX, 2006
Stena Performance, P-MAX, 2006
Stena Provence, P-MAX, 2006
Stena Paris, P-MAX, 2005
Stena Image, IMO2MAX, 2014
Stena Important, IMO2MAX, 2015
Stena Supreme, Suezmax, 2012
Suezmax charter 1, Suezmax
Suezmax charter 2, Suezmax
Yard Contracted Spot
CONFIDENTIAL
4
P&L and balance sheet items, pricing P-MAX earnings vs market*
Source: SWN, CCOR, Clarkson, TNK, FRO, NAT
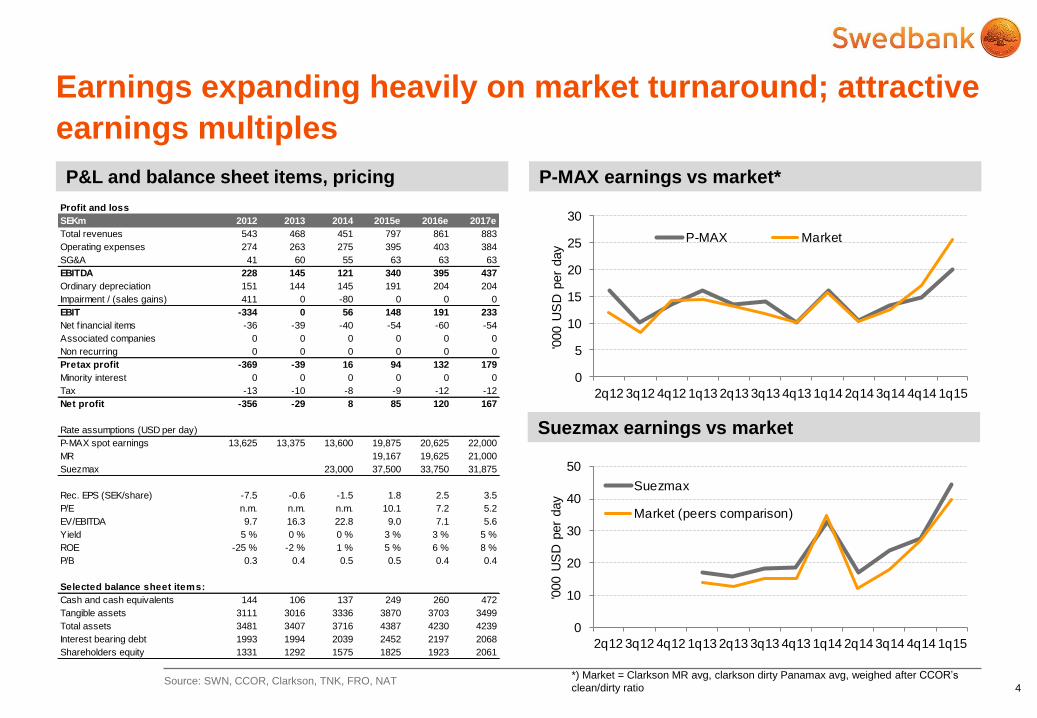
Earnings expanding heavily on market turnaround; attractive
earnings multiples
Profit and loss
SEKm 2012 2013 2014 2015e 2016e 2017e
Total revenues 543 468 451 797 861 883
Operating expenses 274 263 275 395 403 384
SG&A 41 60 55 63 63 63
EBITDA 228 145 121 340 395 437
Ordinary depreciation 151 144 145 191 204 204
Impairment / (sales gains) 411 0 -80 0 0 0
EBIT -334 0 56 148 191 233
Net f inancial items -36 -39 -40 -54 -60 -54
Associated companies 0 0 0 0 0 0
Non recurring 0 0 0 0 0 0
Pretax profit -369 -39 16 94 132 179
Minority interest 0 0 0 0 0 0
Tax -13 -10 -8 -9 -12 -12
Net profit -356 -29 8 85 120 167
Rate assumptions (USD per day)
P-MAX spot earnings 13,625 13,375 13,600 19,875 20,625 22,000
MR 19,167 19,625 21,000
Suezmax 23,000 37,500 33,750 31,875
Rec. EPS (SEK/share) -7.5 -0.6 -1.5 1.8 2.5 3.5
P/E n.m. n.m. n.m. 10.1 7.2 5.2
EV/EBITDA 9.7 16.3 22.8 9.0 7.1 5.6
Yield 5 % 0 % 0 % 3 % 3 % 5 %
ROE -25 % -2 % 1 % 5 % 6 % 8 %
P/B 0.3 0.4 0.5 0.5 0.4 0.4
Selected balance sheet items:
Cash and cash equivalents 144 106 137 249 260 472
Tangible assets 3111 3016 3336 3870 3703 3499
Total assets 3481 3407 3716 4387 4230 4239
Interest bearing debt 1993 1994 2039 2452 2197 2068
Shareholders equity 1331 1292 1575 1825 1923 2061
0
5
10
15
20
25
30
2q12 3q12 4q12 1q13 2q13 3q13 4q13 1q14 2q14 3q14 4q14 1q15
'000 U
SD
per
day
P-MAX Market
Suezmax earnings vs market
0
10
20
30
40
50
2q12 3q12 4q12 1q13 2q13 3q13 4q13 1q14 2q14 3q14 4q14 1q15
'000 U
SD
per
day
Suezmax
Market (peers comparison)
*) Market = Clarkson MR avg, clarkson dirty Panamax avg, weighed after CCOR’s
clean/dirty ratio
CONFIDENTIAL
5
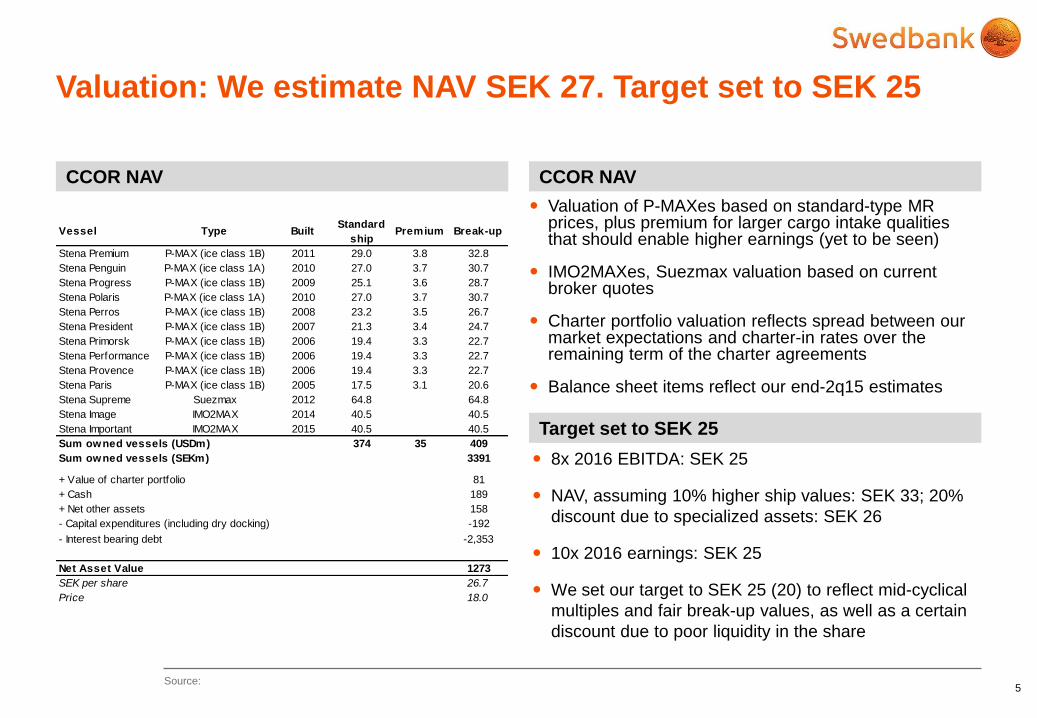
Valuation of P-MAXes based on standard-type MR prices, plus premium for larger cargo intake qualities that should enable higher earnings (yet to be seen)
IMO2MAXes, Suezmax valuation based on current broker quotes
Charter portfolio valuation reflects spread between our market expectations and charter-in rates over the remaining term of the charter agreements
Balance sheet items reflect our end-2q15 estimates
CCOR NAV CCOR NAV
Source:
Valuation: We estimate NAV SEK 27. Target set to SEK 25
Vessel Type BuiltStandard
shipPremium Break-up
Stena Premium P-MAX (ice class 1B) 2011 29.0 3.8 32.8
Stena Penguin P-MAX (ice class 1A) 2010 27.0 3.7 30.7
Stena Progress P-MAX (ice class 1B) 2009 25.1 3.6 28.7
Stena Polaris P-MAX (ice class 1A) 2010 27.0 3.7 30.7
Stena Perros P-MAX (ice class 1B) 2008 23.2 3.5 26.7
Stena President P-MAX (ice class 1B) 2007 21.3 3.4 24.7
Stena Primorsk P-MAX (ice class 1B) 2006 19.4 3.3 22.7
Stena Performance P-MAX (ice class 1B) 2006 19.4 3.3 22.7
Stena Provence P-MAX (ice class 1B) 2006 19.4 3.3 22.7
Stena Paris P-MAX (ice class 1B) 2005 17.5 3.1 20.6
Stena Supreme Suezmax 2012 64.8 64.8
Stena Image IMO2MAX 2014 40.5 40.5
Stena Important IMO2MAX 2015 40.5 40.5
Sum owned vessels (USDm) 374 35 409
Sum owned vessels (SEKm) 3391
+ Value of charter portfolio 81
+ Cash 189
+ Net other assets 158
- Capital expenditures (including dry docking) -192
- Interest bearing debt -2,353
Net Asset Value 1273
SEK per share 26.7
Price 18.0
Target set to SEK 25
8x 2016 EBITDA: SEK 25
NAV, assuming 10% higher ship values: SEK 33; 20%
discount due to specialized assets: SEK 26
10x 2016 earnings: SEK 25
We set our target to SEK 25 (20) to reflect mid-cyclical
multiples and fair break-up values, as well as a certain
discount due to poor liquidity in the share
CONFIDENTIAL
6
Source:
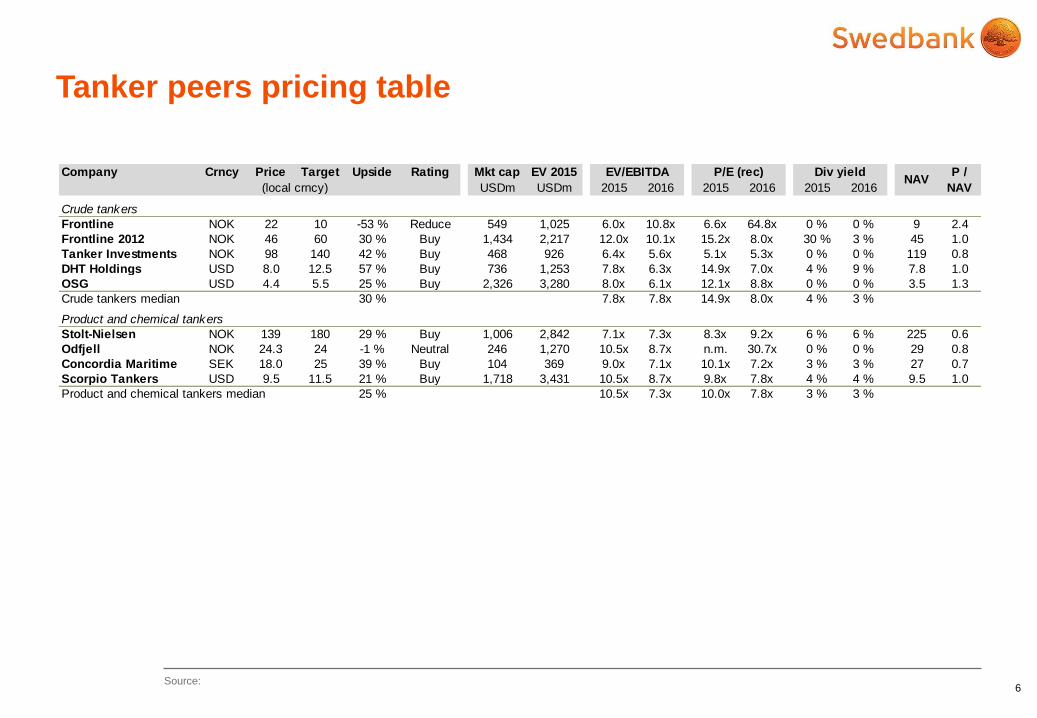
Tanker peers pricing table
Company Crncy Price Target Upside Rating Mkt cap EV 2015
USDm USDm 2015 2016 2015 2016 2015 2016
Crude tankers
Frontline NOK 22 10 -53 % Reduce 549 1,025 6.0x 10.8x 6.6x 64.8x 0 % 0 % 9 2.4
Frontline 2012 NOK 46 60 30 % Buy 1,434 2,217 12.0x 10.1x 15.2x 8.0x 30 % 3 % 45 1.0
Tanker Investments NOK 98 140 42 % Buy 468 926 6.4x 5.6x 5.1x 5.3x 0 % 0 % 119 0.8
DHT Holdings USD 8.0 12.5 57 % Buy 736 1,253 7.8x 6.3x 14.9x 7.0x 4 % 9 % 7.8 1.0
OSG USD 4.4 5.5 25 % Buy 2,326 3,280 8.0x 6.1x 12.1x 8.8x 0 % 0 % 3.5 1.3
Crude tankers median 30 % 7.8x 7.8x 14.9x 8.0x 4 % 3 %
Product and chemical tankers
Stolt-Nielsen NOK 139 180 29 % Buy 1,006 2,842 7.1x 7.3x 8.3x 9.2x 6 % 6 % 225 0.6
Odfjell NOK 24.3 24 -1 % Neutral 246 1,270 10.5x 8.7x n.m. 30.7x 0 % 0 % 29 0.8
Concordia Maritime SEK 18.0 25 39 % Buy 104 369 9.0x 7.1x 10.1x 7.2x 3 % 3 % 27 0.7
Scorpio Tankers USD 9.5 11.5 21 % Buy 1,718 3,431 10.5x 8.7x 9.8x 7.8x 4 % 4 % 9.5 1.0
Product and chemical tankers median 25 % 10.5x 7.3x 10.0x 7.8x 3 % 3 %
NAVP /
NAV
EV/EBITDA P/E (rec) Div yield
(local crncy)
CONFIDENTIAL
Date:
5-Jun-15
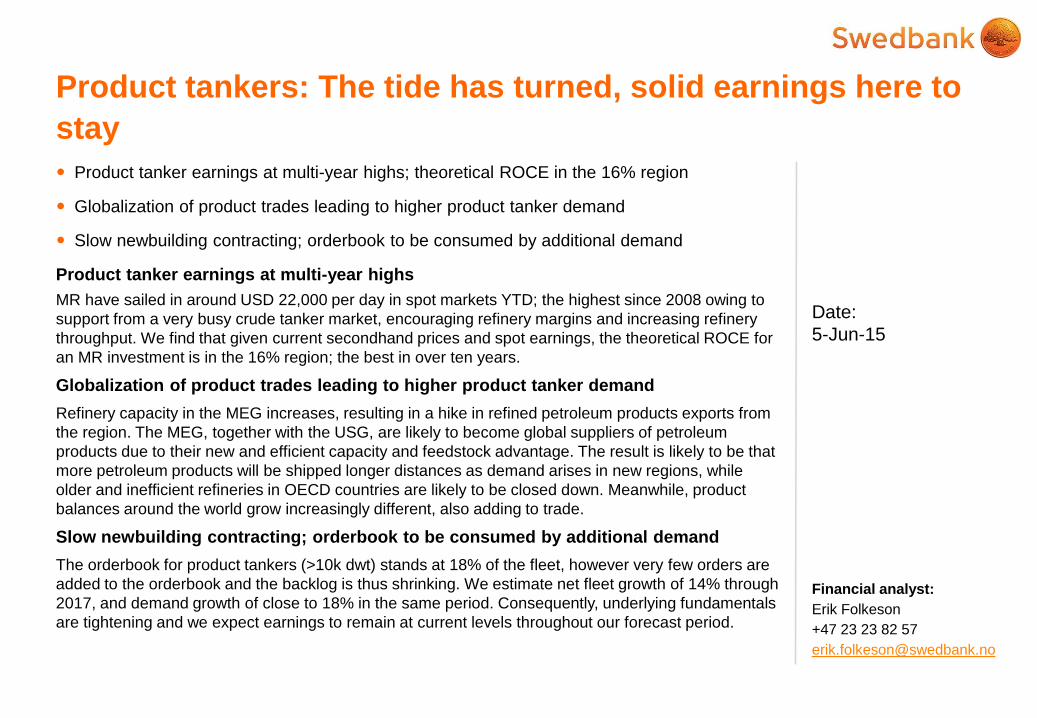
Product tanker earnings at multi-year highs; theoretical ROCE in the 16% region
Globalization of product trades leading to higher product tanker demand
Slow newbuilding contracting; orderbook to be consumed by additional demand
Product tanker earnings at multi-year highs
MR have sailed in around USD 22,000 per day in spot markets YTD; the highest since 2008 owing to
support from a very busy crude tanker market, encouraging refinery margins and increasing refinery
throughput. We find that given current secondhand prices and spot earnings, the theoretical ROCE for
an MR investment is in the 16% region; the best in over ten years.
Globalization of product trades leading to higher product tanker demand
Refinery capacity in the MEG increases, resulting in a hike in refined petroleum products exports from
the region. The MEG, together with the USG, are likely to become global suppliers of petroleum
products due to their new and efficient capacity and feedstock advantage. The result is likely to be that
more petroleum products will be shipped longer distances as demand arises in new regions, while
older and inefficient refineries in OECD countries are likely to be closed down. Meanwhile, product
balances around the world grow increasingly different, also adding to trade.
Slow newbuilding contracting; orderbook to be consumed by additional demand
The orderbook for product tankers (>10k dwt) stands at 18% of the fleet, however very few orders are
added to the orderbook and the backlog is thus shrinking. We estimate net fleet growth of 14% through
2017, and demand growth of close to 18% in the same period. Consequently, underlying fundamentals
are tightening and we expect earnings to remain at current levels throughout our forecast period.
Product tankers: The tide has turned, solid earnings here to
stay
Financial analyst:
Erik Folkeson
+47 23 23 82 57
CONFIDENTIAL
8
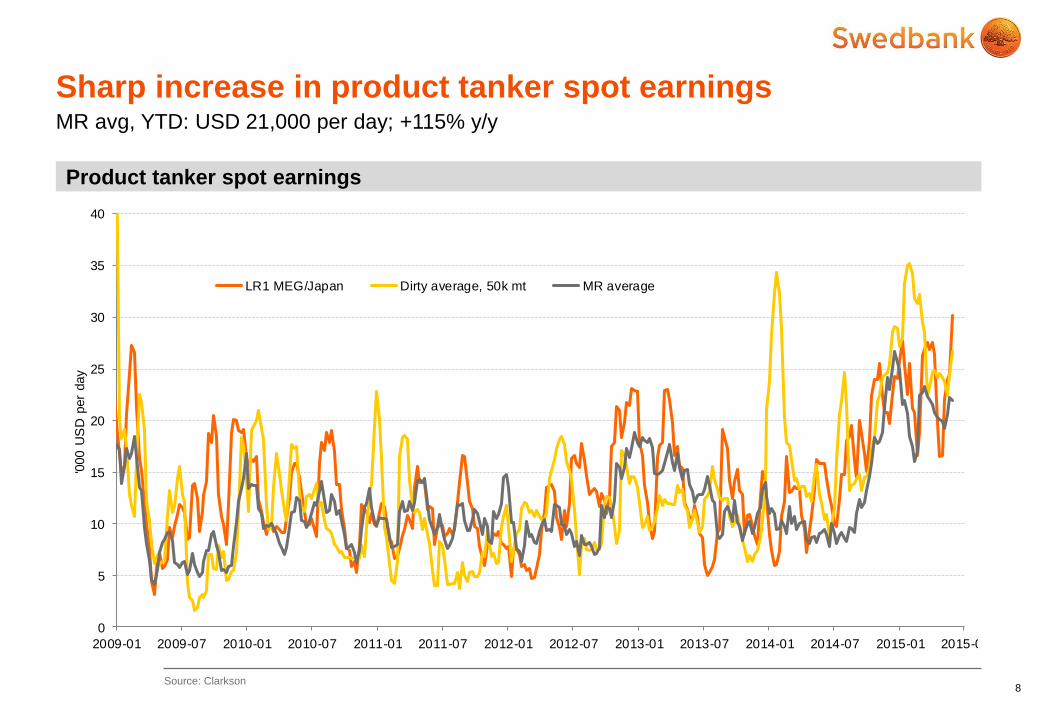
Product tanker spot earnings
Sharp increase in product tanker spot earnings MR avg, YTD: USD 21,000 per day; +115% y/y
0
5
10
15
20
25
30
35
40
2009-01 2009-07 2010-01 2010-07 2011-01 2011-07 2012-01 2012-07 2013-01 2013-07 2014-01 2014-07 2015-01 2015-07
'000 U
SD
per
day
LR1 MEG/Japan Dirty average, 50k mt MR average
Source: Clarkson
CONFIDENTIAL
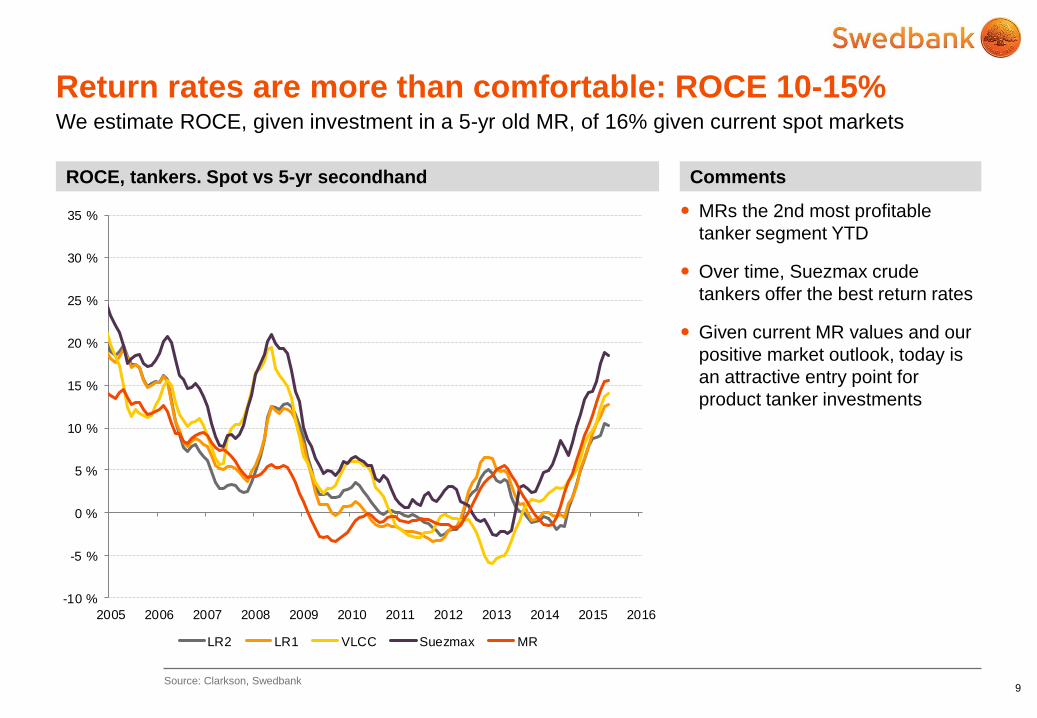
MRs the 2nd most profitable
tanker segment YTD
Over time, Suezmax crude
tankers offer the best return rates
Given current MR values and our
positive market outlook, today is
an attractive entry point for
product tanker investments
9
ROCE, tankers. Spot vs 5-yr secondhand Comments
Source: Clarkson, Swedbank
Return rates are more than comfortable: ROCE 10-15% We estimate ROCE, given investment in a 5-yr old MR, of 16% given current spot markets
-10 %
-5 %
0 %
5 %
10 %
15 %
20 %
25 %
30 %
35 %
2005 2006 2007 2008 2009 2010 2011 2012 2013 2014 2015 2016
LR2 LR1 VLCC Suezmax MR
CONFIDENTIAL 10
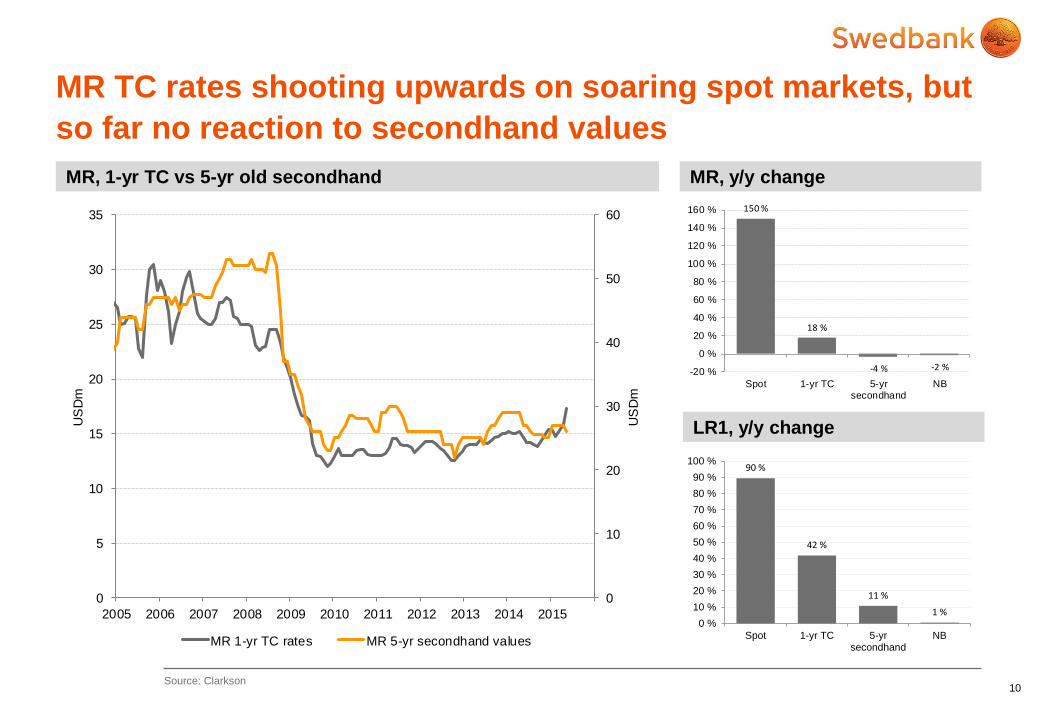
MR, 1-yr TC vs 5-yr old secondhand MR, y/y change
Source: Clarkson
MR TC rates shooting upwards on soaring spot markets, but
so far no reaction to secondhand values
0
10
20
30
40
50
60
0
5
10
15
20
25
30
35
2005 2006 2007 2008 2009 2010 2011 2012 2013 2014 2015
US
Dm
US
Dm
MR 1-yr TC rates MR 5-yr secondhand values
150 %
18 %
-4 % -2 %-20 %
0 %
20 %
40 %
60 %
80 %
100 %
120 %
140 %
160 %
Spot 1-yr TC 5-yrsecondhand
NB
LR1, y/y change
90 %
42 %
11 %
1 %0 %
10 %
20 %
30 %
40 %
50 %
60 %
70 %
80 %
90 %
100 %
Spot 1-yr TC 5-yrsecondhand
NB
CONFIDENTIAL 11
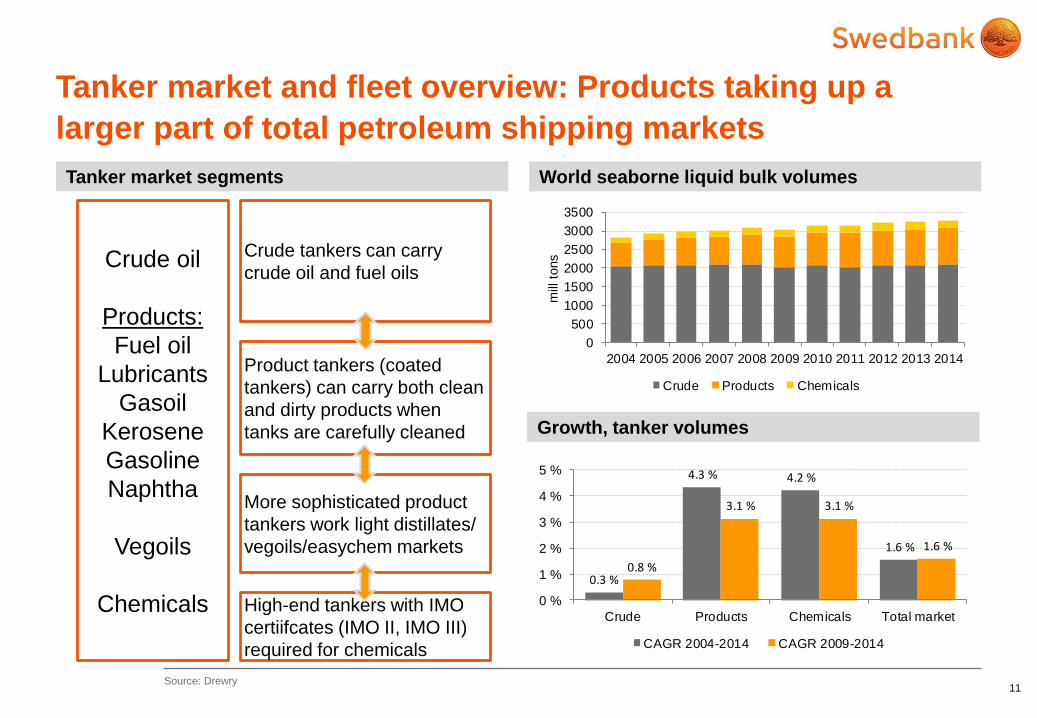
Tanker market segments World seaborne liquid bulk volumes
Source: Drewry
Tanker market and fleet overview: Products taking up a
larger part of total petroleum shipping markets
0
500
1000
1500
2000
2500
3000
3500
2004 2005 2006 2007 2008 2009 2010 2011 2012 2013 2014
mill
tons
Crude Products Chemicals
Growth, tanker volumes
0.3 %
4.3 % 4.2 %
1.6 %
0.8 %
3.1 % 3.1 %
1.6 %
0 %
1 %
2 %
3 %
4 %
5 %
Crude Products Chemicals Total market
CAGR 2004-2014 CAGR 2009-2014
Crude oil
Products:
Fuel oil
Lubricants
Gasoil
Kerosene
Gasoline
Naphtha
Vegoils
Chemicals
Crude tankers can carry
crude oil and fuel oils
Product tankers (coated
tankers) can carry both clean
and dirty products when
tanks are carefully cleaned
More sophisticated product
tankers work light distillates/
vegoils/easychem markets
High-end tankers with IMO
certiifcates (IMO II, IMO III)
required for chemicals
CONFIDENTIAL
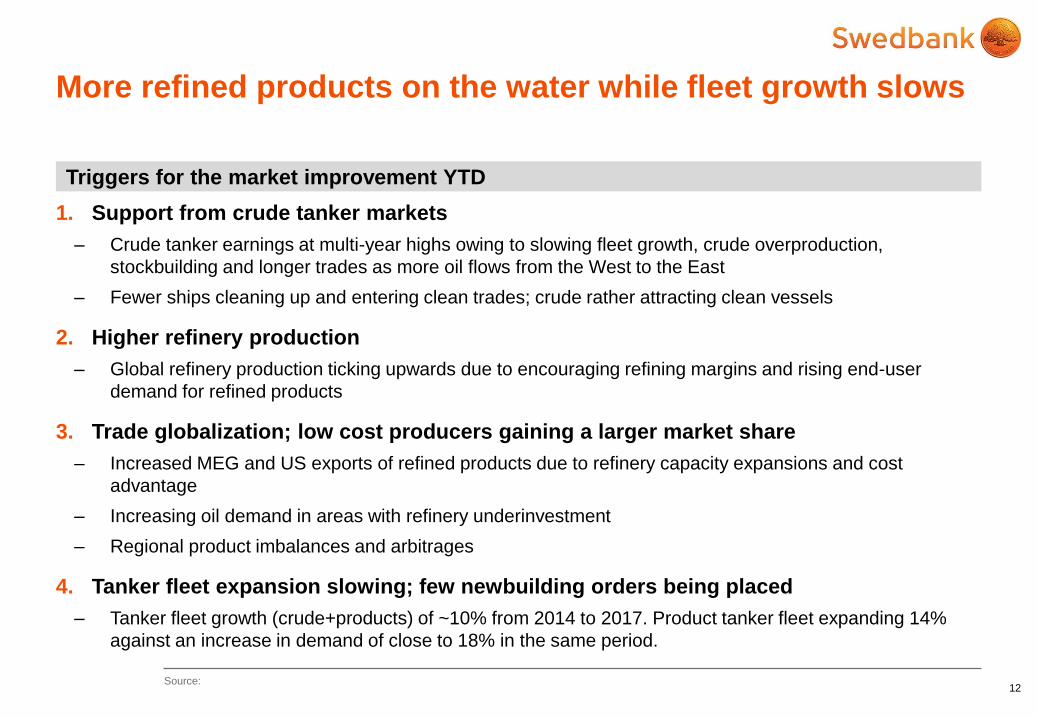
1. Support from crude tanker markets
– Crude tanker earnings at multi-year highs owing to slowing fleet growth, crude overproduction,
stockbuilding and longer trades as more oil flows from the West to the East
– Fewer ships cleaning up and entering clean trades; crude rather attracting clean vessels
2. Higher refinery production
– Global refinery production ticking upwards due to encouraging refining margins and rising end-user
demand for refined products
3. Trade globalization; low cost producers gaining a larger market share
– Increased MEG and US exports of refined products due to refinery capacity expansions and cost
advantage
– Increasing oil demand in areas with refinery underinvestment
– Regional product imbalances and arbitrages
4. Tanker fleet expansion slowing; few newbuilding orders being placed
– Tanker fleet growth (crude+products) of ~10% from 2014 to 2017. Product tanker fleet expanding 14%
against an increase in demand of close to 18% in the same period.
12
Triggers for the market improvement YTD
Source:
More refined products on the water while fleet growth slows
CONFIDENTIAL
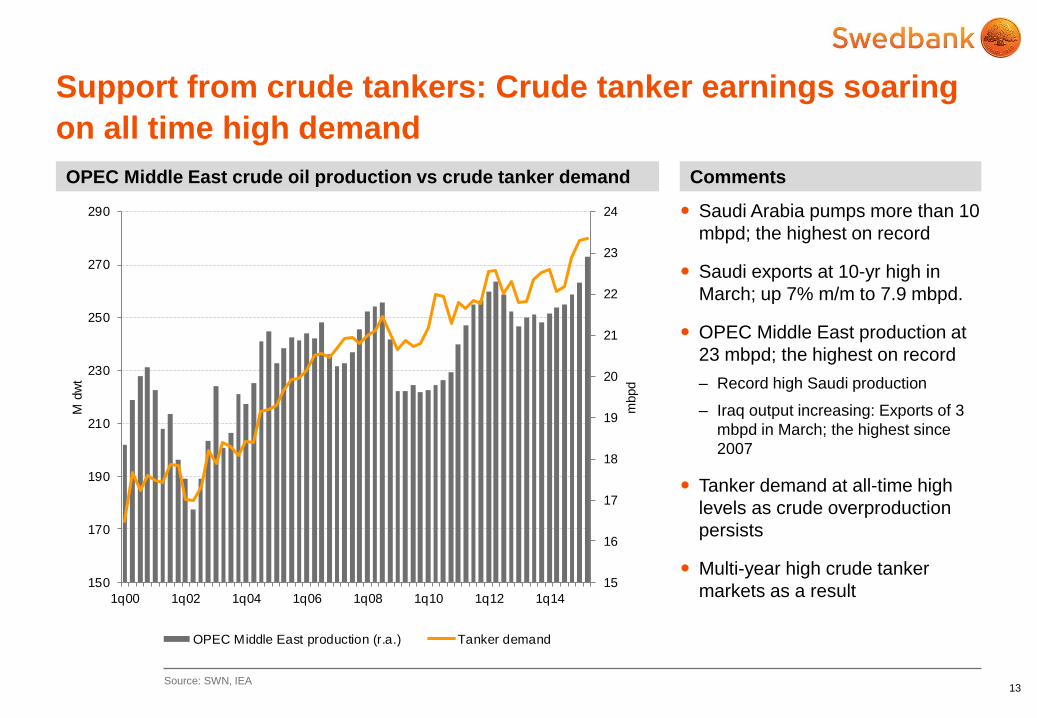
Saudi Arabia pumps more than 10
mbpd; the highest on record
Saudi exports at 10-yr high in
March; up 7% m/m to 7.9 mbpd.
OPEC Middle East production at
23 mbpd; the highest on record
– Record high Saudi production
– Iraq output increasing: Exports of 3
mbpd in March; the highest since
2007
Tanker demand at all-time high
levels as crude overproduction
persists
Multi-year high crude tanker
markets as a result
13
OPEC Middle East crude oil production vs crude tanker demand Comments
Source: SWN, IEA
Support from crude tankers: Crude tanker earnings soaring
on all time high demand
15
16
17
18
19
20
21
22
23
24
150
170
190
210
230
250
270
290
1q00 1q02 1q04 1q06 1q08 1q10 1q12 1q14
mbpd
M d
wt
OPEC Middle East production (r.a.) Tanker demand
CONFIDENTIAL
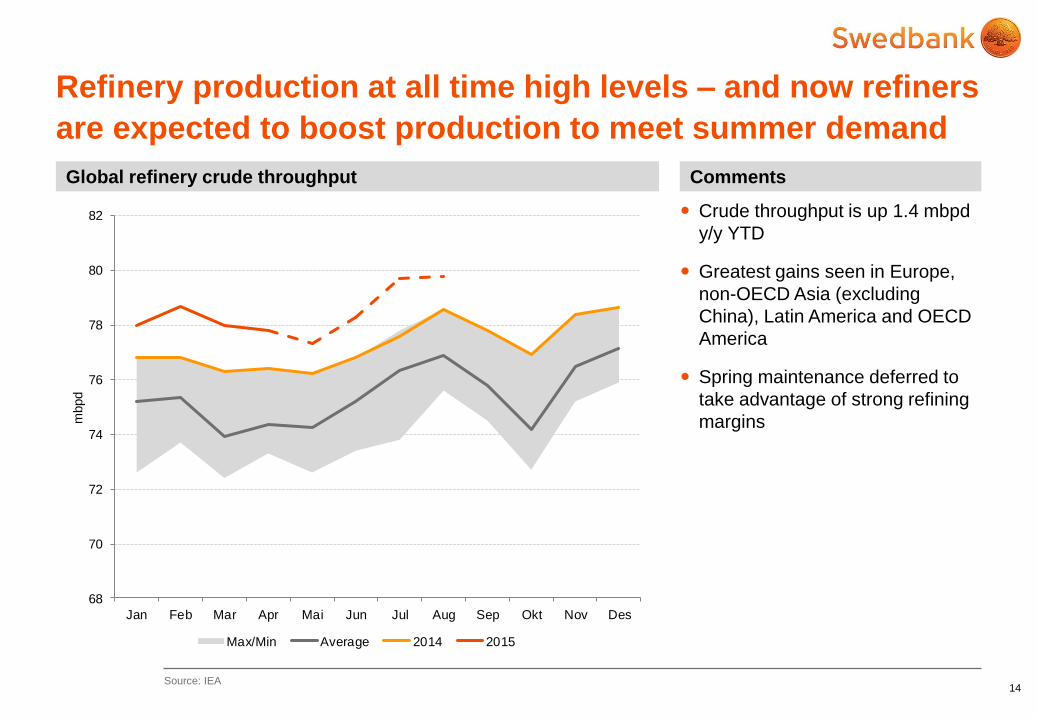
Crude throughput is up 1.4 mbpd
y/y YTD
Greatest gains seen in Europe,
non-OECD Asia (excluding
China), Latin America and OECD
America
Spring maintenance deferred to
take advantage of strong refining
margins
14
Global refinery crude throughput Comments
Source: IEA
Refinery production at all time high levels – and now refiners
are expected to boost production to meet summer demand
68
70
72
74
76
78
80
82
Jan Feb Mar Apr Mai Jun Jul Aug Sep Okt Nov Des
mbpd
Max/Min Average 2014 2015
CONFIDENTIAL
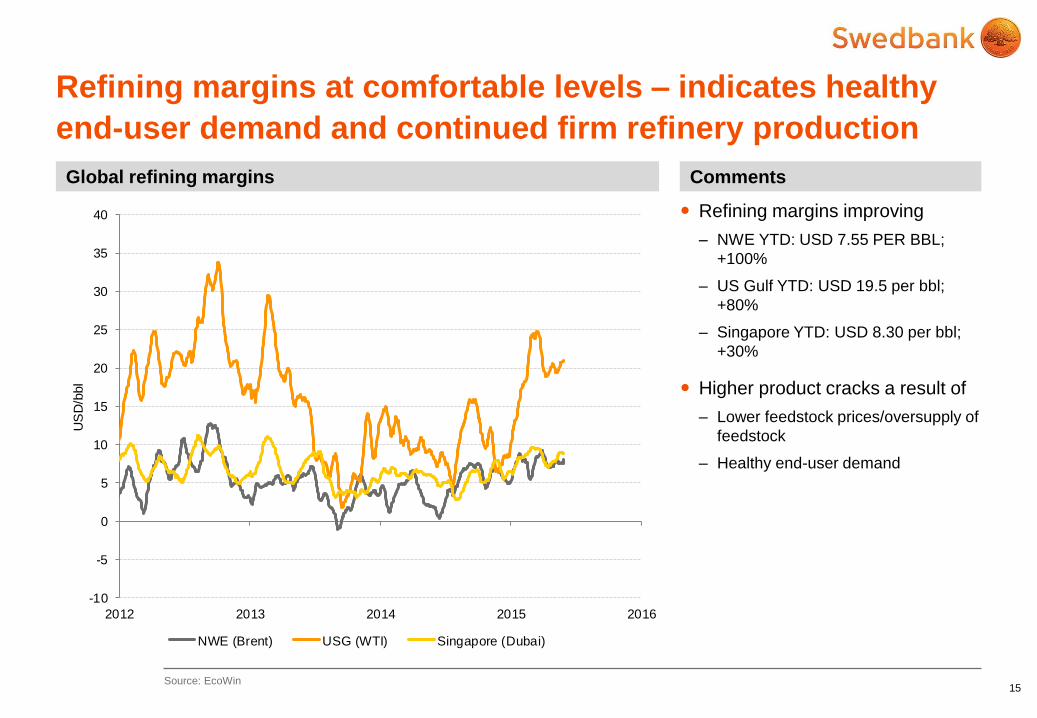
Refining margins improving
– NWE YTD: USD 7.55 PER BBL;
+100%
– US Gulf YTD: USD 19.5 per bbl;
+80%
– Singapore YTD: USD 8.30 per bbl;
+30%
Higher product cracks a result of
– Lower feedstock prices/oversupply of
feedstock
– Healthy end-user demand
15
Global refining margins Comments
Source: EcoWin
Refining margins at comfortable levels – indicates healthy
end-user demand and continued firm refinery production
-10
-5
0
5
10
15
20
25
30
35
40
2012 2013 2014 2015 2016
US
D/b
bl
NWE (Brent) USG (WTI) Singapore (Dubai)
CONFIDENTIAL
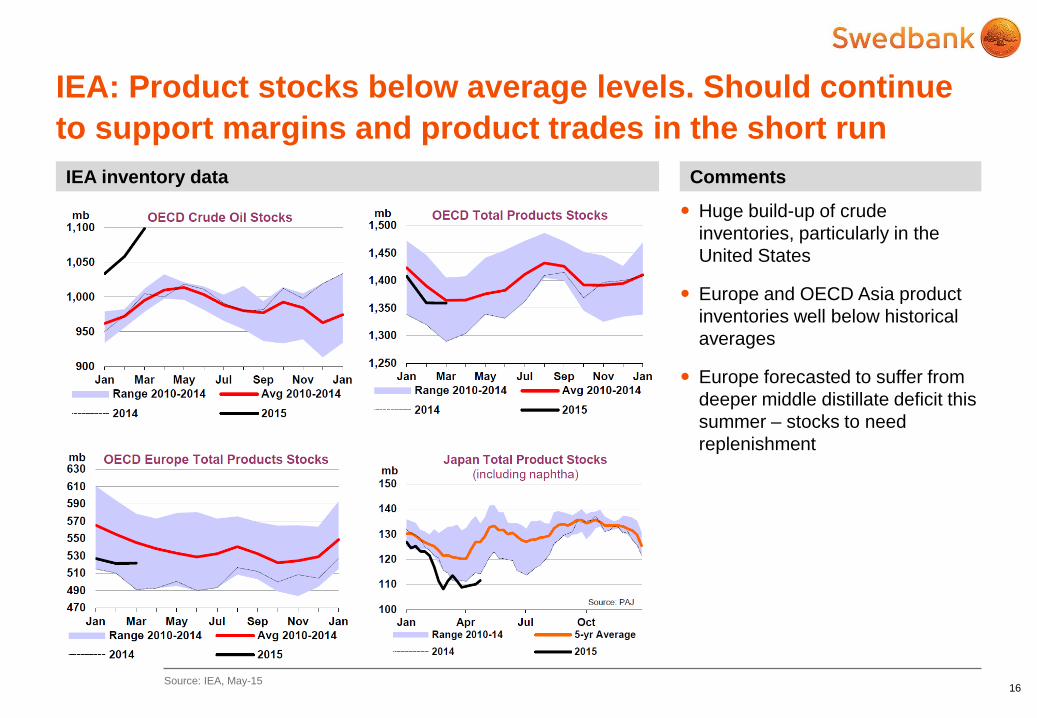
Huge build-up of crude
inventories, particularly in the
United States
Europe and OECD Asia product
inventories well below historical
averages
Europe forecasted to suffer from
deeper middle distillate deficit this
summer – stocks to need
replenishment
16
IEA inventory data Comments
Source: IEA, May-15
IEA: Product stocks below average levels. Should continue
to support margins and product trades in the short run
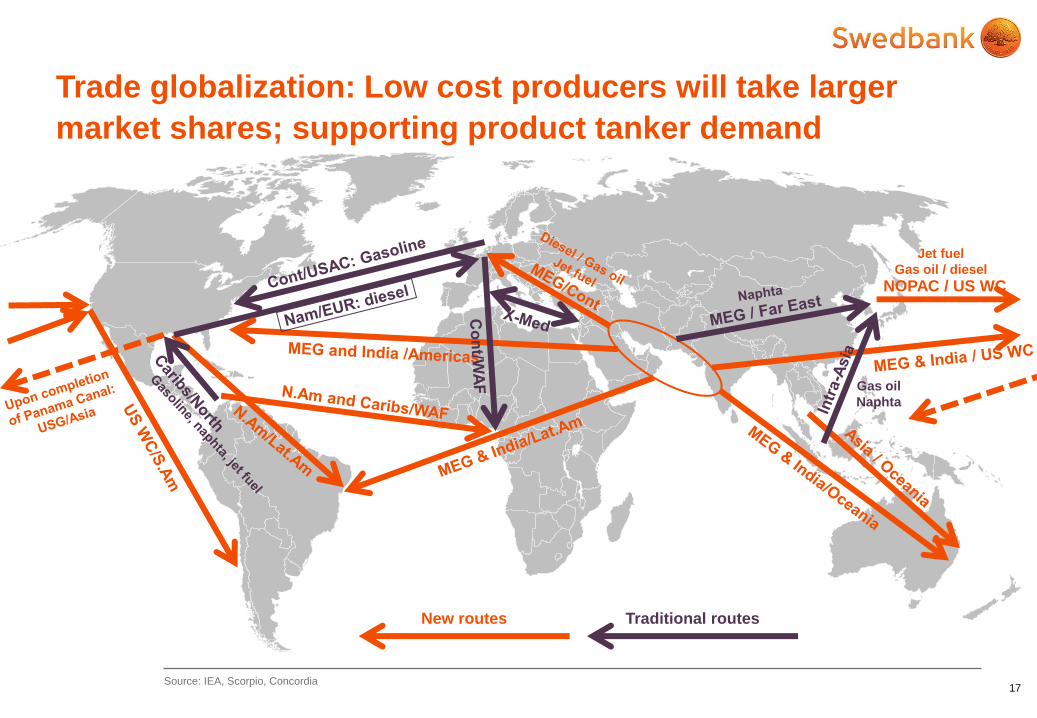
CONFIDENTIAL 17
Source: IEA, Scorpio, Concordia
Trade globalization: Low cost producers will take larger
market shares; supporting product tanker demand
NOPAC / US WC
Gas oil
Naphta
Jet fuel
Gas oil / diesel
New routes Traditional routes
CONFIDENTIAL
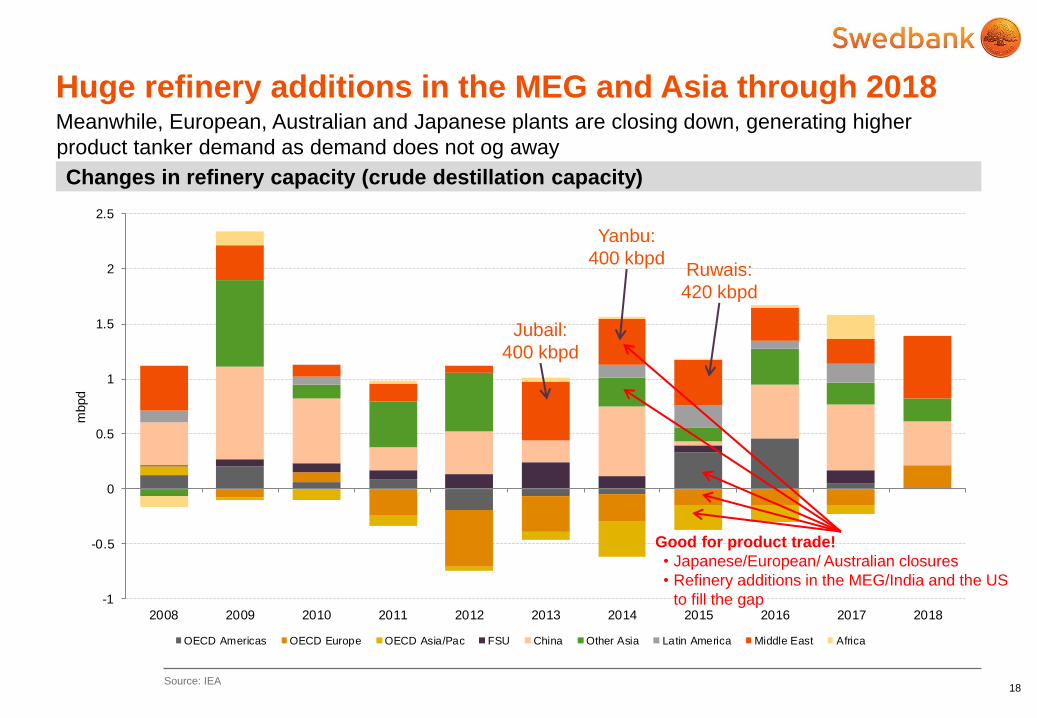
-1
-0.5
0
0.5
1
1.5
2
2.5
2008 2009 2010 2011 2012 2013 2014 2015 2016 2017 2018
mbpd
OECD Americas OECD Europe OECD Asia/Pac FSU China Other Asia Latin America Middle East Africa
18
Changes in refinery capacity (crude destillation capacity)
Source: IEA
Huge refinery additions in the MEG and Asia through 2018 Meanwhile, European, Australian and Japanese plants are closing down, generating higher
product tanker demand as demand does not og away
Good for product trade!
• Japanese/European/ Australian closures
• Refinery additions in the MEG/India and the US
to fill the gap
Jubail:
400 kbpd
Yanbu:
400 kbpd Ruwais:
420 kbpd
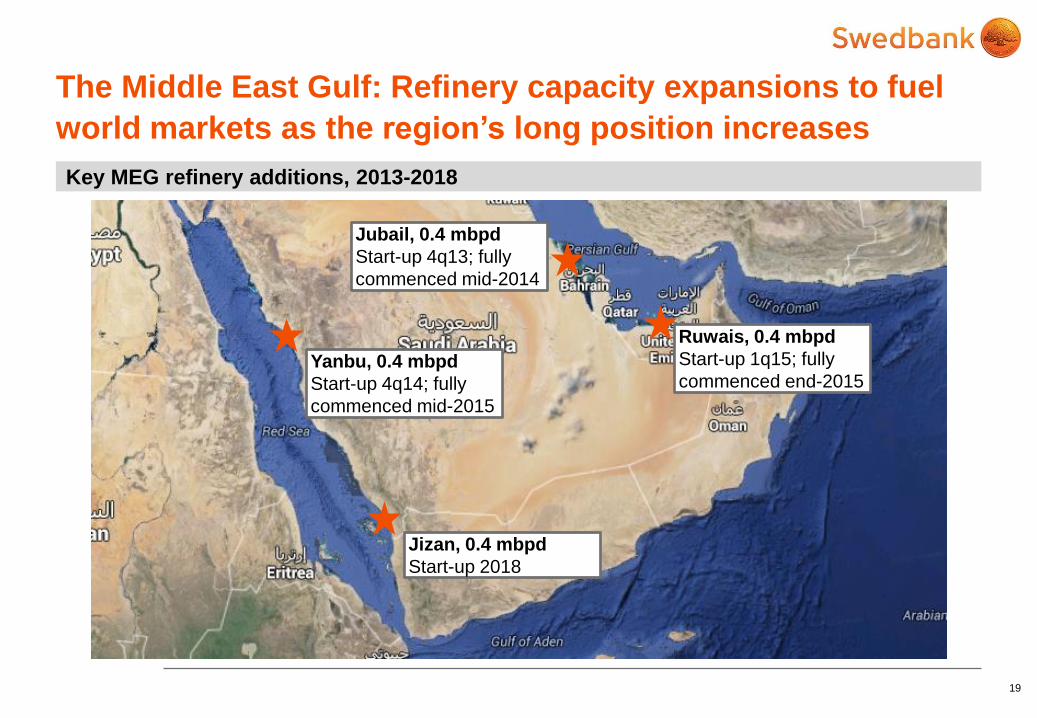
CONFIDENTIAL 19
Key MEG refinery additions, 2013-2018
The Middle East Gulf: Refinery capacity expansions to fuel
world markets as the region’s long position increases
Yanbu, 0.4 mbpd
Start-up 4q14; fully
commenced mid-2015
Ruwais, 0.4 mbpd
Start-up 1q15; fully
commenced end-2015
Jubail, 0.4 mbpd
Start-up 4q13; fully
commenced mid-2014
Jizan, 0.4 mbpd
Start-up 2018
CONFIDENTIAL
0
0.5
1
1.5
2
2.5
01.01.2010 01.01.2011 01.01.2012 01.01.2013 01.01.2014 01.01.2015
mbpd
Saudi Arabia exports Saudi Arabia refinery production
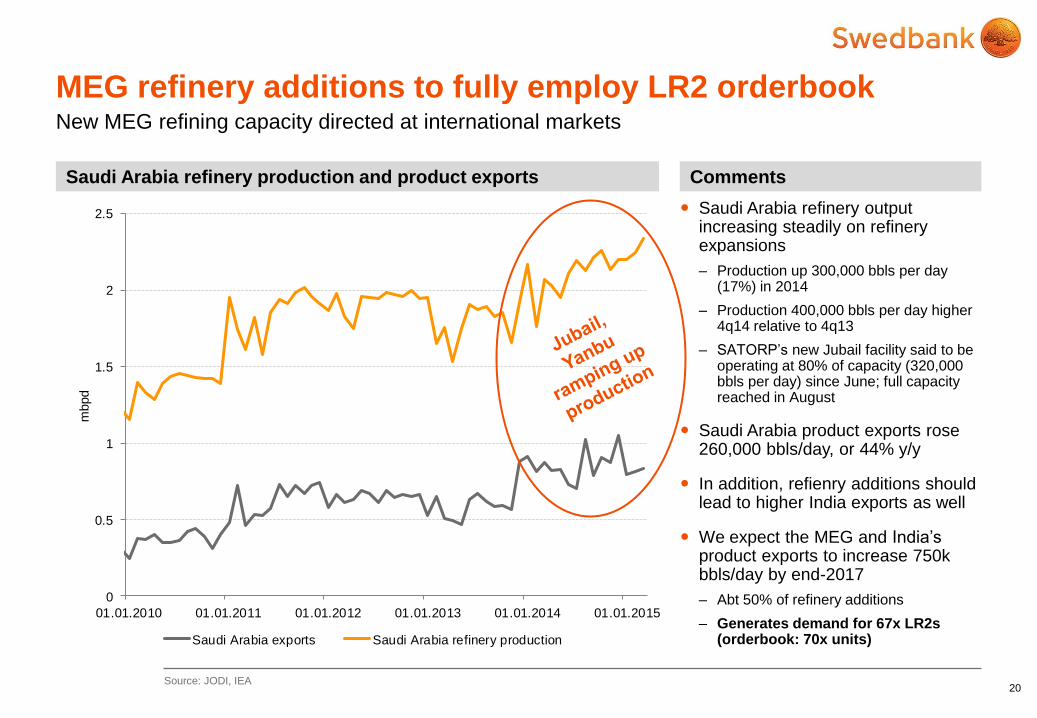
Saudi Arabia refinery output increasing steadily on refinery expansions
– Production up 300,000 bbls per day (17%) in 2014
– Production 400,000 bbls per day higher 4q14 relative to 4q13
– SATORP’s new Jubail facility said to be operating at 80% of capacity (320,000 bbls per day) since June; full capacity reached in August
Saudi Arabia product exports rose 260,000 bbls/day, or 44% y/y
In addition, refienry additions should lead to higher India exports as well
We expect the MEG and India’s product exports to increase 750k bbls/day by end-2017
– Abt 50% of refinery additions
– Generates demand for 67x LR2s (orderbook: 70x units)
20
Saudi Arabia refinery production and product exports Comments
Source: JODI, IEA
MEG refinery additions to fully employ LR2 orderbook New MEG refining capacity directed at international markets
CONFIDENTIAL
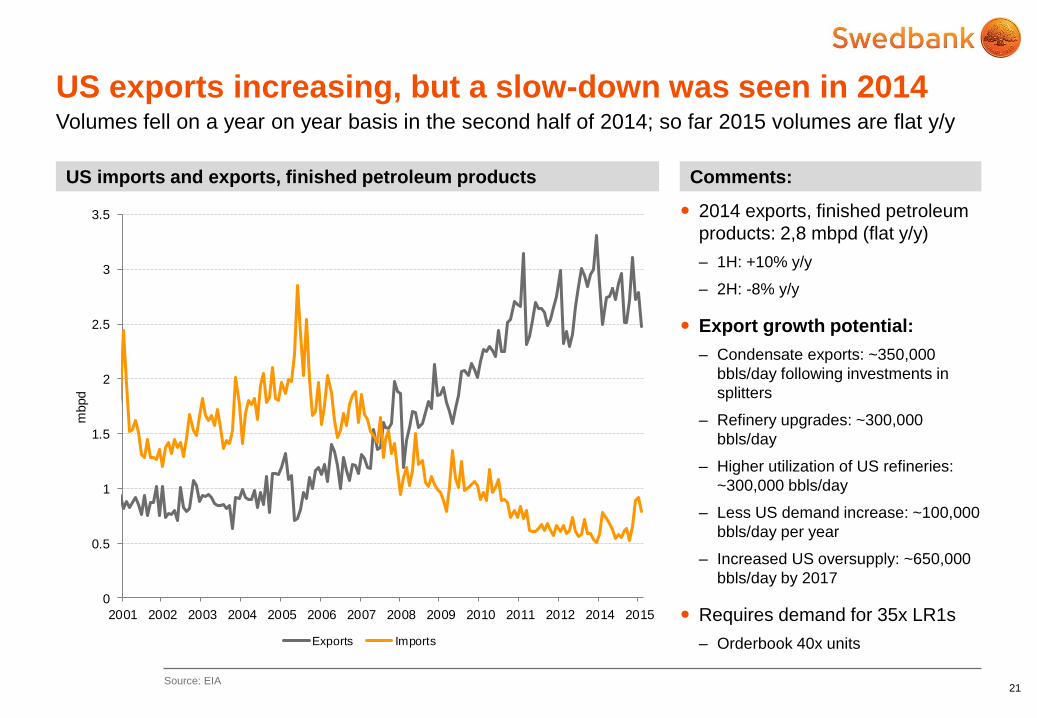
2014 exports, finished petroleum
products: 2,8 mbpd (flat y/y)
– 1H: +10% y/y
– 2H: -8% y/y
Export growth potential:
– Condensate exports: ~350,000
bbls/day following investments in
splitters
– Refinery upgrades: ~300,000
bbls/day
– Higher utilization of US refineries:
~300,000 bbls/day
– Less US demand increase: ~100,000
bbls/day per year
– Increased US oversupply: ~650,000
bbls/day by 2017
Requires demand for 35x LR1s
– Orderbook 40x units
21
US imports and exports, finished petroleum products Comments:
Source: EIA
US exports increasing, but a slow-down was seen in 2014 Volumes fell on a year on year basis in the second half of 2014; so far 2015 volumes are flat y/y
0
0.5
1
1.5
2
2.5
3
3.5
2001 2002 2003 2004 2005 2006 2007 2008 2009 2010 2011 2012 2014 2015
mbpd
Exports Imports
CONFIDENTIAL
22
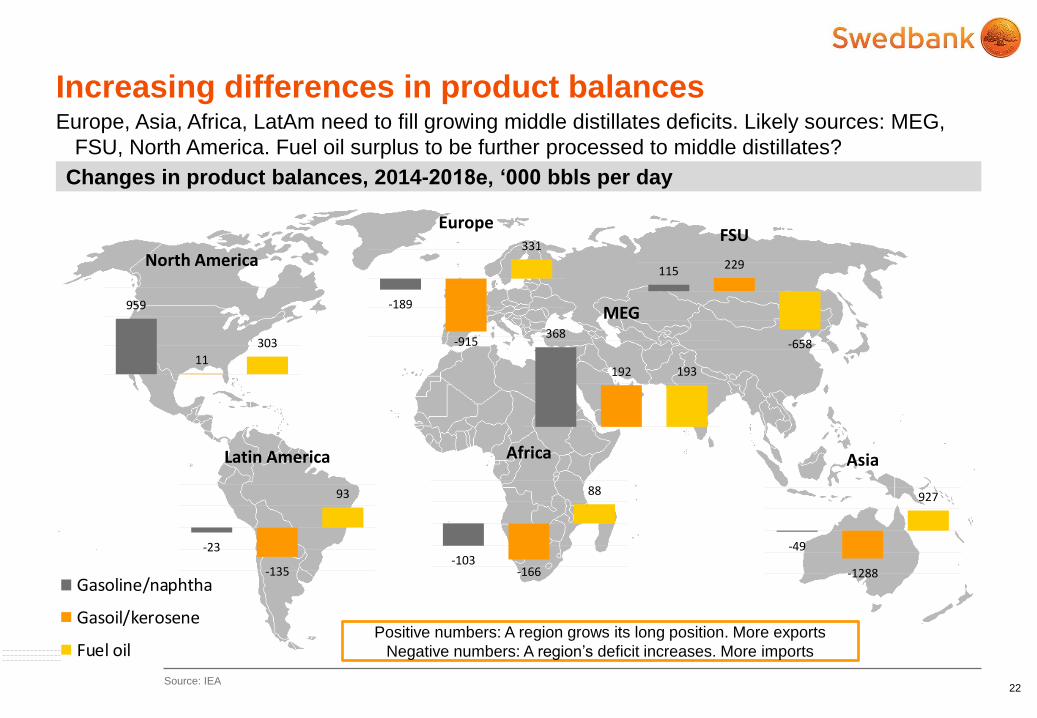
Changes in product balances, 2014-2018e, ‘000 bbls per day
Source: IEA
Increasing differences in product balances Europe, Asia, Africa, LatAm need to fill growing middle distillates deficits. Likely sources: MEG,
FSU, North America. Fuel oil surplus to be further processed to middle distillates?
-189
-915
331
Europe
959
11
303
North America
-103-166
88
Africa
368
192 193
MEG
115 229
-658
FSU
-23
-135
93
Latin America
-49
-1288
927
Asia
Gasoline/naphtha
Gasoil/kerosene
Fuel oilPositive numbers: A region grows its long position. More exports
Negative numbers: A region’s deficit increases. More imports
CONFIDENTIAL 23
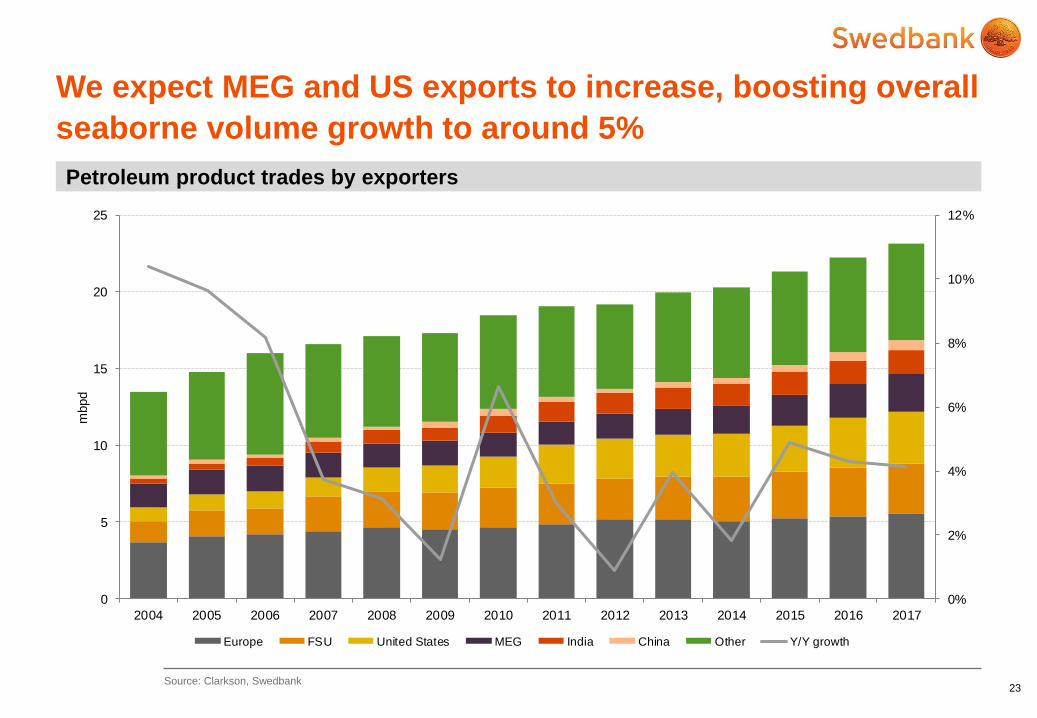
Petroleum product trades by exporters
Source: Clarkson, Swedbank
We expect MEG and US exports to increase, boosting overall
seaborne volume growth to around 5%
0%
2%
4%
6%
8%
10%
12%
0
5
10
15
20
25
2004 2005 2006 2007 2008 2009 2010 2011 2012 2013 2014 2015 2016 2017
mbpd
Europe FSU United States MEG India China Other Y/Y growth
CONFIDENTIAL
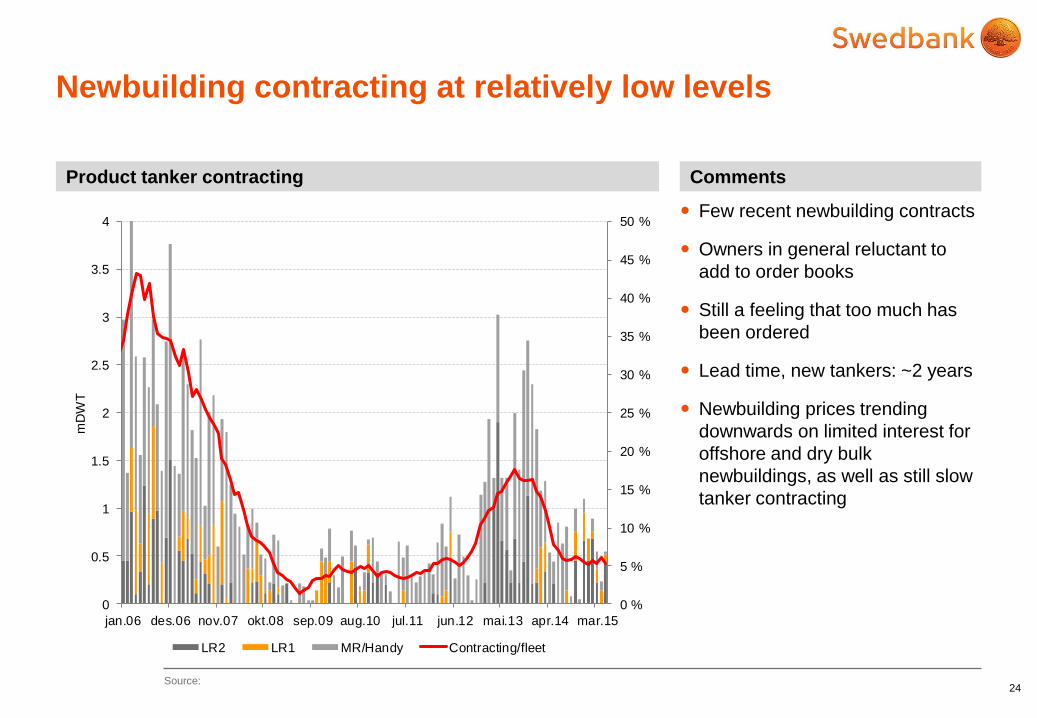
Few recent newbuilding contracts
Owners in general reluctant to
add to order books
Still a feeling that too much has
been ordered
Lead time, new tankers: ~2 years
Newbuilding prices trending
downwards on limited interest for
offshore and dry bulk
newbuildings, as well as still slow
tanker contracting
24
Product tanker contracting Comments
Source:
Newbuilding contracting at relatively low levels
0 %
5 %
10 %
15 %
20 %
25 %
30 %
35 %
40 %
45 %
50 %
0
0.5
1
1.5
2
2.5
3
3.5
4
jan.06 des.06 nov.07 okt.08 sep.09 aug.10 jul.11 jun.12 mai.13 apr.14 mar.15
mD
WT
LR2 LR1 MR/Handy Contracting/fleet
CONFIDENTIAL 25
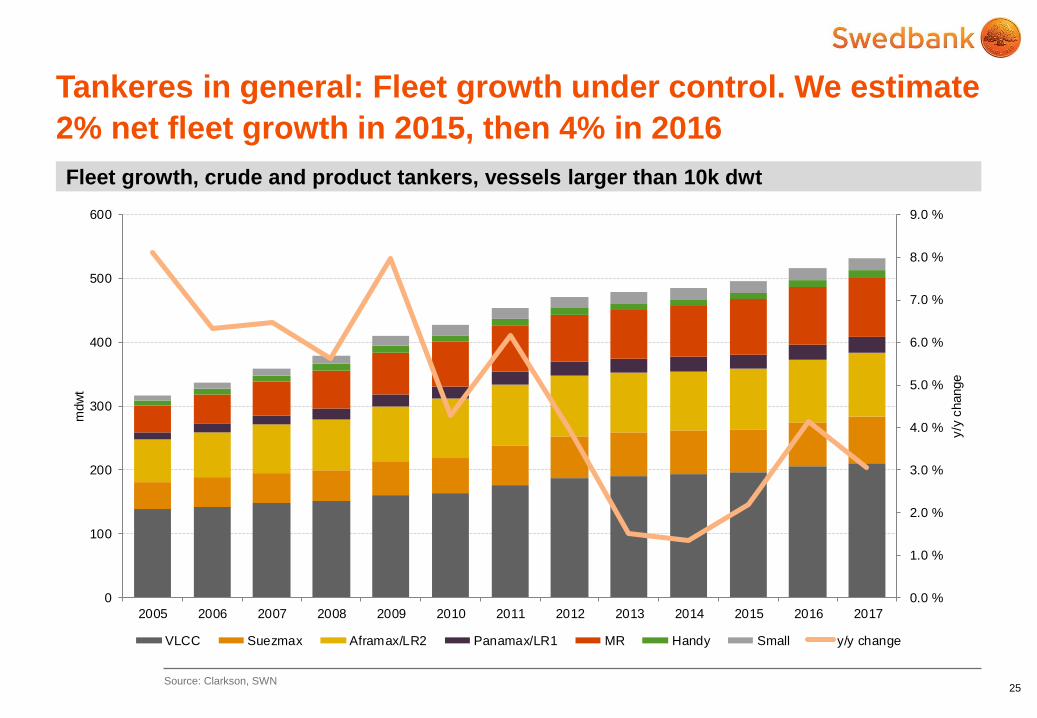
Fleet growth, crude and product tankers, vessels larger than 10k dwt
Source: Clarkson, SWN
Tankeres in general: Fleet growth under control. We estimate
2% net fleet growth in 2015, then 4% in 2016
0.0 %
1.0 %
2.0 %
3.0 %
4.0 %
5.0 %
6.0 %
7.0 %
8.0 %
9.0 %
0
100
200
300
400
500
600
2005 2006 2007 2008 2009 2010 2011 2012 2013 2014 2015 2016 2017
y/y
change
mdw
t
VLCC Suezmax Aframax/LR2 Panamax/LR1 MR Handy Small y/y change
CONFIDENTIAL 26
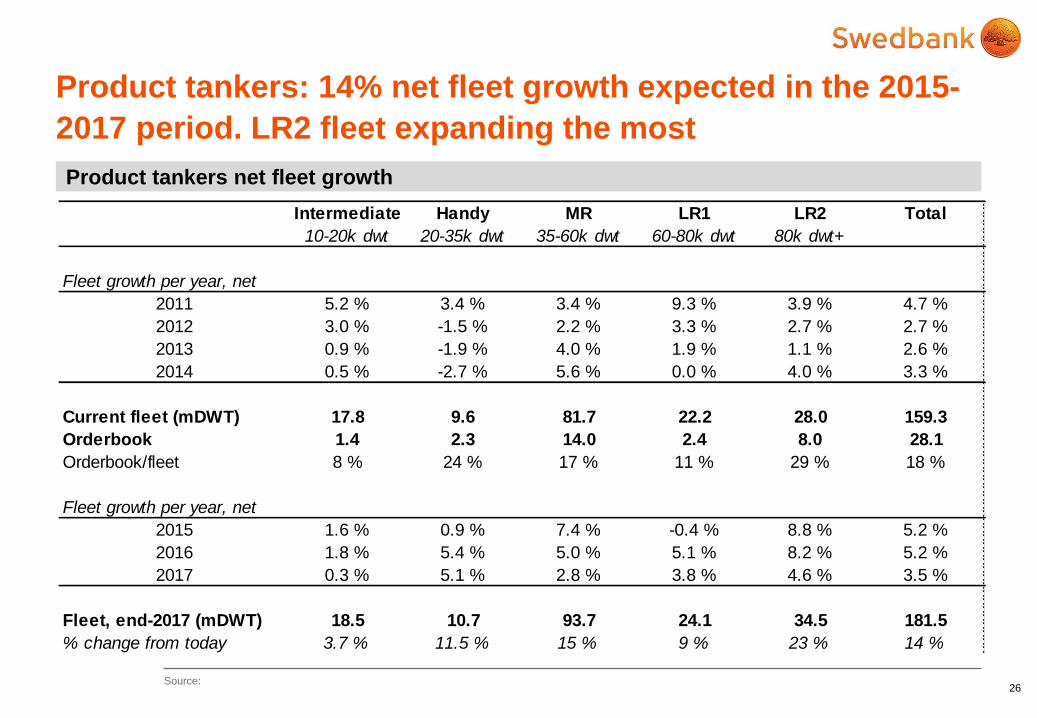
Product tankers net fleet growth
Source:
Product tankers: 14% net fleet growth expected in the 2015-
2017 period. LR2 fleet expanding the most
Intermediate Handy MR LR1 LR2 Total
10-20k dwt 20-35k dwt 35-60k dwt 60-80k dwt 80k dwt+
Fleet growth per year, net
2011 5.2 % 3.4 % 3.4 % 9.3 % 3.9 % 4.7 %
2012 3.0 % -1.5 % 2.2 % 3.3 % 2.7 % 2.7 %
2013 0.9 % -1.9 % 4.0 % 1.9 % 1.1 % 2.6 %
2014 0.5 % -2.7 % 5.6 % 0.0 % 4.0 % 3.3 %
Current fleet (mDWT) 17.8 9.6 81.7 22.2 28.0 159.3
Orderbook 1.4 2.3 14.0 2.4 8.0 28.1
Orderbook/fleet 8 % 24 % 17 % 11 % 29 % 18 %
Fleet growth per year, net
2015 1.6 % 0.9 % 7.4 % -0.4 % 8.8 % 5.2 %
2016 1.8 % 5.4 % 5.0 % 5.1 % 8.2 % 5.2 %
2017 0.3 % 5.1 % 2.8 % 3.8 % 4.6 % 3.5 %
Fleet, end-2017 (mDWT) 18.5 10.7 93.7 24.1 34.5 181.5
% change from today 3.7 % 11.5 % 15 % 9 % 23 % 14 %
CONFIDENTIAL
27
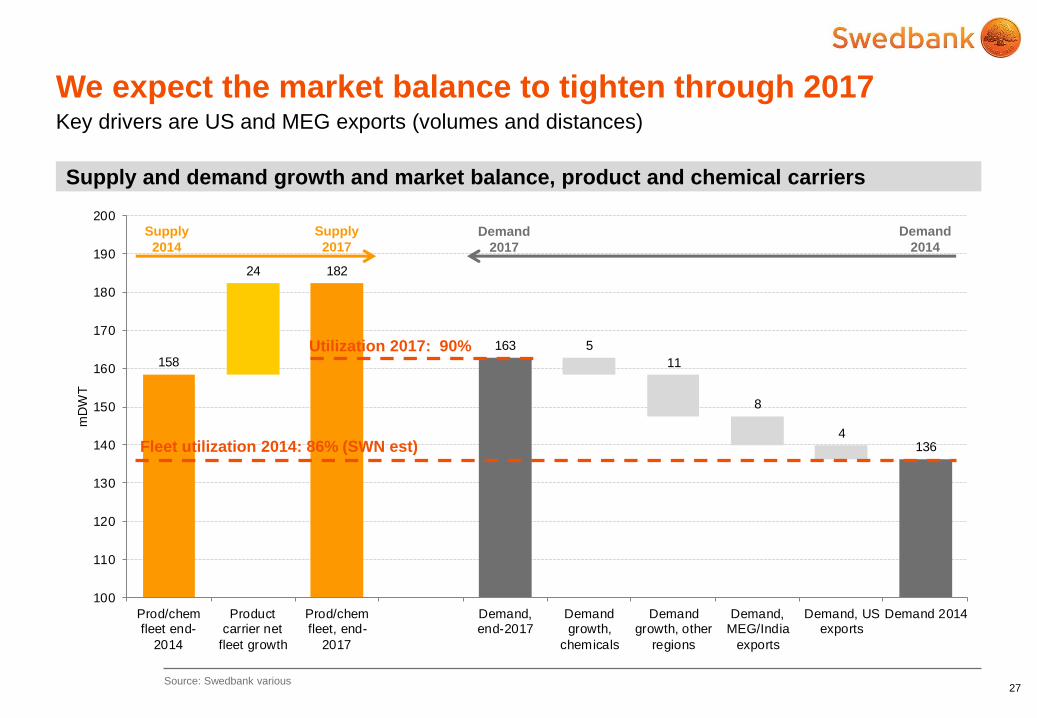
Supply and demand growth and market balance, product and chemical carriers
Source: Swedbank various
We expect the market balance to tighten through 2017 Key drivers are US and MEG exports (volumes and distances)
158
24 182
163 5
11
8
4136
100
110
120
130
140
150
160
170
180
190
200
Prod/chemfleet end-
2014
Productcarrier net
fleet growth
Prod/chemfleet, end-
2017
Demand,end-2017
Demandgrowth,
chemicals
Demandgrowth, other
regions
Demand,MEG/India
exports
Demand, USexports
Demand 2014
mD
WT
Fleet utilization 2014: 86% (SWN est)
Utilization 2017: 90%
Demand
2017
Demand
2014
Supply
2014
Supply
2017
CONFIDENTIAL 28
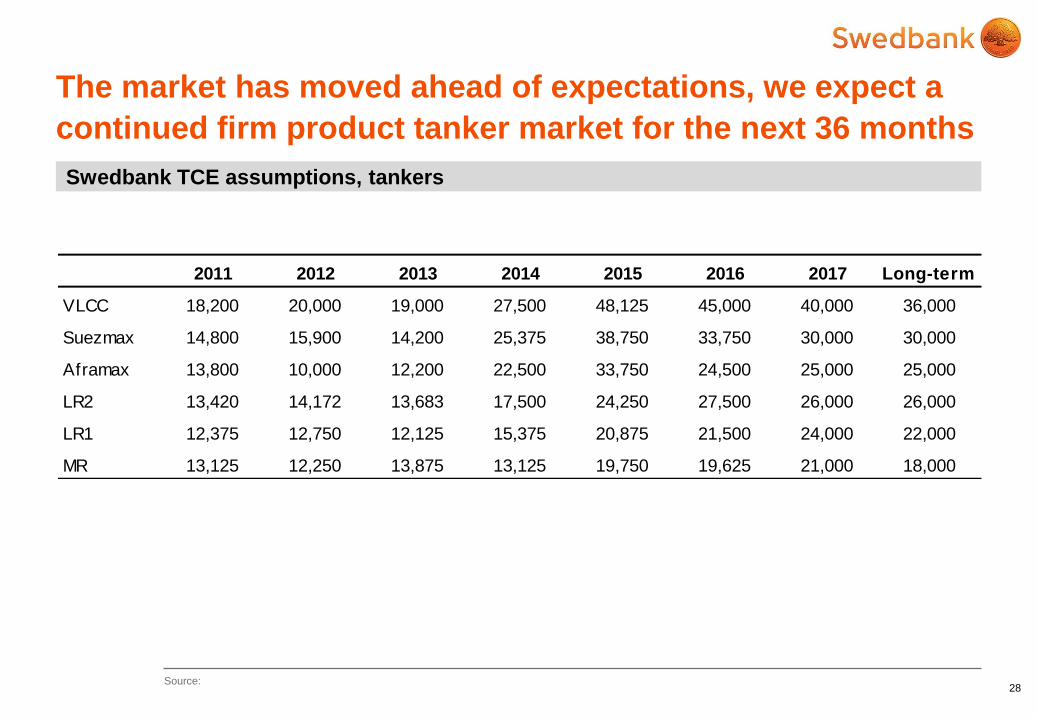
Swedbank TCE assumptions, tankers
Source:
The market has moved ahead of expectations, we expect a
continued firm product tanker market for the next 36 months
2011 2012 2013 2014 2015 2016 2017 Long-term
VLCC 18,200 20,000 19,000 27,500 48,125 45,000 40,000 36,000
Suezmax 14,800 15,900 14,200 25,375 38,750 33,750 30,000 30,000
Aframax 13,800 10,000 12,200 22,500 33,750 24,500 25,000 25,000
LR2 13,420 14,172 13,683 17,500 24,250 27,500 26,000 26,000
LR1 12,375 12,750 12,125 15,375 20,875 21,500 24,000 22,000
MR 13,125 12,250 13,875 13,125 19,750 19,625 21,000 18,000
CONFIDENTIAL
29 Source:
Related Documents