www.wilsongroup.com 1 www.wilsongroup.com 1 Sales Compensation Practices Survey Report – 2013 - 2014 October, 2013 Concord, MA

Concord, MA. 2 Page I.Overview of the Survey and Participants’ Profile 3 II.The Structure of Sales Compensation Plans 11 A.Direct.
Dec 23, 2015
Welcome message from author
This document is posted to help you gain knowledge. Please leave a comment to let me know what you think about it! Share it to your friends and learn new things together.
Transcript

Sales Compensation PracticesSurvey Report – 2013 - 2014
October, 2013
Concord, MA

www.wilsongroup.com 2
Table of Contents
Page
I. Overview of the Survey and Participants’ Profile 3
II. The Structure of Sales Compensation Plans 11
A. Direct Sales ExecutiveB. Account ManagerC. Distribution/Channel ManagerD. Inside/Tele Sales RepresentativeE. First Level Sales Management
III. Comparison of Sales Plan by Market Segment 52
A. By IndustryB. By Company size
IV. Assessment of the Effectiveness of These Plans 66
V. Primary Conclusions and Ideas to Consider 74
Overview of the Wilson Group 76

www.wilsongroup.com 3
PART I
Overview of the Surveyand Participants Profile

www.wilsongroup.com 4
Overview of the Survey
I. Overview of the Survey and Participants Profile
This survey was created to fill an important gap in information about sales compensation plans. While traditional compensation surveys show how much people make in various positions, there is usually little specific information on how companies structure their sales compensation plans. Further, as companies consider changes in their business and sales strategies, it is often very important to re-examine the sales compensation plan so that it aligns effectively with the firm’s strategy. Finally, as companies face a more competitive environment, how people are paid is as important as how much. Hopefully, this survey report provides information and insights on how companies structure their sales programs and the relationship between pay and performance.
Based on the results of this survey, several of the most important findings include:
1. Approximately 77% of the participating companies made changes to their plans for 2013. Over one-third (34%) made moderate the major changes. Most of these changes included: Simplifying the plan, changing the commission rates, and placing more emphasis on acquiring new accounts or customers.
2. The pay mix of the survey positions averaged around 60% for base salary and 40% for variable pay. The mix ranged from 57% salary 33% variable for direct sales to 72% salary and 28% variable for channel managers.
3. Payout levels before target (100% quota) declined in relation to the performance; payout levels above target accelerated well above the actual performance. On average, payouts for exceptional performance was 1.8x that of the payout at target.
4. There was little consistency among the companies about when payouts are earned and paid. Slightly less than one-third (30%) award commission when the product is shipped or delivered, and 28% do this when the sale is booked. Some companies do this when invoiced (17%) and others when invoiced are paid (17%). One-third use a combination.
5. Companies feel the sales compensation plan’s best features are the compensation levels is produced (opportunity and total pay), the simplicity of the plan, and how the plan has no caps on earnings.

www.wilsongroup.com 5
Overview of the Survey (continued)
I. Overview of the Survey and Participants Profile
We hope that you enjoy this report and find it easy to understand and obtain information on how to most effectively design your sales incentive plans. If you have any questions or would like to discuss how your company compares to the market practices, please contact us. We look forward to being of service to you. Our phone number is 978-371-0476 or contact Tom Wilson at [email protected]. Thank you, and enjoy the report.
Important: This report is intended for the survey participants and those that purchase the survey from the Wilson Group. All rights are reserved. This report may not be duplicated or distributed in any fashion without prior written approval from the Wilson Group to individuals outside the survey participants or purchasers of the survey. If you would like permission, please contact us at: 978-371-0476 or at [email protected]
Wilson Group, Inc.
www.wilsongroup.com 6
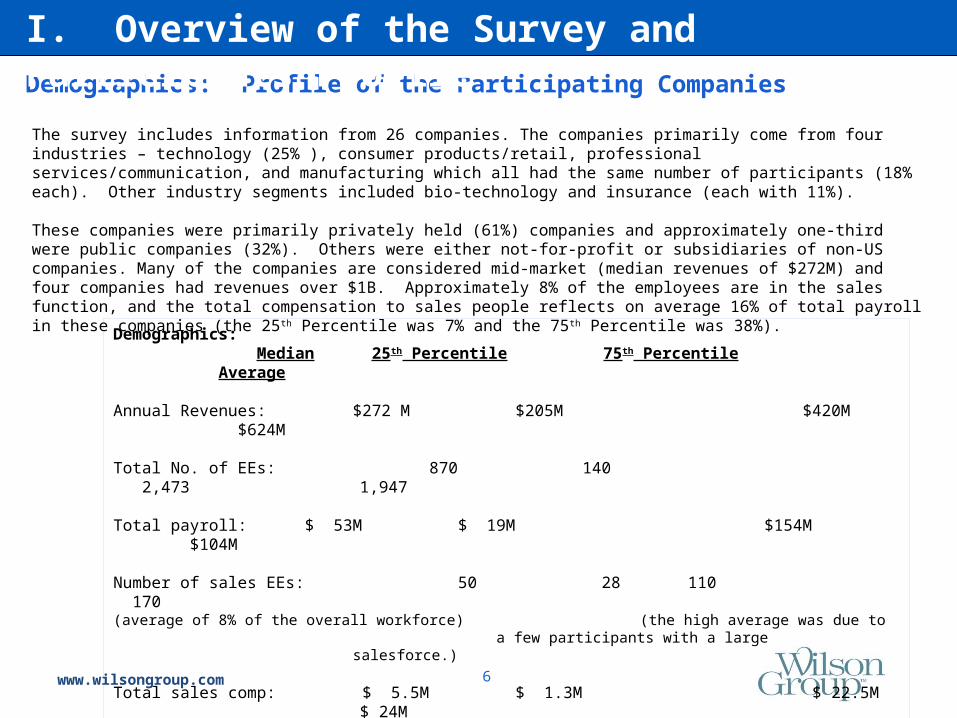
The survey includes information from 26 companies. The companies primarily come from four industries – technology (25% ), consumer products/retail, professional services/communication, and manufacturing which all had the same number of participants (18% each). Other industry segments included bio-technology and insurance (each with 11%).
These companies were primarily privately held (61%) companies and approximately one-third were public companies (32%). Others were either not-for-profit or subsidiaries of non-US companies. Many of the companies are considered mid-market (median revenues of $272M) and four companies had revenues over $1B. Approximately 8% of the employees are in the sales function, and the total compensation to sales people reflects on average 16% of total payroll in these companies (the 25 th Percentile was 7% and the 75th Percentile was 38%).
Demographics:Median 25th Percentile 75th Percentile Average
Annual Revenues: $272 M $205M $420M $624M
Total No. of EEs: 870 140 2,473 1,947
Total payroll: $ 53M $ 19M $154M $104M
Number of sales EEs: 50 28 110 170(average of 8% of the overall workforce) (the high average was due to
a few participants with a large salesforce.)
Total sales comp: $ 5.5M $ 1.3M $ 22.5M $ 24M
Demographics: Profile of the Participating Companies
I. Overview of the Survey and Participants Profile

www.wilsongroup.com 7
This group of companies is clearly in a growth mode. Approximately 82% have revenue growth projections for 2013 that exceeded 7% over 2012. Only one organization was forecasting a decline in sales.
In terms of staffing, 41% of the companies were increasing the number of sales people, 52% were making no change to the staffing level, and 4% were decreasing the staffing levels. This pattern shows that companies on balance are looking to increase revenues between 10% and 15% using the same number of sales professionals in their organization.
Revenue growth projections for 2013
Demographics: Revenue growth projections for 2013
I. Overview of the Survey and Participants Profile
www.wilsongroup.com 8
Positions Included in Sales Compensation Plans
I. Overview of the Survey and Participants Profile
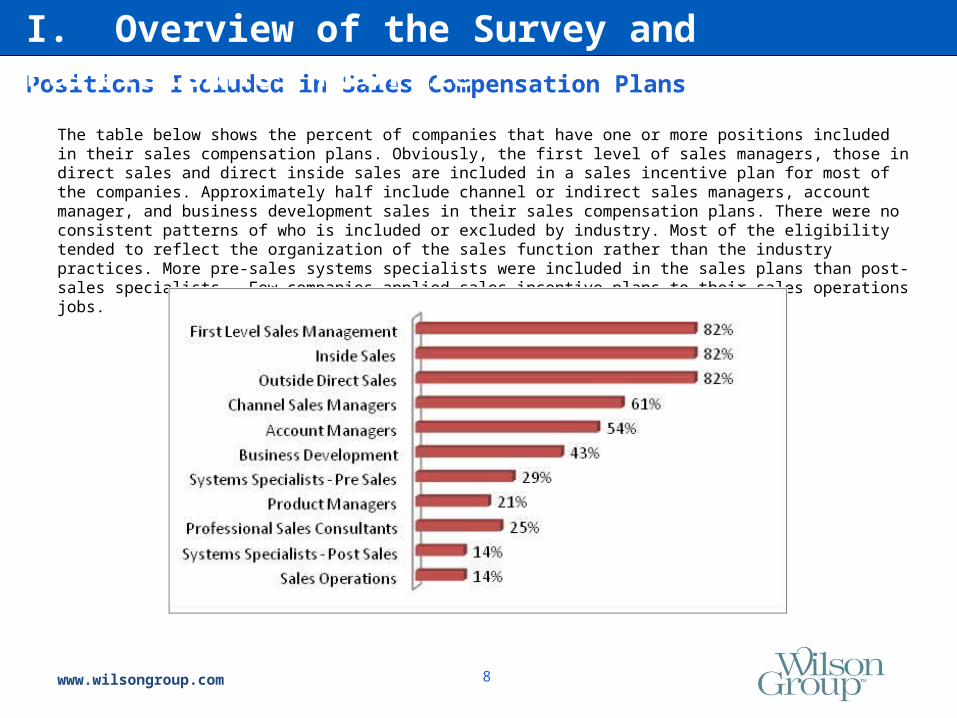
The table below shows the percent of companies that have one or more positions included in their sales compensation plans. Obviously, the first level of sales managers, those in direct sales and direct inside sales are included in a sales incentive plan for most of the companies. Approximately half include channel or indirect sales managers, account manager, and business development sales in their sales compensation plans. There were no consistent patterns of who is included or excluded by industry. Most of the eligibility tended to reflect the organization of the sales function rather than the industry practices. More pre-sales systems specialists were included in the sales plans than post-sales specialists. Few companies applied sales incentive plans to their sales operations jobs.
www.wilsongroup.com 9
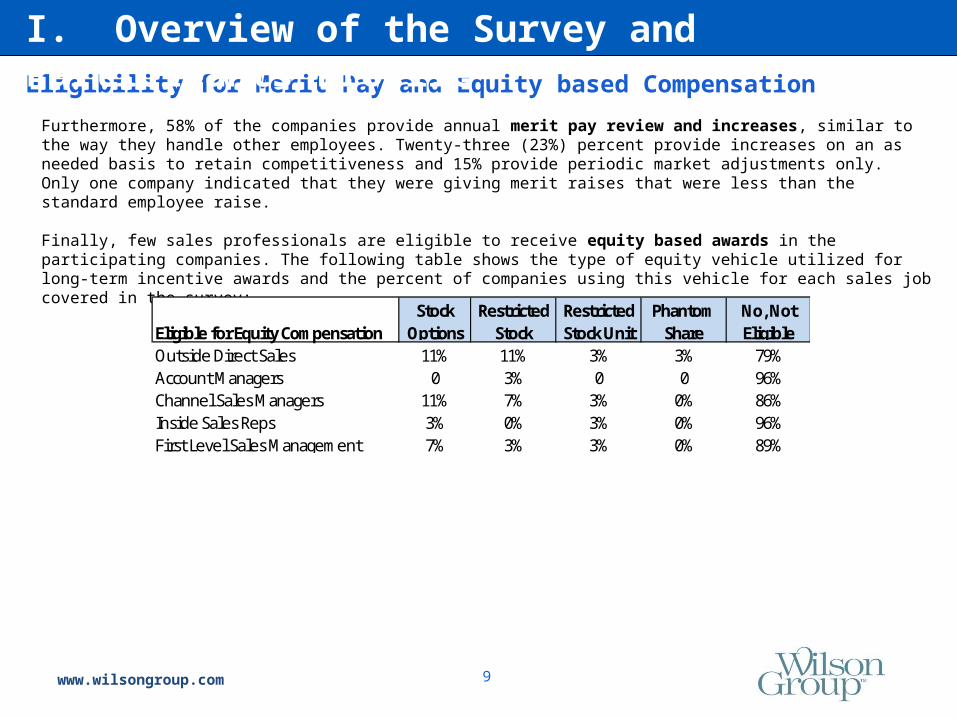
Furthermore, 58% of the companies provide annual merit pay review and increases, similar to the way they handle other employees. Twenty-three (23%) percent provide increases on an as needed basis to retain competitiveness and 15% provide periodic market adjustments only. Only one company indicated that they were giving merit raises that were less than the standard employee raise.
Finally, few sales professionals are eligible to receive equity based awards in the participating companies. The following table shows the type of equity vehicle utilized for long-term incentive awards and the percent of companies using this vehicle for each sales job covered in the survey:
Eligibility for Merit Pay and Equity based Compensation
I. Overview of the Survey and Participants Profile
Eligible for Equity CompensationStock
OptionsRestricted
StockRestricted Stock Unit
Phantom Share
No, Not Eligible
Outside Direct Sales 11% 11% 3% 3% 79%Account Managers 0 3% 0 0 96%Channel Sales Managers 11% 7% 3% 0% 86%Inside Sales Reps 3% 0% 3% 0% 96%First Level Sales Management 7% 3% 3% 0% 89%
www.wilsongroup.com 10
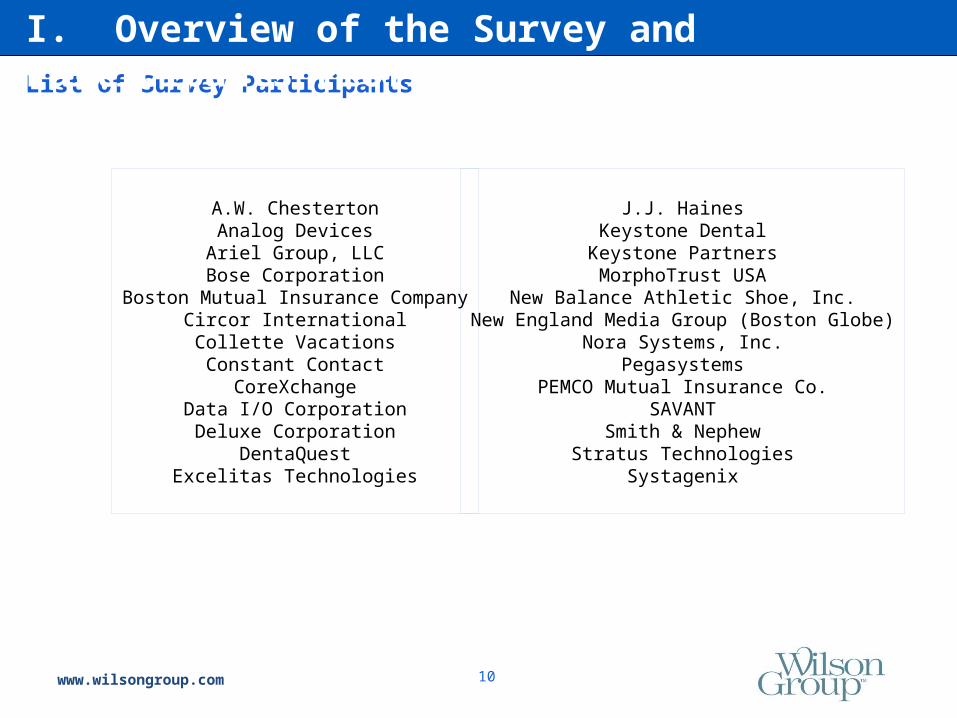
A.W. ChestertonAnalog DevicesAriel Group, LLCBose Corporation
Boston Mutual Insurance CompanyCircor InternationalCollette VacationsConstant Contact
CoreXchangeData I/O CorporationDeluxe Corporation
DentaQuestExcelitas Technologies
List of Survey Participants
I. Overview of the Survey and Participants Profile
J.J. HainesKeystone Dental
Keystone PartnersMorphoTrust USA
New Balance Athletic Shoe, Inc.New England Media Group (Boston Globe)
Nora Systems, Inc.Pegasystems
PEMCO Mutual Insurance Co.SAVANT
Smith & NephewStratus Technologies
Systagenix
www.wilsongroup.com 11
PART II
The Structure of Sales Compensation Plans

www.wilsongroup.com 12
This section of the report will provide a summary of the responses for all participants. The survey examined the sales practices for five (5) positions. These are:
Direct Sales Executive Account Manager Channel (Indirect) Manager Inside/Tele Sales Representative First Level Sales Management
This section will examine the sales compensation design elements for each of these positions. We will first provide the job profile that was included in the survey. Participants were asked to indicate their confidence (expressed as a percentage) of their job match to the job profile. The average responses of the confidence factor exceeded 90% for each of these jobs.
In the section that follows (Section III) we will examine the responses to the most critical questions, or ones where there were the most variance in responses, by industry and by company size (based on revenues).
We hope this information provides important insights to your company’s sales compensation practices as you compare them to the market.
Overview of this Section
II. The Structure of Sales Comp Plans

www.wilsongroup.com 13
The following is the position profile on which the respondents based their sales plan information:
Direct Sales Executive:
Responsible for generating new and/or existing sales from assigned territories, product lines or named accounts. Involves contacting, visiting and building relationships with prospects. Builds a network of referral sources and/or handles leads generated through the company’s marketing initiatives. Participates in analyzing the customer’s needs and opportunities, presenting products and services that can address the customer’s needs, and closing the contract agreement. Demonstrates knowledge of the organization’s products and services, and may have in-depth knowledge of a subset of products or services. This is the seasoned, mid-career level sales position. Requires a minimum of an associate's or bachelor’s degree or its equivalent with 6-9 years of experience in the field or in a related sales area. Relies on experience and judgment to plan and accomplish goals, and utilizes trained sales skills and practices consistent with the firm’s marketing and sales strategies. Typically reports to a district or regional manager or head of a unit/department.
Summary of the Position
II. The Structure of Sales Comp Plans – Direct Sales
www.wilsongroup.com 14
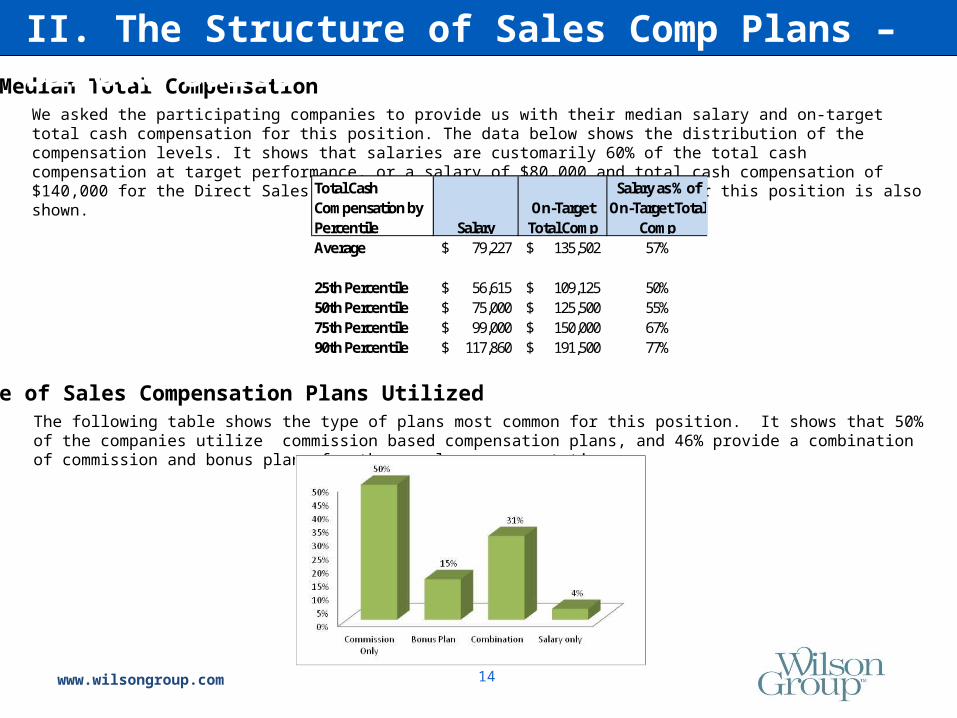
Median Total CompensationWe asked the participating companies to provide us with their median salary and on-target total cash compensation for this position. The data below shows the distribution of the compensation levels. It shows that salaries are customarily 60% of the total cash compensation at target performance, or a salary of $80,000 and total cash compensation of $140,000 for the Direct Sales Executive. The range of data provided for this position is also shown.
Type of Sales Compensation Plans UtilizedThe following table shows the type of plans most common for this position. It shows that 50% of the companies utilize commission based compensation plans, and 46% provide a combination of commission and bonus plans for these sales representatives.
II. The Structure of Sales Comp Plans – Direct Sales
Total Cash Compensation by Percentile Salary
On-Target Total Comp
Salary as % of On-Target Total
CompAverage 79,227$ 135,502$ 57%
25th Percentile 56,615$ 109,125$ 50%50th Percentile 75,000$ 125,500$ 55%75th Percentile 99,000$ 150,000$ 67%90th Percentile 117,860$ 191,500$ 77%

www.wilsongroup.com 15
On-Target Earnings -- Performance FactorsVirtually all participants indicated that their compensation plans were based on individual performance factors. In addition to individual measures, 7% of the participants use team/group measures, another 7% use regional or overall sales performance, and 10% use corporate performance to determine the payouts.
On-Target Earnings -- Performance and Pay RelationshipIn general, the targeted earnings correspond to the same level of performance (as a percent of quota or goal target). The payout below target corresponds closely to the actual performance to quota or goal, but above quota the payout accelerates to approximately 1.44 of the performance to quota.
II. The Structure of Sales Comp Plans – Direct Sales
www.wilsongroup.com 16
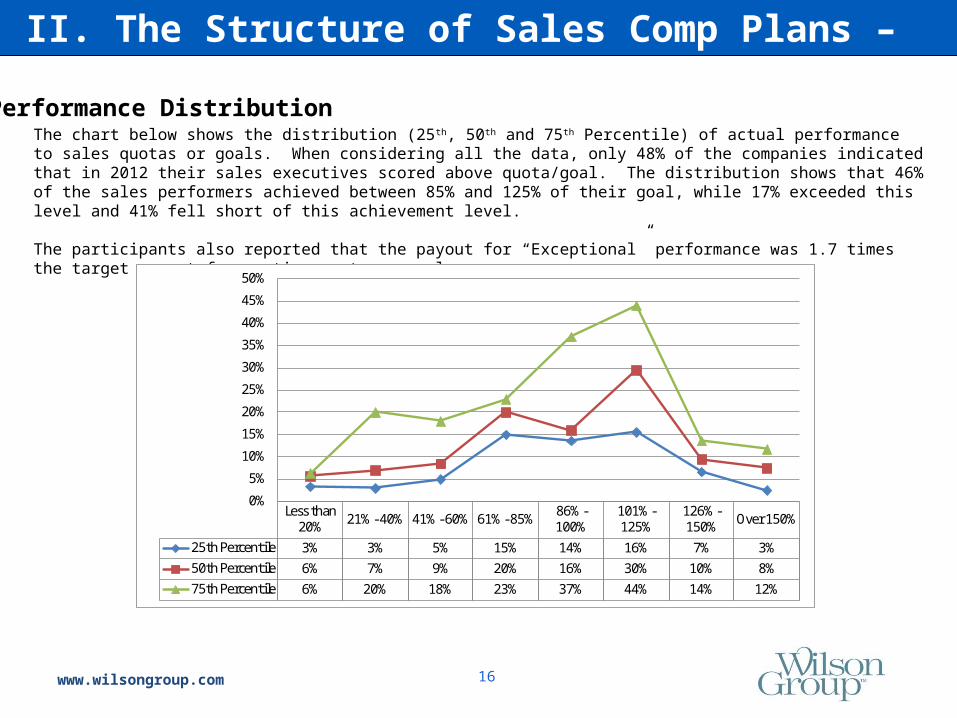
Performance DistributionThe chart below shows the distribution (25th, 50th and 75th Percentile) of actual performance to sales quotas or goals. When considering all the data, only 48% of the companies indicated that in 2012 their sales executives scored above quota/goal. The distribution shows that 46% of the sales performers achieved between 85% and 125% of their goal, while 17% exceeded this level and 41% fell short of this achievement level.
The participants also reported that the payout for “Exceptional” performance was 1.7 times the target payout for meeting quota or goal.
II. The Structure of Sales Comp Plans – Direct Sales
Less than 20% 21% - 40% 41% - 60% 61% - 85% 86% -
100%101% -125%
126% -150% Over 150%
25th Percentile 3% 3% 5% 15% 14% 16% 7% 3%50th Percentile 6% 7% 9% 20% 16% 30% 10% 8%75th Percentile 6% 20% 18% 23% 37% 44% 14% 12%
0%
5%
10%
15%
20%
25%
30%
35%
40%
45%
50%

www.wilsongroup.com 17
Frequency of PayoutsThe sales commission plans for this position are usually paid on a monthly basis, with some paying on a quarterly basis. On further examination of the data, virtually all those that have little to no base salary make their payouts on a monthly basis.
II. The Structure of Sales Comp Plans – Direct Sales
Monthly 58%
Quarterly 33%
Semi-Annual 4%
Annual 4%
When Payouts are MadeWhen people are paid is a more challenging issue than how often. There is greater diversity of opinions on this design element. The table below shows the average responses for when incentive payouts are made. While most companies pay when the product is shipped or the service is delivered, the booking or contract agreement or a combination of these factors is also used by several companies. The combination frequently will pay something at the booking, and the balance when the product is shipped or delivered. Smaller companies tended to use “when collected” to address their concerns with cash flow.
When booked 22%
When shipped/delivered 30%
When invoiced 9%
When collected 17%
Combination 22%

www.wilsongroup.com 18
Performance MeasuresThe primary focus of these positions is clearly on generating sales or revenues for the company. For the Direct Sales, the emphasis tends to be on NEW accounts for many of the participating companies. The following are the performance measures used in these plans. Clearly gross sales is the predominate measure. Between 25% and 32% also use sales from existing accounts or from new accounts, as well as the number of new accounts in their sales incentive plans. This reflects the importance of generating sales from existing customers as well as market share or growth from new customers.
II. The Structure of Sales Comp Plans – Direct Sales

www.wilsongroup.com 19
How commissions are determinedThere are a wide range of practices when it comes to how commissions are determined. Approximately 44% of the participants have commission rates that are tied to the individual’s on-target earnings, where slightly less (41%) use the same rates for all sales professionals. Slightly less than one –third (27%) have commissions by product, and 14% differentiate commission rates by the type of customer – new versus existing.
When performance begins earning incomeApproximately 81% of the participating companies start paying commission on the first dollar of sales. The remaining 19% start paying commission once a threshold level of sales is achieved. For these companies in particular, there is a base salary that is established, and the threshold is intended to “pay for” the base salary.
II. The Structure of Sales Comp Plans – Direct Sales

www.wilsongroup.com 20
Commission accelerators -- PrevalenceMost companies (67%) do provide an accelerator to their commission rates. When accelerators (i.e., an increase in the commission rate) are used, there tends to be 3 or more points of acceleration.
Commission accelerators -- TriggersFor those companies that use accelerators for their commission rates, most increase the rate based on sales performance achievements on a quarterly or annual basis.
II. The Structure of Sales Comp Plans – Direct Sales
www.wilsongroup.com 21
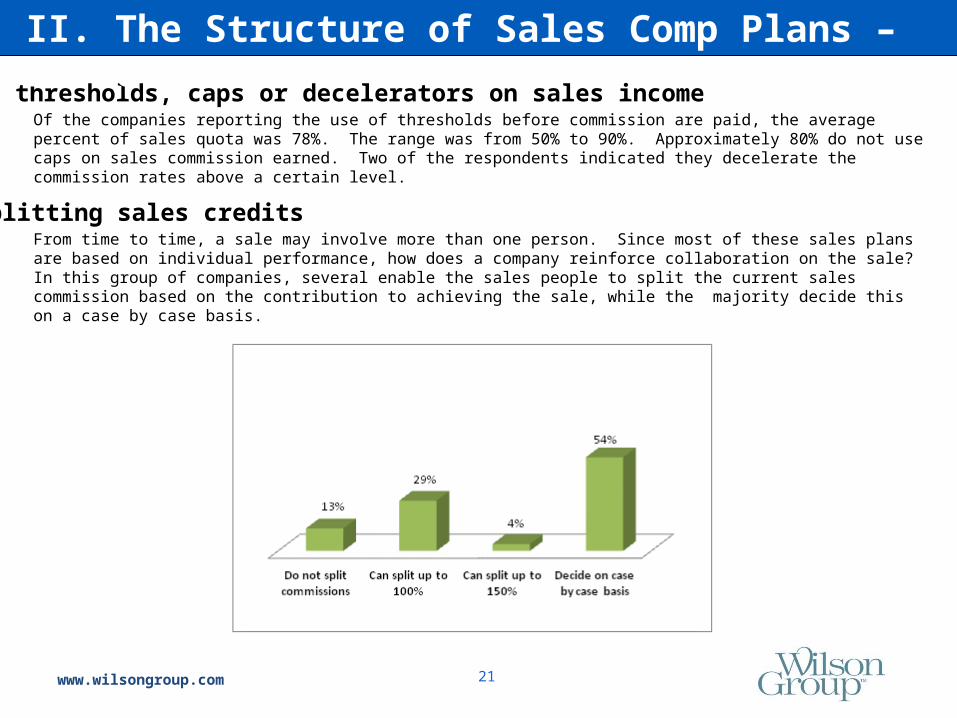
Use of thresholds, caps or decelerators on sales incomeOf the companies reporting the use of thresholds before commission are paid, the average percent of sales quota was 78%. The range was from 50% to 90%. Approximately 80% do not use caps on sales commission earned. Two of the respondents indicated they decelerate the commission rates above a certain level.
Splitting sales creditsFrom time to time, a sale may involve more than one person. Since most of these sales plans are based on individual performance, how does a company reinforce collaboration on the sale? In this group of companies, several enable the sales people to split the current sales commission based on the contribution to achieving the sale, while the majority decide this on a case by case basis.
II. The Structure of Sales Comp Plans – Direct Sales

www.wilsongroup.com 22
Bonus Plans – Frequency of payoutsAs noted earlier in this report, approximately 60% of companies have a bonus plan as part of their sales incentive plan (15% have bonus only and 31% use a combination of commissions and bonuses). Approximately 2/3 rd of this group make bonus payouts on an annual basis and 21% make payouts on a quarterly basis. A few companies make these payouts on a monthly basis.
Bonus Plans – Performance measuresApproximately one quarter of the survey participants make bonus payouts associated with meeting sales quotas and another quarter use bonuses to reward personal performance goals.
II. The Structure of Sales Comp Plans – Direct Sales

www.wilsongroup.com 23
Most important and effective elements of the sales compensation plan“Best Practices” are hard to define particularly in a highly volatile marketplace. So we asked the participants to tell us what they believe are the most important elements of their sales compensation plans, what makes it an effective program. While there was little consensus on the elements, the most important factors seem to be:
(1) No maximum payout or cap to the plan(2) The payout opportunity(3) The simplicity of the plan(4) The overall total compensation levels(5) The use of accelerators to the commission rates
II. The Structure of Sales Comp Plans – Direct Sales

www.wilsongroup.com 24
The following is the position profile on which the respondents based their salesplan information:
Sales Account Manager:
Responsible for generating sales from assigned existing accounts and retaining strong favorable relationships with their customers. Is usually responsible for developing and/or expanding existing accounts within the assigned territory, and ensures that company’s products or services consistently meet customers’ needs. This job is key to the company’s strategies for customer satisfaction and experience. May be responsible for sustaining and renewing client contracts. May require a bachelor's degree and at least 3 to 5 years of experience in the field or in a related account management area. Familiar with a variety of the sales and account management concepts, practices, and procedures. Relies on extensive experience and judgment to plan and accomplish goals. May lead and direct the work of others. Typically reports to a manager of major accounts or a district or regional manager.
II. The Structure of Sales Comp Plans – Acct Mgr

www.wilsongroup.com 25
Median Total CompensationWe asked companies to provide us with the salary and on-target total cash compensation for this position. The data below shows the distribution of the medians of these positions. It shows that compensation mix is 75% for base salaries and 25% for incentive pay.
Type of Sales Compensation Plans UtilizedThe following table shows the type of plans most common for this position. It shows clear differences between companies that have this position. There is a tendency to utilize commission plans, but other types of plans are also prevalent.
II. The Structure of Sales Comp Plans – Acct Mgr
Total Cash Compensation by Percentile Salary
On-Target Total Comp
Salary as % of On-Target Total
CompAverage 85,680$ 134,540$ 63%
25th Percentile 50,000$ 85,375$ 61%50th Percentile 80,000$ 124,350$ 71%75th Percentile 118,000$ 172,650$ 77%90th Percentile 145,000$ 204,500$ 79%
Type of Sales Plan Utilized
Commission Only Bonus Plan Combination Salary only43% 29% 29% 0%
www.wilsongroup.com 26
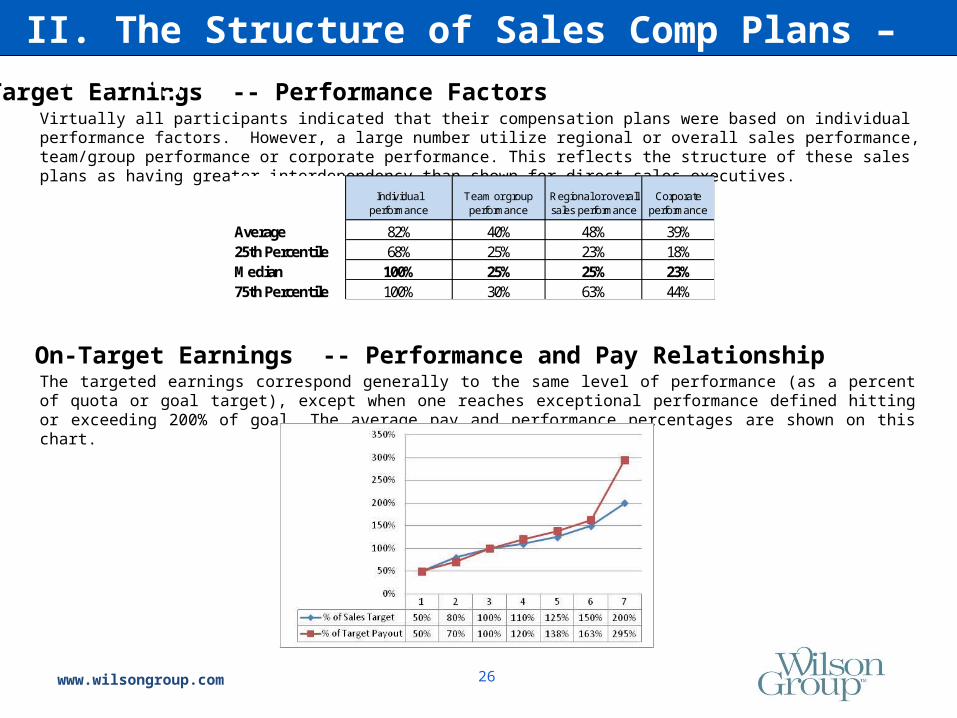
On-Target Earnings -- Performance FactorsVirtually all participants indicated that their compensation plans were based on individual performance factors. However, a large number utilize regional or overall sales performance, team/group performance or corporate performance. This reflects the structure of these sales plans as having greater interdependency than shown for direct sales executives.
On-Target Earnings -- Performance and Pay RelationshipThe targeted earnings correspond generally to the same level of performance (as a percent of quota or goal target), except when one reaches exceptional performance defined hitting or exceeding 200% of goal. The average pay and performance percentages are shown on this chart.
Individual performance
Team or group performance
Regional or overall sales performance
Corporate performance
Average 82% 40% 48% 39%25th Percentile 68% 25% 23% 18%Median 100% 25% 25% 23%75th Percentile 100% 30% 63% 44%
II. The Structure of Sales Comp Plans – Acct Mgr

www.wilsongroup.com 27
Performance DistributionThe chart below shows the distribution (25th, 50th and 75th Percentile) of actual performance to sales quota or goal. When considering all the data, most companies (46%) indicated that their Account Managers achieved between 85% and 125% of their sales goals; and 26% of the companies indicated that in 2012 their Account Managers scored above quota/goal (101% to 150%+). The participants reported that the payouts for “Exceptional” performance were 1.86 times the target payout for meeting the performance goals.
II. The Structure of Sales Comp Plans – Acct Mgr

www.wilsongroup.com 28
Performance MeasuresThe primary focus of these positions is clearly on generating sales or revenues at or above the quota, and addressing personal goals. There is little emphasis among the survey companies that the Account Manager will be profit oriented or differentiating the sales effort between current and new customers.
II. The Structure of Sales Comp Plans – Acct Mgr

www.wilsongroup.com 29
How and when commissions are determinedThe commission rates for Account Managers vary between being based on the product or service (i.e., it is the same rate for all individuals) versus rates that are based on the individual’s performance goals and on-target earnings. Forty-two percent of the respondents indicated they use a fixed rate for commissions where 58% use a rate that is established for the individual.
There are few who use multiple accelerator rates like we saw with the Direct Sales Executive position. Those that responded to this question were evenly split between those that use only one accelerator and those that do not use accelerators at all. Further, most companies start their commission based on the first dollar sale as opposed to setting a threshold before incentive payouts can commence.
The vast majority of companies in the survey do not have caps on commissions for their Account Managers. Only one company uses caps in their survey, and another company will lower the rate of earnings after one has achieved certain performance levels above their goal.
When more than one sales person is involved, most companies decided how to split the commission on a case by case basis. Two companies enable the sales team to divide the 100% of earned commission to members of the selling team based on their level of involvement. Two companies don’t permit splitting of sales commissions.
II. The Structure of Sales Comp Plans – Acct Mgr

www.wilsongroup.com 30
Most important and effective elements of the sales compensation plan“Best Practices” are hard to define particularly in a highly volatile marketplace. So we asked the participants to tell us what they believe are the most important elements of their sales compensation plans - what makes it an effective program. While there was little consensus on the elements, the most important factors seem to be (1) payout opportunity, (2) the simplicity of the plan and (3) and the competitiveness of the overall total compensation levels. The responses are shown below:
II. The Structure of Sales Comp Plans – Acct Mgr
www.wilsongroup.com 31
The following is the position profile on which the respondents based their sales plan information:
Indirect or Channel Sales Manager:
Responsible for generating sales of the company’s products and services that are generated through distributor, broker channels or cooperative partners within identified name distributors, territory or industry. The incumbent does not usually directly generate sales, but is responsible for revenue generation through the management of sales reps and supervisors of another sales organization. Maintains effective communications with sales managers and representatives across the company to ensure proper handling of these indirect sales or account development activities. May participate in presenting product and services to distributors or customers if needed to benefit the sales process or customers’ needs. Usually requires six to nine years of sales experience with particular expertise in distributor sales process. Demonstrates knowledge of the company’s entire product or service lines, and may have in-depth knowledge on a subset of products, services, or industry practices.
II. The Structure of Sales Comp Plans – Channel Mgr

www.wilsongroup.com 32
Median Total CompensationWe asked companies to provide us with the salary and on-target total cash compensation for this position. The data below shows the distribution of the medians of these positions. It shows that compensation mix is approximately 70% for base salaries and 30% for incentive pay.
Type of Sales Compensation Plans UtilizedThe following table shows the type of plans most common for this position. It shows that there are primarily two types of plans utilized for this position – commission only and bonus plans.
Total Cash Compensation by Percentile Salary
On-Target Total Comp
Salary as % of On-Target Total
CompAverage 121,457$ 166,000$ 72%
25th Percentile 105,100$ 147,375$ 70%50th Percentile 120,500$ 161,000$ 71%75th Percentile 133,942$ 177,500$ 76%90th Percentile 146,500$ 199,290$ 77%
Type of Sales Plan Utilized
Commission Only Bonus Plan Combination Salary only56% 33% 0% 11%
II. The Structure of Sales Comp Plans – Channel Mgr

www.wilsongroup.com 33
On-Target Earnings -- Performance FactorsVirtually all participants indicated that their compensation plans were based on individual performance factors. Several companies utilize team/group performance based performance. This reflects that these positions are more similar to Direct Sales than Account Managers.
On-Target Earnings -- Performance and Pay RelationshipThe targeted earnings correspond generally to the same level of performance (as a percent of quota or goal target) below the sales quota or goal. With above target payouts, the payouts increase dramatically higher than the performance targets. The respondents also indicated that at “Exceptional” performance, the payout is 200% of the payout at target level of performance.
Individual performance
Team or group performance
Regional or overall sales
performanceCorporate
performance
Average 75% 75% 0% 0%
25th Percentile 63% 63% 0% 0%
Median 100% 75% 0% 0%
75th Percentile 100% 88% 0% 0%
II. The Structure of Sales Comp Plans – Channel Mgr

www.wilsongroup.com 34
Performance DistributionThe chart below shows the distribution (25th, 50th and 75th Percentile) of actual performance to sales quota or goal. When considering all the data, most companies (45%) indicated that their Channel Managers achieved sale quota/goals, and 18% of the companies indicated that in 2012 their Channel Managers scored above quota/goal.
Less than 20% 21% - 40% 41% - 60% 61% - 85% 86% -
100%101% -125%
126% -150%
Over 150%
25th Percentile 12% 18% 8% 15% 16% 21% 8% 8%50th Percentile 15% 18% 15% 36% 20% 26% 9% 10%75th Percentile 17% 18% 20% 39% 29% 40% 9% 24%
0%
5%
10%
15%
20%
25%
30%
35%
40%
45%
II. The Structure of Sales Comp Plans – Channel Mgr
www.wilsongroup.com 35
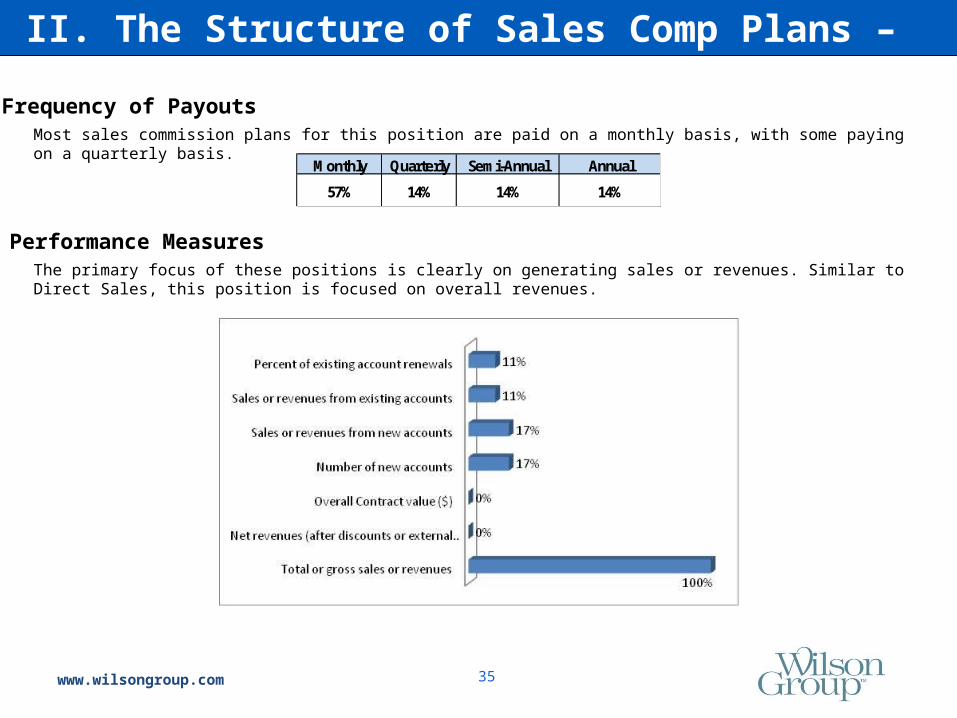
Frequency of PayoutsMost sales commission plans for this position are paid on a monthly basis, with some paying on a quarterly basis.
Performance MeasuresThe primary focus of these positions is clearly on generating sales or revenues. Similar to Direct Sales, this position is focused on overall revenues.
Monthly Quarterly Semi-Annual Annual
57% 14% 14% 14%
II. The Structure of Sales Comp Plans – Channel Mgr

www.wilsongroup.com 36
How and when commissions are determinedThere are a wide range of practices when it comes to how commissions are determined. The commission plans for most Channel Managers do not have accelerators build into their rates. Those that do, accelerate the rate when monthly or annual goals are achieved. The commission rates apply to the first dollars of sales results. Only one company used a threshold before the commission rates would apply. The threshold tended to be around 90% of the quota or sales target.
As in most other sales positions, income caps are not used. Two companies do provide caps given the indirect nature of the sales that result from the Channel Manager; one company reduces or decelerates the commission rates above a defined level. A few companies who have these positions do permit splitting of sales commission (100%) with others. In experience, this splitting are frequently with the direct sales roles when there are overlaps in the territory of the direct sales and channel partners.
Approximately one-third of these positions have a bonus plan associated with their compensation plan. These bonus plans tend to focus on achieving personal goals, or one’s regional/district/area goals or the corporation’s overall performance. One firm uses a bonus to reward goal achievement. Most of these bonuses are paid out quarterly or annually.
II. The Structure of Sales Comp Plans – Channel Mgr

www.wilsongroup.com 37
Most important and effective elements of the sales compensation plan“Best Practices” are hard to define particularly in a highly volatile marketplace. We asked the participants to tell us what they believe are the most important elements of their sales compensation plans - what makes it an effective program. While there was little consensus on the elements, the most important factors seem to be the following:
(1) Overall competitiveness of total compensation(2) There is no maximum payout cap(3) The payout opportunity (4) The simplicity of the plan(5) There is no minimum threshold to earn commission income
II. The Structure of Sales Comp Plans – Channel Mgr

www.wilsongroup.com 38
The following is the position profile on which the respondents based their salesplan information:
Inside Sales Representative:
Responsible for selling the company’s products and services via telephone, email and web-based communication to customers in assigned territory, industry or accounts. This position must close the sale on the products or services. The incumbent may generate prospective customers through cold calling or referrals from marketing and advertising, or from handling customers of assigned Field Sales Representatives. Requires a strong knowledge of the products and services, and the sales tracking and order processing systems. This position may operate as part of a sales team and support direct field sales staff or operate independently. May also be responsible for renewal of contracts and agreements. It may carry a sales quota or goals related to business for new and/or existing customers. The incumbent typically has between 2 -4 years of sales experience.
II. The Structure of Sales Comp Plans — Inside Sales

www.wilsongroup.com 39
Median Total CompensationWe asked companies to provide us with the salary and on-target total cash compensation for this position. The data below shows the distribution of the medians. It shows that compensation mix is approximately 70% for base salaries and 30% for incentive pay.
Type of Sales Compensation Plans UtilizedThe following table shows the type of plans most common for this position. It shows that there are primarily two types of plans utilized for this position – commission only and bonus plans.
Total Cash Compensation by Percentile Salary
On-Target Total Comp
Salary as % of On-Target Total
CompAverage 58,091$ 82,236$ 69%
25th Percentile 49,500$ 67,500$ 63%50th Percentile 62,000$ 74,000$ 70%75th Percentile 70,000$ 95,800$ 75%90th Percentile 70,000$ 110,000$ 83%
Type of Sales Plan Utilized
Commission Only Bonus Plan Combination Salary only63% 25% 13% 0%
II. The Structure of Sales Comp Plans — Inside Sales

www.wilsongroup.com 40
On-Target Earnings -- Performance FactorsVirtually all participants indicated that their compensation plans were based on individual performance factors. Several companies utilize team/group performance based incentives. This reflects that these positions are more similar to Direct Sales than Account Managers.
On-Target Earnings -- Performance and Pay RelationshipThe targeted earnings correspond generally to the same level of performance (as a percent of quota or goal target) below the sales quota or goal. With above target payouts, the payouts increase dramatically higher than the performance targets. The respondents also indicated that at “Exceptional” performance, the payout is 185% of the payout at target level of performance.
Individual performance
Team or group performance
Regional or overall sales
performanceCorporate
performance
Average 75% 75% 0% 0%
25th Percentile 63% 63% 0% 0%
Median 100% 75% 0% 0%
75th Percentile 100% 88% 0% 0%
II. The Structure of Sales Comp Plans — Inside Sales

www.wilsongroup.com 41
Performance DistributionThe chart below shows the distribution (median or 50 th Percentile) of actual performance to sales quota or goal. When considering all the data, most companies (29%) indicated that their Inside Sales Reps achieved sale quota/goals. There was insufficient data to calculate the percentile rankings.
II. The Structure of Sales Comp Plans — Inside Sales
www.wilsongroup.com 42
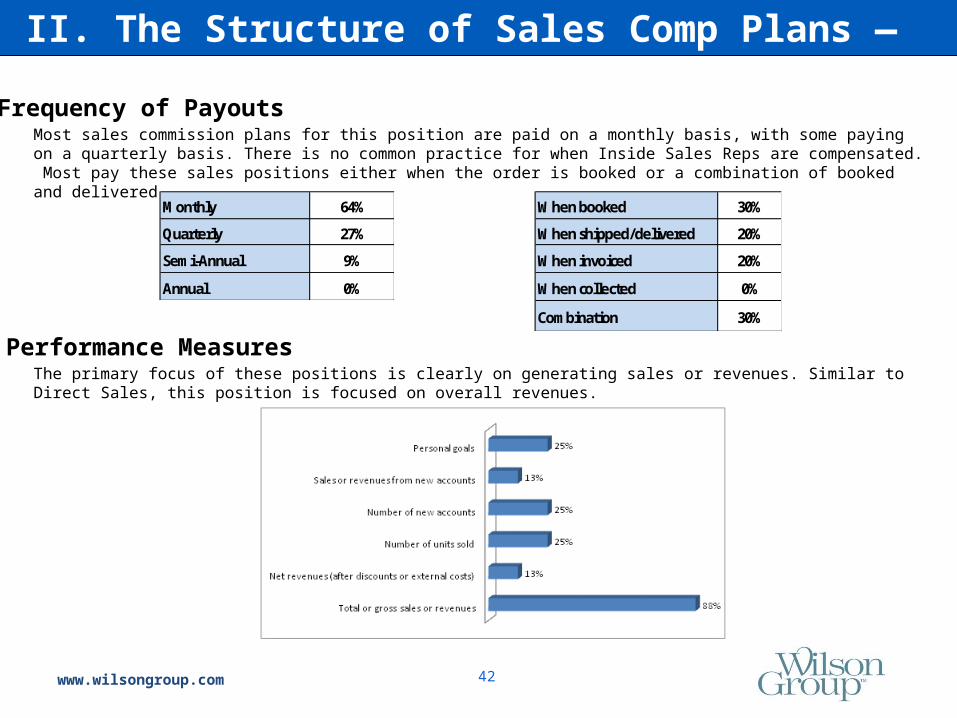
Frequency of PayoutsMost sales commission plans for this position are paid on a monthly basis, with some paying on a quarterly basis. There is no common practice for when Inside Sales Reps are compensated. Most pay these sales positions either when the order is booked or a combination of booked and delivered.
Performance MeasuresThe primary focus of these positions is clearly on generating sales or revenues. Similar to Direct Sales, this position is focused on overall revenues.
Monthly 64%
Quarterly 27%
Semi-Annual 9%
Annual 0%
When booked 30%
When shipped/delivered 20%
When invoiced 20%
When collected 0%
Combination 30%
II. The Structure of Sales Comp Plans — Inside Sales
www.wilsongroup.com 43
How and when commissions are determinedThe sales compensation plans for Inside Sales Representatives are fairly consistent with other sales compensation plans in these participating companies. Approximately 2/3rd use a fixed commission structure and 1/3rd use a structure based on individual quotas and on-target earnings. These commission rates do not tend to have accelerators associated with them. If they do exist, they are linked to performance against one’s quarterly or annual goal. Seventy percent of the plan provide commission income from the first dollar; 30% have a threshold. The threshold averages at 75% of quota, with a range from 50% to 90%. And, like other sales plans, these compensation plans do not tend to have income earning caps.
When sales people share in the achievement of sales, most companies will decide on the commission split on a case by case basis. If there are splits, the amount is limited to the 100% of the available commission. These positions do not tend to be eligible for bonus plans.
II. The Structure of Sales Comp Plans — Inside Sales
www.wilsongroup.com 44
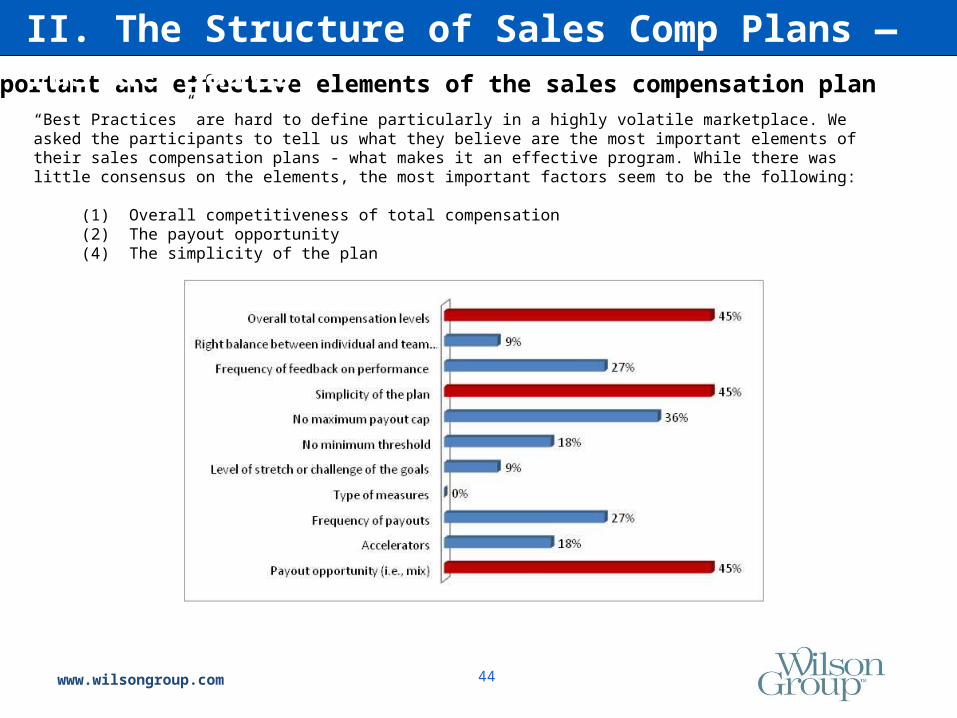
Most important and effective elements of the sales compensation plan“Best Practices” are hard to define particularly in a highly volatile marketplace. We asked the participants to tell us what they believe are the most important elements of their sales compensation plans - what makes it an effective program. While there was little consensus on the elements, the most important factors seem to be the following:
(1) Overall competitiveness of total compensation(2) The payout opportunity (4) The simplicity of the plan
II. The Structure of Sales Comp Plans — Inside Sales

www.wilsongroup.com 45
The following is the position profile on which the respondents based their salesplan information:
First Level Sales Manager:
Responsible for the sales generated to customers in a defined geographic, product or industry segment. This position supervises Direct Sales Representatives and/or Account Managers, but does not manage other sales managers. This is the first level of direct supervision over the field sales force of the company. This work includes coaching and developing staff, handling critical customers, and overseeing the company’s sales process. The incumbent may also have responsibility for generating own sales independent of staff being supervised, and thereby may carry own sales quota. The incumbent typically has 6 – 9 years of sales experience. In an organization with a broad range of levels, please utilize the positions considered as “mid-level” within the sales organization.
II. The Structure of Sales Comp Plans — Sales Manager

www.wilsongroup.com 46
Median Total CompensationWe asked companies to provide us with the salary and on-target total cash compensation for this position. The data below shows the distribution of the medians. It shows that compensation mix is approximately 60% for base salaries and 40% for incentive pay.
Total Cash Compensation by Percentile Salary
On-Target Total Comp
Salary as % of On-Target Total
CompAverage 128,455$ 209,088$ 60%
25th Percentile 124,798$ 173,750$ 53%50th Percentile 132,003$ 202,000$ 60%75th Percentile 143,225$ 275,000$ 68%90th Percentile 149,600$ 279,500$ 74%
Type of Sales Compensation Plans UtilizedThe following table shows the type of plans most common for this position. It shows that there are primarily two types of plans utilized for this position – commission only and a combination of combination and bonus plans.
Type of Sales Plan Utilized
Commission Only Bonus Plan Combination Salary only
42% 17% 42% 0%
II. The Structure of Sales Comp Plans — Sales Manager
www.wilsongroup.com 47
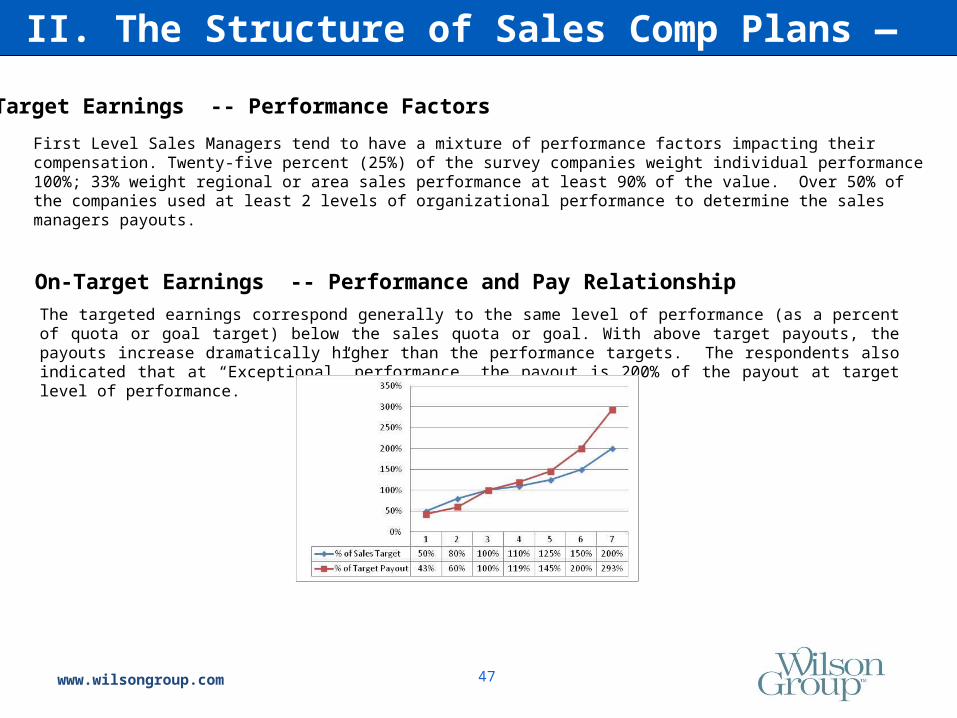
On-Target Earnings -- Performance Factors
On-Target Earnings -- Performance and Pay RelationshipThe targeted earnings correspond generally to the same level of performance (as a percent of quota or goal target) below the sales quota or goal. With above target payouts, the payouts increase dramatically higher than the performance targets. The respondents also indicated that at “Exceptional” performance, the payout is 200% of the payout at target level of performance.
First Level Sales Managers tend to have a mixture of performance factors impacting their compensation. Twenty-five percent (25%) of the survey companies weight individual performance 100%; 33% weight regional or area sales performance at least 90% of the value. Over 50% of the companies used at least 2 levels of organizational performance to determine the sales managers payouts.
II. The Structure of Sales Comp Plans — Sales Manager

www.wilsongroup.com 48
Performance DistributionThe chart below shows the distribution (median or 50 th percentile) of actual performance to sales quota or goal. There was insufficient data to calculate the percentile rankings.
60%
37%
50%
42%
20%
41% - 60% 61% - 85% 86% - 100% 101% - 125% 126% - 150%
II. The Structure of Sales Comp Plans — Sales Manager
www.wilsongroup.com 49
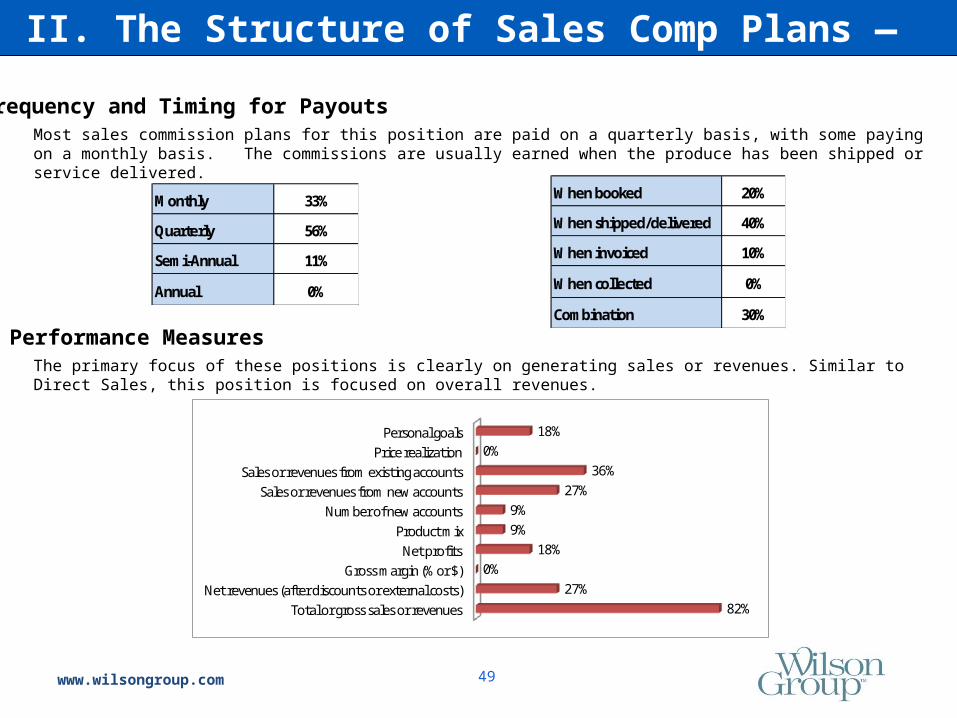
Frequency and Timing for PayoutsMost sales commission plans for this position are paid on a quarterly basis, with some paying on a monthly basis. The commissions are usually earned when the produce has been shipped or service delivered.
Performance MeasuresThe primary focus of these positions is clearly on generating sales or revenues. Similar to Direct Sales, this position is focused on overall revenues.
Monthly 33%
Quarterly 56%
Semi-Annual 11%
Annual 0%
When booked 20%
When shipped/delivered 40%
When invoiced 10%
When collected 0%
Combination 30%
Total or gross sales or revenuesNet revenues (after discounts or external costs)
Gross margin (% or $)Net profits
Product mixNumber of new accounts
Sales or revenues from new accountsSales or revenues from existing accounts
Price realizationPersonal goals
82%27%
0%18%
9%9%
27%36%
0%18%
II. The Structure of Sales Comp Plans — Sales Manager

www.wilsongroup.com 50
How and when commissions are determinedSales managers tend to be compensated similar to their sales staff, with a few important exceptions. Those that carry quotas or are focused on direct sales tend to have a high commission basis for their compensation plans. Commissions are as likely to be fixed as they are designed to be individually quota and on-target income based. These commission plans are similar to direct sales and have multiple, two or three, acceleration points. The triggers for these accelerators are the level of performance to goal on a quarterly or annual basis. Further, the commission payments begin first dollar sales. If there is a threshold, then it tends to be around 80% of goal (the range is from 50% to 90% like other sales positions).
Most companies do not use income caps for their sales managers or other sales staff. Further, they decide on commission splits on a case by case basis.
A few companies indicated that they provide bonus opportunity to their first line sales managers. These bonuses are paid on a monthly or quarterly basis and are usually based on personal goal achievement or the performance of the overall region or area.
II. The Structure of Sales Comp Plans — Sales Manager
www.wilsongroup.com 51
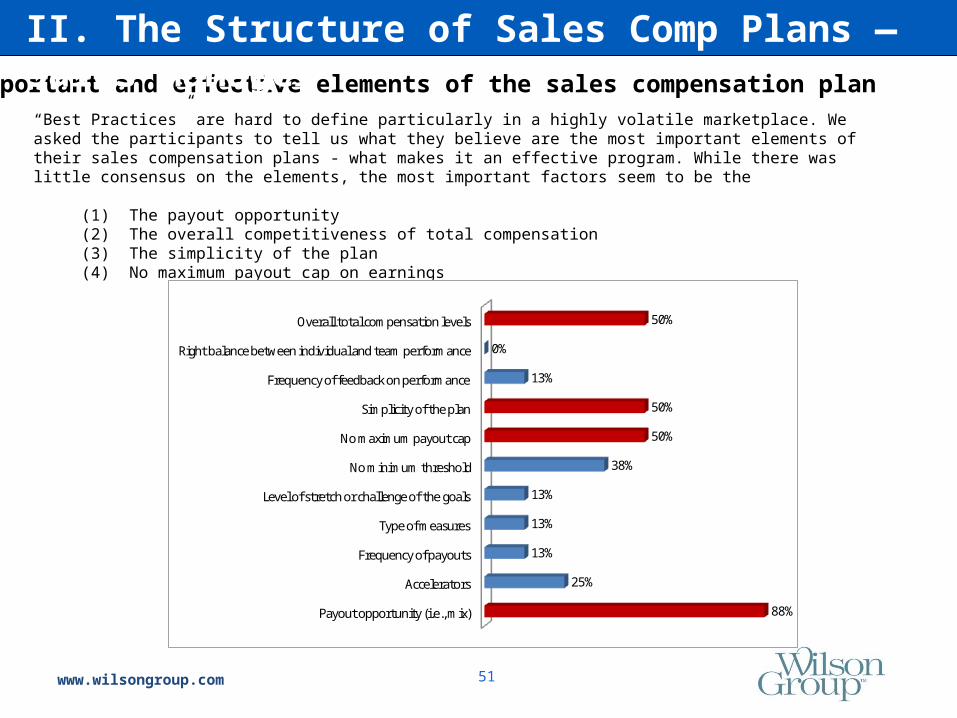
Most important and effective elements of the sales compensation plan“Best Practices” are hard to define particularly in a highly volatile marketplace. We asked the participants to tell us what they believe are the most important elements of their sales compensation plans - what makes it an effective program. While there was little consensus on the elements, the most important factors seem to be the
(1) The payout opportunity (2) The overall competitiveness of total compensation(3) The simplicity of the plan(4) No maximum payout cap on earnings
Payout opportunity (i.e., mix)
Accelerators
Frequency of payouts
Type of measures
Level of stretch or challenge of the goals
No minimum threshold
No maximum payout cap
Simplicity of the plan
Frequency of feedback on performance
Right balance between individual and team performance
Overall total compensation levels
88%
25%
13%
13%
13%
38%
50%
50%
13%
0%
50%
II. The Structure of Sales Comp Plans — Sales Manager

www.wilsongroup.com 52
PART III
Comparison of Sales Plan by Market Segment
www.wilsongroup.com 53
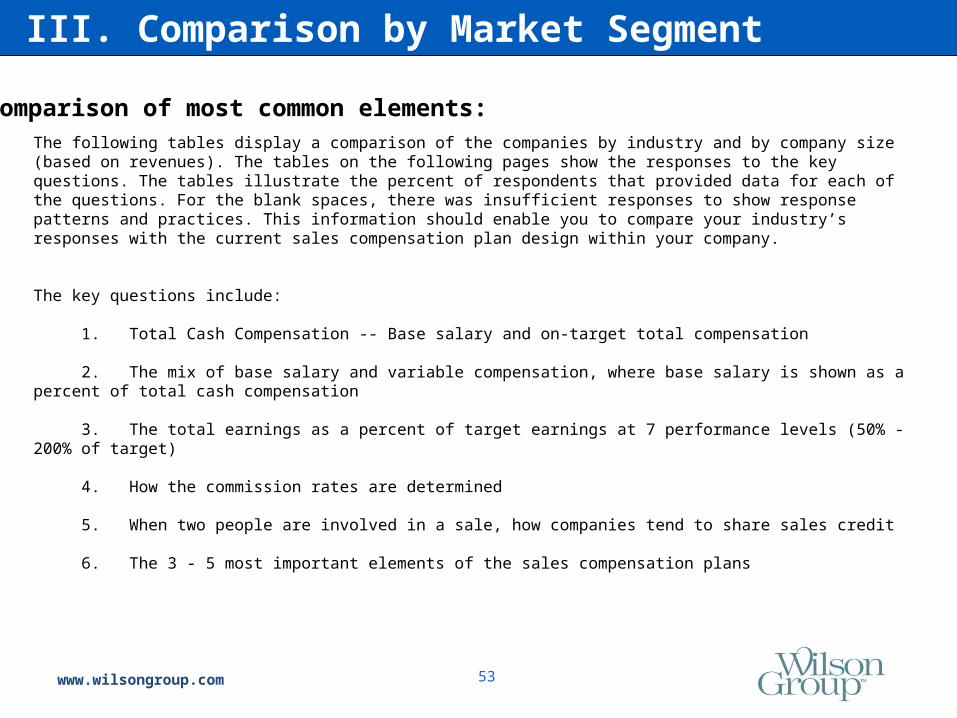
Comparison of most common elements:The following tables display a comparison of the companies by industry and by company size (based on revenues). The tables on the following pages show the responses to the key questions. The tables illustrate the percent of respondents that provided data for each of the questions. For the blank spaces, there was insufficient responses to show response patterns and practices. This information should enable you to compare your industry’s responses with the current sales compensation plan design within your company.
The key questions include:
1. Total Cash Compensation -- Base salary and on-target total compensation
2. The mix of base salary and variable compensation, where base salary is shown as a percent of total cash compensation
3. The total earnings as a percent of target earnings at 7 performance levels (50% - 200% of target)
4. How the commission rates are determined
5. When two people are involved in a sale, how companies tend to share sales credit
6. The 3 - 5 most important elements of the sales compensation plans
III. Comparison by Market Segment

www.wilsongroup.com 54
III. Comparison by Market Segment – By Industry
Industry: TechnologyConsumer Ptds /
RetailManufacturing
Professional Services /
Communications
Description:Number of Cos 6 5 5 5Average Revenue $724.5M $918.2M $313.4M $188.7MNumber of Ees 2415 3166 1469 417
2013 Growth Projections: 12% or greater 50% 40% 0% 20%8% - 11% 17% 20% 40% 20%4% - 7% 17% 0% 60% 20%0% - 3% 17% 40% 0% 20%Decline 0% 0% 0% 20%
Staffing for Sales Org:Increasing number 50% 60% 20% 80%No change 33% 40% 80% 0%Decreasing number 17% 0% 0% 20%
Merit Increases to Sales:Yes, annually 83% 80% 100% 0%Yes, annually but less 0% 0% 0% 0%No, periodically only 0% 20% 0% 20%No, only as needed 17% 0% 0% 40%Does not apply 0% 0% 0% 40%

www.wilsongroup.com 55
III. Comparison by Market Segment – By Industry
Industry: TechnologyConsumer Ptds /
RetailManufacturing
Professional Services /
Communications
Direct Sales Representative
Average Compensation:Median Salary 84,800$ 61,300$ 101,400$ 88,000$ Median Total Cash Comp 156,333$ 109,700$ 125,750$ 141,250$
Mix of pay to On-target earnings:% for base salary 55% 66% 67% 39%
% for incentive pay 42% 30% 30% 56%% for other income 3% 4% 3% 5%
Percent of Target Payout to Performance:50% of quota/goal 46% 50%80% of quota/goal 73% 72%
100% of quota/goal 100% 100%110% of quota/goal 129% 200%125% of quota/goal 156% 215%150% of quota/goal 205% 181%200% of quota/goal 295% 290%
Payout for Exceptional as multiple of target 1.875 1.570 1.670
Frequency of Commission Payouts:Monthly 50% 60% 75% 60%
Quarterly 50% 40% 25% 40%Semi-Annual
AnnualDoes not apply
At what stage are commissions paid:When booked 33% 20% 25%
When shipped/delivered 17% 80% 50%When invoiced 40%
When collected 33% 40%Combination 17% 25% 20%

www.wilsongroup.com 56
III. Comparison by Market Segment – By Industry
Industry: TechnologyConsumer Ptds /
RetailManufacturing
Professional Services /
Communications
Direct Sales Representative
Performance measures:Total or gross sales or revenues 60% 60% 100% 60%
Net revenues 20% 40% 40%Gross margin 20% 20%
Net profits 20%Product mix 20% 20%
Overall contract value 20% 20%Number of new accounts 40% 20% 40% 20%
Sales from new customers 40% 40% 40%Sales from existing customers 20% 40% 40%
How commission payouts are determined:Fixed percent, same for all sales 17% 40% 20%
Individual commission rate 67% 40%Different commission rate by product 17% 40%
Different commission rate by customer type 40%Does not apply 20% 20%
Use of accelerators in comm rates:Yes, one accelerator point 17% 20% 20%
Yes, two accelerator points 33% 20% 20%Yes, three or more accelerator points 33% 40% 33% 20%
No, accelerators are not used 17% 20% 67% 40%

www.wilsongroup.com 57
III. Comparison by Market Segment – By IndustryIndustry: Technology
Consumer Ptds / Retail
ManufacturingProfessional
Services / Communications
Direct Sales Representative
Use of income caps or decelerators:Yes, we use an income cap 17% 40% 33%
Yes, we decelerate rate above X level 17% 20%We decide based on circumstances
No, we do not have caps or limits 67% 60% 67% 80%
Splitting sales credits:We do not split sales commissions 20% 20% 20%
People can split up to 100% 40% 20% 67% 20%People can split up to 150% 20%
We decide on case-by-case basis 40% 60% 33% 40%
Frequency of Bonus Plan PayoutsMonthly 17% 20%
Quarterly 50% 40%Semi-annual
Annual 20% 67% 60%Does not apply 40% 20% 33% 40%
Most effective elements of your sales plan:Payout opportunity (i.e., mix) 83% 40% 40%
Accelerators 33% 60% 25% 20%Frequency of payouts 40% 25%
Type of measures 25% 20%Level of stretch or challenge of goals 17% 25% 20%
No minimum threshold 17% 40% 50% 20%No maximum payout cap 67% 60% 50% 60%
Simplicity of the plan 50% 20% 75% 60%Frequency of performance feedback 17% 20% 20%
Right balance between individual and team 17% 20% 40%Overall total compensation levels 33% 75% 60%

www.wilsongroup.com 58
III. Comparison by Market Segment – By Industry
IndustryConsumer Ptds /
RetailTechnology
Consumer Ptds / Retail
Technology
Account Manager Inside Sales Rep District Sales Manager District Sales Manager
Average Compensation:Median Salary 75,624$ 61,200$ 106,677$ 143,521$ Median Total Cash Comp 106,080$ 88,480$ 138,333$ 248,087$
Mix of pay to On-target earnings:% for base salary 64% 73% 69% 58%
% for incentive pay 24% 27% 31% 42%% for other income 0% 0% 0% 0%
Percent of Target Payout to Performance:50% of quota/goal 50% 36% 37%80% of quota/goal 80% 73% 63%
100% of quota/goal 100% 100% 100%110% of quota/goal 207% 121% 125%125% of quota/goal 173% 144% 150%150% of quota/goal 185% 192% 205%200% of quota/goal 210% 271% 295%
Payout for Exceptional as multiple of target 1.98 1.75 1.70
Frequency of Commission Payouts:Monthly 40% 25% 40%
Quarterly 40% 75% 60%Semi-Annual
AnnualDoes not apply 20%
At what stage are commissions paid:When booked 25% 50% 50% 40%
When shipped/delivered 75% 25% 25% 20%When invoiced
When collectedCombination 25% 25% 40%
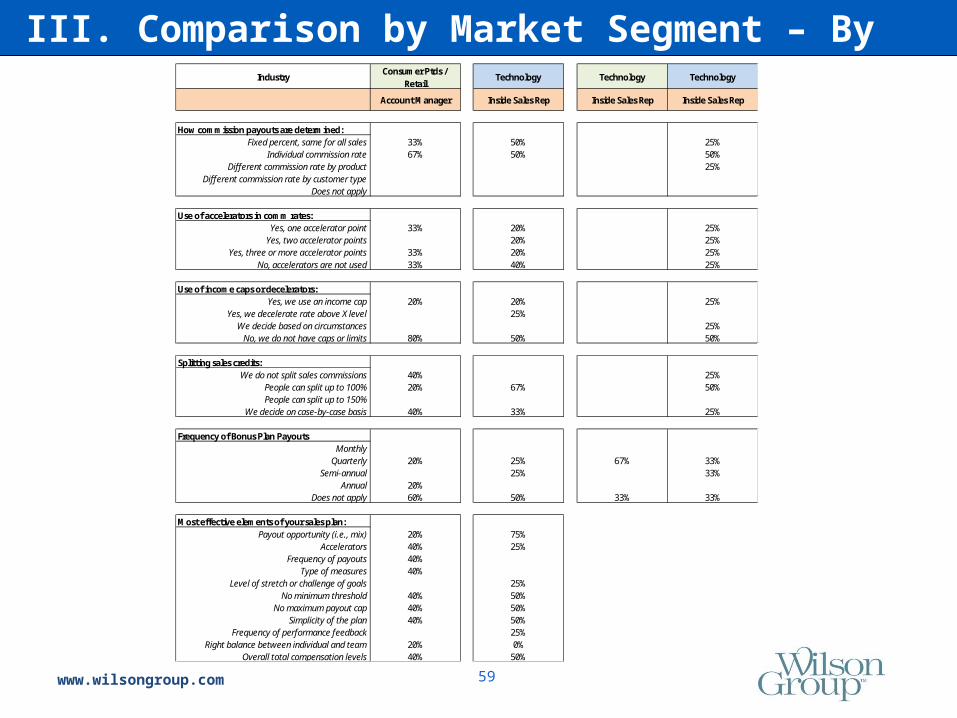
www.wilsongroup.com 59
III. Comparison by Market Segment – By IndustryIndustry
Consumer Ptds / Retail
Technology Technology Technology
Account Manager Inside Sales Rep Inside Sales Rep Inside Sales Rep
How commission payouts are determined:Fixed percent, same for all sales 33% 50% 25%
Individual commission rate 67% 50% 50%Different commission rate by product 25%
Different commission rate by customer typeDoes not apply
Use of accelerators in comm rates:Yes, one accelerator point 33% 20% 25%
Yes, two accelerator points 20% 25%Yes, three or more accelerator points 33% 20% 25%
No, accelerators are not used 33% 40% 25%
Use of income caps or decelerators:Yes, we use an income cap 20% 20% 25%
Yes, we decelerate rate above X level 25%We decide based on circumstances 25%
No, we do not have caps or limits 80% 50% 50%
Splitting sales credits:We do not split sales commissions 40% 25%
People can split up to 100% 20% 67% 50%People can split up to 150%
We decide on case-by-case basis 40% 33% 25%
Frequency of Bonus Plan PayoutsMonthly
Quarterly 20% 25% 67% 33%Semi-annual 25% 33%
Annual 20%Does not apply 60% 50% 33% 33%
Most effective elements of your sales plan:Payout opportunity (i.e., mix) 20% 75%
Accelerators 40% 25%Frequency of payouts 40%
Type of measures 40%Level of stretch or challenge of goals 25%
No minimum threshold 40% 50%No maximum payout cap 40% 50%
Simplicity of the plan 40% 50%Frequency of performance feedback 25%
Right balance between individual and team 20% 0%Overall total compensation levels 40% 50%
www.wilsongroup.com 60
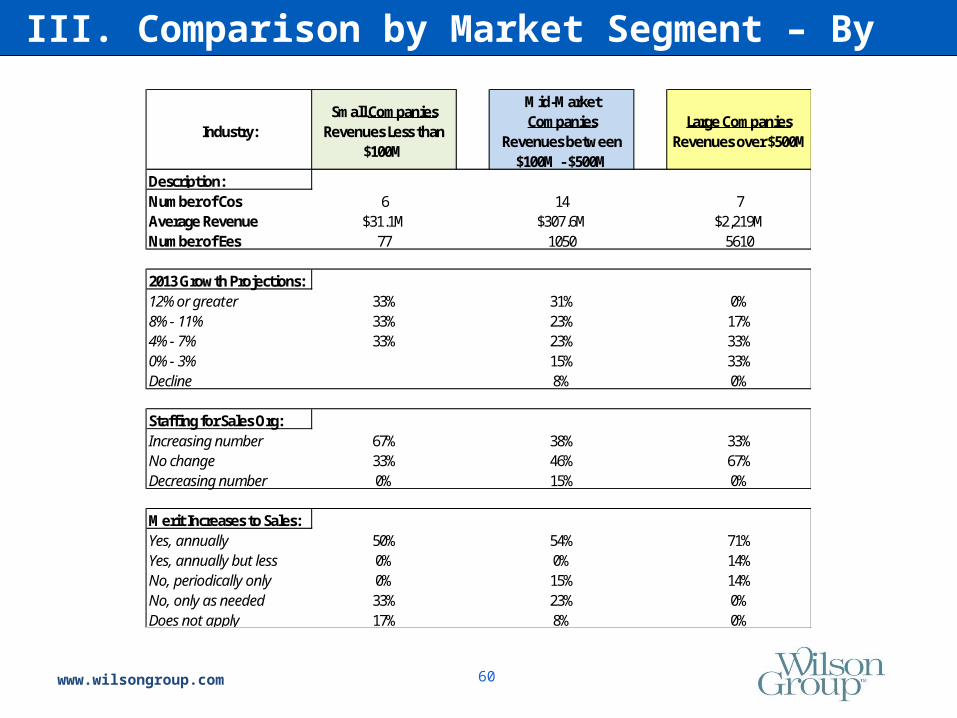
III. Comparison by Market Segment – By Size
Industry:Small Companies
Revenues Less than $100M
Mid-Market Companies
Revenues between $100M - $500M
Large Companies Revenues over $500M
Description:Number of Cos 6 14 7Average Revenue $31.1M $307.6M $2,219MNumber of Ees 77 1050 5610
2013 Growth Projections: 12% or greater 33% 31% 0%8% - 11% 33% 23% 17%4% - 7% 33% 23% 33%0% - 3% 15% 33%Decline 8% 0%
Staffing for Sales Org:Increasing number 67% 38% 33%No change 33% 46% 67%Decreasing number 0% 15% 0%
Merit Increases to Sales:Yes, annually 50% 54% 71%Yes, annually but less 0% 0% 14%No, periodically only 0% 15% 14%No, only as needed 33% 23% 0%Does not apply 17% 8% 0%
www.wilsongroup.com 61
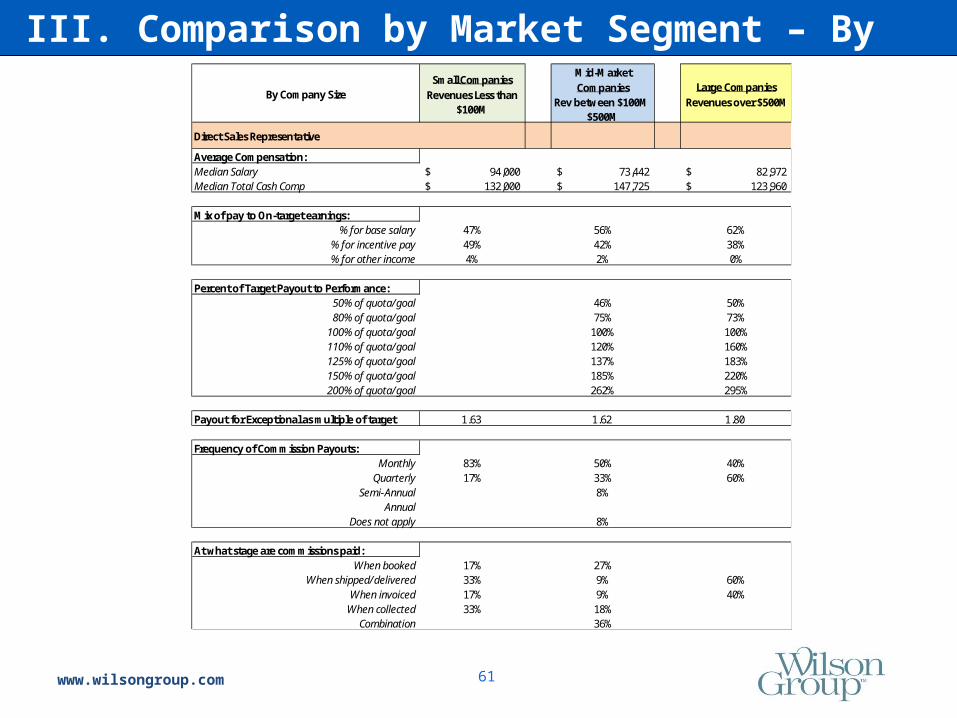
III. Comparison by Market Segment – By SizeBy Company Size
Small CompaniesRevenues Less than
$100M
Mid-Market Companies
Rev between $100M - $500M
Large Companies Revenues over $500M
Direct Sales Representative
Average Compensation:Median Salary 94,000$ 73,442$ 82,972$ Median Total Cash Comp 132,000$ 147,725$ 123,960$
Mix of pay to On-target earnings:% for base salary 47% 56% 62%
% for incentive pay 49% 42% 38%% for other income 4% 2% 0%
Percent of Target Payout to Performance:50% of quota/goal 46% 50%80% of quota/goal 75% 73%
100% of quota/goal 100% 100%110% of quota/goal 120% 160%125% of quota/goal 137% 183%150% of quota/goal 185% 220%200% of quota/goal 262% 295%
Payout for Exceptional as multiple of target 1.63 1.62 1.80
Frequency of Commission Payouts:Monthly 83% 50% 40%
Quarterly 17% 33% 60%Semi-Annual 8%
AnnualDoes not apply 8%
At what stage are commissions paid:When booked 17% 27%
When shipped/delivered 33% 9% 60%When invoiced 17% 9% 40%
When collected 33% 18%Combination 36%

www.wilsongroup.com 62
III. Comparison by Market Segment – By Size
By Company SizeSmall Companies
Revenues Less than $100M
Mid-Market Companies
Rev between $100M - $500M
Large Companies Revenues over
$500M
Direct Sales Representative
Performance measures:Total or gross sales or revenues 67% 73% 60%
Net revenues 17% 18% 60%Gross margin 0% 9% 20%
Net profits 17% 0%Product mix 0% 9% 20%
Overall contract value 0% 18%Number of new accounts 17% 36% 20%
Sales from new customers 50% 18% 20%Sales from existing customers 50% 18%
How commission payouts are determined:Fixed percent, same for all sales 80% 36% 20%
Individual commission rate 36% 60%Different commission rate by product 36% 20%
Different commission rate by customer type 20% 18%Does not apply 9%
Use of accelerators in comm rates:Yes, one accelerator point 18% 20%
Yes, two accelerator points 33% 9% 20%Yes, three or more accelerator points 17% 45% 20%
No, accelerators are not used 50% 27% 40%

www.wilsongroup.com 63
III. Comparison by Market Segment – By SizeBy Company Size
Small CompaniesRevenues Less than
$100M
Mid-Market Companies
Rev between $100M - $500M
Large Companies Revenues over $500M
Direct Sales Representative
Use of income caps or decelerators:Yes, we use an income cap 18% 40%
Yes, we decelerate rate above X level 20%We decide based on circumstances 9%
No, we do not have caps or limits 100% 73% 40%
Splitting sales credits:We do not split sales commissions 18% 20%
People can split up to 100% 33% 27% 20%People can split up to 150% 18%
We decide on case-by-case basis 67% 36% 60%
Frequency of Bonus Plan PayoutsMonthly 20% 8% 17%
Quarterly 20% 25% 17%Semi-annual
Annual 40% 42% 17%Does not apply 20% 25% 50%
Most effective elements of your sales plan:Payout opportunity (i.e., mix) 33% 50% 67%
Accelerators 17% 33% 33%Frequency of payouts 17% 33%
Type of measures 25%Level of stretch or challenge of goals 17% 33%
No minimum threshold 50% 17% 17%No maximum payout cap 67% 67% 17%
Simplicity of the plan 67% 50% 33%Frequency of performance feedback 25% 33%
Right balance between individual and team 17% 25% 17%Overall total compensation levels 33% 67% 0%

www.wilsongroup.com 64
III. Comparison by Market Segment – By Size
By Company SizeMid-Market Companies
Rev's $100M - $500MMid-Market Companies
Rev's $100M - $500M
Sales Position Inside Sales Rep District Sales Manager
Average Compensation:Median Salary 63,583$ 129,257$ Median Total Cash Comp 95,000$ 212,256$
Mix of pay to On-target earnings:% for base salary 72% 60%
% for incentive pay 28% 40%% for other income 0% 0%
Percent of Target Payout to Performance:50% of quota/goal 48% 46%80% of quota/goal 78% 77%
100% of quota/goal 100% 100%110% of quota/goal 120% 124%125% of quota/goal 142% 148%150% of quota/goal 192% 205%200% of quota/goal 246% 262%
Payout for Exceptional as multiple of target 1.84 1.78
Frequency of Commission Payouts:Monthly 33% 17%
Quarterly 33% 50%Semi-Annual 17% 33%
AnnualDoes not apply
At what stage are commissions paid:When booked 40% 40%
When shipped/delivered 20%When invoiced
When collectedCombination 60% 40%

www.wilsongroup.com 65
III. Comparison by Market Segment – By SizeBy Company Size
Mid-Market CompaniesRev's $100M - $500M
Mid-Market CompaniesRev's $100M - $500M
Sales Position Inside Sales Rep District Sales Manager
How commission payouts are determined:Fixed percent, same for all sales 60% 18%
Individual commission rate 40% 27%Different commission rate by product 9%
Different commission rate by customer typeDoes not apply 9%
Use of accelerators in comm rates:Yes, one accelerator point 17% 20%
Yes, two accelerator points 33% 20%Yes, three or more accelerator points 17% 40%
No, accelerators are not used 50% 20%
Use of income caps or decelerators:Yes, we use an income cap 40% 40%
Yes, we decelerate rate above X levelWe decide based on circumstances
No, we do not have caps or limits 60% 60%
Splitting sales credits:We do not split sales commissions 20%
People can split up to 100% 25% 20%People can split up to 150%
We decide on case-by-case basis 75% 60%
Frequency of Bonus Plan PayoutsMonthly
Quarterly 20%Semi-annual 40%
AnnualDoes not apply 40%
Most effective elements of your sales plan:Payout opportunity (i.e., mix) 33% 60%
Accelerators 8% 20%Frequency of payouts 8%
Type of measures 40%Level of stretch or challenge of goals
No minimum threshold 17% 40%No maximum payout cap 25% 40%
Simplicity of the plan 25% 20%Frequency of performance feedback
Right balance between individual and teamOverall total compensation levels 33% 60%
www.wilsongroup.com 66
PART IV
Assessment of the Effectiveness of These Plans
www.wilsongroup.com 67
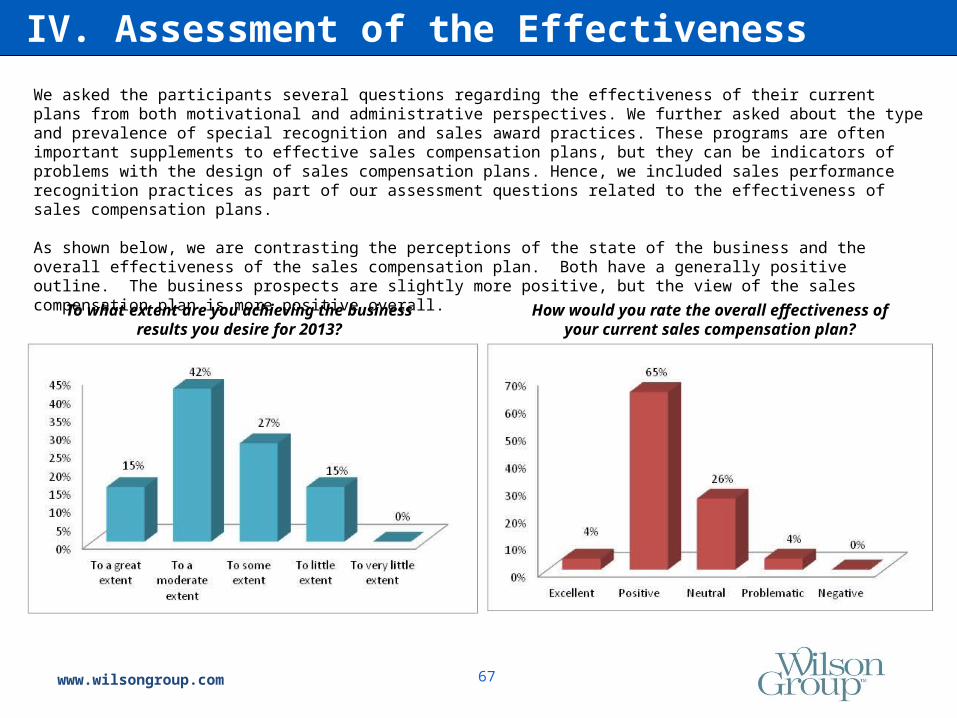
We asked the participants several questions regarding the effectiveness of their current plans from both motivational and administrative perspectives. We further asked about the type and prevalence of special recognition and sales award practices. These programs are often important supplements to effective sales compensation plans, but they can be indicators of problems with the design of sales compensation plans. Hence, we included sales performance recognition practices as part of our assessment questions related to the effectiveness of sales compensation plans.
As shown below, we are contrasting the perceptions of the state of the business and the overall effectiveness of the sales compensation plan. Both have a generally positive outline. The business prospects are slightly more positive, but the view of the sales compensation plan is more positive overall.
IV. Assessment of the Effectiveness
To what extent are you achieving the business results you desire for 2013?
How would you rate the overall effectiveness of your current sales compensation plan?
www.wilsongroup.com 68
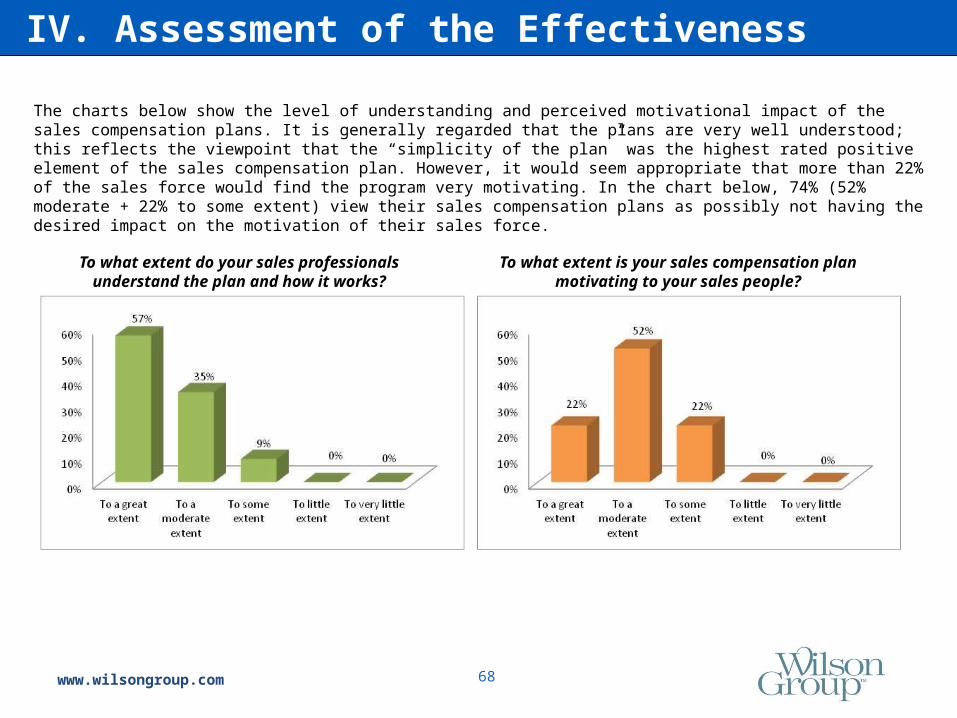
The charts below show the level of understanding and perceived motivational impact of the sales compensation plans. It is generally regarded that the plans are very well understood; this reflects the viewpoint that the “simplicity of the plan” was the highest rated positive element of the sales compensation plan. However, it would seem appropriate that more than 22% of the sales force would find the program very motivating. In the chart below, 74% (52% moderate + 22% to some extent) view their sales compensation plans as possibly not having the desired impact on the motivation of their sales force.
To what extent do your sales professionals understand the plan and how it works?
To what extent is your sales compensation plan motivating to your sales people?
IV. Assessment of the Effectiveness

www.wilsongroup.com 69
To what extent do the most productive sales people earn the most money?
What kind of updates or changes did you make to your 2013 sales compensation plan?
The charts below show the degree to which the most productive sales people earn the most money and the degree of changes made to the sales plan for 2013. This shows that most companies believe their best people are making the most money; this is a strong indicator of the effectiveness of the plan. Consequently little to no changes were made to the plans coming into 2013. Sixty-five (65%) percent of the companies indicated little change was done. Are there areas for improvement?
IV. Assessment of the Effectiveness

www.wilsongroup.com 70
How do you currently administer your sales compensation plans?
How would you assess the effectiveness of the administration of the sales comp plans?
Administering sales compensation plans are often incredibly time and labor intensive activities especially when the number of sales people increases and the plans become more complex. The charts below show how the participating companies administer their sales plans. Most use some form of HRIS, CRM or similar system. Although they indicated that they do not use external service providers, many firms have adapted external contact management programs to internal uses. The second chart indicates that these plans appear to be working fairly well. Seventy-four (74%) of the companies indicated that the plans were excellent or positive. This perspective is in general alignment about the overall sales compensation plans.
IV. Assessment of the Effectiveness

www.wilsongroup.com 71
Most of the participating companies (73%) indicated that they made some changes to their 2012 plans. Those that did make changes, focused on simplifying the plan and aligning the plan to the firm’s strategy and business development initiatives. This apparently was done most directly by changing the commission rates. The overall changes made to the compensation plans for 2013 are shown below:
IV. Assessment of the Effectiveness

www.wilsongroup.com 72
The charts below show the prevalence and experience with sales performance recognition programs. Approximately 36% of the respondents do not use these type of programs. Those that do, focus these awards on the promotion of new products, increasing sales to new customers, etc.. Companies that use various types of performance recognition programs favor them highly, with 67% indicating their effectiveness was positive to excellent. This indicates that those who currently do not use these programs should examine how they may supplement their current sales compensation programs or their sales growth strategies.
What type of sales performance recognition programs do you use?
How would you assess the effectiveness of these sales performance recognition programs?
IV. Assessment of the Effectiveness

www.wilsongroup.com 73
As a final question, we asked the participants to tell us what are the biggest concerns expressed by the sales representatives. They indicated their 3 – 5 most important concerns. The table below shows what these companies believe are the primary concerns of the sales force. The most important factors relate to the goal setting process, the lead generation process, the territory size, and having highly competitive products/services. While this is not unexpected, it does indicate that there are few concerns about the sales compensation plans, but these issues are often magnified by the sales compensation plans. Therefore, the challenge to sales compensation is to assure it is simple to understand, strategically aligned with the company, and integrated with a fundamental and effective sales process.
IV. Assessment of the Effectiveness
0% 5% 10% 15% 20% 25% 30% 35% 40% 45% 50%
Goal or quota setting process
Territory size or configuration
Product information and training
Sales support for complex product offerings
Marketing support and materials
Lead generation or referrals
Coordination across key, national or global accounts
Transfer of account servicing or implementation to internal teams
Understanding the company's goals and strategies
Accuracy of the sales incentive payments
Adequacy or quality of the company's products or services
Product or service prices compared to the competition
Complexity of the current sales compensation plan
Inadequate sales management
48%
30%
26%
17%
17%
35%
17%
4%
9%
9%
9%
30%
9%
4%

www.wilsongroup.com 74
PART V
Primary Conclusionsand Ideas to Consider

www.wilsongroup.com 75
We hope that you have enjoyed reviewing this special survey of sales compensation practices. We look forward to improving the survey information to better meet your needs for information and to establish important trends and insights on how companies are structuring their sales compensation programs. We will be doing this survey again next year.
Based on the information presented in this report, we believe there are several things that are important for every organization to consider in making their sales compensation plans more effective for the organization and the sales professionals.
1. Examine the measures and assure that they are aligned with the strategy of the organization, and serve to focus and inspire sales professionals to do their very best.
2. Create opportunities to reinforce the progress people are making toward their sales goals. The survey data indicated a far less emphasis on performance recognition and performance management programs than we have seen in other organizations. Look for ways to encourage, reinforce and communicate the importance of revenue growth and goal achievement.
3. Make the performance–to–pay ratios meaningful to both the individual and the company. The company should look for ways in which the payouts reflect strong growth and profitability to the company; the individual should regard them as a meaningful “return on effort” for their achievements.
4. Keep the plan (or plans) simple but not simplistic. It is critical that people understand their compensation plans, and have confidence in the numbers and decisions. Use administrative systems to reinforce the access to timely progress information and create opportunities to reinforce achievements.
5. Identify one or two important features of the plan that will give a competitive advantage. Make sure these are important to your sales force as well. Every effective plan has unique elements – what are yours?
If you would like to talk about your sales compensation plans, and explore ways to improve their effectiveness and make a positive impact on the company, please contact us. We would enjoy working with you and building better capabilities and performance in your company.
V. Primary Conclusions and Ideas to Consider
www.wilsongroup.com 76
Overview of theWilson Group

www.wilsongroup.com 77
Our Mission:“To help our clients assess, develop and implement performance systems and
total compensation plans that translate strategy and values into action.”
Our Primary Services:• Sales effectiveness and total rewards
• Executive total compensation• Board of directors governance structure and compensation
• Employee total compensation and rewards• Special studies in market trends and practices
Key Differentiators:• Our expertise -- Work with highly seasoned, experienced professionals
• Our collaborative approach -- We engage our clients in a collaborative, open communication fashion
• More cost effective -- Highly customized, value added to address just what the client needs • Innovative insights -- Simplifies complex data into easy to understand information and actions
plans
Founded: 1994, Concord, MA
Clients and Markets: We have worked with over 150 clients. They include:• Information Technology – iRobot, ACME Packet, Constant Contact, TripAdvisor, Care.com• Life Sciences – Cytyc, AgaMatrix, CRF Healthcare• Manufacturing – A.W. Chesterton, MorphoTrust, Dynavac• Professional services – Copyright Clearance Center, Boston Symphony, Morgan Samuels• Financial services – Safety Insurance, Boston Mutual, DentaQuest, Capital Advisors
Overview of the Wilson Group

www.wilsongroup.com 78
Leadership Team:• Thomas B. Wilson, President• Susan Malanowski, Principal • Rhonda Farrington, Principal• Plus a team of 5 other experienced professionals• Our Network of additional specialized resources:
Thomas E. Shea & Associates– Executive and Board CompensationIndependent Stock Plan Advisors– Global Equity CompensationBostonian Group – Executive and Employee Benefits
Thought Leadership:• Survey of Sales Compensation Practices – 2011 - 2012 • “Goal Setting: What Has Gone Wrong and What Can Be Done” – published WorldatWork Journal, Fall, 2011• “Changes for Challenging Times – Survey Report on Economic Challenges and Company Responses” (2009)• Survey Report on Changes in Variable Cash Compensation Plans (2007)• Survey Report on Changes in Equity Based Compensation (2006)• Innovative Reward Systems for the Changing Workplace (McGraw-Hill, revised 2003)• Published over 30 articles and book chapters• Presented at over 100 leading regional and national conferences
Contact us at: www.wilsongroup.com
978-371-0476801 Main Street, Suite #2
Concord, MA 01742
[email protected]@[email protected]
Overview of the Wilson Group
Related Documents