Informal document No. GRPE-48-11-Rev.1 (48 th GRPE, 1 – 4 June 2004, agenda item 2.) Note by the secretariat : In this revised document, only the text of the front page was changed and footnote 4 (on page 58) was amended to read: "4 OICA requests that use of Teflo filters instead of fluorocarbon coated glass fibre filters be reviewed in future once more data is available." Conclusions on Improving Particulate Mass Measurement Procedures and New Particle Number Measurement Procedures Relative to The Requirements of The 05 Series of Amendments to Regulation No. 83 Transmitted by The Chairman of the Particle Measurement Programme Group in conjunction with the experts from France, Germany, Sweden, Switzerland and the UK Transmitted by The Chairman of the Particle Measurement Programme Group in conjunction with the experts from France, Germany, Sweden, Switzerland and the UK This document comprises the conclusions of the Particle Measurement Programme working group for an improved particulate mass measurement procedure and new procedures to measure particle number emissions from light duty vehicles. The document is based on the text of Regulation No. 83, Annex 4. In addition to changes relative to existing test procedures, the document contains some restructuring and updating relative to the existing text of Regulation No. 83 Annex 4, e.g on gaseous emissions sampling and dynamometer settings, to improve clarity and readability. These revisions do not make any substantive change relative to the requirements of the Regulation. The document has been compiled with input from ACEA, EMA and OICA as well as national governments. Remaining issues/comment/notes are included in footnotes on pages 11, 20, 56, 58, 60, 63, 67 and 68.

Welcome message from author
This document is posted to help you gain knowledge. Please leave a comment to let me know what you think about it! Share it to your friends and learn new things together.
Transcript
Informal document No. GRPE-48-11-Rev.1 (48th GRPE, 1 – 4 June 2004, agenda item 2.)
Note by the secretariat: In this revised document, only the text of the front page was changed and footnote 4 (on page 58) was amended to read: "4 OICA requests that use of Teflo filters instead of fluorocarbon coated glass fibre filters be reviewed in future once more data is available."
Conclusions on Improving Particulate Mass
Measurement Procedures and New Particle Number
Measurement Procedures Relative to The
Requirements of
The 05 Series of Amendments to Regulation No. 83
Transmitted by
The Chairman of the Particle Measurement Programme Group in conjunction with the experts from France, Germany, Sweden,
Switzerland and the UK
Transmitted by
The Chairman of the Particle Measurement Programme Group in conjunction with the experts from France, Germany, Sweden,
Switzerland and the UK
This document comprises the conclusions of the Particle MeasurementProgramme working group for an improved particulate massmeasurement procedure and new procedures to measure particlenumber emissions from light duty vehicles. The document is based on the text of Regulation No. 83, Annex 4. Inaddition to changes relative to existing test procedures, the documentcontains some restructuring and updating relative to the existing textof Regulation No. 83 Annex 4, e.g on gaseous emissions sampling anddynamometer settings, to improve clarity and readability. Theserevisions do not make any substantive change relative to therequirements of the Regulation. The document has been compiled with input from ACEA, EMA andOICA as well as national governments. Remaining issues/comment/notes are included in footnotes on pages11, 20, 56, 58, 60, 63, 67 and 68.
1 June 2004
1
Regulation No. 83 - Annex 4
Contents Section Page
1. INTRODUCTION ......................................................................................................... 4 2. TEST CONDITIONS .................................................................................................... 4
2.1. Ambient Conditions .......................................................................................4 2.2. Test Vehicle...................................................................................................4 2.3. Test Fuel .......................................................................................................5 2.4. Vehicle Installation ........................................................................................5
3. TEST EQUIPMENT ..................................................................................................... 5 3.1. Chassis Dynamometer ..................................................................................5 3.2. Exhaust Dilution System ...............................................................................5 3.3. Gaseous Emissions Sampling and Analysis .................................................5 3.4. Particulate Mass (PM) Emissions Equipment................................................5 3.5. Particle Number (PN) Emissions Equipment.................................................6 3.6. General Test Cell Equipment ........................................................................6
4. DETERMINATION OF VEHICLE ROAD LOAD ........................................................ 6 4.1. Test Procedure..............................................................................................6
5. EMISSIONS TEST PROCEDURE ................................................................................ 6 5.1. Test Cycle .....................................................................................................6 5.2. Test Preparation..........................................................................................10 5.3. Conditioning Procedure...............................................................................12 5.4. Test Procedure............................................................................................12 5.5. Post-Test Procedures..................................................................................14 5.6. Calculation of Emissions .............................................................................15
APPENDIX 1 - CHASSIS DYNAMOMETER SYSTEM ....................................................... 28 1. Specification.....................................................................................................28
1.1. General Requirements......................................................................28 1.2. Specific Requirements......................................................................28
2. Dynamometer Calibration Procedure...............................................................29 2.1. Introduction ......................................................................................29 2.2. Calibration of the load indicator at 80 km/h......................................29 2.3. Calibration of the load indicator at other speeds..............................31 2.4. Calibration of force or torque............................................................31
3. Verification of the Load Curve..........................................................................32 3.1. Procedure.........................................................................................32
APPENDIX 2 - EXHAUST DILUTION SYSTEM................................................................. 33 1. System Specification........................................................................................33
1.1. System Overview .............................................................................33 1.2. General Requirements .....................................................................33 1.3. Specific Requirements .....................................................................34 1.4. Recommended System Descriptions................................................36
1 June 2004
2
2. CVS Calibration Procedure ..............................................................................38 2.1. General Requirements......................................................................38 2.2. Calibration of the positive displacement pump (PDP) ......................39 2.3. Calibration of the critical-flow venturi (CFV) .....................................42
3. System Verification Procedure.........................................................................44 3.1. General Requirements......................................................................44 3.2. CFO Method .....................................................................................44 3.3. Gravimetric Method ..........................................................................44
APPENDIX 3 - GASEOUS EMISSIONS MEASUREMENT EQUIPMENT .......................... 46 1. Specification.....................................................................................................46
1.1. System Overview..............................................................................46 1.2. Sampling System Requirements ......................................................46 1.3. Gas Analysis Requirements .............................................................47 1.4. Recommended System Descriptions................................................49
2. Calibration Procedures.....................................................................................50 2.1. Analyser Calibration Procedure........................................................50 2.2. Analyser Verification Procedure .......................................................51 2.3. FID Hydrocarbon Response Check Procedure ................................52 2.4. NOx Converter Efficiency Test Procedure ........................................53
3. Reference Gases .............................................................................................54 3.1. Pure gases .......................................................................................54 3.2. Calibration and span gases ..............................................................54
APPENDIX 4 - PARTICULATE MASS EMISSIONS MEASUREMENT EQUIPMENT ...... 56 1. Specification.....................................................................................................56
1.1. System Overview..............................................................................56 1.2. General Requirements......................................................................56 1.3. Specific Requirements......................................................................57 1.4. Recommended System Description .................................................59
2. Calibration and Verification Procedures...........................................................60 2.1. Flow Meter Calibration......................................................................60 2.2. Microbalance Calibration ..................................................................60 2.3. Reference Filter Weighing ................................................................60
APPENDIX 5 - PARTICLE NUMBER EMISSIONS MEASUREMENT EQUIPMENT........ 62 1. Specification.....................................................................................................62
1.1. System Overview..............................................................................62 1.2. General Requirements......................................................................62 1.3. Specific Requirements......................................................................62 1.4. Recommended System Description .................................................64
2. Calibration of Particle Number Measurement System .....................................66 2.1. Calibration of the Particle Number Counter ......................................66 2.2. Calibration of the Particle Number Diluters.......................................67 2.3. Calibration of the Volatile Particle Remover .....................................67 2.4. Particle Number System Check Procedures ....................................68
APPENDIX 6 – VERIFICATION OF SIMULATED INERTIA ............................................ 69 1. OBJECT...........................................................................................................69
1 June 2004
3
2. PRINCIPLE ......................................................................................................69 3. SPECIFICATION..............................................................................................70 4. VERIFICATION PROCEDURE........................................................................70
APPENDIX 7 – MEASUREMENT OF VEHICLE ROAD LOAD ......................................... 71 1. OBJECT OF THE METHODS..........................................................................71 2. DEFINITION OF THE ROAD ...........................................................................71 3. ATMOSPHERIC CONDITIONS .......................................................................71
3.1. Wind .................................................................................................71 3.2. Humidity............................................................................................71 3.3. Pressure and Temperature...............................................................71
4. VEHICLE PREPARATION...............................................................................71 4.1. Selection of the test vehicle ..............................................................71 4.2. Running-in ........................................................................................72 4.3. Verifications ......................................................................................72 4.4. Preparation for the test .....................................................................72
5. METHODS .......................................................................................................73 5.1. Energy variation during coast-down method ....................................73 5.2. Torque measurements method at constant speed ...........................76 5.3. Manifold Pressure Method................................................................77
1 June 2004
4
Regulation No. 83 ANNEX 4 – TYPE 1 TEST 1. INTRODUCTION
This annex describes the procedure for the Type I test defined in paragraph 5.3.1. of this Regulation. When the reference fuel to be used is LPG or NG, the provisions of annex 12 shall apply additionally.
2. TEST CONDITIONS
2.1. Ambient Conditions
2.1.1. During the test, the test cell temperature shall be between 293K and 303K (20 and 30°C). The absolute humidity (H) of either the air in the test cell or the intake air of the engine shall be such that:
5.5 ≥ H ≤ 12.2 (g H2O/kg dry air) The absolute humidity (H) shall be measurable to within ± 5 per cent. The following temperatures shall be measured with an accuracy of ± 1.5K: Test cell ambient air
Intake air to the engine Dilution and sampling system temperatures as required for emissions measurement
systems defined in Appendices 2-5 of this annex.
The atmospheric pressure shall be measurable to within ± 0.1kPa.
2.2. Test Vehicle
2.2.1. The vehicle shall be presented in good mechanical condition. It shall have been run-in and driven at least 3,000 km before the test.
2.2.2. The exhaust device shall not exhibit any leak likely to reduce the quantity of gas collected, which quantity shall be that emerging from the engine.
2.2.3. The tightness of the intake system may be checked to ensure that carburation is not affected by an accidental intake of air.
2.2.4. The settings of the engine and of the vehicle's controls shall be those prescribed by the manufacturer. This requirement also applies, in particular, to the settings for idling (rotation speed and carbon monoxide content of the exhaust gases), for the cold start device and for the exhaust gas cleaning system.
2.2.5. The vehicle to be tested, or an equivalent vehicle, shall be fitted, if necessary, with a device to permit the measurement of the characteristic parameters necessary for chassis dynamometer setting, in conformity with Section 4 of this annex.
1 June 2004
5
2.2.6. The technical service responsible for the tests may verify that the vehicle's performance conforms to that stated by the manufacturer, that it can be used for normal driving and, more particularly, that it is capable of starting when cold and when hot.
2.3. Test Fuel
2.3.1. The appropriate reference fuel as defined in annex 10 to this Regulation shall be used for testing.
2.3.2. Vehicles that are fuelled either with petrol or with LPG or NG shall be tested according to annex 12 with the appropriate reference fuel(s) as defined in annex 10a.
2.4. Vehicle Installation
2.4.1. The vehicle shall be approximately horizontal during the test so as to avoid any abnormal distribution of the fuel.
2.4.2. A current of air of variable speed shall be blown over the vehicle. The blower speed shall be such that, within the operating range of 10 km/h to at least 50 km/h, the linear velocity of the air at the blower outlet is within ± 5 km/h of the corresponding roller speed. The final selection of the blower shall have the following characteristics:
Area: at least 0.2 m2; Height of the lower edge above ground: approximately 20cm; Distance from the front of the vehicle: approximately 30cm.
As an alternative the blower speed shall be fixed at an air speed of at least 6 m/s (21.6 km/h). For special vehicles (e.g. vans, off-road), the height of the cooling fan can also be modified at the request of the manufacturer.
3. TEST EQUIPMENT
3.1. Chassis Dynamometer
The chassis dynamometer requirements are given in Appendix 1
3.2. Exhaust Dilution System
The exhaust dilution system requirements are given in Appendix 2
3.3. Gaseous Emissions Sampling and Analysis
The gaseous emissions sampling and analysis equipment requirements are given in Appendix 3
3.4. Particulate Mass (PM) Emissions Equipment
The particulate mass sampling and measurement requirements are given in Appendix 4
1 June 2004
6
3.5. Particle Number (PN) Emissions Equipment
The particle number sampling and measurement requirements are given in Appendix 5
3.6. General Test Cell Equipment
The following temperatures shall be measured with an accuracy of ± 1.5 K: Test cell ambient air
Intake air to the engine Dilution and sampling system temperatures as required for emissions measurement
systems defined in Appendices 2-5 of this annex.
The atmospheric pressure shall be measurable to within ± 0.1 kPa. The absolute humidity (H) shall be measurable to within ± 5 per cent.
4. DETERMINATION OF VEHICLE ROAD LOAD
4.1. Test Procedure
The procedure for measuring the vehicle road load is described in Appendix 7.
This procedure is not required if the chassis dynamometer load is to be set according to the reference mass of the vehicle.
5. EMISSIONS TEST PROCEDURE
5.1. Test Cycle
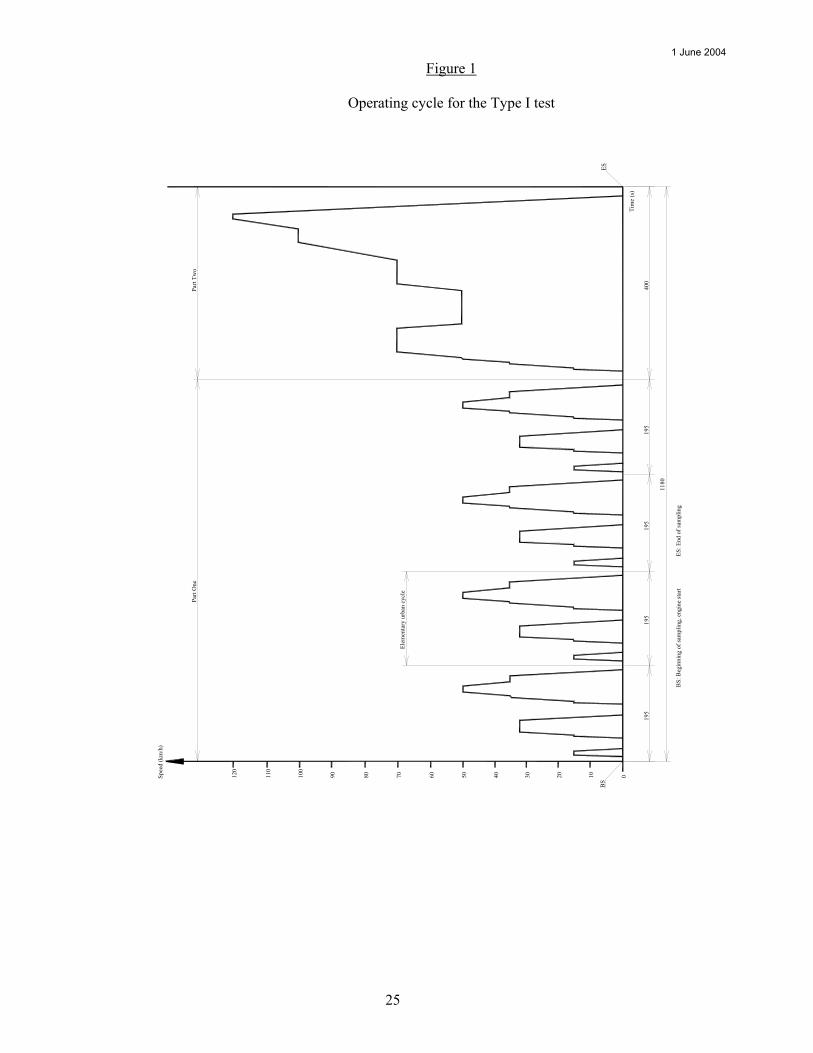
The operating cycle, made up of a Part One (urban cycle) and Part Two (extra-urban cycle), is illustrated in Figure 1. During the complete test Part One is run four times followed by Part Two.
1 June 2004
7
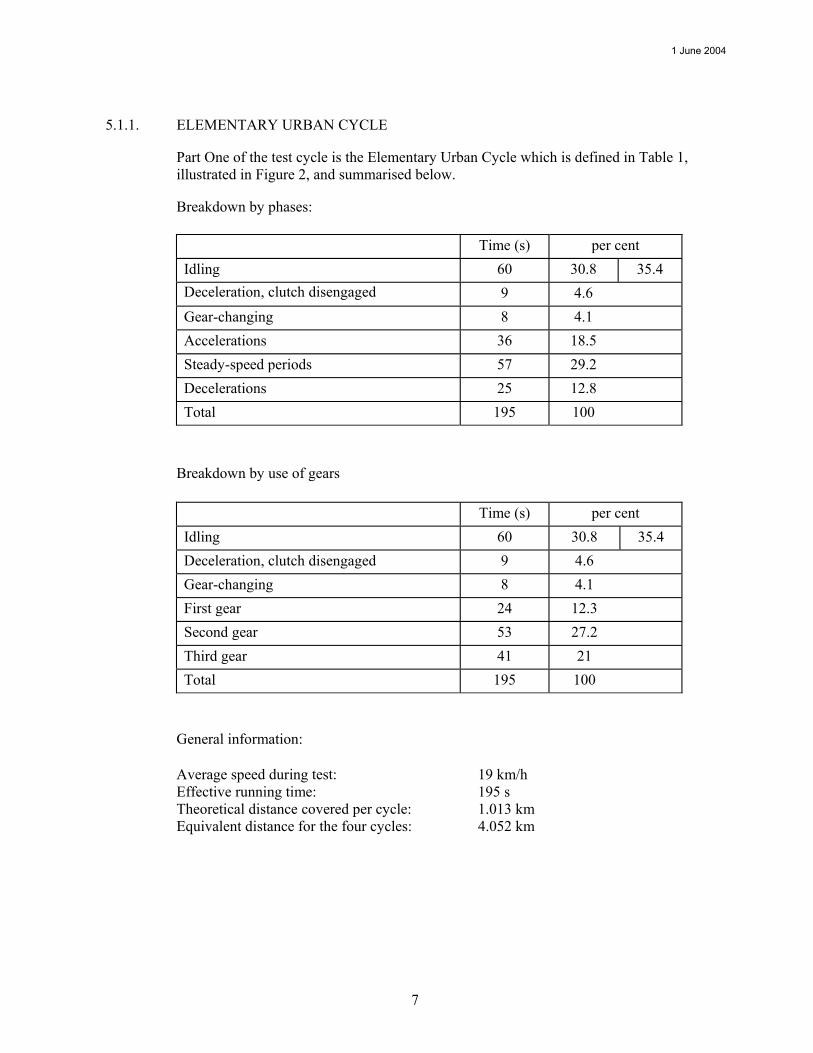
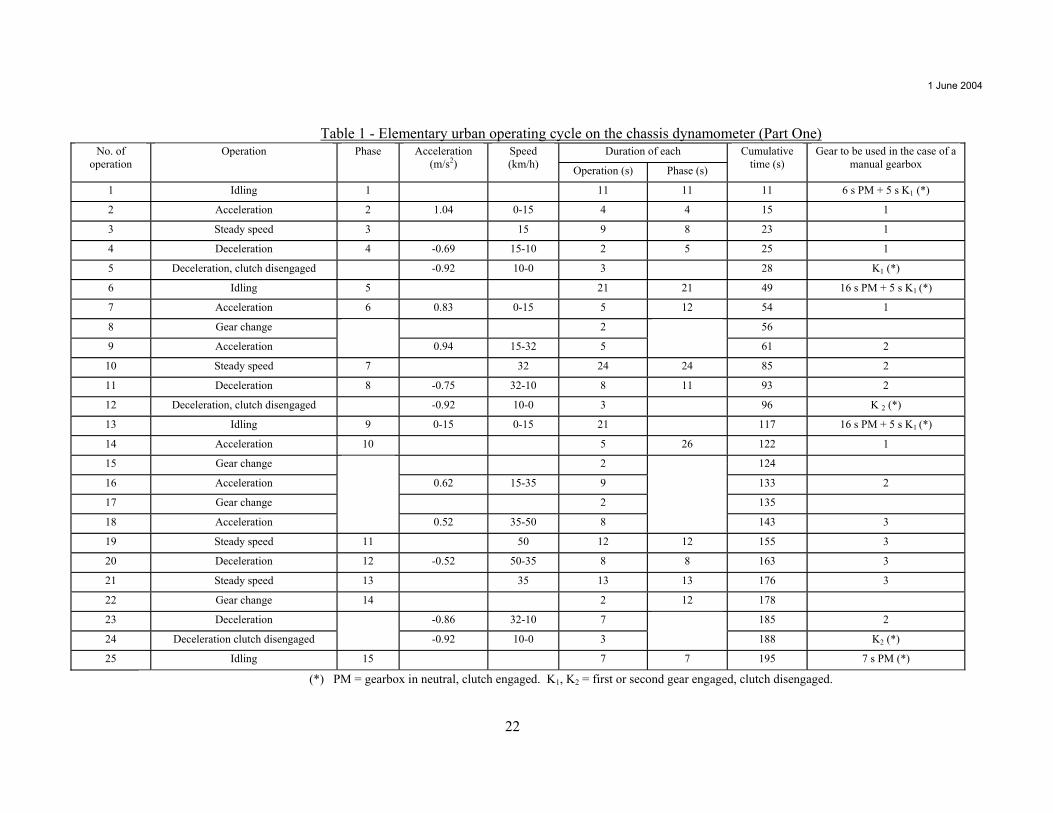
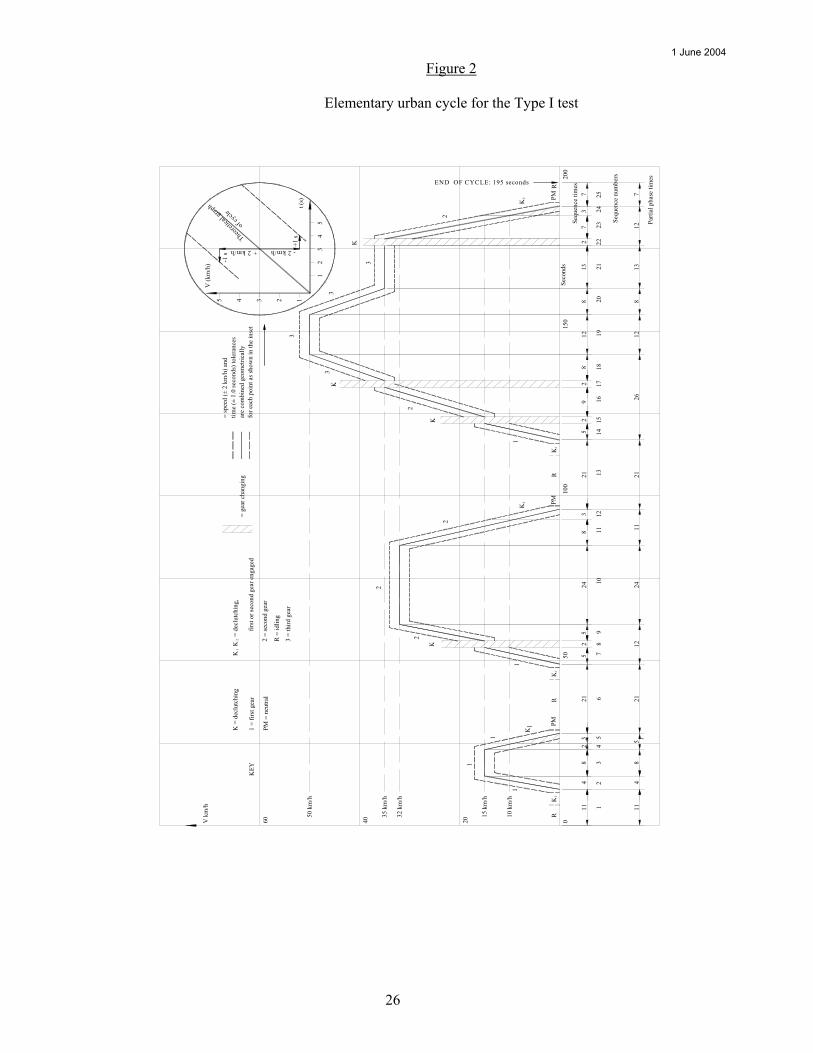
5.1.1. ELEMENTARY URBAN CYCLE
Part One of the test cycle is the Elementary Urban Cycle which is defined in Table 1, illustrated in Figure 2, and summarised below.
Breakdown by phases:
Time (s) per cent Idling 60 30.8 35.4 Deceleration, clutch disengaged 9 4.6 Gear-changing 8 4.1 Accelerations 36 18.5 Steady-speed periods 57 29.2 Decelerations 25 12.8 Total 195 100
Breakdown by use of gears Time (s) per cent Idling 60 30.8 35.4 Deceleration, clutch disengaged 9 4.6 Gear-changing 8 4.1 First gear 24 12.3 Second gear 53 27.2 Third gear 41 21 Total 195 100
General information: Average speed during test: 19 km/h Effective running time: 195 s Theoretical distance covered per cycle: 1.013 km Equivalent distance for the four cycles: 4.052 km
1 June 2004
8
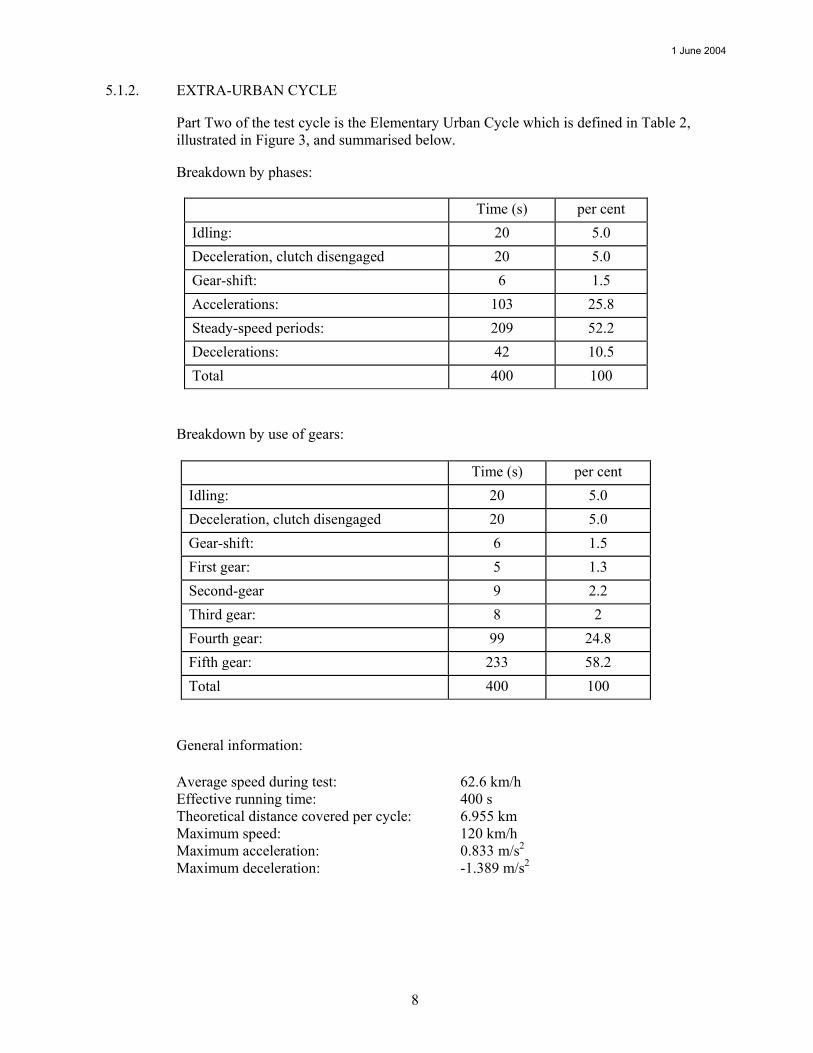
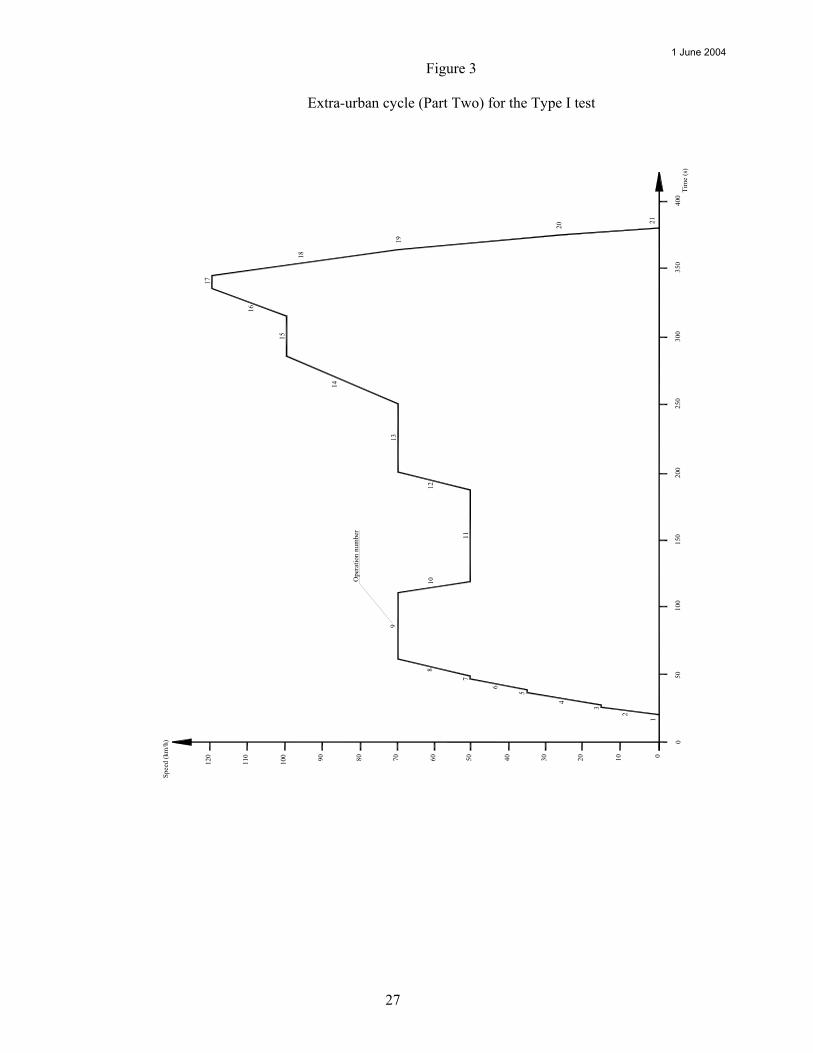
5.1.2. EXTRA-URBAN CYCLE
Part Two of the test cycle is the Elementary Urban Cycle which is defined in Table 2, illustrated in Figure 3, and summarised below.
Breakdown by phases:
Time (s) per cent Idling: 20 5.0 Deceleration, clutch disengaged 20 5.0 Gear-shift: 6 1.5 Accelerations: 103 25.8 Steady-speed periods: 209 52.2 Decelerations: 42 10.5 Total 400 100
Breakdown by use of gears:
Time (s) per cent Idling: 20 5.0 Deceleration, clutch disengaged 20 5.0 Gear-shift: 6 1.5 First gear: 5 1.3 Second-gear 9 2.2 Third gear: 8 2 Fourth gear: 99 24.8 Fifth gear: 233 58.2 Total 400 100
General information: Average speed during test: 62.6 km/h Effective running time: 400 s Theoretical distance covered per cycle: 6.955 km Maximum speed: 120 km/h Maximum acceleration: 0.833 m/s2 Maximum deceleration: -1.389 m/s2
1 June 2004
9
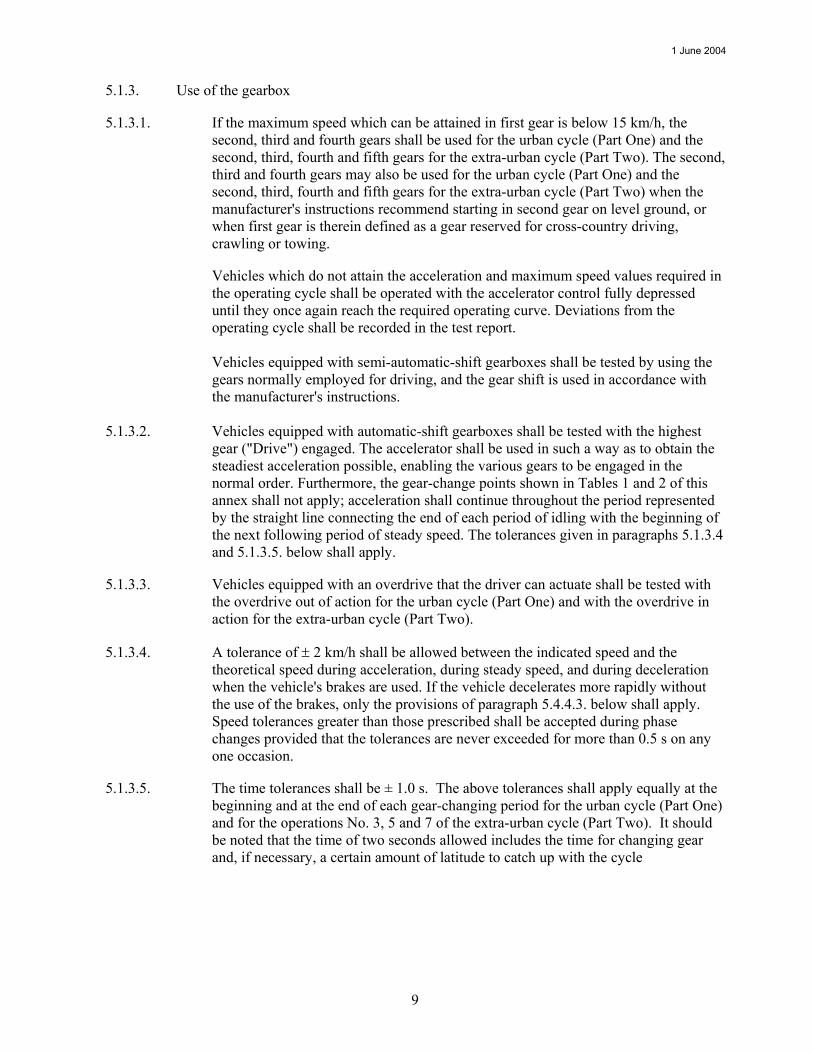
5.1.3. Use of the gearbox
5.1.3.1. If the maximum speed which can be attained in first gear is below 15 km/h, the second, third and fourth gears shall be used for the urban cycle (Part One) and the second, third, fourth and fifth gears for the extra-urban cycle (Part Two). The second, third and fourth gears may also be used for the urban cycle (Part One) and the second, third, fourth and fifth gears for the extra-urban cycle (Part Two) when the manufacturer's instructions recommend starting in second gear on level ground, or when first gear is therein defined as a gear reserved for cross-country driving, crawling or towing.
Vehicles which do not attain the acceleration and maximum speed values required in the operating cycle shall be operated with the accelerator control fully depressed until they once again reach the required operating curve. Deviations from the operating cycle shall be recorded in the test report.
Vehicles equipped with semi-automatic-shift gearboxes shall be tested by using the
gears normally employed for driving, and the gear shift is used in accordance with the manufacturer's instructions.
5.1.3.2. Vehicles equipped with automatic-shift gearboxes shall be tested with the highest
gear ("Drive") engaged. The accelerator shall be used in such a way as to obtain the steadiest acceleration possible, enabling the various gears to be engaged in the normal order. Furthermore, the gear-change points shown in Tables 1 and 2 of this annex shall not apply; acceleration shall continue throughout the period represented by the straight line connecting the end of each period of idling with the beginning of the next following period of steady speed. The tolerances given in paragraphs 5.1.3.4 and 5.1.3.5. below shall apply.
5.1.3.3. Vehicles equipped with an overdrive that the driver can actuate shall be tested with the overdrive out of action for the urban cycle (Part One) and with the overdrive in action for the extra-urban cycle (Part Two).
5.1.3.4. A tolerance of ± 2 km/h shall be allowed between the indicated speed and the theoretical speed during acceleration, during steady speed, and during deceleration when the vehicle's brakes are used. If the vehicle decelerates more rapidly without the use of the brakes, only the provisions of paragraph 5.4.4.3. below shall apply. Speed tolerances greater than those prescribed shall be accepted during phase changes provided that the tolerances are never exceeded for more than 0.5 s on any one occasion.
5.1.3.5. The time tolerances shall be ± 1.0 s. The above tolerances shall apply equally at the beginning and at the end of each gear-changing period for the urban cycle (Part One) and for the operations No. 3, 5 and 7 of the extra-urban cycle (Part Two). It should be noted that the time of two seconds allowed includes the time for changing gear and, if necessary, a certain amount of latitude to catch up with the cycle
1 June 2004
10
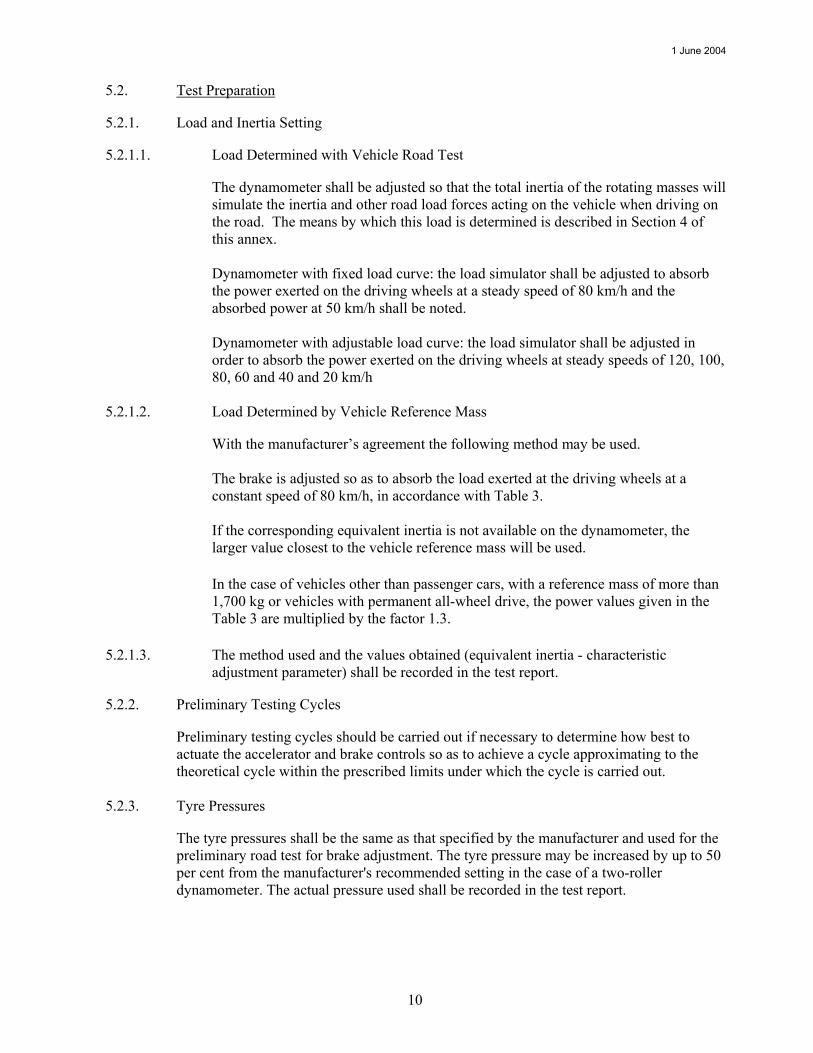
5.2. Test Preparation
5.2.1. Load and Inertia Setting
5.2.1.1. Load Determined with Vehicle Road Test
The dynamometer shall be adjusted so that the total inertia of the rotating masses will simulate the inertia and other road load forces acting on the vehicle when driving on the road. The means by which this load is determined is described in Section 4 of this annex.
Dynamometer with fixed load curve: the load simulator shall be adjusted to absorb
the power exerted on the driving wheels at a steady speed of 80 km/h and the absorbed power at 50 km/h shall be noted.
Dynamometer with adjustable load curve: the load simulator shall be adjusted in
order to absorb the power exerted on the driving wheels at steady speeds of 120, 100, 80, 60 and 40 and 20 km/h
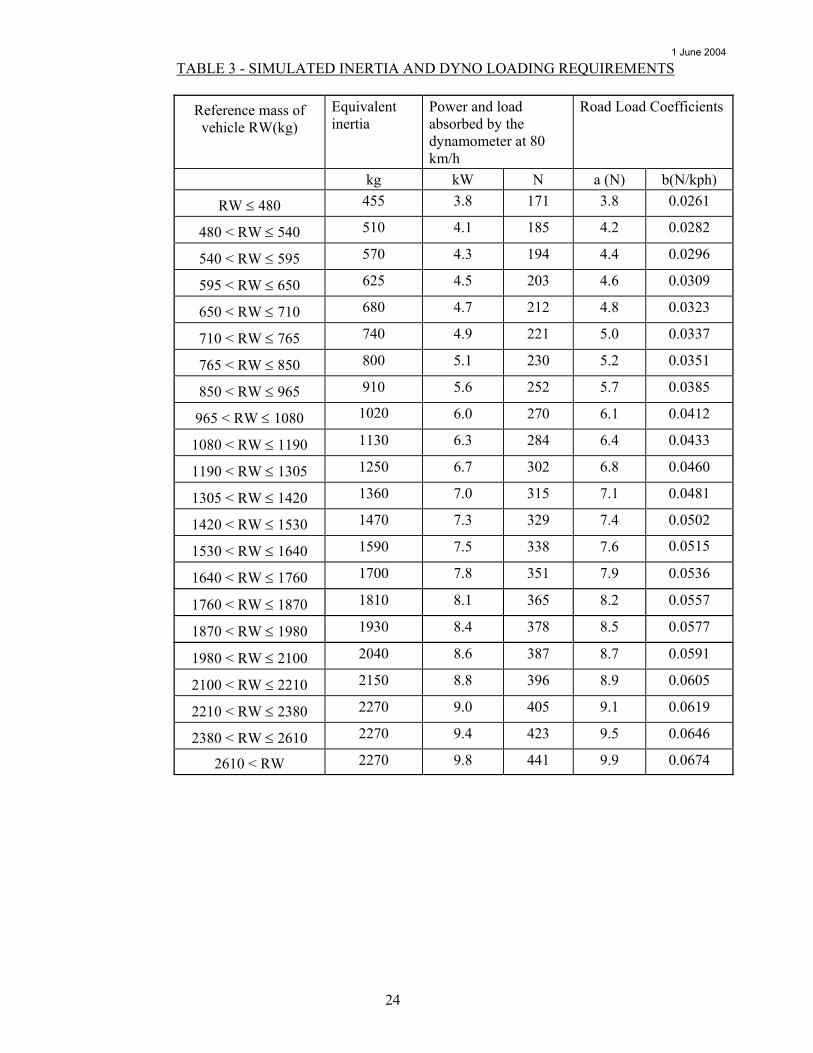
5.2.1.2. Load Determined by Vehicle Reference Mass
With the manufacturer’s agreement the following method may be used. The brake is adjusted so as to absorb the load exerted at the driving wheels at a
constant speed of 80 km/h, in accordance with Table 3. If the corresponding equivalent inertia is not available on the dynamometer, the
larger value closest to the vehicle reference mass will be used.
In the case of vehicles other than passenger cars, with a reference mass of more than 1,700 kg or vehicles with permanent all-wheel drive, the power values given in the Table 3 are multiplied by the factor 1.3.
5.2.1.3. The method used and the values obtained (equivalent inertia - characteristic
adjustment parameter) shall be recorded in the test report.
5.2.2. Preliminary Testing Cycles
Preliminary testing cycles should be carried out if necessary to determine how best to actuate the accelerator and brake controls so as to achieve a cycle approximating to the theoretical cycle within the prescribed limits under which the cycle is carried out.
5.2.3. Tyre Pressures
The tyre pressures shall be the same as that specified by the manufacturer and used for the preliminary road test for brake adjustment. The tyre pressure may be increased by up to 50 per cent from the manufacturer's recommended setting in the case of a two-roller dynamometer. The actual pressure used shall be recorded in the test report.
1 June 2004
11
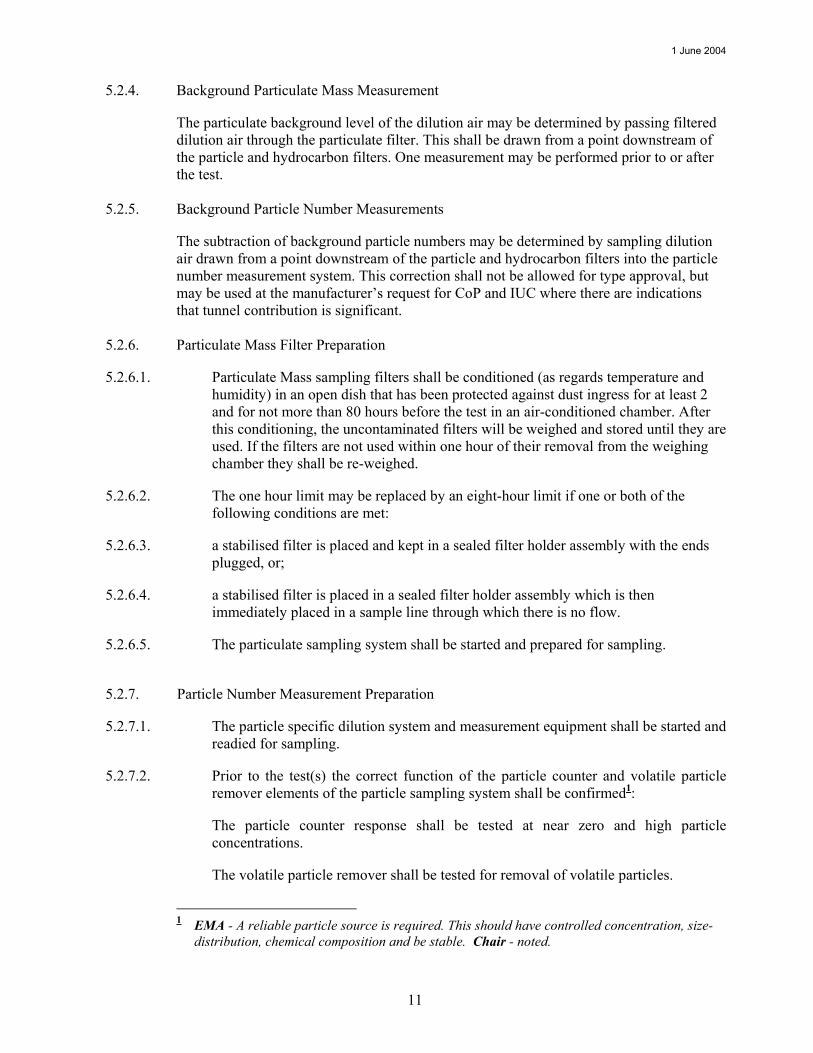
5.2.4. Background Particulate Mass Measurement
The particulate background level of the dilution air may be determined by passing filtered dilution air through the particulate filter. This shall be drawn from a point downstream of the particle and hydrocarbon filters. One measurement may be performed prior to or after the test.
5.2.5. Background Particle Number Measurements
The subtraction of background particle numbers may be determined by sampling dilution air drawn from a point downstream of the particle and hydrocarbon filters into the particle number measurement system. This correction shall not be allowed for type approval, but may be used at the manufacturer’s request for CoP and IUC where there are indications that tunnel contribution is significant.
5.2.6. Particulate Mass Filter Preparation
5.2.6.1. Particulate Mass sampling filters shall be conditioned (as regards temperature and humidity) in an open dish that has been protected against dust ingress for at least 2 and for not more than 80 hours before the test in an air-conditioned chamber. After this conditioning, the uncontaminated filters will be weighed and stored until they are used. If the filters are not used within one hour of their removal from the weighing chamber they shall be re-weighed.
5.2.6.2. The one hour limit may be replaced by an eight-hour limit if one or both of the following conditions are met:
5.2.6.3. a stabilised filter is placed and kept in a sealed filter holder assembly with the ends plugged, or;
5.2.6.4. a stabilised filter is placed in a sealed filter holder assembly which is then immediately placed in a sample line through which there is no flow.
5.2.6.5. The particulate sampling system shall be started and prepared for sampling.
5.2.7. Particle Number Measurement Preparation
5.2.7.1. The particle specific dilution system and measurement equipment shall be started and readied for sampling.
5.2.7.2. Prior to the test(s) the correct function of the particle counter and volatile particle remover elements of the particle sampling system shall be confirmed1:
The particle counter response shall be tested at near zero and high particle concentrations.
The volatile particle remover shall be tested for removal of volatile particles.
1 EMA - A reliable particle source is required. This should have controlled concentration, size-
distribution, chemical composition and be stable. Chair - noted.
1 June 2004
12
When the inlet is equipped with a HEPA filter, it shall be demonstrated that the entire particle sampling system is free from any leaks.
5.2.8. Checking the Gas Analysers
The emissions analysers for the gases shall be set at zero and spanned. The sample bags shall be evacuated.
5.3. Conditioning Procedure
5.3.1. For compression-ignition engined vehicles for the purpose of measuring particulates, at most 36 hours and at least 6 hours before testing, the Part Two cycle described in section 5.1 of this annex shall be used. Three consecutive cycles shall be driven. The dynamometer setting shall be indicated as in paragraphs 5.2.1. above.
At the request of the manufacturer, vehicles fitted with positive-ignition engines may be preconditioned with one Part One and two Part Two driving cycles. After this preconditioning, specific for compression-ignition engines, and before testing, compression-ignition and positive-ignition engined vehicles shall be kept in a room in which the temperature remains relatively constant between 293 and 303 K (20°C and 30°C). This conditioning shall be carried out for at least six hours and continue until the engine oil temperature and coolant, if any, are within +/-2 K of the temperature of the room.
5.3.2. If the manufacturer so requests, the test shall be carried out not later than 30 hours after the vehicle has been run at its normal temperature.
5.3.3. For positive-ignition engined vehicles fuelled with LPG or NG or so equipped that they can be fuelled with either petrol or LPG or NG, between the tests on the first gaseous reference fuel and the second gaseous reference fuel, the vehicle shall be preconditioned before the test on the second reference fuel. This preconditioning is done on the second reference fuel by driving a preconditioning cycle consisting of one Part One (urban part) and two times Part Two (extra-urban part) of the test cycle described in appendix 1 to this annex. On the manufacturer’s request and with the agreement of the technical service this preconditioning may be extended. The dynamometer setting shall be the one indicated in paragraphs 5.1. and 5.2. of this annex.
5.4. Test Procedure
5.4.1. Starting-up the engine
5.4.1.1. The engine shall be started up by means of the devices provided for this purpose according to the manufacturer's instructions, as incorporated in the drivers' handbook of production vehicles.
5.4.1.2. The first cycle starts on the initiation of the engine start-up procedure.
5.4.1.3. In the case of the use of LPG or NG as a fuel it is permissible that the engine is started on petrol and switched to LPG or NG after a predetermined period of time which cannot be changed by the driver.

1 June 2004
13
5.4.2. Idling
5.4.2.1. Manual-shift or semi-automatic gearbox, see Tables 1 and 2
5.4.2.2. Automatic-shift gearbox
After initial engagement the selector shall not be operated at any time during the test except in the case specified in paragraph 5.4.3.3 below or if the selector can actuate the overdrive, if any.
5.4.3. Accelerations
5.4.3.1. Accelerations shall be so performed that the rate of acceleration is as constant as possible throughout the operation.
5.4.3.2. If an acceleration cannot be carried out in the prescribed time, the extra time required shall be deducted from the time allowed for changing gear, if possible, but otherwise from the subsequent steady-speed period.
5.4.3.3. Automatic-shift gearboxes
If an acceleration cannot be carried out in the prescribed time, the gear selector shall operate in accordance with requirements for manual-shift gearboxes.
5.4.4. Decelerations
5.4.4.1. All decelerations of the elementary urban cycle (Part One); shall be effected by removing the foot completely from the accelerator with the clutch remaining engaged. The clutch shall be disengaged, without use of the gear lever, at the higher of the following speeds: 10 km/h or the speed corresponding to the engine idle speed.
All decelerations of the extra-urban cycle (Part Two); shall be effected by removing the foot completely from the accelerator, the clutch remaining engaged. The clutch shall be disengaged, without use of the gear lever, at a speed of 50 km/h for the last deceleration.
5.4.4.2. If the period of deceleration is longer than that prescribed for the corresponding
phase, the vehicle's brakes shall be used to enable compliance with the timing of the cycle.
5.4.4.3. If the period of deceleration is shorter than that prescribed for the corresponding phase, the timing of the theoretical cycle shall be restored by constant speed or idling period merging into the following operation.
5.4.4.4. At the end of the deceleration period (halt of the vehicle on the rollers) of the elementary urban cycle (Part One) the gears shall be placed in neutral and the clutch engaged.

1 June 2004
14
5.4.5. Steady speeds
5.4.5.1. “Pumping" or the closing of the throttle shall be avoided when passing from acceleration to the following steady speed.
5.4.5.2. Periods of constant speed shall be achieved by keeping the accelerator position fixed.
5.4.6. Sampling
Sampling shall begin (BS) before or at the initiation of the engine start up procedure and end on conclusion of the final idling period in the extra-urban cycle (Part Two, end of sampling (ES)) or, in the case of test Type VI, on conclusion of the final idling period of the last elementary urban cycle (Part One).
5.4.7. During the test the speed is recorded against time or collected by the data-acquisition system so that the correctness of the cycles performed can be assessed.
5.4.8. Particles shall be measured continuously in the particle sampling system. The average concentrations shall be determined by integrating the analyser signals over the test cycle.
5.5. Post-Test Procedures
5.5.1. Gas Analyser Check
Zero and span gas reading of the analysers used for continuous measurement shall be checked. The test shall be considered acceptable if the difference between the pre-test and post-test results is less than 2 per cent of the span gas value.
5.5.2. Particulate Filter Weighing
Reference filters shall be weighed within 4 hours of the test filter weighing. The contaminated particulate filter shall be taken to the weighing chamber within one hour following the analyses of the exhaust gases. The filter shall be conditioned for at least 2 hours and not more than 80 hours and then weighed.
5.5.3. Bag Analysis
5.5.3.1. The exhaust gases contained in the bag shall be analysed as soon as possible and in any event not later than 20 minutes after the end of the test cycle.
5.5.3.2. Prior to each sample analysis, the analyser range to be used for each pollutant shall be set to zero with the appropriate zero gas.
5.5.3.3. The analysers shall then be set to the calibration curves by means of span gases of nominal concentrations of 70 to 100 per cent of the range.
5.5.3.4. The analysers' zero settings shall then be rechecked: if any reading differs by more than 2 per cent of the range from that set in paragraph 5.5.3.2. above, the procedure shall be repeated for that analyser.
5.5.3.5. The samples shall then be analysed.

1 June 2004
15
5.5.3.6. After the analysis, zero and span points shall be rechecked using the same gases. If these rechecks are within ± 2 per cent of those in paragraph 5.5.3.3. above, the analysis shall be considered acceptable.
5.5.3.7. At all points in this paragraph, the flow-rates and pressures of the various gases shall be the same as those used during calibration of the analysers.
5.5.3.8. The figure adopted for the content of the gases in each of the pollutants measured shall be that read off after stabilisation of the measuring device. Hydrocarbon mass emissions of compression-ignition engines shall be calculated from the integrated HFID reading, corrected for varying flow if necessary, as shown in section 5.6.6. below.
5.6. Calculation of Emissions
5.6.1. Determination of Volume
5.6.1.1. Calculation of the volume when a variable dilution device with constant flow control by orifice or venturi is used
Record continuously the parameters showing the volumetric flow, and calculate the total volume for the duration of the test.
5.6.1.2. Calculation of volume when a positive displacement pump is used
The volume of diluted exhaust gas measured in systems comprising a positive displacement pump is calculated with the following formula:
V = Vo . N
where: V = volume of the diluted gas expressed in litres per test (prior to correction), Vo = volume of gas delivered by the positive displacement pump in testing
conditions in litres per revolution, N = number of revolutions per test.
5.6.1.3. Correction of Volume to Standard Conditions
The diluted exhaust-gas volume is corrected by means of the following formula:
−⋅⋅=
p
1B1mix T
PPKVV (2)
in which:
( )( ) 6961.2kPa33.101K2.273K1 == (3)
where:
1 June 2004
16
PB = barometric pressure in the test room in kPa,
P1 = vacuum at the inlet to the positive displacement pump in kPa relative to the ambient barometric pressure,
Tp = average temperature of the diluted exhaust gas entering the positive
displacement pump during the test (K).
5.6.2. Total mass of gaseous and particulate pollutants emitted
The mass M of each pollutant emitted by the vehicle during the test shall be determined by obtaining the product of the volumetric concentration and the volume of the gas in question, with due regard for the following densities under above-mentioned reference conditions:
In the case of carbon monoxide (CO): d = 1.25g/l
In the case of hydrocarbons:
for petrol (CH1.85) d = 0.619g/1
for diesel (CHl.86) d = 0.619g/1
for LPG (CH2.525) d = 0.649g/l
for NG (CH4) d = 0.714g/l
In the case of nitrogen oxides (NOx): d = 2.05g/1 5.6.3. Mass emissions of gaseous pollutants shall be calculated by means of the following
formula:
d10CkQV
M6
ihimixi
−⋅⋅⋅⋅= (1)
where:
Mi = mass emission of the pollutant i in grams per kilometre,
Vmix = volume of the diluted exhaust gas expressed in litres per test and corrected to standard conditions (273.2 K and 101.33kPa),
Qi = density of the pollutant i in grams per litre at normal temperature and
pressure (273.2 K and 101.33kPa),
kh = humidity correction factor used for the calculation of the mass emissions of oxides of nitrogen. There is no humidity correction for HC and CO,
1 June 2004
17
Ci = concentration of the pollutant i in the diluted exhaust gas expressed in ppm and corrected by the amount of the pollutant i contained in the dilution air,
d = distance corresponding to the operating cycle in kilometres.
5.6.4. Correction for Dilution Air Concentration
The concentration of pollutant in the diluted exhaust gas shall be corrected by the amount of the pollutant in the dilution air as follows:
−⋅−=
DF11CCC dei (4)
where:
Ci = concentration of the pollutant i in the diluted exhaust gas, expressed in ppm and corrected by the amount of i contained in the dilution air,
Ce = measured concentration of pollutant i in the diluted exhaust gas, expressed in
ppm, Cd = concentration of pollutant i in the air used for dilution, expressed in ppm,
DF = dilution factor.
The dilution factor is calculated as follows:
( ) 4COHC2CO 10CCC
4.13DF−⋅++
= for petrol and diesel (5a)
( ) 4COHC2CO 10CCC
9.11DF−⋅++
= for LPG (5b)
( ) 4COHC2CO 10CCC
5.9DF−⋅++
= for NG (5c)
1 June 2004
18
In these equations:
CCO2 = concentration of CO2 in the diluted exhaust gas contained in the sampling bag, expressed in per cent volume,
CHC = concentration of HC in the diluted exhaust gas contained in the
sampling bag, expressed in ppm carbon equivalent,
CCO = concentration of CO in the diluted exhaust gas contained in the sampling bag, expressed in ppm.
5.6.5. Calculation of the NO Humidity Correction Factor
In order to correct the influence of humidity on the results of oxides of nitrogen, the following calculations are applied:
( )71.10H0329.011k h −⋅−
= (6)
in which:
2adB
da
10RPPPR211.6
H−⋅⋅−
⋅⋅=
where:
H = absolute humidity expressed in grams of water per kilogram of dry air,
Ra = relative humidity of the ambient air expressed as a percentage, Pd = saturation vapour pressure at ambient temperature expressed in kPa,
PB = atmospheric pressure in the room, expressed in kPa.
5.6.6. Determination of HC for compression-ignition engines
To calculate HC-mass emission for compression-ignition engines, the average HC concentration is calculated as follows:
12
t
tHC
e tt
dtC
C
2
1
−
⋅
=∫
(7)
where:
∫ ⋅2
1
t
tHC dtC = integral of the recording of the heated FID over the test (t2-
t1)
1 June 2004
19
Ce = concentration of HC measured in the diluted exhaust in ppm of Ci is substituted for CHC in all relevant equations.
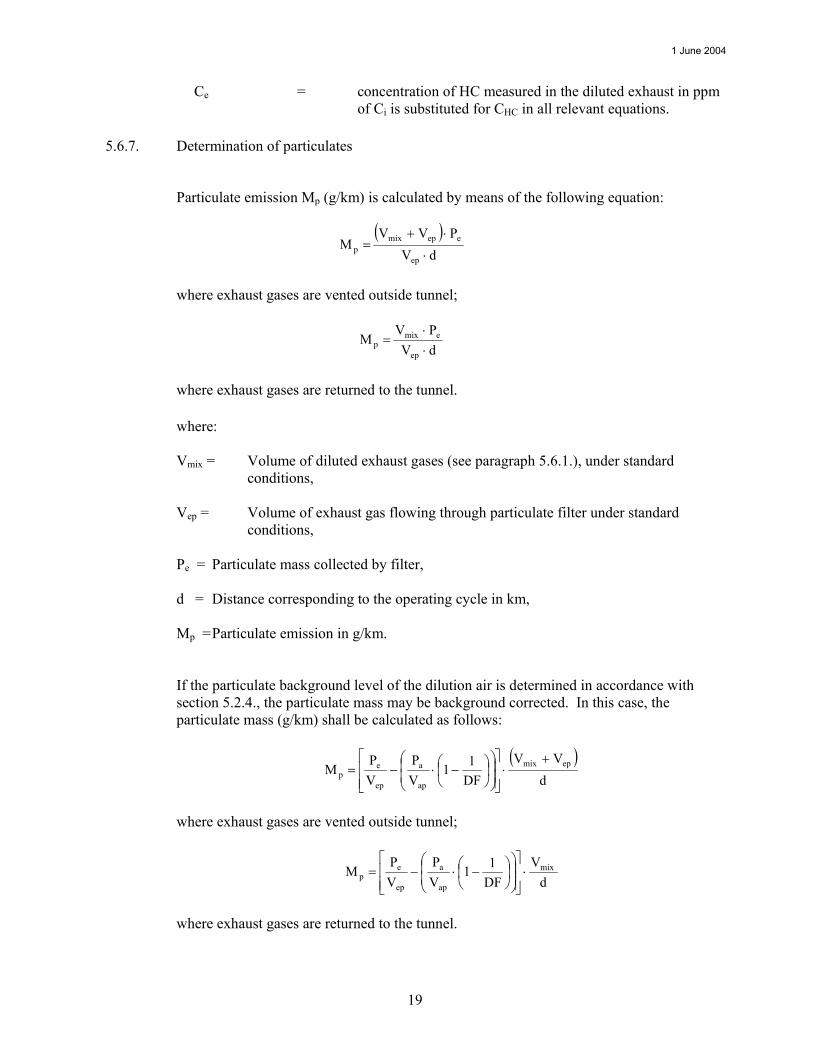
5.6.7. Determination of particulates
Particulate emission Mp (g/km) is calculated by means of the following equation:
( )
dVPVV
Mep
eepmixp ⋅
⋅+=
where exhaust gases are vented outside tunnel;
dVPV
Mep
emixp ⋅
⋅=
where exhaust gases are returned to the tunnel. where: Vmix = Volume of diluted exhaust gases (see paragraph 5.6.1.), under standard
conditions, Vep = Volume of exhaust gas flowing through particulate filter under standard
conditions, Pe = Particulate mass collected by filter, d = Distance corresponding to the operating cycle in km, Mp = Particulate emission in g/km. If the particulate background level of the dilution air is determined in accordance with section 5.2.4., the particulate mass may be background corrected. In this case, the particulate mass (g/km) shall be calculated as follows:
( )d
VVDF11
VP
VP
M epmix
ap
a
ep
ep
+⋅
−⋅−=
where exhaust gases are vented outside tunnel;
dV
DF11
VP
VP
M mix
ap
a
ep
ep ⋅
−⋅−=
where exhaust gases are returned to the tunnel.

1 June 2004
20
Where: Vap = Volume of tunnel air flowing through the background particulate filter under
standard conditions, Pa = Particulate mass collected by background filter, DF = Dilution factor as determined in section 5.6.4
5.6.8. Determination of Particle Number2
Number emission of particles shall be calculated by means of the following equation:
dCVN
310.DRtot..=
where: N = particle number emission expressed in particles per kilometre
V = volume of the diluted exhaust gas expressed in litres per test and corrected to standard
conditions (273.2 K and 101.33 kPa) C = average concentration of particles in the diluted exhaust gas expressed in particles per cubic centimetre
DRtot = total dilution factor of the diluter in the volatile particle remover, calculated as the
product of the dilution factor in the first particle number diluter and the dilution factor in the second particle number diluter (PNDR1 * PNDR2)
d = distance corresponding to the operating cycle expressed in kilometres. C shall be calculated from the following equation:
nC
Cni
i i∑=
== 1
where:
Ci = a discrete measurement of particle concentration in the diluted gas exhaust from the particle counter expressed in particles per cubic centimetre
n = total number of discrete particle concentration measurements made during the operating
cycle.
n shall be calculated from the following equation:
f.Tn = where:
T = time duration of the operating cycle expressed in seconds
2 OICA - particle number background correction should be retained. Chair - No. Introduces
potential for erroneous measurement. Section 5.2.5 modified as compromise.
1 June 2004
21
f = data logging frequency of the particle counter expressed in Hz
5.6.9 Allowance For Mass Emissions From Vehicles Equipped With Periodically Regenerating
Devices
When the vehicle is equipped with a periodically regenerating system as defined in ECE 83.05 Annex 13: Emissions test procedure for a vehicle equipped with a periodically regenerating system, the provisions of Annex 13 shall apply.
_____________
1 June 2004
22
Table 1 - Elementary urban operating cycle on the chassis dynamometer (Part One) Duration of each No. of
operation Operation Phase Acceleration
(m/s2) Speed (km/h) Operation (s) Phase (s)
Cumulative time (s)
Gear to be used in the case of a manual gearbox
1 Idling 1 11 11 11 6 s PM + 5 s K1 (*)
2 Acceleration 2 1.04 0-15 4 4 15 1
3 Steady speed 3 15 9 8 23 1
4 Deceleration 4 -0.69 15-10 2 5 25 1
5 Deceleration, clutch disengaged -0.92 10-0 3 28 K1 (*)
6 Idling 5 21 21 49 16 s PM + 5 s K1 (*)
7 Acceleration 6 0.83 0-15 5 12 54 1
8 Gear change 2 56
9 Acceleration
0.94 15-32 5
61 2
10 Steady speed 7 32 24 24 85 2
11 Deceleration 8 -0.75 32-10 8 11 93 2
12 Deceleration, clutch disengaged -0.92 10-0 3 96 K 2 (*)
13 Idling 9 0-15 0-15 21 117 16 s PM + 5 s K1 (*)
14 Acceleration 10 5 26 122 1
15 Gear change 2 124
16 Acceleration 0.62 15-35 9 133 2
17 Gear change 2 135
18 Acceleration
0.52 35-50 8 143 3
19 Steady speed 11 50 12 12 155 3
20 Deceleration 12 -0.52 50-35 8 8 163 3
21 Steady speed 13 35 13 13 176 3
22 Gear change 14 2 12 178
23 Deceleration -0.86 32-10 7 185 2
24 Deceleration clutch disengaged -0.92 10-0 3
188 K2 (*)
25 Idling 15 7 7 195 7 s PM (*)
(*) PM = gearbox in neutral, clutch engaged. K1, K2 = first or second gear engaged, clutch disengaged.

1 June 2004
23
Table 2 - Extra-urban cycle (Part Two) for the Type I test
Duration of each No. of operation
Operation Phase Acceleration (m/s2)
Speed (km/h)
Operation(s) Phase(s)
Cumulative time(s)
Gear to be used in the case of a manual
gearbox 1 Idling 1 20 20 20 K1 (1)
2 Acceleration 0.83 0 5 25 1
3 Gear change 2 27 -
4 Acceleration 0.62 15-35 9 36 2
5 Gear change 2 38 -
6 Acceleration 0.52 35-30 8 46 3
7 Gear change 2 48 -
8 Acceleration
2
0.43 50-70 13
41
61 4
9 Steady speed 3 70 50 50 111 5
10 Deceleration 4 -0.69 70-50 8 8 119 4 s.5 + 4 s.4
11 Steady speed 5 50 69 69 188 4
12 Acceleration 6 0.43 50-70 13 13 201 4
13 Steady speed 7 70 50 50 251 5
14 Acceleration 8 0.24 70-100 35 35 286 5
15 Steady speed (2) 9 100 30 30 316 5 (2)
16 Acceleration (2) 10 0.28 100-120 20 20 336 5 (2)
17 Steady speed (2) 11 120 10 20 346 5 (2)
18 Deceleration (2) -0.69 120-80 16 34 362 5 (2)
19 Deceleration (2) -1.04 80-50 8 370 5 (2)
20 Deceleration, clutch disengaged
12
1.39 50-0 10
380 K5 (1)
21 Idle 13 20 20 400 PM (1)
(1) PM = gearbox on neutral, clutch engaged. K1,K5 = first or second gear engaged, clutch disengaged (2) Additional gears can be used according to manufacturer recommendations if the vehicle is equipped with a transmission with more
than five gears.
1 June 2004
24
TABLE 3 - SIMULATED INERTIA AND DYNO LOADING REQUIREMENTS
Reference mass of vehicle RW(kg)
Equivalent inertia
Power and load absorbed by the dynamometer at 80 km/h
Road Load Coefficients
kg kW N a (N)
b(N/kph) RW ≤ 480
455 3.8 171 3.8
0.0261
480 < RW ≤ 540
510 4.1 185 4.2
0.0282
540 < RW ≤ 595
570 4.3 194 4.4
0.0296
595 < RW ≤ 650
625 4.5 203 4.6
0.0309
650 < RW ≤ 710
680 4.7 212 4.8
0.0323
710 < RW ≤ 765
740 4.9 221 5.0
0.0337
765 < RW ≤ 850
800 5.1 230 5.2
0.0351
850 < RW ≤ 965
910 5.6 252 5.7
0.0385
965 < RW ≤ 1080 1020 6.0 270
6.1
0.0412
1080 < RW ≤ 1190
1130 6.3 284 6.4
0.0433
1190 < RW ≤ 1305
1250 6.7 302 6.8
0.0460
1305 < RW ≤ 1420
1360 7.0 315 7.1
0.0481
1420 < RW ≤ 1530
1470 7.3 329 7.4
0.0502
1530 < RW ≤ 1640
1590 7.5 338 7.6 0.0515
1640 < RW ≤ 1760
1700 7.8 351 7.9
0.0536
1760 < RW ≤ 1870
1810 8.1 365 8.2
0.0557
1870 < RW ≤ 1980
1930 8.4 378 8.5
0.0577
1980 < RW ≤ 2100
2040 8.6 387 8.7
0.0591
2100 < RW ≤ 2210
2150 8.8 396 8.9
0.0605
2210 < RW ≤ 2380
2270 9.0 405 9.1
0.0619
2380 < RW ≤ 2610
2270 9.4 423 9.5
0.0646
2610 < RW
2270 9.8 441 9.9
0.0674
1 June 2004
25
Figure 1
Operating cycle for the Type I test
Elem
e nta
ry u
rban
cyc
le
Part
One
Part
Two
195
195
195
195
400
1180
Tim
e (s
)010203040506070809 010
0
110
1 20
Spee
d ( k
m/h
)
BS
ES
BS:
Beg
inni
ng o
f sam
plin
g, e
n gin
e st
art
ES: E
nd o
f sam
plin
g
1 June 2004
26
Figure 2
Elementary urban cycle for the Type I test
114
82
321
52
524
83
215
29
28
128
1 32
73
7
114
85
2112
2411
2126
128
1312
7
1
1
1
11
1
2
2
2
2
2
3
3
3
3
K1
K1
K1
K1
K2 PM
PMPM
RR
RR
K2
K
K
KK
050
100
200
150
23
4
156
78
910
1112
1314
1516
1718
1920
2122
2324
25
204060V k
m/h
10 k
m/h
15 k
m/h
32 k
m/h
35 k
m/h
50 k
m/h
KEY
1 =
first
ge a
r
K =
dec
lutc
hing
PM =
neu
tral
K
K
= de
clut
chin
g,
f
irst o
r sec
ond
gear
en g
aged
12 2
= se
cond
gea
r
R =
idlin
g
3 =
third
gea
r
= ge
ar c
hang
ing
= sp
eed
(± 2
km
/h) a
ndt im
e (±
1.0
seco
nds)
tole
ranc
esar
e co
mbi
ned
geom
etric
ally
for e
ach
poin
t as s
how
n i n
the
inse
t
12
34
5
t (s)
12345
V (k
m/h
)
Theoret
ical g
raph
of cycle
+1 s
-1 s
- 2 km/h+ 2 km/h
END OF CYCLE: 195 seconds
Parti
al p
hase
t im
es
S equ
ence
num
bers
Sequ
e nce
tim
es
Seco
nds
1 June 2004
27
Figure 3
Extra-urban cycle (Part Two) for the Type I test
1
2
3
4
5
6
7
8
9
10
11
12
13
14
15
16
17
18
19
20
210102030405060708090100
110
120
050
100
150
200
250
300
350
400
Op e
ratio
n nu
mbe
r
Spee
d (k
m/h
)
Tim
e (s
)

1 June 2004
28
APPENDIX 1 - CHASSIS DYNAMOMETER SYSTEM
1. Specification
1.1. General Requirements
1.1.1. The dynamometer shall be capable of simulating road load within one of the following classifications:
dynamometer with fixed load curve, i.e. a dynamometer whose physical characteristics provide a fixed load curve shape,
dynamometer with adjustable load curve, i.e. a dynamometer with at least two road load parameters that can be adjusted to shape the load curve.
1.1.2. Dynamometers with electric inertia simulation shall be demonstrated to be equivalent to mechanical inertia systems. The means by which equivalence is established are described in Appendix 6 to this Annex.
1.1.3. In the event that the total resistance to progress on the road cannot be reproduced on the chassis dynamometer between speeds of 10 km/h and 120 km/h, it is recommended that a chassis dynamometer having the characteristics defined below should be used
1.1.3.1. The load absorbed by the brake and the chassis dynamometer internal frictional effects between the speeds of 0 and 120 km/h is as follows:
F = (a + b.V2) ± 0.1.F80 (without being negative) where: F = total load absorbed by the chassis dynamometer (N) a = value equivalent to rolling resistance (N)
b = value equivalent to coefficient of air resistance (N/(km/h)2) V = speed (km/h) F80 = load at 80 km/h (N).
1.2. Specific Requirements
1.2.1. The setting of the dynamometer shall not be affected by the lapse of time. It shall not produce any vibrations perceptible to the vehicle and likely to impair the vehicle's normal operations.
1.2.2. The chassis dynamometer may have one or two rollers. The front roller shall drive, directly or indirectly, the inertial masses and the power absorption device.
1.2.3. It shall be possible to measure and read the indicated load to an accuracy of ± 5 per cent.

1 June 2004
29
1.2.4. In the case of a dynamometer with a fixed load curve, the accuracy of the load setting at 80 km/h shall be ± 5 per cent. In the case of a dynamometer with adjustable load curve, the accuracy of matching dynamometer load to road load shall be ± 5 per cent at 120, 100, 80, 60, and 40 km/h and ± 10 per cent at 20 km/h. Below this, dynamometer absorption shall be positive.
1.2.5. The total inertia of the rotating parts (including the simulated inertia where applicable) shall be known and shall be within ± 20 kg of the inertia class for the test.
1.2.6. The speed of the vehicle shall be measured by the speed of rotation of the roller (the front roller in the case of a two-roller dynamometer). It shall be measured with an accuracy of ± 1 km/h at speeds above 10 km/h.
The distance actually driven by the vehicle shall be measured by the movement of rotation of the roller (the front roller in the case of a two-roller dynamometer).
2. Dynamometer Calibration Procedure
2.1. Introduction
This section describes the method to be used to determine the load absorbed by a dynamometer brake. The load absorbed comprises the load absorbed by frictional effects and the load absorbed by the power-absorption device. The dynamometer is brought into operation beyond the range of test speeds. The device used for starting up the dynamometer is then disconnected: the rotational speed of the driven roller decreases. The kinetic energy of the rollers is dissipated by the power-absorption unit and by the frictional effects. This method disregards variations in the roller's internal frictional effects caused by rollers with or without the vehicle. The frictional effects of the rear roller shall be disregarded when the roller is free.
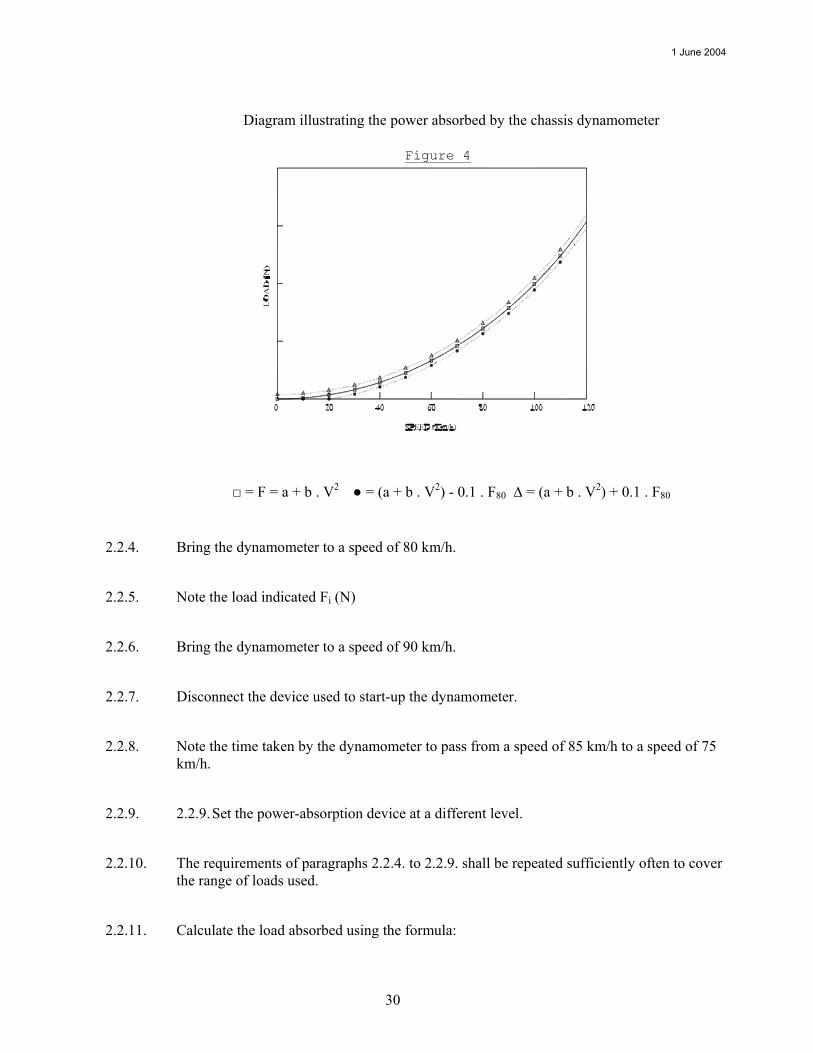
2.2. Calibration of the load indicator at 80 km/h
The following procedure shall be used for calibration of the load indicator to 80 km/h as a function of the load absorbed (see also Figure 4):
2.2.1. Measure the rotational speed of the roller if this has not already been done. A fifth wheel, a revolution counter or some other method may be used.
2.2.2. Place the vehicle on the dynamometer or devise some other method of starting-up the dynamometer.
2.2.3. Use the flywheel or any other system of inertia simulation for the particular inertia class to be used.
1 June 2004
30
Diagram illustrating the power absorbed by the chassis dynamometer
□ = F = a + b . V2 ● = (a + b . V2) - 0.1 . F80 ∆ = (a + b . V2) + 0.1 . F80
2.2.4. Bring the dynamometer to a speed of 80 km/h.
2.2.5. Note the load indicated Fi (N)
2.2.6. Bring the dynamometer to a speed of 90 km/h.
2.2.7. Disconnect the device used to start-up the dynamometer.
2.2.8. Note the time taken by the dynamometer to pass from a speed of 85 km/h to a speed of 75 km/h.
2.2.9. 2.2.9. Set the power-absorption device at a different level.
2.2.10. The requirements of paragraphs 2.2.4. to 2.2.9. shall be repeated sufficiently often to cover the range of loads used.
2.2.11. Calculate the load absorbed using the formula:
Figure 4
1 June 2004
31
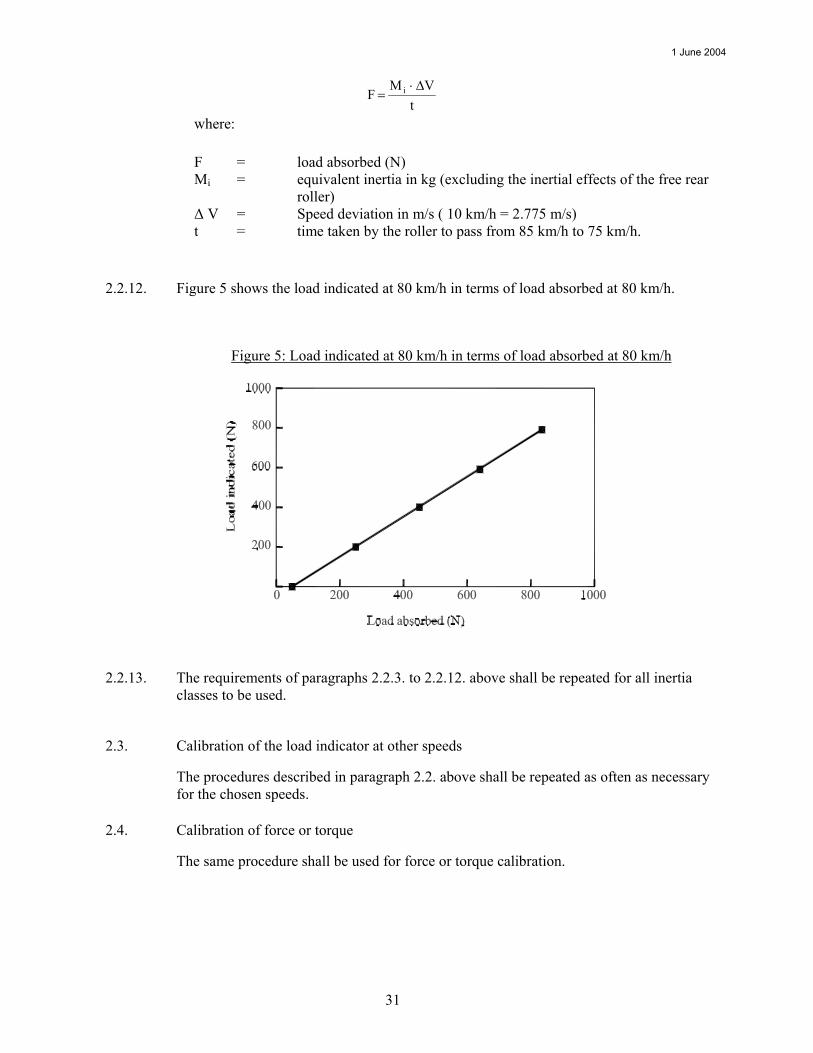
t
VMF i ∆⋅=
where:
F = load absorbed (N) Mi = equivalent inertia in kg (excluding the inertial effects of the free rear
roller) ∆ V = Speed deviation in m/s ( 10 km/h = 2.775 m/s) t = time taken by the roller to pass from 85 km/h to 75 km/h.
2.2.12. Figure 5 shows the load indicated at 80 km/h in terms of load absorbed at 80 km/h.
Figure 5: Load indicated at 80 km/h in terms of load absorbed at 80 km/h
2.2.13. The requirements of paragraphs 2.2.3. to 2.2.12. above shall be repeated for all inertia classes to be used.
2.3. Calibration of the load indicator at other speeds
The procedures described in paragraph 2.2. above shall be repeated as often as necessary for the chosen speeds.
2.4. Calibration of force or torque
The same procedure shall be used for force or torque calibration.
1 June 2004
32
3. Verification of the Load Curve
3.1. Procedure
The load-absorption curve of the dynamometer from a reference setting at a speed of 80 km/h shall be verified as follows:
3.1.1. Place the vehicle on the dynamometer or devise some other method of starting-up the dynamometer.
3.1.2. Adjust the dynamometer to the absorbed load (F) at 80 km/h.
3.1.3. Note the load absorbed at 120, 100, 80, 60, 40 and 20 km/h.
3.1.4. Draw the curve F(V) and verify that it corresponds to the requirements of paragraph 1.1.3.1. of this appendix.
3.1.5. Repeat the procedure set out in paragraphs 3.1.1. to 3.1.4. above for other values of power F at 80 km/h and for other values of inertias.
_____________

1 June 2004
33
APPENDIX 2 - EXHAUST DILUTION SYSTEM
1. System Specification
1.1. System Overview
A full-flow exhaust dilution system shall be used. This requires that the vehicle exhaust be continuously diluted with ambient air under controlled conditions. The total volume of the mixture of exhaust and dilution air shall be measured and a continuously proportional sample of the volume shall be collected for analysis. The quantities of pollutants are determined from the sample concentrations, corrected for the pollutant content of the ambient air and the totalised flow over the test period.
The exhaust dilution system shall consist of a transfer tube, a mixing chamber and dilution tunnel, a dilution air conditioning, a suction device and a flow measurement device. Sampling probes shall be fitted in the dilution tunnel as specified in Appendices 3, 4 and 5.
The mixing chamber described above will be a vessel, such as that illustrated in Figure 7, in which vehicle exhaust gases and the dilution air are combined so as to produce a homogeneous mixture at the chamber outlet.
1.2. General Requirements
1.2.1. The vehicle exhaust gases shall be diluted with a sufficient amount of ambient air to prevent any water condensation in the sampling and measuring system at all conditions which may occur during a test.
1.2.2. The mixture of air and exhaust gases shall be homogeneous at the point where the sampling probe is located (see paragraph 1.3.3. below). The sampling probe shall extract a representative sample of the diluted exhaust gas.
1.2.3. The system shall enable the total volume of the diluted exhaust gases to be measured.
1.2.4. The sampling system shall be gas-tight. The design of the variable-dilution sampling system and the materials that go to make it up shall be such that they do not affect the pollutant concentration in the diluted exhaust gases. Should any component in the system (heat exchanger, cyclone separator, blower, etc.) change the concentration of any of the pollutants in the diluted exhaust gases and the fault cannot be corrected, then sampling for that pollutant shall be carried out upstream from that component.
1.2.5. All parts of the dilution system that are in contact with raw and diluted exhaust gas, shall be designed to minimise deposition or alteration of the particulates or particles. All parts shall be made of electrically conductive materials that do not react with exhaust gas components, and shall be electrically grounded to prevent electrostatic effects.
1 June 2004
34
1.2.6. If the vehicle being tested is equipped with an exhaust pipe comprising several branches, the connecting tubes shall be connected as near as possible to the vehicle without adversely affecting its operation.
1.2.7. The variable-dilution system shall be so designed as to enable the exhaust gases to be sampled without appreciably changing the back-pressure at the exhaust pipe outlet.
1.2.8. The connecting tube between the vehicle and dilution system shall be designed so as to minimise heat loss.
1.3. Specific Requirements
1.3.1. Connection to Vehicle Exhaust
The connecting tube between the vehicle exhaust outlets and the dilution system shall be as short as possible; and satisfy the following requirements:
(i) be less than 3.6 m long, or less than 6.1 m long if heat insulated. Its internal diameter may not exceed 105 mm.
(ii) shall not cause the static pressure at the exhaust outlets on the vehicle being
tested to; differ by more than ± 0.75 kPa at 50 km/h, or more than ± 1.25 kPa for the whole duration of the test from the static pressures recorded when nothing is connected to the vehicle exhaust outlets. The pressure shall be measured in the exhaust outlet or in an extension having the same diameter, as near as possible to the end of the pipe. Sampling systems capable of maintaining the static pressure to within ± 0.25 kPa may be used if a written request from a manufacturer to the Technical Service substantiates the need for the closer tolerance.
(iii) shall not change the nature of the exhaust gas. (iv) any elastomer connectors employed shall be as thermally stable as possible
and have minimum exposure to the exhaust gases
1 June 2004
35
1.3.2. Dilution Air Conditioning
It is recommended that the dilution air used for the primary dilution of the exhaust in the CVS tunnel shall be first charcoal scrubbed and then passed through a secondary filter. The secondary filter should be capable of reducing particles in the most penetrating particle size of the filter material by at least 99.95 per cent, or through a filter of at least class H13 of EN 1822; this represents the specification of High Efficiency Particulate Air (HEPA) filters.
At the vehicle manufacturer’s request, the dilution air may be sampled according to good engineering practice to determine the tunnel contribution to background particulate mass levels, which can then be subtracted from the values measured in the diluted exhaust.
1.3.3. Dilution Tunnel
Provision shall be made for the vehicle exhaust gases and the dilution air to be mixed. A mixing orifice may be used In order to minimise the effects on the conditions at the exhaust outlet and to limit the drop in pressure inside the dilution-air conditioning device, if any, the pressure at the mixing point shall not differ by more than ±0.25 kPa from atmospheric pressure. The homogeneity of the mixture in any cross-section at the location of the sampling probe shall not vary by more than ±2 per cent from the average of the values obtained for at least five points located at equal intervals on the diameter of the gas stream. For particulate and particle emissions sampling, a dilution tunnel shall be used which: - shall consist of a straight tube of electrically-conductive material, which shall be
earthed; - shall be small enough in diameter to cause turbulent flow (Reynolds number ≥4000)
and of sufficient length to cause complete mixing of the exhaust and dilution air; - shall be at least 200 mm in diameter; - may be insulated
1.3.4. Suction Device
This device may have a range of fixed speeds as to ensure sufficient flow to prevent any water condensation. This result is generally obtained if the flow is either:
(i) twice as high as the maximum flow of exhaust gas produced by accelerations of the driving cycle, or
(ii) sufficient to ensure that the CO2 concentration in the dilute-exhaust sample
bag is less than 3 per cent by volume for petrol and diesel, less than 2.2 per cent by volume for LPG and less than 1.5 per cent by volume for NG.
1 June 2004
36
1.3.5. Volume Measurement in the Primary Dilution System
The method of measuring total dilute exhaust volume incorporated in the constant volume sampler shall be such that measurement is accurate to ± 2 per cent under all operating conditions. If the device cannot compensate for variations in the temperature of the mixture of exhaust gases and dilution air at the measuring point, a heat exchanger shall be used to maintain the temperature to within ±6 K of the specified operating temperature. If necessary, a cyclone separator may be used to protect the volume measuring device. A temperature sensor shall be installed immediately before the volume measuring device. This temperature sensor shall have an accuracy and a precision of ±1 K and a response time of 0.1 s at 62 per cent of a given temperature variation (value measured in silicone oil). The measurement of the pressure difference from atmospheric pressure shall be taken upstream from and, if necessary, downstream from the volume measuring device. The pressure measurements shall have a precision and an accuracy of ±0.4 kPa during the test.
1.4. Recommended System Descriptions
Figure 6 and Figure 7 are schematic drawings of two types of recommended exhaust dilution systems that meet the requirements of this Annex. Since various configurations can produce accurate results, exact conformity with these figures is not essential. Additional components such as instruments, valves, solenoids and switches may be used to provide additional information and co-ordinate the functions of the component system.
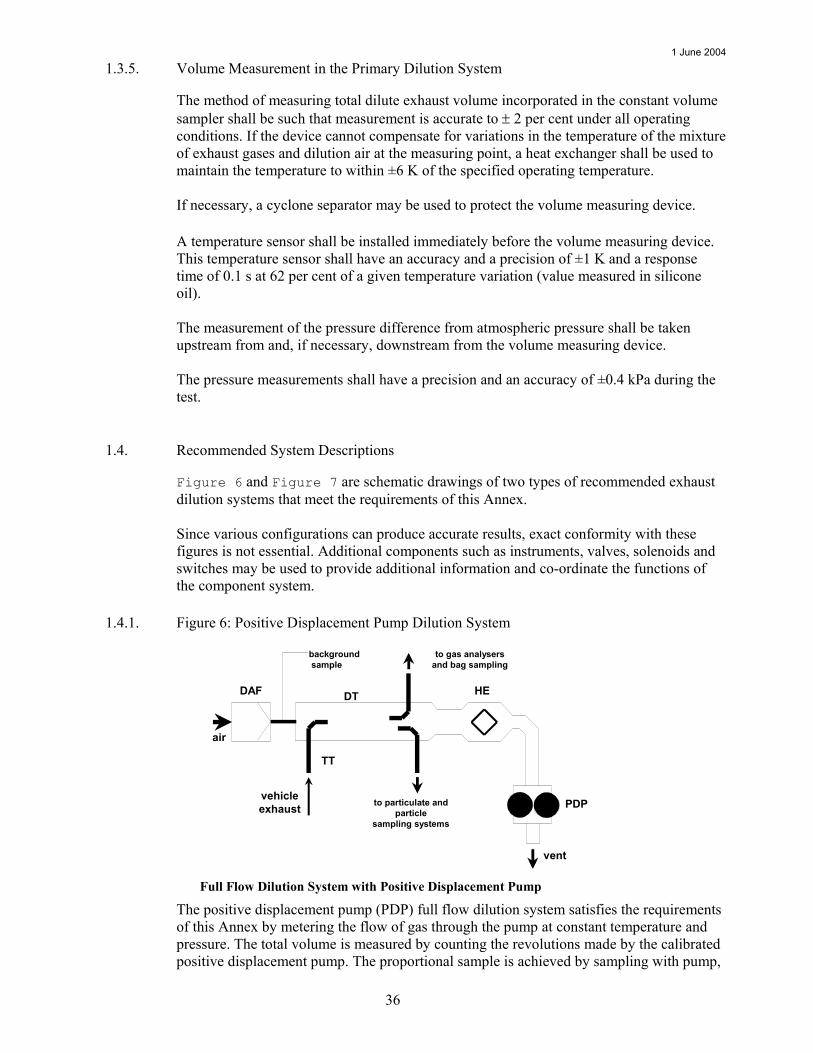
1.4.1. Figure 6: Positive Displacement Pump Dilution System
DAF HE
PDP
TT
air
vehicle exhaust
background sample
vent
to particulate and particle
sampling systems
to gas analysers and bag sampling
DT
Full Flow Dilution System with Positive Displacement Pump The positive displacement pump (PDP) full flow dilution system satisfies the requirements
of this Annex by metering the flow of gas through the pump at constant temperature and pressure. The total volume is measured by counting the revolutions made by the calibrated positive displacement pump. The proportional sample is achieved by sampling with pump,
1 June 2004
37
flow-meter and flow control valve at a constant flow rate. The collecting equipment consists of:
1.4.1.1. A filter (DAF) for the dilution air, which can be preheated if necessary. This filter shall consist of activated charcoal sandwiched between two layers of paper, and shall be used to reduce and stabilise the hydrocarbon concentrations of ambient emissions in the dilution air;
1.4.1.2. A transfer tube (TT) by which vehicle exhaust is admitted into a dilution tunnel (DT) in which the exhaust gas and dilution air are mixed homogeneously;
1.4.1.3. The positive displacement pump (PDP), producing a constant-volume flow of the air/exhaust-gas mixture. The PDP revolutions, together with associated temperature and pressure measurement are used to determine the flowrate;
1.4.1.4. A heat exchanger (HE) of a capacity sufficient to ensure that throughout the test the temperature of the air/exhaust-gas mixture measured at a point immediately upstream of the positive displacement pump is within 6 K of the average operating temperature during the test. This device shall not affect the pollutant concentrations of diluted gases taken off after for analysis.
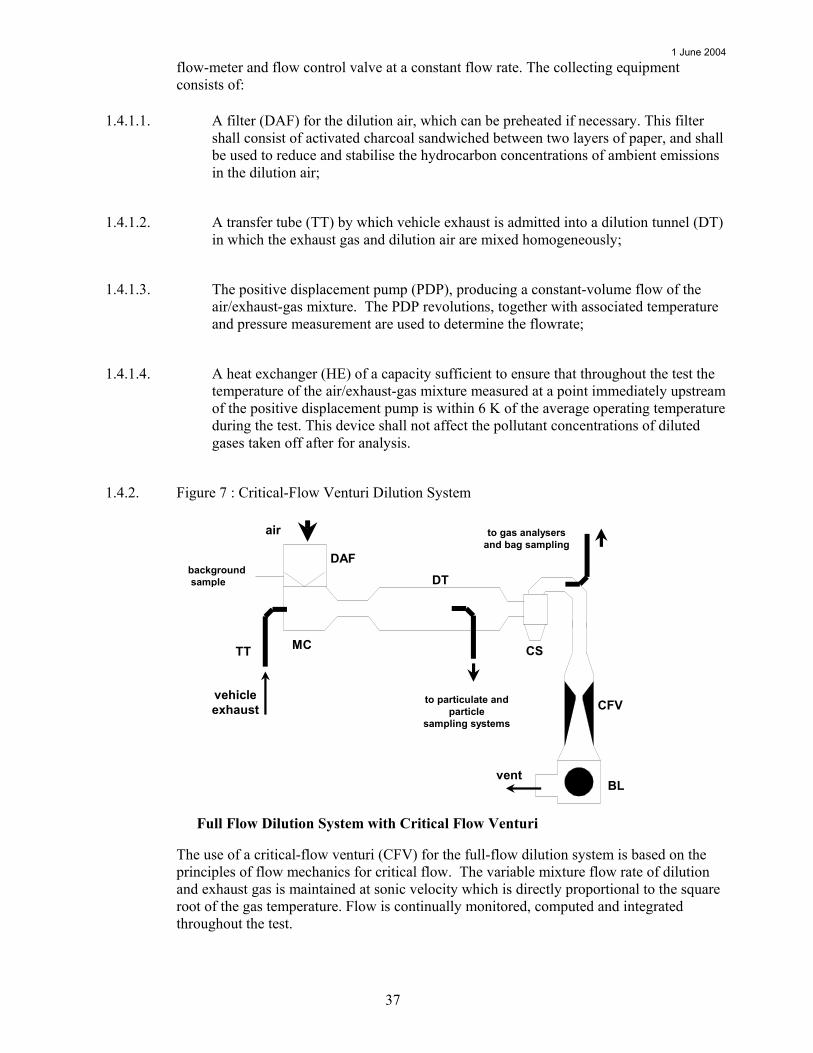
1.4.2. Figure 7 : Critical-Flow Venturi Dilution System
DAF
TT
air
vehicle exhaust
background sample
to particulate and particle
sampling systems
to gas analysers and bag sampling
DT
CFV
MC
vent BL
CS
Full Flow Dilution System with Critical Flow Venturi
The use of a critical-flow venturi (CFV) for the full-flow dilution system is based on the principles of flow mechanics for critical flow. The variable mixture flow rate of dilution and exhaust gas is maintained at sonic velocity which is directly proportional to the square root of the gas temperature. Flow is continually monitored, computed and integrated throughout the test.

1 June 2004
38
The use of an additional critical-flow sampling venturi ensures the proportionality of the gas samples taken from the dilution tunnel. As both pressure and temperature are equal at the two venturi inlets the volume of the gas flow diverted for sampling is proportional to the total volume of diluted exhaust-gas mixture produced, and thus the requirements of this annex are met. The collecting equipment consists of:
1.4.2.1. A filter (DAF) for the dilution air, which can be preheated if necessary. This filter shall consist of activated charcoal sandwiched between two layers of paper, and shall be used to reduce and stabilise the hydrocarbon concentrations of ambient emissions in the dilution air;
1.4.2.2. A mixing chamber (MC) in which exhaust gas and air are mixed homogeneously, and which may be located close to the vehicle so that the length of the transfer tube (TT) is minimised;
1.4.2.3. A dilution tunnel (DT) from which particulates and particles are sampled;
1.4.2.4. A cyclone separator (CS), to extract particles;
1.4.2.5. A measuring critical-flow venturi tube (CFV), to measure the flow volume of the diluted exhaust gas;
1.4.2.6. A blower (BL), of sufficient capacity to handle the total volume of diluted exhaust gas.
2. CVS Calibration Procedure
2.1. General Requirements
The CVS system shall be calibrated by using an accurate flow-meter and a restricting device. The flow through the system shall be measured at various pressure readings and the control parameters of the system measured and related to the flows. The flow-metering device shall be dynamic and suitable for the high flow-rate encountered in constant volume sampler testing. The device shall be of certified accuracy traceable to an approved national or international standard.
2.1.1. Various types of flow-meter may be used, e.g. calibrated venturi, laminar flow-meter, calibrated turbine-meter, provided that they are dynamic measurement systems and can meet the requirements of paragraph 1.3.5 of this Appendix.
2.1.2. The following paragraphs give details of methods of calibrating PDP and CFV units, using a laminar flow-meter, which gives the required accuracy, together with a statistical check on the calibration validity.
1 June 2004
39
2.2. Calibration of the positive displacement pump (PDP)
2.2.1. The following calibration procedure outlines the equipment, the test configuration and the various parameters that are measured to establish the flow-rate of the CVS pump. All the parameters related to the pump are simultaneously measured with the parameters related to the flow-meter which is connected in series with the pump. The calculated flow-rate (given in m3/min. at pump inlet, absolute pressure and temperature) can then be plotted versus a correlation function that is the value of a specific combination of pump parameters. The linear equation that relates the pump flow and the correlation function is then determined. In the event that a CVS has a multiple speed drive, a calibration for each range used shall be performed.
2.2.2. This calibration procedure is based on the measurement of the absolute values of the pump and flow-meter parameters that relate the flow rate at each point. Three conditions shall be maintained to ensure the accuracy and integrity of the calibration curve:
2.2.2.1. The pump pressures shall be measured at tappings on the pump rather than at the external piping on the pump inlet and outlet. Pressure taps that are mounted at the top centre and bottom centre of the pump drive headplate are exposed to the actual pump cavity pressures, and therefore reflect the absolute pressure differentials;
2.2.2.2. Temperature stability shall be maintained during the calibration. The laminar flow-meter is sensitive to inlet temperature oscillations which cause the data points to be scattered. Gradual changes of ±1 K in temperature are acceptable as long as they occur over a period of several minutes;
2.2.2.3. All connections between the flow-meter and the CVS pump shall be free of any leakage.
2.2.3. During an exhaust emission test, the measurement of these same pump parameters enables the user to calculate the flow rate from the calibration equation.
2.2.4. Figure 8 of this appendix shows one possible test set-up. Variations are permissible, provided that the Technical Service approves them as being of comparable accuracy. If the set-up shown in Figure A2.3, is used, the following data shall be found within the limits of precision given:
barometric pressure (corrected)(Pb) ± 0.03 kPa ambient temperature (T) ± 0.2 K air temperature at LFE (ETI) ± 0.15 K pressure depression upstream of LFE (EPI) ± 0.01 kPa pressure drop across the LFE matrix (EDP) ± 0.0015 kPa

1 June 2004
40
air temperature at CVS pump inlet (PTI) ± 0.2 K air temperature at CVS pump outlet (PTO) ± 0.2 K pressure depression at CVS pump inlet (PPI) ± 0.22 kPa pressure head at CVS pump outlet (PPO) ± 0.22 kPa pump revolutions during test period (n) ± 1 1/min elapsed time for period (minimum 250 s) (t) ± 0.1 s
Figure 8: PDP Calibration Configuration
123456
654321
PTI
PTO
Temperatureindicator
Revolutionselapsed time
nt
PTI
PPO
Surge controlvalve (snubber)
Manometer
Variable-flowrestrictor
LFEETI
Filter
EPI EDP
543210
2.2.5. After the system has been connected as shown in Figure A2.3 of this appendix, set the variable restrictor in the wide-open position and run the CVS pump for 20 minutes before starting the calibration.
2.2.6. Reset the restrictor valve to a more restricted condition in an increment of pump inlet depression (about 1 kPa) that will yield a minimum of six data points for the total calibration. Allow the system to stabilise for three minutes and repeat the data acquisition.
2.2.7. The air flow rate (Qs) at each test point is calculated in standard m3/min. from the flow-meter data using the manufacturer's prescribed method.
2.2.8. The air flow-rate is then converted to pump flow (V0) in m3/rev at absolute pump inlet temperature and pressure.
1 June 2004
41
p
ps0 P
33.1012.273
Tn
QV ⋅⋅=
where:
V0 = pump flow rate at Tp and Pp (m3/rev),
Qs = air flow at 101.33 kPa and 273.2 K (m3/min),
Tp = pump inlet temperature (K),
Pp = absolute pump inlet pressure (kPa),
N = pump speed (min-1).
2.2.9. To compensate for the interaction of pump speed pressure variations at the pump and the pump slip rate, the correlation function (x0) between the pump speed (n), the pressure differential from pump inlet to pump outlet and the absolute pump outlet pressure is then calculated as follows:
e
p0 P
Pn1x
∆=
where:
x0 = correlation function,
∆Pp = pressure differential from pump inlet to pump outlet (kPa).
Pe = absolute outlet pressure (PPO + Pb)(kPa).
A linear least-square fit is performed to generate the calibration equations which have the formulae:
V0 = D0 - M (x0)
n = A - B (∆Pp)
D0, M, A and B are the slope-intercept constants describing the lines.
2.2.10. A CVS system that has multiple speeds shall be calibrated on each speed used. The calibration curves generated for the ranges shall be approximately parallel and the intercept values (D0) shall increase as the pump flow range decreases.
2.2.11. If the calibration has been performed carefully, the calculated values from the equation will be within 0.5 per cent of the measured value of V0. Values of M will vary from one pump to another. Calibration is performed at pump start-up and after major maintenance.

1 June 2004
42
2.3. Calibration of the critical-flow venturi (CFV)
2.3.1. Calibration of the CFV is based upon the flow equation for a critical venturi:
TPK
Q vs =
where:
Qs = flow,
Kv = calibration coefficient,
P = absolute pressure (kPa),
T = absolute temperature (K).
Gas flow is a function of inlet pressure and temperature.
The calibration procedure described below establishes the value of the calibration coefficient at measured values of pressure, temperature and air flow.
2.3.2. The manufacturer's recommended procedure shall be followed for calibrating electronic portions of the CFV.
2.3.3. Measurements for flow calibration of the critical flow venturi are required and the following data shall be found within the limits of precision given:
barometric pressure (corrected) (Pb) ± 0.03 kPa,
LFE air temperature, flow-meter (ETI) ± 0.15 K,
pressure depression upstream of LFE (EPI) ± 0.01 kPa,
pressure drop across (EDP) LFE matrix ± 0.0015 kPa,
air flow (Qs) ± 0.5 per cent,
CFV inlet depression (PPI) ± 0.02 kPa,
temperature at venturi inlet (Tv) ± 0.2 K.
2.3.4. The equipment shall be set up as shown in Figure 9 of this appendix and checked for leaks. Any leaks between the flow-measuring device and the critical-flow venturi will seriously affect the accuracy of the calibration.
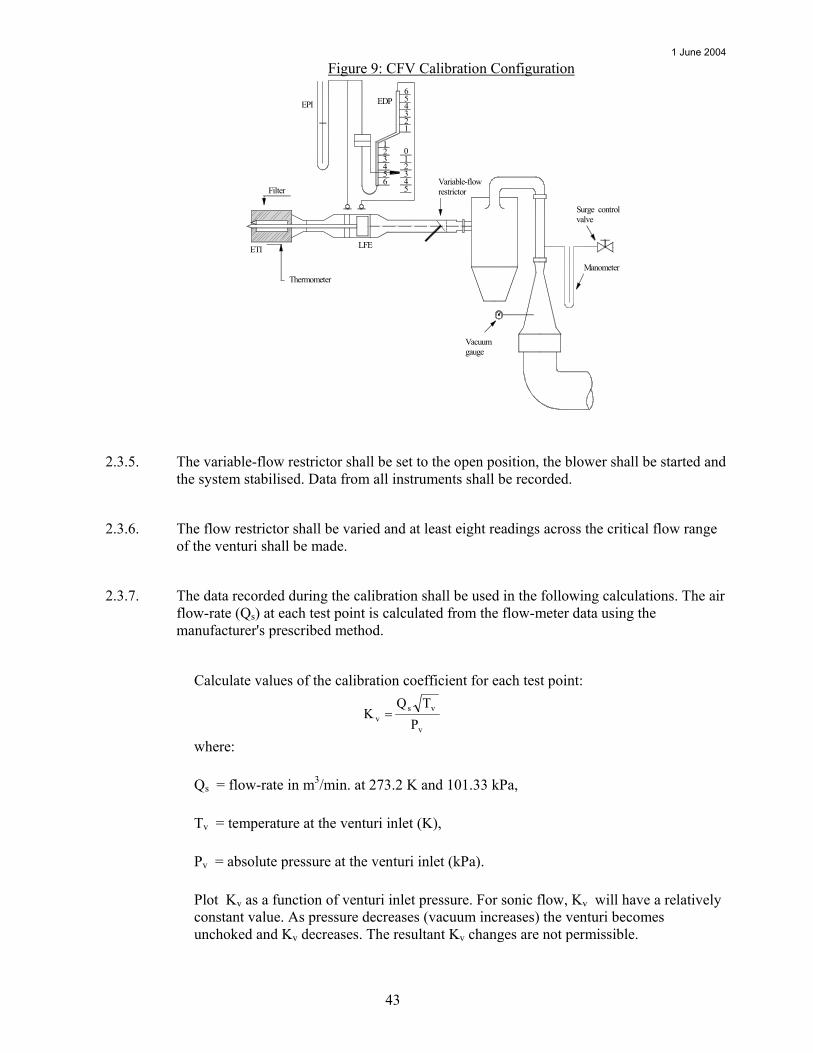
1 June 2004
43
Figure 9: CFV Calibration Configuration
123456
654321
Thermometer
Vacuumgauge
Surge controlvalve
Manometer
Variable-flowrestrictor
LFEETI
Filter
EPI EDP
543210
2.3.5. The variable-flow restrictor shall be set to the open position, the blower shall be started and the system stabilised. Data from all instruments shall be recorded.
2.3.6. The flow restrictor shall be varied and at least eight readings across the critical flow range of the venturi shall be made.
2.3.7. The data recorded during the calibration shall be used in the following calculations. The air flow-rate (Qs) at each test point is calculated from the flow-meter data using the manufacturer's prescribed method.
Calculate values of the calibration coefficient for each test point:
v
vsv P
TQK =
where:
Qs = flow-rate in m3/min. at 273.2 K and 101.33 kPa,
Tv = temperature at the venturi inlet (K),
Pv = absolute pressure at the venturi inlet (kPa).
Plot Kv as a function of venturi inlet pressure. For sonic flow, Kv will have a relatively constant value. As pressure decreases (vacuum increases) the venturi becomes unchoked and Kv decreases. The resultant Kv changes are not permissible.

1 June 2004
44
For a minimum of eight points in the critical region, calculate an average Kv and the standard deviation.
If the standard deviation exceeds 0.3 per cent of the average Kv, take corrective action.
3. System Verification Procedure
3.1. General Requirements
The total accuracy of the CVS sampling system and analytical system shall be determined by introducing a known mass of a pollutant gas into the system whilst it is being operated as if during a normal test and then analysing and calculating the pollutant mass according to the formulae in Section 4.6 of Annex 4 except that the density of propane shall be taken as 1.967 grams per litre at standard conditions. The following two techniques are known to give sufficient accuracy. The maximum permissible deviation between the quantity of gas introduced and the quantity of gas measured is 5 per cent.
3.2. CFO Method
3.2.1. Metering a constant flow of pure gas (CO or C3H8) using a critical flow orifice device
3.2.2. A known quantity of pure gas (CO or C3H8) is fed into the CVS system through the calibrated critical orifice. If the inlet pressure is high enough, the flow-rate (q), which is adjusted by means of the critical flow orifice, is independent of orifice outlet pressure (critical flow). If deviations exceeding 5 per cent occur, the cause of the malfunction shall be determined and corrected. The CVS system is operated as in an exhaust emission test for about 5 to 10 minutes. The gas collected in the sampling bag is analysed by the usual equipment and the results compared to the concentration of the gas samples which was known beforehand.
3.3. Gravimetric Method
3.3.1. Metering a limited quantity of pure gas (CO or C3H8) by means of a gravimetric technique
3.3.2. The following gravimetric procedure may be used to verify the CVS system.
The weight of a small cylinder filled with either carbon monoxide or propane is determined with a precision of ±0.01 g. For about 5 to 10 minutes, the CVS system is operated as in a normal exhaust emission test, while CO or propane is injected into the system. The quantity of pure gas involved is determined by means of differential weighing. The gas accumulated in the bag is then analysed by means of the equipment normally used for exhaust-gas analysis. The results are then compared to the concentration figures computed previously.
_____________

1 June 2004
45
1 June 2004
46
APPENDIX 3 - GASEOUS EMISSIONS MEASUREMENT EQUIPMENT
1. Specification
1.1. System Overview
A continuously proportional sample of the diluted exhaust gases and the dilution air shall be collected for analysis. Mass gaseous emissions shall be determined from the proportional sample concentrations and the total volume measured during the test. The sample concentrations shall be corrected to take account of the pollutant content of the ambient air.
1.2. Sampling System Requirements
1.2.1. The sample of dilute exhaust gases shall be taken upstream from the suction device but downstream from the conditioning devices (if any).
1.2.2. The flow rate shall not deviate from the average by more than ± 2 per cent.
1.2.3. The sampling rate shall not fall below 5 litres per minute and shall not exceed 0.2 per cent of the flow rate of the dilute exhaust gases. An equivalent limit shall apply to constant-mass sampling systems.
1.2.4. A sample of the dilution air shall be taken at a constant flow rate near the ambient air-inlet (after the filter if one is fitted).
1.2.5. The dilution air sample shall not be contaminated by exhaust gases from the mixing area.
1.2.6. The sampling rate for the dilution air shall be comparable to that used in the case of the dilute exhaust gases.
1.2.7. The materials used for the sampling operations shall be such as not to change the pollutant concentration.
1.2.8. Filters may be used in order to extract the solid particles from the sample.
1.2.9. The various valves used to direct the exhaust gases shall be of a quick-adjustment, quick-acting type.
1.2.10. Quick-fastening gas-tight connections may be used between the three-way valves and the sampling bags, the connections sealing themselves automatically on the bag side. Other
1 June 2004
47
systems may be used for conveying the samples to the analyser (three-way stop valves, for example).
1.2.11. Storage of the sample
The gas samples shall be collected in sampling bags of sufficient capacity not to impede the sample flow; the bag material shall be such as to affect neither the measurements themselves nor the chemical composition of the gas samples by more than ± 2 per cent after 20 minutes. (for instance: laminated polyethylene/polyamide films, or fluorinated polyhydrocarbons);
1.2.12. Hydrocarbon Sampling System – Diesel Engines
1.2.12.1. The hydrocarbon sampling system shall consist of a heated sampling probe, line, filter and pump. The sampling probe shall be installed at the same distance from the exhaust gas inlet as the particulate sampling probe, in such a way that neither interferes with samples taken by the other. It shall have a minimum internal diameter of 4 mm.
1.2.12.2. All heated parts shall be maintained at a temperature of 463 K (190 °C) ± 10 K by the heating system.
1.2.12.3. The average concentration of the measured hydrocarbons shall be determined by integration.
1.2.12.4. The heated sampling line shall be fitted with a heated filter (FH) 99 per cent efficient with particles ≥ 0.3 µm, to extract any solid particles from the continuous flow of gas required for analysis.
1.2.12.5. The sampling system response time (from the probe to the analyser inlet) shall be no more than four seconds.
1.2.12.6. The HFID shall be used with a constant flow (heat exchanger) system to ensure a representative sample, unless compensation for varying CFV or CFO flow is made.
1.3. Gas Analysis Requirements
1.3.1. Carbon monoxide (CO) and carbon dioxide (CO2) analyses:
Analysers shall be of the non-dispersive infra-red (NDIR) absorption type.
1.3.2. Hydrocarbons (HC) analysis - spark-ignition engines:
The analyser shall be of the flame ionisation (FID) type calibrated with propane gas expressed equivalent to carbon atoms (C1).
1 June 2004
48
1.3.3. Hydrocarbons (HC) analysis - compression-ignition engines:
The analyser shall be of the flame ionisation type with detector, valves, pipework, etc., heated to 463 K (190 °C) ± 10 K (HFID). It shall be calibrated with propane gas expressed equivalent to carbon atoms (C1).
1.3.4. Nitrogen oxide (NOx) analysis:
The analyser shall be either of the chemi-luminescent (CLA) or of the non-dispersive ultra-violet resonance absorption (NDUVR) type, both with NOx-NO converters.
1.3.5. The analysers shall have a measuring range compatible with the accuracy required to measure the concentrations of the exhaust gas sample pollutants.
1.3.6. Measurement error shall not exceed ± 2 per cent (intrinsic error of analyser) disregarding the true value for the calibration gases.
1.3.7. For concentrations of less than 100 ppm, the measurement error shall not exceed ± 2 ppm.
1.3.8. The ambient air sample shall be measured on the same analyser with an appropriate range.
1.3.9. No gas drying device shall be used before the analysers unless shown to have no effect on the pollutant content of the gas stream.

1 June 2004
49
1.4. Recommended System Descriptions
Figure 10 is a schematic drawing of the system for gaseous emissions sampling.
Figure 10: Gaseous Emissions Sampling Schematic
P
Dilution Tunnel (see figures 6 & 7)
Air
from vehicleexhaust
S1 S2 / SV
S3
F
P
N
FL
V BEQ N
FL
V BAQ
to vent or optional
continuous analyser
to vent
HFID
zero gas
span gas
R, I
Fh Q BA
Lh Vh
The components of the system are as follows:
1.4.1. Two sampling probes (S1 and S2) for continuous sampling of the dilution air and of the diluted exhaust-gas/air mixture;
1.4.2. A filter (F), to extract solid particles from the flows of gas collected for analysis;
1.4.3. Pumps (P), to collect a constant flow of the dilution air as well as of the diluted exhaust-gas/air mixture during the test;
1.4.4. Flow controller (N), to ensure a constant uniform flow of the gas samples taken during the course of the test from sampling probes S1 and S2 (for PDP-CVS) and flow of the gas samples shall be such that, at the end of each test, the quantity of the samples is sufficient for analysis (approx. 10 litres per minute);
1.4.5. Flow meters (FL), for adjusting and monitoring the constant flow of gas samples during the test;
1.4.6. Quick-acting valves (V), to divert a constant flow of gas samples into the sampling bags or to the outside vent;
1 June 2004
50
1.4.7. Gas-tight, quick-lock coupling elements (Q) between the quick-acting valves and the sampling bags; the coupling shall close automatically on the sampling-bag side; as an alternative, other ways of transporting the samples to the analyser may be used (three-way stopcocks, for instance);
1.4.8. Bags (B), for collecting samples of the diluted exhaust gas and of the dilution air during the test;
1.4.9. A sampling critical-flow venturi (SV), to take proportional samples of the diluted exhaust gas at sampling probe S2 A(CFV-CVS only);
1.4.10. A scrubber (PS), in the sampling line (CFV-CVS only);
1.4.11. Components for hydrocarbon sampling using HFID:
Fh is a heated filter,
S3 is a sampling point close to the mixing chamber,
Vh is a heated multi-way valve,
Q is a quick connector to allow the ambient air sample BA to be analysed on the HFID,
HFID is a heated flame ionisation analyser,
R and I are a means of integrating and recording the instantaneous
hydrocarbon concentrations,
Lh is a heated sample line.
2. Calibration Procedures
2.1. Analyser Calibration Procedure
2.1.1. Each analyser shall be calibrated as often as necessary and in any case in the month before type approval testing and at least once every six months for verifying conformity of production.
2.1.2. Each normally used operating range shall be calibrated by the following procedure:

1 June 2004
51
2.1.2.1. The analyser calibration curve is established by at least five calibration points spaced as uniformly as possible. The nominal concentration of the calibration gas of the highest concentration shall be not less than 80 per cent of the full scale.
2.1.2.2. The calibration gas concentration required may be obtained by means of a gas divider, diluting with purified N2 or with purified synthetic air. The accuracy of the mixing device shall be such that the concentrations of the diluted calibration gases may be determined to within ±2 per cent.
2.1.2.3. The calibration curve is calculated by the least squares method. If the resulting polynomial degree is greater than 3, the number of calibration points shall be at least equal to this polynomial degree plus 2.
2.1.2.4. The calibration curve shall not differ by more than ± 2 per cent from the nominal value of each calibration gas.
2.1.3. Trace of the calibration curve
From the trace of the calibration curve and the calibration points, it is possible to verify that the calibration has been carried out correctly. The different characteristic parameters of the analyser shall be indicated, particularly:
the scale, the sensitivity, the zero point, the date of carrying out the calibration.
2.1.4. If it can be shown to the satisfaction of the technical service that alternative technology (e.g. computer, electronically controlled range switch, etc.) can give equivalent accuracy, then these alternatives may be used.
2.2. Analyser Verification Procedure
2.2.1. Each normally used operating range shall be checked prior to each analysis in accordance with the following:
2.2.2. The calibration shall be checked by use of a zero gas and by use of a span gas that has a nominal value within 80-95 per cent of the supposed value to be analysed.
2.2.3. If, for the two points considered, the value found does not differ by more than ± 5 per cent of the full scale from the theoretical value, the adjustment parameters may be modified. Should this not be the case, a new calibration curve shall be established in accordance with paragraph 1 of this appendix.
1 June 2004
52
2.2.4. After testing, zero gas and the same span gas are used for re-checking. The analysis is considered acceptable if the difference between the two measuring results is less than 2 per cent.
2.3. FID Hydrocarbon Response Check Procedure
2.3.1. Detector response optimisation
The FID shall be adjusted, as specified by the instrument manufacturer. Propane in air should be used, to optimise the response, on the most common operating range.
2.3.2. Calibration of the HC analyser
The analyser should be calibrated using propane in air and purified synthetic air. (See Section 3 of this Appendix.) Establish a calibration curve as described in paragraphs 2.1. of this appendix.
2.3.3. Response factors of different hydrocarbons and recommended limits
The response factor (Rf), for a particular hydrocarbon species is the ratio of the FID C1 reading to the gas cylinder concentration, expressed as ppm C1. The concentration of the test gas shall be at a level to give a response of approximately 80 per cent of full-scale deflection, for the operating range. The concentration shall be known, to an accuracy of ± 2 per cent in reference to a gravimetric standard expressed in volume. In addition, the gas cylinder shall be pre-conditioned for 24 hours at a temperature between 293 K and 303 K (20 and 30 °C). Response factors should be determined when introducing an analyser into service and thereafter at major service intervals. The test gases to be used and the recommended response factors are:
Methane and purified air: 1.00 < Rf < 1.15
or 1.00 < Rf < 1.05 for NG fuelled vehicles
Propylene and purified air: 0.90 < Rf < 1.00
Toluene and purified air: 0.90 < Rf < 1.00 These are relative to a response factor (Rf) of 1.00 for propane and purified air.
2.3.4. Oxygen interference check and recommended limits
The response factor shall be determined as described in paragraph 2.3.3 above. The test gas to be used and recommended response factor range is:
Propane and nitrogen: 0.95 < Rf < 1.05

1 June 2004
53
2.4. NOx Converter Efficiency Test Procedure
The efficiency of the converter used for the conversion of NO2 into NO is tested as follows: Using the test set up as shown in Figure 11 and the procedure described below, the efficiency of converters can be tested by means of an ozonator.
2.4.1. Calibrate the analyzer in the most common operating range following the manufacturer's specifications using zero and span gas (the NO content of which shall amount to about 80 per cent of the operating range and the NO2 concentration of the gas mixture shall be less than 5 per cent of the NO concentration). The NOx analyser shall be in the NO mode so that the span gas does not pass through the converter. Record the indicated concentration.
2.4.2. Via a T-fitting, oxygen or synthetic air is added continuously to the span gas flow until the concentration indicated is about 10 per cent less than the indicated calibration concentration given in paragraph 2.4.1. above. Record the indicated concentration (C). The ozonator is kept deactivated throughout this process.
2.4.3. The ozonator is now activated to generate enough ozone to bring the NO concentration down to 20 per cent (minimum 10 per cent) of the calibration concentration given in paragraph 2.4.1. above. Record the indicated concentration (d).
2.4.4. The NOx analyser is then switched to the NOx mode, which means that the gas mixture (consisting of NO, NO2, O2 and N2 ) now passes through the converter. Record the indicated concentration (a).
2.4.5. The ozonator is now deactivated. The mixture of gases described in paragraph 2.4.2. above passes through the converter into the detector. Record the indicated concentration (b).
Figure 11: NOx Converter Efficiency Test Configuration
1 June 2004
54
2.4.6. With the ozonator deactivated, the flow of oxygen or synthetic air is also shut off. The NO2 reading of the analyser shall then be no more than 5 per cent above the figure given in paragraph 2.4.1. above.
2.4.7. The efficiency of the NOx converter is calculated as follows:
100dcba1(%)Efficiency ⋅
−−
+=
2.4.8. The efficiency of the converter shall not be less than 95 per cent.
2.4.9. The efficiency of the converter shall be tested at least once a week.
3. Reference Gases
3.1. Pure gases
The following pure gases shall be available, if necessary, for calibration and operation:
purified nitrogen: (purity: ±1 ppm C, ±1 ppm CO, ±400 ppm CO2, ±0.1 ppm NO);
purified synthetic air: (purity: ±1 ppm C, ±1 ppm CO, ±400 ppm CO2, ±0.1 ppm NO); oxygen content between 18 and 21 per cent volume;
purified oxygen: (purity > 99.5 per cent vol. O2);
purified hydrogen (and mixture containing helium): (purity ± 1 ppm C, ± 400 ppm CO2).
carbon monoxide: (minimum purity 99.5 per cent)
propane: (minimum purity 99.5 per cent).
3.2. Calibration and span gases
Mixtures of gases having the following chemical compositions shall be available: C3 H8 and purified synthetic air (see 3.1. above); CO and purified nitrogen; CO2 and purified nitrogen; NO and purified nitrogen. (The amount of NO2 contained in this calibration gas shall
not exceed 5per cent of the NO content.)

1 June 2004
55
The true concentration of a calibration gas shall be within ± 2 per cent of the stated
figure. _____________
1 June 2004
56
APPENDIX 4 - PARTICULATE MASS EMISSIONS MEASUREMENT EQUIPMENT
1. Specification
1.1. System Overview
1.1.1. The particulate sampling unit shall consist of a sampling probe located in the dilution tunnel, a particle transfer tube, a filter holder, a partial-flow pump, and flow rate regulators and measuring units.
1.1.2. It is recommended that a particle size pre-classifier (e.g. cyclone, impactor etc) be employed immediately upstream of the filter. However, a sampling probe, acting as an appropriate size-classification device is acceptable.
1.2. General Requirements
1.2.1. The sampling probe for the test gas flow for particulates shall be so arranged within the dilution tract that a representative sample gas flow can be taken from the homogeneous air/exhaust mixture.
1.2.2. The particulate sample flow rate shall be proportional to the total flow of diluted exhaust gas in the dilution tunnel
1.2.3. The sampled dilute exhaust gas shall be maintained at a temperature of 320 ± 5 K (47°C ± 5°C)3 and have a residence time of at least 0.2 s at this temperature, immediately before the particulate filter.
1.2.4. The particulate sample shall be collected on a single filter mounted within a holder in the sampled dilute exhaust gas flow.
1.2.5. All parts of the dilution system and the sampling system from the exhaust pipe up to the filter holder, which are in contact with raw and diluted exhaust gas, shall be designed to minimise deposition or alteration of the particulates. All parts shall be made of electrically conductive materials that do not react with exhaust gas components, and shall be electrically grounded to prevent electrostatic effects.
1.2.6. If it is not possible to compensate for variations in the flow rate provision shall be made for a heat exchanger and a temperature control device as specified in Appendix 2 so as to ensure that the flow rate in the system is constant and the sampling rate accordingly proportional
3 OICA stated that some LDV vehicles might require the sample to be cooled to achieve <325K
(<52°C) and queried the value of the 0.2s residence time requirement. Chair - noted.
1 June 2004
57
1.3. Specific Requirements
1.3.1. Pm Sampling Probe
1.3.1.1. The sample probe shall deliver the particle-size classification performance described in Section 1.3.1.4. It is recommended that this performance be achieved by the use of a sharp-edged, open-ended probe facing directly into the direction of flow plus a pre-classifier (cyclone impactor etc). An appropriate sampling probe such as that indicated in Figure 13, may alternatively be used provided it achieves the pre-classification performance described in Section 1.3.1.4.
1.3.1.2. The sample probe shall be installed near the tunnel centreline, between 10 and 20 tunnel diameters downstream of the gas inlet and have an internal diameter of at least 12 mm.
If more than one simultaneous sample is drawn from a single sample probe, the flow drawn from that probe shall be split into identical sub-flows to avoid sampling artefacts.
If multiple probes are used, each probe shall be sharp-edged, open-ended and facing directly into the direction of flow. Probes shall be equally spaced around the central longitudinal axis of the dilution tunnel, with the spacing between probes at least 5cm.
1.3.1.3. The distance from the sampling tip to the filter mount shall be at least five probe diameters, but shall not exceed 1,020 mm.
1.3.1.4. The pre-classifier (e.g. cyclone, impactor, etc.) shall be located upstream of the filter holder assembly. The pre-classifier 50 per cent cut point particle diameter shall be between 2.5 µm and 10 µm at the volumetric flow rate selected for sampling particulate mass emissions. The pre-classifier shall allow at least 99per cent of the mass concentration of 1 µm particles entering the pre-classifier to pass through the exit of the pre-classifier at the volumetric flow rate selected for sampling particulate mass emissions.
1.3.2. Sample Pump and Flow Meter
1.3.2.1. The sample gas flow measurement unit shall consist of pumps, gas flow regulators and flow measuring units.
1.3.2.2. The temperature of the gas flow in the flow meter may not fluctuate by more than ± 3 K, nor may the mass flow rate fluctuate by more than ± 5 per cent. [Should the volume of flow change unacceptably as a result of excessive filter loading, the test shall be stopped. When it is repeated, the rate of flow shall be decreased.]
1 June 2004
58
1.3.3. Filter and Filter Holder
1.3.3.1. Quick-acting valves shall be located both up and downstream of the filter in the direction of flow.
1.3.3.2. It is recommended that the particulate sample rate (Vep/Vmix) shall be adjusted such that the mass collected on the 47 mm diameter filter (Pe) is ≥ 50µg.
1.3.3.3. Fluorocarbon coated glass fibre filters are required4. All filter types shall have a 0.3µm DOP (di-octylphthalate) collection efficiency of at least [99]5 per cent at a gas face velocity of at least 35cm/s.
1.3.3.4. The filter holder assembly shall be of a design that provides an even flow distribution across the filter stain area. The filter stain area shall be at least 1075mm2.
1.3.4. Filter Weighing Chamber and Balance
1.3.4.1. The microgram balance used to determine the weight of a filter shall have a precision (standard deviation) of 2µg and resolution of 1µg or better.
1.3.4.2. The weighing chamber (or room) shall meet the following conditions during all filter conditioning and weighing operations6:
Temperature maintained at 295 ± 3K (22 ± 3°C)
Relative humidity maintained at 45 ± 8 per cent.
The chamber (or room) environment shall be free of any ambient contaminants (such as dust) that would settle on the particulate filters during their stabilisation.
Limited deviations from weighing room temperature and humidity specifications will
be allowed provided their total duration does not exceed 30 minutes in any one filter conditioning period. The weighing room should meet the required specifications prior to personal entrance into the weighing room. During the weighing operation no deviations from the specified conditions are permitted.
1.3.4.3. To eliminate the effects of static electricity: the balance should be grounded through placement upon an antistatic mat and particulate filters should be neutralised prior to
4 OICA requests that use of Teflo filters instead of fluorocarbon coated glass fibre filters be
reviewed in future once more data is available. 5 OICA to provide data clarifying 99 per cent rather than 95 per cent efficiency. Awaited 6 OICA to supply contribution concerning weighing room set-point drift as an output of the PM-3
programme. Awaited.
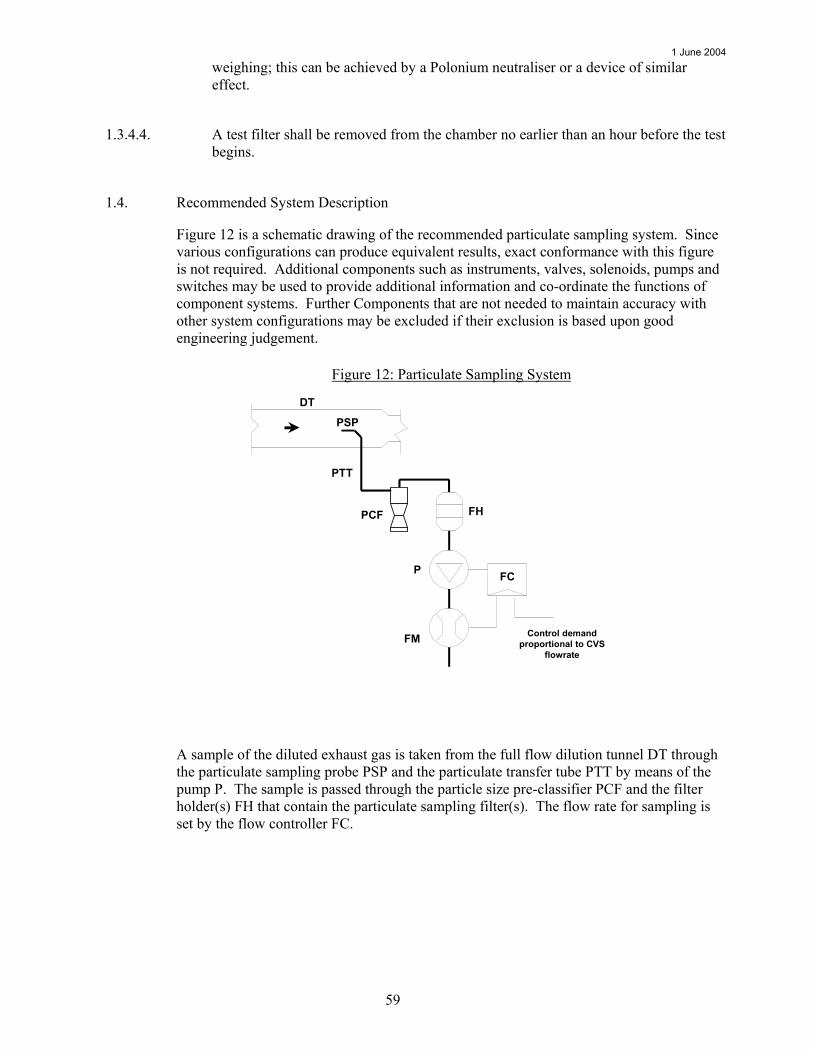
1 June 2004
59
weighing; this can be achieved by a Polonium neutraliser or a device of similar effect.
1.3.4.4. A test filter shall be removed from the chamber no earlier than an hour before the test begins.
1.4. Recommended System Description
Figure 12 is a schematic drawing of the recommended particulate sampling system. Since various configurations can produce equivalent results, exact conformance with this figure is not required. Additional components such as instruments, valves, solenoids, pumps and switches may be used to provide additional information and co-ordinate the functions of component systems. Further Components that are not needed to maintain accuracy with other system configurations may be excluded if their exclusion is based upon good engineering judgement.
Figure 12: Particulate Sampling System
FM
FC
FH
Control demand proportional to CVS
flowrate
PTT
P
PSP
DT
PCF
A sample of the diluted exhaust gas is taken from the full flow dilution tunnel DT through
the particulate sampling probe PSP and the particulate transfer tube PTT by means of the pump P. The sample is passed through the particle size pre-classifier PCF and the filter holder(s) FH that contain the particulate sampling filter(s). The flow rate for sampling is set by the flow controller FC.
1 June 2004
60
2. Calibration and Verification Procedures
2.1. Flow Meter Calibration
The Technical Service shall ensure the existence of a calibration certificate for the flow meter demonstrating compliance with a traceable standard within a 12 months period prior to the test, or since any repair or change which could influence calibration.
2.2. Microbalance Calibration
The Technical Service shall ensure the existence of a calibration certificate for the microbalance demonstrating compliance with a traceable standard within a 12 months period prior to the test.
2.3. Reference Filter Weighing
At least two unused reference filters shall be weighed within 4 hours of, but preferably at the same time as the sample filter weighings. They shall be the same size and material as the sample filter. If the average weight of the reference filters changes by more than +/-5µg between sample filter weighings, then the sample filter shall be discarded and the emissions test repeated7.
If the weighing room stability criteria outlined in paragraph 1.3.4. is not met, but the reference filter weighings meet the above criteria, the vehicle manufacturer has the option of accepting the sample filter weights or voiding the tests, fixing the weighing room control system and rerunning the test.
_____________
7 OICA - Requests inclusion of buoyancy correction as per US HD2007. Chair - Accepted.
Buoyancy correction aligned with US FTP will be adopted following its publication by US EPA in June 2004.

1 June 2004
61
Figure 13: Particulate sampling probe configuration
1 June 2004
62
APPENDIX 5 - PARTICLE NUMBER EMISSIONS MEASUREMENT EQUIPMENT
1. Specification
1.1. System Overview
1.1.1. The particle sampling system shall consist of a dilution tunnel, a sampling probe and a sample pre-conditioning unit upstream of a particle concentration measurement device.
1.1.2. It is recommended that a particle size pre-classifier (e.g. cyclone, impactor etc) be employed immediately upstream of the filter. However, if the sample probe acts as an appropriate size-classification device, a particle size pre-classifier shall not be required.
1.2. General Requirements
1.2.1. The particle sampling point shall be located within a dilution tunnel.
1.2.2. The sample pre-conditioning unit shall include devices for sample dilution and for volatile particle removal. The sampling probe for the test gas flow shall be so arranged within the dilution tract that a representative sample gas flow can be taken from the homogeneous air/exhaust mixture.
1.2.3. All parts of the dilution system and the sampling system from the exhaust pipe up to the particle concentration measurement system, which are in contact with raw and diluted exhaust gas, shall be designed to minimise deposition of the particles. All parts shall be made of electrically conductive materials that do not react with exhaust gas components, and shall be electrically grounded to prevent electrostatic effects.
1.2.4. The particle sampling system shall incorporate good aerosol sampling practice that includes the avoidance of sharp bends and abrupt changes in section, the use of smooth internal surfaces and the minimisation of the length of the sampling line.
1.2.5. The dilution air used for the primary dilution of the exhaust in the CVS tunnel and for all subsequent dilution stages shall be first passed through a medium capable of reducing particles in the most penetrating particle size of the filter material by at least 99.95 per cent, or through a filter of at least class H13 of EN 1822; this represents the specification of High Efficiency Particulate Air (HEPA) filters.
1.3. Specific Requirements
1.3.1. The particle number measurement device shall have size related inlet characteristics as defined in 1.3.4.8.
1 June 2004
63
1.3.2. A sample pre-classifier is recommended.
1.3.3. The sample preconditioning unit shall:
1.3.3.1. be capable of diluting the sample in the range 1-1000 times in one or more stages to achieve a particle number concentration below 10000/cm3 and gas temperature below 35°C at the particle number counter.
1.3.3.2. Operate under conditions that achieve greater than 99 per cent reduction of 30nm C40 particles and greater than 90 per cent solid particle penetration at 30, 50 and 100nm particle diameter.
1.3.3.3. Include an initial heated dilution stage which outputs a diluted sample at a temperature of ≥150°C and a particle removal element which eliminates volatile particles with an efficiency equivalent to the performance of an evaporation tube with a minimum length of 350mm +/-10 mm and an internal diameter of 6mm +/- 0.1mm, with a controlled wall temperature greater than 150°C, and with a portion of the length, equivalent to a gas residence time of 0.5s +/- 0.05s, held at between 300°C and 400°C8.
1.3.4. The particle concentration measurement device (PNC) shall:
1.3.4.1. operate under full flow operating conditions.
1.3.4.2. have a counting accuracy of ± 10 per cent across the range 100 cm-3 to 104 cm-3 and +/- 10 cm-3 below this concentration range against a traceable standard.
1.3.4.3. have a readability of 0.1 particles cm-3.
1.3.4.4. have a linear response to particle concentration over 1 to 10,000 particles cm-3
1.3.4.5. have a data logging frequency equal to or greater than 0.5 Hz.
1.3.4.6. have a T90 response time over the measured concentration range of less than 15 s. It is recommended that the response time is not less than 5s
1.3.4.7. have a data-averaging period of between 1 and 6s and shall not incorporate automatic data manipulation functions.
8 OICA - Design rather than performance specification! Ricardo - Ultimate intention is to write a
specification for the VPR based upon heat transfer, however, additional data are required to ascertain precise details. Chair - retain until a better option exists.
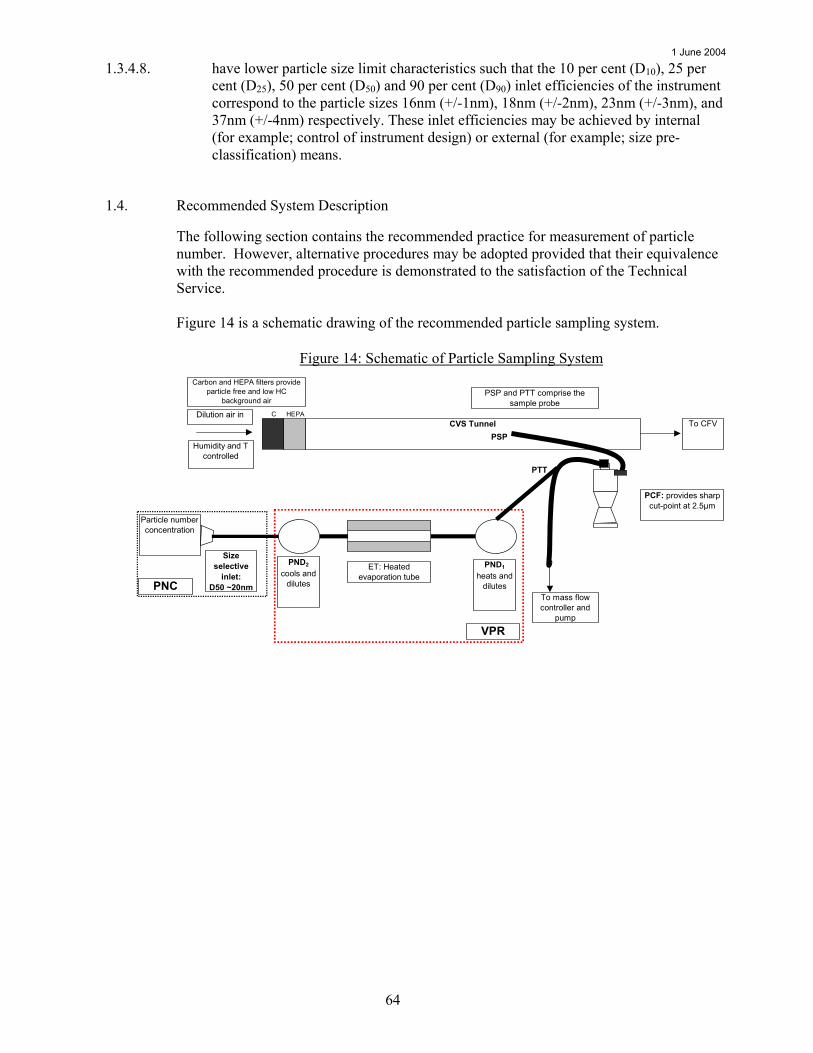
1 June 2004
64
1.3.4.8. have lower particle size limit characteristics such that the 10 per cent (D10), 25 per cent (D25), 50 per cent (D50) and 90 per cent (D90) inlet efficiencies of the instrument correspond to the particle sizes 16nm (+/-1nm), 18nm (+/-2nm), 23nm (+/-3nm), and 37nm (+/-4nm) respectively. These inlet efficiencies may be achieved by internal (for example; control of instrument design) or external (for example; size pre-classification) means.
1.4. Recommended System Description
The following section contains the recommended practice for measurement of particle number. However, alternative procedures may be adopted provided that their equivalence with the recommended procedure is demonstrated to the satisfaction of the Technical Service. Figure 14 is a schematic drawing of the recommended particle sampling system.
Figure 14: Schematic of Particle Sampling System
C HEPACVS Tunnel
To mass flow controller and
pump
PCF: provides sharp cut-point at 2.5µm
Carbon and HEPA filters provide particle free and low HC
background air
PND1
heats and dilutes
Particle number concentration
ET: Heatedevaporation tube
Dilution air in
Humidity and T controlled
To CFV
Size selective
inlet:D50 ~20nm
PSP and PTT comprise the sample probe
PND2
cools and dilutes
VPR
PSP
PTT
PNC
1 June 2004
65
1.4.1. Sampling System Description
The particle sampling system shall consist of a sampling probe tip in the dilution tunnel (PSP), a particle transfer tube (PTT), a particle pre-classifier (PCF) and a volatile particle remover (VPR) upstream of the particle number concentration measurement (PNC) unit. The VPR shall include devices for sample dilution (particle number diluters: PND1 and PND2) and particle evaporation (Evaporation tube, ET). The sampling probe for the test gas flow shall be so arranged within the dilution tract that a representative sample gas flow can be taken from the homogeneous air/exhaust mixture. The system response time shall be no greater than 20 s, and shall be co-ordinated with sampling time/test cycle offsets, if necessary
1.4.2. Particle Sampling Probe
The sampling probe tip (PSP) and particle transfer tube (PTT) together comprise the particle sampling probe. The sampling probe shall meet the following conditions: It shall be installed near the tunnel centre line, 10 to 20 tunnel diameters downstream of the gas inlet, facing upstream into the tunnel gas flow with its axis at the tip parallel to that of the dilution tunnel. The PSP and PTT should have an internal diameter of approximately 12mm. The PTT may be heated to no greater than 52°C. The distance from the sampling tip to the point at which the probe leaves the dilution tunnel shall be less than 200 mm. The distance from the sampling tip to the entrance to the sample pre-conditioning unit shall not exceed 1,000 mm. The distance from the sampling tip to the entrance to the particle counter shall not exceed 2,500 mm.
1.4.3. Particle Pre-classifier
The recommended particle pre-classifier shall be located immediately upstream of the sample pre-conditioning unit. The pre-classifier 50 per cent cut point particle diameter shall be between 2.5 µm and 10 µm at the volumetric flow rate selected for sampling particle number emissions. The pre-classifier shall allow at least 99 per cent of the mass concentration of 1 µm particles entering the pre-classifier to pass through the exit of the pre-classifier at the volumetric flow rate selected for sampling particle number emissions.
1.4.4. Volatile Particle Remover
The volatile particle remover (VPR) shall comprise one particle number diluter (PND1), an evaporation tube and a second diluter (PND2) in series. The VPR shall be capable of diluting the sample drawn from the primary dilution tunnel by a dilution ratio range from 1 to 1000. This dilution function (DRtot) is to reduce the number concentration of the sample entering the particle concentration measurement unit to less than 10,000 particles cm-3 and to suppress nucleation within the sample. DRtot is calculated as the product of the dilution
1 June 2004
66
factor in the first particle number diluter (PNDR1) and the dilution factor in the second particle number diluter PNDR2. The VPR shall operate under conditions that achieve greater than 99 per cent reduction of 30nm C40 particles and greater than 90 per cent solid particle penetration at 30, 50 and 100nm particle diameter.
1.4.4.1. First Particle Number Dilution Device (PND1)
The first particle number dilution device shall be specifically designed to dilute particle number concentration and output a diluted sample at a temperature equal to or greater than 150°C. The diluter should be supplied with HEPA filtered dilution air and be capable of a dilution ratio of 1 to 1000 times. The dilution ratio of the PND1 shall be selected such that peak particle number concentration downstream of the first diluter is <105 particles cm-3 and >103 particles cm-3.
1.4.4.2. Evaporation Tube
The evaporation tube shall have a minimum length 350mm +/-10 mm and an internal diameter of 6mm +/- 0.1mm and be equipped with a heating mantle. The entire length of the ET shall be controlled at a wall temperature greater than that of the first particle number dilution device and with a portion of the length, equivalent to a gas residence time of 0.5s +/- 0.05s, held at 300-400°C.
1.4.4.3. Second Particle Number Dilution Device (PND2)
The second particle number dilution device shall be specifically designed to dilute particle number concentration. The diluter shall be supplied with HEPA filtered dilution air and be capable of a dilution ratio of 1 to 30 times. The dilution ratio of PND2 shall be selected such that particle number concentration downstream of the second diluter is <104 particles cm-3 and the gas temperature prior to entry to the PNC is <35°C.
1.4.5. Particle Number Concentration Measurement Device
The particle concentration measurement device (PNC) shall meet the requirements of Section 1.3.4.
2. Calibration of Particle Number Measurement System
2.1. Calibration of the Particle Number Counter
2.1.1. The Technical Service shall ensure the existence of a calibration certificate for the particle number counter demonstrating compliance with a traceable standard within a 12 month period prior to the emissions test.
1 June 2004
67
2.1.2. Calibration shall be traceable to a standard calibration method:
by comparison of the response of the counter under calibration with that of a calibrated aerosol electrometer when simultaneously sampling electrostatically classified calibration particles, or by comparison of the response of the counter under calibration with that of a second counter which has been calibrated by the above method. In either case, calibration shall be undertaken using at least five standard concentrations spaced as uniformly as possible across the counter’s measurement range. Measured concentrations shall be within ± 10 per cent of the standard concentration for each calibration concentration used. The gradient from a linear regression of the two data sets shall be calculated and recorded. Linearity of response is calculated as the square of the Pearson product moment correlation coefficient (R2) of the two data sets and shall be equal to or greater than 0.95.
2.2. Calibration of the Particle Number Diluters
2.2.1. The Technical Service shall ensure the existence of a calibration certificate for the diluter demonstrating compliance with a traceable performance specification within a 6 month period prior to the emissions test.
The calibration certificate shall detail the diluter performance across the nominal dilution range of the diluter with respect to gases and with respect to solid particles. The diluter shall achieve minimum penetration performance of 0.aa, 0.bb, 0.cc, 0.dd, 0.ee9 for 20nm, 100nm, 300nm, 500nm and 700nm particles respectively for the dilution ratio employed in the test and in comparison with the diluter performance for gases.
2.2.2. Calibration shall be undertaken by measuring the concentration of the standard gas with a calibrated gas monitor at the inlet and outlet of the diluter. Calibration shall be undertaken at least 5 dilution ratios spaced as uniformly as possible across the dilution ratio range from 0 to 1000. Measured dilution ratios shall be within ± 10 per cent of nominal dilution ratio settings. If a diluter is to be used over a narrower dilution range, then the 5-point calibration should span that range.
2.3. Calibration of the Volatile Particle Remover
2.3.1. The Technical Service shall ensure the existence of a calibration certificate for the volatile particle remover demonstrating effective penetration efficiency within a 6 month period prior to the emissions test.
2.3.2. The test aerosol for these measurements shall be solid particles of diameters 30, 50 and 100 nm and a minimum concentration of 1,000 particles cm-3. Particle concentrations shall be 9 Ricardo - aa,bb,cc,dd,ee have to be defined following actual measurement experience. For
example at nominal DR of 10: if the gas concentration is measured as [0.099 x the initial concentration] and the 20nm particle level is measured as [0.08 x the initial concentration], the penetration 0.aa will equal (1/0.099)/(1/0.08) = 0.81 (0.808). Chair - noted.
1 June 2004
68
measured upstream and downstream of the apparatus operating at the temperature and flow conditions employed during an emission test. A minimum penetration efficiency of 90 per cent shall be achieved at all three test particle diameters.
2.3.3. The Technical Service shall ensure the existence of a calibration certificate for the volatile particle remover demonstrating effective volatile particle removal efficiency within a 6 months period prior to the emissions test. The VPR shall demonstrate greater than 99 per cent reduction of 30nm C40 particles at an upstream particle concentration of 10000cm-3.
2.4. Particle Number System Check Procedures10
2.4.1. Linearity of the particle counter response shall be validated. The test aerosol for this validation shall show a particle size within the range 30-100nm at a stable concentration greater than 10,000 particles cm-3. This calibration shall be carried out with at least five concentrations spaced as uniformly as possible across the counter’s measurement range by diluting the test aerosol using a calibrated aerosol diluter. The gradient from a linear regression of the two data sets shall be within ± 10 per cent of that calculated from the annual calibration data. The Pearson product moment correlation coefficient (R2) of the two data sets shall be equal to or greater than 0.95.
2.4.2. The particle counter shall report a measured concentration of less than 10 particle cm-3 when a HEPA filter is attached to the inlet of the entire particle sampling system (VPR and PNC).
2.4.3. The particle counter shall report a measured concentration of less than 1 particle cm-3 when a HEPA filter is attached to the sample inlet of the counter.
2.4.4. The flow into the particle counter shall report a measured value within 5 per cent of the particle counter nominal flow rate when checked with a calibrated flow meter
2.4.5. The particle counter shall report a measured concentration in excess of 10,000 particles cm-
3 when challenged with an undiluted sample of the test aerosol used in the daily particle counter linearity validation.
2.4.6. The evaporation tube shall indicate a reading of 300°C to 400°C
2.4.7. The diluter PND1 shall indicate a temperature reading of ≥150°C
_____________
10 Ricardo - Exact requirements for calibration shall be determined following the inter-laboratory
correlation exercise. Considerations will include the need for frequent calibration, comprehensive daily validations and for verification of VPR on a regular basis. Chair - noted.
1 June 2004
69
APPENDIX 6 – VERIFICATION OF SIMULATED INERTIA
1. OBJECT
The method described in this appendix makes it possible to check that the simulated total inertia of the dynamometer is carried out satisfactorily in the running phase of the operating cycle. The manufacturer of the dynamometer shall specify a method for verifying the specifications according to paragraph 3 of this appendix.
2. PRINCIPLE
2.1 Drawing-up working equations Since the dynamometer is subjected to variations in the rotating speed of the roller(s), the force at the surface of the roller(s) can be expressed by the formula:
1M FIIF +γ⋅=γ⋅=
where: F = force at the surface of the roller(s), I = total inertia of the dynamometer (equivalent inertia of the vehicle: see the table in paragraph 5.1.), IM = inertia of the mechanical masses of the dynamometer,
γ = tangential acceleration at roller surface, F1 = inertia force.
Note: An explanation of this formula with reference to dynamometers with mechanically simulated inertia’s is appended. Thus, total inertia is expressed as follows: I = Im+ F1 / γ where: Im can be calculated or measured by traditional methods, F1 can be measured on the dynamometer, γ can be calculated from the peripheral speed of the rollers. The total inertia (I) will be determined during an acceleration or deceleration test with values higher than or equal to those obtained on an operating cycle.
1 June 2004
70
2.2. Specification for the calculation of total inertia The test and calculation methods shall make it possible to determine the total inertia I with a relative error (∆I/I) of less than ± 2 per cent.
3. SPECIFICATION
3.1 The mass of the simulated total inertia I shall remain the same as the theoretical value of the equivalent inertia (see Appendix 1) within the following limits:
3.1.1 ± 5 per cent of the theoretical value for each instantaneous value; 3.1.2 ± 2 per cent of the theoretical value for the average value calculated for each sequence of
the cycle.
The limit given in paragraph 3.1.1. above is brought to ± 50 per cent for one second when starting and, for vehicles with manual transmission, for two seconds during gear changes.
4. VERIFICATION PROCEDURE
4.1 Verification is carried out during each test throughout the cycle defined in Section 4.4. of Annex 4.
4.2 However, if the requirements of paragraph 3. above are met, with instantaneous
accelerations which are at least three times greater or smaller than the values obtained in the sequences of the theoretical cycle, the verification described above will not be necessary.
_________

1 June 2004
71
APPENDIX 7 – MEASUREMENT OF VEHICLE ROAD LOAD
RESISTANCE TO PROGRESS OF A VEHICLE MEASUREMENT METHOD ON THE ROAD
SIMULATION ON A CHASSIS DYNAMOMETER
1. OBJECT OF THE METHODS
The object of the methods defined below is to measure the resistance to progress of a vehicle at stabilised speeds on the road and to simulate this resistance on a dynamometer, in accordance with the conditions set out in paragraph 4.2.1. of annex 4.
2. DEFINITION OF THE ROAD
The road shall be level and sufficiently long to enable the measurements specified in this appendix to be made. The slope shall be constant to within ± 0.1 per cent and shall not exceed 1.5 per cent.
3. ATMOSPHERIC CONDITIONS
3.1. Wind
Testing shall be limited to wind speeds averaging less than 3 m/s with peak speeds of less than 5 m/s. In addition, the vector component of the wind speed across the test road shall be less than 2 m/s. Wind velocity shall be measured 0.7 m above the road surface.
3.2. Humidity
The road shall be dry.
3.3. Pressure and Temperature
Air density at the time of the test shall not deviate by more than ±7.5 per cent from the reference conditions, P = 100 kPa and T = 293.2 K.
4. VEHICLE PREPARATION
4.1. Selection of the test vehicle
If not all variants of a vehicle type are measured, the following criteria for the selection of the test vehicle shall be used.
4.1.1. Body
If there are different types of body, the test shall be performed on the least aerodynamic body. The manufacturer shall provide the necessary data for the selection.
4.1.2. Tyres
The widest tyre shall be chosen. If there are more than three tyre sizes, the widest minus one shall be chosen.

1 June 2004
72
4.1.3. Testing mass
The testing mass shall be the reference mass of the vehicle with the highest inertia range.
4.1.4. Engine
The test vehicle shall have the largest heat exchanger(s).
4.1.5. Transmission
A test shall be carried out with each type of the following transmission:
front-wheel drive rear-wheel drive full-time 4 x 4 part-time 4 x 4 automatic gearbox manual gearbox
4.2. Running-in
The vehicle shall be in normal running order and adjustment after having been run-in for at least 3,000/km. The tyres shall be run-in at the same time as the vehicle or have a tread depth within 90 and 50 per cent of the initial tread depth.
4.3. Verifications
The following checks shall be made in accordance with the manufacturer's specifications for the use considered: wheels, wheel trims, tyres (make, type, pressure), front axle geometry, brake
adjustment (elimination of parasitic drag), lubrication of front and rear axles, adjustment of the suspension and vehicle level, etc.
4.4. Preparation for the test
4.4.1. The vehicle shall be loaded to its reference mass. The level of the vehicle shall be that obtained when the centre of gravity of the load is situated midway between the 'R' points of the front outer seats and on a straight line passing through those points.
4.4.2. In the case of road tests, the windows of the vehicle shall be closed. Any covers of air climatisation systems, headlamps, etc. shall be in the non-operating position.
4.4.3. The vehicle shall be clean.
4.4.4. Immediately prior to the test, the vehicle shall be brought to normal running temperature in an appropriate manner.
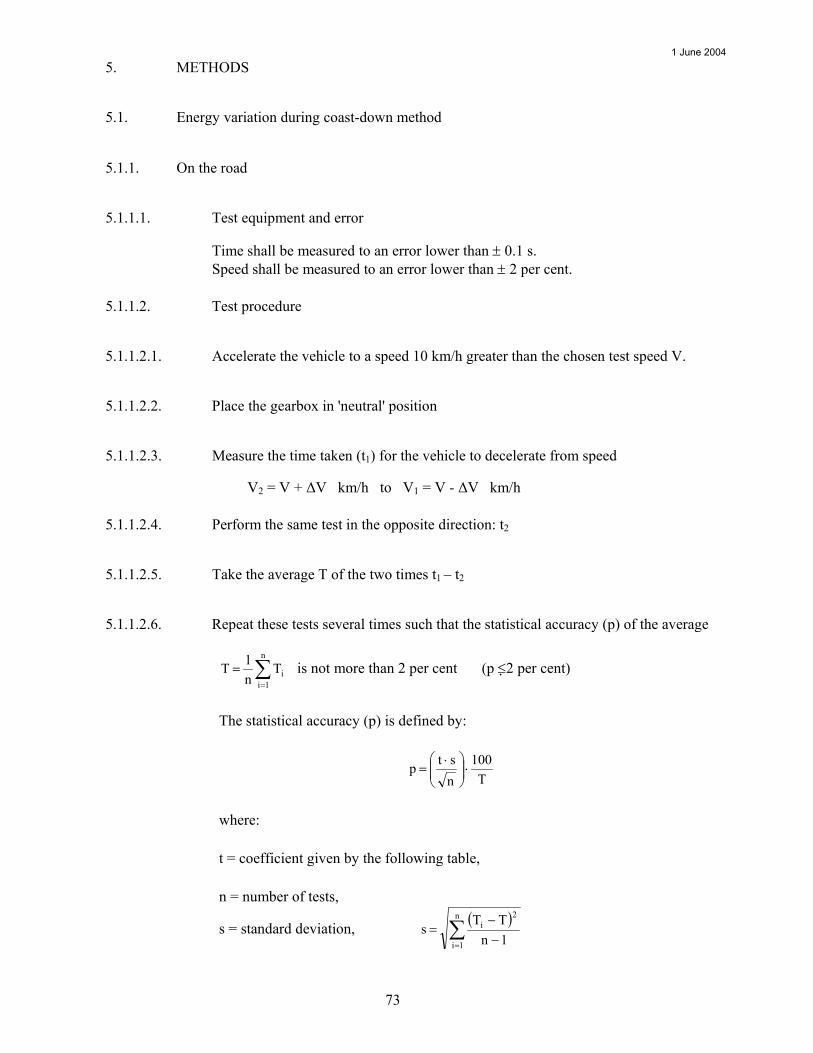
1 June 2004
73
5. METHODS
5.1. Energy variation during coast-down method
5.1.1. On the road
5.1.1.1. Test equipment and error
Time shall be measured to an error lower than ± 0.1 s. Speed shall be measured to an error lower than ± 2 per cent.
5.1.1.2. Test procedure
5.1.1.2.1. Accelerate the vehicle to a speed 10 km/h greater than the chosen test speed V.
5.1.1.2.2. Place the gearbox in 'neutral' position
5.1.1.2.3. Measure the time taken (t1) for the vehicle to decelerate from speed
V2 = V + ∆V km/h to V1 = V - ∆V km/h
5.1.1.2.4. Perform the same test in the opposite direction: t2
5.1.1.2.5. Take the average T of the two times t1 – t2
5.1.1.2.6. Repeat these tests several times such that the statistical accuracy (p) of the average
∑=
=n
1iiT
n1T is not more than 2 per cent (p ≤2 per cent)
The statistical accuracy (p) is defined by:
T100
nstp ⋅
⋅=
where:
t = coefficient given by the following table,
n = number of tests,
s = standard deviation, ( )∑= −
−=
n
1i
2i
1nTT
s
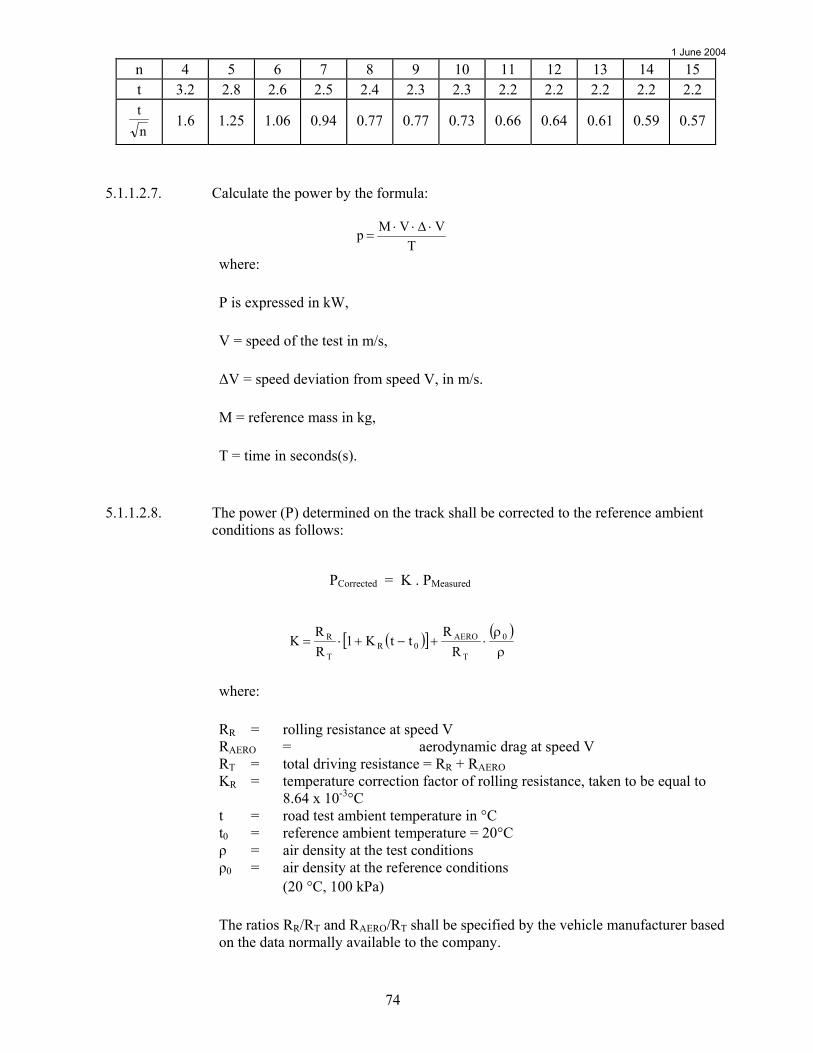
1 June 2004
74
n 4 5 6 7 8 9 10 11 12 13 14 15 t 3.2 2.8 2.6 2.5 2.4 2.3 2.3 2.2 2.2 2.2 2.2 2.2
nt 1.6 1.25 1.06 0.94 0.77 0.77 0.73 0.66 0.64 0.61 0.59 0.57
5.1.1.2.7. Calculate the power by the formula:
T
VVMp ⋅∆⋅⋅=
where:
P is expressed in kW,
V = speed of the test in m/s,
∆V = speed deviation from speed V, in m/s.
M = reference mass in kg,
T = time in seconds(s).
5.1.1.2.8. The power (P) determined on the track shall be corrected to the reference ambient conditions as follows:
PCorrected = K . PMeasured
( )[ ] ( )ρρ
⋅+−+⋅= 0
T
AERO0R
T
R
RR
ttK1RR
K
where:
RR = rolling resistance at speed V RAERO = aerodynamic drag at speed V RT = total driving resistance = RR + RAERO KR = temperature correction factor of rolling resistance, taken to be equal to
8.64 x 10⁻³°C t = road test ambient temperature in °C t0 = reference ambient temperature = 20°C ρ = air density at the test conditions ρ0 = air density at the reference conditions
(20 °C, 100 kPa)
The ratios RR/RT and RAERO/RT shall be specified by the vehicle manufacturer based on the data normally available to the company.
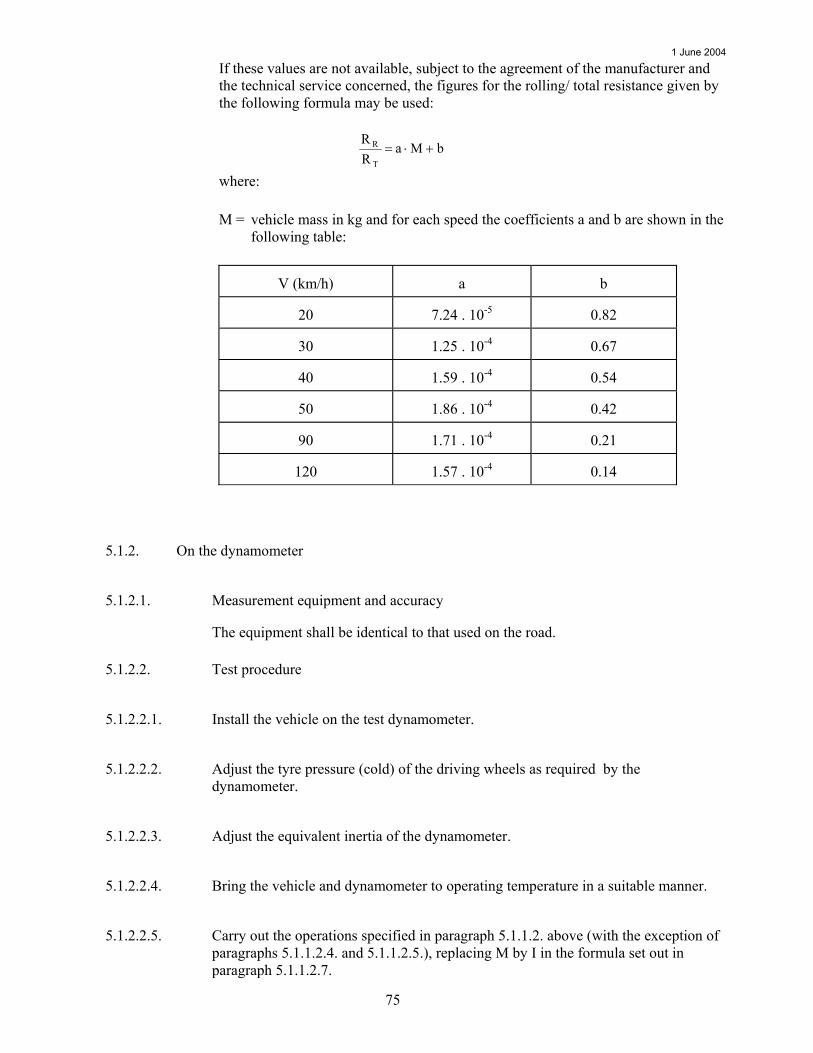
1 June 2004
75
If these values are not available, subject to the agreement of the manufacturer and the technical service concerned, the figures for the rolling/ total resistance given by the following formula may be used:
bMaRR
T
R +⋅=
where:
M = vehicle mass in kg and for each speed the coefficients a and b are shown in the following table:
V (km/h)
a
b
20
7.24 . 10-5
0.82
30
1.25 . 10-4
0.67
40
1.59 . 10-4
0.54
50
1.86 . 10-4
0.42
90
1.71 . 10-4
0.21
120
1.57 . 10-4
0.14
5.1.2. On the dynamometer
5.1.2.1. Measurement equipment and accuracy
The equipment shall be identical to that used on the road.
5.1.2.2. Test procedure
5.1.2.2.1. Install the vehicle on the test dynamometer.
5.1.2.2.2. Adjust the tyre pressure (cold) of the driving wheels as required by the dynamometer.
5.1.2.2.3. Adjust the equivalent inertia of the dynamometer.
5.1.2.2.4. Bring the vehicle and dynamometer to operating temperature in a suitable manner.
5.1.2.2.5. Carry out the operations specified in paragraph 5.1.1.2. above (with the exception of paragraphs 5.1.1.2.4. and 5.1.1.2.5.), replacing M by I in the formula set out in paragraph 5.1.1.2.7.

1 June 2004
76
5.1.2.2.6. Adjust the brake to reproduce the corrected power (paragraph 5.1.1.2.8.) and to take into account the difference between the vehicle mass (M) on the track and the equivalent inertia test mass (I) to be used. This may be done by calculating the mean corrected road coast down time from V2 to V1 and reproducing the same time on the dynamometer by the following relationship:
K = value specified in paragraph 5.1.1.2.8. above.
5.1.2.2.7. The power Pa to be absorbed by the dynamometer shall be determined in order to enable the same power (paragraph 5.1.1.2.8.) to be reproduced for the same vehicle on different days.
5.2. Torque measurements method at constant speed
5.2.1. On the road
5.2.1.1. Measurement equipment and error
Torque measurement shall be carried out with an appropriate measuring device accurate to within ±2 per cent.
Speed measurement shall be accurate to within ±2 per cent.
5.2.1.2. Test procedure
5.2.1.2.1. Bring the vehicle to the chosen stabilised speed V.
5.2.1.2.2. Record the torque Ct and speed over a period of at least 20 seconds. The accuracy of the data recording system shall be at least ±1 Nm for the torque and ±0.2 km/h for the speed.
5.2.1.2.3. Differences in torque Ct and speed relative to time shall not exceed 5 per cent for each second of the measurement period.
5.2.1.2.4. The torque Ct1 is the average torque derived from the following formula:
∫∆+
∆=
tt
t1t dt)t(C
t1C
MI
KT
T measuredcorrected ⋅=
1 June 2004
77
5.2.1.2.5. The test shall be carried out three times in each direction. Determine the average torque from these six measurements for the reference speed. If the average speed deviates by more than 1 km/h from the reference speed. a linear regression shall be used for calculating the average torque.
5.2.1.2.6. Determine the average of these two torques Ct1 and Ct2, i.e. Ct.
5.2.1.2.7. The average torque CT determined on the track shall be corrected to the reference ambient conditions as follows:
CTcorrected = K . CTmeasured
where K has the value specified in paragraph 5.1.1.2.8. of this appendix.
5.2.2. On the dynamometer
5.2.2.1. Measurement equipment and error
The equipment shall be identical to that used on the road.
5.2.2.2. Test procedure
5.2.2.2.1. Perform the operations specified in paragraphs 5.1.2.2.1. to 5.1.2.2.4. above.
5.2.2.2.2. Perform the operations specified in paragraphs 5.2.1.2.1. to 5.2.1.2.4. above.
5.2.2.2.3. Adjust the power absorption unit to reproduce the corrected total track torque indicated in paragraph 5.2.1.2.7. above.
5.2.2.2.4. Proceed with the same operations as in paragraph 5.1.2.2.7., for the same purpose.
5.3. Manifold Pressure Method
5.3.1. Introduction
This method is not a preferred method and shall be used only with fixed load curve shape dynamometers for determination of load setting at 80 km/h and cannot be used for vehicles with compression-ignition engines.
5.3.2. Test instrumentation
The vacuum (or absolute pressure) in the vehicle’s intake manifold shall be measured to an accuracy of ± 0.25 kPa. It shall be possible to record this reading continuously or at intervals of no more than one second. The speed shall be recorded continuously with a precision of ± 0.4 km/h.
1 June 2004
78
5.3.3. Road test
5.3.3.1. Ensure that the requirements of paragraph 4. of this Appendix.
5.3.3.2. Drive the vehicle at a steady speed of 80 km/h, recording speed and vacuum (or absolute pressure) in accordance with the requirements of paragraph 5.3.2. above.
5.3.3.3. Repeat procedure set out in paragraph 5.3.3.2. above three times in each direction. All six runs shall be completed within four hours.
5.3.4. Data reduction and acceptance criteria
5.3.4.1. Review results obtained in accordance with paragraphs 5.3.3.2. and 5.3.3.3. above. (Speed shall not be lower than 79.5 km/h or greater than 80.5 km/h for more than one second). For each run, read vacuum level at one second intervals, calculate mean vacuum and standard deviation. This calculation shall consist of no less than 10 readings of vacuum.
5.3.4.2. The standard deviation shall not exceed 10 per cent of the mean for each run.
5.3.4.3. Calculate the mean value for the six runs (three runs in each direction).
5.3.5. Dynamometer setting
5.3.5.1. Preparation
Perform the operations specified in paragraphs 5.1.2.2.1. to 5.1.2.2.4. of this appendix.
5.3.5.2. Load setting
After warm-up, drive the vehicle at a steady speed of 80 km/h and adjust dynamometer load to reproduce the vacuum reading obtained in accordance with paragraph 5.3.4.3. above. Deviation from this reading shall be no greater than 0.25 kPa. The same instruments shall be used for this exercise as were used during the road test.
Related Documents