Conclusions of small- Conclusions of small- scale geomorphology scale geomorphology • Off road vehicles have lasting affects on desert environment • Channels in walkway plots are bimodal and follow the orientation of rock alignments and the piedmont’s steepest gradient • After 50 years the channels in walkway and road plots have not attained the characteristics of channels in control plots, mainly due to compaction and the rock alignments

Conclusions of small-scale geomorphology Off road vehicles have lasting affects on desert environment Channels in walkway plots are bimodal and follow.
Dec 19, 2015
Welcome message from author
This document is posted to help you gain knowledge. Please leave a comment to let me know what you think about it! Share it to your friends and learn new things together.
Transcript

Conclusions of small-scale Conclusions of small-scale geomorphologygeomorphology
• Off road vehicles have lasting affects on desert environment
• Channels in walkway plots are bimodal and follow the orientation of rock alignments and the piedmont’s steepest gradient
• After 50 years the channels in walkway and road plots have not attained the characteristics of channels in control plots, mainly due to compaction and the rock alignments

• Cosmogenic isotopes
• Tracers as sediment moves down piedmont
• Tracers at near surface to determine deposition rates
Switch from human-induced Switch from human-induced rates to long-term rates of rates to long-term rates of
landscape changelandscape change
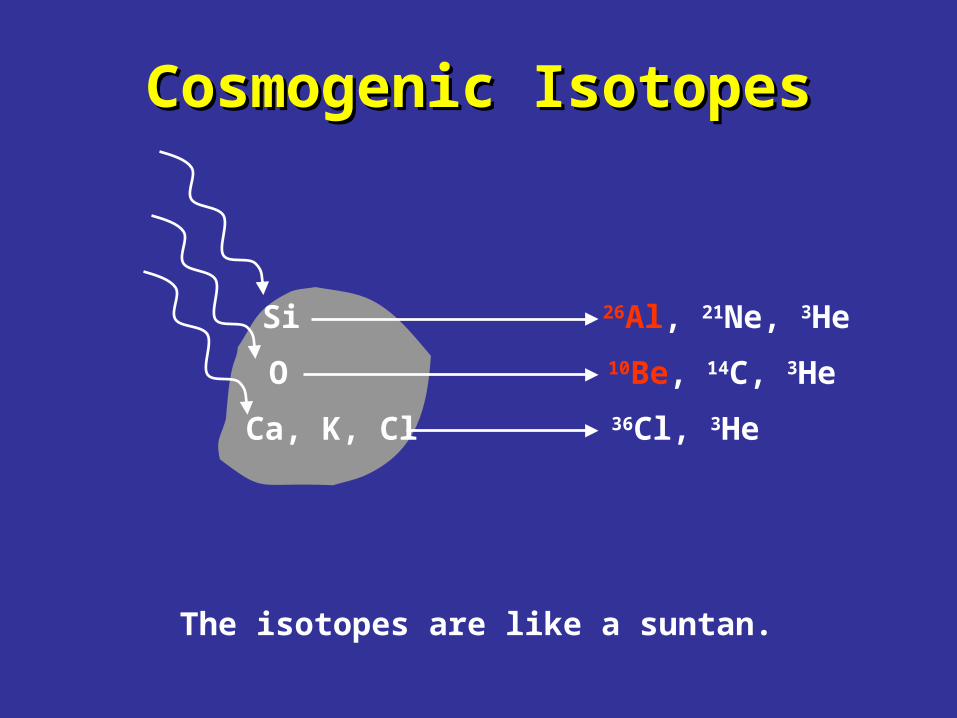
Cosmogenic IsotopesCosmogenic Isotopes
Si
O
Ca, K, Cl
26Al, 21Ne, 3He
10Be, 14C, 3He
36Cl, 3He
The isotopes are like a suntan.
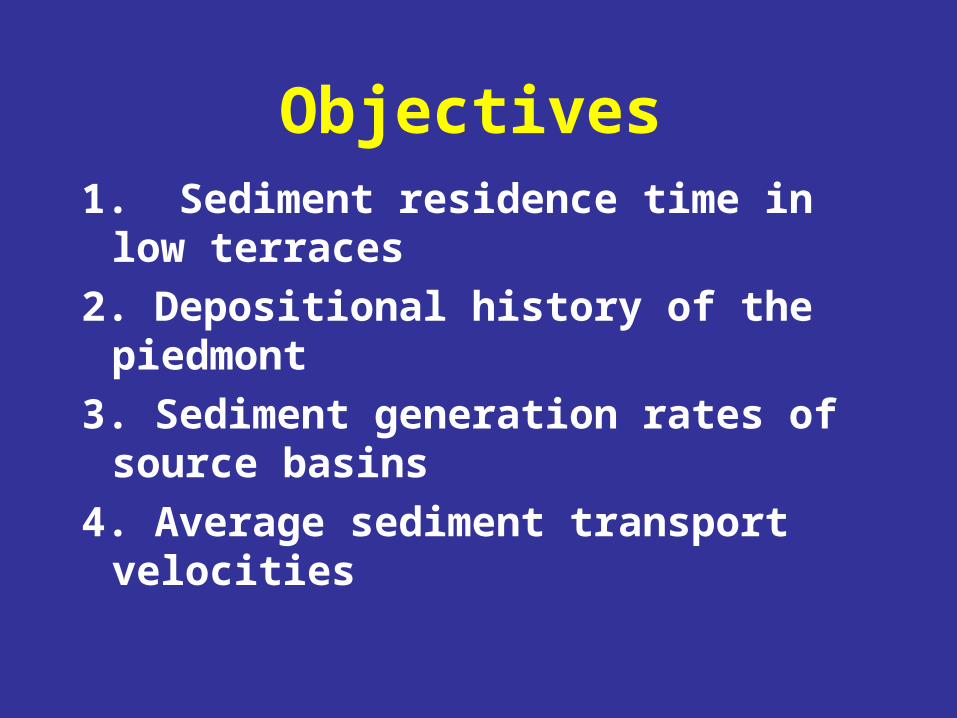
Objectives1. Sediment residence time in low
terraces
2. Depositional history of the piedmont
3. Sediment generation rates of source basins
4. Average sediment transport velocities

Three types of cosmogenic Three types of cosmogenic isotopes samplesisotopes samples
• Integrated valley samples collected from streams that exit steep narrow basins of the Iron and Granite Mountains
• Integrated soil profiles from two pits on the Iron Mountain piedmont
• Integrated transect samples collected at 1 km intervals away from the Iron and Granite Mountain rangefronts
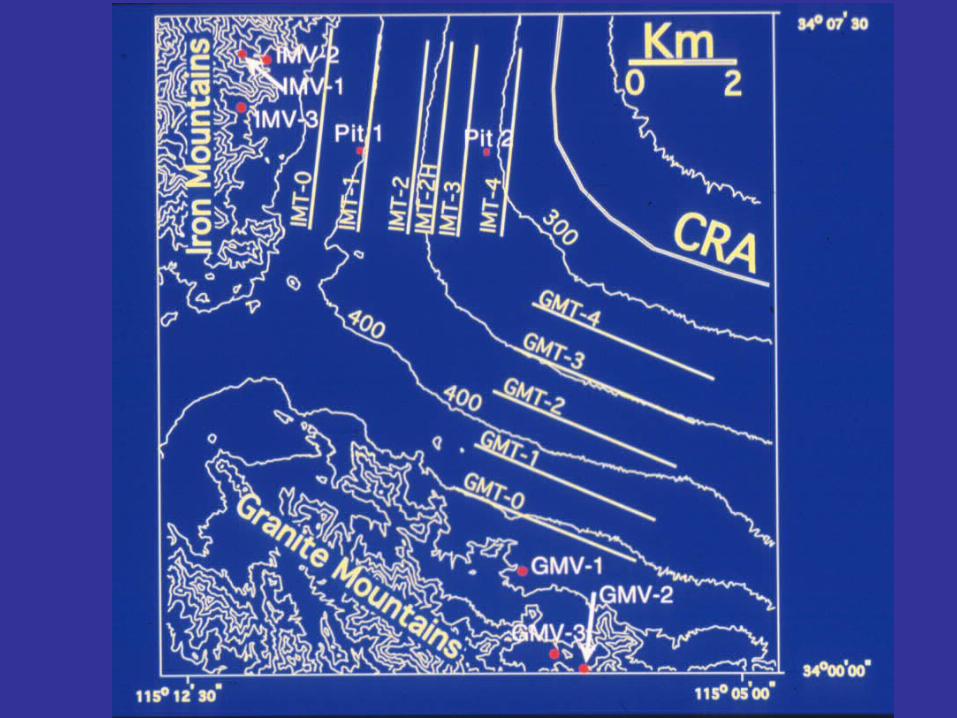
Sampling Map Sampling Map

Valley Valley SampleSample
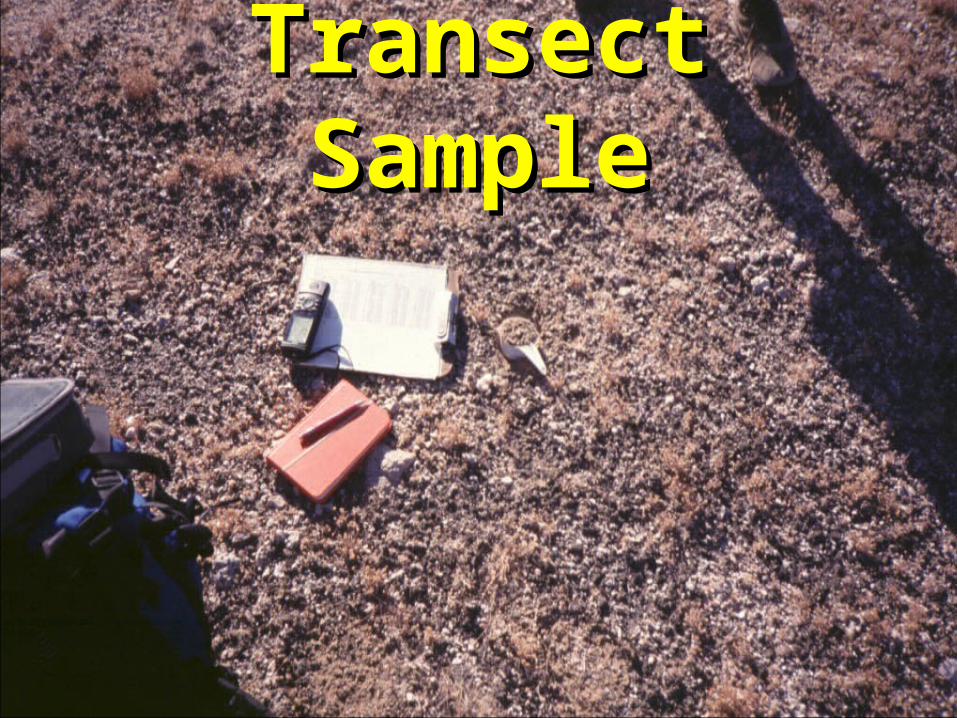
Transect SampleTransect Sample
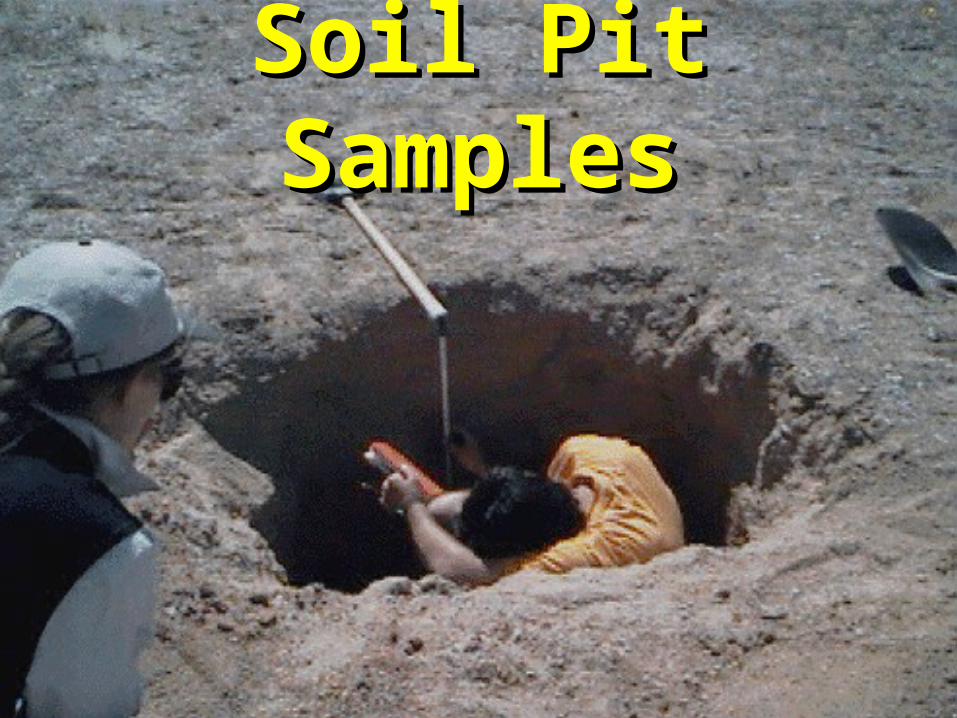
Soil Pit SamplesSoil Pit Samples
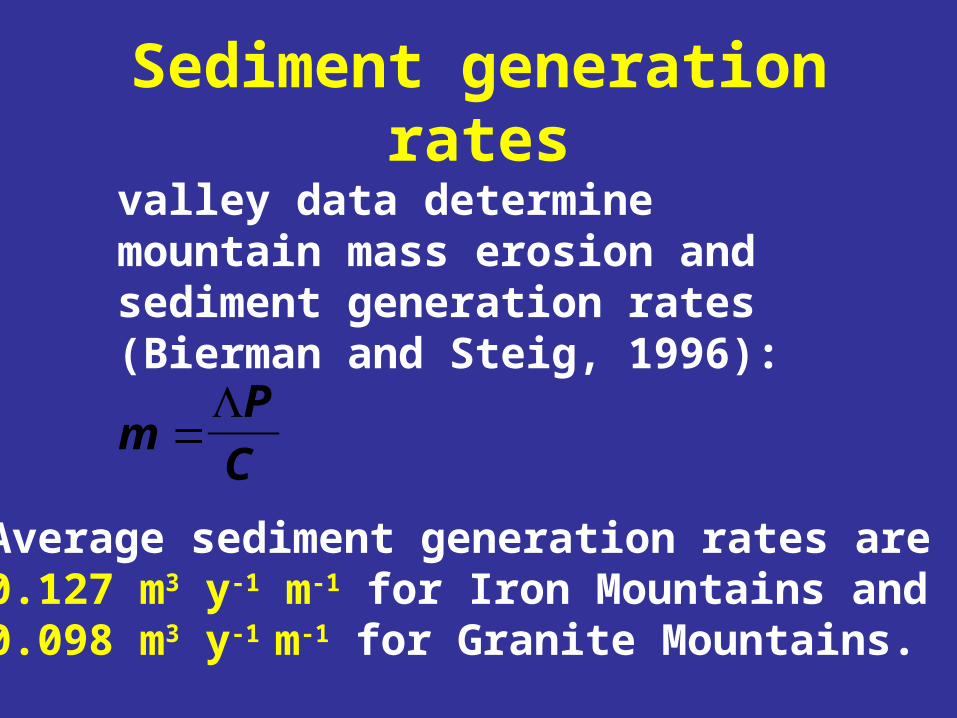
Sediment generation rates
mP
C
valley data determine mountain mass erosion and sediment generation rates (Bierman and Steig, 1996):
Average sediment generation rates are 0.127 m3 y-1 m-1 for Iron Mountains and 0.098 m3 y-1 m-1 for Granite Mountains.
0
100
200
300
400
0 1 2 3 4
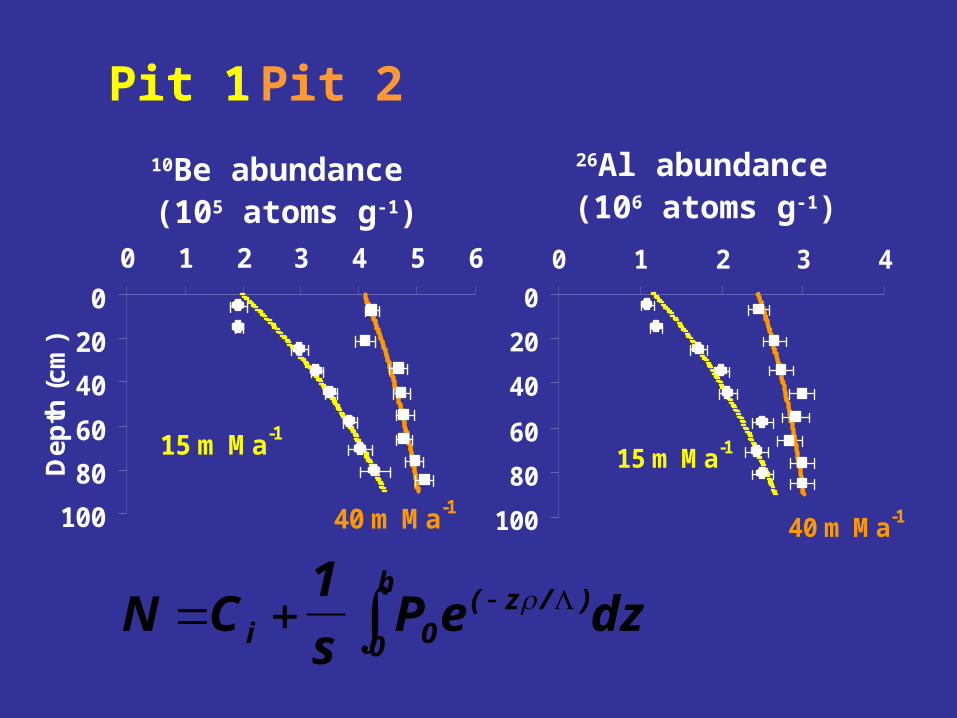
Nuclide abundance (105 atoms g-1)
Dep
th (
cm)
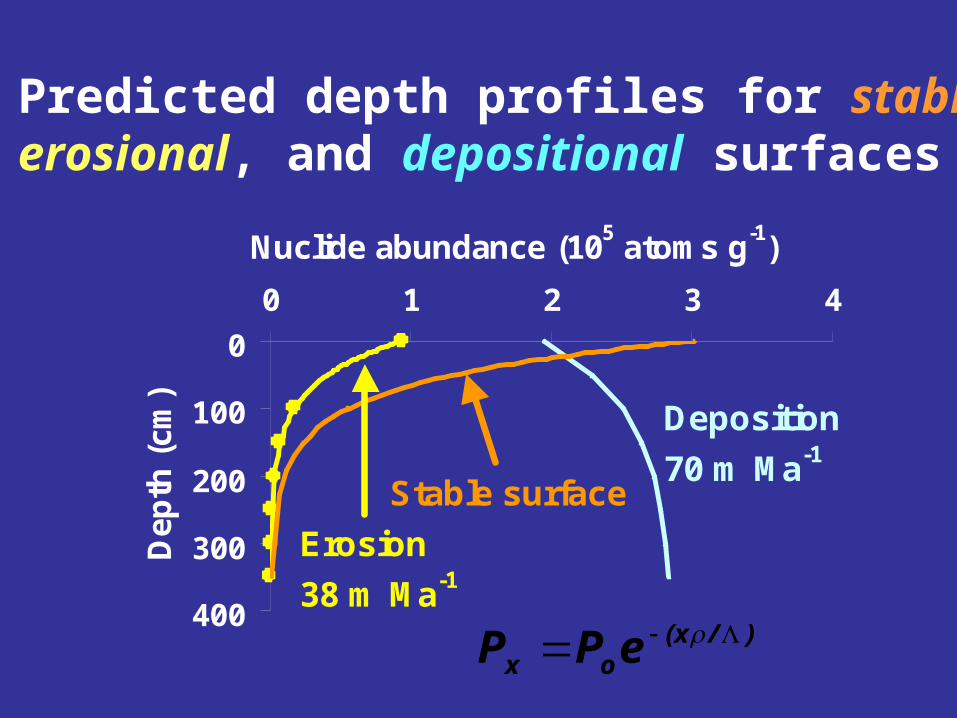
Deposition
70 m Ma-1
Stable surface
Erosion
38 m Ma-1
Predicted depth profiles for stable,erosional, and depositional surfaces
P P ex o(x / )
0
20
40
60
80
100
0 1 2 3 4 5 6
Dep
th (c
m)
15 m Ma-1
40 m Ma-1
0
20
40
60
80
100
0 1 2 3 4
15 m Ma-1
40 m Ma-1
26Al abundance (106 atoms g-1)
10Be abundance (105 atoms g-1)
Pit 1 Pit 2
N C1
sP e dzi 0
( z / )
0
h
Unconformity• Lower nuclide abundances =
less dosed sediment
• Nuclide difference represents a period of time
• Soil pit 1 10Be difference represents ~15 ka and 26Al difference represents ~6 ka

Iron Mountain transect samples

0.E+00
1.E+06
2.E+06
3.E+06
IMT-1 IMT1-CHAN
IMT1-CRIT
IMT1-TERR
IMT-4 IMT4-CHAN
IMT4-CRIT
IMT4-TERR
Nu
clid
e ab
un
dan
ce (
ato
ms
g-1
)Channels “firehose” across
the surface
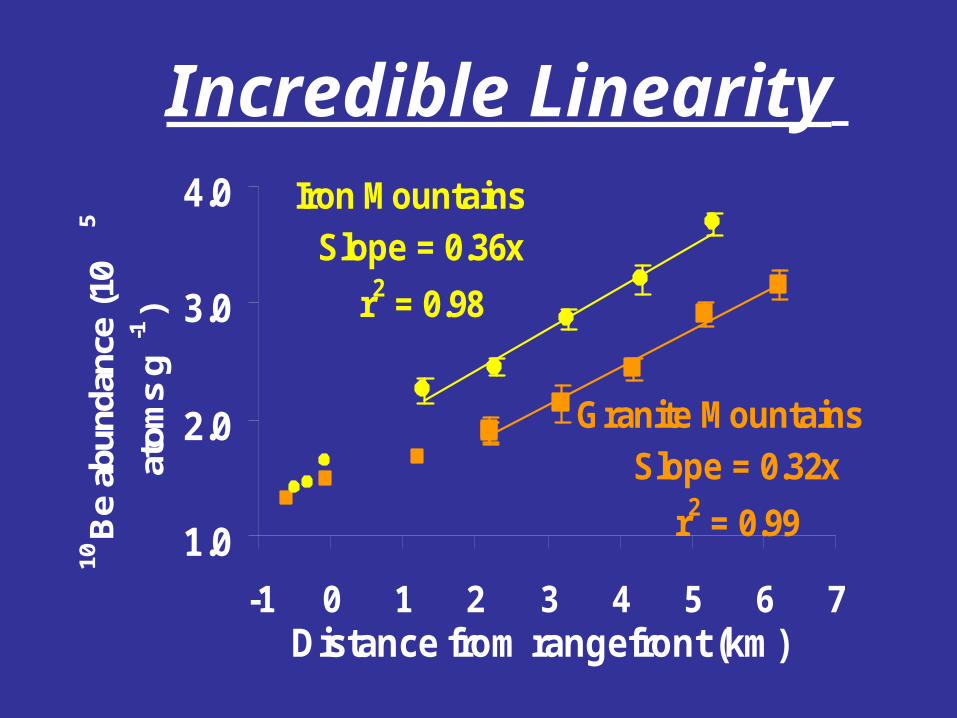
Slope = 0.36x
r2 = 0.98
Slope = 0.32x
r2 = 0.991.0
2.0
3.0
4.0
-1 0 1 2 3 4 5 6 7Distance from rangefront (km)
10B
e ab
unda
nce
(10
5
atom
s g
-1)
Iron Mountains
Granite Mountains
Incredible Linearity

Slope = 0.21x
r2 = 0.93
Slope = 0.26x
r2 = 0.97
0.0
1.0
2.0
3.0
-1 0 1 2 3 4 5 6 7Distance from rangefront (km)
26A
l ab
un
dan
ce (1
06
ato
ms
g-1
)
Iron Mountains
Granite Mountains
More linear trendlines!
Three endmember processes
1. Depositional surface
2. Surface of transport
3. Erosional surface
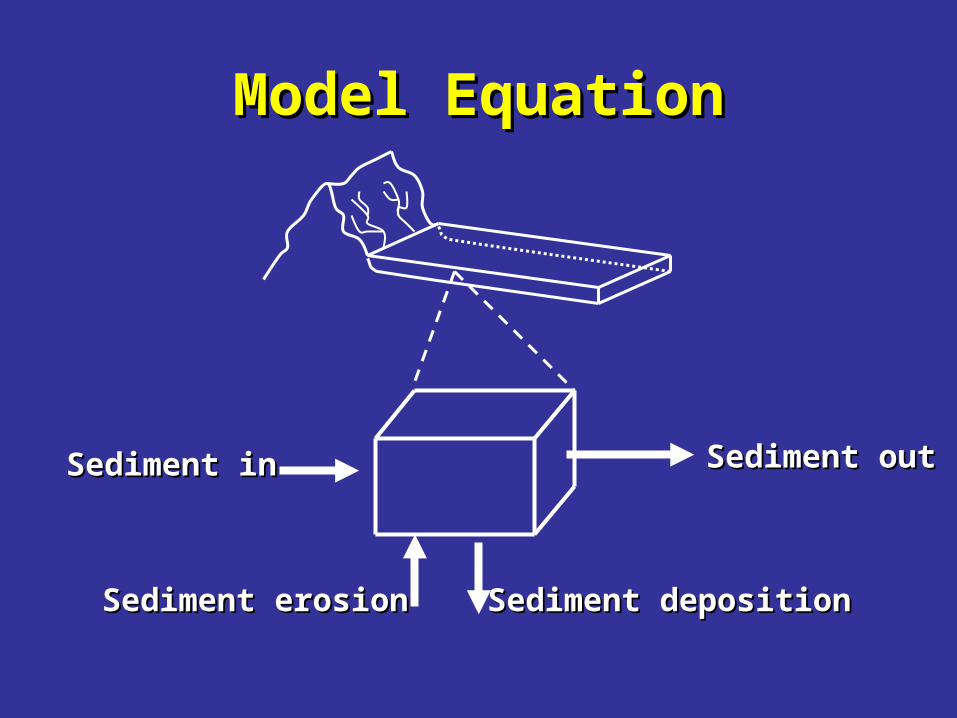
Model EquationModel Equation
Sediment inSediment in Sediment outSediment out
Sediment depositionSediment depositionSediment erosionSediment erosion

Constraints on piedmont deposition and active layer• Deposition rates are not uniform across
piedmont (15 m Ma-1 to 40 m Ma-1)
• Deposition rates are not uniform through time (unconformity from ~5 to ~15 ka at soil pit 1)
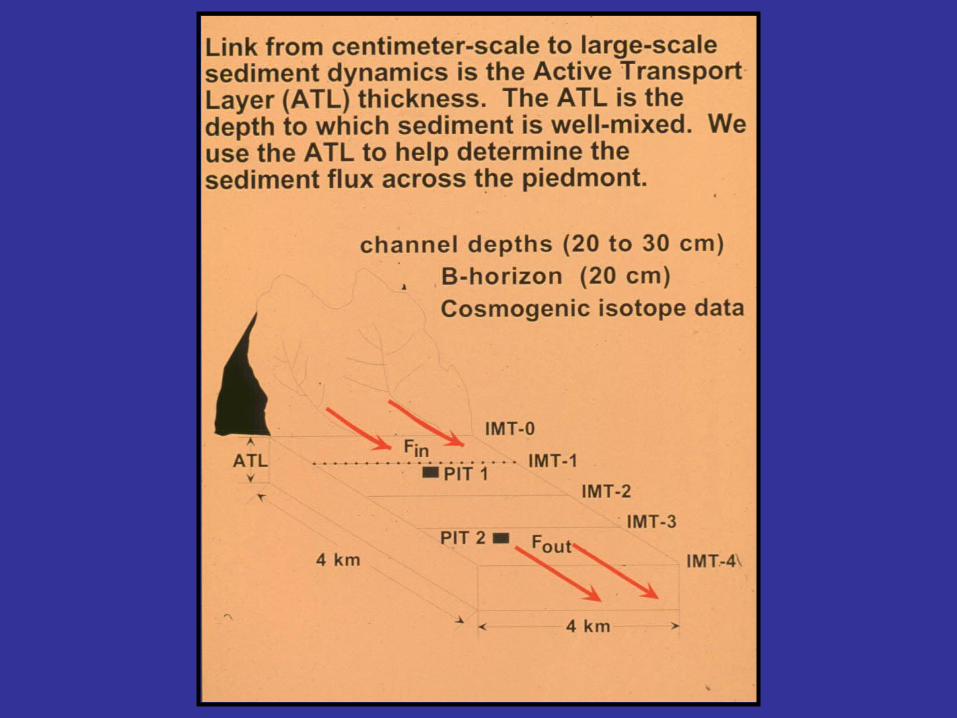
• Active layer is well-mixed and thickness (20 to 30 cm) is spatially uniform

Mixed layer or active layer is uniform thickness (20 to 30
cm) as determined from• measurement of B-horizon
depth
• measurements of maximum channel depths
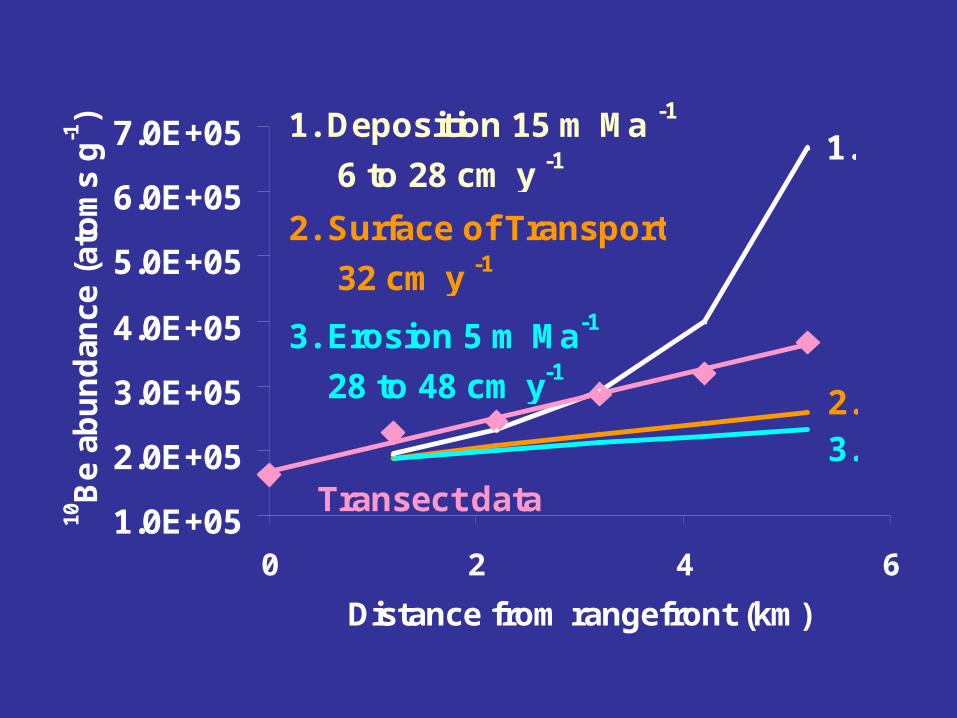
1.0E+05
2.0E+05
3.0E+05
4.0E+05
5.0E+05
6.0E+05
7.0E+05
0 2 4 6
Distance from rangefront (km)
10B
e ab
un
dan
ce (
ato
ms
g-1) 1. Deposition 15 m Ma -1
6 to 28 cm y -1
3. Erosion 5 m Ma-1
28 to 48 cm y-1
Transect data
2. Surface of Transport
32 cm y -1
1.
2.3.

Mixed model assumesPre-unconformity
• 40 cm ATL• 25 m Ma-1 erosion
rates• deposition of 15 m
Ma-1
• deposition of 40 m Ma-1
Post-unconformity• 30 cm ATL• 38 m Ma-1 erosion
rates• surface of transport• deposition of 40 m
Ma-1

1
2
3
4
5
-2000 0 2000 4000 6000
Distance from rangefront (m)
10B
e a
bu
nd
an
ce
(10
5 ato
ms
g-1
)Mixed Model
Velocities are 35 ±10 cm y-1
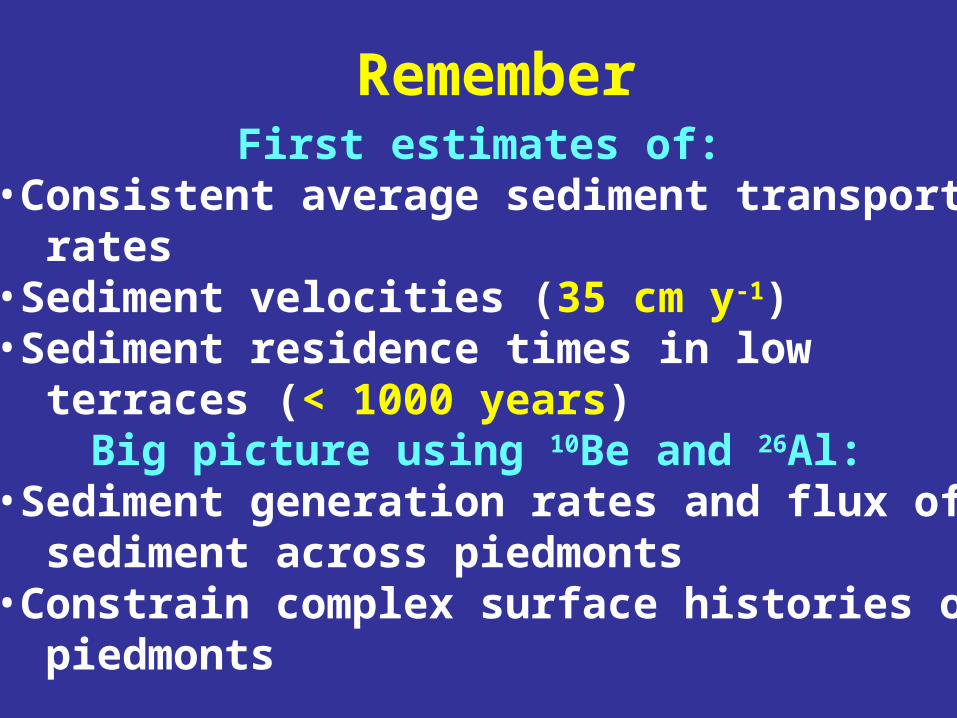
Remember First estimates of:
•Consistent average sediment transport rates•Sediment velocities (35 cm y-1)•Sediment residence times in low terraces (< 1000 years)
Big picture using 10Be and 26Al:•Sediment generation rates and flux of sediment across piedmonts•Constrain complex surface histories of piedmonts
Acknowledgements• We would like to thank Darrin Santos and
Christine Massey for field assistance
• U.S. Army Research Office for funding this research
• Ben Copans and Susan Nies for laboratory assistance
• John Southon and Erik Clapp for AMS assistance
Related Documents