Competencies and Early Labour Market Careers of Higher Education Graduates in Europe Editors: Jim Allen, Samo Pavlin and Rolf van der Velden Authors: Jim Allen, Johan Coenen, Martin Humburg, Samo Pavlin, Peter Robert, Ivan Svetlik and Rolf van der Velden

Welcome message from author
This document is posted to help you gain knowledge. Please leave a comment to let me know what you think about it! Share it to your friends and learn new things together.
Transcript

Competencies and Early Labour Market Careers of Higher Education Graduates in Europe
Editors:Jim Allen, Samo Pavlin and Rolf van der Velden
Authors: Jim Allen, Johan Coenen, Martin Humburg, Samo Pavlin, Peter Robert,
Ivan Svetlik and Rolf van der Velden
ISBN 978-961235548
9 789612 355487
The work environment encountered by graduates can be described as dynamic, innovative, competitive, quality-oriented, and often international. As many as half of all graduates across all countries have undergone a reorganization within the last 12 months, and a similar proportion work in organizations that can be described as innovative, and that rely heavily on higher education graduates for the introduction of their innovations. The vast majority of graduates working in the private sector across all countries report working in an organization experiencing high or very high levels of competition. Arguably more remarkable is the fact that around two in every five graduates working in the public sector also report high levels of competition. Competition by quality rather than price prevails across all countries/regions. Many graduates work in organizations with an international scope of operations.
ISBN 978-961-235-548-7
Final report Cover B5 170 x 240.indd 1 14. 12. 11 19:46


Competencies and Early Labour Market Careers of Higher Education Graduates in Europe
Editors: Jim Allen, Samo Pavlin and Rolf van der Velden
Authors: Jim Allen, Johan Coenen, Martin Humburg, Samo Pavlin, Peter Robert,
Ivan Svetlik and Rolf van der Velden
Ljubljana, 2011
Competencies and Early Labour Market Careers of Higher Education Graduates in Europe Edited by: Jim Allen, Samo Pavlin and Rolf van der Velden Authors: Jim Allen, Johan Coenen, Martin Humburg, Samo Pavlin, Peter Robert, Ivan Svetlik and Rolf van der Velden Publisher: University of Ljubljana, Faculty of Social Sciences Copyright © FDV, 2011. Photocopying and reproduction in parts and in whole is prohibited. All rights reserved. Reviewed by: Andrej Kohont, Alojzija Židan Cover design by: Darinka Knapič Cover photo: iStock Printed by: NTD d. o. o. Print run: 200 copies
The project HEGESCO (Higher Education as a Generator of Strategic Competences -. 133838-LLP-1-2007-1-SI-ERASMUS-EMHE) - key source of this book - has been co-
funded with support from the European Commission. This publication reflects the views only of the author, and the Commission cannot be held responsible for any use
which may be made of the information contained therein.
Technical preparation of this book has been co-funded with support from the Slovenian Research Agency.
_________________________________________________ CIP - Kataložni zapis o publikaciji Narodna in univerzitetna knjižnica, Ljubljana 378(4)(082) 331.5(4):378(082) COMPETENCIES and early labour market careers of higher education graduates in Europe / [authors Jim Allen ... et al.] ; editors Jim Allen, Samo Pavlin and Rolf van der Velden. - Ljubljana : Faculty of Social Sciences, 2011 ISBN 978-961-235-548-7 1. Allen, Jim 258618880
Acknowledgements The authors would like to acknowledge the indispensible support received from all
partners in the participating countries of the HEGESCO project. Our thanks go to
Helena Kovačič, Andrej Kohont, Nevenka Černigoj-Sadar, Miroljub Ignjatović and
Mateja Melink at the University of Ljubljana; to Arzu Akkuyunlu, Selda Onderoglu,
Buket Akkonyunlu and Bugay Turhan at Hacettepe University; to Matild Sagi at
TARKI; to Kestutis Pukelis, Nora Pileicikiene and Elina Dailidiene at Vytautus
Magnus University; and to Monika Domanska, Joanna Zyra and Viktor Shevchuk at
Cracow University of Technology. We would also like to acknowledge the invaluable
advice provided by the members of the HEGESCO Project’s advisory board: Julia
Evetts at Nottingham University; Ulrich Teichler at Kassel University; and Bo
Hansson from the OECD.

Table of Contents
Chapter 1 Introduction ................................................................................................................ 7 Jim Allen and Rolf van der Velden 1.1 Background ........................................................................................................ 7 1.2 Methods and data ............................................................................................. 8 1.3 Structure of the book ......................................................................................... 9 Chapter 2 Higher Education Experiences ............................................................................... 11 Jim Allen, Johan Coenen and Martin Humburg 2.1 Introduction ..................................................................................................... 11 2.2 Program characteristics .................................................................................. 11 2.2 Modes of teaching and learning ...................................................................... 15 2.3 Study behaviour .............................................................................................. 20 2.4 Experiences acquired during higher education ............................................... 22 2.5 Conclusions .................................................................................................... 26 Chapter 3 The Transition and Early Career ............................................................................. 29 Jim Allen, Johan Coenen and Martin Humburg 3.1 Introduction ..................................................................................................... 29 3.2 Transition ........................................................................................................ 29 3.3 Current labour force status ............................................................................. 37 3.4 Quality of employment .................................................................................... 40 3.5 Evaluation of study programme ...................................................................... 49 3.6 Conclusions .................................................................................................... 53 Chapter 4 The Role of Higher Education in Producing Relevant Competences ................. 55 Jim Allen, Johan Coenen and Martin Humburg 4.1 Introduction ..................................................................................................... 55 4.2 Required and acquired competences ............................................................. 55 4.3 Strong and weak points of study programme ................................................. 60 4.4 Determinants of competencies ....................................................................... 62 4.5 Conclusions .................................................................................................... 71
Chapter 5 The World of Work and the Demand for Competences ........................................ 73 Samo Pavlin and Ivan Svetlik 5.1 Economic sectors and occupational groups ................................................... 73 5.2 Characteristics of work organizations ............................................................. 76 5.3 Characteristics of jobs ..................................................................................... 86 5.4 The effect of organizational and job characteristics on the demand for competences .............................................................................................................. 89 5.5 Knowledge management characteristics of jobs as predictors of required human capital of graduates ........................................................................................ 99 5.6 Conclusions .................................................................................................. 102 Chapter 6 Country Patterns of Labour Market Entry and Early Career .............................. 107 Peter Robert 6.1 Introduction ................................................................................................... 107 6.2 Grouping countries: on what basis? .............................................................. 107 6.3 Dimensions and indicators for the country patterns ...................................... 109 6.4 Country patterns ........................................................................................... 112
6.4.1 Labour market entry ............................................................................... 112 6.4.2 Match between qualification and current job .......................................... 114 6.4.3 Mobility out of first employment / job ...................................................... 116 6.4.4 Unemployment experience ..................................................................... 118 6.4.5 General typology .................................................................................... 120
6.5 Discussion of the results ............................................................................... 122 Chapter 7 Conclusions and Policy Implications .................................................................. 127 Rolf van der Velden and Jim Allen 7.1 Conclusions .................................................................................................. 127 7.2 Policy Implications ........................................................................................ 130
References ........................................................................................................... 135
7
Chapter 1 Introduction Jim Allen and Rolf van der Velden
1.1 Background
In the knowledge based society the attention of higher education institutions is increasingly focused on the positions their graduates attain in the world of work and society. This is reflected in a recent communication by the European Commission (2003) on “the role of Universities1 within the knowledge society and economy in Europe and on the conditions under which they will be able to effectively play that role”. Against this background, higher education policy has increasingly gained a European dimension, with its own distinct influence over national education policies. It is clear that the Bologna declaration and the subsequent initiatives have put higher education in the centre of EU policy with the goal to create a “Europe of knowledge”. The EU’s stated strategic goal for the current decade is ‘to become the most competitive and dynamic knowledge-based economy in the world capable of sustainable economic growth with more and better jobs and greater social cohesion’ (European Commission, 2000). Universities play a vital role in this Europe of knowledge, as the recent communication of the Commission has made clear (European Commission, 2003). This opens up a number of issues. One of the most important is the potential for competence development in higher education. It is important to know what competences are needed for successful entry into the labour market, better employability and active citizenship, how these competences are related to characteristics of jobs and firms, to what extent higher education graduates possess these competences, and to what extent HE provides these competences. This book aims to provide empirically based answers to these questions. This is done on the basis of data obtained via the HEGESCO Project. Among other things, this project involved a large-scale quantitative survey among graduates 4-5 years after graduation. This large-scale survey was based on the methodology developed by the REFLEX network, which already conducted a comparable survey in 16 other (mainly EU) countries. The project identifies the major competencies that are required of HE graduates by employers and the extent to which HE has provided a solid basis for developing these competencies. A key aim of the project is to relate these competences to characteristics of the national HE system, to the HE program followed as well as to specific modes of teaching, learning and assessment during the HE course. To this end a comprehensive knowledge base has been developed
1 Taken to mean all higher education institutions, including for example Fachhochschulen, polytechnics and Grandes Ecoles.
Competencies and Early Labour Market Careers of Higher Education Graduates in Europe
8
on which recommendations of strategy development and implementation for broader group of beneficiaries can be developed.
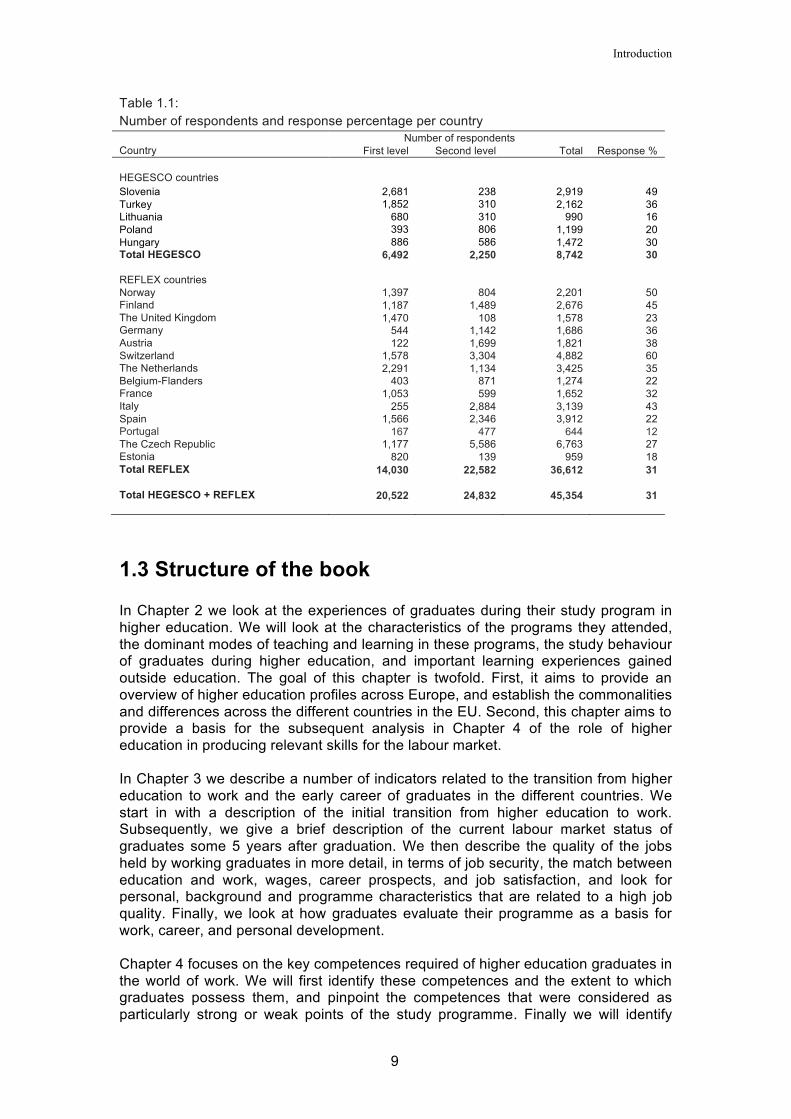
1.2 Methods and data As stated above, the large scale survey used in the HEGESCO Project is based on the methodology developed by the REFLEX network, and the data from the REFLEX survey is used in this book to provide a frame of reference against which the outcomes of the HEGESCO Project are interpreted.2 The REFLEX project was carried out in sixteen countries: Austria, Belgium-Flanders, the Czech Republic, Estonia, Finland, France, Germany, Italy, Japan, the Netherlands, Norway, Portugal, Spain, Sweden, Switzerland and the UK. The HEGESCO Project was carried out two to three years later in five additional countries: Slovenia, Turkey, Lithuania, Poland and Hungary. Together with Estonia and the Czech Republic, which took part in the REFLEX project, the participating countries in HEGESCO are all new and candidate member states (NCMS) of the European Union. In each country in both the REFLEX and HEGESCO Projects, a representative sample was drawn of graduates from ISCED 5A who got their degree five years prior to the time of the survey (in most REFLEX countries this was the academic year 1999/2000, in the HEGESCO countries the academic year 2002/2003). The data collection for REFLEX took place in 2005, and that for HEGESCO in 2008. The mail questionnaire focusses on educational experiences before and during higher education, the transition to the labour market, characteristics of the first job, characteristics of the occupational and labour market career up to the present, characteristics of the current job, characteristics of the current organization, assessment of required and acquired skills, evaluation of the educational program, work orientations, and some socio-biographical information. Higher education in most European countries is characterized by a certain degree of internal differentiation. Because it is essential to take into account differences in level of higher education, but not practical to book detailed results for each type in each country, in this book we draw a broad distinction between those higher education programmes that provide direct access to a PhD – referred to as second level programmes, e.g. university master level programmes – and those programmes that do not provide direct access to PhD – referred to as first level programmes, e.g. bachelor programmes, programmes offered by Fachhochschulen. Table 1 contains an overview of the number of available respondents and the response percentage per country. It is clear that the number of respondents differs strongly between countries. To prevent certain countries from dominating the mean results across all countries, all descriptive analyses presented in this book are weighted to 2,000 cases for each country. The weighting coefficient used also corrects for over- or underrepresentation of certain levels or fields of higher education compared to population figures. Multivariate analyses use unweighted data, whereby a random sample of no more than 2.000 cases per country has been drawn.
2 An exception is made for Japan, which is quite different in many respects from all European countries, and as such is not seen as an informative point of comparison for interpreting the results of the HEGESCO Project.
Introduction
9
Table 1.1: Number of respondents and response percentage per country Number of respondents Country First level Second level Total Response % HEGESCO countries Slovenia 2,681 238 2,919 49 Turkey 1,852 310 2,162 36 Lithuania 680 310 990 16 Poland 393 806 1,199 20 Hungary 886 586 1,472 30 Total HEGESCO 6,492 2,250 8,742 30 REFLEX countries Norway 1,397 804 2,201 50 Finland 1,187 1,489 2,676 45 The United Kingdom 1,470 108 1,578 23 Germany 544 1,142 1,686 36 Austria 122 1,699 1,821 38 Switzerland 1,578 3,304 4,882 60 The Netherlands 2,291 1,134 3,425 35 Belgium-Flanders 403 871 1,274 22 France 1,053 599 1,652 32 Italy 255 2,884 3,139 43 Spain 1,566 2,346 3,912 22 Portugal 167 477 644 12 The Czech Republic 1,177 5,586 6,763 27 Estonia 820 139 959 18 Total REFLEX 14,030 22,582 36,612 31 Total HEGESCO + REFLEX 20,522 24,832 45,354 31
1.3 Structure of the book In Chapter 2 we look at the experiences of graduates during their study program in higher education. We will look at the characteristics of the programs they attended, the dominant modes of teaching and learning in these programs, the study behaviour of graduates during higher education, and important learning experiences gained outside education. The goal of this chapter is twofold. First, it aims to provide an overview of higher education profiles across Europe, and establish the commonalities and differences across the different countries in the EU. Second, this chapter aims to provide a basis for the subsequent analysis in Chapter 4 of the role of higher education in producing relevant skills for the labour market. In Chapter 3 we describe a number of indicators related to the transition from higher education to work and the early career of graduates in the different countries. We start in with a description of the initial transition from higher education to work. Subsequently, we give a brief description of the current labour market status of graduates some 5 years after graduation. We then describe the quality of the jobs held by working graduates in more detail, in terms of job security, the match between education and work, wages, career prospects, and job satisfaction, and look for personal, background and programme characteristics that are related to a high job quality. Finally, we look at how graduates evaluate their programme as a basis for work, career, and personal development. Chapter 4 focuses on the key competences required of higher education graduates in the world of work. We will first identify these competences and the extent to which graduates possess them, and pinpoint the competences that were considered as particularly strong or weak points of the study programme. Finally we will identify

Competencies and Early Labour Market Careers of Higher Education Graduates in Europe
10
characteristics of the higher education program that are relevant in producing the key competences. The main purpose of Chapter 5 is to learn in what way the characteristics of jobs and organizations affect the demand for graduates’ competences. We start by exploring the distribution of graduates by occupational groups and economic sectors, before describing some more substantive characteristics of work organizations and jobs. Subsequently, we study in what way the characteristics of jobs and work organizations impact graduates’ requirements in the world of work. Finally, we look at the knowledge management processes graduates are involved in at work, and explore in what way these processes affect competence requirements and the utilization of knowledge and skills. In Chapters 2 to 5, the NCMS (new and candidate member states: the HEGESCO countries together with the Czech Republic and Estonia from the REFLEX Project) are compared, individually and as a group, with the remaining northern and southern European REFLEX countries. The results presented in these chapters make clear that the NCMS not only differ in many respects from northern and southern REFLEX countries, but also from each other. The aim of Chapter 6 is to search more systematically for typical “combinations” of countries in terms of graduates’ labour market entry and early career experiences. This is done using selected indicators on a number of dimensions of labour market entry and early career processes to form clusters of countries based on the statistical method of cluster analysis. Chapter 7 concludes this volume by drawing some general conclusions from the results of the separate chapters, and deriving some policy implications for different groups of stakeholders.

Higher Education Experiences
11
Chapter 2 Higher Education Experiences Jim Allen, Johan Coenen and Martin Humburg
2.1 Introduction In this chapter we look at the experiences of graduates during their study program in higher education. We will look into questions such as:
What are the main characteristics of the programs they attended? (Section 2.2)
What were the dominant modes of teaching and learning in these programs? (Section 2.3)
What was the study behaviour of graduates during higher education? (Section 2.4)
Did graduates have important learning experiences outside education and if so, what were these experiences? (Section 2.5)
The goal of this chapter is twofold. First, it will provide an overview of higher education profiles across Europe. Do we find major differences across the different countries in the EU or is there a more universal pattern? Are the different characteristics related? If so, what patterns do we find? Second, this chapter provides a basis for the subsequent analysis in Chapter 4 of the role of higher education in producing relevant skills for the labour market.
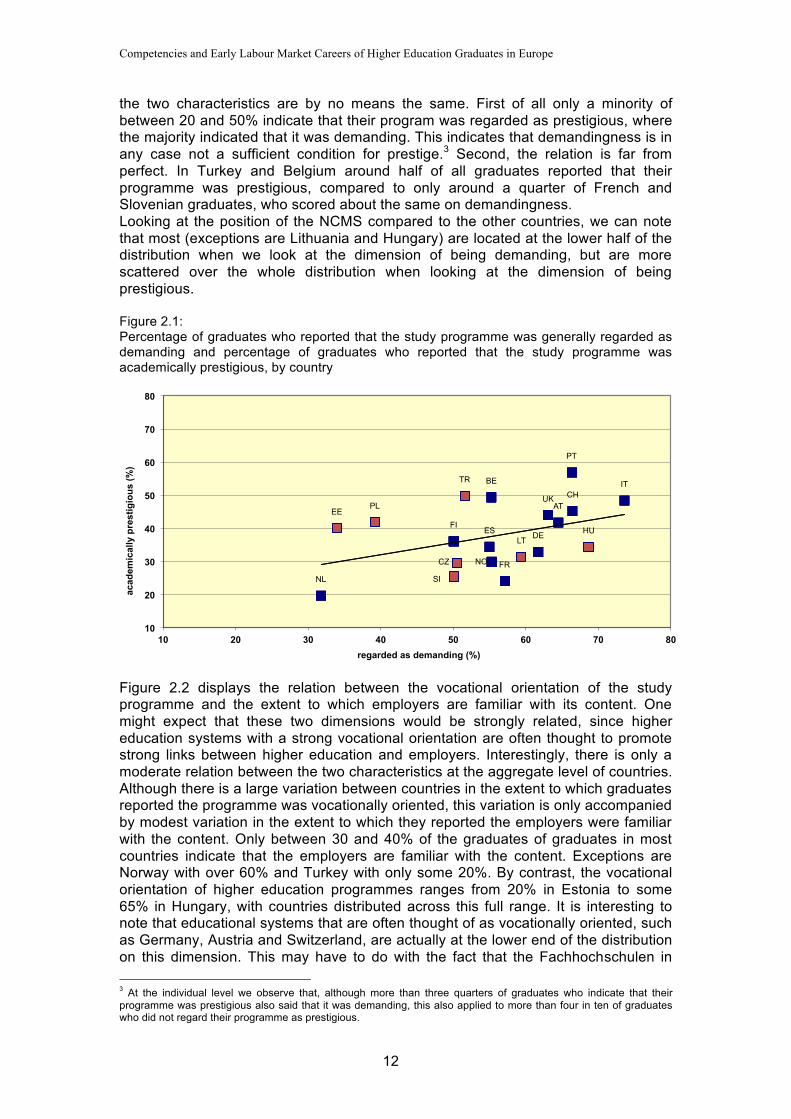
2.2 Program characteristics In the survey, graduates were asked to characterize their study on the basis of a number of statements. For each of these statements, the respondents could indicate to which extent these statements applied to their study program on a 5-point scale ranging from 1 (Not at all) to 5 (To a very high extent). In order to paint a picture of the main similarities and differences between countries, we have grouped the statements into pairs that are in some way related. We start in Figure 2.1, which gives an overview of the average responses in each of the countries to the statements: ‘The programme was generally regarded as demanding’ and ‘The programme was academically prestigious’. In most of the countries a majority of between 50 and 70% of the graduates indicate that their program was regarded as demanding. Exceptions are the Netherlands, Estonia and Poland, where only between 30 and 40% of graduates indicate that this was the case. Although there is some relation between demandingness and prestige,
Competencies and Early Labour Market Careers of Higher Education Graduates in Europe
12
the two characteristics are by no means the same. First of all only a minority of between 20 and 50% indicate that their program was regarded as prestigious, where the majority indicated that it was demanding. This indicates that demandingness is in any case not a sufficient condition for prestige.3 Second, the relation is far from perfect. In Turkey and Belgium around half of all graduates reported that their programme was prestigious, compared to only around a quarter of French and Slovenian graduates, who scored about the same on demandingness. Looking at the position of the NCMS compared to the other countries, we can note that most (exceptions are Lithuania and Hungary) are located at the lower half of the distribution when we look at the dimension of being demanding, but are more scattered over the whole distribution when looking at the dimension of being prestigious. Figure 2.1: Percentage of graduates who reported that the study programme was generally regarded as demanding and percentage of graduates who reported that the study programme was academically prestigious, by country
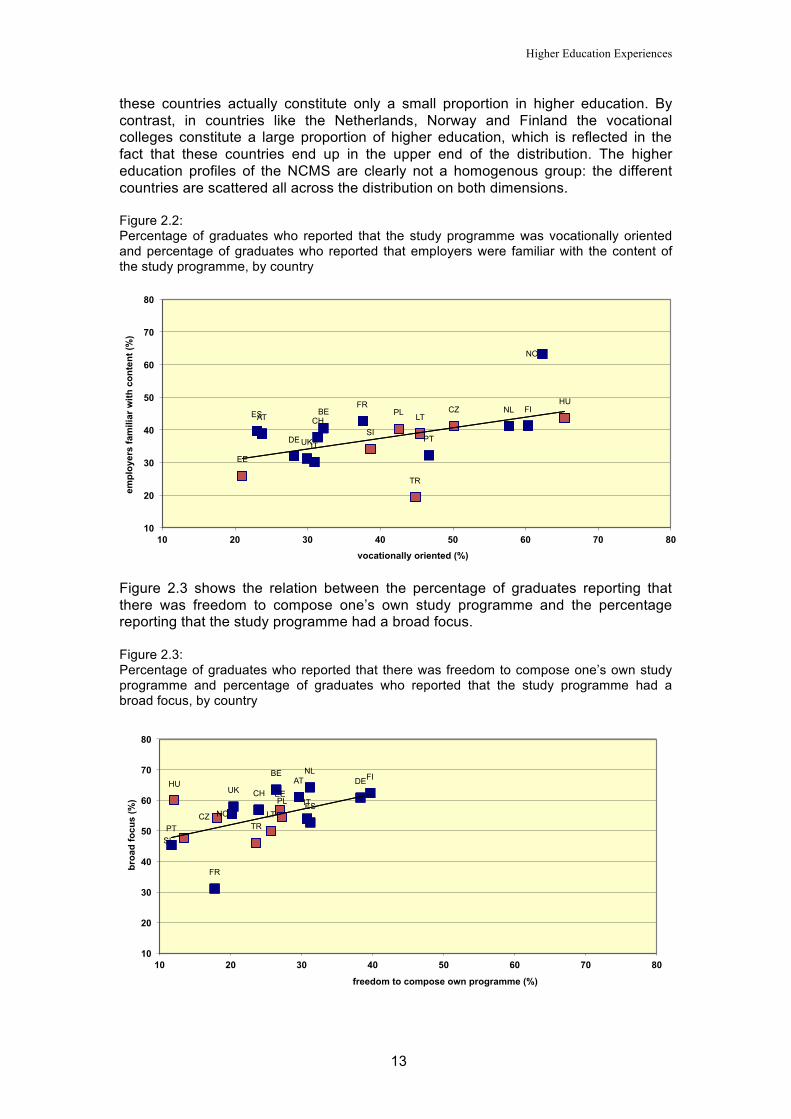
Figure 2.2 displays the relation between the vocational orientation of the study programme and the extent to which employers are familiar with its content. One might expect that these two dimensions would be strongly related, since higher education systems with a strong vocational orientation are often thought to promote strong links between higher education and employers. Interestingly, there is only a moderate relation between the two characteristics at the aggregate level of countries. Although there is a large variation between countries in the extent to which graduates reported the programme was vocationally oriented, this variation is only accompanied by modest variation in the extent to which they reported the employers were familiar with the content. Only between 30 and 40% of the graduates of graduates in most countries indicate that the employers are familiar with the content. Exceptions are Norway with over 60% and Turkey with only some 20%. By contrast, the vocational orientation of higher education programmes ranges from 20% in Estonia to some 65% in Hungary, with countries distributed across this full range. It is interesting to note that educational systems that are often thought of as vocationally oriented, such as Germany, Austria and Switzerland, are actually at the lower end of the distribution on this dimension. This may have to do with the fact that the Fachhochschulen in 3 At the individual level we observe that, although more than three quarters of graduates who indicate that their programme was prestigious also said that it was demanding, this also applied to more than four in ten of graduates who did not regard their programme as prestigious.
IT
ES
FR
AT
DE
NL
UK
FI
NO CZ
CH
PT
BE
EE
SI
TR
LT
PL
HU
10
20
30
40
50
60
70
80
10 20 30 40 50 60 70 80
aca
dem
ical
ly p
rest
igio
us (%
)
regarded as demanding (%)
Higher Education Experiences
13
these countries actually constitute only a small proportion in higher education. By contrast, in countries like the Netherlands, Norway and Finland the vocational colleges constitute a large proportion of higher education, which is reflected in the fact that these countries end up in the upper end of the distribution. The higher education profiles of the NCMS are clearly not a homogenous group: the different countries are scattered all across the distribution on both dimensions. Figure 2.2: Percentage of graduates who reported that the study programme was vocationally oriented and percentage of graduates who reported that employers were familiar with the content of the study programme, by country
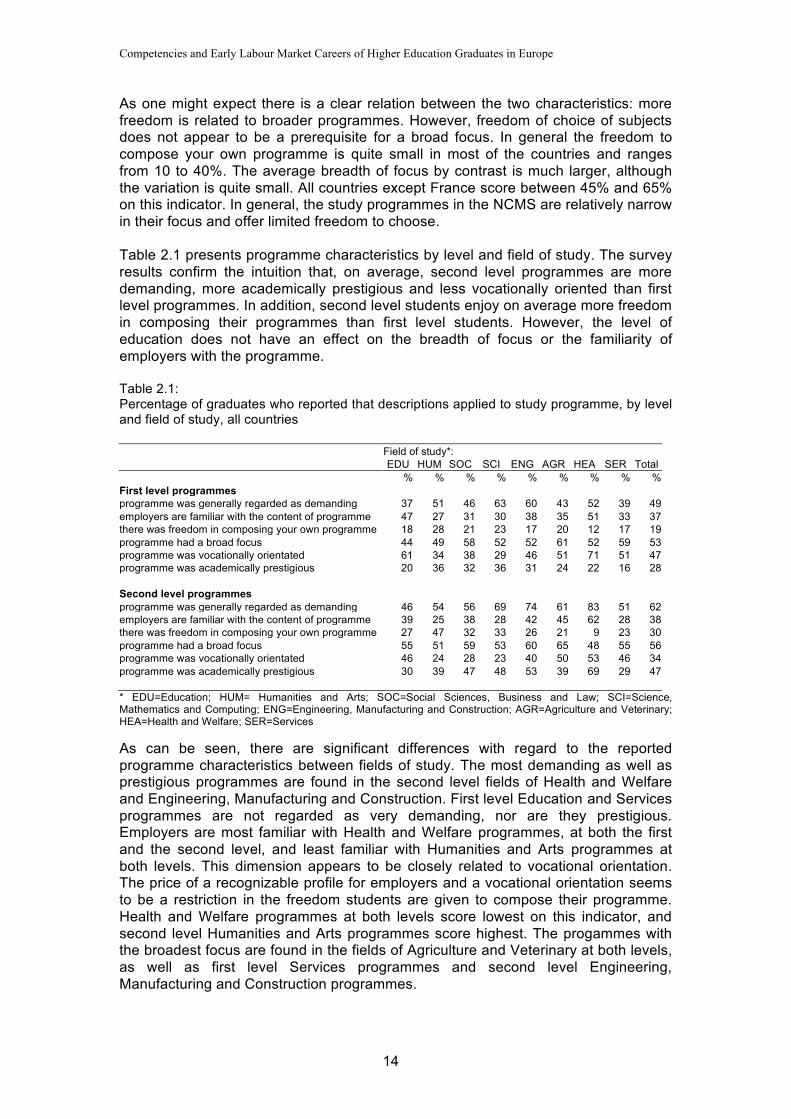
Figure 2.3 shows the relation between the percentage of graduates reporting that there was freedom to compose one’s own study programme and the percentage reporting that the study programme had a broad focus. Figure 2.3: Percentage of graduates who reported that there was freedom to compose one’s own study programme and percentage of graduates who reported that the study programme had a broad focus, by country
IT
ES FR
AT
DE
NL
UK
FI
NO
CZ CH
PT
BE
EE
SI
TR
LT PL HU
10
20
30
40
50
60
70
80
10 20 30 40 50 60 70 80
em
ploy
ers
fam
iliar
with
con
tent
(%)
vocationally oriented (%)
IT ES
FR
AT DE NL
UK FI
NO CZ
CH
PT
BE
EE
SI
TR LT
PL
HU
10
20
30
40
50
60
70
80
10 20 30 40 50 60 70 80
bro
ad fo
cus
(%)
freedom to compose own programme (%)
Competencies and Early Labour Market Careers of Higher Education Graduates in Europe
14
As one might expect there is a clear relation between the two characteristics: more freedom is related to broader programmes. However, freedom of choice of subjects does not appear to be a prerequisite for a broad focus. In general the freedom to compose your own programme is quite small in most of the countries and ranges from 10 to 40%. The average breadth of focus by contrast is much larger, although the variation is quite small. All countries except France score between 45% and 65% on this indicator. In general, the study programmes in the NCMS are relatively narrow in their focus and offer limited freedom to choose. Table 2.1 presents programme characteristics by level and field of study. The survey results confirm the intuition that, on average, second level programmes are more demanding, more academically prestigious and less vocationally oriented than first level programmes. In addition, second level students enjoy on average more freedom in composing their programmes than first level students. However, the level of education does not have an effect on the breadth of focus or the familiarity of employers with the programme. Table 2.1: Percentage of graduates who reported that descriptions applied to study programme, by level and field of study, all countries Field of study*: EDU HUM SOC SCI ENG AGR HEA SER Total % % % % % % % % % First level programmes programme was generally regarded as demanding 37 51 46 63 60 43 52 39 49 employers are familiar with the content of programme 47 27 31 30 38 35 51 33 37 there was freedom in composing your own programme 18 28 21 23 17 20 12 17 19 programme had a broad focus 44 49 58 52 52 61 52 59 53 programme was vocationally orientated 61 34 38 29 46 51 71 51 47 programme was academically prestigious 20 36 32 36 31 24 22 16 28 Second level programmes programme was generally regarded as demanding 46 54 56 69 74 61 83 51 62 employers are familiar with the content of programme 39 25 38 28 42 45 62 28 38 there was freedom in composing your own programme 27 47 32 33 26 21 9 23 30 programme had a broad focus 55 51 59 53 60 65 48 55 56 programme was vocationally orientated 46 24 28 23 40 50 53 46 34 programme was academically prestigious 30 39 47 48 53 39 69 29 47 * EDU=Education; HUM= Humanities and Arts; SOC=Social Sciences, Business and Law; SCI=Science, Mathematics and Computing; ENG=Engineering, Manufacturing and Construction; AGR=Agriculture and Veterinary; HEA=Health and Welfare; SER=Services As can be seen, there are significant differences with regard to the reported programme characteristics between fields of study. The most demanding as well as prestigious programmes are found in the second level fields of Health and Welfare and Engineering, Manufacturing and Construction. First level Education and Services programmes are not regarded as very demanding, nor are they prestigious. Employers are most familiar with Health and Welfare programmes, at both the first and the second level, and least familiar with Humanities and Arts programmes at both levels. This dimension appears to be closely related to vocational orientation. The price of a recognizable profile for employers and a vocational orientation seems to be a restriction in the freedom students are given to compose their programme. Health and Welfare programmes at both levels score lowest on this indicator, and second level Humanities and Arts programmes score highest. The progammes with the broadest focus are found in the fields of Agriculture and Veterinary at both levels, as well as first level Services programmes and second level Engineering, Manufacturing and Construction programmes.

Higher Education Experiences
15
2.2 Modes of teaching and learning Apart from general characteristics of the study programme, graduates were asked to indicate to what extent different modes of teaching and learning were stressed during higher education. Again they could use a 5-point scale ranging from 1 (Not at all) to 5 (To a very high extent). Again, we present the results in scatterplots of related pairs of dimensions. First of all, Figure 2.4 gives an overview of the extent to which lectures and group assignments were stressed. Despite the attention that has been paid in recent years to more group-based as opposed to individual learning, lectures remains the most emphasized mode of learning across all countries. There is a clear though far from perfect negative relation between the extent to which lectures are emphasized and the extent to which group assignments are emphasized, with the Netherlands emerging as the country in which learning in groups is most strongly emphasized, and Lithuania and Estonia appearing as countries where lectures are the dominant form. Almost all of the graduates in these countries indicated that this mode of teaching was emphasized to a high or very high extent. More in general the higher education programmes in the NCMS seem to stress lectures somewhat more, and group assignments somewhat less, than the other countries. Figure 2.4: Mode of teaching: Extent to which lectures versus group assignments were emphasized in the study programme, by country
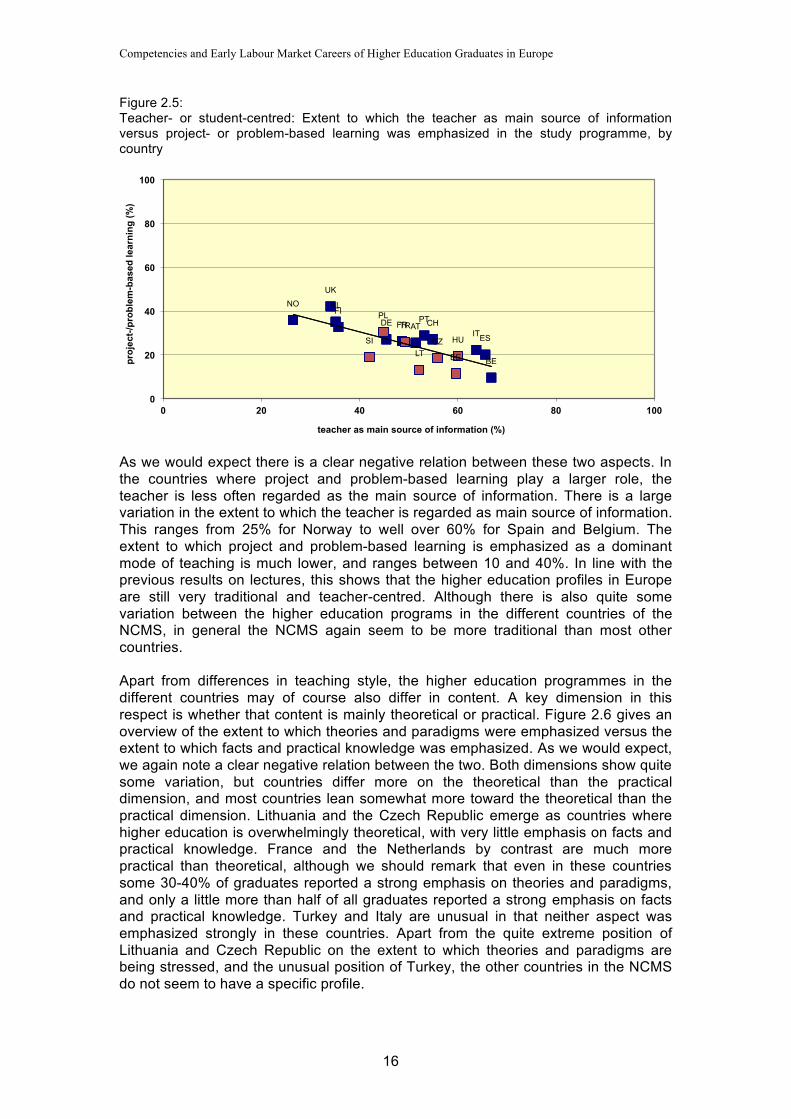
Related to the extent to which education takes place more in lecture or in group sessions is the extent to which the higher education programmes can be characterized as either teacher- or student-centred. Figure 2.5 displays this, based on the percentage of graduates who reported that the following items were emphasized: ‘Teacher was the main source of information’ and ‘Project and problem-based learning’.
IT
FR
AT DE
NL
UK
FI NO
CZ CH
PT
BE EE
SI
TR LT
PL
HU
0
20
40
60
80
100
0 20 40 60 80 100
gro
up a
ssig
nmen
ts (%
)
lectures (%)
Competencies and Early Labour Market Careers of Higher Education Graduates in Europe
16
Figure 2.5: Teacher- or student-centred: Extent to which the teacher as main source of information versus project- or problem-based learning was emphasized in the study programme, by country
As we would expect there is a clear negative relation between these two aspects. In the countries where project and problem-based learning play a larger role, the teacher is less often regarded as the main source of information. There is a large variation in the extent to which the teacher is regarded as main source of information. This ranges from 25% for Norway to well over 60% for Spain and Belgium. The extent to which project and problem-based learning is emphasized as a dominant mode of teaching is much lower, and ranges between 10 and 40%. In line with the previous results on lectures, this shows that the higher education profiles in Europe are still very traditional and teacher-centred. Although there is also quite some variation between the higher education programs in the different countries of the NCMS, in general the NCMS again seem to be more traditional than most other countries. Apart from differences in teaching style, the higher education programmes in the different countries may of course also differ in content. A key dimension in this respect is whether that content is mainly theoretical or practical. Figure 2.6 gives an overview of the extent to which theories and paradigms were emphasized versus the extent to which facts and practical knowledge was emphasized. As we would expect, we again note a clear negative relation between the two. Both dimensions show quite some variation, but countries differ more on the theoretical than the practical dimension, and most countries lean somewhat more toward the theoretical than the practical dimension. Lithuania and the Czech Republic emerge as countries where higher education is overwhelmingly theoretical, with very little emphasis on facts and practical knowledge. France and the Netherlands by contrast are much more practical than theoretical, although we should remark that even in these countries some 30-40% of graduates reported a strong emphasis on theories and paradigms, and only a little more than half of all graduates reported a strong emphasis on facts and practical knowledge. Turkey and Italy are unusual in that neither aspect was emphasized strongly in these countries. Apart from the quite extreme position of Lithuania and Czech Republic on the extent to which theories and paradigms are being stressed, and the unusual position of Turkey, the other countries in the NCMS do not seem to have a specific profile.
IT ES FR AT DE
NL
UK
FI NO
CZ
CH PT
BE EE
SI
TR
LT
PL
HU
0
20
40
60
80
100
0 20 40 60 80 100
pro
ject
-/pro
blem
-bas
ed le
arni
ng (%
)
teacher as main source of information (%)
Higher Education Experiences
17
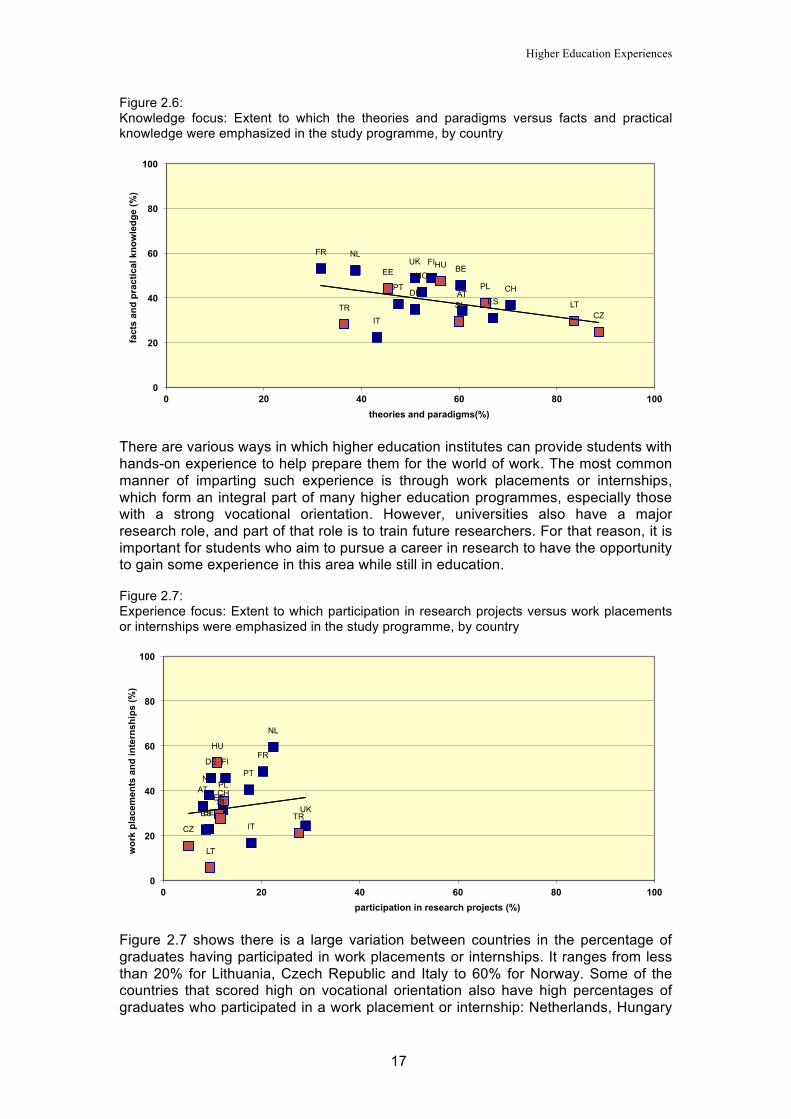
Figure 2.6: Knowledge focus: Extent to which the theories and paradigms versus facts and practical knowledge were emphasized in the study programme, by country
There are various ways in which higher education institutes can provide students with hands-on experience to help prepare them for the world of work. The most common manner of imparting such experience is through work placements or internships, which form an integral part of many higher education programmes, especially those with a strong vocational orientation. However, universities also have a major research role, and part of that role is to train future researchers. For that reason, it is important for students who aim to pursue a career in research to have the opportunity to gain some experience in this area while still in education. Figure 2.7: Experience focus: Extent to which participation in research projects versus work placements or internships were emphasized in the study programme, by country
Figure 2.7 shows there is a large variation between countries in the percentage of graduates having participated in work placements or internships. It ranges from less than 20% for Lithuania, Czech Republic and Italy to 60% for Norway. Some of the countries that scored high on vocational orientation also have high percentages of graduates who participated in a work placement or internship: Netherlands, Hungary
IT
ES
FR
AT DE
NL UK FI
NO
CZ
CH PT
BE EE
SI TR LT
PL
HU
0
20
40
60
80
100
0 20 40 60 80 100
fact
s an
d pr
actic
al k
now
ledg
e (%
)
theories and paradigms(%)
IT ES
FR
AT
DE
NL
UK
FI
NO
CZ
CH
PT
BE
EE SI
TR
LT
PL
HU
0
20
40
60
80
100
0 20 40 60 80 100
wor
k pl
acem
ents
and
inte
rnsh
ips
(%)
participation in research projects (%)
Competencies and Early Labour Market Careers of Higher Education Graduates in Europe
18
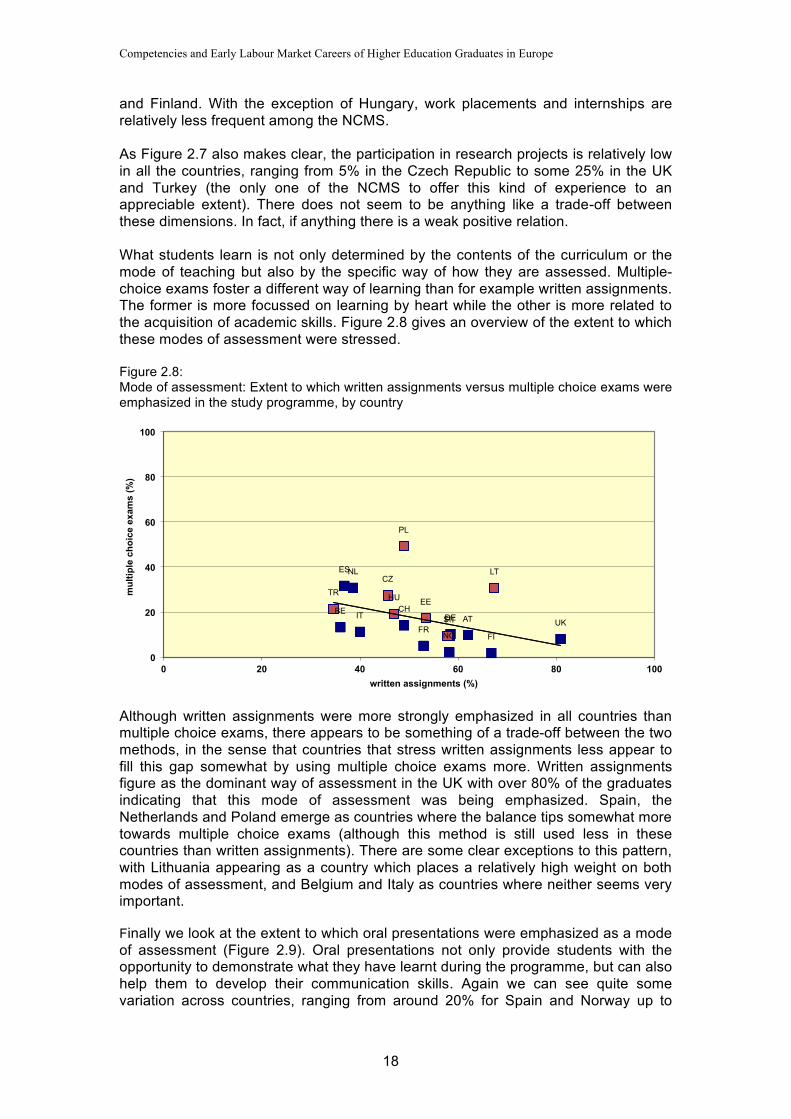
and Finland. With the exception of Hungary, work placements and internships are relatively less frequent among the NCMS. As Figure 2.7 also makes clear, the participation in research projects is relatively low in all the countries, ranging from 5% in the Czech Republic to some 25% in the UK and Turkey (the only one of the NCMS to offer this kind of experience to an appreciable extent). There does not seem to be anything like a trade-off between these dimensions. In fact, if anything there is a weak positive relation. What students learn is not only determined by the contents of the curriculum or the mode of teaching but also by the specific way of how they are assessed. Multiple-choice exams foster a different way of learning than for example written assignments. The former is more focussed on learning by heart while the other is more related to the acquisition of academic skills. Figure 2.8 gives an overview of the extent to which these modes of assessment were stressed. Figure 2.8: Mode of assessment: Extent to which written assignments versus multiple choice exams were emphasized in the study programme, by country
Although written assignments were more strongly emphasized in all countries than multiple choice exams, there appears to be something of a trade-off between the two methods, in the sense that countries that stress written assignments less appear to fill this gap somewhat by using multiple choice exams more. Written assignments figure as the dominant way of assessment in the UK with over 80% of the graduates indicating that this mode of assessment was being emphasized. Spain, the Netherlands and Poland emerge as countries where the balance tips somewhat more towards multiple choice exams (although this method is still used less in these countries than written assignments). There are some clear exceptions to this pattern, with Lithuania appearing as a country which places a relatively high weight on both modes of assessment, and Belgium and Italy as countries where neither seems very important. Finally we look at the extent to which oral presentations were emphasized as a mode of assessment (Figure 2.9). Oral presentations not only provide students with the opportunity to demonstrate what they have learnt during the programme, but can also help them to develop their communication skills. Again we can see quite some variation across countries, ranging from around 20% for Spain and Norway up to
IT
ES
FR AT DE
NL
UK
FI NO
CZ
CH PT
BE EE
SI
TR
LT
PL
HU
0
20
40
60
80
100
0 20 40 60 80 100
mul
tiple
cho
ice
exam
s (%
)
written assignments (%)
Higher Education Experiences
19
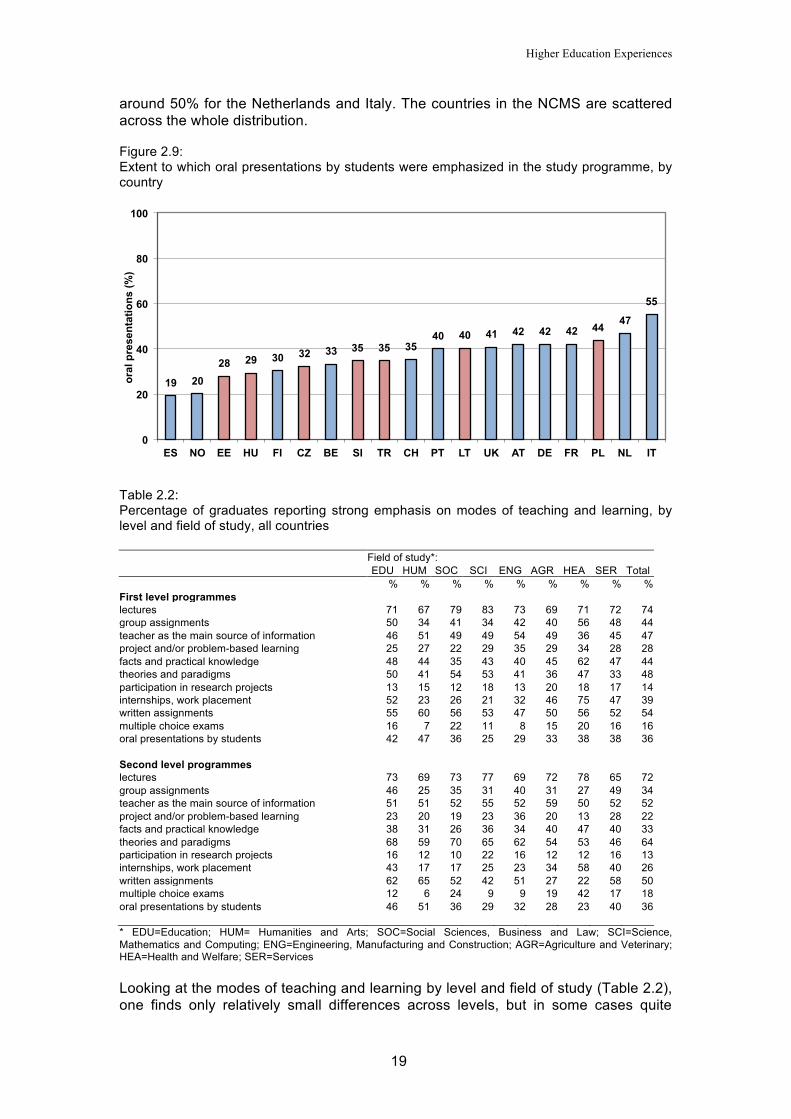
around 50% for the Netherlands and Italy. The countries in the NCMS are scattered across the whole distribution. Figure 2.9: Extent to which oral presentations by students were emphasized in the study programme, by country
Table 2.2: Percentage of graduates reporting strong emphasis on modes of teaching and learning, by level and field of study, all countries Field of study*: EDU HUM SOC SCI ENG AGR HEA SER Total % % % % % % % % % First level programmes lectures 71 67 79 83 73 69 71 72 74 group assignments 50 34 41 34 42 40 56 48 44 teacher as the main source of information 46 51 49 49 54 49 36 45 47 project and/or problem-based learning 25 27 22 29 35 29 34 28 28 facts and practical knowledge 48 44 35 43 40 45 62 47 44 theories and paradigms 50 41 54 53 41 36 47 33 48 participation in research projects 13 15 12 18 13 20 18 17 14 internships, work placement 52 23 26 21 32 46 75 47 39 written assignments 55 60 56 53 47 50 56 52 54 multiple choice exams 16 7 22 11 8 15 20 16 16 oral presentations by students 42 47 36 25 29 33 38 38 36 Second level programmes lectures 73 69 73 77 69 72 78 65 72 group assignments 46 25 35 31 40 31 27 49 34 teacher as the main source of information 51 51 52 55 52 59 50 52 52 project and/or problem-based learning 23 20 19 23 36 20 13 28 22 facts and practical knowledge 38 31 26 36 34 40 47 40 33 theories and paradigms 68 59 70 65 62 54 53 46 64 participation in research projects 16 12 10 22 16 12 12 16 13 internships, work placement 43 17 17 25 23 34 58 40 26 written assignments 62 65 52 42 51 27 22 58 50 multiple choice exams 12 6 24 9 9 19 42 17 18 oral presentations by students 46 51 36 29 32 28 23 40 36 * EDU=Education; HUM= Humanities and Arts; SOC=Social Sciences, Business and Law; SCI=Science, Mathematics and Computing; ENG=Engineering, Manufacturing and Construction; AGR=Agriculture and Veterinary; HEA=Health and Welfare; SER=Services Looking at the modes of teaching and learning by level and field of study (Table 2.2), one finds only relatively small differences across levels, but in some cases quite
19 20 28 29 30 32 33 35 35 35
40 40 41 42 42 42 44 47
55
0
20
40
60
80
100
ES NO EE HU FI CZ BE SI TR CH PT LT UK AT DE FR PL NL IT
oral
pre
sent
atio
ns (%
)
Competencies and Early Labour Market Careers of Higher Education Graduates in Europe
20
large differences across fields of education. First level programmes seem to be more practical and work-oriented, placing somewhat more emphasis on internships and work placements, facts and practical knowledge, group assignments and project and/or problem-based learning than second level programmes, and less emphasis on theories and paradigms. The greatest difference between fields of study can be seen in the extent to which internships and work placements are emphasized. These play a minor role in the humanities and arts, social sciences, business and law, and science, mathematics and computing at both the first and second levels, but they are quite strongly emphasized in fields like health and welfare, education and services. There is also little emphasis on multiple choice exams in both first and second level humanities and arts and science, mathematics and computing programmes, but this form of test is relatively common in social sciences, business and law programmes, and especially in second level health and welfare programmes.
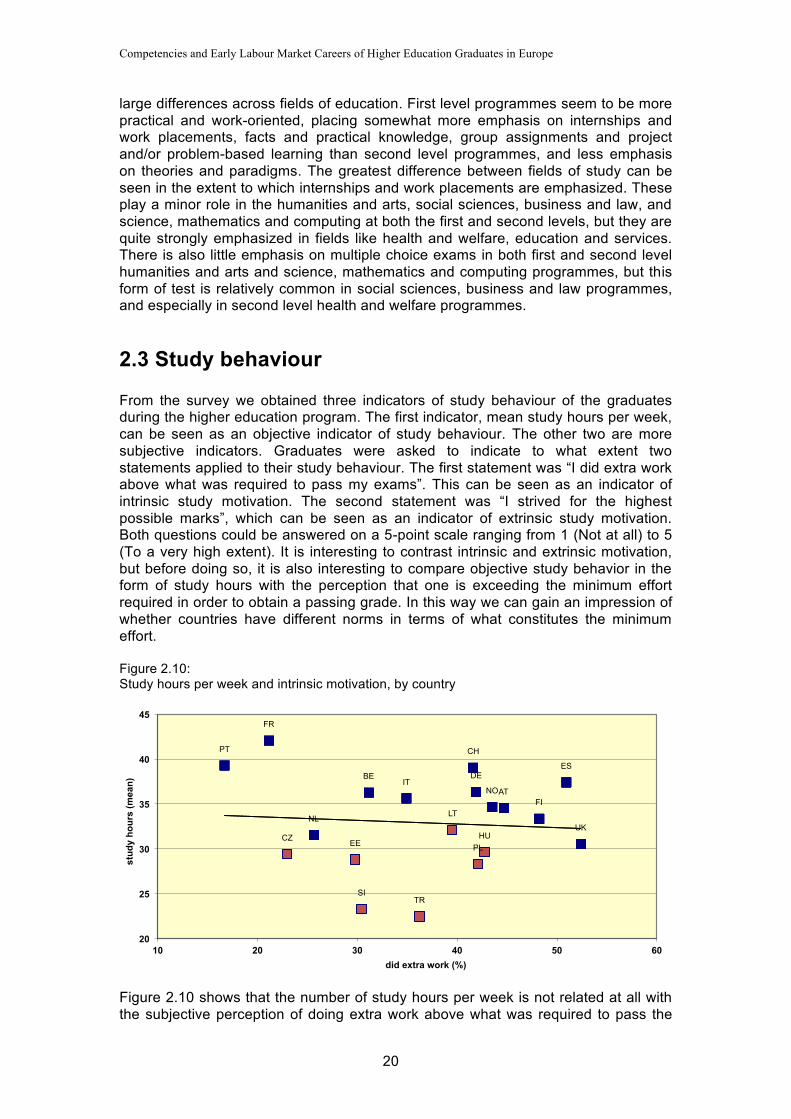
2.3 Study behaviour From the survey we obtained three indicators of study behaviour of the graduates during the higher education program. The first indicator, mean study hours per week, can be seen as an objective indicator of study behaviour. The other two are more subjective indicators. Graduates were asked to indicate to what extent two statements applied to their study behaviour. The first statement was “I did extra work above what was required to pass my exams”. This can be seen as an indicator of intrinsic study motivation. The second statement was “I strived for the highest possible marks”, which can be seen as an indicator of extrinsic study motivation. Both questions could be answered on a 5-point scale ranging from 1 (Not at all) to 5 (To a very high extent). It is interesting to contrast intrinsic and extrinsic motivation, but before doing so, it is also interesting to compare objective study behavior in the form of study hours with the perception that one is exceeding the minimum effort required in order to obtain a passing grade. In this way we can gain an impression of whether countries have different norms in terms of what constitutes the minimum effort. Figure 2.10: Study hours per week and intrinsic motivation, by country
Figure 2.10 shows that the number of study hours per week is not related at all with the subjective perception of doing extra work above what was required to pass the
IT
ES
FR
AT
DE
NL UK
FI NO
CZ
CH PT
BE
EE
SI TR
LT
PL HU
20
25
30
35
40
45
10 20 30 40 50 60
stu
dy h
ours
(mea
n)
did extra work (%)
Higher Education Experiences
21
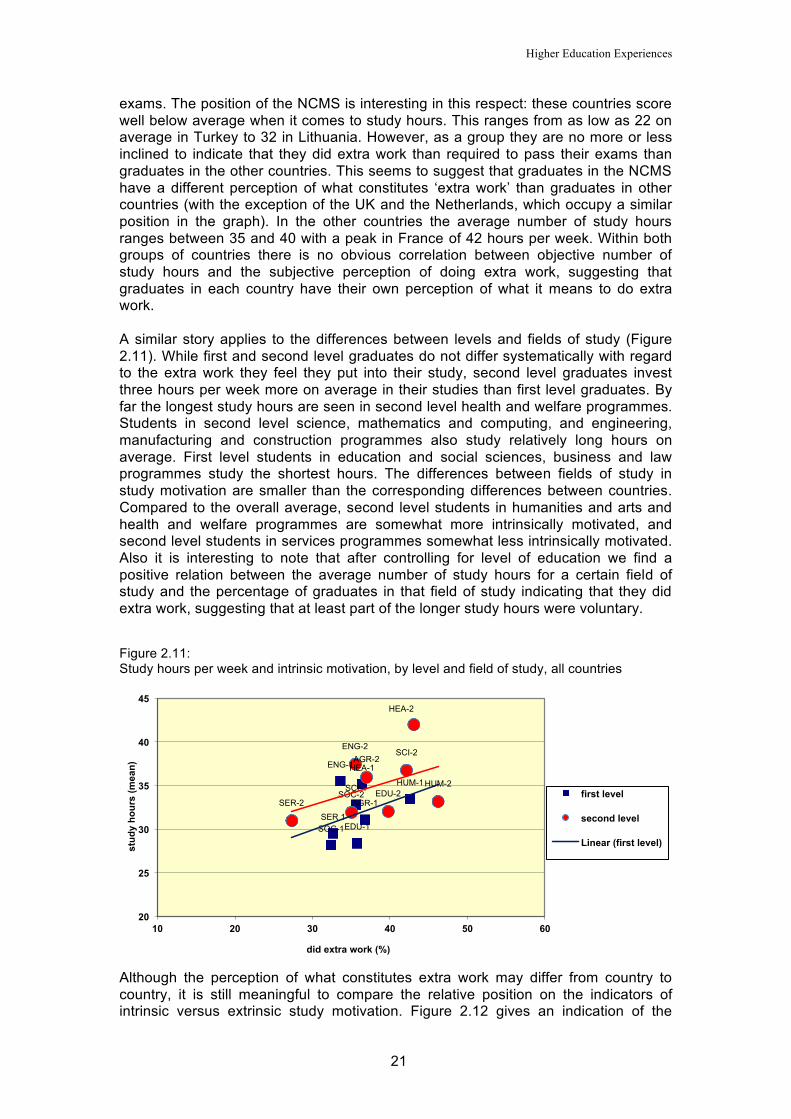
exams. The position of the NCMS is interesting in this respect: these countries score well below average when it comes to study hours. This ranges from as low as 22 on average in Turkey to 32 in Lithuania. However, as a group they are no more or less inclined to indicate that they did extra work than required to pass their exams than graduates in the other countries. This seems to suggest that graduates in the NCMS have a different perception of what constitutes ‘extra work’ than graduates in other countries (with the exception of the UK and the Netherlands, which occupy a similar position in the graph). In the other countries the average number of study hours ranges between 35 and 40 with a peak in France of 42 hours per week. Within both groups of countries there is no obvious correlation between objective number of study hours and the subjective perception of doing extra work, suggesting that graduates in each country have their own perception of what it means to do extra work. A similar story applies to the differences between levels and fields of study (Figure 2.11). While first and second level graduates do not differ systematically with regard to the extra work they feel they put into their study, second level graduates invest three hours per week more on average in their studies than first level graduates. By far the longest study hours are seen in second level health and welfare programmes. Students in second level science, mathematics and computing, and engineering, manufacturing and construction programmes also study relatively long hours on average. First level students in education and social sciences, business and law programmes study the shortest hours. The differences between fields of study in study motivation are smaller than the corresponding differences between countries. Compared to the overall average, second level students in humanities and arts and health and welfare programmes are somewhat more intrinsically motivated, and second level students in services programmes somewhat less intrinsically motivated. Also it is interesting to note that after controlling for level of education we find a positive relation between the average number of study hours for a certain field of study and the percentage of graduates in that field of study indicating that they did extra work, suggesting that at least part of the longer study hours were voluntary. Figure 2.11: Study hours per week and intrinsic motivation, by level and field of study, all countries
Although the perception of what constitutes extra work may differ from country to country, it is still meaningful to compare the relative position on the indicators of intrinsic versus extrinsic study motivation. Figure 2.12 gives an indication of the
EDU-1
HUM-1
SOC-1
SCI-1
ENG-1
AGR-1
HEA-1
SER 1
EDU-2 HUM-2
SOC-2
SCI-2 ENG-2
AGR-2
HEA-2
SER-2
20
25
30
35
40
45
10 20 30 40 50 60
stud
y ho
urs
(mea
n)
did extra work (%)
first level
second level
Linear (first level)
Competencies and Early Labour Market Careers of Higher Education Graduates in Europe
22
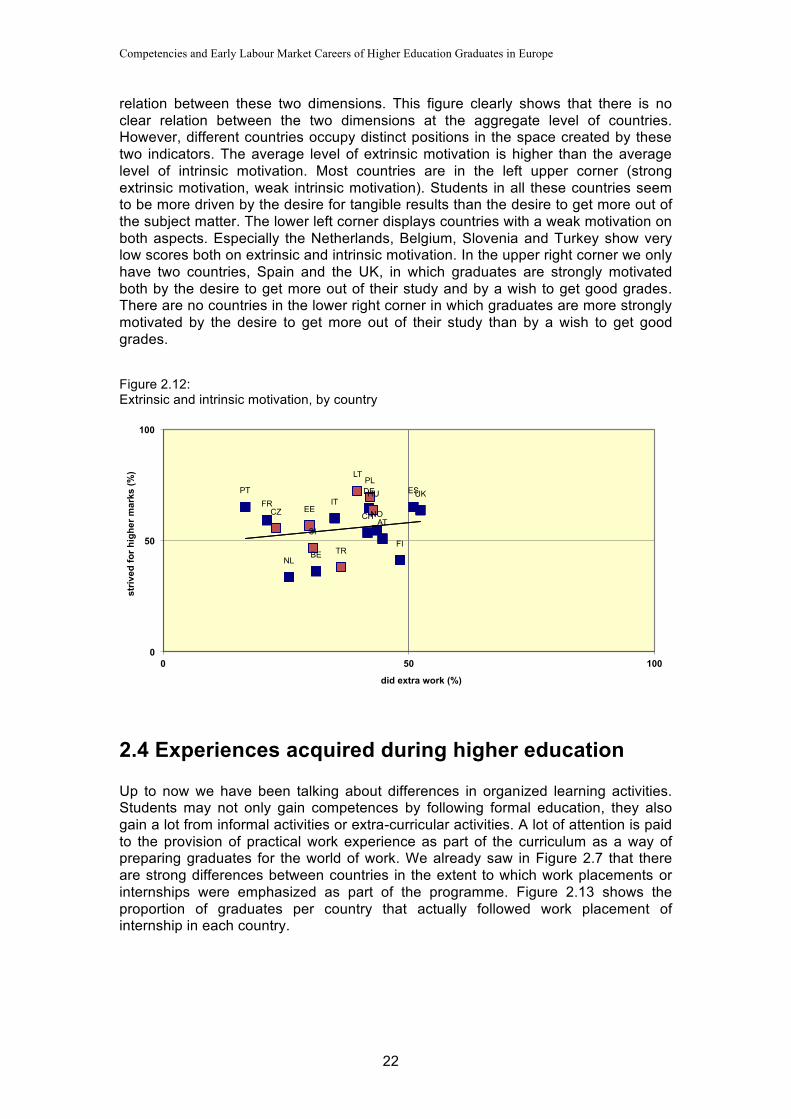
relation between these two dimensions. This figure clearly shows that there is no clear relation between the two dimensions at the aggregate level of countries. However, different countries occupy distinct positions in the space created by these two indicators. The average level of extrinsic motivation is higher than the average level of intrinsic motivation. Most countries are in the left upper corner (strong extrinsic motivation, weak intrinsic motivation). Students in all these countries seem to be more driven by the desire for tangible results than the desire to get more out of the subject matter. The lower left corner displays countries with a weak motivation on both aspects. Especially the Netherlands, Belgium, Slovenia and Turkey show very low scores both on extrinsic and intrinsic motivation. In the upper right corner we only have two countries, Spain and the UK, in which graduates are strongly motivated both by the desire to get more out of their study and by a wish to get good grades. There are no countries in the lower right corner in which graduates are more strongly motivated by the desire to get more out of their study than by a wish to get good grades. Figure 2.12: Extrinsic and intrinsic motivation, by country
2.4 Experiences acquired during higher education Up to now we have been talking about differences in organized learning activities. Students may not only gain competences by following formal education, they also gain a lot from informal activities or extra-curricular activities. A lot of attention is paid to the provision of practical work experience as part of the curriculum as a way of preparing graduates for the world of work. We already saw in Figure 2.7 that there are strong differences between countries in the extent to which work placements or internships were emphasized as part of the programme. Figure 2.13 shows the proportion of graduates per country that actually followed work placement of internship in each country.
IT ES
FR
AT
DE
NL
UK
FI
NO CZ CH
PT
BE
EE
SI
TR
LT PL HU
0
50
100
0 50 100
str
ived
for h
ighe
r mar
ks (%
)
did extra work (%)
Higher Education Experiences
23
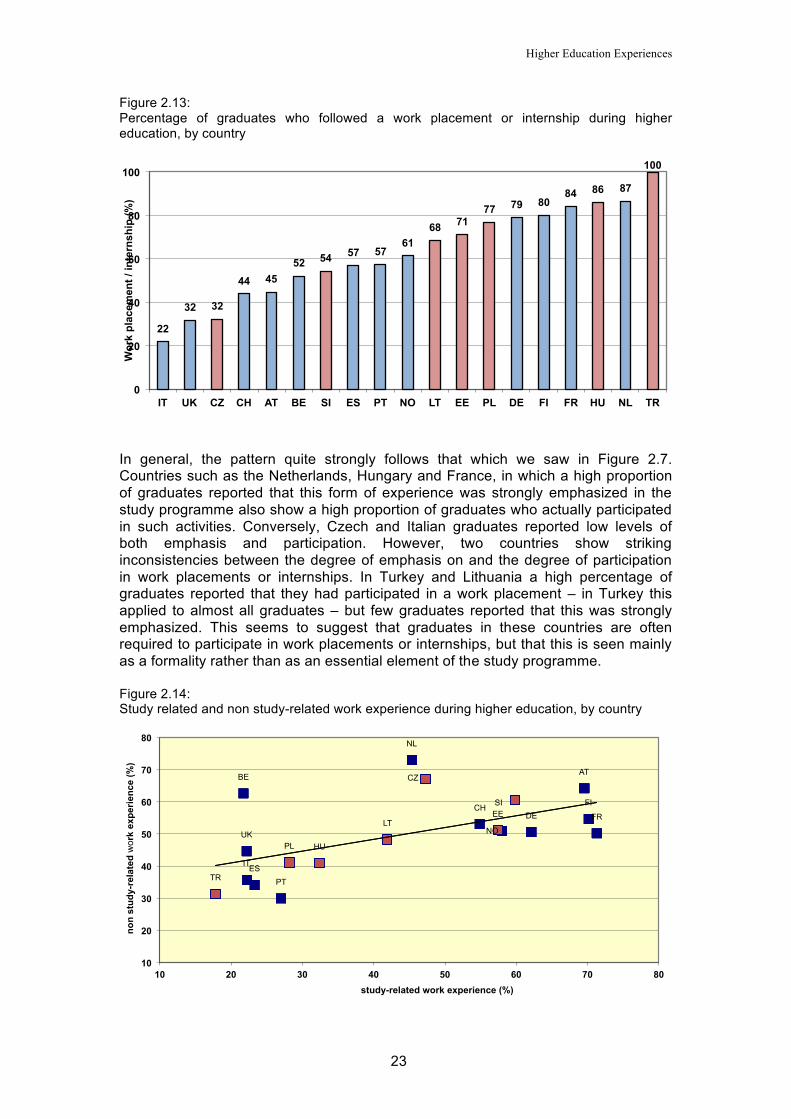
Figure 2.13: Percentage of graduates who followed a work placement or internship during higher education, by country
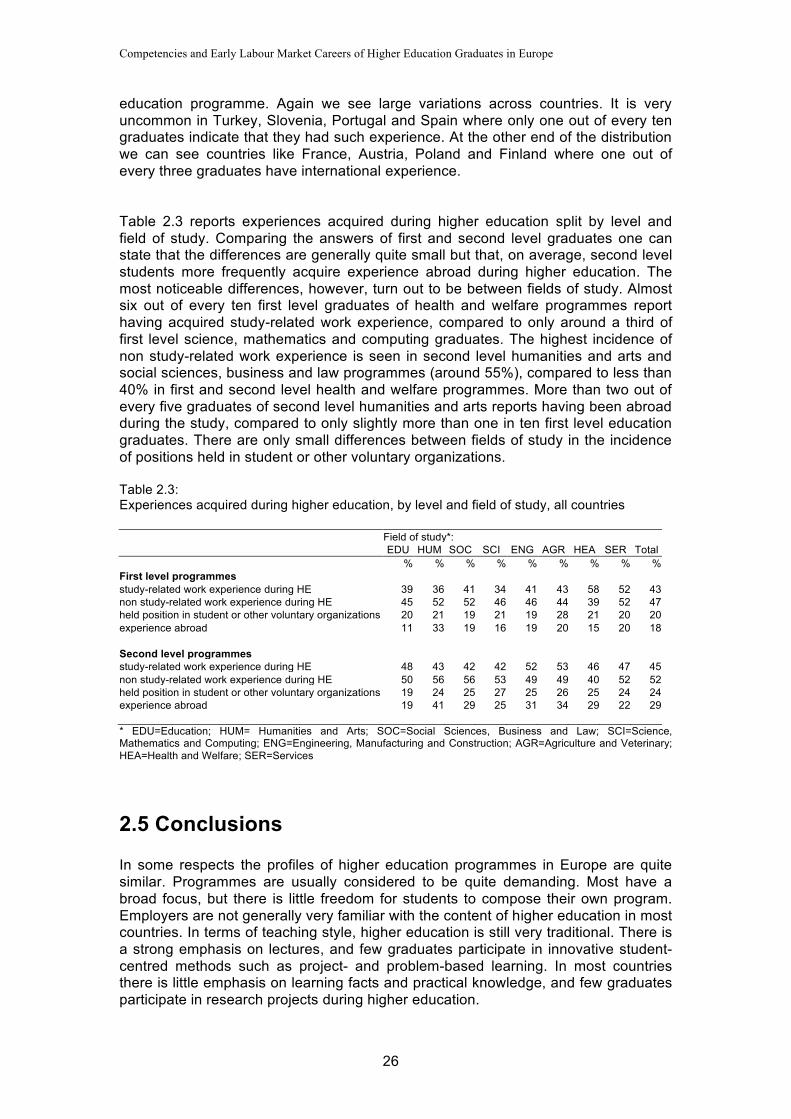
In general, the pattern quite strongly follows that which we saw in Figure 2.7. Countries such as the Netherlands, Hungary and France, in which a high proportion of graduates reported that this form of experience was strongly emphasized in the study programme also show a high proportion of graduates who actually participated in such activities. Conversely, Czech and Italian graduates reported low levels of both emphasis and participation. However, two countries show striking inconsistencies between the degree of emphasis on and the degree of participation in work placements or internships. In Turkey and Lithuania a high percentage of graduates reported that they had participated in a work placement – in Turkey this applied to almost all graduates – but few graduates reported that this was strongly emphasized. This seems to suggest that graduates in these countries are often required to participate in work placements or internships, but that this is seen mainly as a formality rather than as an essential element of the study programme. Figure 2.14: Study related and non study-related work experience during higher education, by country
22
32 32
44 45 52 54 57 57
61 68 71
77 79 80 84 86 87
100
0
20
40
60
80
100
IT UK CZ CH AT BE SI ES PT NO LT EE PL DE FI FR HU NL TR
Wor
k pl
acem
ent /
inte
rnsh
ip (%
)
IT ES
FR
AT
DE
NL
UK
FI
NO
CZ
CH
PT
BE
EE SI
TR
LT
PL HU
10
20
30
40
50
60
70
80
10 20 30 40 50 60 70 80
non
stu
dy-r
elat
ed w
ork
expe
rienc
e (%
)
study-related work experience (%)

Competencies and Early Labour Market Careers of Higher Education Graduates in Europe
24
There are of course other ways in which graduates can obtain work experience during higher education. Figure 2.14 gives the percentage of graduates indicating that they had study-related work experience during higher education (this is work experience not related to a work placement or internship) as well as the percentage indicating that they had work experience that was not related to their study programme. We can note that on both dimensions there is a large variation between the countries in this informal way of gaining skills. It is clear that there is no trade-off, at the national level at least – between study-related and non study-related work experience. In fact, in countries with the highest percentage of graduates who gained study-related work experience – Austria, Finland and France – more than half of all graduates also received non study-related work experience. Conversely, with the exception of Belgium, the countries with low proportions of graduates receiving study-related work experience are also the countries that score lowest on non study-related experience. The NCMS do not form a coherent group in terms of experience, and are distributed across almost the whole range of experience. In the light of the relatively low number of study hours and limited degree of willingness to do extra work reported by Czech and Dutch graduates (see Figure 2.10), it is striking that these countries show the highest proportion of graduates reporting non study-related work experience. We also saw that a relatively low proportion of graduates in these countries found the study programme demanding (see Figure 2.1). At first sight, it seems that students in those countries choose to make use of the lack of challenge presented by the programme to spend less time on study and earn extra money on the side. At the individual level however we see that those with non study-related work experience in those countries actually studied slightly longer hours on average than those without such experience. Figure 2.15: Percentage of graduates left higher education without acquiring relevant experience* during the study programme, by country
* work placement, internship, or other study-related work experience At the end of the day, it may not matter how exactly graduates obtain relevant work experience prior to graduation, as long as they do so. Figure 2.15 gives an overview of the percentage of graduates who left higher education without any relevant experience at all, be it through learning activities that form part of the study programme like a work placement or internship, or through the acquisition of study-related work experience on one’s own initiative outside the study programme. In most
0 6 6 8 9 12 13
16 17 20 21 21
27 30
36 36 38
59 63
0
10
20
30
40
50
60
70
TR NL FI DE HU FR EE PL AT LT SI NO CH PT ES CZ BE UK IT
no
rele
vant
wor
k e
xper
ienc
e (%
)

Higher Education Experiences
25
countries relatively few graduates leave higher education without some form of relevant experience. There are however countries where more than a quarter of all graduates lack any such experience, and in the UK and Italy this applies to around six in every ten graduates. The position of the NCMS is scattered all across the distribution. Figure 2.16: Percentage of graduates who held positions in student or other voluntary organizations during the study programme, by country
Of course, work experience is not the only way to acquire relevant skills. In Figure 2.16 we present the percentage of graduates indicating that they held a position in a student or other voluntary organizations while studying. Again we can see large variations across countries. Taking up such positions is quite uncommon in the Czech Republic, Spain and Italy while it is relatively frequent in Belgium and the Netherlands. Figure 2.17: Percentage of graduates who spent time abroad for study or work during the study programme, by country
Figure 2.17 gives another important way of gaining relevant skills: the proportion of graduates who spent some time abroad for study or work during their higher
5
10 10
14 16 16 17
19 20 22 23 24 25
28 30
32 33
37 41
0
10
20
30
40
50
CZ ES IT SI HU EE AT LT PL DE PT UK FI FR TR CH NO BE NL
Posi
tions
in v
olun
tary
org
aniz
atio
ns (%
)
9
12 13 13 17 17 18 19 19
27 28 28 30 30 30
32 32 36 36
0
10
20
30
40
50
TR SI PT ES EE IT HU NO UK CZ LT BE NL DE CH FI PL AT FR
Spen
t tim
e ab
road
(%)
Competencies and Early Labour Market Careers of Higher Education Graduates in Europe
26
education programme. Again we see large variations across countries. It is very uncommon in Turkey, Slovenia, Portugal and Spain where only one out of every ten graduates indicate that they had such experience. At the other end of the distribution we can see countries like France, Austria, Poland and Finland where one out of every three graduates have international experience. Table 2.3 reports experiences acquired during higher education split by level and field of study. Comparing the answers of first and second level graduates one can state that the differences are generally quite small but that, on average, second level students more frequently acquire experience abroad during higher education. The most noticeable differences, however, turn out to be between fields of study. Almost six out of every ten first level graduates of health and welfare programmes report having acquired study-related work experience, compared to only around a third of first level science, mathematics and computing graduates. The highest incidence of non study-related work experience is seen in second level humanities and arts and social sciences, business and law programmes (around 55%), compared to less than 40% in first and second level health and welfare programmes. More than two out of every five graduates of second level humanities and arts reports having been abroad during the study, compared to only slightly more than one in ten first level education graduates. There are only small differences between fields of study in the incidence of positions held in student or other voluntary organizations. Table 2.3: Experiences acquired during higher education, by level and field of study, all countries Field of study*: EDU HUM SOC SCI ENG AGR HEA SER Total % % % % % % % % % First level programmes study-related work experience during HE 39 36 41 34 41 43 58 52 43 non study-related work experience during HE 45 52 52 46 46 44 39 52 47 held position in student or other voluntary organizations 20 21 19 21 19 28 21 20 20 experience abroad 11 33 19 16 19 20 15 20 18 Second level programmes study-related work experience during HE 48 43 42 42 52 53 46 47 45 non study-related work experience during HE 50 56 56 53 49 49 40 52 52 held position in student or other voluntary organizations 19 24 25 27 25 26 25 24 24 experience abroad 19 41 29 25 31 34 29 22 29 * EDU=Education; HUM= Humanities and Arts; SOC=Social Sciences, Business and Law; SCI=Science, Mathematics and Computing; ENG=Engineering, Manufacturing and Construction; AGR=Agriculture and Veterinary; HEA=Health and Welfare; SER=Services
2.5 Conclusions In some respects the profiles of higher education programmes in Europe are quite similar. Programmes are usually considered to be quite demanding. Most have a broad focus, but there is little freedom for students to compose their own program. Employers are not generally very familiar with the content of higher education in most countries. In terms of teaching style, higher education is still very traditional. There is a strong emphasis on lectures, and few graduates participate in innovative student-centred methods such as project- and problem-based learning. In most countries there is little emphasis on learning facts and practical knowledge, and few graduates participate in research projects during higher education.
Higher Education Experiences
27
In other respects the higher education profiles in Europe are very different. Given the lack of familiarity of employers with the content of the programme, it is striking that there is a high degree of variation in the extent to which higher education programmes are regarded vocationally oriented, with employers being scarcely more familiar with the content in countries where higher education is strongly vocational than in countries where this is not the case. Furthermore, although education is generally traditional, there are some countries where somewhat less emphasis is placed on the teacher as the main source of information and more on group assignments. In terms of content, countries differ strongly in the extent to which theories and paradigms are emphasized, and although this aspect is emphasized more in most countries than facts and practical knowledge, there are some countries in which the emphasis is more on the latter than on the former. There is also a large variation in the extent to which students can gain practical experience through work placements, internships or other forms of study related work experience. However, in almost all countries, a strong majority of graduates leave higher education with some kind of relevant work experience under their belt. Many also held paid jobs during higher education that were not related to the content of their study programme, but relatively few graduates spent time abroad or held positions in student or other voluntary organizations while enrolled. In sum, although there are some common elements, we cannot speak of a universal higher education profile in Europe. Nor can we characterize European students as universal. There are large differences between countries in the study behaviour of students in terms of number of study hours, as well as the extent to which they are intrinsically and extrinsically motivated. It is striking that graduates in the NCMS report low average study hours compared to their northern and southern European peers, but do not differ systematically in their subjective perception of study motivation. This seems to suggest that graduates in different countries have different ideas of what it means to study hard. In most countries students seem to be more extrinsically motivated than intrinsically motivated, with a high proportion of graduates in most countries reporting a strong orientation towards achieving high marks, but few indicating a willingness to work harder than necessary to achieve this.


The Transition and Early Career
29
Chapter 3 The Transition and Early Career Jim Allen, Johan Coenen and Martin Humburg
3.1 Introduction In this chapter we describe a number of indicators related to the transition from higher education to work and the early career of graduates in the different countries. We start in Section 3.2 with a description of the initial transition from higher education to work. First of all we describe the timing and methods graduates used when searching for work, and the time required by graduates to find their first job after graduation. In addition to describing these indicators, we try to identify personal, background and programme characteristics that influence the search duration. Following that, we then describe the early career development in terms of total unemployment duration and number of changes of employer. Section 3.3 contains a brief description of the current labour market status of graduates some 5 years after graduation. We distinguish first of all those who participate in the labour force from those who, for whatever reason, choose not to make themselves available from work. For those who do participate in the labour force, we then distinguish between those who are currently in paid employment and those who are currently unemployed. Lastly, for those who are in paid employment, we look at the working hours. Section 3.4 describes the quality of the jobs held by working graduates in more detail, in terms of job security, the match between education and work, wages, career prospects, and job satisfaction. We conclude this section by looking for personal, background and programme characteristics that are related to a high job quality. In Section 3.5 we look at how graduates evaluate their programme as a basis for work, career, and personal development. Finally, in Section 3.6 we draw some general conclusions.
3.2 Transition In this section we describe the initial transition from higher education to work. We start by describing when graduates started searching for work. By starting early with searching for a job, graduates may improve their chances of finding work relative soon after graduation. For this reason, it may be that, other things being equal, students who anticipate difficulties in finding work after graduation are more likely to start searching early than students who are confident of finding a job quickly. For this
Competencies and Early Labour Market Careers of Higher Education Graduates in Europe
30
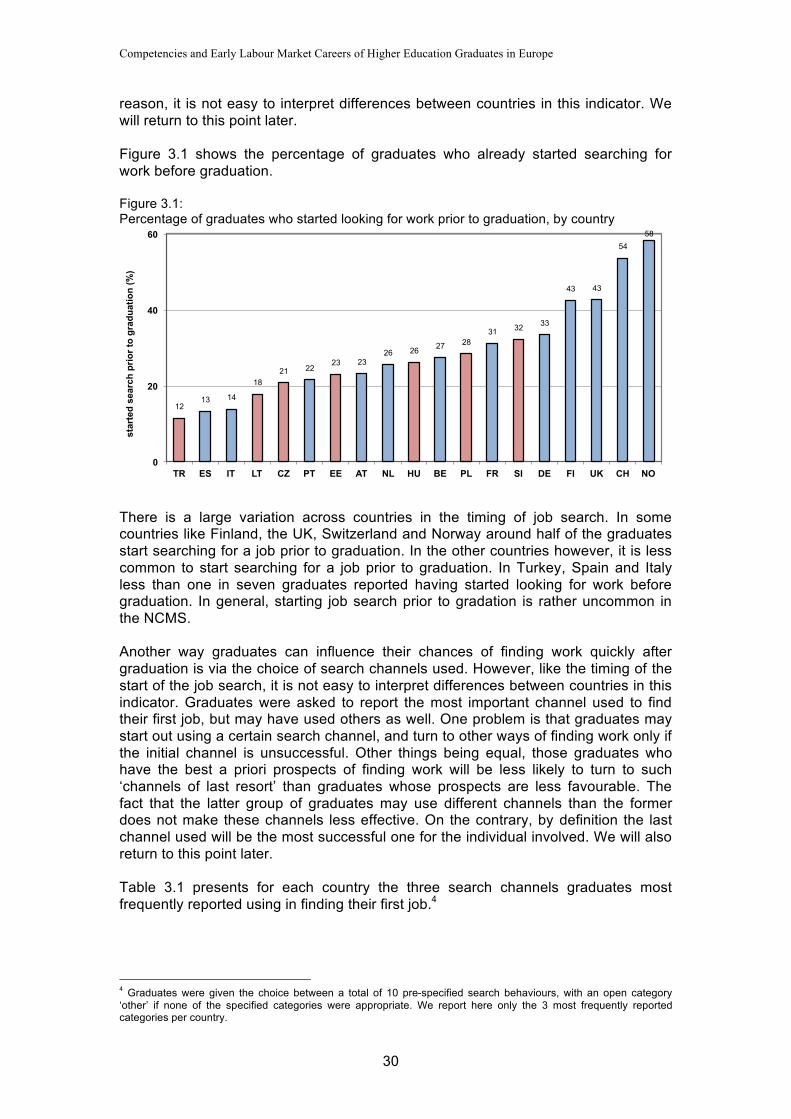
reason, it is not easy to interpret differences between countries in this indicator. We will return to this point later. Figure 3.1 shows the percentage of graduates who already started searching for work before graduation. Figure 3.1: Percentage of graduates who started looking for work prior to graduation, by country
There is a large variation across countries in the timing of job search. In some countries like Finland, the UK, Switzerland and Norway around half of the graduates start searching for a job prior to graduation. In the other countries however, it is less common to start searching for a job prior to graduation. In Turkey, Spain and Italy less than one in seven graduates reported having started looking for work before graduation. In general, starting job search prior to gradation is rather uncommon in the NCMS. Another way graduates can influence their chances of finding work quickly after graduation is via the choice of search channels used. However, like the timing of the start of the job search, it is not easy to interpret differences between countries in this indicator. Graduates were asked to report the most important channel used to find their first job, but may have used others as well. One problem is that graduates may start out using a certain search channel, and turn to other ways of finding work only if the initial channel is unsuccessful. Other things being equal, those graduates who have the best a priori prospects of finding work will be less likely to turn to such ‘channels of last resort’ than graduates whose prospects are less favourable. The fact that the latter group of graduates may use different channels than the former does not make these channels less effective. On the contrary, by definition the last channel used will be the most successful one for the individual involved. We will also return to this point later. Table 3.1 presents for each country the three search channels graduates most frequently reported using in finding their first job.4
4 Graduates were given the choice between a total of 10 pre-specified search behaviours, with an open category ‘other’ if none of the specified categories were appropriate. We report here only the 3 most frequently reported categories per country.
12 13 14
18 21 22
23 23 26 26 27 28
31 32 33
43 43
54 58
0
20
40
60
TR ES IT LT CZ PT EE AT NL HU BE PL FR SI DE FI UK CH NO
star
ted
sear
ch p
rior t
o gr
adua
tion
(%)

The Transition and Early Career
31
Table 3.1: Top 3 channels used by graduates to find their first job after graduation, by country and European region
NCMS REFLEX EE LT PL CZ HU SI TR All NE SE Total Through family, friends, acquaint. 1 1 2 2 1 2 1 1 2 2 Contacted employer on own initiative 2 1 1 2 1 2 2 1 1 1 Through advert. in newspaper 2 3 3 3 3 2 3 3 Approached by employer 3 3 3 3 Through internet 3
Interestingly, the top three ways to find work in NCMS are similar to those reported in Southern and Northern European countries. The same five channels turn up in the top three in all countries/regions. However, there are differences, and these are quite informative. Whereas finding a job through family, friends and acquaintances is not among the top three in Northern Europe, it is in second position in Southern Europe, and in the top position in NCMS. Expressed in percentages, 9.9% of Northern European graduates, 19.6% of Southern European graduates and 24.3% of NCMS graduates found their first job through the help of their social network. In all of these countries this channel is in the top two. Lithuania (33.9%), Turkey (30.4%) and Hungary (28.9%) are the countries with the highest proportion of graduates finding work through this channel. The second most important search channel for graduates in NCMS was contacting employers on one’s own initiative, which was the most often reported search channel in Northern and Southern Europe. It was also the top search channel in the Czech Republic, Poland and Slovenia. This search channel is in the top two in all countries/regions except Estonia, where it is not even in the top three. The third most often reported way of finding work in NCMS, through advertisements in newspapers, is also among the top three in Northern and Southern Europe. In the Czech Republic, Estonia, Slovenia, being approached by the employer is the third most important way of finding work. In this respect these countries resemble Northern Europe. Finding work through the internet is only among the top three search channels in Turkey. Figure 3.2: Average number of months search duration of graduates after graduation, by country
1,0 1,1
1,6 1,6 1,7 1,8 1,8 1,8 1,9 2,0 2,2
2,4 2,5 2,6 2,7
3,5 3,8
4,4
6,8
0
1
2
3
4
5
6
7
8
NO NL DE CH CZ PL AT FI BE UK FR EE IT LT PT HU SI ES TR
sear
ch d
urat
ion
(m.)
Competencies and Early Labour Market Careers of Higher Education Graduates in Europe
32
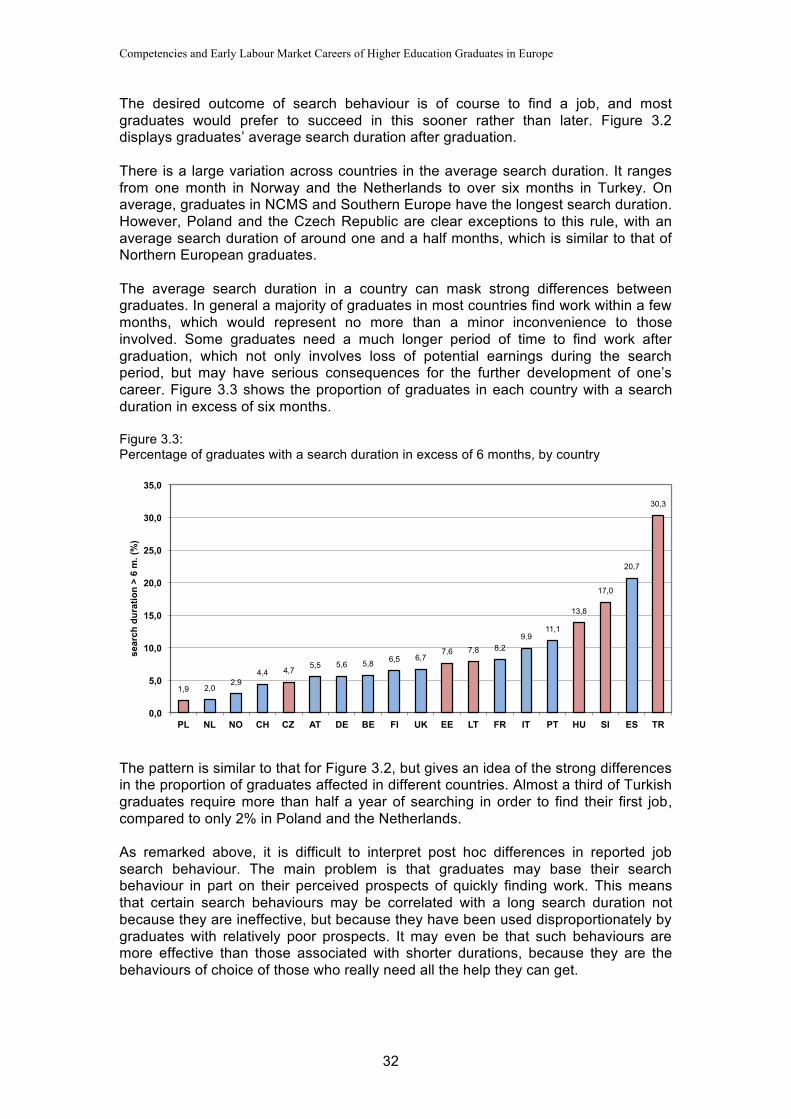
The desired outcome of search behaviour is of course to find a job, and most graduates would prefer to succeed in this sooner rather than later. Figure 3.2 displays graduates’ average search duration after graduation. There is a large variation across countries in the average search duration. It ranges from one month in Norway and the Netherlands to over six months in Turkey. On average, graduates in NCMS and Southern Europe have the longest search duration. However, Poland and the Czech Republic are clear exceptions to this rule, with an average search duration of around one and a half months, which is similar to that of Northern European graduates. The average search duration in a country can mask strong differences between graduates. In general a majority of graduates in most countries find work within a few months, which would represent no more than a minor inconvenience to those involved. Some graduates need a much longer period of time to find work after graduation, which not only involves loss of potential earnings during the search period, but may have serious consequences for the further development of one’s career. Figure 3.3 shows the proportion of graduates in each country with a search duration in excess of six months. Figure 3.3: Percentage of graduates with a search duration in excess of 6 months, by country
The pattern is similar to that for Figure 3.2, but gives an idea of the strong differences in the proportion of graduates affected in different countries. Almost a third of Turkish graduates require more than half a year of searching in order to find their first job, compared to only 2% in Poland and the Netherlands. As remarked above, it is difficult to interpret post hoc differences in reported job search behaviour. The main problem is that graduates may base their search behaviour in part on their perceived prospects of quickly finding work. This means that certain search behaviours may be correlated with a long search duration not because they are ineffective, but because they have been used disproportionately by graduates with relatively poor prospects. It may even be that such behaviours are more effective than those associated with shorter durations, because they are the behaviours of choice of those who really need all the help they can get.
1,9 2,0 2,9
4,4 4,7 5,5 5,6 5,8 6,5 6,7
7,6 7,8 8,2 9,9
11,1
13,8
17,0
20,7
30,3
0,0
5,0
10,0
15,0
20,0
25,0
30,0
35,0
PL NL NO CH CZ AT DE BE FI UK EE LT FR IT PT HU SI ES TR
sear
ch d
urat
ion
> 6
m. (
%)

The Transition and Early Career
33
Figure 3.4: Percentage of graduates with a search duration in excess of 6 months and percentage of graduates who started looking for work prior to graduation, by country
Figure 3.4 shows the relation at the level of countries between the proportion of graduates who started searching before graduation and the proportion who took longer than 6 months to find the first job. This seems to contradict the expectation that graduates with the worst prospects start searching early. If there is a relation at all, it is negative rather than positive (although this relation is driven by the extremes of Turkey and Spain on the one hand and Norway and Switzerland on the other hand). The countries with the highest percentage of long search durations – Turkey and Spain – were also the countries where the lowest percentage of graduates stated searching prior to graduation. Conversely, the countries in which the highest percentage of graduates started searching prior to graduation – Norway, the UK, Switzerland and Finland – also showed a low proportion of graduates with a long search duration. Although it is not certain that this relation is a causal one (when these ‘outliers’ are removed, the relation disappears), it is clear that graduates in countries where it is more difficult to find work do themselves no favors by waiting until after graduation before starting to look for work. Figure 3.5 Searching for first job more than 6 months by search channel, NCMS
IT
ES
FR
AT DE
NL
UK FI
NO CZ
CH
PT
BE EE
SI
TR
LT
PL
HU
0
10
20
30
40
0 10 20 30 40 50 60 70
sea
rch
dura
tion
> 6m
. (%
)
started search before graduation(%)
3,8
7,3
7,4
10,2
12,9
13,7
15,5
16,2
20,0
21,5
0 5 10 15 20 25
Through work placement during higher education
Approached by employer
Through help of higher education institution
Contacted employer on own initiative
Through private employment agency
Through advertisement in newspaper
Through internet
Through family, friends or acquaintances
Through public employment agency
Set up my own business
search duration > 6m. (%)
Competencies and Early Labour Market Careers of Higher Education Graduates in Europe
34
Figure 3.5 shows the percentage of graduates in the NCMS with a search duration in excess of 6 months, by search channel used to find the first job. The latter are ranked in order of frequency. There is little if any relation between the frequency in which a particular search channel is used and its ‘effectiveness’ in terms of search duration. The three most popular channels in the NCMS do not differ much from the overall average in terms of the percentage that reported taking longer than 6 months to find the job. Asking family friends, family or acquaintances is associated with a slightly higher proportion with a lengthy search than average, and contacting employers on own initiative with a slightly lower proportion. The most ‘effective’ channels are through work placements, through being approached by an employer and through help of the higher education institution. In the case of the former, the short search duration is to be expected, since most graduates who find work in this way will have in effect already been recruited while taking part in their work placement. It is also not surprising that being approached by employers is ‘effective’, since employers looking to snap up the best graduates will tend to approach these graduates as soon as possible (preferably before they graduate). Graduates have little direct control over this channel however. The apparent ‘effectiveness’ of being helped by the higher education institution is less intuitively obvious, but this may simply be that institutions concentrate their efforts on the period around graduation, so that those who found a job in this way are unlikely to have had a long search duration. Or it may simply be that institutions most often help their best graduates to find a job. The least ‘effective’ channels are setting up one’s own business and enlisting the help of a public employment agency. It seems likely that these are often channels of last resort that are used only after other means have failed. We would expect that the speed with which graduates find work after graduation will not only depend on their own search behaviour, but also on their perceived attractiveness for employers. In part, this may be influenced by the characteristics of the study programme, as well as by other experiences gained during higher education that have been described in the previous chapter. In part it may also depend on personal and background characteristics of graduates. In order to gain an impression of this, Table 3.2 shows the results of a series of multivariate analysis of search duration, in which the effects of a range of factors on this search duration have been estimated.5
5 The relatively small number of observations per country compromises the reliability of separate analyses conducted at that level. In this book we therefore restrict multivariate analyses to the main ‘regions of northern Europe, southern Europe and the NCMS.

The Transition and Early Career
35
Table 3.2: Effects of selected characteristics on search duration, by European region (OLS regression, unstandardized coefficients)6
NCMS NE SE Total Programme characteristics Academic Prestige -0.205 *** -0.224 ** -0.149 *** Demanding programme Employers familiar with content -0.285 *** -0.223 *** -0.394 *** -0.275 *** Vocationally oriented -0.211 *** -0.116 *** -0.160 * -0.170 *** Experiences during higher education Internship during study programme Study-related working experience -0.685 *** -0.352 *** -0.646 *** -0.500 *** Non-study-related working experience Position in voluntary organizations -0.676 *** -0.221 ** Spent time abroad for study or work -0.589 ** -0.302 ** -0.404 *** Study behaviour and performance Study hours per week Did extra work above required to pass exams 0.269 *** 0.131 *** Strived for the highest possible mark Average graduation grade (standardized) -0.290 *** -0.088 ** Personal and background characteristics Father higher education -0.800 *** -0.217 *** Age 0.786 *** 0.188 *** 0.223 *** Age-squared (*100) -1.006 ** -0.178 *** -0.228 *** Female 0.176 ** 0.613 *** 0.258 *** Born abroad First level degree (relative to second level) 0.407 * Field of study Education -0.783 *** -0.775 *** 0.743 * -0.524 *** Humanities and Arts 0.314 *** Social sciences, Business and Law ref. ref. ref. ref. Science, Mathematics and Computing Engineering, Manufacturing and Construction -1.179 *** -1.064 *** -0.660 *** Agriculture and Veterinary Health and Welfare -1.650 *** -0.761 *** -1.254 *** -1.082 *** Services N 5916 10292 4879 21089 Adjusted R-squared 0.133 0.045 0.049 0.111
*** = p<0.01; ** = p<0.05; * = p<0.10 Only statistically significant results shown All analyses include country dummies Several characteristics have a rather strong effect on search duration in all three regions. Not surprisingly, graduates who obtained study-related work experience during higher education had a significantly shorter search duration than those who had no such experience. There are two possible interpretations of this effect. It seems likely that a part of this effect is due to the fact that graduates continued or resumed working after graduation with an employer they already had during higher education or that they used this contact to gain access to a different employer. It is however plausible that at least some of the effect is due to the general preference of employers – all other things being equal – for graduates with study-related work experience. It is notable that study-related work experience has a stronger effect in southern Europe and the NCMS than in northern Europe. It may be that northern European graduates have little trouble finding work in any case, with or without work experience, but that graduates in southern Europe and some of the NCMS experience more difficulty and therefore need to rely more on study-related experience to prove their worth to potential employers.
6 The coefficients can be interpreted as the number of additional months of job search associated with a unit of change on the predictors. For example: the coefficient -0.685 for study-related work experience in the NCMS indicates that graduates in that region who acquired such experience need almost 7/10 of a month less on average to find their first job after graduation than graduates who acquired no such experience. This may not sound much, but is equivalent to one graduate in ten lacking such experience who takes seven months longer to find a job.

Competencies and Early Labour Market Careers of Higher Education Graduates in Europe
36
Non-study related work experience and – somewhat unexpectedly – work placements and internships showed no significant effects on search duration. Participation in voluntary organizations had a strong effect on search duration only in the NCMS. Time spent abroad during higher education also had a strong effect in the NCMS, and a moderate effect as well as in northern European REFLEX countries. Graduates of programmes that have strong links with the labour market, as indicated by the degree to which employers were familiar with the content of the programme as well as the degree of vocational orientation, had a shorter search duration in all three regions than graduates where such links are weaker. Participation in prestigious programmes appears to speed the transition from higher education to work in southern European REFLEX countries and the NCMS, but not in northern Europe. Interestingly, after taking other programme characteristics into account, participation in programmes that were regarded as demanding did not significantly affect the speed of the transition in any of the regions. Interestingly, good grades were helpful in the NCMS, but not in the REFLEX countries. After controlling for grades, average study hours per week and striving for the highest possible grades had no significant effect on search duration in any of the three regions. More puzzlingly, the willingness to do extra work above what was required to pass exams showed a moderate positive (!) effect on search duration in the NCMS. This counterintuitive effect may point to a different kind of search behavior: maybe the more intrinsically motivated students have a desire for certain jobs which will lead to longer search durations, because they will not accept just any job. Another possibility is that study motivation is related to certain personality traits that are differentially favoured in the labour market. For example, it may be that a willingness to put in more work than strictly required is related to an inclination towards procrastination and poor time management skills. Some personal and background characteristics of graduates have a significant effect on search duration. Older graduates take longer to find work in the NCMS and to a lesser extent in northern Europe, although the negative effect of age-squared indicates that the difference is mainly between the youngest graduates and the rest. Female graduates make a less speedy entry to the world of work in northern and southern European REFLEX countries but not in the NCMS. There is no significant effect of being born abroad, but there is an effect of having a father with higher education: this seems to speed up the transition process in the NCMS. There was no difference in search duration between first and second level graduates, except in southern Europe, where first level graduates took a little longer to find work. There were some strong differences between fields of study. Health and welfare graduates found work more quickly than the reference field Social sciences, business and law in all three regions. Engineering graduates also found work more rapidly than the reference category in the NCMS as well as in southern Europe. Education graduates were more successful than the reference category in this respect in the NCMS and northern European REFLEX countries. Only in southern European REFLEX countries did Education graduates have a harder time finding work than the reference category. Graduates in the fields of Humanities and arts, Science, mathematics and computing and Agriculture and veterinary did not differ significantly from the reference category, except that northern European Humanities and arts graduates took slightly longer to find work than their Social science, business and law counterparts.
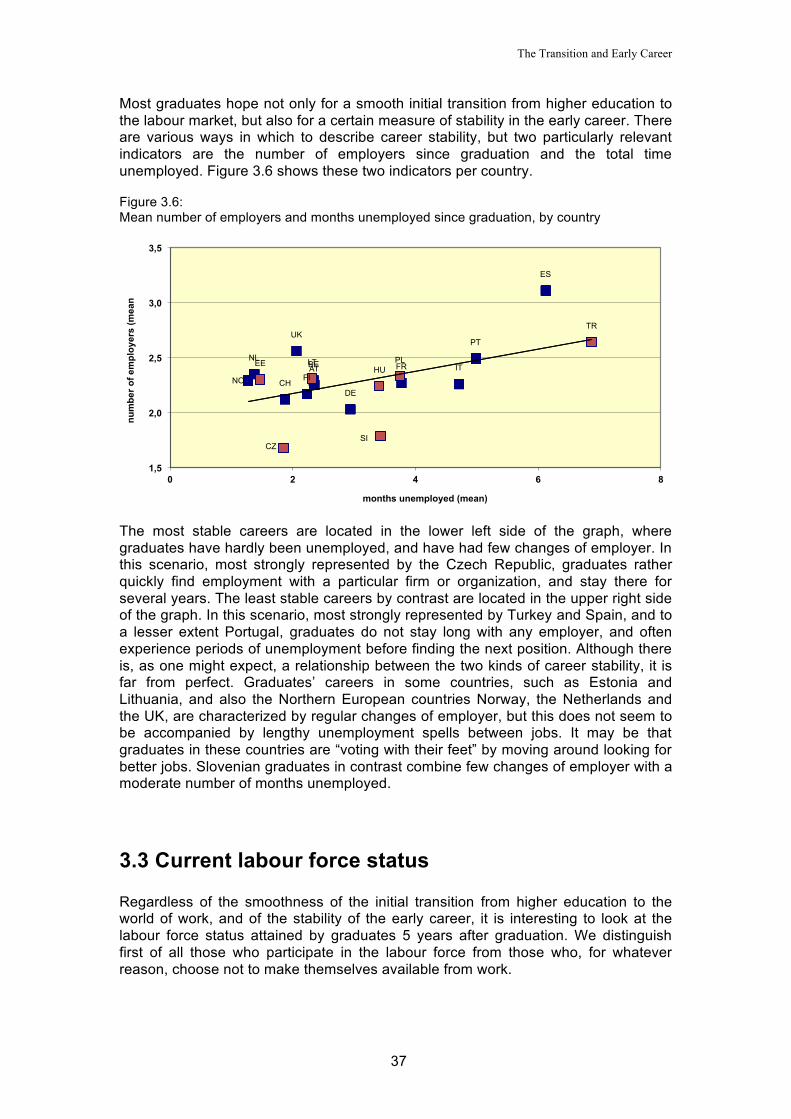
The Transition and Early Career
37
Most graduates hope not only for a smooth initial transition from higher education to the labour market, but also for a certain measure of stability in the early career. There are various ways in which to describe career stability, but two particularly relevant indicators are the number of employers since graduation and the total time unemployed. Figure 3.6 shows these two indicators per country. Figure 3.6: Mean number of employers and months unemployed since graduation, by country
The most stable careers are located in the lower left side of the graph, where graduates have hardly been unemployed, and have had few changes of employer. In this scenario, most strongly represented by the Czech Republic, graduates rather quickly find employment with a particular firm or organization, and stay there for several years. The least stable careers by contrast are located in the upper right side of the graph. In this scenario, most strongly represented by Turkey and Spain, and to a lesser extent Portugal, graduates do not stay long with any employer, and often experience periods of unemployment before finding the next position. Although there is, as one might expect, a relationship between the two kinds of career stability, it is far from perfect. Graduates’ careers in some countries, such as Estonia and Lithuania, and also the Northern European countries Norway, the Netherlands and the UK, are characterized by regular changes of employer, but this does not seem to be accompanied by lengthy unemployment spells between jobs. It may be that graduates in these countries are “voting with their feet” by moving around looking for better jobs. Slovenian graduates in contrast combine few changes of employer with a moderate number of months unemployed.
3.3 Current labour force status Regardless of the smoothness of the initial transition from higher education to the world of work, and of the stability of the early career, it is interesting to look at the labour force status attained by graduates 5 years after graduation. We distinguish first of all those who participate in the labour force from those who, for whatever reason, choose not to make themselves available from work.
IT
ES
FR AT
DE
NL
UK
FI NO
CZ
CH
PT
BE EE
SI
TR
LT PL HU
1,5
2,0
2,5
3,0
3,5
0 2 4 6 8
num
ber o
f em
ploy
ers
(mea
n
months unemployed (mean)
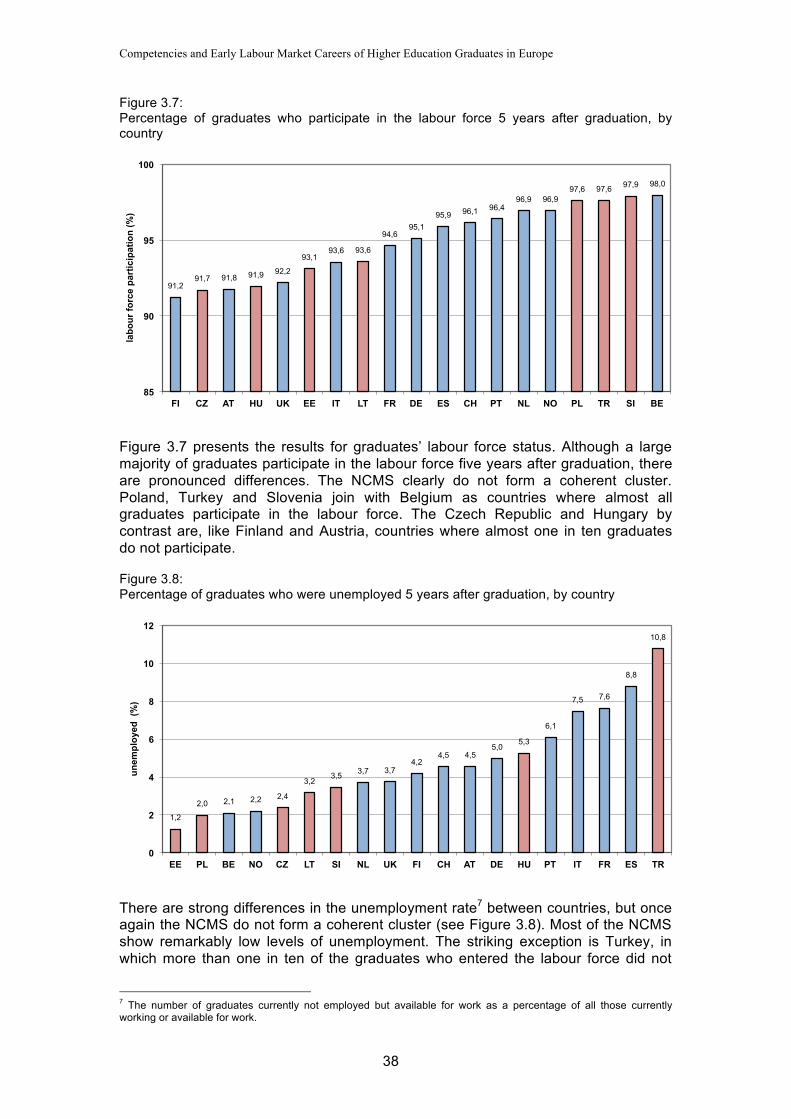
Competencies and Early Labour Market Careers of Higher Education Graduates in Europe
38
Figure 3.7: Percentage of graduates who participate in the labour force 5 years after graduation, by country
Figure 3.7 presents the results for graduates’ labour force status. Although a large majority of graduates participate in the labour force five years after graduation, there are pronounced differences. The NCMS clearly do not form a coherent cluster. Poland, Turkey and Slovenia join with Belgium as countries where almost all graduates participate in the labour force. The Czech Republic and Hungary by contrast are, like Finland and Austria, countries where almost one in ten graduates do not participate. Figure 3.8: Percentage of graduates who were unemployed 5 years after graduation, by country
There are strong differences in the unemployment rate7 between countries, but once again the NCMS do not form a coherent cluster (see Figure 3.8). Most of the NCMS show remarkably low levels of unemployment. The striking exception is Turkey, in which more than one in ten of the graduates who entered the labour force did not
7 The number of graduates currently not employed but available for work as a percentage of all those currently working or available for work.
91,2 91,7 91,8 91,9 92,2
93,1 93,6 93,6
94,6 95,1
95,9 96,1 96,4 96,9 96,9
97,6 97,6 97,9 98,0
85
90
95
100
FI CZ AT HU UK EE IT LT FR DE ES CH PT NL NO PL TR SI BE
labo
ur fo
rce
part
icip
atio
n (%
)
1,2
2,0 2,1 2,2 2,4
3,2 3,5 3,7 3,7
4,2 4,5 4,5
5,0 5,3
6,1
7,5 7,6
8,8
10,8
0
2
4
6
8
10
12
EE PL BE NO CZ LT SI NL UK FI CH AT DE HU PT IT FR ES TR
unem
ploy
ed (
%)

The Transition and Early Career
39
have work at the time of the survey. Hungary also shows a moderately high level of unemployment, whereas in Poland (2%) and Estonia (about 1%) graduate unemployment appears almost nonexistent. Labour force participation and unemployment give only a very rudimentary view of the degree to which graduates have laid a claim to a fully-fledged place in their national economy. A graduate who works just a few hours per week in a job unrelated to their higher education degree occupies a very different place in the economy to that of a graduate who works in a full-time job for which (s)he has been trained. In the remainder of this section, we look in more detail at labour force participation, by examining working hours. To gain an impression of the extent to which graduates have ‘grown’ into their current positions, we compare the situation in the current job with that in the first job gained after graduation. Figure 3.9: Average working hours in first and current job, by country
Figure 3.9 compares mean contract working hours of the first and current job. In most countries there is an increase in contract working hours after the first job. The differences between countries are quite small. Although the NCMS do not form a single coherent cluster, in most of them the number of hours worked is relatively high. As was the case for search duration, average working hours in countries can mask large differences in the distribution of working hours. Graduates can work either part time or full time, and many graduates even work more than a regular full-time working week. Figure 3.10 presents the percentage of graduates currently working full time or more in total in all jobs, distinguishing those who work full time (33 to 40 hours per week) and those who work more. Total working hours include contractual working hours, paid or unpaid average overtime in the main job and hours working in other jobs. Clearly, the majority of graduates in all countries currently work at least full-time, defined as 33 working hours or more per week. Only in the Netherlands do more than one in five graduates work part-time. Again, although the NCMS don’t form a single coherent group, in most of them the percentage working full-time is relatively high. What is particularly striking is the high percentage of graduates working more than a regular full-time working week in most countries. In Turkey this applies to almost three quarter of all working graduates. It seems that those Turkish
34 35 35
36 36 36 36 36 36 36 37
37 37 38 38 38 38
40
42
35
37
35 35
37 36
39
36
38 37
36
38 37 38
39
38
39
41
38
30
35
40
45
PT DE FR NL PL ES AT FI CZ IT NO HU BE UK LT EE SI TR CH
wor
king
hou
rs
first job current job

Competencies and Early Labour Market Careers of Higher Education Graduates in Europe
40
graduates who find full-time work make the most of this, by putting in long hours. This proportion is also very high in the Czech Republic and Slovenia. Figure 3.10: Graduates currently working fulltime in total over all jobs, by country
3.4 Quality of employment In this section we look in more detail at the quality of the jobs currently held by working graduates, in terms of the match between education, wages, career prospects, job security and job satisfaction. Figures 3.11 and 3.12 present the match between educational level and field of study and that considered appropriate in the current job. Figure 3.11: Percentage of graduates working in a job for which their own or a higher level is considered most appropriate, first and current job, by country
40 42 41
17 12 16 24
43 52
45 48 54 56
46
27 35
44 47 41
38 41 43
68 73 70
62
44 35
43 41 35 34
44
64 56
48 45
52
0
10
20
30
40
50
60
70
80
90
100
NL IT ES CH TR AT DE PL PT FR NO FI EE HU CZ BE UK LT SI
%
> 40 hrs 33-40 hrs
57 60 62
64 67 70 70 70
73 75 79 79 79 80 80
85 85 85 86
70
80 75
77 78 81
88
77
85 88
86 87 85 86 90
87 83
89 90
0
10
20
30
40
50
60
70
80
90
100
ES UK LT HU IT BE PL TR NL CZ SI FR AT NO FI CH DE EE PT
job
at o
wn
or h
ighe
r lev
el (%
)
first job current job
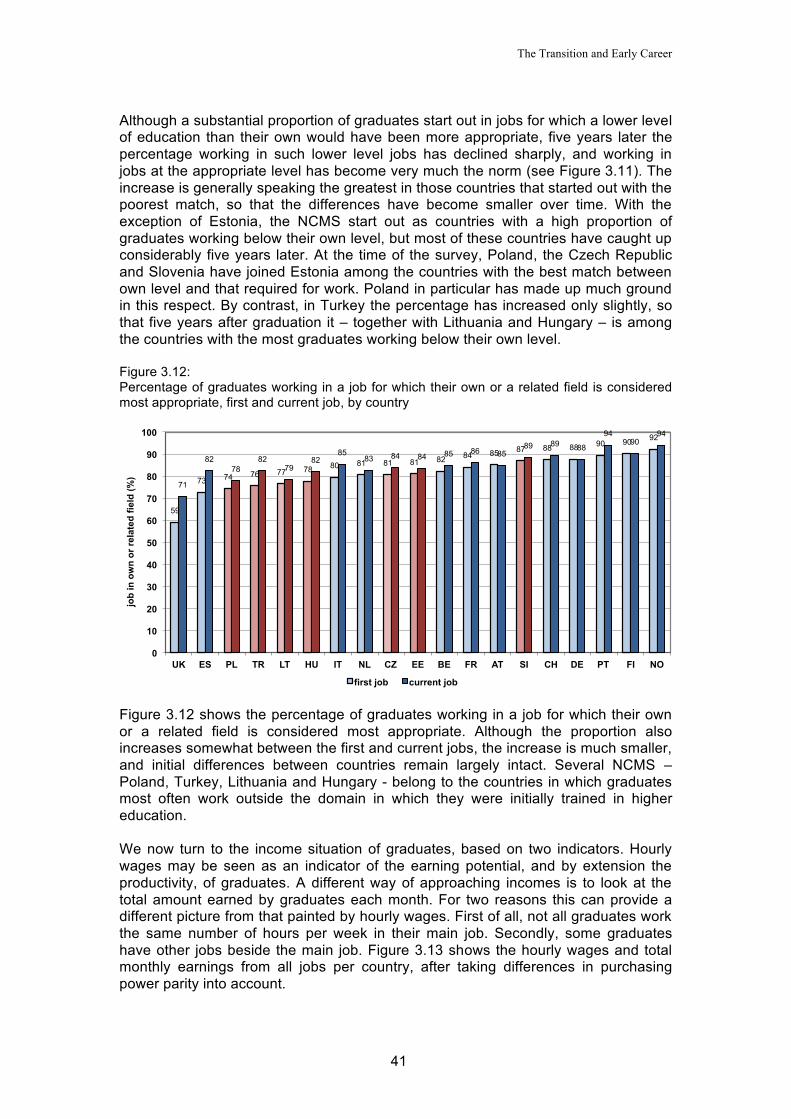
The Transition and Early Career
41
Although a substantial proportion of graduates start out in jobs for which a lower level of education than their own would have been more appropriate, five years later the percentage working in such lower level jobs has declined sharply, and working in jobs at the appropriate level has become very much the norm (see Figure 3.11). The increase is generally speaking the greatest in those countries that started out with the poorest match, so that the differences have become smaller over time. With the exception of Estonia, the NCMS start out as countries with a high proportion of graduates working below their own level, but most of these countries have caught up considerably five years later. At the time of the survey, Poland, the Czech Republic and Slovenia have joined Estonia among the countries with the best match between own level and that required for work. Poland in particular has made up much ground in this respect. By contrast, in Turkey the percentage has increased only slightly, so that five years after graduation it – together with Lithuania and Hungary – is among the countries with the most graduates working below their own level. Figure 3.12: Percentage of graduates working in a job for which their own or a related field is considered most appropriate, first and current job, by country
Figure 3.12 shows the percentage of graduates working in a job for which their own or a related field is considered most appropriate. Although the proportion also increases somewhat between the first and current jobs, the increase is much smaller, and initial differences between countries remain largely intact. Several NCMS – Poland, Turkey, Lithuania and Hungary - belong to the countries in which graduates most often work outside the domain in which they were initially trained in higher education. We now turn to the income situation of graduates, based on two indicators. Hourly wages may be seen as an indicator of the earning potential, and by extension the productivity, of graduates. A different way of approaching incomes is to look at the total amount earned by graduates each month. For two reasons this can provide a different picture from that painted by hourly wages. First of all, not all graduates work the same number of hours per week in their main job. Secondly, some graduates have other jobs beside the main job. Figure 3.13 shows the hourly wages and total monthly earnings from all jobs per country, after taking differences in purchasing power parity into account.
59
73 74 76 77 78 80 81 81 81 82 84 85 87 88 88 90 90 92
71
82 78
82 79
82 85
83 84 84 85 86 85 89 89 88
94 90
94
0
10
20
30
40
50
60
70
80
90
100
UK ES PL TR LT HU IT NL CZ EE BE FR AT SI CH DE PT FI NO
job
in o
wn
or re
late
d fie
ld (%
)
first job current job
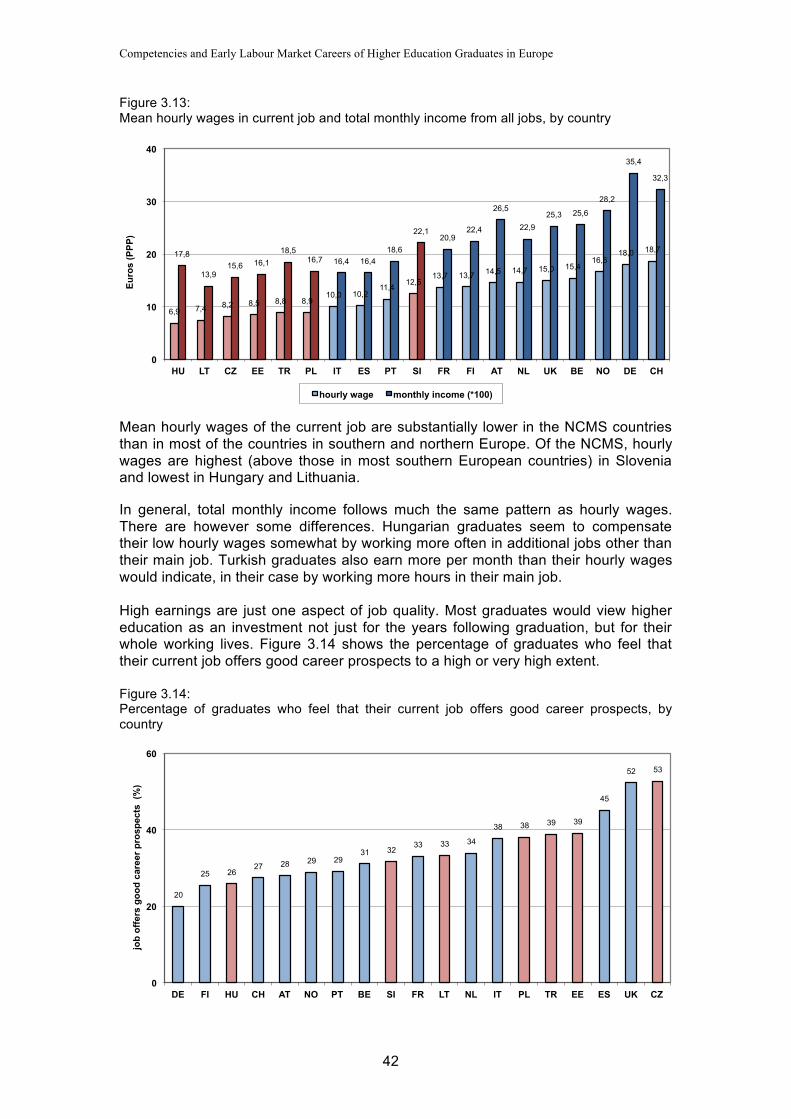
Competencies and Early Labour Market Careers of Higher Education Graduates in Europe
42
Figure 3.13: Mean hourly wages in current job and total monthly income from all jobs, by country
Mean hourly wages of the current job are substantially lower in the NCMS countries than in most of the countries in southern and northern Europe. Of the NCMS, hourly wages are highest (above those in most southern European countries) in Slovenia and lowest in Hungary and Lithuania. In general, total monthly income follows much the same pattern as hourly wages. There are however some differences. Hungarian graduates seem to compensate their low hourly wages somewhat by working more often in additional jobs other than their main job. Turkish graduates also earn more per month than their hourly wages would indicate, in their case by working more hours in their main job. High earnings are just one aspect of job quality. Most graduates would view higher education as an investment not just for the years following graduation, but for their whole working lives. Figure 3.14 shows the percentage of graduates who feel that their current job offers good career prospects to a high or very high extent. Figure 3.14: Percentage of graduates who feel that their current job offers good career prospects, by country
6,9 7,4 8,2 8,5 8,8 8,9 10,0 10,2
11,4 12,5
13,7 13,7 14,5 14,7 15,0 15,4 16,6
18,0 18,7 17,8
13,9 15,6 16,1
18,5 16,7 16,4 16,4
18,6
22,1 20,9
22,4
26,5
22,9 25,3 25,6
28,2
35,4
32,3
0
10
20
30
40
HU LT CZ EE TR PL IT ES PT SI FR FI AT NL UK BE NO DE CH
Euro
s (P
PP)
hourly wage monthly income (*100)
20
25 26 27 28 29 29
31 32 33 33 34
38 38 39 39
45
52 53
0
20
40
60
DE FI HU CH AT NO PT BE SI FR LT NL IT PL TR EE ES UK CZ
job
offe
rs g
ood
care
er p
rosp
ects
(%
)
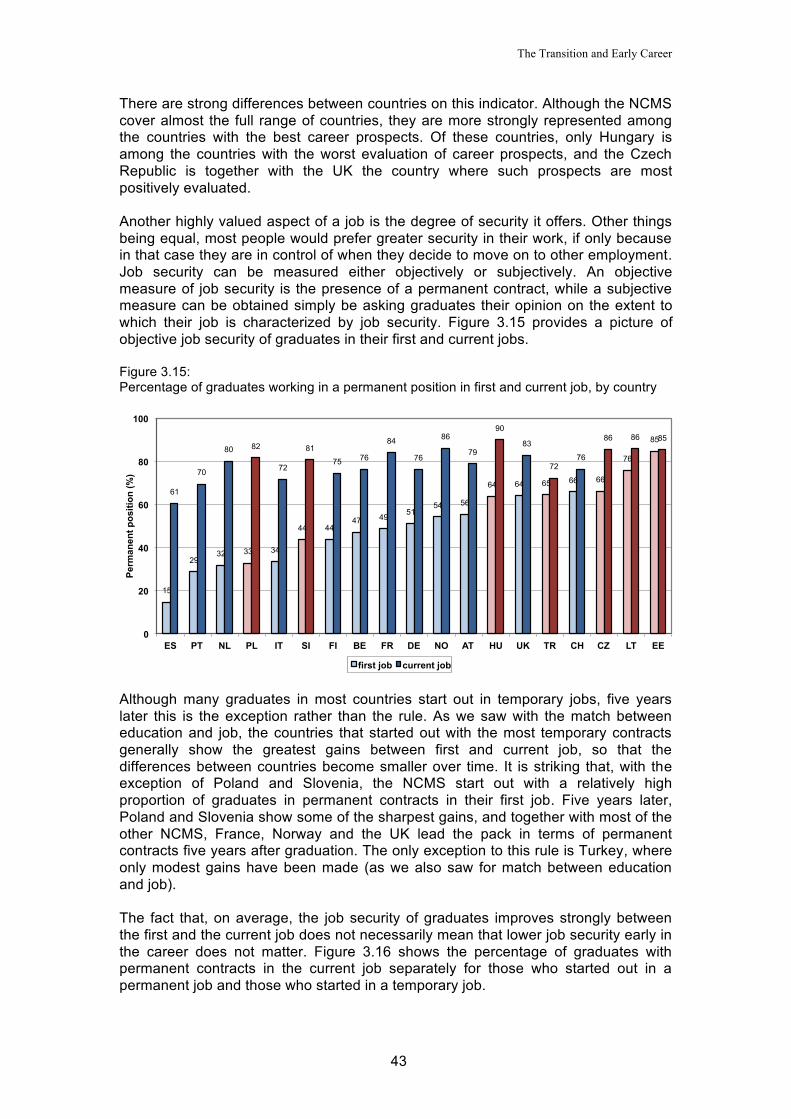
The Transition and Early Career
43
There are strong differences between countries on this indicator. Although the NCMS cover almost the full range of countries, they are more strongly represented among the countries with the best career prospects. Of these countries, only Hungary is among the countries with the worst evaluation of career prospects, and the Czech Republic is together with the UK the country where such prospects are most positively evaluated. Another highly valued aspect of a job is the degree of security it offers. Other things being equal, most people would prefer greater security in their work, if only because in that case they are in control of when they decide to move on to other employment. Job security can be measured either objectively or subjectively. An objective measure of job security is the presence of a permanent contract, while a subjective measure can be obtained simply be asking graduates their opinion on the extent to which their job is characterized by job security. Figure 3.15 provides a picture of objective job security of graduates in their first and current jobs. Figure 3.15: Percentage of graduates working in a permanent position in first and current job, by country
Although many graduates in most countries start out in temporary jobs, five years later this is the exception rather than the rule. As we saw with the match between education and job, the countries that started out with the most temporary contracts generally show the greatest gains between first and current job, so that the differences between countries become smaller over time. It is striking that, with the exception of Poland and Slovenia, the NCMS start out with a relatively high proportion of graduates in permanent contracts in their first job. Five years later, Poland and Slovenia show some of the sharpest gains, and together with most of the other NCMS, France, Norway and the UK lead the pack in terms of permanent contracts five years after graduation. The only exception to this rule is Turkey, where only modest gains have been made (as we also saw for match between education and job). The fact that, on average, the job security of graduates improves strongly between the first and the current job does not necessarily mean that lower job security early in the career does not matter. Figure 3.16 shows the percentage of graduates with permanent contracts in the current job separately for those who started out in a permanent job and those who started in a temporary job.
15
29 32 33 34
44 44 47 49 51
54 56
64 64 65 66 66
76
85
61
70
80 82
72
81
75 76
84
76
86
79
90
83
72 76
86 86 85
0
20
40
60
80
100
ES PT NL PL IT SI FI BE FR DE NO AT HU UK TR CH CZ LT EE
Perm
anen
t pos
ition
(%)
first job current job
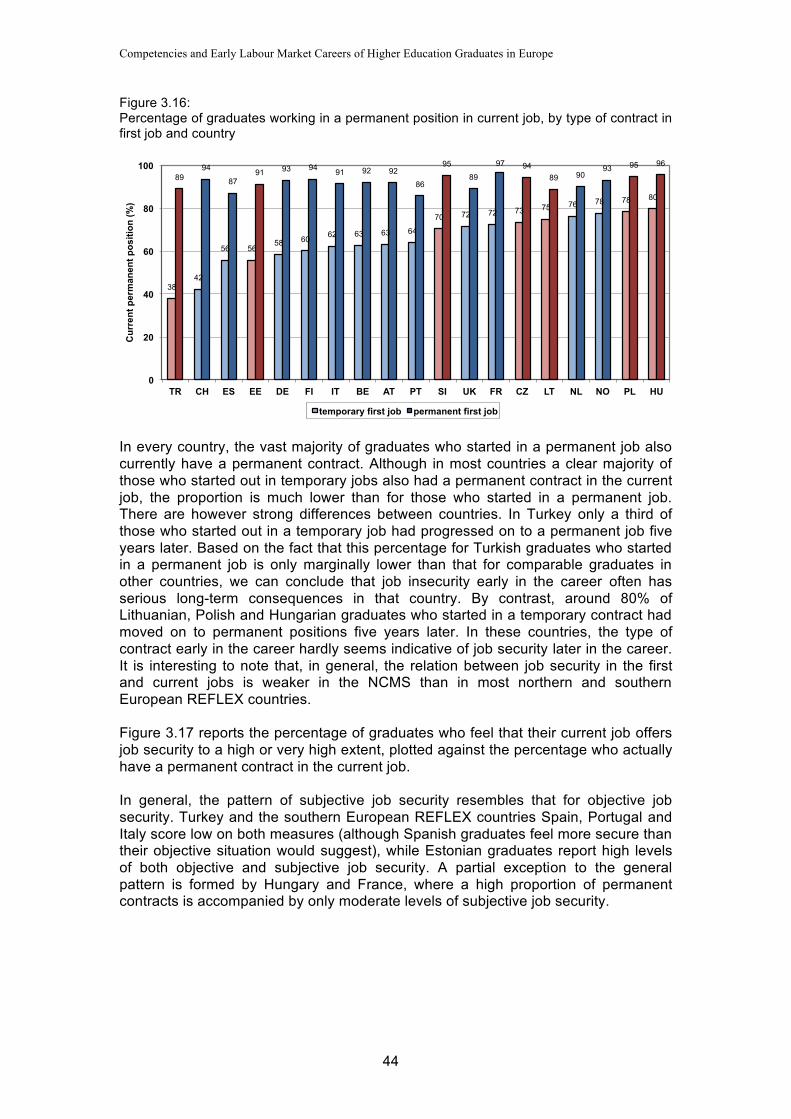
Competencies and Early Labour Market Careers of Higher Education Graduates in Europe
44
Figure 3.16: Percentage of graduates working in a permanent position in current job, by type of contract in first job and country
In every country, the vast majority of graduates who started in a permanent job also currently have a permanent contract. Although in most countries a clear majority of those who started out in temporary jobs also had a permanent contract in the current job, the proportion is much lower than for those who started in a permanent job. There are however strong differences between countries. In Turkey only a third of those who started out in a temporary job had progressed on to a permanent job five years later. Based on the fact that this percentage for Turkish graduates who started in a permanent job is only marginally lower than that for comparable graduates in other countries, we can conclude that job insecurity early in the career often has serious long-term consequences in that country. By contrast, around 80% of Lithuanian, Polish and Hungarian graduates who started in a temporary contract had moved on to permanent positions five years later. In these countries, the type of contract early in the career hardly seems indicative of job security later in the career. It is interesting to note that, in general, the relation between job security in the first and current jobs is weaker in the NCMS than in most northern and southern European REFLEX countries. Figure 3.17 reports the percentage of graduates who feel that their current job offers job security to a high or very high extent, plotted against the percentage who actually have a permanent contract in the current job. In general, the pattern of subjective job security resembles that for objective job security. Turkey and the southern European REFLEX countries Spain, Portugal and Italy score low on both measures (although Spanish graduates feel more secure than their objective situation would suggest), while Estonian graduates report high levels of both objective and subjective job security. A partial exception to the general pattern is formed by Hungary and France, where a high proportion of permanent contracts is accompanied by only moderate levels of subjective job security.
38 42
56 56 58 60 62 63 63 64
70 72 72 73 75 76 78 78 80
89 94
87 91 93 94 91 92 92
86
95
89
97 94 89 90
93 95 96
0
20
40
60
80
100
TR CH ES EE DE FI IT BE AT PT SI UK FR CZ LT NL NO PL HU
Cur
rent
per
man
ent p
ositi
on (%
)
temporary first job permanent first job

The Transition and Early Career
45
Figure 3.17: Permanent contract and subjective job security in the current job, by country
A good indicator of overall job quality is the level of job satisfaction of graduates working in those jobs. Respondents were asked to rate their job satisfaction on a five-point scale ranging from very dissatisfied to very satisfied. Respondents answering 4 and 5 on this scale can be regarded as having high job satisfaction. This is shown in Figure 3.18. Figure 3.18: Percentage of graduates who report high or very high job satisfaction, by country
In general, there are only fairly small differences between countries in the job satisfaction of graduates, with all but two countries falling in the range between 62% and 74%. The two exceptions are Italy, where only 57% of graduates was satisfied with the current job, and Turkey, where only half of all graduates were satisfied. The NCMS are distributed across almost the whole range, with Estonia joining Belgium, Norway and Austria as countries where a high proportion of graduates are satisfied with their work. Table 3.3 presents the results of multivariate analyses in which the effects of various characteristics on hourly wage are estimated.
IT
ES FR AT
DE
NL UK
FI
NO CZ
CH PT
BE
EE
SI
TR
LT
PL
HU
50
60
70
80
90
100
50 60 70 80 90 100
hig
h/ve
ry h
igh
subj
ectiv
e jo
b se
curit
y (%
)
permanent position (%)
50
57
62 63 63 65 65 65 66 67 68 68 70 71 72 72 73 74 74
0
20
40
60
80
TR IT PT HU ES UK SI FI LT PL NL FR DE CZ CH EE BE NO AT
(ver
y) s
atis
fied
with
cur
rent
job
(%)
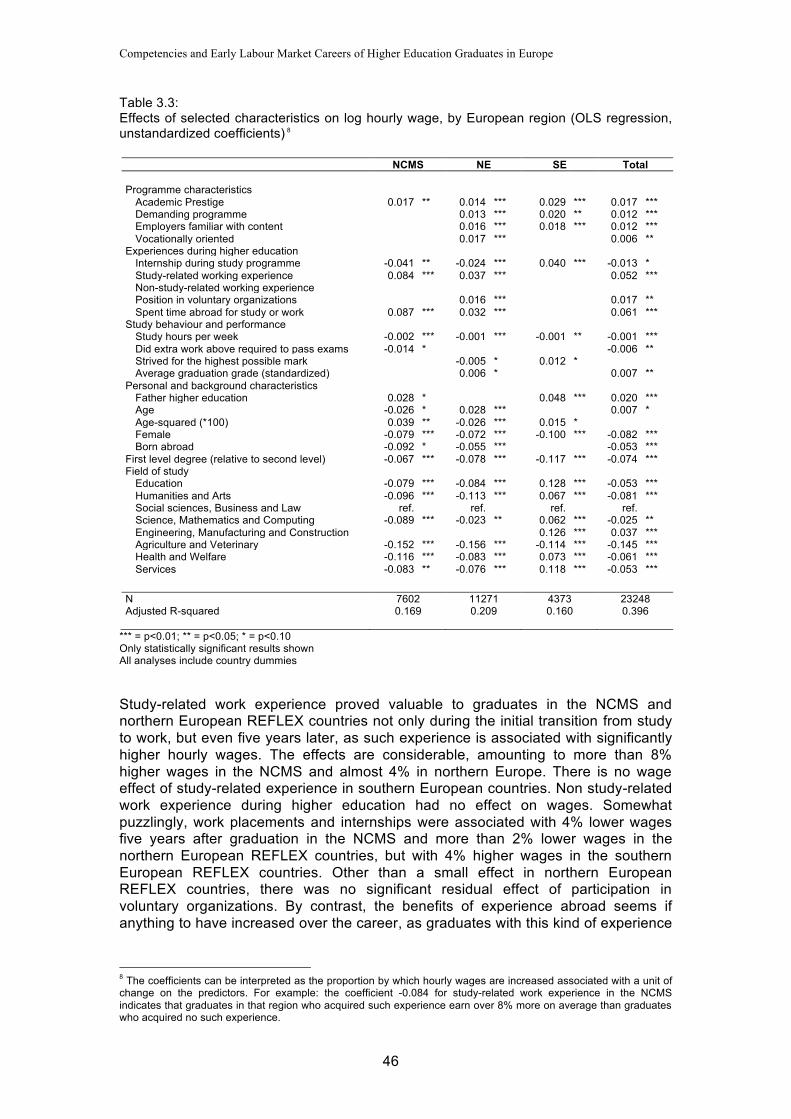
Competencies and Early Labour Market Careers of Higher Education Graduates in Europe
46
Table 3.3: Effects of selected characteristics on log hourly wage, by European region (OLS regression, unstandardized coefficients) 8
NCMS NE SE Total Programme characteristics Academic Prestige 0.017 ** 0.014 *** 0.029 *** 0.017 *** Demanding programme 0.013 *** 0.020 ** 0.012 *** Employers familiar with content 0.016 *** 0.018 *** 0.012 *** Vocationally oriented 0.017 *** 0.006 ** Experiences during higher education Internship during study programme -0.041 ** -0.024 *** 0.040 *** -0.013 * Study-related working experience 0.084 *** 0.037 *** 0.052 *** Non-study-related working experience Position in voluntary organizations 0.016 *** 0.017 ** Spent time abroad for study or work 0.087 *** 0.032 *** 0.061 *** Study behaviour and performance Study hours per week -0.002 *** -0.001 *** -0.001 ** -0.001 *** Did extra work above required to pass exams -0.014 * -0.006 ** Strived for the highest possible mark -0.005 * 0.012 * Average graduation grade (standardized) 0.006 * 0.007 ** Personal and background characteristics Father higher education 0.028 * 0.048 *** 0.020 *** Age -0.026 * 0.028 *** 0.007 * Age-squared (*100) 0.039 ** -0.026 *** 0.015 * Female -0.079 *** -0.072 *** -0.100 *** -0.082 *** Born abroad -0.092 * -0.055 *** -0.053 *** First level degree (relative to second level) -0.067 *** -0.078 *** -0.117 *** -0.074 *** Field of study Education -0.079 *** -0.084 *** 0.128 *** -0.053 *** Humanities and Arts -0.096 *** -0.113 *** 0.067 *** -0.081 *** Social sciences, Business and Law ref. ref. ref. ref. Science, Mathematics and Computing -0.089 *** -0.023 ** 0.062 *** -0.025 ** Engineering, Manufacturing and Construction 0.126 *** 0.037 *** Agriculture and Veterinary -0.152 *** -0.156 *** -0.114 *** -0.145 *** Health and Welfare -0.116 *** -0.083 *** 0.073 *** -0.061 *** Services -0.083 ** -0.076 *** 0.118 *** -0.053 *** N 7602 11271 4373 23248 Adjusted R-squared 0.169 0.209 0.160 0.396
*** = p<0.01; ** = p<0.05; * = p<0.10 Only statistically significant results shown All analyses include country dummies Study-related work experience proved valuable to graduates in the NCMS and northern European REFLEX countries not only during the initial transition from study to work, but even five years later, as such experience is associated with significantly higher hourly wages. The effects are considerable, amounting to more than 8% higher wages in the NCMS and almost 4% in northern Europe. There is no wage effect of study-related experience in southern European countries. Non study-related work experience during higher education had no effect on wages. Somewhat puzzlingly, work placements and internships were associated with 4% lower wages five years after graduation in the NCMS and more than 2% lower wages in the northern European REFLEX countries, but with 4% higher wages in the southern European REFLEX countries. Other than a small effect in northern European REFLEX countries, there was no significant residual effect of participation in voluntary organizations. By contrast, the benefits of experience abroad seems if anything to have increased over the career, as graduates with this kind of experience
8 The coefficients can be interpreted as the proportion by which hourly wages are increased associated with a unit of change on the predictors. For example: the coefficient -0.084 for study-related work experience in the NCMS indicates that graduates in that region who acquired such experience earn over 8% more on average than graduates who acquired no such experience.
The Transition and Early Career
47
during higher education earned almost 9% higher wages five years after graduation in the NCMS and more than 3% higher in northern European REFLEX countries. The effects of attending programmes that have strong links with the labour market, seem to be generally rather short-lived, at least in the NCMS. Whereas familiarity of employers with the content of the programme followed showed significant effects on wages five years later in the REFLEX countries, there was no such effect in the NCMS. And whereas vocational orientation had a positive effect on wages in northern European REFLEX countries, there was again no effect in the NCMS. In contrast, participation in prestigious programmes, which did not help graduates find a job quickly after graduation, show positive effects on wages in all three regions.. Participation in demanding programmes showed positive effects on wages in the REFLEX countries, but not in the NCMS. Good grades had a weak effect on wages in northern Europe, and no effect at all in southern Europe and the NCMS. Even more than was the case with search duration, study effort and motivation seem anything but helpful when it comes to wages. Study hours per week showed a weak negative effect in all three regions. The willingness to do extra work above what was required to pass exams had a moderate negative effect in the NCMS. Striving for the highest possible grades had no effect in the NCMS, but showed a moderate positive effect in southern Europe and a weak negative effect in northern Europe. As remarked above, these indicators may be associated with unobserved differences in ability, search behaviour and such that are in turn the real cause of lower wages. Personal and background characteristics of graduates have a significant effect on wages in some countries. In the NCMS and southern European REFLEX countries graduates whose father had a higher education degree earned respectively 3% and 5% more five years after graduation than graduates whose father had no such degree. Strangely, although older graduates earned significantly more than younger graduates in northern Europe, they earned significantly less in the NCMS. Female graduates were at a strong disadvantage in all three regions, earning 7-10% less than similar male graduates. Graduates who were born abroad did earn respectively 9% and almost 6% less than home-country graduates in the NCMS and northern European REFLEX countries. First level graduates earn 7-11% less than second level graduates in all three regions. In the NCMS and northern Europe, graduates in the field of social sciences, business and law, which was the reference category, show higher earnings than graduates in most other fields. By contrast, southern European graduates in all fields besides agriculture and veterinary earn more than the reference category.
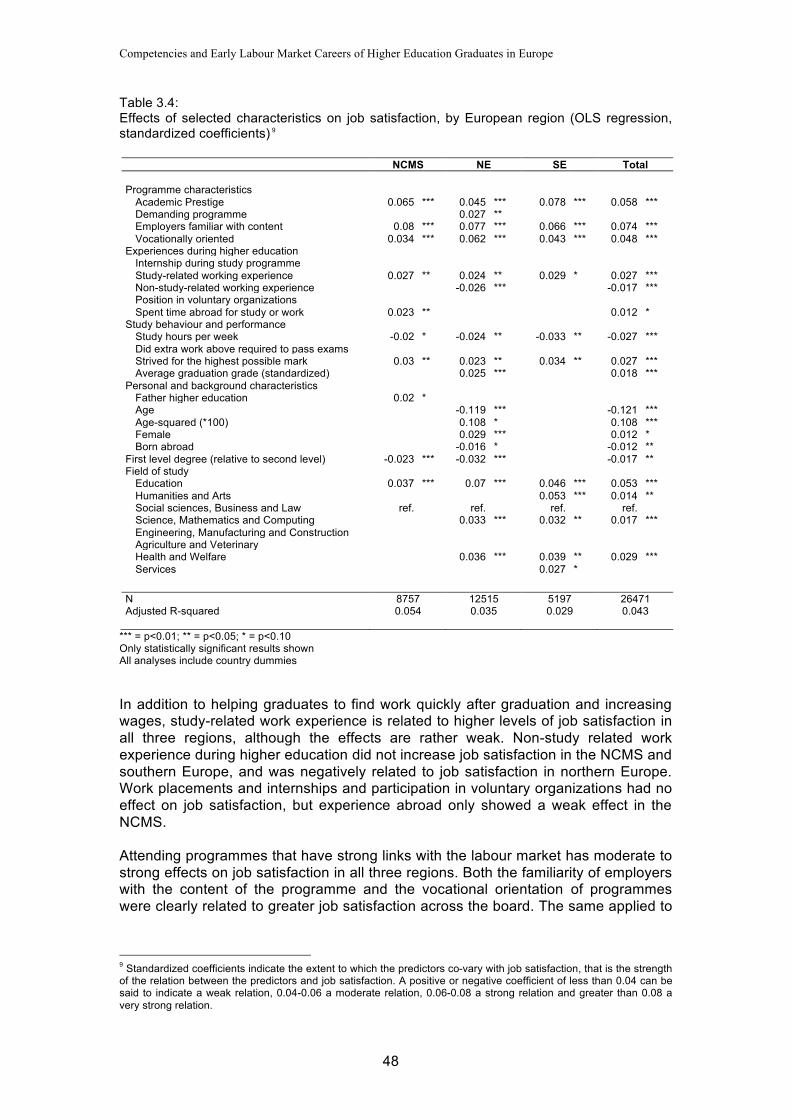
Competencies and Early Labour Market Careers of Higher Education Graduates in Europe
48
Table 3.4: Effects of selected characteristics on job satisfaction, by European region (OLS regression, standardized coefficients) 9
NCMS NE SE Total Programme characteristics Academic Prestige 0.065 *** 0.045 *** 0.078 *** 0.058 *** Demanding programme 0.027 ** Employers familiar with content 0.08 *** 0.077 *** 0.066 *** 0.074 *** Vocationally oriented 0.034 *** 0.062 *** 0.043 *** 0.048 *** Experiences during higher education Internship during study programme Study-related working experience 0.027 ** 0.024 ** 0.029 * 0.027 *** Non-study-related working experience -0.026 *** -0.017 *** Position in voluntary organizations Spent time abroad for study or work 0.023 ** 0.012 * Study behaviour and performance Study hours per week -0.02 * -0.024 ** -0.033 ** -0.027 *** Did extra work above required to pass exams Strived for the highest possible mark 0.03 ** 0.023 ** 0.034 ** 0.027 *** Average graduation grade (standardized) 0.025 *** 0.018 *** Personal and background characteristics Father higher education 0.02 * Age -0.119 *** -0.121 *** Age-squared (*100) 0.108 * 0.108 *** Female 0.029 *** 0.012 * Born abroad -0.016 * -0.012 ** First level degree (relative to second level) -0.023 *** -0.032 *** -0.017 ** Field of study Education 0.037 *** 0.07 *** 0.046 *** 0.053 *** Humanities and Arts 0.053 *** 0.014 ** Social sciences, Business and Law ref. ref. ref. ref. Science, Mathematics and Computing 0.033 *** 0.032 ** 0.017 *** Engineering, Manufacturing and Construction Agriculture and Veterinary Health and Welfare 0.036 *** 0.039 ** 0.029 *** Services 0.027 * N 8757 12515 5197 26471 Adjusted R-squared 0.054 0.035 0.029 0.043
*** = p<0.01; ** = p<0.05; * = p<0.10 Only statistically significant results shown All analyses include country dummies In addition to helping graduates to find work quickly after graduation and increasing wages, study-related work experience is related to higher levels of job satisfaction in all three regions, although the effects are rather weak. Non-study related work experience during higher education did not increase job satisfaction in the NCMS and southern Europe, and was negatively related to job satisfaction in northern Europe. Work placements and internships and participation in voluntary organizations had no effect on job satisfaction, but experience abroad only showed a weak effect in the NCMS. Attending programmes that have strong links with the labour market has moderate to strong effects on job satisfaction in all three regions. Both the familiarity of employers with the content of the programme and the vocational orientation of programmes were clearly related to greater job satisfaction across the board. The same applied to
9 Standardized coefficients indicate the extent to which the predictors co-vary with job satisfaction, that is the strength of the relation between the predictors and job satisfaction. A positive or negative coefficient of less than 0.04 can be said to indicate a weak relation, 0.04-0.06 a moderate relation, 0.06-0.08 a strong relation and greater than 0.08 a very strong relation.

The Transition and Early Career
49
academic prestige, but again there was no effect of demandingness of the programme in the NCMS (although a weak effect was present in northern Europe). Good grades had only a weak effect on job satisfaction five years later in northern Europe, but not in southern Europe of the NCMS. Hours studied per week during higher education showed weak negative effects on job satisfaction in all three regions. There were no significant effects of the willingness to do extra work, but the willingness to strive for higher grades showed weak positive effects on job satisfaction in all three regions. Personal and background characteristics of graduates had quite strong effects on job satisfaction in northern Europe, but little or no effect in the NCMS and southern Europe. First level graduates were slightly less satisfied than second level graduates in the NCMS and northern Europe. Graduates in the field of Education are relatively satisfied with their work in all three regions, and Science, mathematics and computing graduates and Health and welfare graduates in the REFLEX countries were somewhat more satisfied than graduates in the reference field of social sciences, business and law.
3.5 Evaluation of study programme Figures 3.19 to 3.21 present the evaluation results of graduates’ study programme as a basis for work, career and everyday life, by country. We start in Figure 3.19 with the evaluation of the programme as a basis for starting work, and as a basis for current work tasks (that is, for work tasks five years after graduation). This give an impression for the extent to which the programme prepared graduates for work in the short and the medium term. Figure 3.19: Evaluation of study programme as basis for starting work and for performing current work tasks, by country
In general, the two dimensions are quite strongly related, suggesting that, in the eyes of graduates, there is a link between what works well in the short term and what works further along in the career. The evaluation of the programme as a basis for performing current tasks is somewhat less positive than that for starting work in almost all countries. This is only to be expected, since even in the best imaginable case the knowledge and skills gained in education will be subject to a certain degree
IT
ES
FR AT
DE
NL
UK
FI NO
CZ
CH
PT
BE EE
SI TR
LT PL HU
10
30
50
70
90
10 30 50 70 90
cur
rent
wor
k ta
sks(
%)
starting work (%)
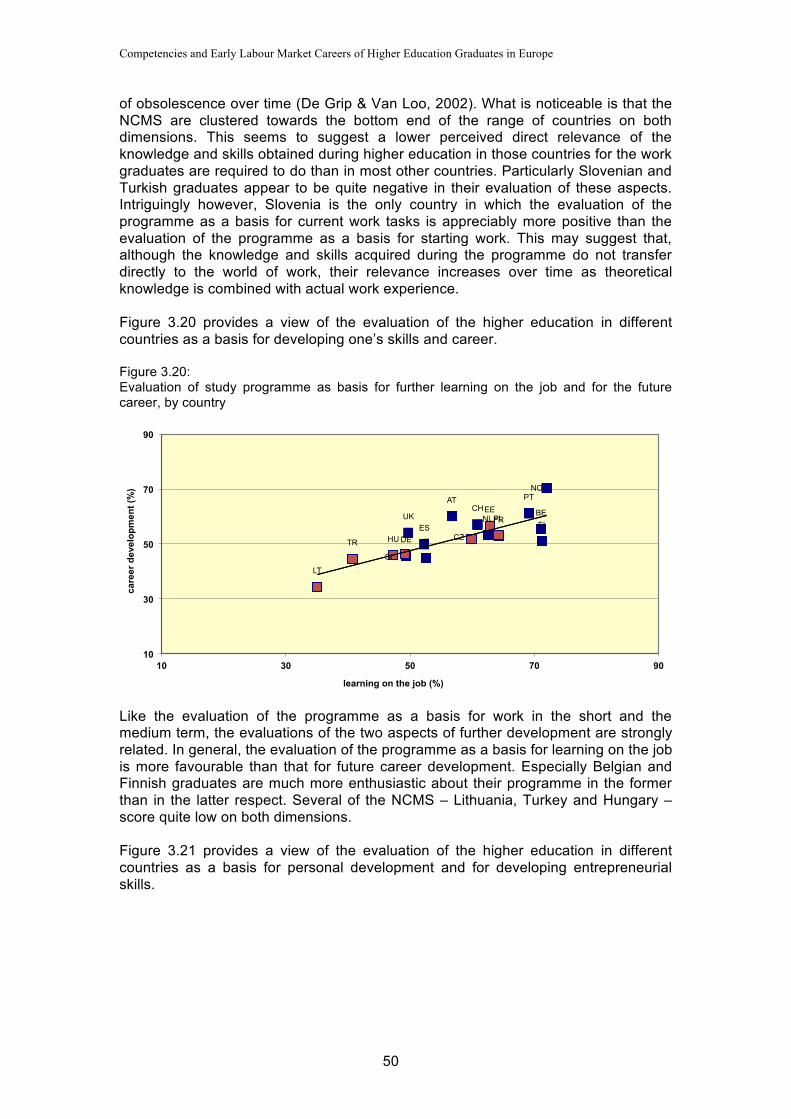
Competencies and Early Labour Market Careers of Higher Education Graduates in Europe
50
of obsolescence over time (De Grip & Van Loo, 2002). What is noticeable is that the NCMS are clustered towards the bottom end of the range of countries on both dimensions. This seems to suggest a lower perceived direct relevance of the knowledge and skills obtained during higher education in those countries for the work graduates are required to do than in most other countries. Particularly Slovenian and Turkish graduates appear to be quite negative in their evaluation of these aspects. Intriguingly however, Slovenia is the only country in which the evaluation of the programme as a basis for current work tasks is appreciably more positive than the evaluation of the programme as a basis for starting work. This may suggest that, although the knowledge and skills acquired during the programme do not transfer directly to the world of work, their relevance increases over time as theoretical knowledge is combined with actual work experience. Figure 3.20 provides a view of the evaluation of the higher education in different countries as a basis for developing one’s skills and career. Figure 3.20: Evaluation of study programme as basis for further learning on the job and for the future career, by country
Like the evaluation of the programme as a basis for work in the short and the medium term, the evaluations of the two aspects of further development are strongly related. In general, the evaluation of the programme as a basis for learning on the job is more favourable than that for future career development. Especially Belgian and Finnish graduates are much more enthusiastic about their programme in the former than in the latter respect. Several of the NCMS – Lithuania, Turkey and Hungary – score quite low on both dimensions. Figure 3.21 provides a view of the evaluation of the higher education in different countries as a basis for personal development and for developing entrepreneurial skills.
IT
ES FR
AT
DE
NL UK FI
NO
CZ
CH PT
BE EE
SI
TR
LT
PL
HU
10
30
50
70
90
10 30 50 70 90
car
eer d
evel
opm
ent (
%)
learning on the job (%)
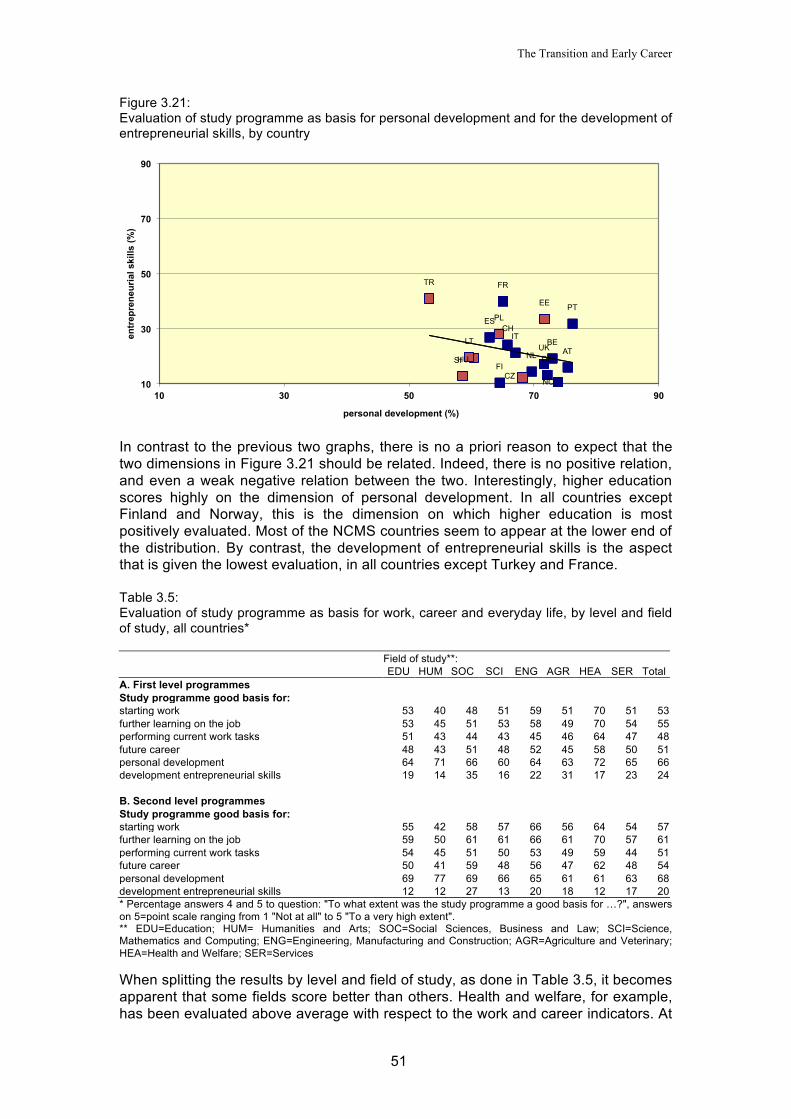
The Transition and Early Career
51
Figure 3.21: Evaluation of study programme as basis for personal development and for the development of entrepreneurial skills, by country
In contrast to the previous two graphs, there is no a priori reason to expect that the two dimensions in Figure 3.21 should be related. Indeed, there is no positive relation, and even a weak negative relation between the two. Interestingly, higher education scores highly on the dimension of personal development. In all countries except Finland and Norway, this is the dimension on which higher education is most positively evaluated. Most of the NCMS countries seem to appear at the lower end of the distribution. By contrast, the development of entrepreneurial skills is the aspect that is given the lowest evaluation, in all countries except Turkey and France. Table 3.5: Evaluation of study programme as basis for work, career and everyday life, by level and field of study, all countries* Field of study**: EDU HUM SOC SCI ENG AGR HEA SER Total A. First level programmes Study programme good basis for: starting work 53 40 48 51 59 51 70 51 53 further learning on the job 53 45 51 53 58 49 70 54 55 performing current work tasks 51 43 44 43 45 46 64 47 48 future career 48 43 51 48 52 45 58 50 51 personal development 64 71 66 60 64 63 72 65 66 development entrepreneurial skills 19 14 35 16 22 31 17 23 24 B. Second level programmes Study programme good basis for: starting work 55 42 58 57 66 56 64 54 57 further learning on the job 59 50 61 61 66 61 70 57 61 performing current work tasks 54 45 51 50 53 49 59 44 51 future career 50 41 59 48 56 47 62 48 54 personal development 69 77 69 66 65 61 61 63 68 development entrepreneurial skills 12 12 27 13 20 18 12 17 20 * Percentage answers 4 and 5 to question: "To what extent was the study programme a good basis for …?", answers on 5=point scale ranging from 1 "Not at all" to 5 "To a very high extent". ** EDU=Education; HUM= Humanities and Arts; SOC=Social Sciences, Business and Law; SCI=Science, Mathematics and Computing; ENG=Engineering, Manufacturing and Construction; AGR=Agriculture and Veterinary; HEA=Health and Welfare; SER=Services When splitting the results by level and field of study, as done in Table 3.5, it becomes apparent that some fields score better than others. Health and welfare, for example, has been evaluated above average with respect to the work and career indicators. At
IT
ES
FR
AT DE NL
UK
FI
NO CZ
CH
PT
BE
EE
SI
TR
LT
PL
HU
10
30
50
70
90
10 30 50 70 90
ent
repr
eneu
rial s
kills
(%)
personal development (%)

Competencies and Early Labour Market Careers of Higher Education Graduates in Europe
52
the same time, it has been evaluated below average with regard to the development of entrepreneurial skills. In contrast, humanities and arts scored below average with regard to all indicators except personal development where it scored highest amongst all fields of education. Figure 3.22 shows the percentage of graduates who would choose the same study programme at the same institute if they could choose again. This can be seen as an overall indicator of study satisfaction. Figure 3.22: Preference for the same study programme and institute if one could choose again, by country*
Graduates from the NCMS, with the exception of Czech graduates, report less frequently that they would choose the same study programme at the institute again if they were free to choose again than graduates from most northern and southern European REFLEX countries. This is seen particularly strongly in Turkey, where just a third of graduates say they would choose the same programme at the same institute again. By contrast, over two thirds of graduates in Belgium, Switzerland and France report that they would repeat their initial choice if they were allowed to choose again. As Figure 3.23 shows, second level graduates report more often that they would make the same study choice again than first level graduates. At both levels, preference for the same study programme at the same institute is highest for health and welfare graduates. With regard to first level programmes, this preference is lowest for graduates of agriculture and veterinary. With regard to second level programmes, the preference for the same study programme at the same institute is lowest for humanities and arts graduates, closely followed by education as well as agriculture and veterinary graduates.
35
48 49 53
56 56 57 58 59 60 62 64 64 65 65 66
69 69 71
0
20
40
60
80
100
TR LT ES EE PT SI HU DE FI PL NL NO CZ UK IT AT BE CH FR
Wou
ld c
hoos
e sa
me
stud
y/in
stitu
te (%
)

The Transition and Early Career
53
Figure 3.23: Preference for the same study programme if one could choose again, by level and field of study, all countries
3.6 Conclusions In most countries, a strong majority of graduates enjoy a rather smooth transition from higher education to work, and a rather successful start to their career. In most countries, more than nine out of ten graduates obtained work in less than six months after graduation. Although the first job obtained sometimes did not match the level and/or field of the graduates’ own higher education qualifications, and was often in a temporary contract, five years later most graduates had obtained a permanent contract in a suitable job. Despite this generally rosy picture, there is room for improvement in some areas. Although the transition and early career is a success for most graduates, there are some for whom things turn out less well, and these are strongly concentrated in particular countries. Although some of the NCMS are included here, it is clear that these countries do not form a coherent block. On the contrary, while for example Turkey and to a lesser extent Hungary resemble southern European REFLEX countries in having generally unfavourable employment prospects for graduates, Estonia and Poland show the lowest graduate unemployment levels of all the countries five years after graduation. Chapter 6 describes in detail how the NCMS fit into the overall range of countries in terms of transition and early career. There are also some indicators on which none of the countries scores particularly well. In most countries only around a quarter to a third of graduates reported that the current job offers good career prospects. This might help explain why, despite graduates’ high success rate in terms of finding suitable work, the proportion of graduates who are satisfied with their current job is only around two thirds in most countries. What can higher education institutions and students do to improve their chances of a smooth and successful transition to the world of work? We found clear evidence that strong links between higher education and work facilitate a rapid transition from study to work and greatly improve the chances that the work found is rewarding, both materially and psychologically. Students can themselves narrow the gap between higher education and work by acquiring study-related work experience while in higher
48 53 55 54 54
59 60 64
60 59 58 61
63 60
65 69
0
20
40
60
80
AGR EDU HUM SER SOC SCI ENG HEA
wou
ld c
hoos
e sa
me
stud
y/in
stitu
te (%
)
first level second level
Competencies and Early Labour Market Careers of Higher Education Graduates in Europe
54
education, and this also turns out to be a highly successful way of ensuring a successful transition. Particularly in the NCMS experience abroad during higher education also seems to provide a strong platform on which graduates can enter the labour market with some confidence. Contrary to expectations, organized work experience in the form of work placements or internships does not appear beneficial, and in some cases is even related to somewhat less favourable outcomes. This result does not necessarily mean that such organized experience is not a good thing, but may reflect the fact that work placements or internships are often programme or even system characteristics, in which most if not all students in the relevant programme participate. This circumstance makes it difficult to disentangle the effects of such experience on the prospects of individual graduates of a particular programme from the effect of general characteristics of that programme, such as familiarity of employers with its content and the degree of vocational orientation. Another feature of higher education that is strongly related to a successful transition to the world of work is the degree of academic prestige of the programme. The effects of prestige of programmes is not attributable to their demandingness, in fact the latter programme characteristic shows relatively little effect on labour market success. Of course, in the short term higher education institutes have little control over their prestige (and students none at all), but this result underscores the value of obtaining access to the best universities and colleges, and is as such especially of interest to secondary school students. Several personal characteristics have quite strong effects on the chances of a successful transition from study to work. Graduates whose father has a higher education qualification have a much more successful transition, especially in the NCMS, where these graduates find work more quickly, earn higher wages, and are more satisfied with their work than graduates whose fathers do not have a higher education degree. Women have a much tougher time of it than comparable men, taking longer to find work and earning less in the jobs that they find. Foreign born graduates find work just as quickly, but earn less than home-country graduates. In most countries, the aspect on which graduates are most likely to give a positive evaluation of their study programme is as a basis for personal development. The evaluation of the programme as a basis for work or for skill and career development is generally less positive, especially in the NCMS. The aspect on which graduates are least likely to give a positive evaluation of their study programme is as a basis for the development of entrepreneurial skills. Interestingly, Turkey Poland and Estonia are among the few countries where a sizable proportion of graduates give a positive evaluation of this aspect. Graduates from the NCMS, with the exception of Czech graduates, report less frequently that they would choose the same study programme at the institute again if they were free to choose again than graduates from most northern and southern European REFLEX countries.

The Role of Higher Education in Producing Relevant Competences
55
Chapter 4 The Role of Higher Education in Producing Relevant Competences Jim Allen, Johan Coenen and Martin Humburg
4.1 Introduction In the previous chapters we have looked at the experiences of the graduates during higher education, as well as the transition from higher education to the labour market. In this chapter we will focus on the key competences required of higher education graduates in the world of work. In Section 4.2 we will first identify these competences and the extent to which graduates possess them. We will then identify which competences were considered as particularly strong or weak points of the study programme (Section 4.3). Finally we will identify which characteristics of the higher education program are relevant in producing the key competences (Section 4.4).
4.2 Required and acquired competences One of the key foci in the survey is on the competences required of higher education in the world of work, and the extent to which graduates possess these. To this end, graduates were asked to rate both their own level of ability and the level required in their current job on 22 different competences. Both own level and required level were measured on the same 7-point scale ranging from ‘very low’(1) to ‘very high’ (7). This allows us not only to identify competences which are required or possessed to a high extent, but also to calculate discrepancies between own and required levels and so to identify shortages and surpluses. In this section we aim first of all to identify those competences that are most often required at a high or very high level by employers, as well as competences for which graduates own level is significantly lower than the level required in their jobs (shortages). In both cases we will determine these competences first for the NCMS and then look how they compare to the other countries. The selection of most relevant skills in the NCMS will form the main focus of Section 4.4, in which the effectiveness of higher education as a producer of competences that are in high demand is the key focus. In Chapter 5, we will look among other things at the characteristics of firms and organizations and the market in which they operate on the required level of these competences.
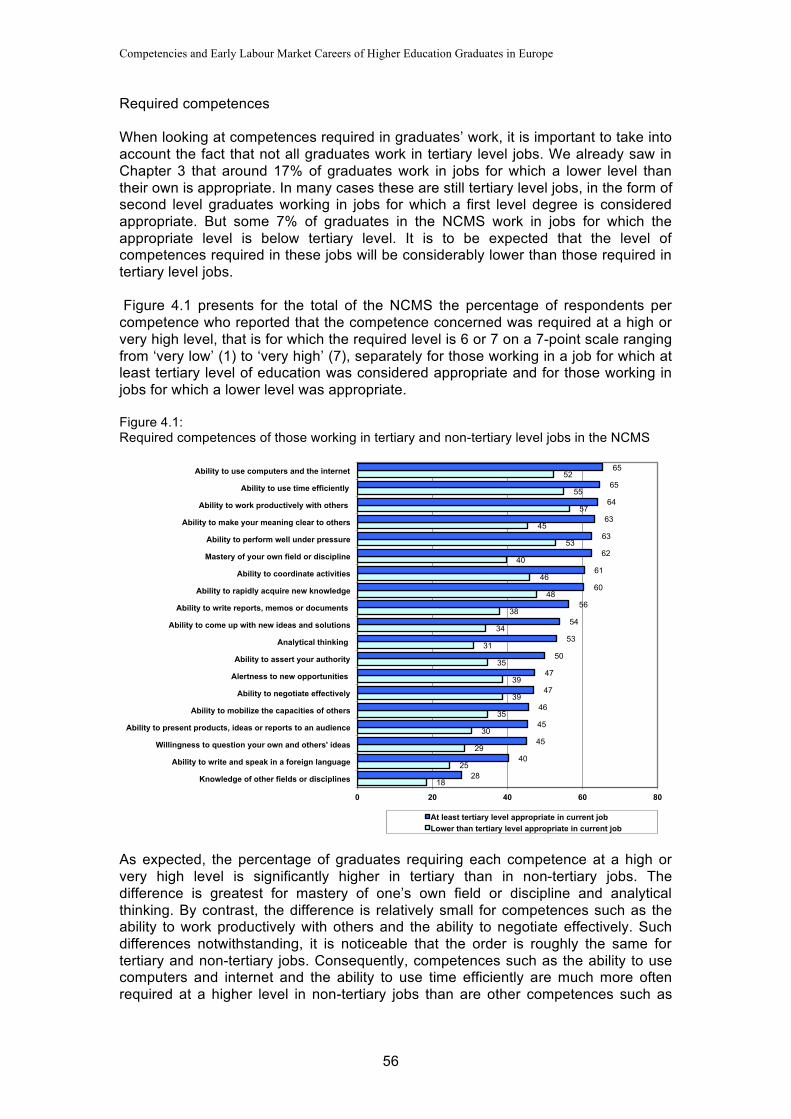
Competencies and Early Labour Market Careers of Higher Education Graduates in Europe
56
Required competences When looking at competences required in graduates’ work, it is important to take into account the fact that not all graduates work in tertiary level jobs. We already saw in Chapter 3 that around 17% of graduates work in jobs for which a lower level than their own is appropriate. In many cases these are still tertiary level jobs, in the form of second level graduates working in jobs for which a first level degree is considered appropriate. But some 7% of graduates in the NCMS work in jobs for which the appropriate level is below tertiary level. It is to be expected that the level of competences required in these jobs will be considerably lower than those required in tertiary level jobs. Figure 4.1 presents for the total of the NCMS the percentage of respondents per competence who reported that the competence concerned was required at a high or very high level, that is for which the required level is 6 or 7 on a 7-point scale ranging from ‘very low’ (1) to ‘very high’ (7), separately for those working in a job for which at least tertiary level of education was considered appropriate and for those working in jobs for which a lower level was appropriate. Figure 4.1: Required competences of those working in tertiary and non-tertiary level jobs in the NCMS
As expected, the percentage of graduates requiring each competence at a high or very high level is significantly higher in tertiary than in non-tertiary jobs. The difference is greatest for mastery of one’s own field or discipline and analytical thinking. By contrast, the difference is relatively small for competences such as the ability to work productively with others and the ability to negotiate effectively. Such differences notwithstanding, it is noticeable that the order is roughly the same for tertiary and non-tertiary jobs. Consequently, competences such as the ability to use computers and internet and the ability to use time efficiently are much more often required at a higher level in non-tertiary jobs than are other competences such as
18
25
29
30
35
39
39
35
31
34
38
48
46
40
53
45
57
55
52
28
40
45
45
46
47
47
50
53
54
56
60
61
62
63
63
64
65
65
0 20 40 60 80
Knowledge of other fields or disciplines
Ability to write and speak in a foreign language
Willingness to question your own and others' ideas
Ability to present products, ideas or reports to an audience
Ability to mobilize the capacities of others
Ability to negotiate effectively
Alertness to new opportunities
Ability to assert your authority
Analytical thinking
Ability to come up with new ideas and solutions
Ability to write reports, memos or documents
Ability to rapidly acquire new knowledge
Ability to coordinate activities
Mastery of your own field or discipline
Ability to perform well under pressure
Ability to make your meaning clear to others
Ability to work productively with others
Ability to use time efficiently
Ability to use computers and the internet
At least tertiary level appropriate in current job Lower than tertiary level appropriate in current job
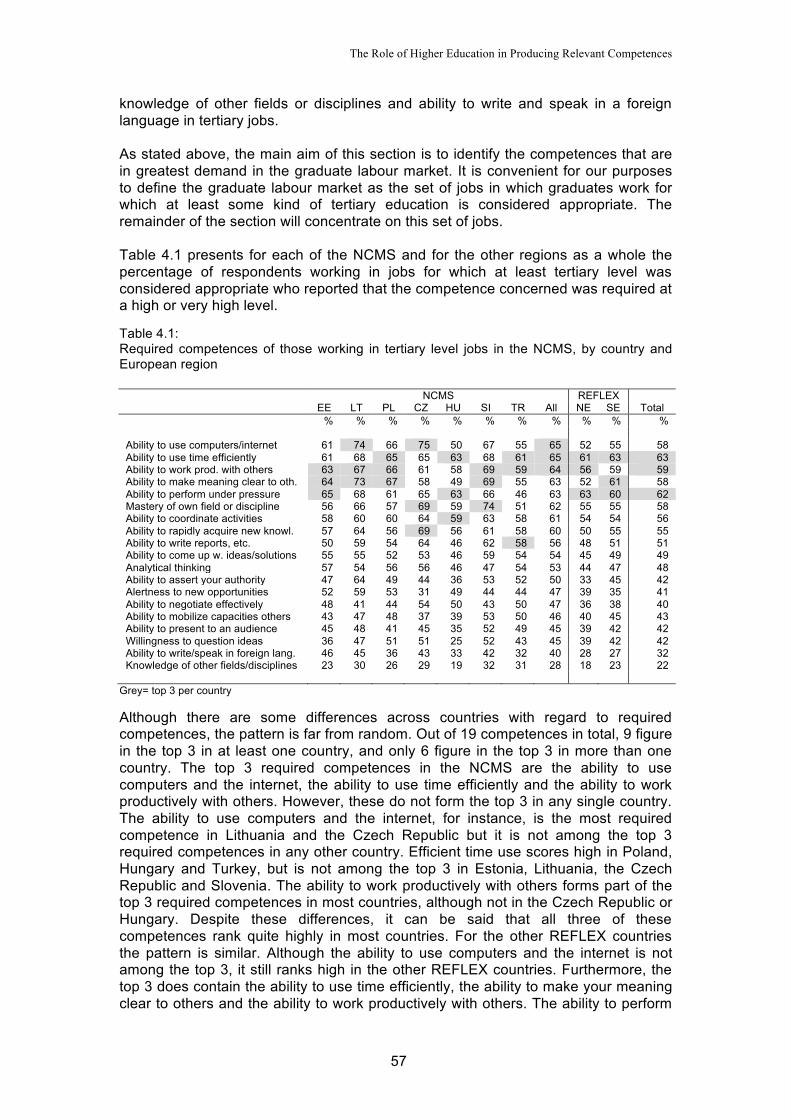
The Role of Higher Education in Producing Relevant Competences
57
knowledge of other fields or disciplines and ability to write and speak in a foreign language in tertiary jobs. As stated above, the main aim of this section is to identify the competences that are in greatest demand in the graduate labour market. It is convenient for our purposes to define the graduate labour market as the set of jobs in which graduates work for which at least some kind of tertiary education is considered appropriate. The remainder of the section will concentrate on this set of jobs. Table 4.1 presents for each of the NCMS and for the other regions as a whole the percentage of respondents working in jobs for which at least tertiary level was considered appropriate who reported that the competence concerned was required at a high or very high level. Table 4.1: Required competences of those working in tertiary level jobs in the NCMS, by country and European region
NCMS REFLEX EE LT PL CZ HU SI TR All NE SE Total % % % % % % % % % % % Ability to use computers/internet 61 74 66 75 50 67 55 65 52 55 58 Ability to use time efficiently 61 68 65 65 63 68 61 65 61 63 63 Ability to work prod. with others 63 67 66 61 58 69 59 64 56 59 59 Ability to make meaning clear to oth. 64 73 67 58 49 69 55 63 52 61 58 Ability to perform under pressure 65 68 61 65 63 66 46 63 63 60 62 Mastery of own field or discipline 56 66 57 69 59 74 51 62 55 55 58 Ability to coordinate activities 58 60 60 64 59 63 58 61 54 54 56 Ability to rapidly acquire new knowl. 57 64 56 69 56 61 58 60 50 55 55 Ability to write reports, etc. 50 59 54 64 46 62 58 56 48 51 51 Ability to come up w. ideas/solutions 55 55 52 53 46 59 54 54 45 49 49 Analytical thinking 57 54 56 56 46 47 54 53 44 47 48 Ability to assert your authority 47 64 49 44 36 53 52 50 33 45 42 Alertness to new opportunities 52 59 53 31 49 44 44 47 39 35 41 Ability to negotiate effectively 48 41 44 54 50 43 50 47 36 38 40 Ability to mobilize capacities others 43 47 48 37 39 53 50 46 40 45 43 Ability to present to an audience 45 48 41 45 35 52 49 45 39 42 42 Willingness to question ideas 36 47 51 51 25 52 43 45 39 42 42 Ability to write/speak in foreign lang. 46 45 36 43 33 42 32 40 28 27 32 Knowledge of other fields/disciplines 23 30 26 29 19 32 31 28 18 23 22
Grey= top 3 per country Although there are some differences across countries with regard to required competences, the pattern is far from random. Out of 19 competences in total, 9 figure in the top 3 in at least one country, and only 6 figure in the top 3 in more than one country. The top 3 required competences in the NCMS are the ability to use computers and the internet, the ability to use time efficiently and the ability to work productively with others. However, these do not form the top 3 in any single country. The ability to use computers and the internet, for instance, is the most required competence in Lithuania and the Czech Republic but it is not among the top 3 required competences in any other country. Efficient time use scores high in Poland, Hungary and Turkey, but is not among the top 3 in Estonia, Lithuania, the Czech Republic and Slovenia. The ability to work productively with others forms part of the top 3 required competences in most countries, although not in the Czech Republic or Hungary. Despite these differences, it can be said that all three of these competences rank quite highly in most countries. For the other REFLEX countries the pattern is similar. Although the ability to use computers and the internet is not among the top 3, it still ranks high in the other REFLEX countries. Furthermore, the top 3 does contain the ability to use time efficiently, the ability to make your meaning clear to others and the ability to work productively with others. The ability to perform
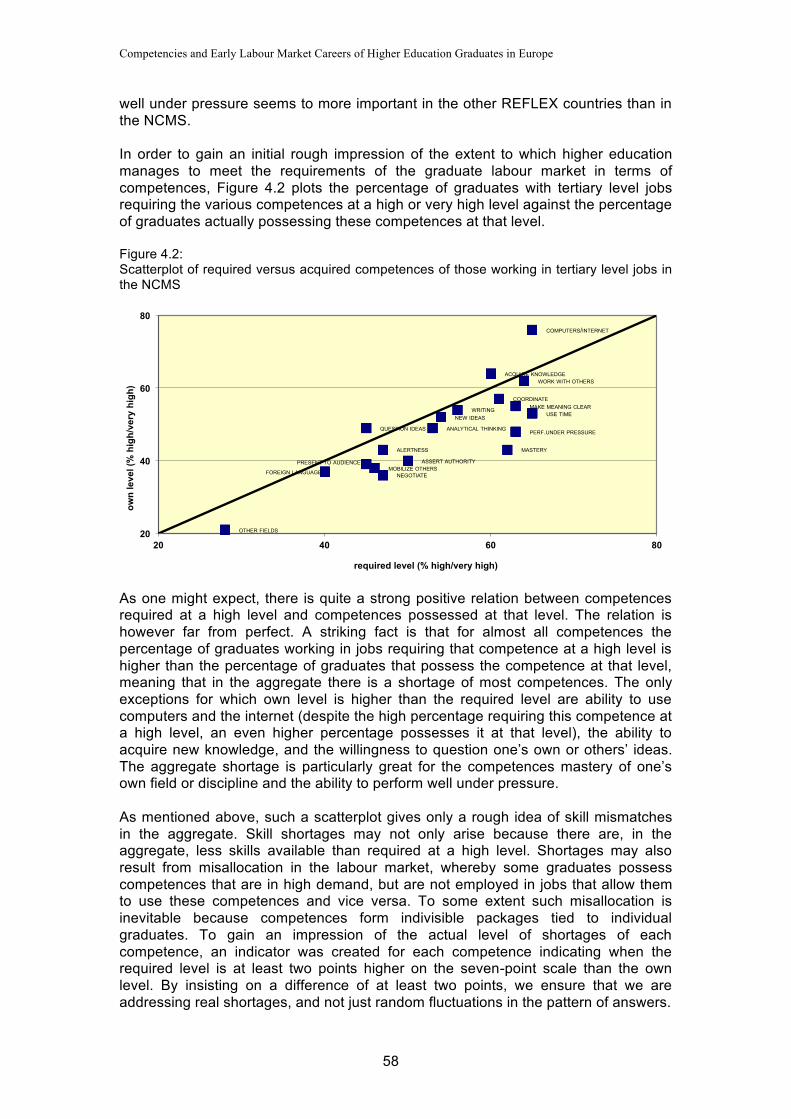
Competencies and Early Labour Market Careers of Higher Education Graduates in Europe
58
well under pressure seems to more important in the other REFLEX countries than in the NCMS. In order to gain an initial rough impression of the extent to which higher education manages to meet the requirements of the graduate labour market in terms of competences, Figure 4.2 plots the percentage of graduates with tertiary level jobs requiring the various competences at a high or very high level against the percentage of graduates actually possessing these competences at that level. Figure 4.2: Scatterplot of required versus acquired competences of those working in tertiary level jobs in the NCMS
As one might expect, there is quite a strong positive relation between competences required at a high level and competences possessed at that level. The relation is however far from perfect. A striking fact is that for almost all competences the percentage of graduates working in jobs requiring that competence at a high level is higher than the percentage of graduates that possess the competence at that level, meaning that in the aggregate there is a shortage of most competences. The only exceptions for which own level is higher than the required level are ability to use computers and the internet (despite the high percentage requiring this competence at a high level, an even higher percentage possesses it at that level), the ability to acquire new knowledge, and the willingness to question one’s own or others’ ideas. The aggregate shortage is particularly great for the competences mastery of one’s own field or discipline and the ability to perform well under pressure. As mentioned above, such a scatterplot gives only a rough idea of skill mismatches in the aggregate. Skill shortages may not only arise because there are, in the aggregate, less skills available than required at a high level. Shortages may also result from misallocation in the labour market, whereby some graduates possess competences that are in high demand, but are not employed in jobs that allow them to use these competences and vice versa. To some extent such misallocation is inevitable because competences form indivisible packages tied to individual graduates. To gain an impression of the actual level of shortages of each competence, an indicator was created for each competence indicating when the required level is at least two points higher on the seven-point scale than the own level. By insisting on a difference of at least two points, we ensure that we are addressing real shortages, and not just random fluctuations in the pattern of answers.
COMPUTERS/INTERNET
USE TIME
WORK WITH OTHERS
MAKE MEANING CLEAR
PERF.UNDER PRESSURE
MASTERY
COORDINATE
ACQUIRE KNOWLEDGE
WRITING NEW IDEAS
ANALYTICAL THINKING
ASSERT AUTHORITY
ALERTNESS
NEGOTIATE MOBILIZE OTHERS
PRESENT TO AUDIENCE
QUESTION IDEAS
FOREIGN LANGUAGE
OTHER FIELDS 20
40
60
80
20 40 60 80
own
leve
l (%
hig
h/ve
ry h
igh)
required level (% high/very high)
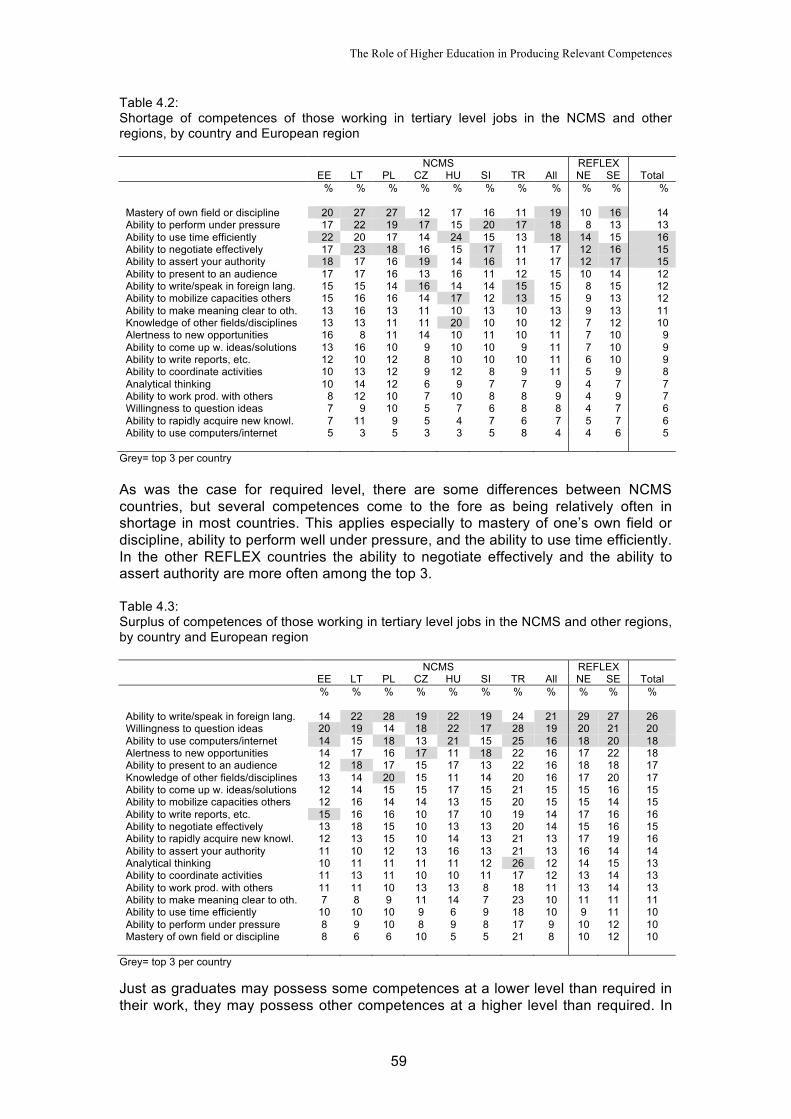
The Role of Higher Education in Producing Relevant Competences
59
Table 4.2: Shortage of competences of those working in tertiary level jobs in the NCMS and other regions, by country and European region
NCMS REFLEX EE LT PL CZ HU SI TR All NE SE Total % % % % % % % % % % % Mastery of own field or discipline 20 27 27 12 17 16 11 19 10 16 14 Ability to perform under pressure 17 22 19 17 15 20 17 18 8 13 13 Ability to use time efficiently 22 20 17 14 24 15 13 18 14 15 16 Ability to negotiate effectively 17 23 18 16 15 17 11 17 12 16 15 Ability to assert your authority 18 17 16 19 14 16 11 17 12 17 15 Ability to present to an audience 17 17 16 13 16 11 12 15 10 14 12 Ability to write/speak in foreign lang. 15 15 14 16 14 14 15 15 8 15 12 Ability to mobilize capacities others 15 16 16 14 17 12 13 15 9 13 12 Ability to make meaning clear to oth. 13 16 13 11 10 13 10 13 9 13 11 Knowledge of other fields/disciplines 13 13 11 11 20 10 10 12 7 12 10 Alertness to new opportunities 16 8 11 14 10 11 10 11 7 10 9 Ability to come up w. ideas/solutions 13 16 10 9 10 10 9 11 7 10 9 Ability to write reports, etc. 12 10 12 8 10 10 10 11 6 10 9 Ability to coordinate activities 10 13 12 9 12 8 9 11 5 9 8 Analytical thinking 10 14 12 6 9 7 7 9 4 7 7 Ability to work prod. with others 8 12 10 7 10 8 8 9 4 9 7 Willingness to question ideas 7 9 10 5 7 6 8 8 4 7 6 Ability to rapidly acquire new knowl. 7 11 9 5 4 7 6 7 5 7 6 Ability to use computers/internet 5 3 5 3 3 5 8 4 4 6 5
Grey= top 3 per country As was the case for required level, there are some differences between NCMS countries, but several competences come to the fore as being relatively often in shortage in most countries. This applies especially to mastery of one’s own field or discipline, ability to perform well under pressure, and the ability to use time efficiently. In the other REFLEX countries the ability to negotiate effectively and the ability to assert authority are more often among the top 3. Table 4.3: Surplus of competences of those working in tertiary level jobs in the NCMS and other regions, by country and European region
NCMS REFLEX EE LT PL CZ HU SI TR All NE SE Total % % % % % % % % % % % Ability to write/speak in foreign lang. 14 22 28 19 22 19 24 21 29 27 26 Willingness to question ideas 20 19 14 18 22 17 28 19 20 21 20 Ability to use computers/internet 14 15 18 13 21 15 25 16 18 20 18 Alertness to new opportunities 14 17 16 17 11 18 22 16 17 22 18 Ability to present to an audience 12 18 17 15 17 13 22 16 18 18 17 Knowledge of other fields/disciplines 13 14 20 15 11 14 20 16 17 20 17 Ability to come up w. ideas/solutions 12 14 15 15 17 15 21 15 15 16 15 Ability to mobilize capacities others 12 16 14 14 13 15 20 15 15 14 15 Ability to write reports, etc. 15 16 16 10 17 10 19 14 17 16 16 Ability to negotiate effectively 13 18 15 10 13 13 20 14 15 16 15 Ability to rapidly acquire new knowl. 12 13 15 10 14 13 21 13 17 19 16 Ability to assert your authority 11 10 12 13 16 13 21 13 16 14 14 Analytical thinking 10 11 11 11 11 12 26 12 14 15 13 Ability to coordinate activities 11 13 11 10 10 11 17 12 13 14 13 Ability to work prod. with others 11 11 10 13 13 8 18 11 13 14 13 Ability to make meaning clear to oth. 7 8 9 11 14 7 23 10 11 11 11 Ability to use time efficiently 10 10 10 9 6 9 18 10 9 11 10 Ability to perform under pressure 8 9 10 8 9 8 17 9 10 12 10 Mastery of own field or discipline 8 6 6 10 5 5 21 8 10 12 10
Grey= top 3 per country Just as graduates may possess some competences at a lower level than required in their work, they may possess other competences at a higher level than required. In

Competencies and Early Labour Market Careers of Higher Education Graduates in Europe
60
other words, they may have a surplus of certain competences. Table 4.3 shows the percentage of graduates for each competence for which the own level is at least two points higher than the required level. The competences most often in surplus in both the NCMS and the other REFLEX countries are the ability to write and speak in a foreign language, the willingness to question one’s own or others’ ideas and the ability to use computers and the internet. Although there is a clear negative relation between surpluses and shortages, it is clear that they are not simply each other’s mirror image. For example, foreign language skills are the main surplus in the NCMS, but figure quite highly as shortages as well. In the case of this competence, in the aggregate the supply matches demand quite well (see Figure 4.2), but graduates with good language skills quite often end up in jobs where they cannot put them to use. Figure 4.3 plots shortages against surpluses for the NCMS as a whole. Figure 4.3: Scatterplot of shortage versus surplus of competences among those working in tertiary level jobs in the NCMS
As mentioned, foreign language skills possessed by graduates are often poorly matched to jobs requiring these skills. A similar story applies, albeit to a lesser extent, to the ability to present products, ideas or reports to an audience, the ability to negotiate effectively, the ability to assert one’s authority and the ability to mobilize the capacities of others. On the other hand, some competences are rather well matched in the graduate labour market, showing relatively low levels of both shortages and surpluses. This applies to the ability to work productively with others, the ability to acquire new knowledge, and analytical thinking. Graduates with these competences often seem to find jobs in which they can put them to productive use.
4.3 Strong and weak points of study programme When asked for three strong points of their study programme, graduates from all countries/regions very consistently mentioned analytical thinking, mastery of one’s own field or discipline and the ability to rapidly acquire new knowledge (see Table 4.4). Interestingly, none of these were mentioned in the top three of competences for which they had a surplus. One might also think that competences that are rarely in
MASTERY
PERF. UNDER PRESSURE USE TIME
NEGOTIATE
ASSERT AUTHORITY
PRESENT TO AUDIENCE
FOREIGN LANGUAGE
MOBILIZE OTHERS
MAKE MEANING CLEAR
OTHER FIELDS ALERTNESS
NEW IDEAS WRITING
COORDINATE ANALYTICAL THINKING
WORK WITH OTHERS
QUESTION IDEAS
ACQUIRE KNOWLEDGE
COMPUTERS/INTERNET
5
10
15
20
25
0 5 10 15 20
surp
lus
(%)
shortage (%)
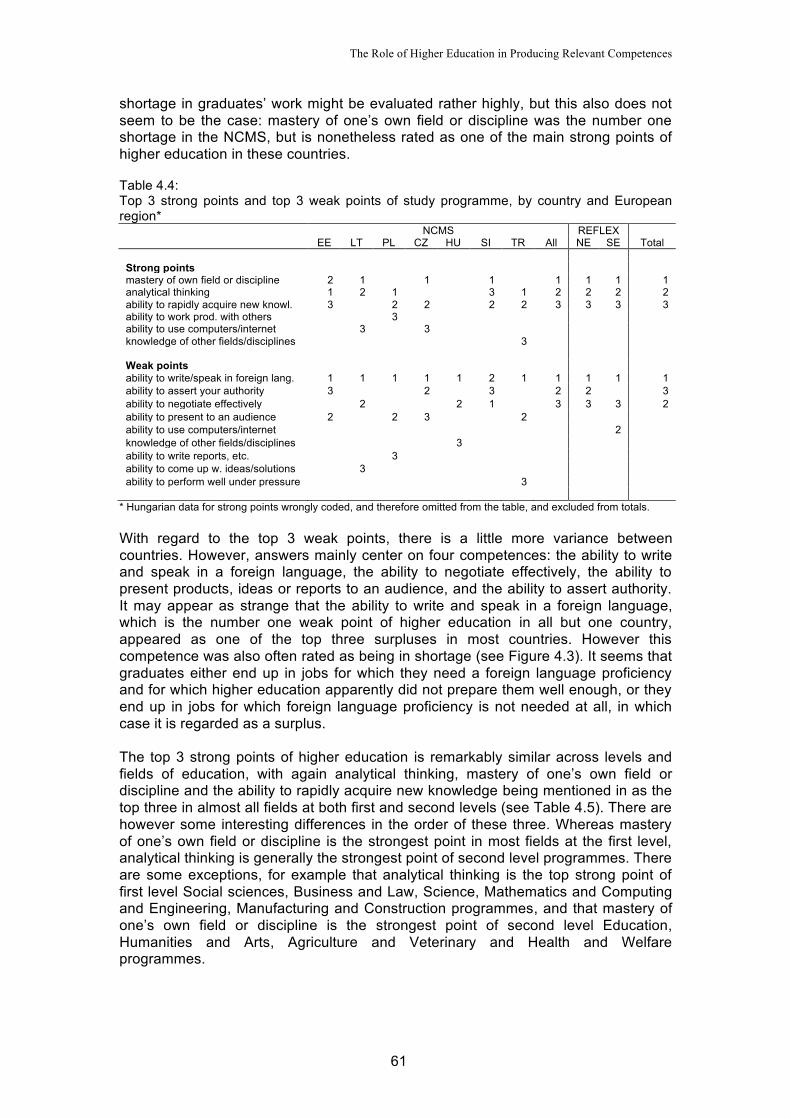
The Role of Higher Education in Producing Relevant Competences
61
shortage in graduates’ work might be evaluated rather highly, but this also does not seem to be the case: mastery of one’s own field or discipline was the number one shortage in the NCMS, but is nonetheless rated as one of the main strong points of higher education in these countries. Table 4.4: Top 3 strong points and top 3 weak points of study programme, by country and European region*
NCMS REFLEX Total EE LT PL CZ HU SI TR All NE SE
Strong points mastery of own field or discipline 2 1 1 1 1 1 1 1 analytical thinking 1 2 1 3 1 2 2 2 2 ability to rapidly acquire new knowl. 3 2 2 2 2 3 3 3 3 ability to work prod. with others 3 ability to use computers/internet 3 3 knowledge of other fields/disciplines 3 Weak points ability to write/speak in foreign lang. 1 1 1 1 1 2 1 1 1 1 1 ability to assert your authority 3 2 3 2 2 3 ability to negotiate effectively 2 2 1 3 3 3 2 ability to present to an audience 2 2 3 2 ability to use computers/internet 2 knowledge of other fields/disciplines 3 ability to write reports, etc. 3 ability to come up w. ideas/solutions 3 ability to perform well under pressure 3
* Hungarian data for strong points wrongly coded, and therefore omitted from the table, and excluded from totals. With regard to the top 3 weak points, there is a little more variance between countries. However, answers mainly center on four competences: the ability to write and speak in a foreign language, the ability to negotiate effectively, the ability to present products, ideas or reports to an audience, and the ability to assert authority. It may appear as strange that the ability to write and speak in a foreign language, which is the number one weak point of higher education in all but one country, appeared as one of the top three surpluses in most countries. However this competence was also often rated as being in shortage (see Figure 4.3). It seems that graduates either end up in jobs for which they need a foreign language proficiency and for which higher education apparently did not prepare them well enough, or they end up in jobs for which foreign language proficiency is not needed at all, in which case it is regarded as a surplus. The top 3 strong points of higher education is remarkably similar across levels and fields of education, with again analytical thinking, mastery of one’s own field or discipline and the ability to rapidly acquire new knowledge being mentioned in as the top three in almost all fields at both first and second levels (see Table 4.5). There are however some interesting differences in the order of these three. Whereas mastery of one’s own field or discipline is the strongest point in most fields at the first level, analytical thinking is generally the strongest point of second level programmes. There are some exceptions, for example that analytical thinking is the top strong point of first level Social sciences, Business and Law, Science, Mathematics and Computing and Engineering, Manufacturing and Construction programmes, and that mastery of one’s own field or discipline is the strongest point of second level Education, Humanities and Arts, Agriculture and Veterinary and Health and Welfare programmes.
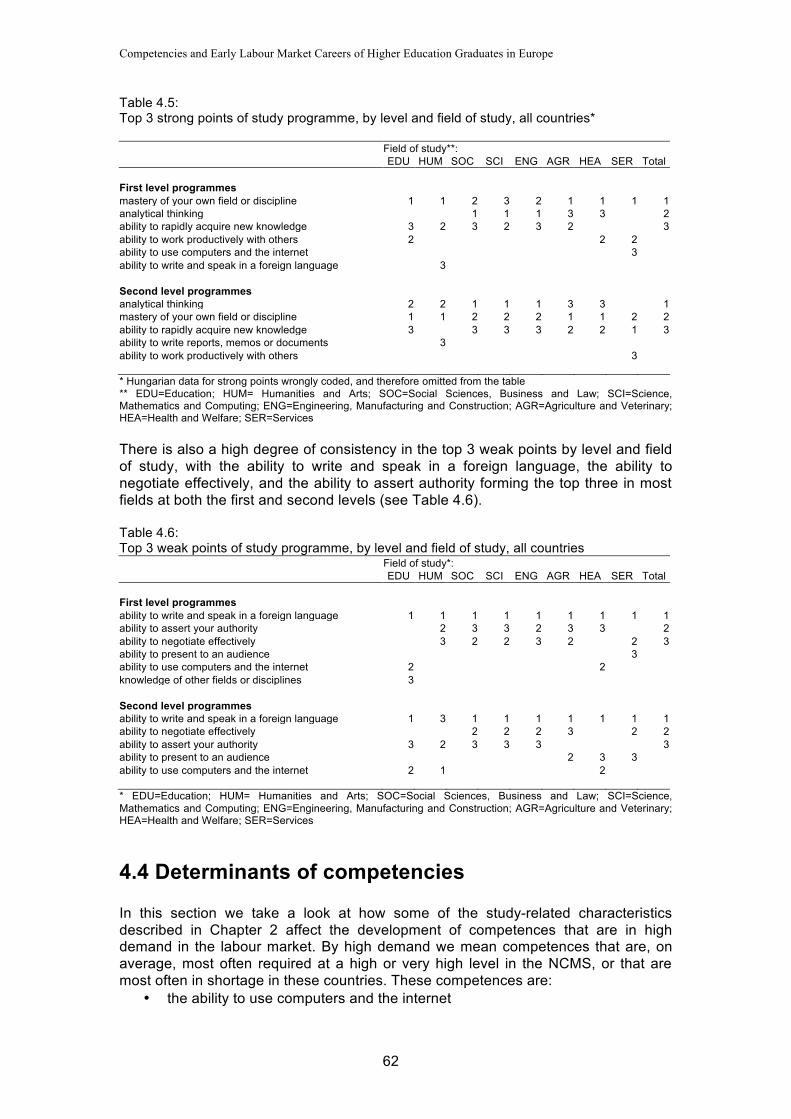
Competencies and Early Labour Market Careers of Higher Education Graduates in Europe
62
Table 4.5: Top 3 strong points of study programme, by level and field of study, all countries* Field of study**: EDU HUM SOC SCI ENG AGR HEA SER Total First level programmes mastery of your own field or discipline 1 1 2 3 2 1 1 1 1 analytical thinking 1 1 1 3 3 2 ability to rapidly acquire new knowledge 3 2 3 2 3 2 3 ability to work productively with others 2 2 2 ability to use computers and the internet 3 ability to write and speak in a foreign language 3 Second level programmes analytical thinking 2 2 1 1 1 3 3 1 mastery of your own field or discipline 1 1 2 2 2 1 1 2 2 ability to rapidly acquire new knowledge 3 3 3 3 2 2 1 3 ability to write reports, memos or documents 3 ability to work productively with others 3 * Hungarian data for strong points wrongly coded, and therefore omitted from the table ** EDU=Education; HUM= Humanities and Arts; SOC=Social Sciences, Business and Law; SCI=Science, Mathematics and Computing; ENG=Engineering, Manufacturing and Construction; AGR=Agriculture and Veterinary; HEA=Health and Welfare; SER=Services There is also a high degree of consistency in the top 3 weak points by level and field of study, with the ability to write and speak in a foreign language, the ability to negotiate effectively, and the ability to assert authority forming the top three in most fields at both the first and second levels (see Table 4.6). Table 4.6: Top 3 weak points of study programme, by level and field of study, all countries Field of study*: EDU HUM SOC SCI ENG AGR HEA SER Total First level programmes ability to write and speak in a foreign language 1 1 1 1 1 1 1 1 1 ability to assert your authority 2 3 3 2 3 3 2 ability to negotiate effectively 3 2 2 3 2 2 3 ability to present to an audience 3 ability to use computers and the internet 2 2 knowledge of other fields or disciplines 3 Second level programmes ability to write and speak in a foreign language 1 3 1 1 1 1 1 1 1 ability to negotiate effectively 2 2 2 3 2 2 ability to assert your authority 3 2 3 3 3 3 ability to present to an audience 2 3 3 ability to use computers and the internet 2 1 2 * EDU=Education; HUM= Humanities and Arts; SOC=Social Sciences, Business and Law; SCI=Science, Mathematics and Computing; ENG=Engineering, Manufacturing and Construction; AGR=Agriculture and Veterinary; HEA=Health and Welfare; SER=Services
4.4 Determinants of competencies In this section we take a look at how some of the study-related characteristics described in Chapter 2 affect the development of competences that are in high demand in the labour market. By high demand we mean competences that are, on average, most often required at a high or very high level in the NCMS, or that are most often in shortage in these countries. These competences are:
the ability to use computers and the internet

The Role of Higher Education in Producing Relevant Competences
63
the ability to use time efficiently the ability to work productively with others mastery of one’s own field or discipline and the ability to perform well under pressure.
It is worth noting at the outset that, with the exception of mastery of one’s own field or discipline and perhaps in some cases the ability to use computers and the internet, these are competences that probably don’t form part of the core curriculum of most study programmes. One might legitimately ask whether higher education should be expected to teach such (self-) management skills as these. In terms of curriculum, such skepticism is probably justified. However, in recent years there has been an increasing emphasis in many countries not only on the content of higher education, but also on the form in which this content is being taught. This has resulted in the introduction of more innovative, student-centred modes of teaching and learning to supplement or in some cases largely replace the more classical forms. Such innovative methods are applied not just because they are an efficient way for students to cover the curriculum, but also in the expectation that they help prepare students to be able to take control of their own development, and to guide the development of their co-workers, in the world of work. It is interesting to see whether such innovative methods bear fruit, both in terms of producing graduates with real expertise in their own field, and of more generic (self-) management competences. In order to see which study-related factors have the strongest effect on developing the 5 selected competences, a series of regression analyses were run. Analyses were run for each of the 5 competences in each of the regions distinguished in the descriptive tables and figures in this chapter and elsewhere in this book. This results in a large number of analyses, each containing a large number of predictors. We will only present the coefficients that are statistically significant at 10% level or less. Although all of the predictors were included in each regression analysis, so that the estimated coefficients represent effects after controlling for all other variables, we will present the results of different categories of variables separately, loosely following the structure of the descriptive tables and figures in this chapter. We start by looking at the effects of programme characteristics. Table 4.7 shows the significant results of selected programme characteristics on the five competences per region. In general, the programme characteristic most strongly related to the selected competences is the extent to which that programme was regarded as demanding. This had significant effects on all competences, and in most cases these were significant in all three regions. There were however differences, both between regions and competences. The strongest effects are on the mastery of one’s own field or discipline, and the ability to use time efficiently were also clearly influenced by demandingness of the study programme in all three regions. The effects on the ability to work with others and the ability to use computers and the internet were less strong, the later showing no significant effect in the NCMS. In general, it is striking that the effects of demandingness were less strong in the NCMS than in northern and southern Europe.
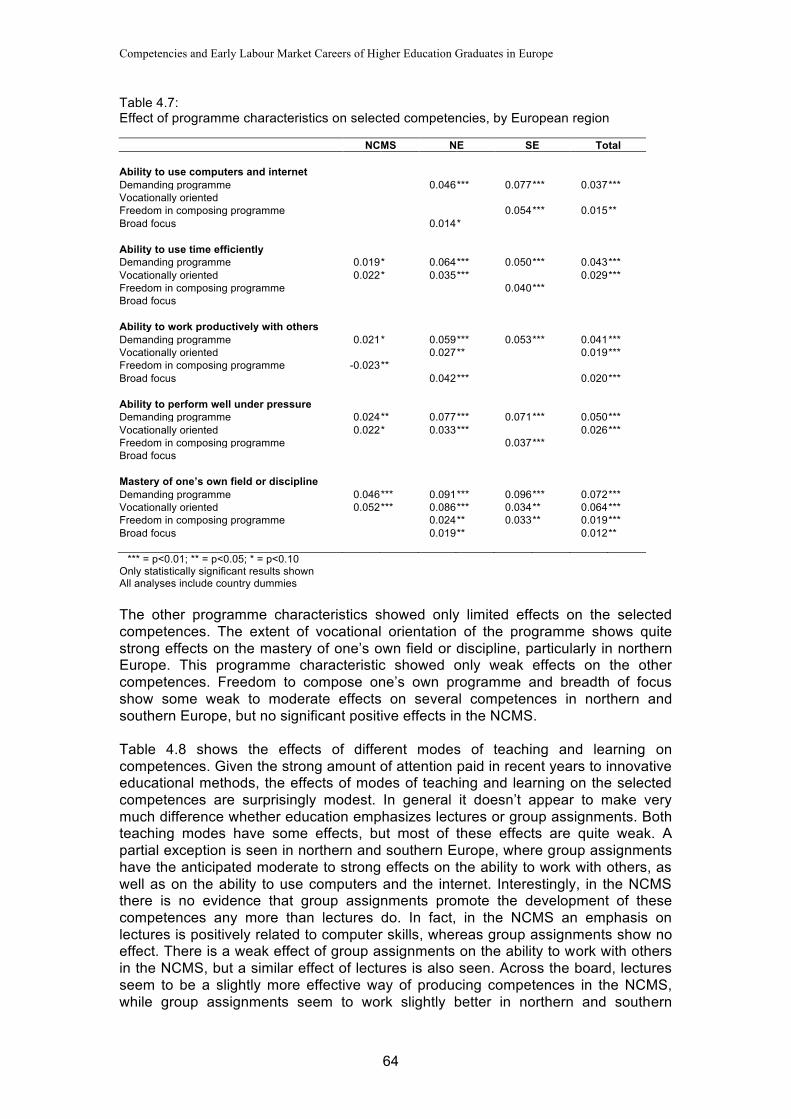
Competencies and Early Labour Market Careers of Higher Education Graduates in Europe
64
Table 4.7: Effect of programme characteristics on selected competencies, by European region NCMS NE SE Total Ability to use computers and internet Demanding programme 0.046 *** 0.077 *** 0.037 *** Vocationally oriented Freedom in composing programme 0.054 *** 0.015 ** Broad focus 0.014 * Ability to use time efficiently Demanding programme 0.019 * 0.064 *** 0.050 *** 0.043 *** Vocationally oriented 0.022 * 0.035 *** 0.029 *** Freedom in composing programme 0.040 *** Broad focus Ability to work productively with others Demanding programme 0.021 * 0.059 *** 0.053 *** 0.041 *** Vocationally oriented 0.027 ** 0.019 *** Freedom in composing programme -0.023 ** Broad focus 0.042 *** 0.020 *** Ability to perform well under pressure Demanding programme 0.024 ** 0.077 *** 0.071 *** 0.050 *** Vocationally oriented 0.022 * 0.033 *** 0.026 *** Freedom in composing programme 0.037 *** Broad focus Mastery of one’s own field or discipline Demanding programme 0.046 *** 0.091 *** 0.096 *** 0.072 *** Vocationally oriented 0.052 *** 0.086 *** 0.034 ** 0.064 *** Freedom in composing programme 0.024 ** 0.033 ** 0.019 *** Broad focus 0.019 ** 0.012 ** *** = p<0.01; ** = p<0.05; * = p<0.10 Only statistically significant results shown All analyses include country dummies The other programme characteristics showed only limited effects on the selected competences. The extent of vocational orientation of the programme shows quite strong effects on the mastery of one’s own field or discipline, particularly in northern Europe. This programme characteristic showed only weak effects on the other competences. Freedom to compose one’s own programme and breadth of focus show some weak to moderate effects on several competences in northern and southern Europe, but no significant positive effects in the NCMS. Table 4.8 shows the effects of different modes of teaching and learning on competences. Given the strong amount of attention paid in recent years to innovative educational methods, the effects of modes of teaching and learning on the selected competences are surprisingly modest. In general it doesn’t appear to make very much difference whether education emphasizes lectures or group assignments. Both teaching modes have some effects, but most of these effects are quite weak. A partial exception is seen in northern and southern Europe, where group assignments have the anticipated moderate to strong effects on the ability to work with others, as well as on the ability to use computers and the internet. Interestingly, in the NCMS there is no evidence that group assignments promote the development of these competences any more than lectures do. In fact, in the NCMS an emphasis on lectures is positively related to computer skills, whereas group assignments show no effect. There is a weak effect of group assignments on the ability to work with others in the NCMS, but a similar effect of lectures is also seen. Across the board, lectures seem to be a slightly more effective way of producing competences in the NCMS, while group assignments seem to work slightly better in northern and southern
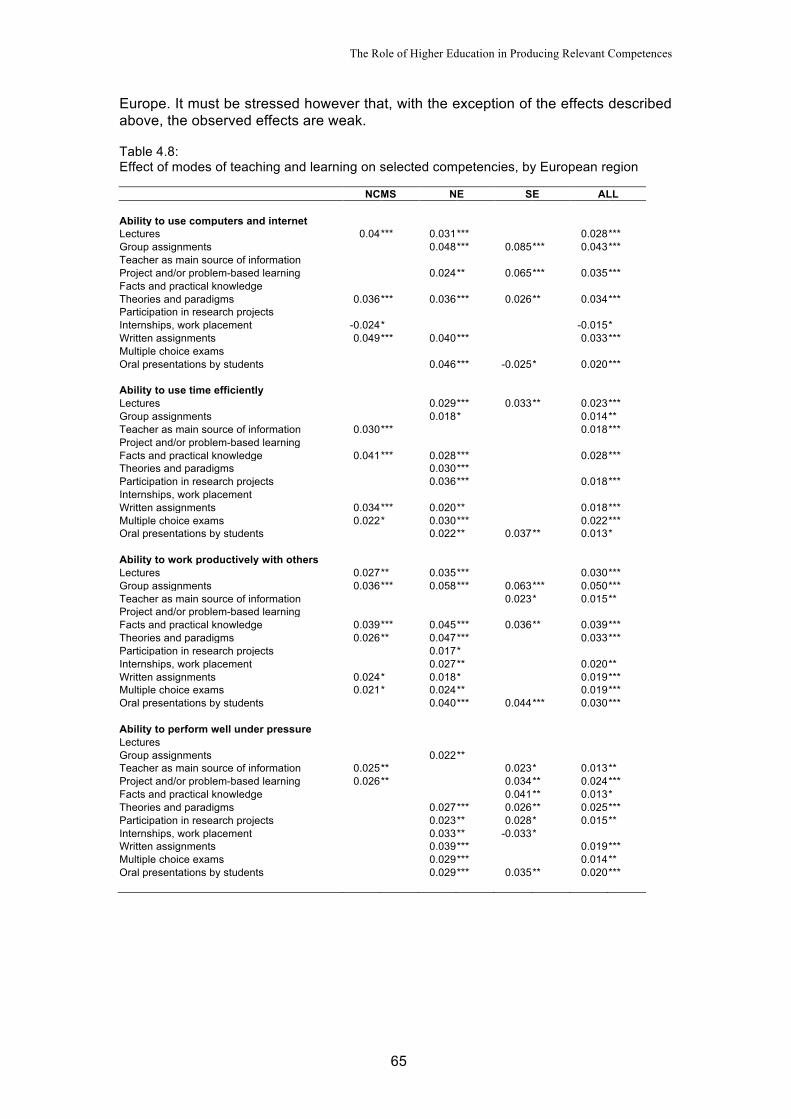
The Role of Higher Education in Producing Relevant Competences
65
Europe. It must be stressed however that, with the exception of the effects described above, the observed effects are weak. Table 4.8: Effect of modes of teaching and learning on selected competencies, by European region NCMS NE SE ALL Ability to use computers and internet Lectures 0.04 *** 0.031 *** 0.028 *** Group assignments 0.048 *** 0.085 *** 0.043 *** Teacher as main source of information Project and/or problem-based learning 0.024 ** 0.065 *** 0.035 *** Facts and practical knowledge Theories and paradigms 0.036 *** 0.036 *** 0.026 ** 0.034 *** Participation in research projects Internships, work placement -0.024 * -0.015 * Written assignments 0.049 *** 0.040 *** 0.033 *** Multiple choice exams Oral presentations by students 0.046 *** -0.025 * 0.020 *** Ability to use time efficiently Lectures 0.029 *** 0.033 ** 0.023 *** Group assignments 0.018 * 0.014 ** Teacher as main source of information 0.030 *** 0.018 *** Project and/or problem-based learning Facts and practical knowledge 0.041 *** 0.028 *** 0.028 *** Theories and paradigms 0.030 *** Participation in research projects 0.036 *** 0.018 *** Internships, work placement Written assignments 0.034 *** 0.020 ** 0.018 *** Multiple choice exams 0.022 * 0.030 *** 0.022 *** Oral presentations by students 0.022 ** 0.037 ** 0.013 * Ability to work productively with others Lectures 0.027 ** 0.035 *** 0.030 *** Group assignments 0.036 *** 0.058 *** 0.063 *** 0.050 *** Teacher as main source of information 0.023 * 0.015 ** Project and/or problem-based learning Facts and practical knowledge 0.039 *** 0.045 *** 0.036 ** 0.039 *** Theories and paradigms 0.026 ** 0.047 *** 0.033 *** Participation in research projects 0.017 * Internships, work placement 0.027 ** 0.020 ** Written assignments 0.024 * 0.018 * 0.019 *** Multiple choice exams 0.021 * 0.024 ** 0.019 *** Oral presentations by students 0.040 *** 0.044 *** 0.030 *** Ability to perform well under pressure Lectures Group assignments 0.022 ** Teacher as main source of information 0.025 ** 0.023 * 0.013 ** Project and/or problem-based learning 0.026 ** 0.034 ** 0.024 *** Facts and practical knowledge 0.041 ** 0.013 * Theories and paradigms 0.027 *** 0.026 ** 0.025 *** Participation in research projects 0.023 ** 0.028 * 0.015 ** Internships, work placement 0.033 ** -0.033 * Written assignments 0.039 *** 0.019 *** Multiple choice exams 0.029 *** 0.014 ** Oral presentations by students 0.029 *** 0.035 ** 0.020 ***
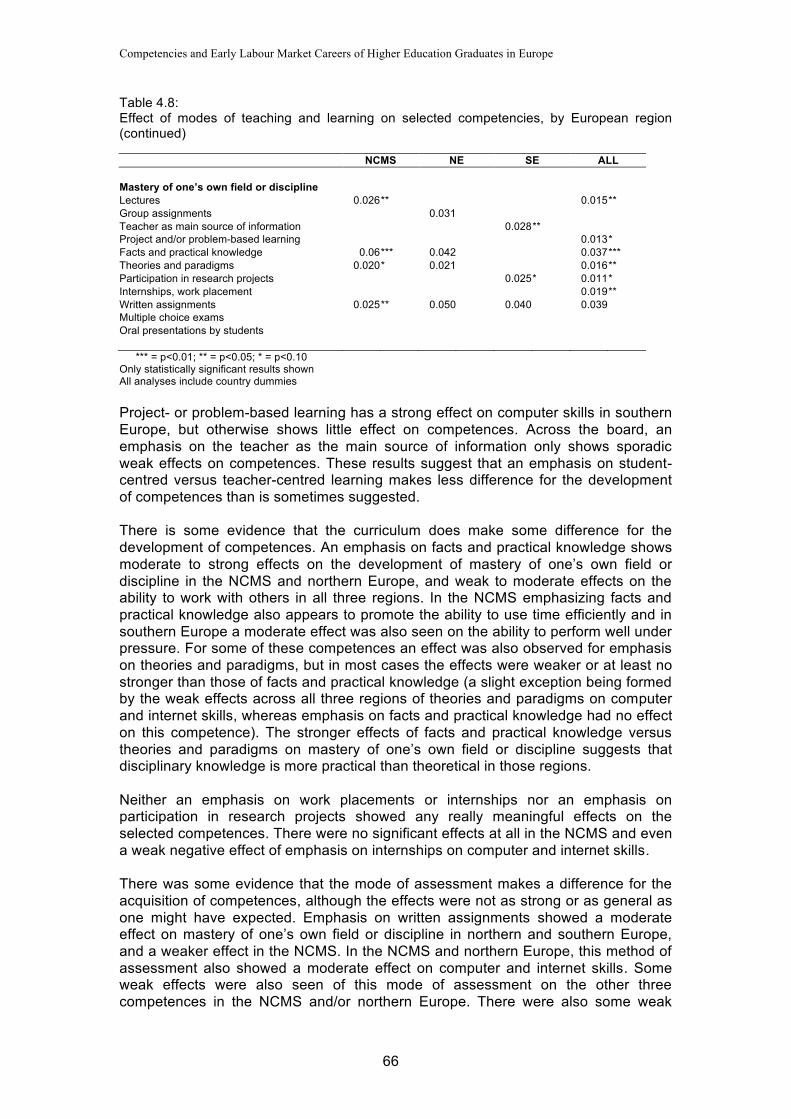
Competencies and Early Labour Market Careers of Higher Education Graduates in Europe
66
Table 4.8: Effect of modes of teaching and learning on selected competencies, by European region (continued) NCMS NE SE ALL Mastery of one’s own field or discipline Lectures 0.026 ** 0.015 ** Group assignments 0.031 Teacher as main source of information 0.028 ** Project and/or problem-based learning 0.013 * Facts and practical knowledge 0.06 *** 0.042 0.037 *** Theories and paradigms 0.020 * 0.021 0.016 ** Participation in research projects 0.025 * 0.011 * Internships, work placement 0.019 ** Written assignments 0.025 ** 0.050 0.040 0.039 Multiple choice exams Oral presentations by students *** = p<0.01; ** = p<0.05; * = p<0.10 Only statistically significant results shown All analyses include country dummies Project- or problem-based learning has a strong effect on computer skills in southern Europe, but otherwise shows little effect on competences. Across the board, an emphasis on the teacher as the main source of information only shows sporadic weak effects on competences. These results suggest that an emphasis on student-centred versus teacher-centred learning makes less difference for the development of competences than is sometimes suggested. There is some evidence that the curriculum does make some difference for the development of competences. An emphasis on facts and practical knowledge shows moderate to strong effects on the development of mastery of one’s own field or discipline in the NCMS and northern Europe, and weak to moderate effects on the ability to work with others in all three regions. In the NCMS emphasizing facts and practical knowledge also appears to promote the ability to use time efficiently and in southern Europe a moderate effect was also seen on the ability to perform well under pressure. For some of these competences an effect was also observed for emphasis on theories and paradigms, but in most cases the effects were weaker or at least no stronger than those of facts and practical knowledge (a slight exception being formed by the weak effects across all three regions of theories and paradigms on computer and internet skills, whereas emphasis on facts and practical knowledge had no effect on this competence). The stronger effects of facts and practical knowledge versus theories and paradigms on mastery of one’s own field or discipline suggests that disciplinary knowledge is more practical than theoretical in those regions. Neither an emphasis on work placements or internships nor an emphasis on participation in research projects showed any really meaningful effects on the selected competences. There were no significant effects at all in the NCMS and even a weak negative effect of emphasis on internships on computer and internet skills. There was some evidence that the mode of assessment makes a difference for the acquisition of competences, although the effects were not as strong or as general as one might have expected. Emphasis on written assignments showed a moderate effect on mastery of one’s own field or discipline in northern and southern Europe, and a weaker effect in the NCMS. In the NCMS and northern Europe, this method of assessment also showed a moderate effect on computer and internet skills. Some weak effects were also seen of this mode of assessment on the other three competences in the NCMS and/or northern Europe. There were also some weak

The Role of Higher Education in Producing Relevant Competences
67
effects of multiple choice exams on some competences in some regions, but these effects were generally weaker than or at most comparable to those for written assignments. Emphasis on oral presentations by students showed no significant effects in the NCMS. There was a moderate effect on the ability to work productively with others in northern and southern Europe as well as a moderate effect on computer and internet skills in northern Europe. Strangely, a weak negative effect on computer and internet skills was observed in southern Europe. Only weak effects were seen on several other competences. There was no effect at all on the mastery of one’s own field or discipline. Table 4.9 shows the effects of study behavior and performance on competences. Table 4.9: Effect of study behaviour and performance on selected competencies, by European region NCMS NE SE Total Ability to use computers and internet Average graduation grade Study hours per week -0.025 ** Did more work than required for exams -0.021 ** 0.036 ** Strived for the highest possible mark 0.026 *** 0.019 *** Ability to use time efficiently
Average graduation grade 0.031 *** 0.023 *** 0.027
*** Study hours per week 0.039 *** Did more work than required for exams 0.039 *** 0.020 *** Strived for the highest possible mark 0.065 *** 0.035 *** 0.062 *** 0.051 *** Ability to work productively with others Average graduation grade 0.021 * Study hours per week 0.049 *** Did more work than required for exams -0.023 **
Strived for the highest possible mark 0.030 ** 0.025 ** 0.023
*** Ability to perform well under pressure
Average graduation grade 0.028
*** 0.011
** Study hours per week 0.036 ** 0.014 ** Did more work than required for exams -0.057 *** -0.022 *** Strived for the highest possible mark 0.029 ** 0.031 *** 0.025 *** Mastery of one’s own field or discipline
Average graduation grade 0.030 *** 0.068 *** -0.029 ** 0.035
*** Study hours per week Did more work than required for exams 0.053 *** 0.025 *** Strived for the highest possible mark 0.057 *** 0.077 *** 0.059 *** 0.068 *** *** = p<0.01; ** = p<0.05; * = p<0.10 Only statistically significant results shown All analyses include country dummies Probably the most striking result in Table 4.9 is the relatively weak relation between grades and competences, particularly the mastery of one’s own field or discipline. Only in northern Europe is there a really strong relation between grades and mastery. In the NCMS grades also seem to be related to mastery, but only weakly so. In southern Europe there is even a weak negative relation between grades and

Competencies and Early Labour Market Careers of Higher Education Graduates in Europe
68
mastery. Grades are also significantly related to several other competences in the NCMS and/or northern Europe, but effects are weak. After controlling for grades, there are some residual effects of study behavior and study motivation. Study hours show few effects. These are only positively related to competences in southern Europe, with the strongest effect on the ability to work productively with others. The willingness to do more work than required to pass exams showed a moderate effect on mastery of one’s own field or discipline in the NCMS, but otherwise appears to be hardly related to higher competence levels. In some cases such intrinsic motivation is even related to lower levels of some competences. Striving for the highest possible marks is quite strongly related to mastery of your own field in all three regions, and also to the ability to use time efficiently (especially in the NCMS and southern Europe). Table 4.10 shows the effects of experiences during higher education on competences. Table 4.10: Effect of experiences during higher education on selected competencies, by European region NCMS NE SE Total Ability to use computers and internet Study-related work experience 0.021 ** 0.014 ** Non study-related work experience 0.042 *** 0.014 ** Internship during study programme -0.029 ** -0.022 * 0.046 *** Position in voluntary organizations 0.018 * 0.019 ** 0.067 *** 0.028 *** Spent time abroad for study or work Ability to use time efficiently Study-related work experience 0.041 *** 0.021 *** Non study-related work experience Internship during study programme Position in voluntary organizations -0.023 ** -0.012 * Spent time abroad for study or work Ability to work productively with others Study-related work experience 0.023 ** 0.024 *** 0.057 *** 0.032 *** Non study-related work experience 0.041 *** 0.021 *** Internship during study programme -0.029 *** Position in voluntary organizations 0.025 *** 0.045 *** 0.027 *** Spent time abroad for study or work Ability to perform well under pressure Study-related work experience 0.054 *** 0.044 *** 0.031 ** 0.046 *** Non study-related work experience 0.037 0.029 ** 0.022 *** Internship during study programme -0.027 ** 0.030 * Position in voluntary organizations 0.032 *** 0.035 *** 0.025 *** Spent time abroad for study or work 0.035 *** 0.034 *** 0.024 * 0.033 *** Mastery of one’s own field or discipline Study-related work experience 0.073 *** 0.043 *** 0.053 *** 0.055 *** Non study-related work experience -0.024 ** -0.029 ** -0.020 *** Internship during study programme -0.049 *** -0.025 *** Position in voluntary organizations 0.018 ** 0.011 * Spent time abroad for study or work *** = p<0.01; ** = p<0.05; * = p<0.10 Only statistically significant results shown All analyses include country dummies Perhaps unsurprisingly, the most effective form of experience in terms of acquiring competences is study-related work experience, which shows rather strong effects on most of the competences in at least some regions. This applies most of all for

The Role of Higher Education in Producing Relevant Competences
69
mastery of one’s own field or discipline, and least for ability to use computers or the internet. Interestingly, the latter competence is more strongly influenced by non study-related work experience in the NCMS. Surprisingly, internships show few positive effects, and are in fact negatively related to mastery of one’s own field or discipline in the NCMS. Holding a position in a voluntary organization during higher education is related to all five selected competences in at least one or the three regions, but the only effects of any real importance are on the ability to work with others and especially the ability to use computers or the internet in southern Europe. No effects were seen for time spent abroad during higher education. Table 4.11 shows the effects of personal and background characteristics on competences. Table 4.11: Effect of personal and background characteristics on selected competencies, by European region NCMS NE SE Total Ability to use computers and internet Age 0.133 ** -0.113 * Age-squared -0.237 *** -0.103 *** Female -0.104 *** -0.050 *** -0.063 *** Born abroad Father higher education -0.020 ** Ability to use time efficiently Age -0.118 * Age-squared 0.109 * Female 0.125 *** 0.145 *** 0.088 *** 0.128 *** Born abroad Father higher education -0.018 * -0.011 * Ability to work productively with others Age 0.174 *** 0.135 *** Age-squared -0.185 *** -0.130 *** Female 0.084 *** 0.099 *** 0.059 *** 0.086 *** Born abroad Father higher education Ability to perform well under pressure Age 0.224 *** -0.193 *** 0.069 * Age-squared -0.226 *** 0.166 *** -0.065 * Female -0.047 *** -0.042 *** -0.026 *** Born abroad Father higher education Mastery of one’s own field or discipline Age 0.176 *** 0.168 *** Age-squared -0.123 ** -0.109 *** Female -0.020 * -0.054 *** -0.089 *** -0.049 *** Born abroad -0.010 * Father higher education *** = p<0.01; ** = p<0.05; * = p<0.10 Only statistically significant results shown All analyses include country dummies The most striking outcome of the analyses in terms of effects of personal characteristics is the consistent effect of gender on several competences. In every region, female graduates show a higher level of ability to use time efficiently and ability to work productively with others than men. Conversely, women report lower levels of ability to work under pressure and mastery of one’s own field or discipline in all three regions. Women also appear to have lower levels of computer and internet skills than men in northern and southern Europe, although not in the NCMS.

Competencies and Early Labour Market Careers of Higher Education Graduates in Europe
70
Older graduates appear to have quite distinctive competence profiles compared to younger graduates, but the effects are quite mixed in terms of region. In northern Europe, older graduates appear to be much more competent than their younger peers in all respects except the ability to use time efficiently. By contrast, in southern Europe older graduates appear to be much less competent in terms of the ability to use computers and the internet, the ability to use time efficiently and the ability to perform well under pressure. In the NCMS competences do not appear to be related to age at all. Having a father who completed higher education and being born abroad do not seen to have any serious effect on competences in any of the regions, the only significant effects being weak negative effects of father’s higher education on computer and internet skills in northern Europe and on the ability to use time efficiently in the NCMS. Table 4.12 shows the effect of programme level on competences. Table 4.12: Effect of programme level (first versus second level) on selected competencies, by European region NCMS NE SE Total Ability to use computers and internet 0.050 *** 0.023 *** Ability to use time efficiently Ability to work productively with others 0.045 *** 0.022 *** Ability to perform well under pressure 0.023 * -0.034 ** Mastery of one’s own field or discipline -0.023 ** -0.027 * -0.016* ** *** = p<0.01; ** = p<0.05; * = p<0.10 Only statistically significant results shown All analyses include country dummies Surprisingly, there is relatively little difference between first and second level graduates in terms of competences. The differences such as they are also point in different directions. The only competences on which second level graduates have a slight advantage are the mastery of one’s own field or discipline, for which a weak effect is seen in northern and southern Europe (but not the NCMS), and the ability to perform well under pressure, for which a weak effect is seen in the NCMS and southern Europe (but not in northern Europe). However, first level graduates appear to perform moderately better in terms of computer and internet skills in northern Europe, and in terms of ability to work with others in the NCMS. Table 4.13 shows the effect of field of study on competences. In general, the reference field, Social sciences, business and law, performs better than the other fields in terms of the production of competences. In most cases the graduates of this field perform as well or better than those in other fields in terms of most of the competences in all three regions. There are some exceptions. Science and Engineering graduates clearly have the best computer and internet skills in all three regions, and in northern Europe Education and Humanities graduates have the highest level of mastery of their own field. In southern Europe humanities graduates also perform well on this latter competence. Somewhat surprisingly, health and welfare graduates do not show significantly higher levels of mastery than the reference group in the NCMS and northern Europe, and only a slightly higher level in southern Europe. The lowest levels of competences in general is seen for the field of Agriculture and veterinary.

The Role of Higher Education in Producing Relevant Competences
71
Table 4.13: Effect of field of study on selected competencies, by European region NCMS NE SE Total Ability to use computers and internet Education -0.093 *** -0.117 *** -0.131 *** -0.111 *** Humanities and Arts -0.076 *** -0.077 *** -0.034 ** -0.071 *** Social sciences, Business and Law ref ref ref ref Science, Mathematics and Computing 0.025 ** 0.067 *** 0.050 *** 0.052 *** Engineering, Manufacturing and Construction 0.040 *** 0.036 *** 0.052 *** 0.043 *** Agriculture and Veterinary -0.043 *** -0.041 *** -0.029 *** Health and Welfare -0.079 *** -0.157 *** -0.130 *** -0.130 *** Services -0.020 ** -0.039 *** -0.014 ** Ability to use time efficiently Education -0.012 * Humanities and Arts -0.019 * -0.013 * Social sciences, Business and Law ref ref ref ref Science, Mathematics and Computing -0.030 *** -0.053 *** -0.035 *** Engineering, Manufacturing and Construction -0.055 *** -0.021 *** Agriculture and Veterinary -0.031 ** Health and Welfare Services -0.015 * Ability to work productively with others Education 0.026 *** Humanities and Arts Social sciences, Business and Law ref ref ref ref Science, Mathematics and Computing Engineering, Manufacturing and Construction Agriculture and Veterinary -0.017 ** Health and Welfare Services 0.025 ** 0.013 ** Ability to perform well under pressure Education -0.088 *** -0.042 *** -0.073 *** -0.069 *** Humanities and Arts -0.039 *** -0.030 ** -0.027 *** Social sciences, Business and Law ref ref ref ref Science, Mathematics and Computing -0.058 *** -0.073 *** -0.054 *** -0.062 *** Engineering, Manufacturing and Construction -0.028 ** -0.048 *** -0.033 *** Agriculture and Veterinary -0.041 *** -0.025 *** -0.023 * -0.029 *** Health and Welfare -0.045 *** -0.040 *** -0.036 *** Services -0.027 ** -0.013 ** Mastery of one’s own field or discipline Education 0.049 *** 0.026 *** Humanities and Arts 0.068 *** 0.062 *** 0.045 *** Social sciences, Business and Law ref ref ref ref Science, Mathematics and Computing 0.023 ** 0.014 ** Engineering, Manufacturing and Construction -0.025 ** -0.043 *** -0.032 ** -0.035 *** Agriculture and Veterinary -0.031 *** -0.029 ** -0.022 *** Health and Welfare 0.036 ** Services *** = p<0.01; ** = p<0.05; * = p<0.10 Only statistically significant results shown All analyses include country dummies
4.5 Conclusions In the world of work, graduates are expected to be competent in a broad range of areas, comprising both field-specific and generic skills, as well as technical abilities in the areas of computer and internet usage. The competences that are most often required at a high to very high level in tertiary-level jobs held by graduates in the NCMS are the ability to use computers and the internet, the ability to use time
Competencies and Early Labour Market Careers of Higher Education Graduates in Europe
72
efficiently, and the ability to work productively with others. Most graduates are highly competent in these areas, particularly with respect to the ability to use computers and the internet, but there are some shortages, of these and other competences, notably the mastery of one’s own field or discipline and the ability to perform well under pressure. There are also competences for which a relatively large number of graduates report a surplus (a significantly higher own level than is required in their work). The main surpluses are found for the competences ability to write and speak in a foreign language, the willingness to question one’s own and others’ ideas, and the ability to use computers and the internet (the latter despite being the competence most often required at a high level: most graduates possess sufficient skills in this area for their work). Foreign language skills are notable in being relatively often in shortage as well as in surplus, which seems to indicate that – at least with respect to this competence – there is a misallocation of graduates across jobs. What can higher education institutes and students do to foster the competences that are most in demand, that is that are most often required at a high or very high level and/or are most often in shortage. Not surprisingly, demanding HE programmes appear to foster all kinds of competences, particularly mastery of one’s own field or discipline. The reported level of mastery of one’s own field or discipline was also quite strongly related to the degree to which study programmes are vocationally oriented and to the acquisition of relevant work experience during higher education, and depends more on practical than on theoretical modes of teaching and learning. The latter finding suggests that disciplinary knowledge is more practical than academic in most countries. Given the strong amount of attention paid in recent years to innovative educational methods, the effects of modes of teaching and learning on the selected competences are surprisingly modest. In general it doesn’t appear to make very much difference whether education emphasizes lectures or group assignments, and emphasis on student-centred versus teacher-centred learning makes less difference for the development of competences than is sometimes suggested. Across the board, lectures seem to be a slightly more effective way of producing competences in the NCMS, while group assignments seem to work slightly better in northern and southern Europe. There was some evidence that the mode of assessment makes a difference for the acquisition of competences, although the effects were not as strong or as general as one might have expected. Emphasis on written assignments showed weak to moderate effects on all competences, but not in all three regions, and although there were also some weak effects of multiple choice exams on some competences in some regions, these effects were generally weaker than or at most comparable to those for written assignments. The relation between grades and competences is surprisingly weak, particularly in the case of mastery of one’s own field or discipline. Interestingly, the willingness to strive for the highest possible marks showed a stronger effect on mastery in all three regions than grades themselves, and also showed rather strong effects on time management skills.

The World of Work and the Demand for Competences
73
Chapter 5 The World of Work and the Demand for Competences Samo Pavlin and Ivan Svetlik The main purpose of this chapter is to learn in what way the characteristics of jobs and organizations affect the demand for graduates’ competences. Following the example of previous chapters, this is done in a country comparative fashion in several steps. First, we explore the distribution of graduates by occupational groups and economic sectors. Second, we look at the characteristics of work organizations. We learn about their competitive, qualitative and innovative characteristics. Third, we look at the characteristics of jobs and explore differences between their managerial and professional character in particular. Fourth, we study in what way the characteristics of jobs and work organizations impact graduates’ requirements in the world of work. Fifth, we look at the knowledge management processes graduates are involved in at work, and explore in what way these processes affect competence requirements and the utilization of knowledge and skills.
5.1 Economic sectors and occupational groups Before looking in more detail at the characteristics of the organizations graduates work in and the nature of the jobs they perform, in this section we start by describing the distribution of graduates over economic sectors and occupations. Figure 5.1 shows the how graduates are distributed across broad economic sectors. The great majority of graduates in all countries work in service organizations, usually in the public sector. The only countries in which a quarter or more of graduates work in industry or agriculture are the Turkey and the Czech Republic. Private services are most strongly represented Italy, but the Baltic States Lithuania and Estonia as well as Austria, the Netherlands and Switzerland also show high proportions in this sector. With the exception of Italy, where almost half the graduates work in private services, the largest proportion of graduates in all countries work in public services and administration, although the share working in this sector is also relatively small in Turkey and Lithuania.
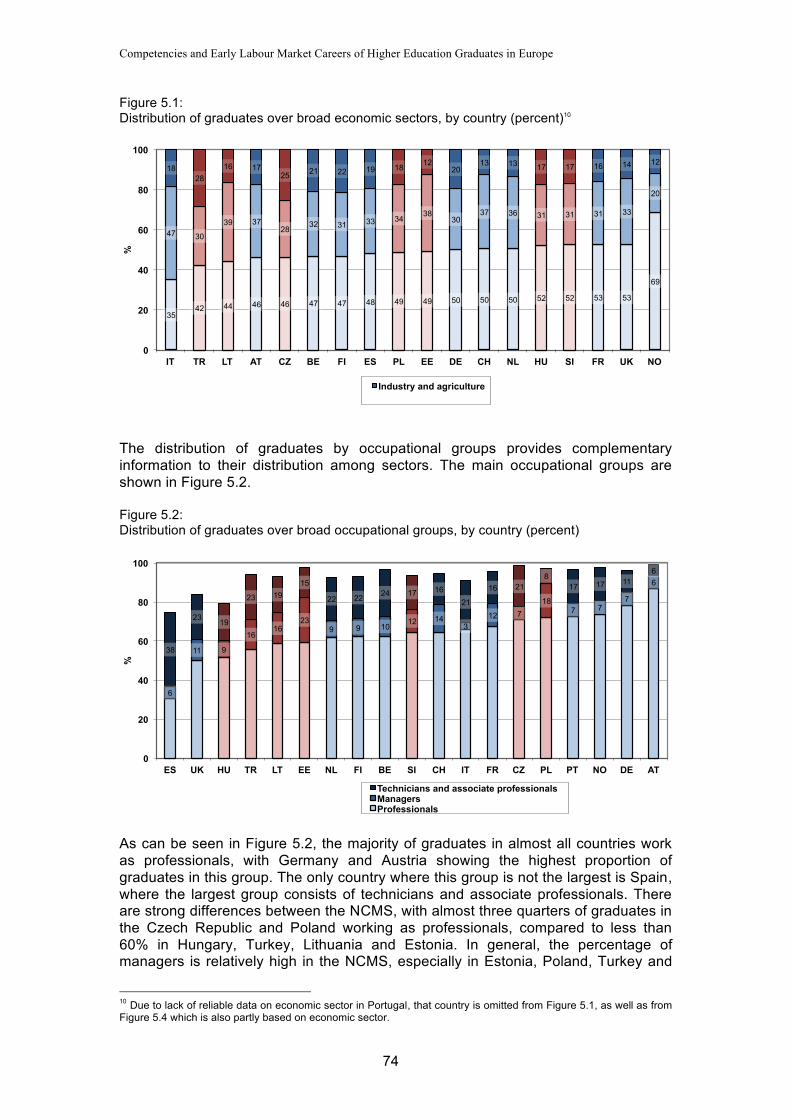
Competencies and Early Labour Market Careers of Higher Education Graduates in Europe
74
Figure 5.1: Distribution of graduates over broad economic sectors, by country (percent)10
The distribution of graduates by occupational groups provides complementary information to their distribution among sectors. The main occupational groups are shown in Figure 5.2. Figure 5.2: Distribution of graduates over broad occupational groups, by country (percent)
As can be seen in Figure 5.2, the majority of graduates in almost all countries work as professionals, with Germany and Austria showing the highest proportion of graduates in this group. The only country where this group is not the largest is Spain, where the largest group consists of technicians and associate professionals. There are strong differences between the NCMS, with almost three quarters of graduates in the Czech Republic and Poland working as professionals, compared to less than 60% in Hungary, Turkey, Lithuania and Estonia. In general, the percentage of managers is relatively high in the NCMS, especially in Estonia, Poland, Turkey and
10 Due to lack of reliable data on economic sector in Portugal, that country is omitted from Figure 5.1, as well as from Figure 5.4 which is also partly based on economic sector.
35 42 44 46 46 47 47 48 49 49 50 50 50 52 52 53 53
69
47 30
39 37 28 32 31 33 34
38 30
37 36 31 31 31 33
20
18 28
16 17 25 21 22 19 18 12
20 13 13 17 17 16 14 12
0
20
40
60
80
100
IT TR LT AT CZ BE FI ES PL EE DE CH NL HU SI FR UK NO
%
Industry and agriculture
6
11 9
16 16
23 9 9 10
12 14 3
12 7 18
7 7 7
6
38
23 19
23 19 15
22 22 24 17 16 21
16 21 8
17 17 11 6
0
20
40
60
80
100
ES UK HU TR LT EE NL FI BE SI CH IT FR CZ PL PT NO DE AT
%
Technicians and associate professionals Managers Professionals

The World of Work and the Demand for Competences
75
Lithuania. The third category identified in Figure 5.2, technicians and associate professionals, lies on the margins of what could be regarded as the occupational domain of higher education graduates. There are strong differences between countries in the percentage of graduates who fall into this category, ranging from almost four in ten Spanish graduates to less than 10% of Polish and Austrian graduates. With the exception of Spain, the UK and Hungary, the vast majority of graduates in all countries work in one of these three broad categories. The remaining occupations consist of occupations that would normally be regarded as non-tertiary jobs, comprising both white-collar and blue-collar occupations at intermediate and lower levels. As Figure 5.3 makes clear, the broad occupational group of professionals consists of very different kind of occupations. Figure 5.3: Specification of professional occupations, by country (percent)
The proportion of graduates working as physical, mathematical and engineering science professionals varies from less than a tenth in Lithuania, Hungary and Spain to almost a quarter of all graduates in Germany. In general, a much smaller percentage of graduates work as life science and health professionals, varying from less than 3% in Hungary and Poland to around one in seven graduates in France and Norway. The proportion of teaching professionals is quite substantial, but varies strongly between countries, with a quarter or more of Hungarian and Turkish graduates falling into this category, compared to less than 10% in Spain and Switzerland. Finally a large group of graduates falls into the category ‘other professionals’, consisting among other things of professionals in the area of business, public administration, law, social sciences and the arts. This category is particularly large in Austria and Poland, where it accounts for around four in every ten working graduates, while only around one in twelve Spanish graduates falls into this group. At this point we draw our attention again to managers and professionals – the main target groups of higher education institutions. In Figure 5.4 we look at the ratio between them, drawing thereby a distinction between graduates working in the three broad economic sectors identified in Figure 5.1 as well as between countries. This provides an indication of the degree of professionalization of graduate work in different sectors and countries.
9 11 8 9 8 11 11 22
10 19 14 19 15 21
13 11 11 24
15 9 5
2 4 4 4 8
5
10
12
6 10 15 9
3 7 17
7 12 5
18 25 27
12 15
16
15 19
9 18
13 19 15
19 23
23 18 14
8
16 16 16
35 30
27 20 23 25 27 25
18 26 38
31 23 29 45
0
20
40
60
80
100
ES UK HU TR LT EE NL FI BE CH SI IT FR CZ PL PT NO DE AT
%
Other professionals Teaching professionals Life science and health professionals Physical, mathematical and engineering science professionals
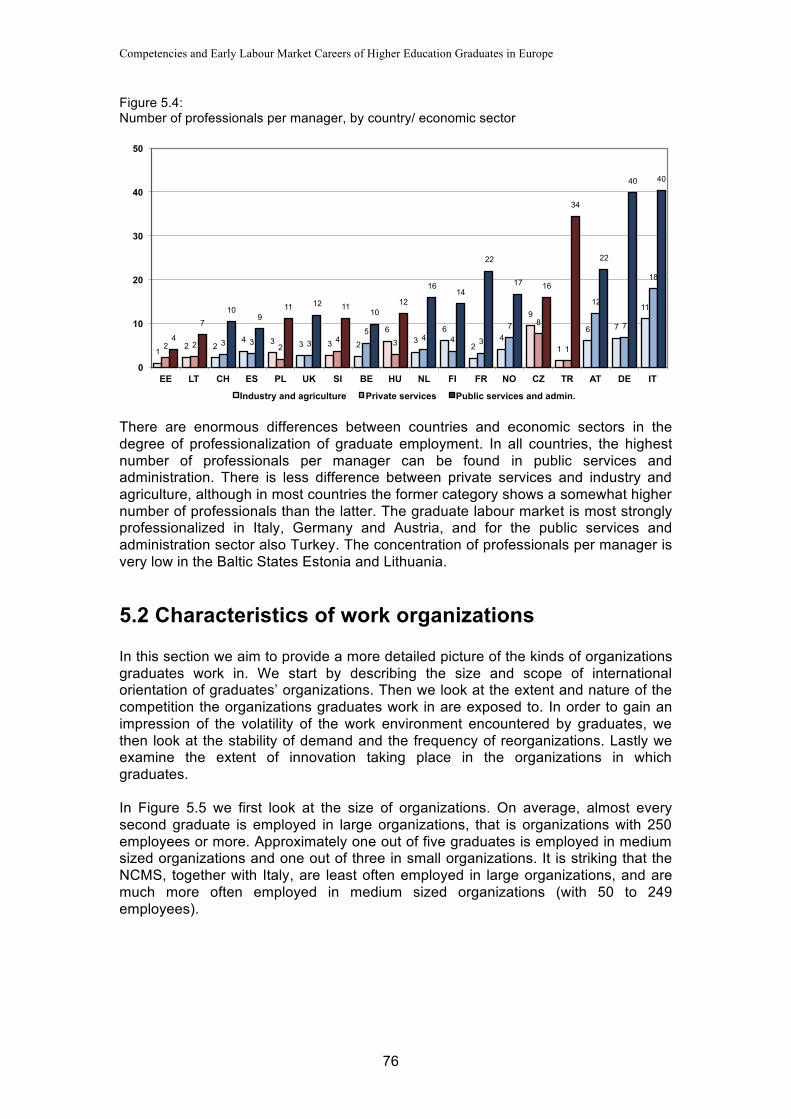
Competencies and Early Labour Market Careers of Higher Education Graduates in Europe
76
Figure 5.4: Number of professionals per manager, by country/ economic sector
There are enormous differences between countries and economic sectors in the degree of professionalization of graduate employment. In all countries, the highest number of professionals per manager can be found in public services and administration. There is less difference between private services and industry and agriculture, although in most countries the former category shows a somewhat higher number of professionals than the latter. The graduate labour market is most strongly professionalized in Italy, Germany and Austria, and for the public services and administration sector also Turkey. The concentration of professionals per manager is very low in the Baltic States Estonia and Lithuania.
5.2 Characteristics of work organizations In this section we aim to provide a more detailed picture of the kinds of organizations graduates work in. We start by describing the size and scope of international orientation of graduates’ organizations. Then we look at the extent and nature of the competition the organizations graduates work in are exposed to. In order to gain an impression of the volatility of the work environment encountered by graduates, we then look at the stability of demand and the frequency of reorganizations. Lastly we examine the extent of innovation taking place in the organizations in which graduates. In Figure 5.5 we first look at the size of organizations. On average, almost every second graduate is employed in large organizations, that is organizations with 250 employees or more. Approximately one out of five graduates is employed in medium sized organizations and one out of three in small organizations. It is striking that the NCMS, together with Italy, are least often employed in large organizations, and are much more often employed in medium sized organizations (with 50 to 249 employees).
1 2 2
4 3 3 3 2
6 3
6
2 4
9
1
6 7
11
2 2 3 3 2 3 4
5 3 4 4 3
7 8
1
12
7
18
4
7 10
9 11 12 11
10 12
16 14
22
17 16
34
22
40 40
0
10
20
30
40
50
EE LT CH ES PL UK SI BE HU NL FI FR NO CZ TR AT DE IT
Industry and agriculture Private services Public services and admin.
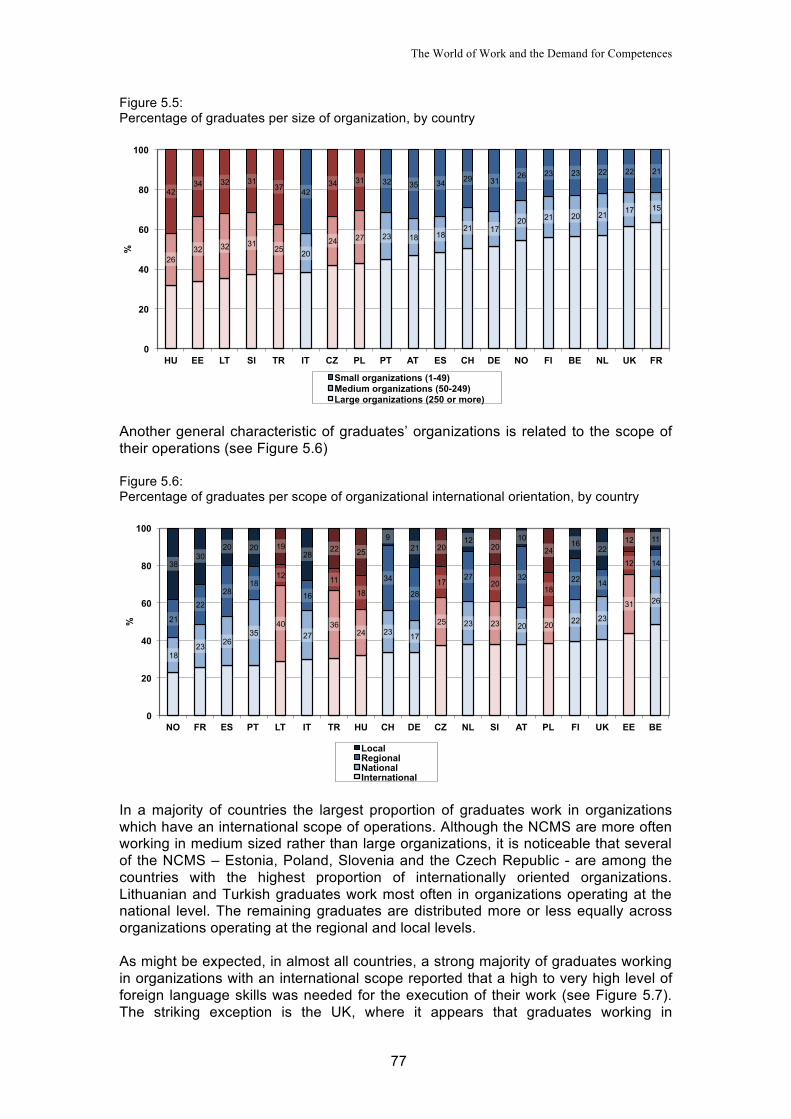
The World of Work and the Demand for Competences
77
Figure 5.5: Percentage of graduates per size of organization, by country
Another general characteristic of graduates’ organizations is related to the scope of their operations (see Figure 5.6) Figure 5.6: Percentage of graduates per scope of organizational international orientation, by country
In a majority of countries the largest proportion of graduates work in organizations which have an international scope of operations. Although the NCMS are more often working in medium sized rather than large organizations, it is noticeable that several of the NCMS – Estonia, Poland, Slovenia and the Czech Republic - are among the countries with the highest proportion of internationally oriented organizations. Lithuanian and Turkish graduates work most often in organizations operating at the national level. The remaining graduates are distributed more or less equally across organizations operating at the regional and local levels. As might be expected, in almost all countries, a strong majority of graduates working in organizations with an international scope reported that a high to very high level of foreign language skills was needed for the execution of their work (see Figure 5.7). The striking exception is the UK, where it appears that graduates working in
26 32 32 31
25 20 24 27 23 18 18
21 17 20 21 20 21 17 15
42 34 32 31
37 42 34 31 32 35 34 29 31
26 23 23 22 22 21
0
20
40
60
80
100
HU EE LT SI TR IT CZ PL PT AT ES CH DE NO FI BE NL UK FR
%
Small organizations (1-49) Medium organizations (50-249) Large organizations (250 or more)
18 23 26
35 40
27 36
24 23 17
25 23 23 20 20 22 23
31 26
21
22
28 18
12
16
11 18
34
28 17
27 20
32 18
22 14
12 14 38 30
20 20 19 28
22 25
9 21 20
12 20
10 24
16 22
12 11
0
20
40
60
80
100
NO FR ES PT LT IT TR HU CH DE CZ NL SI AT PL FI UK EE BE
%
Local Regional National International
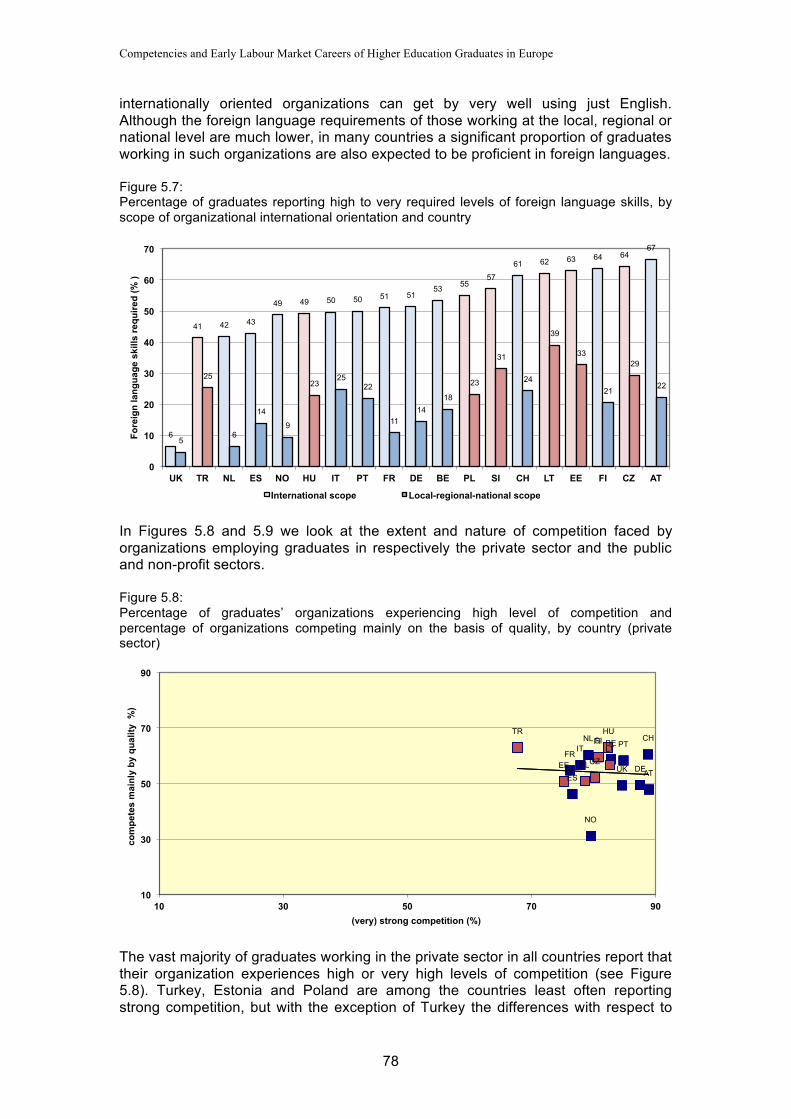
Competencies and Early Labour Market Careers of Higher Education Graduates in Europe
78
internationally oriented organizations can get by very well using just English. Although the foreign language requirements of those working at the local, regional or national level are much lower, in many countries a significant proportion of graduates working in such organizations are also expected to be proficient in foreign languages. Figure 5.7: Percentage of graduates reporting high to very required levels of foreign language skills, by scope of organizational international orientation and country
In Figures 5.8 and 5.9 we look at the extent and nature of competition faced by organizations employing graduates in respectively the private sector and the public and non-profit sectors. Figure 5.8: Percentage of graduates’ organizations experiencing high level of competition and percentage of organizations competing mainly on the basis of quality, by country (private sector)
The vast majority of graduates working in the private sector in all countries report that their organization experiences high or very high levels of competition (see Figure 5.8). Turkey, Estonia and Poland are among the countries least often reporting strong competition, but with the exception of Turkey the differences with respect to
6
41 42 43
49 49 50 50 51 51 53 55
57
61 62 63 64 64 67
5
25
6
14
9
23 25
22
11 14
18
23
31
24
39
33
21
29
22
0
10
20
30
40
50
60
70
UK TR NL ES NO HU IT PT FR DE BE PL SI CH LT EE FI CZ AT
Fore
ign
lang
uage
ski
lls re
quire
d (%
)
International scope Local-regional-national scope
IT
ES
FR
AT DE
NL
UK
FI
NO
CZ
CH PT BE
EE
SI TR
LT
PL
HU
10
30
50
70
90
10 30 50 70 90
com
pete
s m
ainl
y by
qua
lity
%)
(very) strong competition (%)
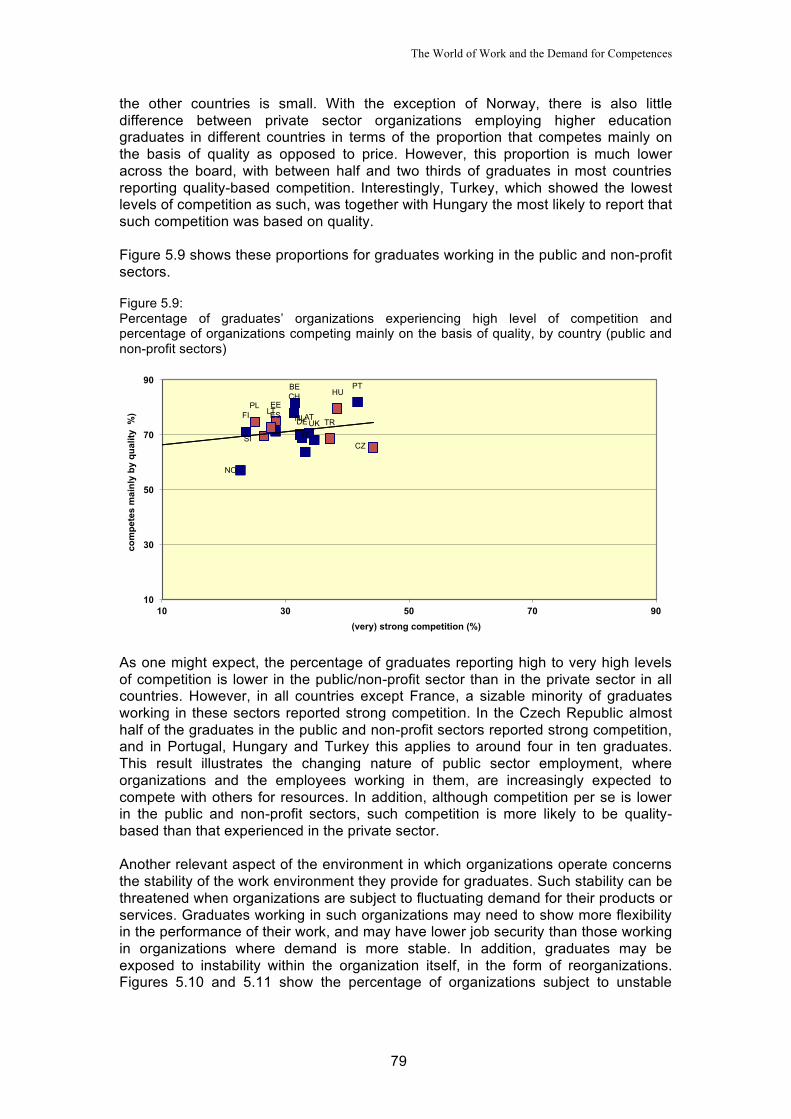
The World of Work and the Demand for Competences
79
the other countries is small. With the exception of Norway, there is also little difference between private sector organizations employing higher education graduates in different countries in terms of the proportion that competes mainly on the basis of quality as opposed to price. However, this proportion is much lower across the board, with between half and two thirds of graduates in most countries reporting quality-based competition. Interestingly, Turkey, which showed the lowest levels of competition as such, was together with Hungary the most likely to report that such competition was based on quality. Figure 5.9 shows these proportions for graduates working in the public and non-profit sectors. Figure 5.9: Percentage of graduates’ organizations experiencing high level of competition and percentage of organizations competing mainly on the basis of quality, by country (public and non-profit sectors)
As one might expect, the percentage of graduates reporting high to very high levels of competition is lower in the public/non-profit sector than in the private sector in all countries. However, in all countries except France, a sizable minority of graduates working in these sectors reported strong competition. In the Czech Republic almost half of the graduates in the public and non-profit sectors reported strong competition, and in Portugal, Hungary and Turkey this applies to around four in ten graduates. This result illustrates the changing nature of public sector employment, where organizations and the employees working in them, are increasingly expected to compete with others for resources. In addition, although competition per se is lower in the public and non-profit sectors, such competition is more likely to be quality-based than that experienced in the private sector. Another relevant aspect of the environment in which organizations operate concerns the stability of the work environment they provide for graduates. Such stability can be threatened when organizations are subject to fluctuating demand for their products or services. Graduates working in such organizations may need to show more flexibility in the performance of their work, and may have lower job security than those working in organizations where demand is more stable. In addition, graduates may be exposed to instability within the organization itself, in the form of reorganizations. Figures 5.10 and 5.11 show the percentage of organizations subject to unstable
IT
ES AT DE NL UK FI
NO
CZ
CH PT BE
EE
SI
TR LT
PL HU
10
30
50
70
90
10 30 50 70 90
com
pete
s m
ainl
y by
qua
lity
%)
(very) strong competition (%)
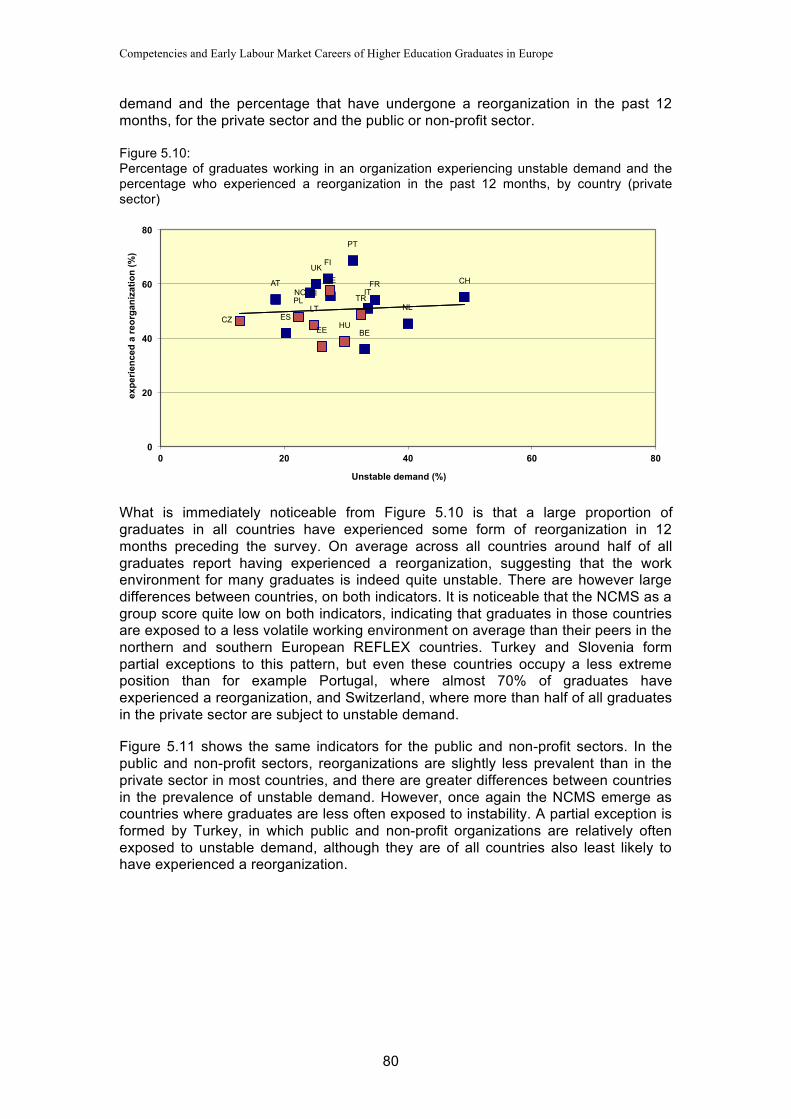
Competencies and Early Labour Market Careers of Higher Education Graduates in Europe
80
demand and the percentage that have undergone a reorganization in the past 12 months, for the private sector and the public or non-profit sector. Figure 5.10: Percentage of graduates working in an organization experiencing unstable demand and the percentage who experienced a reorganization in the past 12 months, by country (private sector)
What is immediately noticeable from Figure 5.10 is that a large proportion of graduates in all countries have experienced some form of reorganization in 12 months preceding the survey. On average across all countries around half of all graduates report having experienced a reorganization, suggesting that the work environment for many graduates is indeed quite unstable. There are however large differences between countries, on both indicators. It is noticeable that the NCMS as a group score quite low on both indicators, indicating that graduates in those countries are exposed to a less volatile working environment on average than their peers in the northern and southern European REFLEX countries. Turkey and Slovenia form partial exceptions to this pattern, but even these countries occupy a less extreme position than for example Portugal, where almost 70% of graduates have experienced a reorganization, and Switzerland, where more than half of all graduates in the private sector are subject to unstable demand. Figure 5.11 shows the same indicators for the public and non-profit sectors. In the public and non-profit sectors, reorganizations are slightly less prevalent than in the private sector in most countries, and there are greater differences between countries in the prevalence of unstable demand. However, once again the NCMS emerge as countries where graduates are less often exposed to instability. A partial exception is formed by Turkey, in which public and non-profit organizations are relatively often exposed to unstable demand, although they are of all countries also least likely to have experienced a reorganization.
IT
ES
FR AT DE
NL
UK FI
NO
CZ
CH
PT
BE EE
SI TR LT
PL
HU
0
20
40
60
80
0 20 40 60 80
expe
rienc
ed a
reor
gani
zatio
n (%
)
Unstable demand (%)
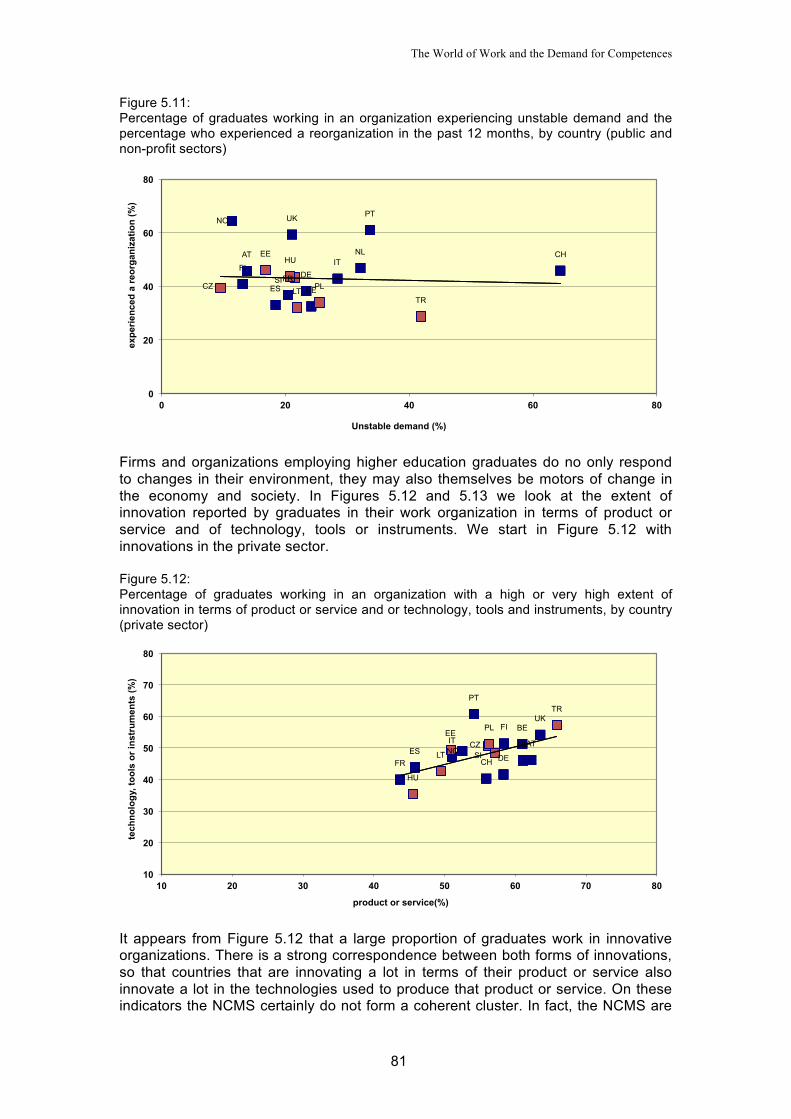
The World of Work and the Demand for Competences
81
Figure 5.11: Percentage of graduates working in an organization experiencing unstable demand and the percentage who experienced a reorganization in the past 12 months, by country (public and non-profit sectors)
Firms and organizations employing higher education graduates do no only respond to changes in their environment, they may also themselves be motors of change in the economy and society. In Figures 5.12 and 5.13 we look at the extent of innovation reported by graduates in their work organization in terms of product or service and of technology, tools or instruments. We start in Figure 5.12 with innovations in the private sector. Figure 5.12: Percentage of graduates working in an organization with a high or very high extent of innovation in terms of product or service and or technology, tools and instruments, by country (private sector)
It appears from Figure 5.12 that a large proportion of graduates work in innovative organizations. There is a strong correspondence between both forms of innovations, so that countries that are innovating a lot in terms of their product or service also innovate a lot in the technologies used to produce that product or service. On these indicators the NCMS certainly do not form a coherent cluster. In fact, the NCMS are
IT
ES FR
AT
DE
NL
UK
FI
NO
CZ
CH
PT
BE
EE
SI
TR LT PL
HU
0
20
40
60
80
0 20 40 60 80
expe
rienc
ed a
reor
gani
zatio
n (%
)
Unstable demand (%)
IT ES
FR
AT
DE
NL
UK FI
NO CZ
CH
PT
BE EE
SI
TR
LT
PL
HU
10
20
30
40
50
60
70
80
10 20 30 40 50 60 70 80
tech
nolo
gy, t
ools
or i
nstr
umen
ts (%
)
product or service(%)
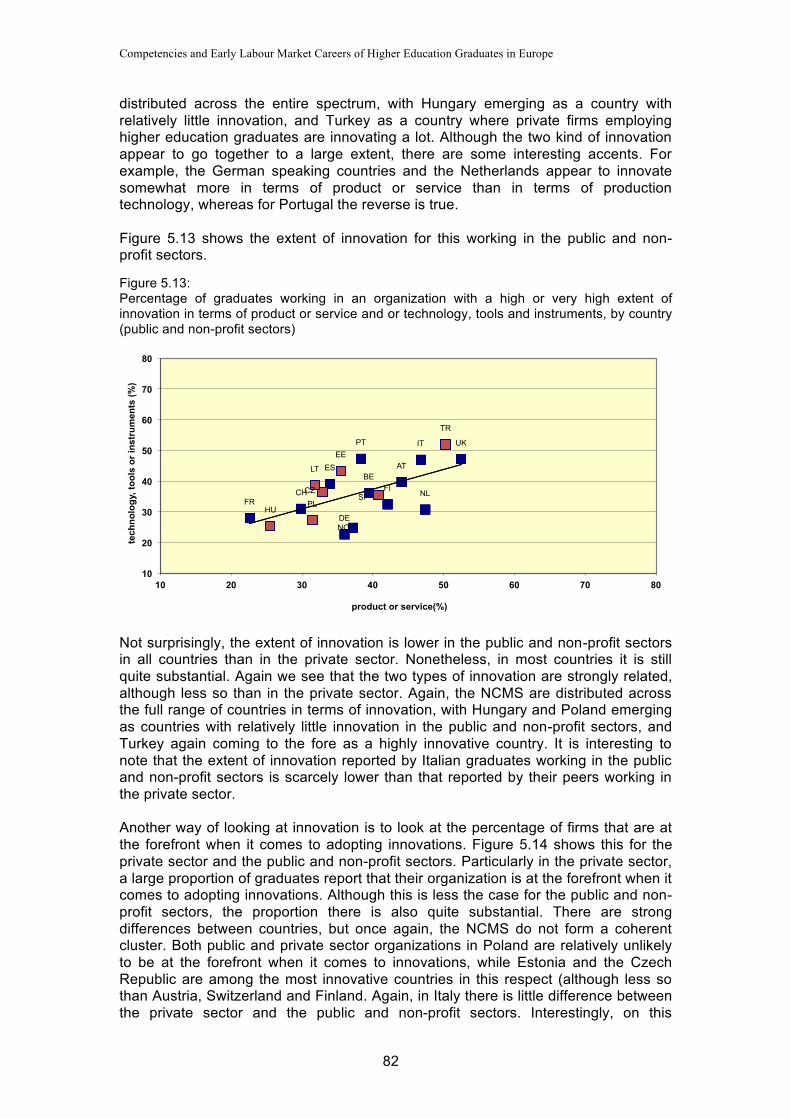
Competencies and Early Labour Market Careers of Higher Education Graduates in Europe
82
distributed across the entire spectrum, with Hungary emerging as a country with relatively little innovation, and Turkey as a country where private firms employing higher education graduates are innovating a lot. Although the two kind of innovation appear to go together to a large extent, there are some interesting accents. For example, the German speaking countries and the Netherlands appear to innovate somewhat more in terms of product or service than in terms of production technology, whereas for Portugal the reverse is true. Figure 5.13 shows the extent of innovation for this working in the public and non-profit sectors. Figure 5.13: Percentage of graduates working in an organization with a high or very high extent of innovation in terms of product or service and or technology, tools and instruments, by country (public and non-profit sectors)
Not surprisingly, the extent of innovation is lower in the public and non-profit sectors in all countries than in the private sector. Nonetheless, in most countries it is still quite substantial. Again we see that the two types of innovation are strongly related, although less so than in the private sector. Again, the NCMS are distributed across the full range of countries in terms of innovation, with Hungary and Poland emerging as countries with relatively little innovation in the public and non-profit sectors, and Turkey again coming to the fore as a highly innovative country. It is interesting to note that the extent of innovation reported by Italian graduates working in the public and non-profit sectors is scarcely lower than that reported by their peers working in the private sector. Another way of looking at innovation is to look at the percentage of firms that are at the forefront when it comes to adopting innovations. Figure 5.14 shows this for the private sector and the public and non-profit sectors. Particularly in the private sector, a large proportion of graduates report that their organization is at the forefront when it comes to adopting innovations. Although this is less the case for the public and non-profit sectors, the proportion there is also quite substantial. There are strong differences between countries, but once again, the NCMS do not form a coherent cluster. Both public and private sector organizations in Poland are relatively unlikely to be at the forefront when it comes to innovations, while Estonia and the Czech Republic are among the most innovative countries in this respect (although less so than Austria, Switzerland and Finland. Again, in Italy there is little difference between the private sector and the public and non-profit sectors. Interestingly, on this
IT
ES
FR
AT
DE
NL
UK
FI
NO
CZ CH
PT
BE
EE
SI
TR
LT
PL HU
10
20
30
40
50
60
70
80
10 20 30 40 50 60 70 80
tech
nolo
gy, t
ools
or i
nstr
umen
ts (%
)
product or service(%)
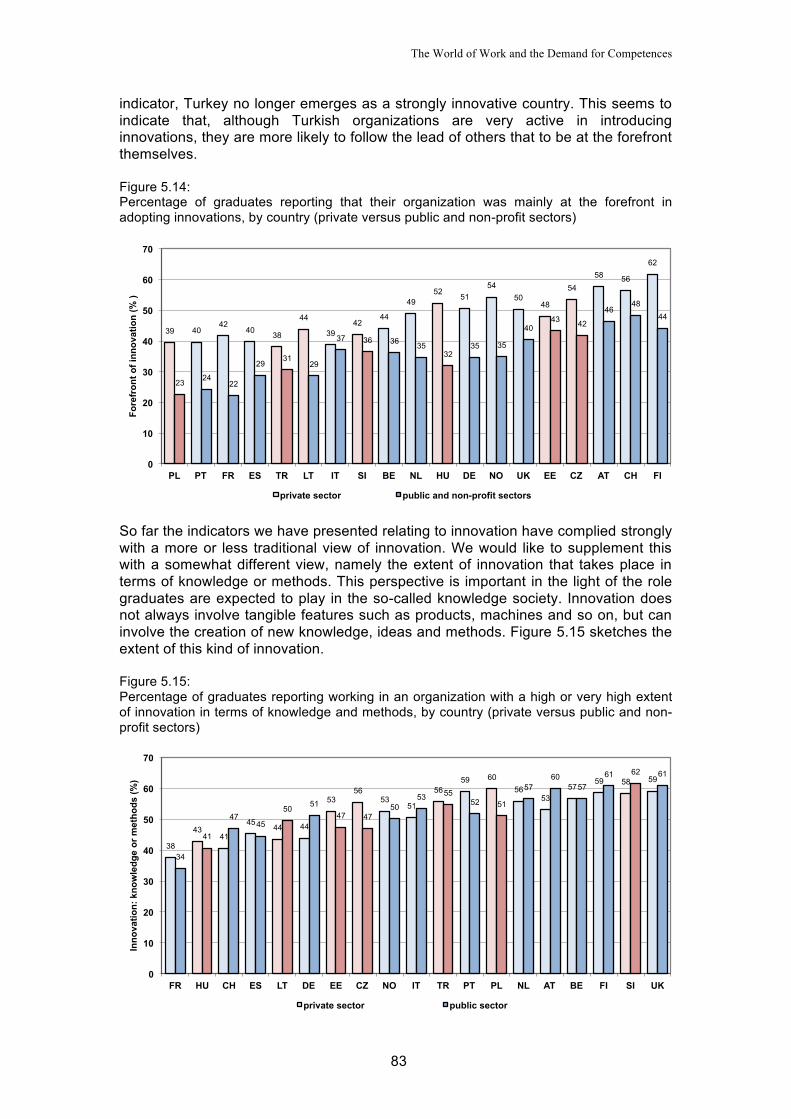
The World of Work and the Demand for Competences
83
indicator, Turkey no longer emerges as a strongly innovative country. This seems to indicate that, although Turkish organizations are very active in introducing innovations, they are more likely to follow the lead of others that to be at the forefront themselves. Figure 5.14: Percentage of graduates reporting that their organization was mainly at the forefront in adopting innovations, by country (private versus public and non-profit sectors)
So far the indicators we have presented relating to innovation have complied strongly with a more or less traditional view of innovation. We would like to supplement this with a somewhat different view, namely the extent of innovation that takes place in terms of knowledge or methods. This perspective is important in the light of the role graduates are expected to play in the so-called knowledge society. Innovation does not always involve tangible features such as products, machines and so on, but can involve the creation of new knowledge, ideas and methods. Figure 5.15 sketches the extent of this kind of innovation. Figure 5.15: Percentage of graduates reporting working in an organization with a high or very high extent of innovation in terms of knowledge and methods, by country (private versus public and non-profit sectors)
39 40 42
40 38
44
39 42
44
49 52
51 54
50 48
54 58 56
62
23 24 22
29 31
29
37 36 36 35 32
35 35
40 43 42
46 48
44
0
10
20
30
40
50
60
70
PL PT FR ES TR LT IT SI BE NL HU DE NO UK EE CZ AT CH FI
Fore
fron
t of i
nnov
atio
n (%
)
private sector public and non-profit sectors
38
43 41
45 44 44
53 56
53 51
56 59 60
56 53
57 59 58 59
34
41
47 45
50 51 47 47
50 53 55
52 51
57 60
57 61 62 61
0
10
20
30
40
50
60
70
FR HU CH ES LT DE EE CZ NO IT TR PT PL NL AT BE FI SI UK
Inno
vatio
n: k
now
ledg
e or
met
hods
(%)
private sector public sector
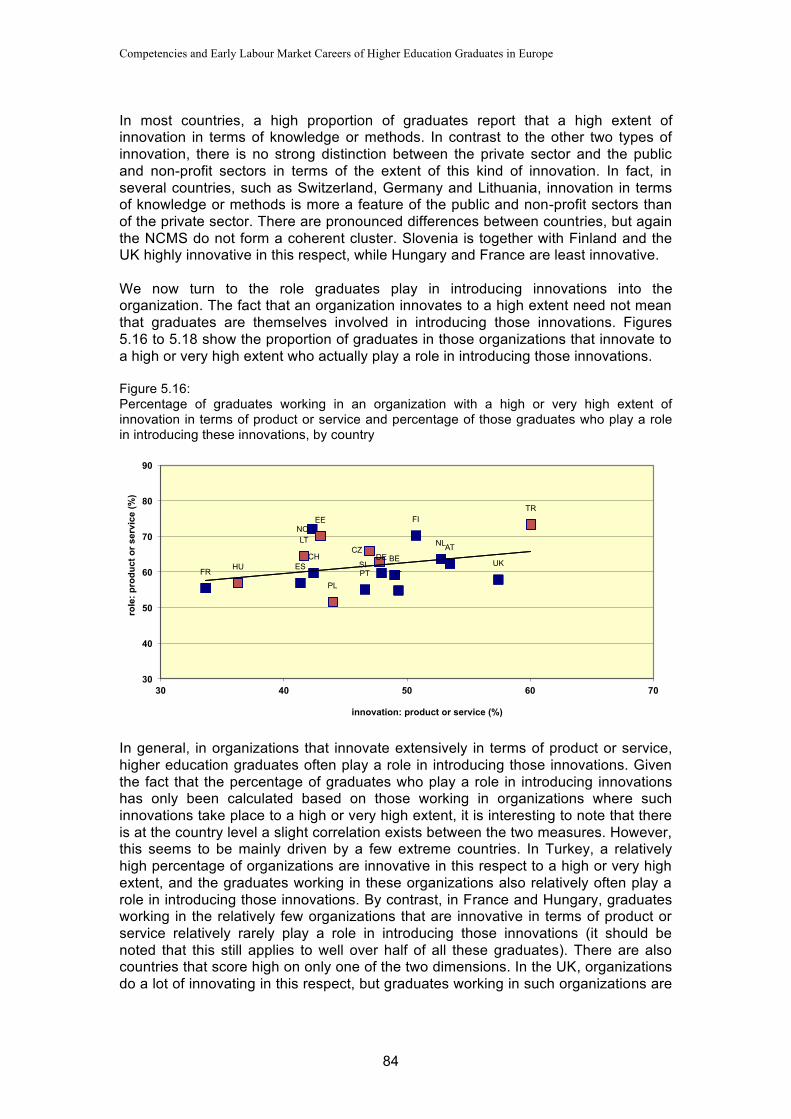
Competencies and Early Labour Market Careers of Higher Education Graduates in Europe
84
In most countries, a high proportion of graduates report that a high extent of innovation in terms of knowledge or methods. In contrast to the other two types of innovation, there is no strong distinction between the private sector and the public and non-profit sectors in terms of the extent of this kind of innovation. In fact, in several countries, such as Switzerland, Germany and Lithuania, innovation in terms of knowledge or methods is more a feature of the public and non-profit sectors than of the private sector. There are pronounced differences between countries, but again the NCMS do not form a coherent cluster. Slovenia is together with Finland and the UK highly innovative in this respect, while Hungary and France are least innovative. We now turn to the role graduates play in introducing innovations into the organization. The fact that an organization innovates to a high extent need not mean that graduates are themselves involved in introducing those innovations. Figures 5.16 to 5.18 show the proportion of graduates in those organizations that innovate to a high or very high extent who actually play a role in introducing those innovations. Figure 5.16: Percentage of graduates working in an organization with a high or very high extent of innovation in terms of product or service and percentage of those graduates who play a role in introducing these innovations, by country
In general, in organizations that innovate extensively in terms of product or service, higher education graduates often play a role in introducing those innovations. Given the fact that the percentage of graduates who play a role in introducing innovations has only been calculated based on those working in organizations where such innovations take place to a high or very high extent, it is interesting to note that there is at the country level a slight correlation exists between the two measures. However, this seems to be mainly driven by a few extreme countries. In Turkey, a relatively high percentage of organizations are innovative in this respect to a high or very high extent, and the graduates working in these organizations also relatively often play a role in introducing those innovations. By contrast, in France and Hungary, graduates working in the relatively few organizations that are innovative in terms of product or service relatively rarely play a role in introducing those innovations (it should be noted that this still applies to well over half of all these graduates). There are also countries that score high on only one of the two dimensions. In the UK, organizations do a lot of innovating in this respect, but graduates working in such organizations are
IT ES
FR
AT DE
NL
UK
FI NO
CZ CH
PT
BE
EE
SI
TR
LT
PL
HU
30
40
50
60
70
80
90
30 40 50 60 70
role
: pro
duct
or s
ervi
ce (%
)
innovation: product or service (%)
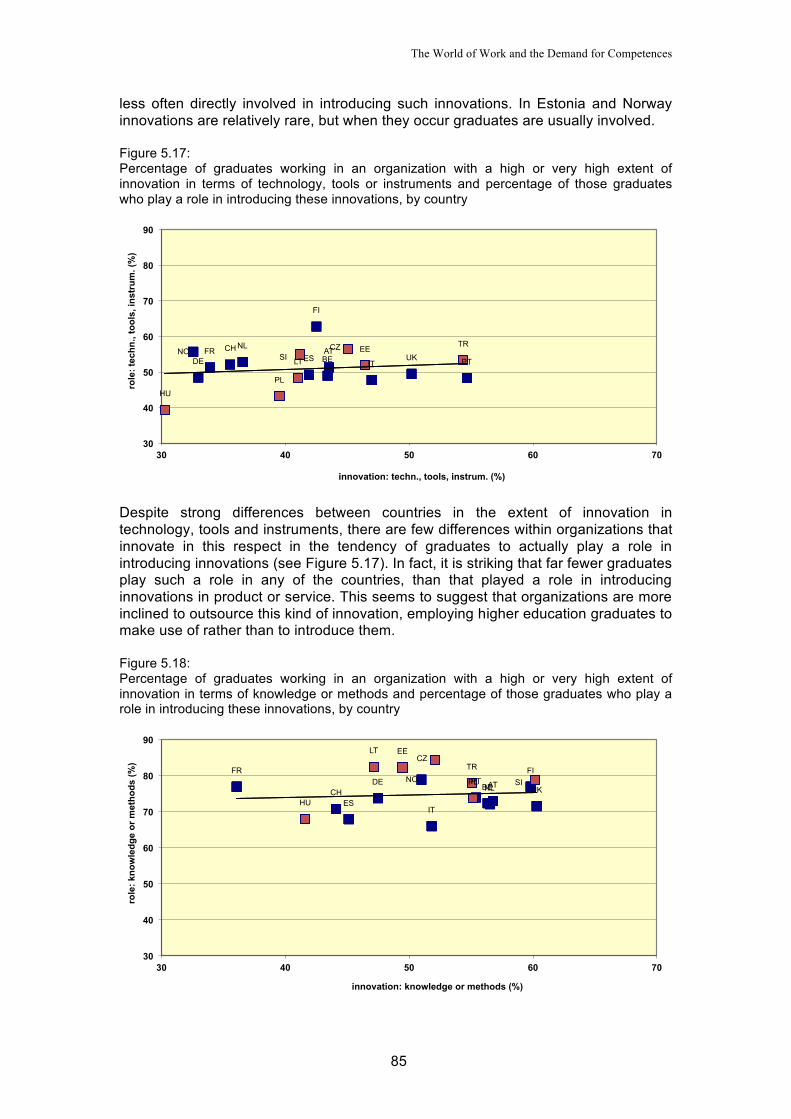
The World of Work and the Demand for Competences
85
less often directly involved in introducing such innovations. In Estonia and Norway innovations are relatively rare, but when they occur graduates are usually involved. Figure 5.17: Percentage of graduates working in an organization with a high or very high extent of innovation in terms of technology, tools or instruments and percentage of those graduates who play a role in introducing these innovations, by country
Despite strong differences between countries in the extent of innovation in technology, tools and instruments, there are few differences within organizations that innovate in this respect in the tendency of graduates to actually play a role in introducing innovations (see Figure 5.17). In fact, it is striking that far fewer graduates play such a role in any of the countries, than that played a role in introducing innovations in product or service. This seems to suggest that organizations are more inclined to outsource this kind of innovation, employing higher education graduates to make use of rather than to introduce them. Figure 5.18: Percentage of graduates working in an organization with a high or very high extent of innovation in terms of knowledge or methods and percentage of those graduates who play a role in introducing these innovations, by country
IT ES
FR AT DE
NL UK
FI
NO CZ CH
PT BE EE
SI TR
LT
PL
HU
30
40
50
60
70
80
90
30 40 50 60 70
role
: tec
hn.,
tool
s, in
stru
m. (
%)
innovation: techn., tools, instrum. (%)
IT ES
FR
AT DE NL UK
FI NO
CZ
CH PT
BE
EE
SI
TR
LT
PL
HU
30
40
50
60
70
80
90
30 40 50 60 70
role
: kno
wle
dge
or m
etho
ds (%
)
innovation: knowledge or methods (%)
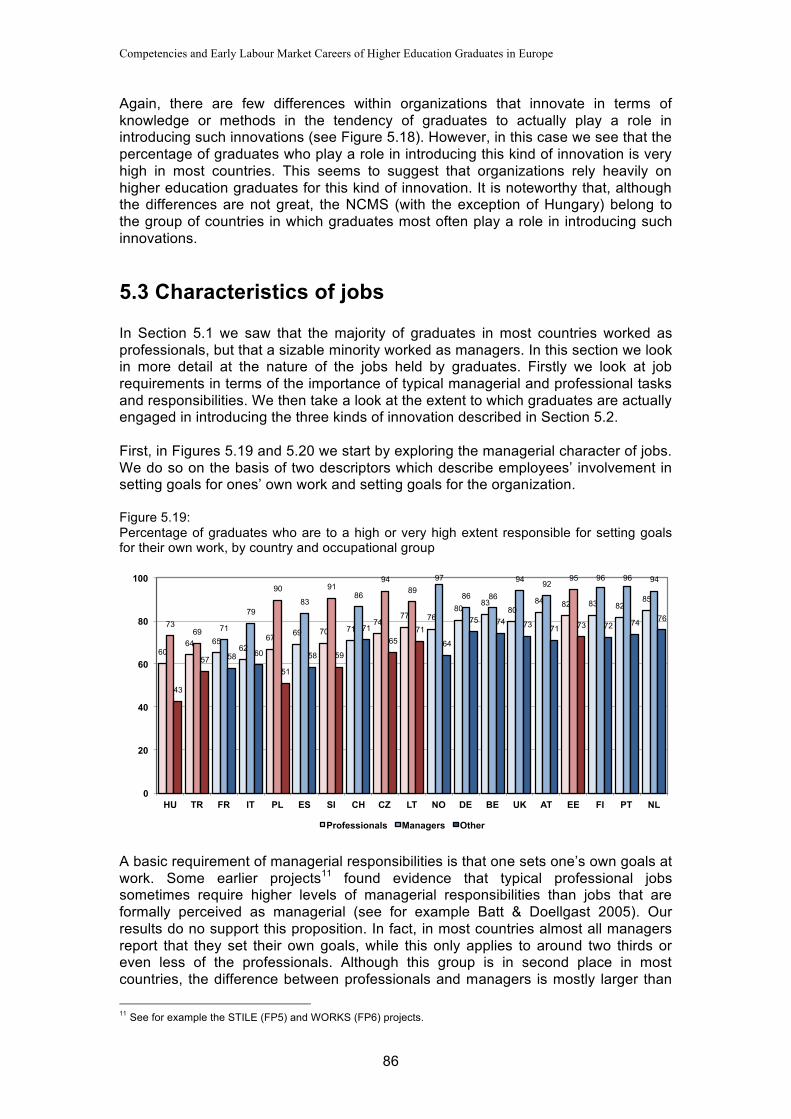
Competencies and Early Labour Market Careers of Higher Education Graduates in Europe
86
Again, there are few differences within organizations that innovate in terms of knowledge or methods in the tendency of graduates to actually play a role in introducing such innovations (see Figure 5.18). However, in this case we see that the percentage of graduates who play a role in introducing this kind of innovation is very high in most countries. This seems to suggest that organizations rely heavily on higher education graduates for this kind of innovation. It is noteworthy that, although the differences are not great, the NCMS (with the exception of Hungary) belong to the group of countries in which graduates most often play a role in introducing such innovations.
5.3 Characteristics of jobs In Section 5.1 we saw that the majority of graduates in most countries worked as professionals, but that a sizable minority worked as managers. In this section we look in more detail at the nature of the jobs held by graduates. Firstly we look at job requirements in terms of the importance of typical managerial and professional tasks and responsibilities. We then take a look at the extent to which graduates are actually engaged in introducing the three kinds of innovation described in Section 5.2. First, in Figures 5.19 and 5.20 we start by exploring the managerial character of jobs. We do so on the basis of two descriptors which describe employees’ involvement in setting goals for ones’ own work and setting goals for the organization. Figure 5.19: Percentage of graduates who are to a high or very high extent responsible for setting goals for their own work, by country and occupational group
A basic requirement of managerial responsibilities is that one sets one’s own goals at work. Some earlier projects11 found evidence that typical professional jobs sometimes require higher levels of managerial responsibilities than jobs that are formally perceived as managerial (see for example Batt & Doellgast 2005). Our results do no support this proposition. In fact, in most countries almost all managers report that they set their own goals, while this only applies to around two thirds or even less of the professionals. Although this group is in second place in most countries, the difference between professionals and managers is mostly larger than 11 See for example the STILE (FP5) and WORKS (FP6) projects.
60 64 65
62 67 69 70 71
74 77 76
80 83
80 84 82 83 82
85
73 69 71
79
90
83
91 86
94 89
97
86 86
94 92 95 96 96 94
43
57 58 60
51
58 59
71 65
71
64
75 74 73 71 73 72 74 76
0
20
40
60
80
100
HU TR FR IT PL ES SI CH CZ LT NO DE BE UK AT EE FI PT NL
Professionals Managers Other
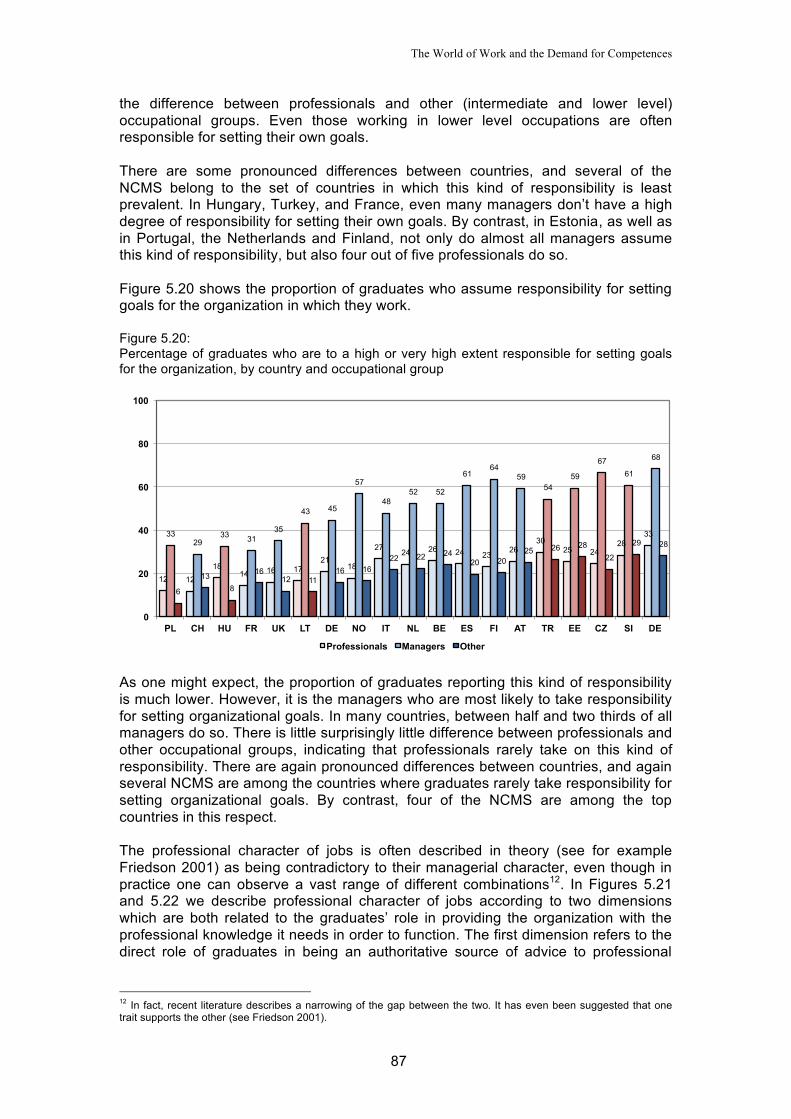
The World of Work and the Demand for Competences
87
the difference between professionals and other (intermediate and lower level) occupational groups. Even those working in lower level occupations are often responsible for setting their own goals. There are some pronounced differences between countries, and several of the NCMS belong to the set of countries in which this kind of responsibility is least prevalent. In Hungary, Turkey, and France, even many managers don’t have a high degree of responsibility for setting their own goals. By contrast, in Estonia, as well as in Portugal, the Netherlands and Finland, not only do almost all managers assume this kind of responsibility, but also four out of five professionals do so. Figure 5.20 shows the proportion of graduates who assume responsibility for setting goals for the organization in which they work. Figure 5.20: Percentage of graduates who are to a high or very high extent responsible for setting goals for the organization, by country and occupational group
As one might expect, the proportion of graduates reporting this kind of responsibility is much lower. However, it is the managers who are most likely to take responsibility for setting organizational goals. In many countries, between half and two thirds of all managers do so. There is little surprisingly little difference between professionals and other occupational groups, indicating that professionals rarely take on this kind of responsibility. There are again pronounced differences between countries, and again several NCMS are among the countries where graduates rarely take responsibility for setting organizational goals. By contrast, four of the NCMS are among the top countries in this respect. The professional character of jobs is often described in theory (see for example Friedson 2001) as being contradictory to their managerial character, even though in practice one can observe a vast range of different combinations12. In Figures 5.21 and 5.22 we describe professional character of jobs according to two dimensions which are both related to the graduates’ role in providing the organization with the professional knowledge it needs in order to function. The first dimension refers to the direct role of graduates in being an authoritative source of advice to professional
12 In fact, recent literature describes a narrowing of the gap between the two. It has even been suggested that one trait supports the other (see Friedson 2001).
12 12 18
14 16 17 21
18
27 24 26 24 23 26
30 25 24
28 33 33
29 33 31
35
43 45
57
48 52 52
61 64
59 54
59
67 61
68
6
13 8
16 12 11
16 16 22 22 24
20 20 25 26 28
22
29 28
0
20
40
60
80
100
PL CH HU FR UK LT DE NO IT NL BE ES FI AT TR EE CZ SI DE
Professionals Managers Other
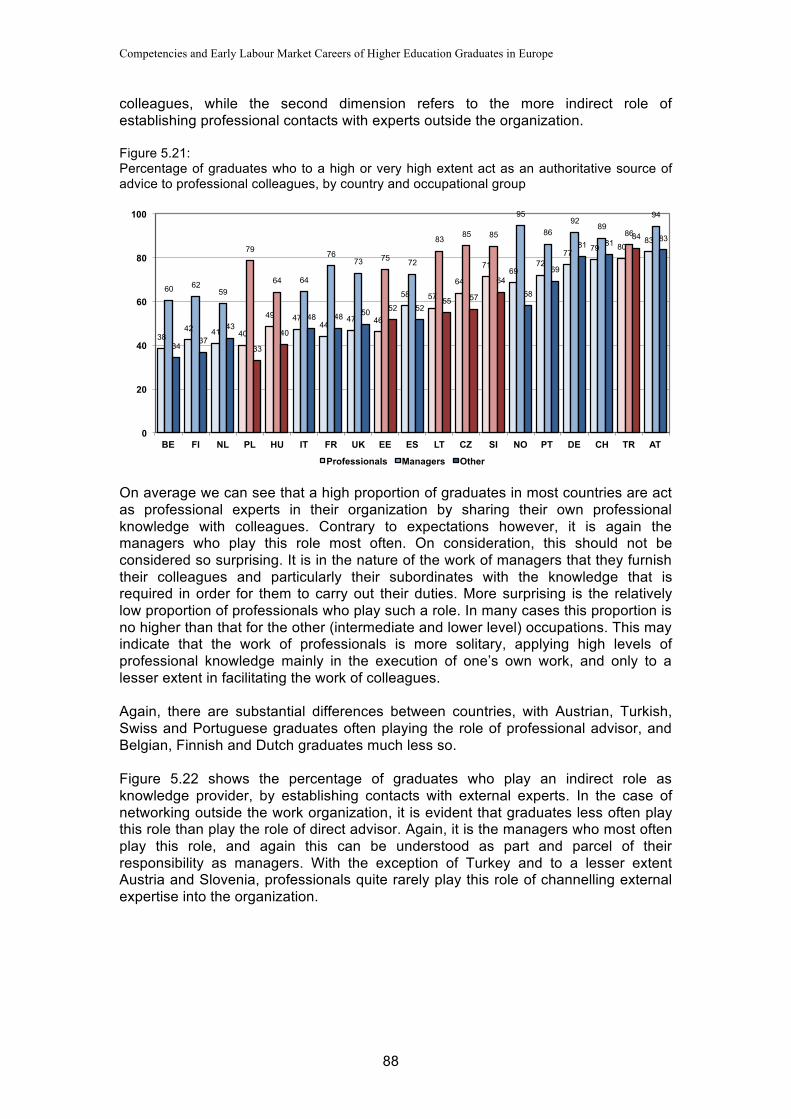
Competencies and Early Labour Market Careers of Higher Education Graduates in Europe
88
colleagues, while the second dimension refers to the more indirect role of establishing professional contacts with experts outside the organization. Figure 5.21: Percentage of graduates who to a high or very high extent act as an authoritative source of advice to professional colleagues, by country and occupational group
On average we can see that a high proportion of graduates in most countries are act as professional experts in their organization by sharing their own professional knowledge with colleagues. Contrary to expectations however, it is again the managers who play this role most often. On consideration, this should not be considered so surprising. It is in the nature of the work of managers that they furnish their colleagues and particularly their subordinates with the knowledge that is required in order for them to carry out their duties. More surprising is the relatively low proportion of professionals who play such a role. In many cases this proportion is no higher than that for the other (intermediate and lower level) occupations. This may indicate that the work of professionals is more solitary, applying high levels of professional knowledge mainly in the execution of one’s own work, and only to a lesser extent in facilitating the work of colleagues. Again, there are substantial differences between countries, with Austrian, Turkish, Swiss and Portuguese graduates often playing the role of professional advisor, and Belgian, Finnish and Dutch graduates much less so. Figure 5.22 shows the percentage of graduates who play an indirect role as knowledge provider, by establishing contacts with external experts. In the case of networking outside the work organization, it is evident that graduates less often play this role than play the role of direct advisor. Again, it is the managers who most often play this role, and again this can be understood as part and parcel of their responsibility as managers. With the exception of Turkey and to a lesser extent Austria and Slovenia, professionals quite rarely play this role of channelling external expertise into the organization.
38 42 41 40
49 47 44
47 46
58 57
64
71 69
72 77 79 80
83
60 62 59
79
64 64
76 73 75 72
83 85 85
95
86 92
89 86
94
34 37
43
33
40
48 48 50 52 52 55 57
64
58
69
81 81 84 83
0
20
40
60
80
100
BE FI NL PL HU IT FR UK EE ES LT CZ SI NO PT DE CH TR AT
Professionals Managers Other
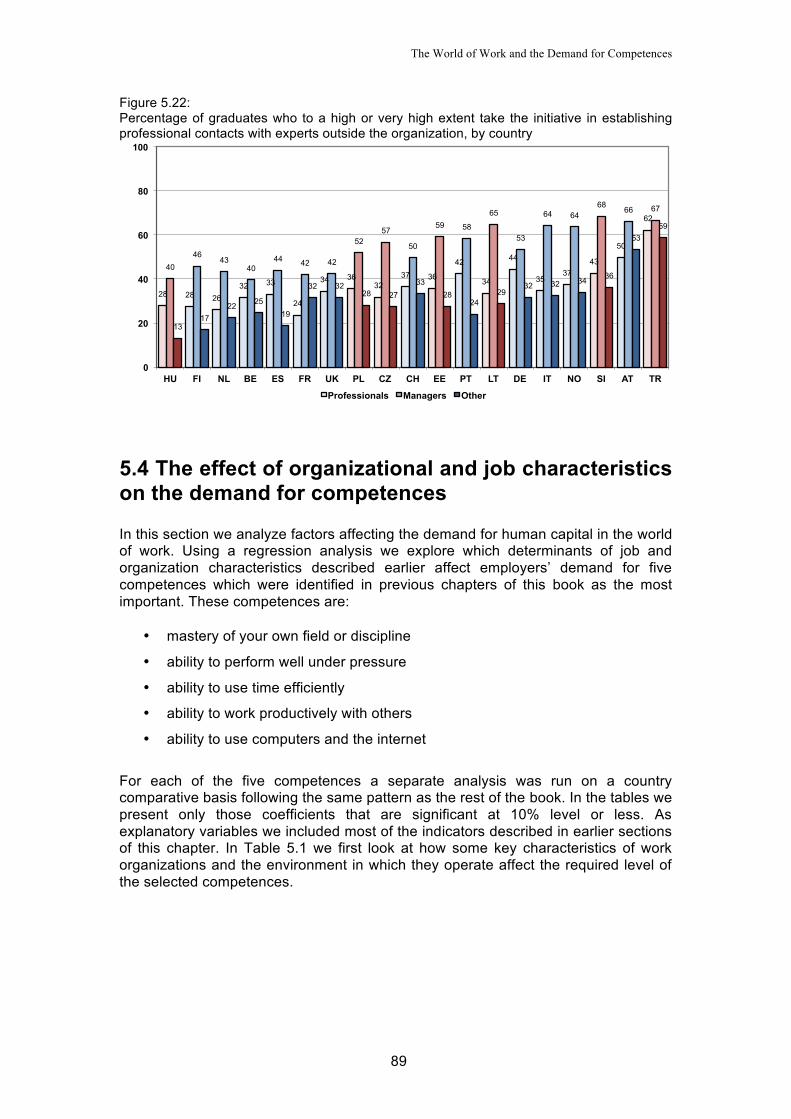
The World of Work and the Demand for Competences
89
Figure 5.22: Percentage of graduates who to a high or very high extent take the initiative in establishing professional contacts with experts outside the organization, by country
5.4 The effect of organizational and job characteristics on the demand for competences In this section we analyze factors affecting the demand for human capital in the world of work. Using a regression analysis we explore which determinants of job and organization characteristics described earlier affect employers’ demand for five competences which were identified in previous chapters of this book as the most important. These competences are:
mastery of your own field or discipline
ability to perform well under pressure
ability to use time efficiently
ability to work productively with others
ability to use computers and the internet
For each of the five competences a separate analysis was run on a country comparative basis following the same pattern as the rest of the book. In the tables we present only those coefficients that are significant at 10% level or less. As explanatory variables we included most of the indicators described in earlier sections of this chapter. In Table 5.1 we first look at how some key characteristics of work organizations and the environment in which they operate affect the required level of the selected competences.
28 28 26 32 33
24
34 36 32
37 36
42
34
44
35 37
43
50
62
40 46
43 40
44 42 42
52 57
50
59 58
65
53
64 64 68 66 67
13 17
22 25 19
32 32 28 27
33 28
24 29
32 32 34 36
53 59
0
20
40
60
80
100
HU FI NL BE ES FR UK PL CZ CH EE PT LT DE IT NO SI AT TR
Professionals Managers Other

Competencies and Early Labour Market Careers of Higher Education Graduates in Europe
90
Table 5.1: Effect of characteristics of work organizations on required level of selected competencies, by European region
NCMS NE SE Total Ability to use computers and internet Competition 0.050*** 0.041*** 0.041** 0.044*** Quality orientation Instability of demand Reorganization 0.025*** 0.015** Innovation (org. level) 0.145*** 0.158*** 0.170*** 0.158*** Ability to use time efficiently Competition 0.103*** 0.118*** 0.086*** 0.105*** Quality orientation 0.033*** 0.042*** 0.030*** Instability of demand -0.033*** -0.017* -0.023*** Reorganization 0.011* Innovation (org. level) 0.076*** 0.099*** 0.102*** 0.091*** Ability to work productively with others Competition 0.081*** 0.065*** 0.042** 0.067*** Quality orientation 0.043*** 0.023** 0.029*** Instability of demand -0.047*** -0.021*** Reorganization 0.045*** 0.029*** Innovation (org. level) 0.113*** 0.117*** 0.140*** 0.122*** Ability to perform well under pressure Competition 0.083*** 0.113*** 0.140*** 0.110*** Quality orientation 0.012* Instability of demand Reorganization 0.036*** 0.025*** 0.049*** 0.035*** Innovation (org. level) 0.045*** 0.088*** 0.063*** 0.064*** Mastery of one’s own field or discipline Competition 0.054*** 0.069*** 0.067*** 0.062*** Quality orientation 0.038*** 0.041*** 0.030** 0.039*** Instability of demand -0.022** -0.014** Reorganization -0.033*** -0.027* -0.019*** Innovation (org. level) 0.093*** 0.111*** 0.107*** 0.104***
*** = p<0.01; ** = p<0.05; * = p<0.10 Only statistically significant results shown It is clear that working in a competitive environment provides a strong boost for the demand for graduates’ competences. Not surprisingly, the clearest effects of the strength of competition in all three regions are on the required level of ability to use time efficiently and to perform well under pressure. However, competition also enhances the demand for the other competences, especially the ability to work productively with others and the mastery of one’s own field or discipline. It is an interesting paradox that competition increases the need for teamwork – especially in the NCMS - and also notable that employers choose to deploy professional expertise as a way of tackling their competitors. The moderate effects of computer and internet skills also underscore the increasing importance of information technology in competitive markets. The effects of quality orientation – the degree to which competition is based on quality rather than price – are less pronounced. There are some weak to moderate effects on mastery of one’s own field or discipline, the ability to work productively with others and the ability to use time efficiently. The latter effect is a little surprising. One might expect that when quality rather than price is the most important factor, time – which is usually equated with money – would be less of an issue. Perhaps there is a premium for being the first firm to bring a new high quality product or service on to the market. Instability of demand has little effect on the selected competences, and the effects that are observed are largely confined to the NCMS. Furthermore, the observed
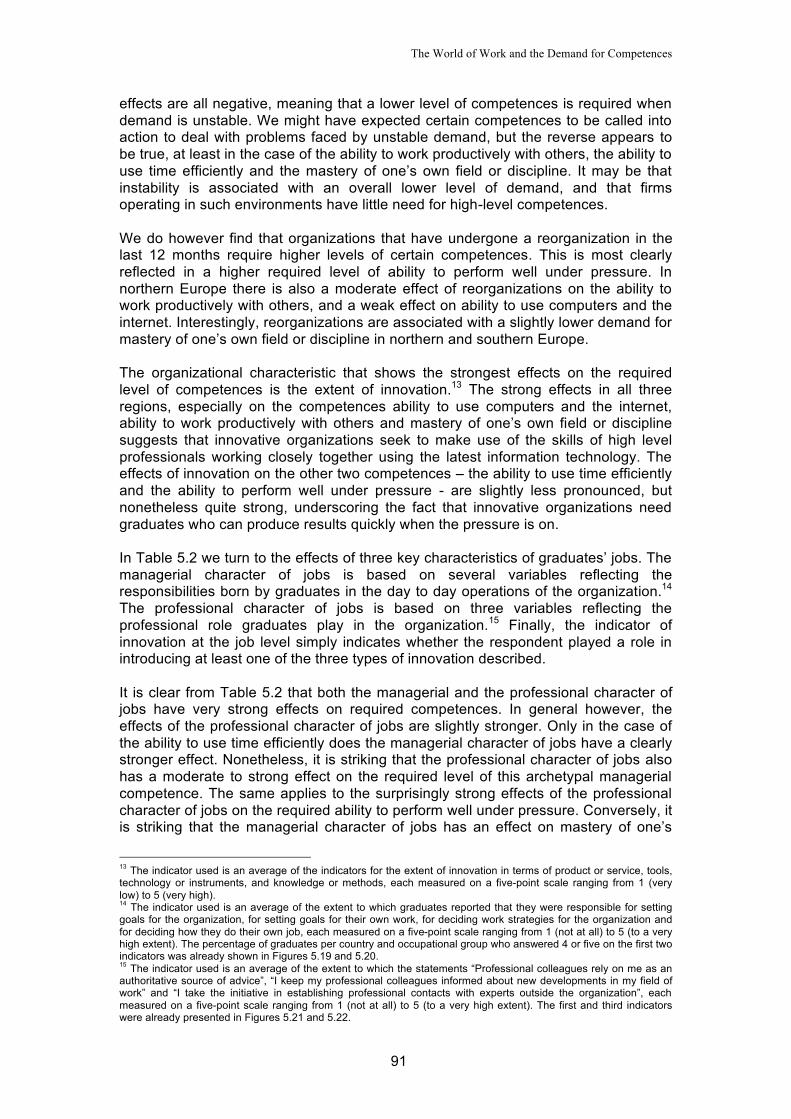
The World of Work and the Demand for Competences
91
effects are all negative, meaning that a lower level of competences is required when demand is unstable. We might have expected certain competences to be called into action to deal with problems faced by unstable demand, but the reverse appears to be true, at least in the case of the ability to work productively with others, the ability to use time efficiently and the mastery of one’s own field or discipline. It may be that instability is associated with an overall lower level of demand, and that firms operating in such environments have little need for high-level competences. We do however find that organizations that have undergone a reorganization in the last 12 months require higher levels of certain competences. This is most clearly reflected in a higher required level of ability to perform well under pressure. In northern Europe there is also a moderate effect of reorganizations on the ability to work productively with others, and a weak effect on ability to use computers and the internet. Interestingly, reorganizations are associated with a slightly lower demand for mastery of one’s own field or discipline in northern and southern Europe. The organizational characteristic that shows the strongest effects on the required level of competences is the extent of innovation.13 The strong effects in all three regions, especially on the competences ability to use computers and the internet, ability to work productively with others and mastery of one’s own field or discipline suggests that innovative organizations seek to make use of the skills of high level professionals working closely together using the latest information technology. The effects of innovation on the other two competences – the ability to use time efficiently and the ability to perform well under pressure - are slightly less pronounced, but nonetheless quite strong, underscoring the fact that innovative organizations need graduates who can produce results quickly when the pressure is on. In Table 5.2 we turn to the effects of three key characteristics of graduates’ jobs. The managerial character of jobs is based on several variables reflecting the responsibilities born by graduates in the day to day operations of the organization.14 The professional character of jobs is based on three variables reflecting the professional role graduates play in the organization.15 Finally, the indicator of innovation at the job level simply indicates whether the respondent played a role in introducing at least one of the three types of innovation described. It is clear from Table 5.2 that both the managerial and the professional character of jobs have very strong effects on required competences. In general however, the effects of the professional character of jobs are slightly stronger. Only in the case of the ability to use time efficiently does the managerial character of jobs have a clearly stronger effect. Nonetheless, it is striking that the professional character of jobs also has a moderate to strong effect on the required level of this archetypal managerial competence. The same applies to the surprisingly strong effects of the professional character of jobs on the required ability to perform well under pressure. Conversely, it is striking that the managerial character of jobs has an effect on mastery of one’s
13 The indicator used is an average of the indicators for the extent of innovation in terms of product or service, tools, technology or instruments, and knowledge or methods, each measured on a five-point scale ranging from 1 (very low) to 5 (very high). 14 The indicator used is an average of the extent to which graduates reported that they were responsible for setting goals for the organization, for setting goals for their own work, for deciding work strategies for the organization and for deciding how they do their own job, each measured on a five-point scale ranging from 1 (not at all) to 5 (to a very high extent). The percentage of graduates per country and occupational group who answered 4 or five on the first two indicators was already shown in Figures 5.19 and 5.20. 15 The indicator used is an average of the extent to which the statements “Professional colleagues rely on me as an authoritative source of advice”, “I keep my professional colleagues informed about new developments in my field of work” and “I take the initiative in establishing professional contacts with experts outside the organization”, each measured on a five-point scale ranging from 1 (not at all) to 5 (to a very high extent). The first and third indicators were already presented in Figures 5.21 and 5.22.

Competencies and Early Labour Market Careers of Higher Education Graduates in Europe
92
own field or discipline – which one would think was pre-eminently the domain of professionals – which is comparable to, and in the case of southern Europe even stronger, than the effect of the professional character of jobs. Table 5.2: Effect of characteristics of jobs on required level of selected competencies, by European region
NCMS NE SE Total Ability to use computers and internet Managerial character of jobs 0.064*** 0.020* 0.033*** Professional character of jobs 0.082*** 0.100*** 0.108*** 0.094*** Innovation (job level) 0.035** 0.014** Ability to use time efficiently Managerial character of jobs 0.114*** 0.094*** 0.164*** 0.115*** Professional character of jobs 0.053*** 0.090*** 0.054*** 0.067*** Innovation (job level) -0.020** Ability to work productively with others Managerial character of jobs 0.052*** 0.070*** 0.087*** 0.067*** Professional character of jobs 0.104*** 0.114*** 0.103*** 0.106*** Innovation (job level) 0.030** Ability to perform well under pressure Managerial character of jobs 0.067*** 0.095*** 0.099*** 0.083*** Professional character of jobs 0.099*** 0.098*** 0.111*** 0.105*** Innovation (job level) -0.024** Mastery of one’s own field or discipline Managerial character of jobs 0.115*** 0.107*** 0.161*** 0.119*** Professional character of jobs 0.107*** 0.111*** 0.125*** 0.112*** Innovation (job level) 0.020* 0.027* 0.011*
*** = p<0.01; ** = p<0.05; * = p<0.10 Only statistically significant results shown In contrast to the very strong effects of the managerial and professional character of jobs, innovation at the job has very little effect on any of the competences. The effects that are observed are without fail weak, and in two cases the effect is even negative. Given the strong effect of innovation at the organization level, this lack of effect is puzzling. It suggests that innovative firms are extremely focussed on deploying high-level competences, but do not thereby draw a strong distinction between those actually involved in introducing innovations and those who are not involved. Table 5.3 shows the effect of broad economic sector on the required level of competences. In general, the highest level of required competences is seen in the reference sector private services. The differences are most pronounced in the case of computer and internet skills, where the required level is lowest in all three regions in the public services and administration sector and highest in the private services sector. The only case where the required level is highest in one of the sectors besides the reference sector was the public services and administration in northern Europe, where a somewhat higher level of mastery was required.

The World of Work and the Demand for Competences
93
Table 5.3: Effect of economic sector on required level of selected competencies, by European region
NCMS NE SE Total Ability to use computers and internet Industry and agriculture -0.060*** -0.069*** -0.044*** -0.060*** Private services Ref. Ref. Ref. Ref. Public services and administration -0.089*** -0.139*** -0.157*** -0.130*** Ability to use time efficiently Industry and agriculture -0.041*** -0.020*** Private services Ref. Ref. Ref. Ref. Public services and administration -0.037*** -0.023** Ability to work productively with others Industry and agriculture -0.026** Private services Ref. Ref. Ref. Ref. Public services and administration 0.019** Ability to perform well under pressure Industry and agriculture -0.045*** -0.025*** Private services Ref. Ref. Ref. Ref. Public services and administration -0.055*** -0.052*** -0.036*** Mastery of one’s own field or discipline Industry and agriculture -0.057*** -0.028*** Private services Ref. Ref. Ref. Ref. Public services and administration 0.040*** 0.019**
*** = p<0.01; ** = p<0.05; * = p<0.10 Only statistically significant results shown Table 5.4 shows the effect of broad occupational group on the required level of competences. There are some pronounced differences between occupational groups, which however vary considerably per competence and per region. The only more or less uniform outcome is that the level of competences required in “other occupations” – consisting of intermediate and lower level occupations for which one would not normally require a higher education qualification – is in most cases lower than that required the reference category “Technicians and associate professionals”. Given the fact that the reference category is itself on the lower margins of the occupational domain for the higher educated, the clarity of this result is notable. Even more notable is the fact that the competence requirements for managers and the different classes of professionals are as often lower as higher than those for the reference category. Rather than there being a clear hierarchy of occupations, there is a strong qualitative differentiation in terms of distinct competence profiles required in each occupational group. The “Physical, mathematical and engineering science professionals” are characterized by high required levels of computer and internet skills (especially in northern Europe), quite low levels of typical management competences (ability to use time efficiently and to perform well under pressure), and levels of ability to work productively with others and mastery of one’s own field or discipline that differ little from those required of technicians and associate professionals. Especially the modest level of mastery required of this group is surprising, since these are together with life science professionals by far the most scientifically oriented of the occupational groups.
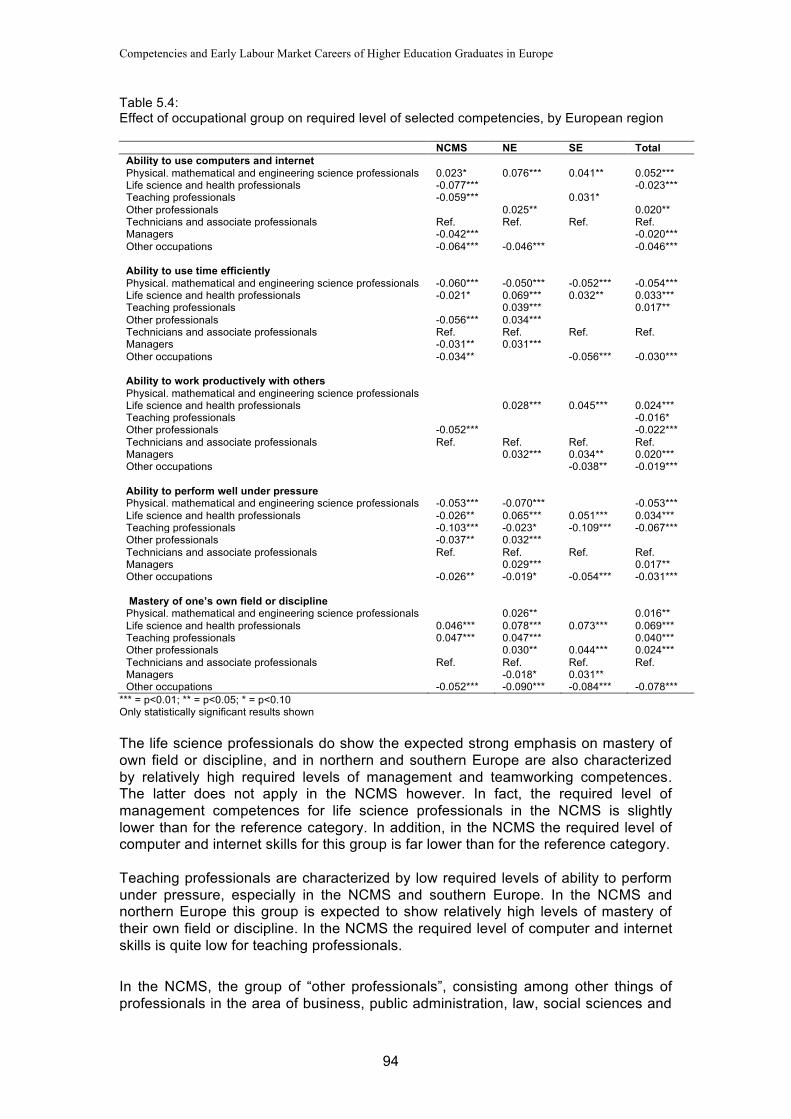
Competencies and Early Labour Market Careers of Higher Education Graduates in Europe
94
Table 5.4: Effect of occupational group on required level of selected competencies, by European region
NCMS NE SE Total Ability to use computers and internet Physical. mathematical and engineering science professionals 0.023* 0.076*** 0.041** 0.052*** Life science and health professionals -0.077*** -0.023*** Teaching professionals -0.059*** 0.031* Other professionals 0.025** 0.020** Technicians and associate professionals Ref. Ref. Ref. Ref. Managers -0.042*** -0.020*** Other occupations -0.064*** -0.046*** -0.046*** Ability to use time efficiently Physical. mathematical and engineering science professionals -0.060*** -0.050*** -0.052*** -0.054*** Life science and health professionals -0.021* 0.069*** 0.032** 0.033*** Teaching professionals 0.039*** 0.017** Other professionals -0.056*** 0.034*** Technicians and associate professionals Ref. Ref. Ref. Ref. Managers -0.031** 0.031*** Other occupations -0.034** -0.056*** -0.030*** Ability to work productively with others Physical. mathematical and engineering science professionals Life science and health professionals 0.028*** 0.045*** 0.024*** Teaching professionals -0.016* Other professionals -0.052*** -0.022*** Technicians and associate professionals Ref. Ref. Ref. Ref. Managers 0.032*** 0.034** 0.020*** Other occupations -0.038** -0.019*** Ability to perform well under pressure Physical. mathematical and engineering science professionals -0.053*** -0.070*** -0.053*** Life science and health professionals -0.026** 0.065*** 0.051*** 0.034*** Teaching professionals -0.103*** -0.023* -0.109*** -0.067*** Other professionals -0.037** 0.032*** Technicians and associate professionals Ref. Ref. Ref. Ref. Managers 0.029*** 0.017** Other occupations -0.026** -0.019* -0.054*** -0.031*** Mastery of one’s own field or discipline Physical. mathematical and engineering science professionals 0.026** 0.016** Life science and health professionals 0.046*** 0.078*** 0.073*** 0.069*** Teaching professionals 0.047*** 0.047*** 0.040*** Other professionals 0.030** 0.044*** 0.024*** Technicians and associate professionals Ref. Ref. Ref. Ref. Managers -0.018* 0.031** Other occupations -0.052*** -0.090*** -0.084*** -0.078***
*** = p<0.01; ** = p<0.05; * = p<0.10 Only statistically significant results shown The life science professionals do show the expected strong emphasis on mastery of own field or discipline, and in northern and southern Europe are also characterized by relatively high required levels of management and teamworking competences. The latter does not apply in the NCMS however. In fact, the required level of management competences for life science professionals in the NCMS is slightly lower than for the reference category. In addition, in the NCMS the required level of computer and internet skills for this group is far lower than for the reference category. Teaching professionals are characterized by low required levels of ability to perform under pressure, especially in the NCMS and southern Europe. In the NCMS and northern Europe this group is expected to show relatively high levels of mastery of their own field or discipline. In the NCMS the required level of computer and internet skills is quite low for teaching professionals. In the NCMS, the group of “other professionals”, consisting among other things of professionals in the area of business, public administration, law, social sciences and
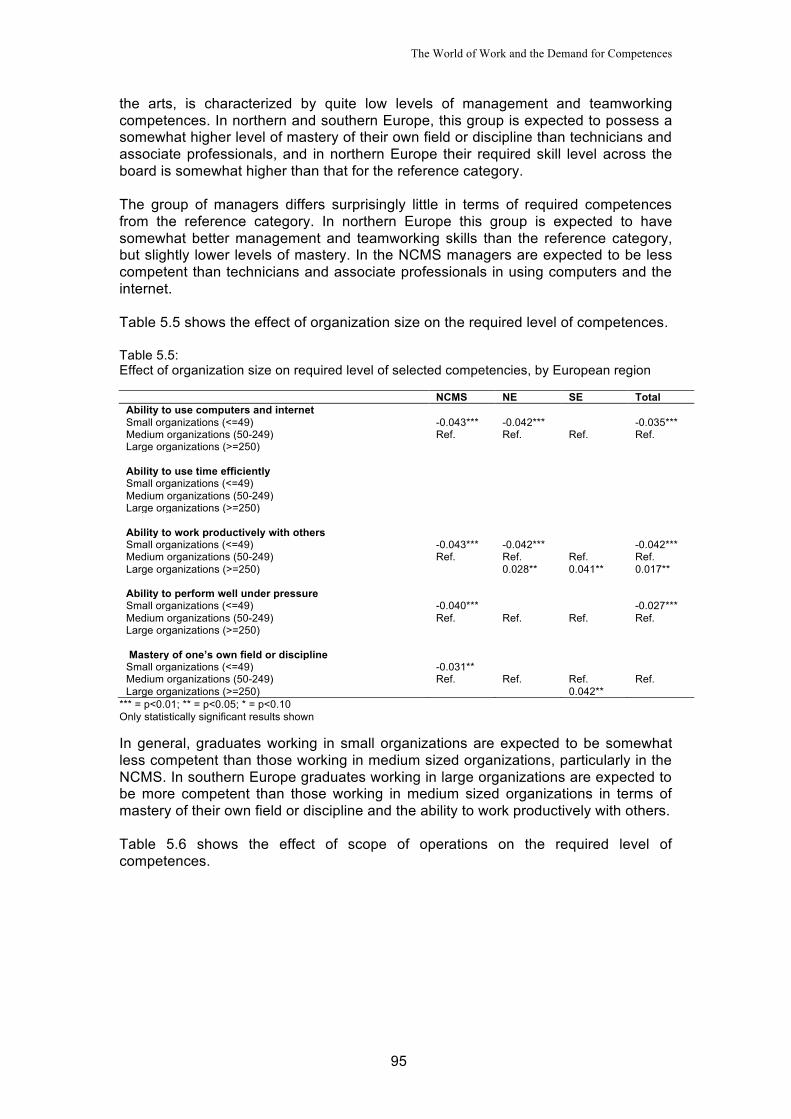
The World of Work and the Demand for Competences
95
the arts, is characterized by quite low levels of management and teamworking competences. In northern and southern Europe, this group is expected to possess a somewhat higher level of mastery of their own field or discipline than technicians and associate professionals, and in northern Europe their required skill level across the board is somewhat higher than that for the reference category. The group of managers differs surprisingly little in terms of required competences from the reference category. In northern Europe this group is expected to have somewhat better management and teamworking skills than the reference category, but slightly lower levels of mastery. In the NCMS managers are expected to be less competent than technicians and associate professionals in using computers and the internet. Table 5.5 shows the effect of organization size on the required level of competences. Table 5.5: Effect of organization size on required level of selected competencies, by European region
NCMS NE SE Total Ability to use computers and internet Small organizations (<=49) -0.043*** -0.042*** -0.035*** Medium organizations (50-249) Ref. Ref. Ref. Ref. Large organizations (>=250) Ability to use time efficiently Small organizations (<=49) Medium organizations (50-249) Large organizations (>=250) Ability to work productively with others Small organizations (<=49) -0.043*** -0.042*** -0.042*** Medium organizations (50-249) Ref. Ref. Ref. Ref. Large organizations (>=250) 0.028** 0.041** 0.017** Ability to perform well under pressure Small organizations (<=49) -0.040*** -0.027*** Medium organizations (50-249) Ref. Ref. Ref. Ref. Large organizations (>=250) Mastery of one’s own field or discipline Small organizations (<=49) -0.031** Medium organizations (50-249) Ref. Ref. Ref. Ref. Large organizations (>=250) 0.042**
*** = p<0.01; ** = p<0.05; * = p<0.10 Only statistically significant results shown In general, graduates working in small organizations are expected to be somewhat less competent than those working in medium sized organizations, particularly in the NCMS. In southern Europe graduates working in large organizations are expected to be more competent than those working in medium sized organizations in terms of mastery of their own field or discipline and the ability to work productively with others. Table 5.6 shows the effect of scope of operations on the required level of competences.
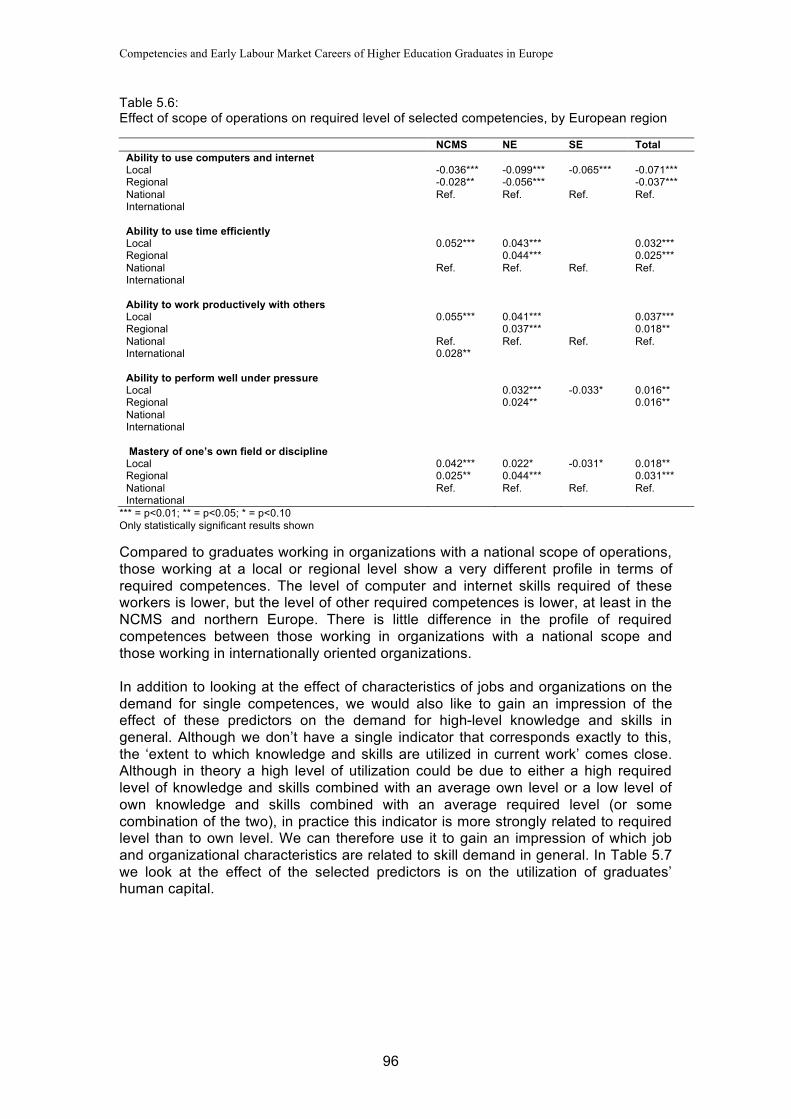
Competencies and Early Labour Market Careers of Higher Education Graduates in Europe
96
Table 5.6: Effect of scope of operations on required level of selected competencies, by European region
NCMS NE SE Total Ability to use computers and internet Local -0.036*** -0.099*** -0.065*** -0.071*** Regional -0.028** -0.056*** -0.037*** National Ref. Ref. Ref. Ref. International Ability to use time efficiently Local 0.052*** 0.043*** 0.032*** Regional 0.044*** 0.025*** National Ref. Ref. Ref. Ref. International Ability to work productively with others Local 0.055*** 0.041*** 0.037*** Regional 0.037*** 0.018** National Ref. Ref. Ref. Ref. International 0.028** Ability to perform well under pressure Local 0.032*** -0.033* 0.016** Regional 0.024** 0.016** National International Mastery of one’s own field or discipline Local 0.042*** 0.022* -0.031* 0.018** Regional 0.025** 0.044*** 0.031*** National Ref. Ref. Ref. Ref. International
*** = p<0.01; ** = p<0.05; * = p<0.10 Only statistically significant results shown Compared to graduates working in organizations with a national scope of operations, those working at a local or regional level show a very different profile in terms of required competences. The level of computer and internet skills required of these workers is lower, but the level of other required competences is lower, at least in the NCMS and northern Europe. There is little difference in the profile of required competences between those working in organizations with a national scope and those working in internationally oriented organizations. In addition to looking at the effect of characteristics of jobs and organizations on the demand for single competences, we would also like to gain an impression of the effect of these predictors on the demand for high-level knowledge and skills in general. Although we don’t have a single indicator that corresponds exactly to this, the ‘extent to which knowledge and skills are utilized in current work’ comes close. Although in theory a high level of utilization could be due to either a high required level of knowledge and skills combined with an average own level or a low level of own knowledge and skills combined with an average required level (or some combination of the two), in practice this indicator is more strongly related to required level than to own level. We can therefore use it to gain an impression of which job and organizational characteristics are related to skill demand in general. In Table 5.7 we look at the effect of the selected predictors is on the utilization of graduates’ human capital.
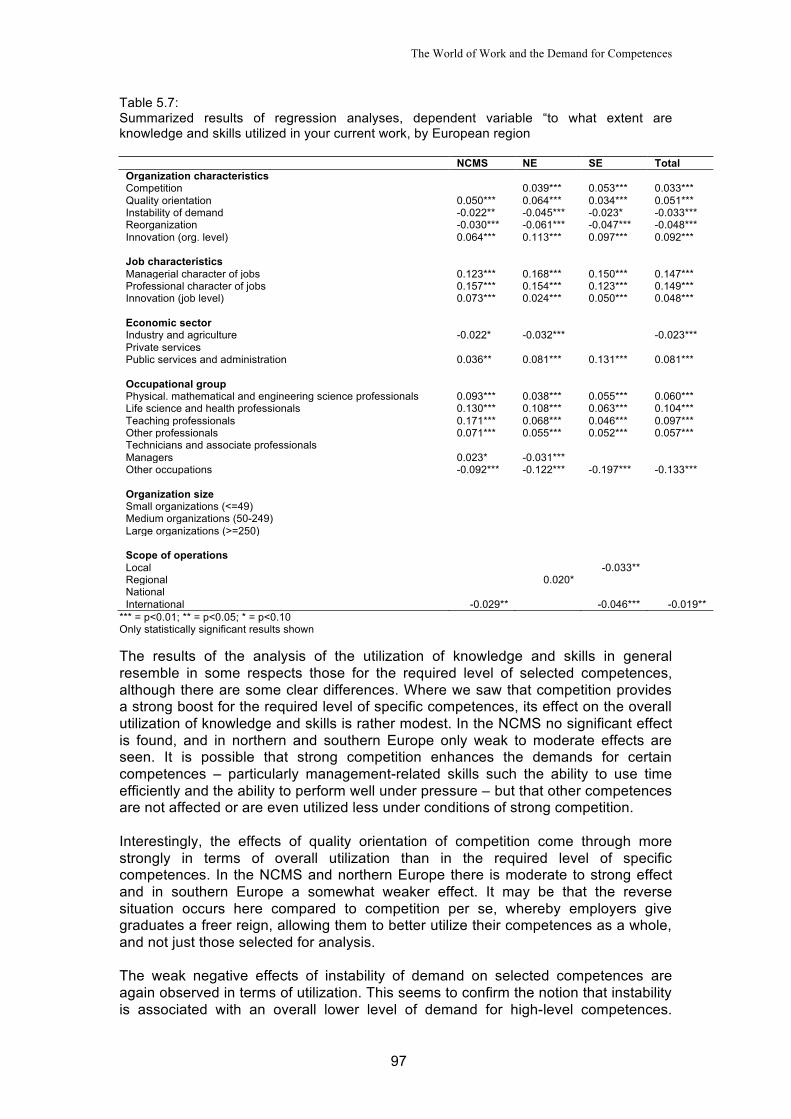
The World of Work and the Demand for Competences
97
Table 5.7: Summarized results of regression analyses, dependent variable “to what extent are knowledge and skills utilized in your current work, by European region
NCMS NE SE Total Organization characteristics Competition 0.039*** 0.053*** 0.033*** Quality orientation 0.050*** 0.064*** 0.034*** 0.051*** Instability of demand -0.022** -0.045*** -0.023* -0.033*** Reorganization -0.030*** -0.061*** -0.047*** -0.048*** Innovation (org. level) 0.064*** 0.113*** 0.097*** 0.092*** Job characteristics Managerial character of jobs 0.123*** 0.168*** 0.150*** 0.147*** Professional character of jobs 0.157*** 0.154*** 0.123*** 0.149*** Innovation (job level) 0.073*** 0.024*** 0.050*** 0.048*** Economic sector Industry and agriculture -0.022* -0.032*** -0.023*** Private services Public services and administration 0.036** 0.081*** 0.131*** 0.081*** Occupational group Physical. mathematical and engineering science professionals 0.093*** 0.038*** 0.055*** 0.060*** Life science and health professionals 0.130*** 0.108*** 0.063*** 0.104*** Teaching professionals 0.171*** 0.068*** 0.046*** 0.097*** Other professionals 0.071*** 0.055*** 0.052*** 0.057*** Technicians and associate professionals Managers 0.023* -0.031*** Other occupations -0.092*** -0.122*** -0.197*** -0.133*** Organization size Small organizations (<=49) Medium organizations (50-249) Large organizations (>=250) Scope of operations Local -0.033** Regional 0.020* National International -0.029** -0.046*** -0.019**
*** = p<0.01; ** = p<0.05; * = p<0.10 Only statistically significant results shown The results of the analysis of the utilization of knowledge and skills in general resemble in some respects those for the required level of selected competences, although there are some clear differences. Where we saw that competition provides a strong boost for the required level of specific competences, its effect on the overall utilization of knowledge and skills is rather modest. In the NCMS no significant effect is found, and in northern and southern Europe only weak to moderate effects are seen. It is possible that strong competition enhances the demands for certain competences – particularly management-related skills such the ability to use time efficiently and the ability to perform well under pressure – but that other competences are not affected or are even utilized less under conditions of strong competition. Interestingly, the effects of quality orientation of competition come through more strongly in terms of overall utilization than in the required level of specific competences. In the NCMS and northern Europe there is moderate to strong effect and in southern Europe a somewhat weaker effect. It may be that the reverse situation occurs here compared to competition per se, whereby employers give graduates a freer reign, allowing them to better utilize their competences as a whole, and not just those selected for analysis. The weak negative effects of instability of demand on selected competences are again observed in terms of utilization. This seems to confirm the notion that instability is associated with an overall lower level of demand for high-level competences.
Competencies and Early Labour Market Careers of Higher Education Graduates in Europe
98
Interestingly, where we saw an increased demand for certain competences following a reorganization, such changes in the organization are associated with lower levels of utilization of knowledge and skills in general, particularly in northern and southern Europe. We saw that in those regions there was a lower demand for mastery of one’s own field or discipline following a reorganization. Perhaps reorganizations increase the need for teamworking, stress management and the like, but actually decrease the need for knowledge and other cognitive abilities, resulting in a net decrease in utilization. The organizational characteristic that showed the strongest effects on the required level of competences was the extent of innovation, and this also shows the clearest impact on utilization in general. This is particularly the case in northern and southern Europe, but also in the NCMS the effect is quite strong. We already saw that both the managerial and the professional character of jobs has very strong effects on required competences, and these also show very strong effects on utilization in all three regions. Interestingly, whereas innovation at the job level had relatively little impact on individual competences, it does have a much clearer effect on utilization of knowledge and skills in general, especially in the NCMS. This result may go some way towards shedding light on the puzzle we were faced with earlier, namely that innovation at the organization level increased the demand for specific competences, while the role played by graduates in actually introducing those innovations (the job-level effect) showed little effect. It is plausible that graduates involved in introducing innovations make use of competences other than those included in the analysis, especially aspects such as the ability to come up with new ideas and solutions and the willingness to question one’s own and others ideas. It is conceivable that the situation in strongly innovative organizations is very fluid, requiring the staff in general to be strong in terms of management skills, teamworking, computer skills and professional expertise, but that the competences required of those actually doing the innovating lie mainly in the more abstract and creative domain. In contrast to the results for individual competences, the private services sector does not emerge as the sector in which knowledge and skills are most strongly utilized. In the NCMS and northern Europe utilization is slightly lower in industry and agriculture, but the difference is much smaller than the effects on individual competences suggested. More strikingly, whereas the public services and administration sector showed rather low utilization of some individual competences, in general it shows the strongest level of utilization of knowledge and skills. Whereas we saw rather mixed effects of occupational groups, in the case of utilization the pattern of effects is very similar in all three regions. Although the size of the effects varies somewhat, in all three regions the different categories of professionals all show clearly higher levels of utilization in all three regions than the reference category technicians and associate professionals, and in all three regions the ‘other occupations’ score very much lower. There is a slight difference in terms of the position of managers, with this group scoring slightly higher than the reference category in the NCMS, slightly lower in northern Europe, and not significantly different in southern Europe. In sum, the conclusion seems to be that there is not much difference between managers and technicians/associate professionals in terms of utilization. On closer inspection, the differences between some of the groups of professionals is larger, with teaching professionals showing the highest levels of utilization in the NCMS and Life science and health professionals scoring highest in northern Europe. It is striking that the penalty in terms of underutilization for working in the lower level ‘other occupations’ is most severe in southern Europe.
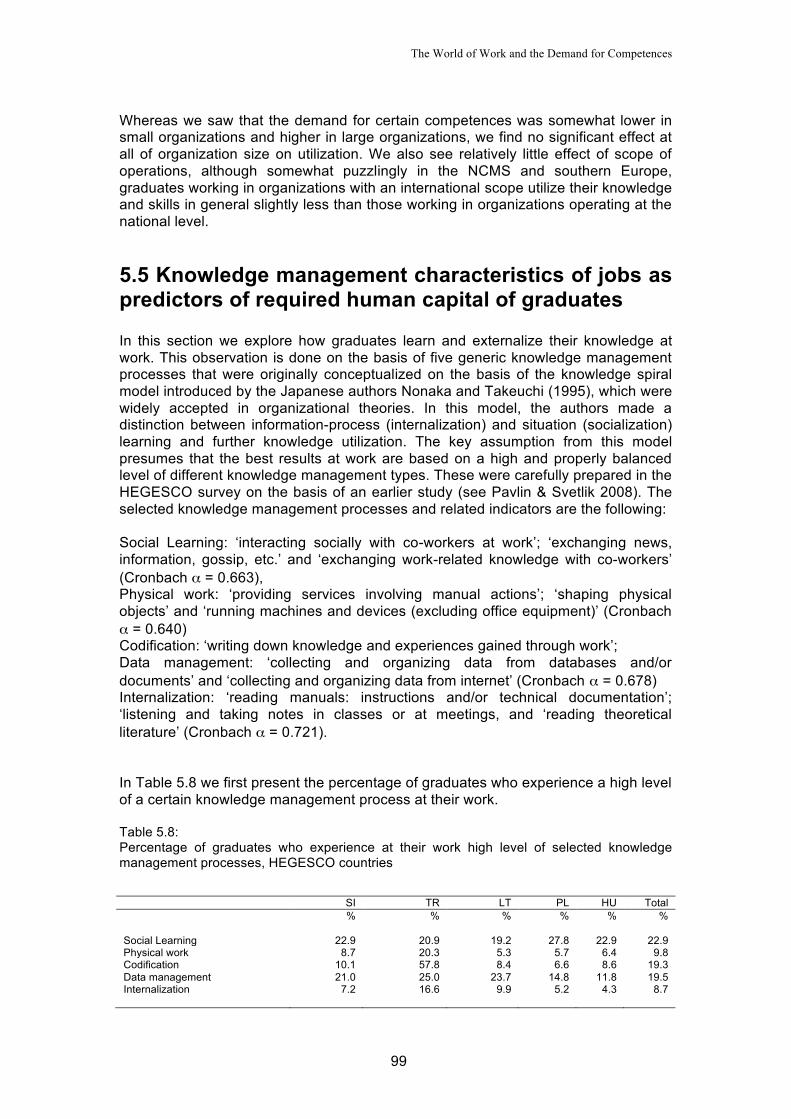
The World of Work and the Demand for Competences
99
Whereas we saw that the demand for certain competences was somewhat lower in small organizations and higher in large organizations, we find no significant effect at all of organization size on utilization. We also see relatively little effect of scope of operations, although somewhat puzzlingly in the NCMS and southern Europe, graduates working in organizations with an international scope utilize their knowledge and skills in general slightly less than those working in organizations operating at the national level.
5.5 Knowledge management characteristics of jobs as predictors of required human capital of graduates In this section we explore how graduates learn and externalize their knowledge at work. This observation is done on the basis of five generic knowledge management processes that were originally conceptualized on the basis of the knowledge spiral model introduced by the Japanese authors Nonaka and Takeuchi (1995), which were widely accepted in organizational theories. In this model, the authors made a distinction between information-process (internalization) and situation (socialization) learning and further knowledge utilization. The key assumption from this model presumes that the best results at work are based on a high and properly balanced level of different knowledge management types. These were carefully prepared in the HEGESCO survey on the basis of an earlier study (see Pavlin & Svetlik 2008). The selected knowledge management processes and related indicators are the following: Social Learning: ‘interacting socially with co-workers at work’; ‘exchanging news, information, gossip, etc.’ and ‘exchanging work-related knowledge with co-workers’ (Cronbach α = 0.663), Physical work: ‘providing services involving manual actions’; ‘shaping physical objects’ and ‘running machines and devices (excluding office equipment)’ (Cronbach α = 0.640) Codification: ‘writing down knowledge and experiences gained through work’; Data management: ‘collecting and organizing data from databases and/or documents’ and ‘collecting and organizing data from internet’ (Cronbach α = 0.678) Internalization: ‘reading manuals: instructions and/or technical documentation’; ‘listening and taking notes in classes or at meetings, and ‘reading theoretical literature’ (Cronbach α = 0.721). In Table 5.8 we first present the percentage of graduates who experience a high level of a certain knowledge management process at their work. Table 5.8: Percentage of graduates who experience at their work high level of selected knowledge management processes, HEGESCO countries
SI TR LT PL HU Total % % % % % % Social Learning 22.9 20.9 19.2 27.8 22.9 22.9 Physical work 8.7 20.3 5.3 5.7 6.4 9.8 Codification 10.1 57.8 8.4 6.6 8.6 19.3 Data management 21.0 25.0 23.7 14.8 11.8 19.5 Internalization 7.2 16.6 9.9 5.2 4.3 8.7

Competencies and Early Labour Market Careers of Higher Education Graduates in Europe
100
From the table we can see that the proportion of graduates with a high level of social learning activity is similar. On average, more than one out of five graduates experiences a high intensity of this job trait. Turkey shows a far higher prevalence of physical work than the other countries, with one in five Turkish graduates reporting a high intensity on this trait compared to far less than one in ten in all other countries. Turkish graduates show an exceptionally high level of codification, which in the survey was limited only to the observation of writing knowledge and the result of work. Well over half of all Turkish graduates show a high level of this knowledge management activity, compared to a tenth or less of graduates in other countries. The difference between Turkey and the other countries on this indicator is so great that we suspect that the question has been understood differently by Turkish graduates. For this reason, this indicator has been excluded from the subsequent analyses in this chapter. Data management, electronic or by other means, characterizes the job of every fifth graduates, with the highest proportion seen in Turkey (around a quarter) and the lowest in Hungary (around one in eight). Lastly, we look at internalization. This type of learning most closely resembles the prevailing learning type in higher education, but in the world of work less than one in ten graduates are engaged in such activities to a high extent. Turkey is again the country with the highest level of intensity on this activity. Each of the five types of knowledge management types in itself provides indicative information for exploring knowledge requirements at work. However, looking at them as a means or context of knowledge creation they can be considered as an additional dimension of job characteristics. Using the regression analysis presented in Table 5.9 we explore to what extent knowledge management process at work impact the demand for competences and the utilization of knowledge and skills in general. In the analyses we control for the effects described in the previous section.
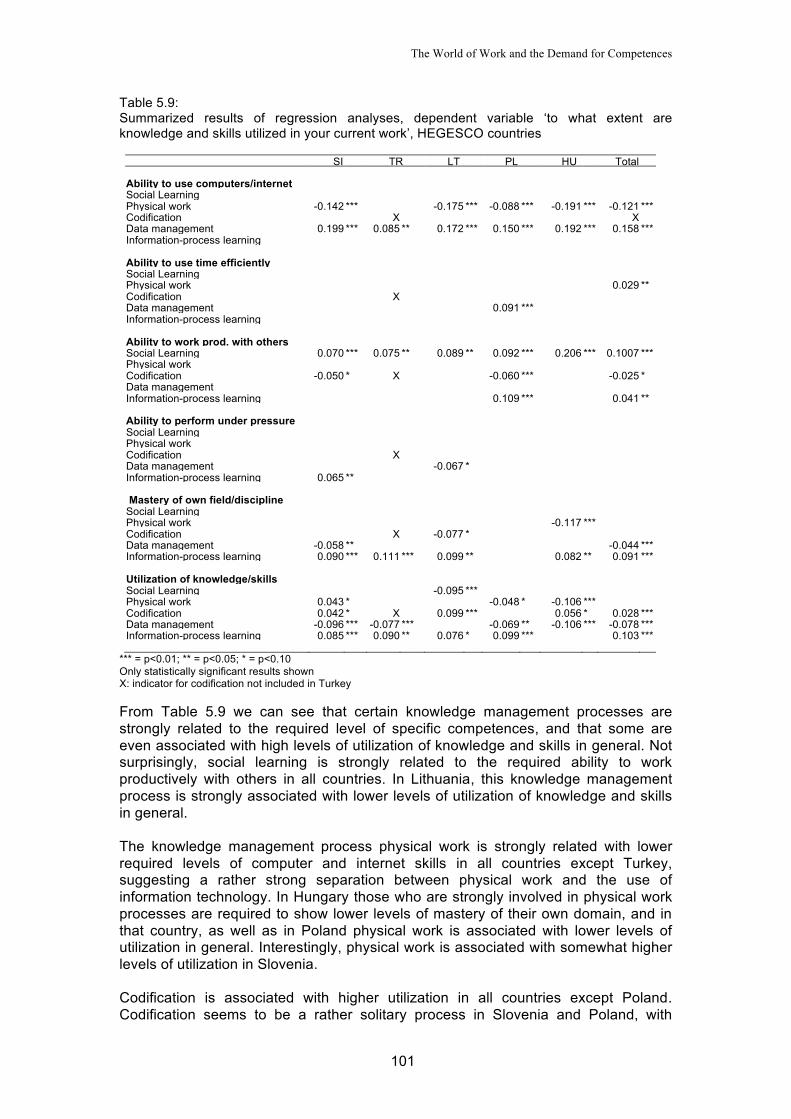
The World of Work and the Demand for Competences
101
Table 5.9: Summarized results of regression analyses, dependent variable ‘to what extent are knowledge and skills utilized in your current work’, HEGESCO countries
SI TR LT PL HU Total Ability to use computers/internet Social Learning Physical work -0.142 *** -0.175 *** -0.088 *** -0.191 *** -0.121 *** Codification X X Data management 0.199 *** 0.085 ** 0.172 *** 0.150 *** 0.192 *** 0.158 *** Information-process learning Ability to use time efficiently
Social Learning Physical work 0.029 ** Codification X Data management 0.091 *** Information-process learning Ability to work prod. with others Social Learning 0.070 *** 0.075 ** 0.089 ** 0.092 *** 0.206 *** 0.1007 *** Physical work Codification -0.050 * X -0.060 *** -0.025 * Data management Information-process learning 0.109 *** 0.041 ** Ability to perform under pressure Social Learning Physical work Codification X Data management -0.067 * Information-process learning 0.065 ** Mastery of own field/discipline Social Learning Physical work -0.117 *** Codification X -0.077 * Data management -0.058 ** -0.044 *** Information-process learning 0.090 *** 0.111 *** 0.099 ** 0.082 ** 0.091 *** Utilization of knowledge/skills Social Learning -0.095 *** Physical work 0.043 * -0.048 * -0.106 *** Codification 0.042 * X 0.099 *** 0.056 * 0.028 *** Data management -0.096 *** -0.077 *** -0.069 ** -0.106 *** -0.078 *** Information-process learning 0.085 *** 0.090 ** 0.076 * 0.099 *** 0.103 ***
*** = p<0.01; ** = p<0.05; * = p<0.10 Only statistically significant results shown X: indicator for codification not included in Turkey From Table 5.9 we can see that certain knowledge management processes are strongly related to the required level of specific competences, and that some are even associated with high levels of utilization of knowledge and skills in general. Not surprisingly, social learning is strongly related to the required ability to work productively with others in all countries. In Lithuania, this knowledge management process is strongly associated with lower levels of utilization of knowledge and skills in general. The knowledge management process physical work is strongly related with lower required levels of computer and internet skills in all countries except Turkey, suggesting a rather strong separation between physical work and the use of information technology. In Hungary those who are strongly involved in physical work processes are required to show lower levels of mastery of their own domain, and in that country, as well as in Poland physical work is associated with lower levels of utilization in general. Interestingly, physical work is associated with somewhat higher levels of utilization in Slovenia. Codification is associated with higher utilization in all countries except Poland. Codification seems to be a rather solitary process in Slovenia and Poland, with
Competencies and Early Labour Market Careers of Higher Education Graduates in Europe
102
graduates spending a lot of time on such activities being required to show lower levels of ability to work productively with others. In Lithuania, this activity is strongly associated with lower levels of mastery. Data management is strongly associated with higher required levels of computer and internet skills in all countries, but in other respects seems to decrease rather than increase demand for high-level competences. In all countries except Poland this activity is associated with lower levels of utilization of knowledge and skills in general. Other effects are specific to particular competences in particular countries. The data management activity that is most strongly associated with high levels of mastery of one’s own field or discipline is internalization or information-process learning. In all countries except Poland this effect is very strong. There is also a strong effect in all countries except Poland on overall utilization of knowledge and skills.
5.6 Conclusions Graduates in all countries work mostly in service organizations, and relatively rarely in industry or agriculture. Most work as professionals, although the proportion of managers is also quite high in the NCMS. The graduate labour market is most strongly professionalized in Italy, Germany and Austria, and least in the Baltic States Estonia and Lithuania. The public services and administration sector is strongly professionalized in all countries. Although in most countries graduates are most often employed in large organizations, many graduates in the NCMS are employed in medium sized organizations. A large proportion of graduates work in organizations that have an international scope of operations. Private sector organizations employing higher education graduates are subject to intense competition, which more often than not is based on quality rather than price. Even in the public sector, strong competition is not uncommon, and this competition is even more strongly quality based than in the private sector. The working environment of graduates is also quite volatile, with frequent reorganizations in most countries. Particularly in the private sector, reorganizations are rather common, while in some countries a sizable proportion of organizations are also faced with unstable demand. Graduates in the NCMS are exposed to a less volatile working environment on average than their peers in the northern and southern European REFLEX countries. A large proportion of graduates work in innovative organizations, particularly in the private sector. Of the NCMS, Hungary emerges as a country with relatively little private-sector innovation, and Turkey as a country where private firms employing higher education graduates innovate a lot. Even in the public and non-profit sectors there is substantial innovation in most countries, although clearly less so than in private sector. Hungary and Poland are among the countries with relatively little innovation in the public and non-profit sectors, while Turkey again belongs to the group of highly innovative countries. In the private sector, and to a lesser extent in the public and non-profit sectors, a large proportion of graduates report that their organization is at the forefront when it comes to adopting innovations. Both public and private sector organizations in Poland are relatively unlikely to be at the forefront when it comes to innovations, while Estonia and the Czech Republic are among the most innovative countries in this respect. Although, as we saw, Turkish organizations
The World of Work and the Demand for Competences
103
are very active in introducing innovations, they are more likely to follow the lead of others than to be at the forefront themselves. In most countries, a high proportion of graduates report that a high extent of innovation in terms of knowledge or methods. In contrast to the other two types of innovation, there is no strong distinction between the private sector and the public and non-profit sectors in terms of the extent of this kind of innovation. Again, the NCMS do not form a coherent cluster. Slovenia is together with Finland and the UK highly innovative in this respect, while Hungary and France are least innovative. Innovative organizations rely heavily on higher education graduates for the introduction of their innovations. This applies especially to innovations in terms of knowledge and methods, and least for technology tools and instruments. There are few differences between countries in the proportion of graduates working in innovative organizations that are involved in introducing innovations. In most countries, almost all managers report that they set their own goals, and a large proportion of managers also shoulders responsibility for setting goals for their organization. Not surprisingly, professionals and those employed in other occupations are less likely to take on these typical managerial responsibilities. With the exception of Estonia, graduates in the NCMS are relatively unlikely to be responsible for setting their own goals. Poland and Hungary belong to the group of countries where even many managers do not take on either form of responsibility. A high proportion of graduates in most countries act as professional experts in their organization by sharing their own professional knowledge with colleagues, and many also act as knowledge brokers by establishing contacts with external experts. Contrary to expectations however, it is managers rather than professionals who play this role most often. The high score of managers on these indicators is not so surprising, since they must furnish their colleagues and subordinates with the knowledge they need to carry out their duties. More surprising is the relatively low proportion of professionals who play such a role. This may indicate that the work of professionals is more solitary, applying high levels of professional knowledge mainly in the execution of one’s own work, and only to a lesser extent in facilitating the work of colleagues. Austrian and Turkish graduates are most likely to play the role of professional experts, while Dutch, Belgian, Finnish and Hungarian graduates are relatively unlikely to do so. The organizational characteristic that shows the strongest effects on the required level of competences is the extent of innovation. The observed effects suggest that innovative organizations seek to make use of the skills of high level professionals working closely together using the latest information technology, and need graduates who can produce results quickly when the pressure is on. Working in a competitive environment also provides a strong boost for the demand for graduates’ competences, particularly management competences. Paradoxically, among other things competition also increases the need for teamwork, especially in the NCMS. Surprisingly, the effects of quality orientation – the degree to which competition is based on quality rather than price – are less pronounced than those of strength of competition, although this does increase the demand for some competences, especially in the NCMS and northern Europe. The volatility of the work environment has only a limited effect of the demand for competences, with instability of demand being related to somewhat lower demand for some competences in the NCMS, and reorganizations being associated with a slight increase in the demand for some competences particularly in northern Europe.
Competencies and Early Labour Market Careers of Higher Education Graduates in Europe
104
Both the managerial and the professional character of jobs have very strong effects on required competences. The effects of the professional character are generally slightly stronger, with the exception of time management skills, which depends more on the managerial character of jobs. It is however striking that the professional character of jobs also has a moderate to strong effect on the demand for this archetypal managerial competence, while the managerial character of jobs has an effect on required mastery of one’s own field or discipline, which one would think was pre-eminently the domain of professionals. In contrast to the very strong effects of the managerial and professional character of jobs, innovation at the job has very little effect on any of the competences. This seems to suggest that innovative firms are extremely focused on deploying high-level competences, but do not thereby draw a strong distinction between those actually involved in introducing innovations and those who are not involved. The results of the analysis of the utilization on knowledge and skills in general resemble in some respects those for the required level of selected competences, although there are some clear differences. The organizational characteristic that showed the strongest effects on the required level of competences was the extent of innovation, and this also shows the clearest impact on utilization in general. Similarly, the strong effects of the managerial and the professional character of jobs has very strong effects on required competences is also reflected in their effects on utilization. However, where we saw that competition provides a strong boost for the required level of specific competences, its effect on the overall utilization of knowledge and skills is rather modest, while the effects of quality orientation of competition come through more strongly in terms of overall utilization than in the required level of specific competences. Volatility of the work environment in the form of unstable demand and reorganizations is generally related to lower levels of utilization. Interestingly, whereas innovation at the job level had relatively little impact on individual competences, it does have a much clearer effect on utilization of knowledge and skills in general, especially in the NCMS. It may be that graduates involved in introducing innovations mainly need to be creative, but do not need to be particularly adept in the competences included in the analyses. In general, the discrepancies between the results of the analyses for individual competences and those for utilization of knowledge and skills suggest that different underlying competences may be driving the results. In the five countries that participated in the HEGESCO project, the time spent on a range of knowledge management activities was asked of graduates. The resulting information was used to construct five dimensions of knowledge management. In general, graduates were most often engaged in social learning - involving various forms of social interaction and knowledge exchange with co-workers - and in data management. Much less time was spent on physical work, codification – involving the recording of work-related knowledge and experiences - and internalization. The latter is the activity that most closely resembles the prevailing learning type in higher education. Some clear effects of these knowledge management activities on both the demand for competences and the utilization of knowledge and skills were observed. Social learning is strongly related to required teamworking abilities in all countries. Physical work is strongly related to lower required levels of computer and internet skills. Codification emerges as an important factor related to demand for and utilization of competences in Turkey, showing strong effects on required computer and internet skills, time management skills and mastery of one’s own field or discipline, as well as on the utilization of knowledge and skills in general. It is interesting that this activity shows such clear effects in Turkey, where the time spent on codification is much
The World of Work and the Demand for Competences
105
higher than in other countries. Data management is strongly associated with higher required levels of computer and internet skills in all countries, but in other respects seems to decrease rather than increase demand for high-level competences, also decrease the overall level of utilization of knowledge and skills. The data management activity that is most strongly associated with high levels of mastery of one’s own field or discipline is internalization or information-process learning, and this activity also has a strong effect on overall utilization of knowledge and skills.


Country Patterns of Labour Market Entry and Early Career
107
Chapter 6 Country Patterns of Labour Market Entry and Early Career Peter Robert
6.1 Introduction
The aim of this chapter is to search for typical “combinations” of countries in terms of graduates’ labour market entry and early career experiences. To achieve this goal, the analysis will basically follow the following steps: 1) Dimensions are chosen that represent labour market entry and early career processes; 2) Indicators are selected or constructed that represent the given dimension; 3) A statistical procedure is performed to detect the typical combinations that express certain common patterns and place the countries in the same group on that basis. The country groups will be constructed by the method of cluster analysis. This type of analysis is in accordance with some previously existing examples. First of all, we should mention the related work by Marcus Gangl, who investigated labour market entry process in several European societies and defined clusters of countries based on various characteristics (Gangl 2001. 2003a). While Gangl concentrated only on the old EU-member states, the post-communist countries and new EU-member states were chiefly investigated by Saar et al. (2008) and Unt (2007). Furthermore, a specific project also focusses on the peculiarities of these societies (Kogan et al. 2008). Results from these studies will be discussed briefly below, as these will serve as a prototype for the present analysis. The text continues with the description of the dimensions and indicators (variables) used, and the method of analysis is also briefly explained. The main part of the chapter comprises the results, describing the groupings of the countries along the lines of the various dimensions in the process of labour market entry and early career. The chapter ends with an elaborate discussion of the findings.
6.2 Grouping countries: on what basis? Based on the existing literature, two mechanisms for grouping countries can be identified: the first one builds on the connection between the educational system and the labour market and the second one deals with employment protection legislation. Regarding the first approach of grouping countries, scholars have traditionally contrasted internal labour markets (ILM) with occupational labour markets (OLM).
Competencies and Early Labour Market Careers of Higher Education Graduates in Europe
108
Marsden (1999) combines this distinction with a second one, namely that between the production and training approaches. The training approach relies on comprehensible signals about job seekers that firms operating in an OLM can use to fill vacancies. This approach is cost efficient for firms because they need not to bear such high expenses for training. Better signalling can reduce search costs for employees as well (Spence 1974). If employers cannot rely on OLM, they will create ILM and turn to the production approach. Alternate terms for the same distinction are the organizational and qualificational mobility spaces (Maurice et al. 1986, Müller and Shavit 1998). The latter type (qualificational space or OLM) is structured predominantly along the corresponding tracks of vocational training in the national educational system. The former type (organizational space or ILM) refers to those countries that cannot rely on employment related training systems, where the level of vocational specificity is lower and where, consequently, the training of the workforce is tied to the internal labour markets in the firms. Under the conditions of OLM, labour market entry is expected to be faster and the match between qualifications and jobs is expected to be better (Allmendinger 1989). An earlier research project on this topic (CATEWE) suggested that national systems for school-to-work transition formed a single continuum, with countries like Germany at one end of the scale having strong occupational labour markets, standardized and track-differentiated education systems, and strong links between education and the labour market. Countries like the United Kingdom and Ireland at the other end of the continuum are dominated by internal labour markets, with less standardized and less differentiated education systems, weaker links between education and the labour market and little formal work-based training (Smyth et al. 2001). However, when testing this concept in a more detailed manner, Gangl (2001, 2003a) went beyond the dichotomy and described three clusters of EU-15 countries with regard to patterns of labour market entry. A first group comprises a set of countries with extensive vocational training systems and occupational labour markets (Austria, Germany, Denmark and the Netherlands). A second group includes the rest of the Western and Northern European nations but also Spain, with an emphasis on general education and a more pronounced internal labour market organization, where allocation predominantly relies on experience. Finally, Italy, Portugal, and Greece form the third group as a separate Southern European cluster with strong qualification and strong experience effects at the same time, and where unemployment risk is high in the early career and mobility is scarce but stability is high once initial employment has been secured. Regarding the new EU-member states, the OLM versus ILM distinction is obviously a relevant approach. The targeted studies on these countries found that Slovenia, the Czech Republic and Poland are closer to the OLM end, while Estonia, Lithuania and Hungary are closer to the ILM end of the continuum (Kogan et al. 2008). It is important to keep in mind that earlier research on school-to-work transition cited above referred to a broader population of school leavers and was not restricted to higher education graduates. Nevertheless, the variation in the degree of vocational specificity or of educational signalling is generally not limited to secondary education, but holds for higher education to some extent as well. Tertiary education in the countries with an OLM reveals features of the vocational versus academic duality, while the linear type of higher education in accordance with the so-called Bologna system is traditionally more characteristic for the countries with ILM. The second approach, based on employment protection legislation (EPL), is expected to affect both labour market entry and further mobility of new entrants out of
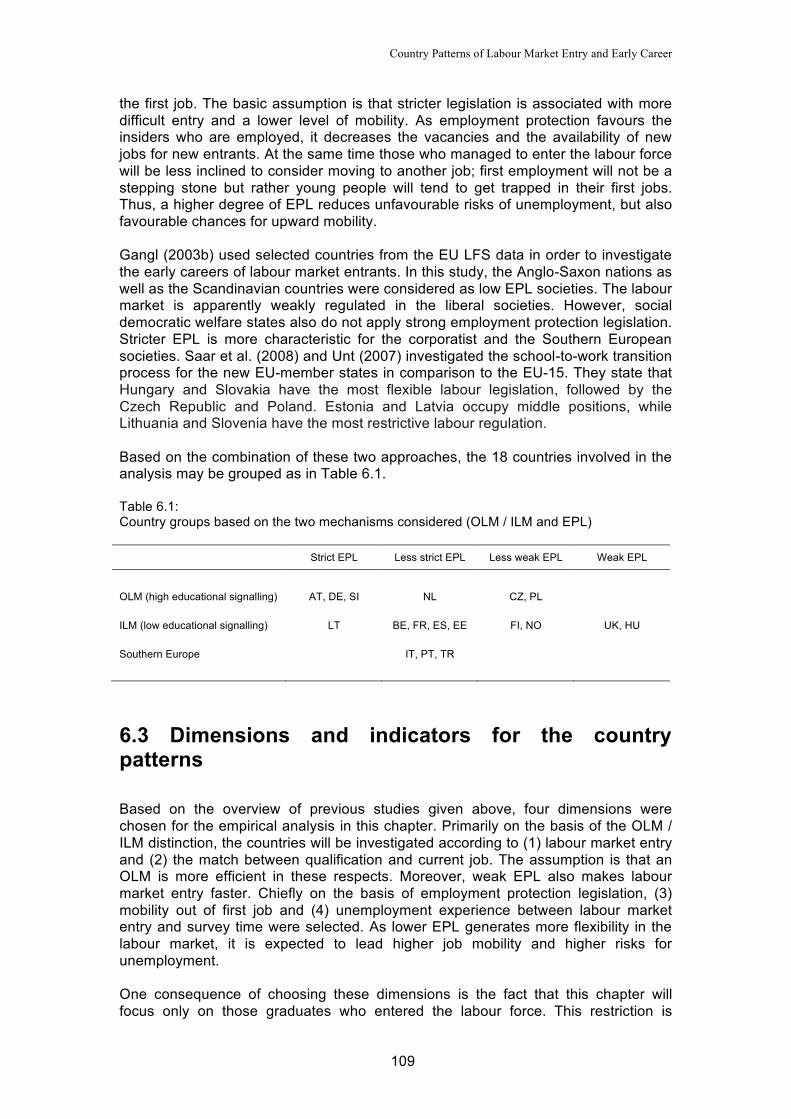
Country Patterns of Labour Market Entry and Early Career
109
the first job. The basic assumption is that stricter legislation is associated with more difficult entry and a lower level of mobility. As employment protection favours the insiders who are employed, it decreases the vacancies and the availability of new jobs for new entrants. At the same time those who managed to enter the labour force will be less inclined to consider moving to another job; first employment will not be a stepping stone but rather young people will tend to get trapped in their first jobs. Thus, a higher degree of EPL reduces unfavourable risks of unemployment, but also favourable chances for upward mobility. Gangl (2003b) used selected countries from the EU LFS data in order to investigate the early careers of labour market entrants. In this study, the Anglo-Saxon nations as well as the Scandinavian countries were considered as low EPL societies. The labour market is apparently weakly regulated in the liberal societies. However, social democratic welfare states also do not apply strong employment protection legislation. Stricter EPL is more characteristic for the corporatist and the Southern European societies. Saar et al. (2008) and Unt (2007) investigated the school-to-work transition process for the new EU-member states in comparison to the EU-15. They state that Hungary and Slovakia have the most flexible labour legislation, followed by the Czech Republic and Poland. Estonia and Latvia occupy middle positions, while Lithuania and Slovenia have the most restrictive labour regulation. Based on the combination of these two approaches, the 18 countries involved in the analysis may be grouped as in Table 6.1. Table 6.1: Country groups based on the two mechanisms considered (OLM / ILM and EPL) Strict EPL Less strict EPL Less weak EPL Weak EPL
OLM (high educational signalling) AT, DE, SI NL CZ, PL
ILM (low educational signalling) LT BE, FR, ES, EE FI, NO UK, HU
Southern Europe IT, PT, TR
6.3 Dimensions and indicators for the country patterns
Based on the overview of previous studies given above, four dimensions were chosen for the empirical analysis in this chapter. Primarily on the basis of the OLM / ILM distinction, the countries will be investigated according to (1) labour market entry and (2) the match between qualification and current job. The assumption is that an OLM is more efficient in these respects. Moreover, weak EPL also makes labour market entry faster. Chiefly on the basis of employment protection legislation, (3) mobility out of first job and (4) unemployment experience between labour market entry and survey time were selected. As lower EPL generates more flexibility in the labour market, it is expected to lead higher job mobility and higher risks for unemployment. One consequence of choosing these dimensions is the fact that this chapter will focus only on those graduates who entered the labour force. This restriction is
Competencies and Early Labour Market Careers of Higher Education Graduates in Europe
110
important in the light of the existing literature where the rising unemployment risk among young labour market entrants is an important feature (Gangl 2002, Kogan et al. 2007). It also holds that the present analysis deals with a “selected” group of graduates. Thus, the comparative analysis of those who succeeded and did not succeed to enter the labour force is regarded as a different task. (1) Labour market entry is investigated from the viewpoint of easiness and fastness of the process. For this purpose, two features of the process are considered. The transition from school to work appears to differ characteristically between those who started to work already before graduation and those who entered the labour market only after receiving a diploma. A further significant attribute of the entry process is the length of time graduates needed to find a job. This is measured in months, and the resulting indicator is defined as a job search requiring longer than 6 months.16 Summing up, entering the labour force before graduation and spending less time on finding a job after graduation are considered to be signs of a fast and easy labour market entry – although we cannot rule out the possibility that other unobserved aspects may play a role as well. (2) The match between qualification and job is one of the most important research issues connected to the process of educational expansion, which is thought to lead to a decline in the signalling function of degrees. Interest in this topic is older in some countries and more recent in others, but it probably started in the US. Various terms are used to describe the same phenomenon, such as over-education (Freeman 1976) and underemployment (Livingstone 1998). Some authors speak about a performance gap between educational attainment and job requirements; others use the term of credential gap when entry requirements to certain jobs do not fit to qualifications. It is customary to make a distinction between an objective and a subjective approach to underemployment or over-education. In this chapter we focus on the current job17 and use four indicators. The first indicator constructed to illustrate a bad match is the proportion of graduates who work in ISCO major groups 3 to 9. ISCO major groups 1 (Legislators, senior officials and managers) and 2 (Professionals) are usually seen as the core occupational domain of higher education graduates. It is assumed that graduates working in other jobs than these ones are likely to be underemployed. 18 While this indicator may express a credential gap or objective underemployment, the next one refers to subjective underemployment. Respondents were asked to characterize the type of education they felt most appropriate for the work in their current job. One answer category was lower than higher education. The proportion of graduates in this category is regarded as a sign of over-education. Graduates were also asked whether the field of their study was appropriate to their work. In this case the percentage of “exclusively own field” was selected as an indicator of good match between qualification and current job. Finally, a 5-point scale ranging between “not at all (1)” and “to a very high extent (5)” was used to estimate how much knowledge and skills were utilized in the work. Answer codes 1-3 are regarded as expressing underutilization of skills. This is the fourth indicator to be used in the analysis.
16 This variable is set at 0 for those who started to work before graduation. 17 We also considered looking at first job, but decided against this on the grounds that first jobs are frequently transient and underemployment would have probably been overestimated. In the case of the current occupation, some graduates are still the first job, while others have already left their first job. This difference is taken on board by a separate dimension in the chapter. 18 Labels for ISCO major group 3-9 are as follows: 3: Technicians and associate professionals; 4: Clerks; 5: Service workers and shop and market sales workers; 6: Skilled agricultural and fishery workers; 7: Craft and related trades workers; 8: Plant and machine operators and assemblers; 9: Elementary occupations. It is assumed that a diploma from higher education will not be a typical requirement for employment in these jobs.
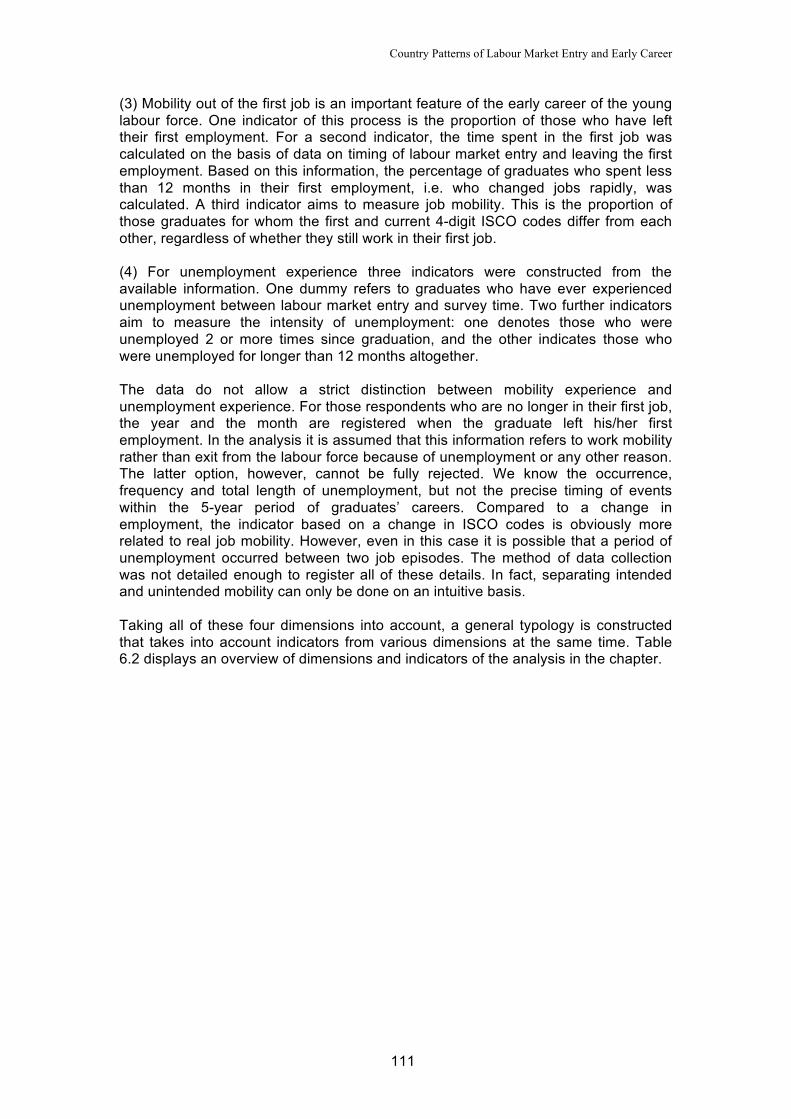
Country Patterns of Labour Market Entry and Early Career
111
(3) Mobility out of the first job is an important feature of the early career of the young labour force. One indicator of this process is the proportion of those who have left their first employment. For a second indicator, the time spent in the first job was calculated on the basis of data on timing of labour market entry and leaving the first employment. Based on this information, the percentage of graduates who spent less than 12 months in their first employment, i.e. who changed jobs rapidly, was calculated. A third indicator aims to measure job mobility. This is the proportion of those graduates for whom the first and current 4-digit ISCO codes differ from each other, regardless of whether they still work in their first job. (4) For unemployment experience three indicators were constructed from the available information. One dummy refers to graduates who have ever experienced unemployment between labour market entry and survey time. Two further indicators aim to measure the intensity of unemployment: one denotes those who were unemployed 2 or more times since graduation, and the other indicates those who were unemployed for longer than 12 months altogether. The data do not allow a strict distinction between mobility experience and unemployment experience. For those respondents who are no longer in their first job, the year and the month are registered when the graduate left his/her first employment. In the analysis it is assumed that this information refers to work mobility rather than exit from the labour force because of unemployment or any other reason. The latter option, however, cannot be fully rejected. We know the occurrence, frequency and total length of unemployment, but not the precise timing of events within the 5-year period of graduates’ careers. Compared to a change in employment, the indicator based on a change in ISCO codes is obviously more related to real job mobility. However, even in this case it is possible that a period of unemployment occurred between two job episodes. The method of data collection was not detailed enough to register all of these details. In fact, separating intended and unintended mobility can only be done on an intuitive basis. Taking all of these four dimensions into account, a general typology is constructed that takes into account indicators from various dimensions at the same time. Table 6.2 displays an overview of dimensions and indicators of the analysis in the chapter.

Competencies and Early Labour Market Careers of Higher Education Graduates in Europe
112
Table 6.2: Dimensions and indicators for country clustering Labour market entry Mismatch Mobility experience Unemployment
experience General typology
1 Length of job search: over 6 months
Working in a job that does not require a
HE diploma Left first employment Unemployed ever Length of job search:
over 6 months
2 LM entry before graduation
Feeling of being overeducated
Spent less than 12 months in first employment
Unemployed more than 2 times Unemployed ever
3
Feeling that field of study fits exactly to
the job
First and current job differ
Unemployed longer than 12 months
Working in a job that does not require a
HE diploma
4 Feeling that skills are underutilized Feeling of being
overeducated
5 Feeling that skills are underutilized
6.4 Country patterns The findings of the analysis are presented in five sections. Each section includes a so-called dendogram, which is a graphical representation of the clustering procedure. Cluster analysis starts from 18 cases (each country represents itself) and the dendogram displays how countries that are more similar and closer to each other will be grouped together. This grouping process ends when all 18 countries are united. The other information presented for each dimension is one cluster solution with a given number of the clusters. The name of the countries is listed for each cluster and the differences between the clusters are interpreted on the ground of differences by the given indicators.
6.4.1 Labour market entry According to the dendogram in Figure 6.1, there are clear groups of countries that are similar and close to each other with respect to the labour market entry indicators: UK, Portugal and Italy; France, Germany and Belgium; Austria, The Czech Republic and Poland; Finland, Lithuania and Estonia. Slovenia turns out to be similar to this latter group of three countries; then these four nations turn out to be definitely different from the rest and remain a separate cluster according to the dendogram. Spain, Hungary and Turkey seem to be another separate cluster where countries are similar to each other but rather different from the rest. In a sense all the other countries are closer to each other and can be clustered together by the method. Nevertheless, it is worthwhile and possible to show some differences among them, too. The preferred cluster solution is presented in Table 6.3 together with the selected indicators for characterizing labour market entry. It looks that one separate cluster of the countries involves those where graduates faced difficulties for labour market entry in terms of the indicators used here. Both the
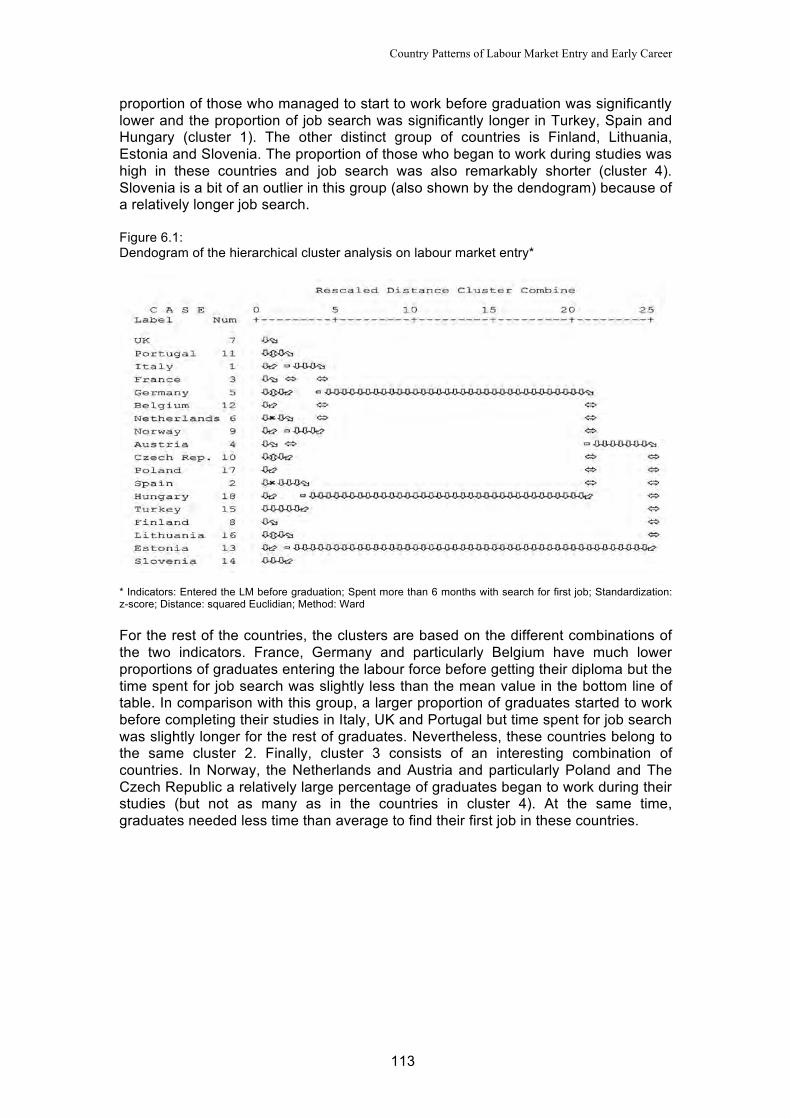
Country Patterns of Labour Market Entry and Early Career
113
proportion of those who managed to start to work before graduation was significantly lower and the proportion of job search was significantly longer in Turkey, Spain and Hungary (cluster 1). The other distinct group of countries is Finland, Lithuania, Estonia and Slovenia. The proportion of those who began to work during studies was high in these countries and job search was also remarkably shorter (cluster 4). Slovenia is a bit of an outlier in this group (also shown by the dendogram) because of a relatively longer job search. Figure 6.1: Dendogram of the hierarchical cluster analysis on labour market entry*
* Indicators: Entered the LM before graduation; Spent more than 6 months with search for first job; Standardization: z-score; Distance: squared Euclidian; Method: Ward For the rest of the countries, the clusters are based on the different combinations of the two indicators. France, Germany and particularly Belgium have much lower proportions of graduates entering the labour force before getting their diploma but the time spent for job search was slightly less than the mean value in the bottom line of table. In comparison with this group, a larger proportion of graduates started to work before completing their studies in Italy, UK and Portugal but time spent for job search was slightly longer for the rest of graduates. Nevertheless, these countries belong to the same cluster 2. Finally, cluster 3 consists of an interesting combination of countries. In Norway, the Netherlands and Austria and particularly Poland and The Czech Republic a relatively large percentage of graduates began to work during their studies (but not as many as in the countries in cluster 4). At the same time, graduates needed less time than average to find their first job in these countries.

Competencies and Early Labour Market Careers of Higher Education Graduates in Europe
114
Table 6.3: Country groups (4 cluster solution) for labour market entry * Clusters Country Entered the LM before graduation Spent more than 6 months with search
for first job % % 1 Hard and slow TR 16 30 ES 15 21 HU 15 17 2a FR 15 08 DE 14 09 BE 06 07 2b IT 16 12 UK 20 11 PT 21 11 3 NO 16 05 NL 22 03 AT 24 07 CZ 29 04 PL 28 09 4 Easy and fast SI 55 12 FI 42 06 LT 46 06 EE 50 05 Total 25 10 * Graduates who have never entered the labour force are left out from the analysis.
6.4.2 Match between qualification and current job The structure of patterns for match between education and current occupation seems to build up from a series of pairing countries together as shown by the first step of the dendogram. Some of these pairs look plausible in the light of the assumptions listed in Table 6.1. For example, France and Estonia at the top of Figure 6.2 both belonged to the ILM and the less strict EPL group. Similarly, it is not surprising that Austria and Germany turn out to be close to each other. The next pair of Finland and Norway happened also to be in the same cell of Table 6.1 for ILM and less weak EPL. Italy and Turkey both represent Southern European nations with less strict EPL, while UK and Hungary were predicted as having low educational signalling and weak EPL. Nevertheless, the full picture is not perfect, as the Czech Republic and Belgium seem to be close to each other, contrary to the dimensions in Table 6.1. The Netherlands and Slovenia also form a pair: though both are OLM countries, the strictness of EPL differs for them. As the clustering of the countries continues, there seem to be four characteristic groups appearing in the end, countries that are closer to each other but dissimilar to the rest. The difference among these clusters in the light of the four indicators is displayed in Table 6.4. There are five countries with a good match where a low proportion of graduates work in jobs not requiring a diploma (ISCO 3-9), few of them feel they are overeducated or have a job where skills are underutilized, and a large proportion of them think that their current job fits exactly to their field of study (cluster 1). Finding Austria and Germany in this cluster is less surprising (though subjective underemployment is quite high in Austria) than the other countries like Estonia, France or Poland. But for example in Poland, where the proportion of graduates who
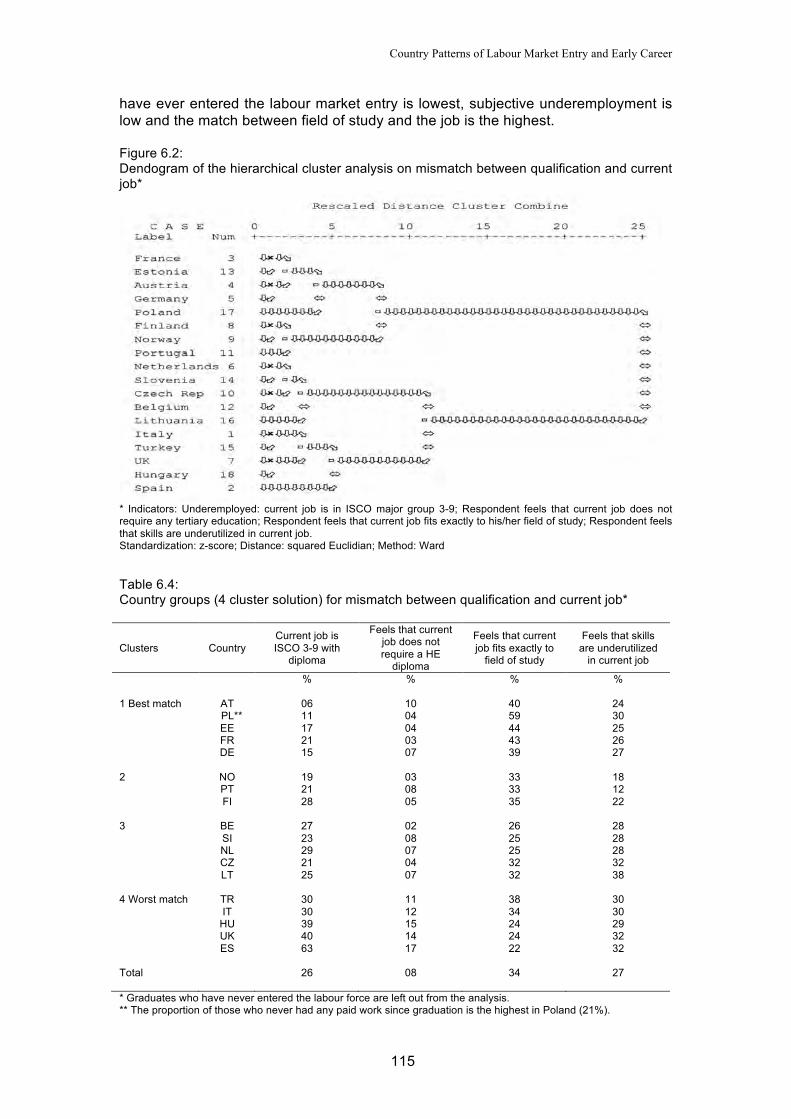
Country Patterns of Labour Market Entry and Early Career
115
have ever entered the labour market entry is lowest, subjective underemployment is low and the match between field of study and the job is the highest. Figure 6.2: Dendogram of the hierarchical cluster analysis on mismatch between qualification and current job*
* Indicators: Underemployed: current job is in ISCO major group 3-9; Respondent feels that current job does not require any tertiary education; Respondent feels that current job fits exactly to his/her field of study; Respondent feels that skills are underutilized in current job. Standardization: z-score; Distance: squared Euclidian; Method: Ward Table 6.4: Country groups (4 cluster solution) for mismatch between qualification and current job*
Clusters Country Current job is ISCO 3-9 with
diploma
Feels that current job does not require a HE
diploma
Feels that current job fits exactly to
field of study
Feels that skills are underutilized
in current job
% % % % 1 Best match AT 06 10 40 24 PL** 11 04 59 30 EE 17 04 44 25 FR 21 03 43 26 DE 15 07 39 27 2 NO 19 03 33 18 PT 21 08 33 12 FI 28 05 35 22 3 BE 27 02 26 28 SI 23 08 25 28 NL 29 07 25 28 CZ 21 04 32 32 LT 25 07 32 38 4 Worst match TR 30 11 38 30 IT 30 12 34 30 HU 39 15 24 29 UK 40 14 24 32 ES 63 17 22 32 Total 26 08 34 27 * Graduates who have never entered the labour force are left out from the analysis. ** The proportion of those who never had any paid work since graduation is the highest in Poland (21%).

Competencies and Early Labour Market Careers of Higher Education Graduates in Europe
116
Cluster 2 includes only three countries and they are not very far away from the first group. This holds particularly for Norway with a very low level of subjective underemployment and a relatively low percentage of graduates who feel that their skills are underutilized. Portuguese graduates score very low on the latter indicator, and it is mainly this that places them in this group together with the two Scandinavian nations. Some inconsistencies in the evaluation of the current occupation seem to be present in the next group of nations (cluster 3). Both objective and subjective underemployment (job does not require a HE diploma) are around or below the mean in the bottom of Table 6.4. At the same time, graduates in some countries like Slovenia, the Netherlands or Belgium feel that the mismatch between field of study and current occupation is greater. In some other countries like Lithuania or the Czech Republic, more graduates feel that their skills are underutilized in their current occupation. The group with the worst match between qualifications and current job includes again five nations with consistent results on the four indicators (cluster 4). Hungary and UK, one of the original pairs, as well as three Mediterranean societies appear in this group. According to the data, graduates in these countries are seriously underemployed in these countries in terms of both the objective and the subjective indicators. Also there is a strong feeling of working in a job where skills are underutilized and which does not fit to the graduates’ field of study (this latter feature holds less for Turkey and Italy.)
6.4.3 Mobility out of first employment / job For the patterns with respect to the mobility chances of graduates, there seems to be a large cluster with as many as eight countries that are close to each other: Finland, Belgium, the Netherlands, Hungary and Poland in one subgroup and France, Austria and Portugal in another – as shown in the lower part of the dendogram in Figure 6.3. Another very distinct group of nations appears at the top of the figure: the Czech Republic and Slovenia, and Italy and Germany. These four countries emerge in the clustering procedure as being very far from the rest. Another unique pair is formed by Estonia and Lithuania, which remains separate from the rest, although the distance is not so big for them as it is for the previous group. The pair of the United Kingdom and Turkey turns to a triad together with Norway, and Spain is the next closest to these countries. The cluster typology for the mobility experiences by the indicators is displayed in Table 6.5. According to the data, the latter group turns out to be the one where graduates seem to be the most mobile, related to a high degree of flexibility in the labour market in these four countries (cluster 1). The percentage of those who left their first employment is at least two-thirds, or even higher as in Spain and the United Kingdom. A similarly high proportion of graduates made a rapid change in these countries, spending less than 12 months in their first employment. The indicator for job mobility between first and current job based on 4-digit ISCO coding is also high in these countries, particularly in Norway indicating a quite transient situation for first jobs among graduates.
Country Patterns of Labour Market Entry and Early Career
117
Figure 6.3: Dendogram of the hierarchical cluster analysis on mobility experience out of first employment / job*
* Indicators: Left first employment; Spent less than 12 months in first employment; Moved to another job; Standardization: z-score; Distance: squared Euclidian; Method: Ward Only Lithuania and Estonia form cluster 2, where job mobility is very high, more than half of the respondents work in a different job five years after graduation than the one they started after entering the labour force. Thus the two Baltic countries and Norway seem to have the most flexible graduate labour market in this respect. A large proportion, two thirds of the degree holders, left first employment as well, but the special feature of the Baltic countries is that the mobility process was slower: the proportion of those who spent less than 12 months in the first job is just above ten percent and far below the overall mean. The next group of countries, in which graduates can be labelled as medium mobiles, consists of the large number of eight nations (cluster 3). The common pattern in these countries is an amount of mobility out of first employment that, although it exceeds half of the graduates in those countries, is around the average over all countries. The time spent in the first employment is close to the overall average as well. Only Portugal turned out to be more mobile regarding first employment. However, the Portuguese graduates seem to be a special case because they are rather strongly immobile in terms of changing jobs. Despite of strong mobility in terms of employment, only one-third of them currently work in a different job than the one they started out in. A low level of job mobility characterizes France and Austria as well: this triad is clearly visible in the dendogram of Figure 6.3. In fact, mobility in terms of employer change and job change seems to coincide in most of the countries, except for these three.
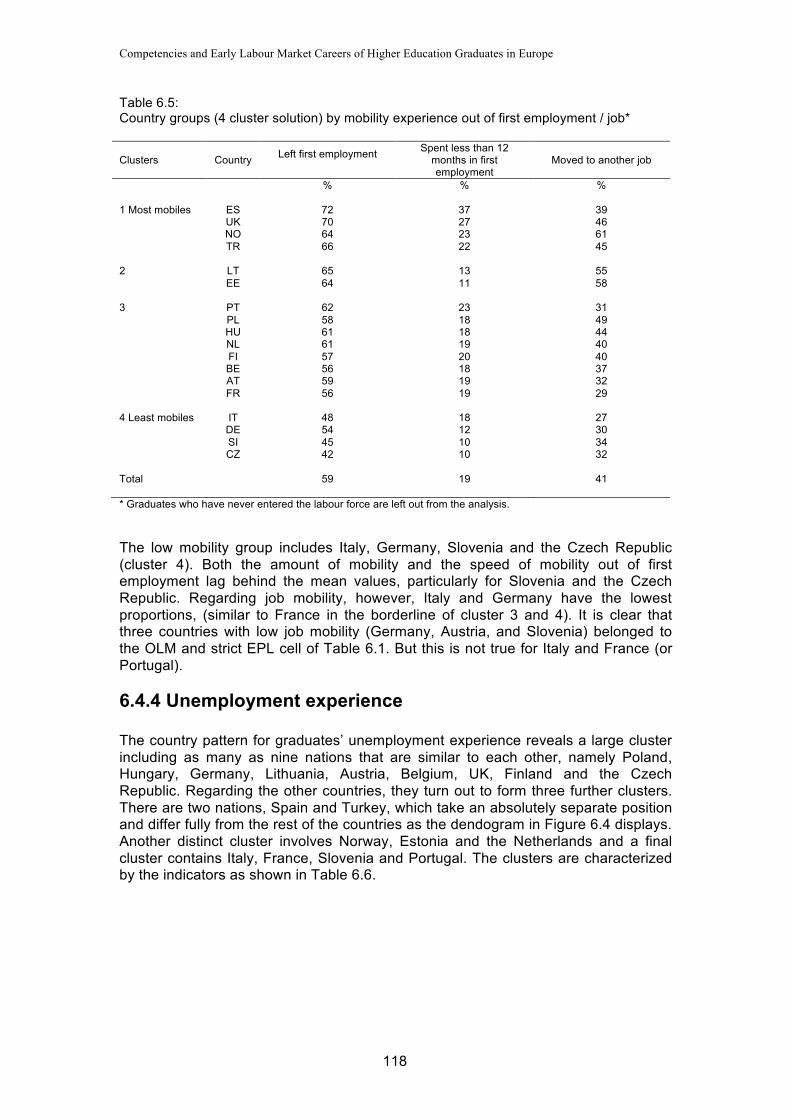
Competencies and Early Labour Market Careers of Higher Education Graduates in Europe
118
Table 6.5: Country groups (4 cluster solution) by mobility experience out of first employment / job*
Clusters Country Left first employment
Spent less than 12 months in first employment
Moved to another job
% % % 1 Most mobiles ES 72 37 39 UK 70 27 46 NO 64 23 61 TR 66 22 45 2 LT 65 13 55 EE 64 11 58 3 PT 62 23 31 PL 58 18 49 HU 61 18 44 NL 61 19 40 FI 57 20 40 BE 56 18 37 AT 59 19 32 FR 56 19 29 4 Least mobiles IT 48 18 27 DE 54 12 30 SI 45 10 34 CZ 42 10 32 Total 59 19 41 * Graduates who have never entered the labour force are left out from the analysis. The low mobility group includes Italy, Germany, Slovenia and the Czech Republic (cluster 4). Both the amount of mobility and the speed of mobility out of first employment lag behind the mean values, particularly for Slovenia and the Czech Republic. Regarding job mobility, however, Italy and Germany have the lowest proportions, (similar to France in the borderline of cluster 3 and 4). It is clear that three countries with low job mobility (Germany, Austria, and Slovenia) belonged to the OLM and strict EPL cell of Table 6.1. But this is not true for Italy and France (or Portugal).
6.4.4 Unemployment experience The country pattern for graduates’ unemployment experience reveals a large cluster including as many as nine nations that are similar to each other, namely Poland, Hungary, Germany, Lithuania, Austria, Belgium, UK, Finland and the Czech Republic. Regarding the other countries, they turn out to form three further clusters. There are two nations, Spain and Turkey, which take an absolutely separate position and differ fully from the rest of the countries as the dendogram in Figure 6.4 displays. Another distinct cluster involves Norway, Estonia and the Netherlands and a final cluster contains Italy, France, Slovenia and Portugal. The clusters are characterized by the indicators as shown in Table 6.6.
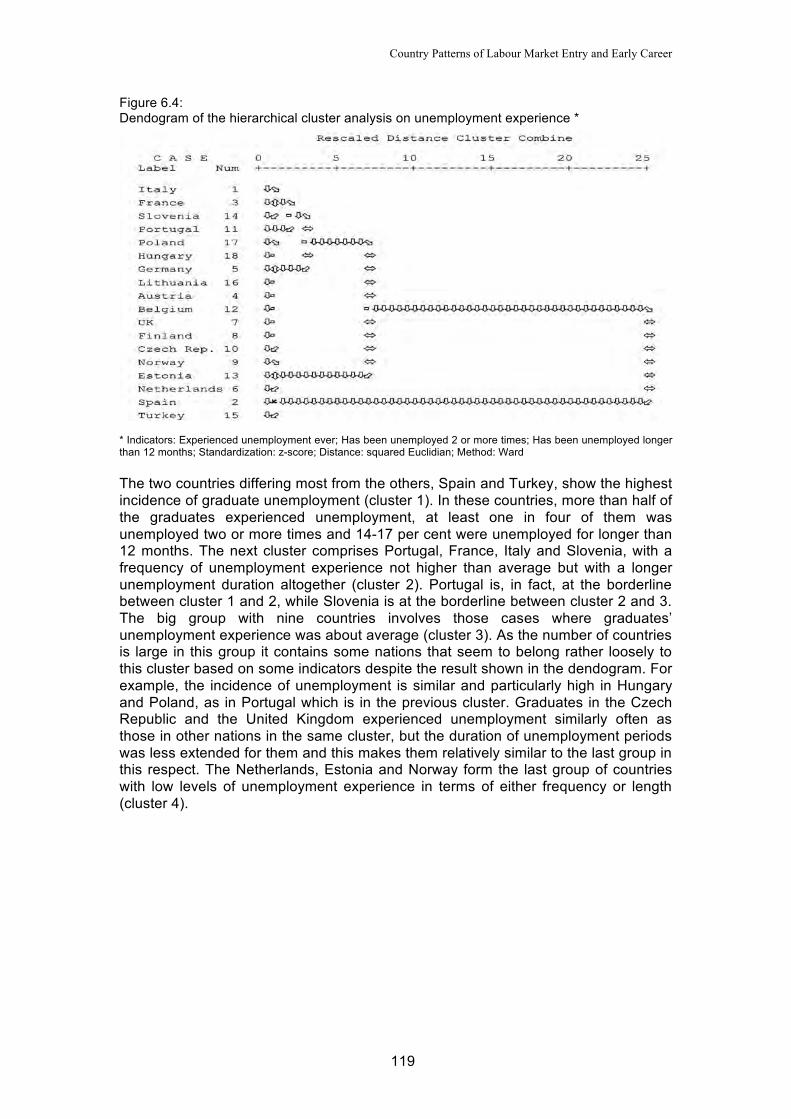
Country Patterns of Labour Market Entry and Early Career
119
Figure 6.4: Dendogram of the hierarchical cluster analysis on unemployment experience *
* Indicators: Experienced unemployment ever; Has been unemployed 2 or more times; Has been unemployed longer than 12 months; Standardization: z-score; Distance: squared Euclidian; Method: Ward The two countries differing most from the others, Spain and Turkey, show the highest incidence of graduate unemployment (cluster 1). In these countries, more than half of the graduates experienced unemployment, at least one in four of them was unemployed two or more times and 14-17 per cent were unemployed for longer than 12 months. The next cluster comprises Portugal, France, Italy and Slovenia, with a frequency of unemployment experience not higher than average but with a longer unemployment duration altogether (cluster 2). Portugal is, in fact, at the borderline between cluster 1 and 2, while Slovenia is at the borderline between cluster 2 and 3. The big group with nine countries involves those cases where graduates’ unemployment experience was about average (cluster 3). As the number of countries is large in this group it contains some nations that seem to belong rather loosely to this cluster based on some indicators despite the result shown in the dendogram. For example, the incidence of unemployment is similar and particularly high in Hungary and Poland, as in Portugal which is in the previous cluster. Graduates in the Czech Republic and the United Kingdom experienced unemployment similarly often as those in other nations in the same cluster, but the duration of unemployment periods was less extended for them and this makes them relatively similar to the last group in this respect. The Netherlands, Estonia and Norway form the last group of countries with low levels of unemployment experience in terms of either frequency or length (cluster 4).
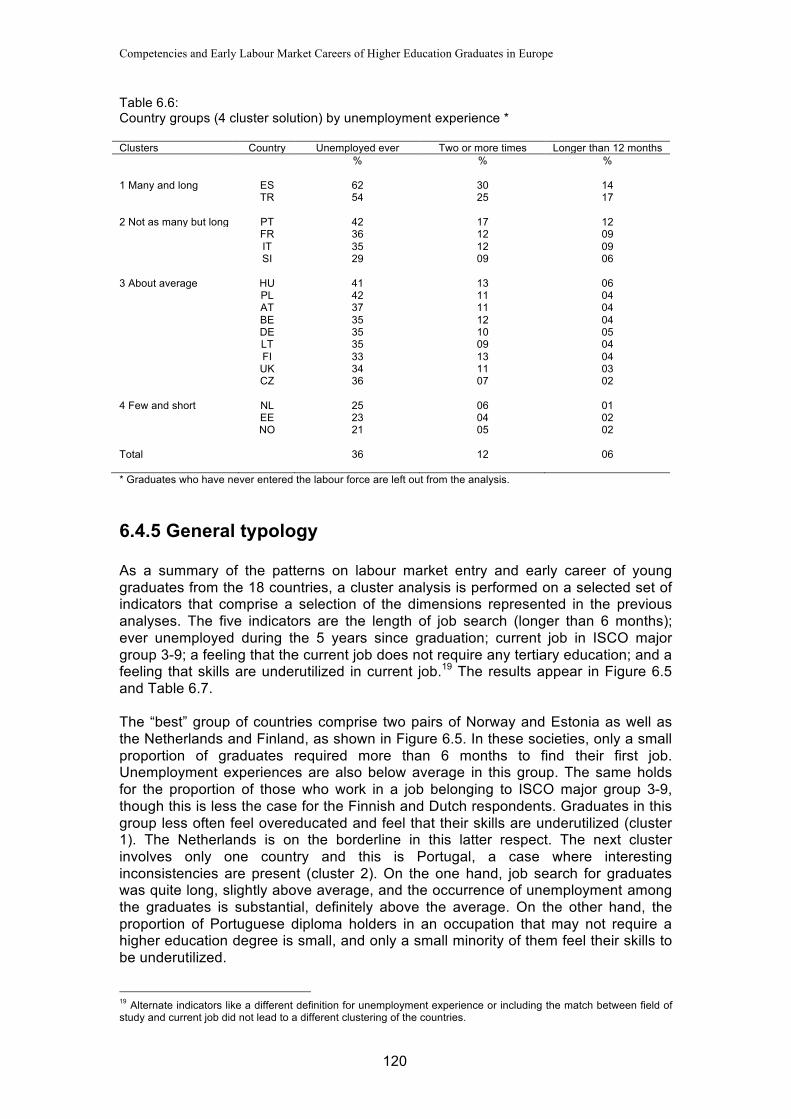
Competencies and Early Labour Market Careers of Higher Education Graduates in Europe
120
Table 6.6: Country groups (4 cluster solution) by unemployment experience * Clusters Country Unemployed ever Two or more times Longer than 12 months % % % 1 Many and long ES 62 30 14 TR 54 25 17 2 Not as many but long PT 42 17 12 FR 36 12 09 IT 35 12 09 SI 29 09 06 3 About average HU 41 13 06 PL 42 11 04 AT 37 11 04 BE 35 12 04 DE 35 10 05 LT 35 09 04 FI 33 13 04 UK 34 11 03 CZ 36 07 02 4 Few and short NL 25 06 01 EE 23 04 02 NO 21 05 02 Total 36 12 06 * Graduates who have never entered the labour force are left out from the analysis.
6.4.5 General typology As a summary of the patterns on labour market entry and early career of young graduates from the 18 countries, a cluster analysis is performed on a selected set of indicators that comprise a selection of the dimensions represented in the previous analyses. The five indicators are the length of job search (longer than 6 months); ever unemployed during the 5 years since graduation; current job in ISCO major group 3-9; a feeling that the current job does not require any tertiary education; and a feeling that skills are underutilized in current job.19 The results appear in Figure 6.5 and Table 6.7. The “best” group of countries comprise two pairs of Norway and Estonia as well as the Netherlands and Finland, as shown in Figure 6.5. In these societies, only a small proportion of graduates required more than 6 months to find their first job. Unemployment experiences are also below average in this group. The same holds for the proportion of those who work in a job belonging to ISCO major group 3-9, though this is less the case for the Finnish and Dutch respondents. Graduates in this group less often feel overeducated and feel that their skills are underutilized (cluster 1). The Netherlands is on the borderline in this latter respect. The next cluster involves only one country and this is Portugal, a case where interesting inconsistencies are present (cluster 2). On the one hand, job search for graduates was quite long, slightly above average, and the occurrence of unemployment among the graduates is substantial, definitely above the average. On the other hand, the proportion of Portuguese diploma holders in an occupation that may not require a higher education degree is small, and only a small minority of them feel their skills to be underutilized.
19 Alternate indicators like a different definition for unemployment experience or including the match between field of study and current job did not lead to a different clustering of the countries.

Country Patterns of Labour Market Entry and Early Career
121
The next large group includes as many as eight countries (cluster 3). Entry into the labour market seems to be fast for the majority of them, in particular in the Czech Republic, Austria and Lithuania. Unemployment experiences are about average, although the situation is more favourable in Slovenia and less favourable in Poland. The mismatch between qualification and current occupation indicates a mixture. On the one hand, underemployment is less characteristic for graduates in these societies either from an objective or from a subjective perspective. But on the other hand, graduates feel their skills to be underutilized in some of the countries like Poland, the Czech Republic and Lithuania. Thus even if the respondents work in “proper” job which requires tertiary education, in some countries (and these are all new EU member states) many graduates feel that their skills are not utilized in an appropriate manner. The next group consists of only three countries: Italy, the United Kingdom and Hungary (cluster 4). Here entry into the labour force was slower and unemployment experiences also exceeded the average (chiefly in Hungary). The mismatch between qualification and current job is more pronounced in every respect. The last pair of Turkey and Spain can be characterized by even worse features for graduates (cluster 5). Entry into the labour market was particularly hard for them and more than half experienced unemployment at least once. There is also a marked mismatch between education and current job (primarily in Spain). Figure 6.5: Dendogram of the hierarchical cluster analysis on LM entry and early career of young graduates in 18 countries*
* Indicators: Job search was longer than 6 months; Respondent has experienced unemployment during 5 years since graduation; Current job is in ISCO major group 3-9; Respondent feels that current job does not require any tertiary education; Respondent feels that skills are underutilized in current job. Standardization: z-score; Distance: squared Euclidian; Method: Ward
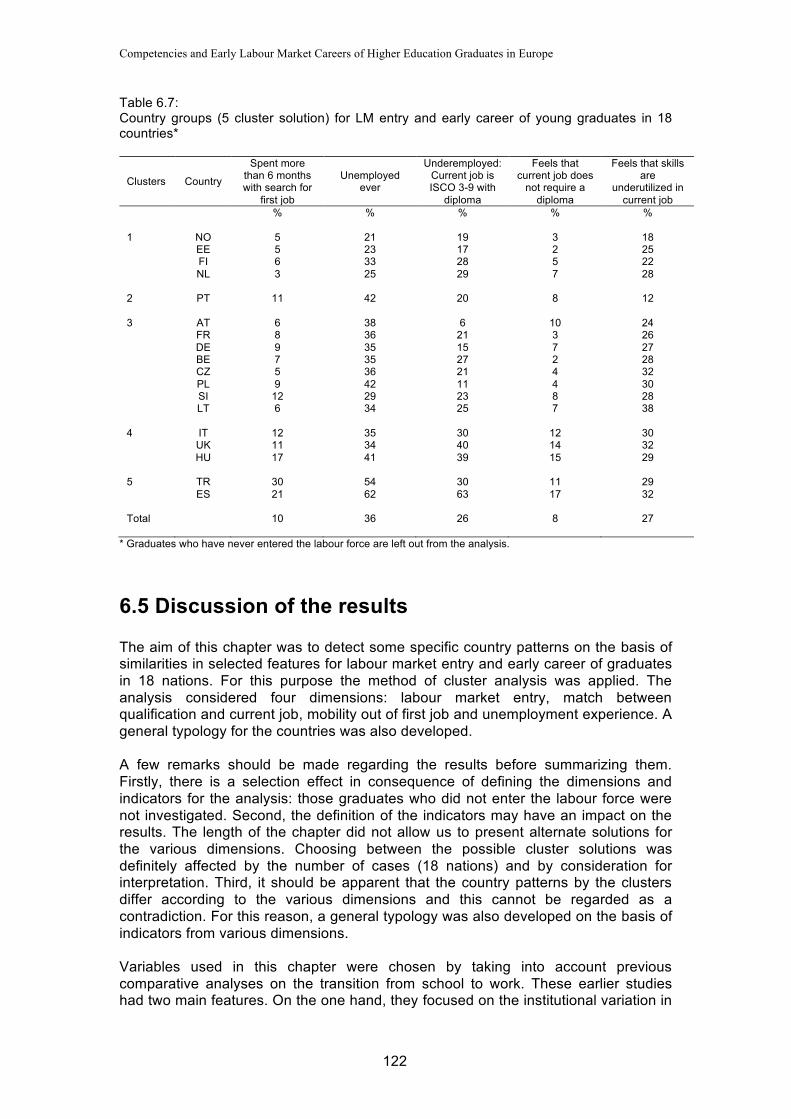
Competencies and Early Labour Market Careers of Higher Education Graduates in Europe
122
Table 6.7: Country groups (5 cluster solution) for LM entry and early career of young graduates in 18 countries*
Clusters Country
Spent more than 6 months with search for
first job
Unemployed ever
Underemployed: Current job is ISCO 3-9 with
diploma
Feels that current job does
not require a diploma
Feels that skills are
underutilized in current job
% % % % % 1 NO 5 21 19 3 18 EE 5 23 17 2 25 FI 6 33 28 5 22 NL 3 25 29 7 28 2 PT 11 42 20 8 12 3 AT 6 38 6 10 24 FR 8 36 21 3 26 DE 9 35 15 7 27 BE 7 35 27 2 28 CZ 5 36 21 4 32 PL 9 42 11 4 30 SI 12 29 23 8 28 LT 6 34 25 7 38 4 IT 12 35 30 12 30 UK 11 34 40 14 32 HU 17 41 39 15 29 5 TR 30 54 30 11 29 ES 21 62 63 17 32 Total 10 36 26 8 27
* Graduates who have never entered the labour force are left out from the analysis.
6.5 Discussion of the results The aim of this chapter was to detect some specific country patterns on the basis of similarities in selected features for labour market entry and early career of graduates in 18 nations. For this purpose the method of cluster analysis was applied. The analysis considered four dimensions: labour market entry, match between qualification and current job, mobility out of first job and unemployment experience. A general typology for the countries was also developed. A few remarks should be made regarding the results before summarizing them. Firstly, there is a selection effect in consequence of defining the dimensions and indicators for the analysis: those graduates who did not enter the labour force were not investigated. Second, the definition of the indicators may have an impact on the results. The length of the chapter did not allow us to present alternate solutions for the various dimensions. Choosing between the possible cluster solutions was definitely affected by the number of cases (18 nations) and by consideration for interpretation. Third, it should be apparent that the country patterns by the clusters differ according to the various dimensions and this cannot be regarded as a contradiction. For this reason, a general typology was also developed on the basis of indicators from various dimensions. Variables used in this chapter were chosen by taking into account previous comparative analyses on the transition from school to work. These earlier studies had two main features. On the one hand, they focused on the institutional variation in
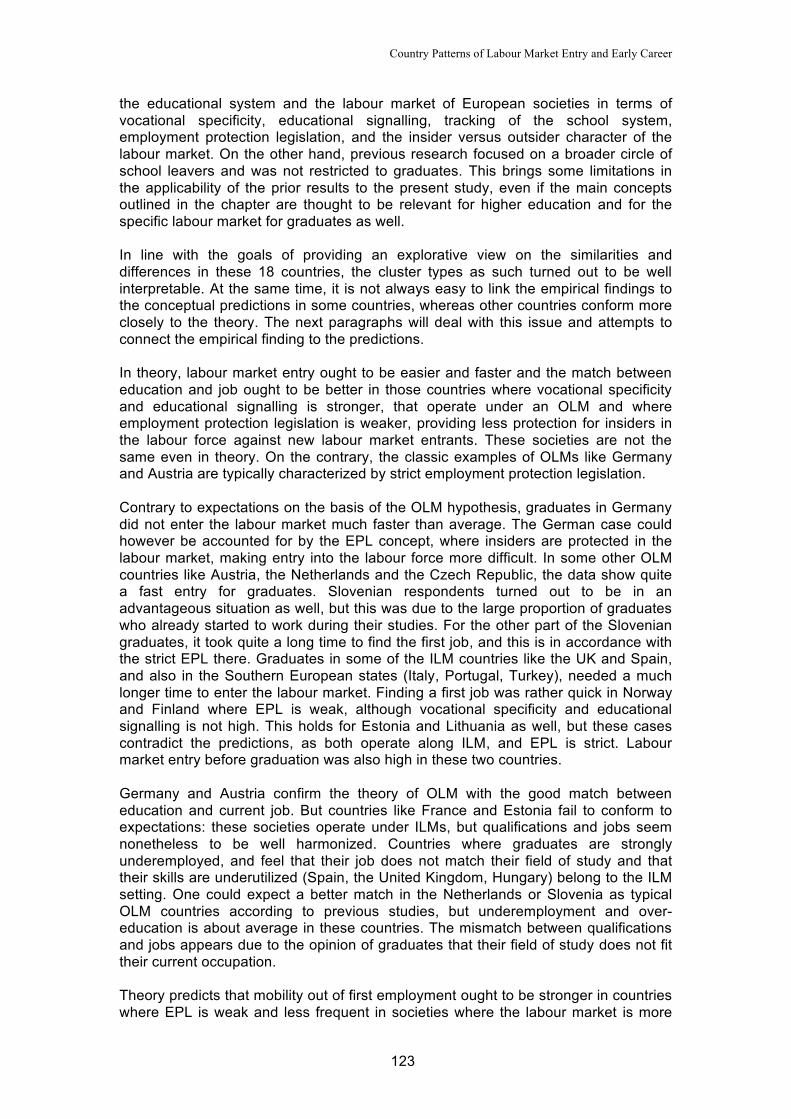
Country Patterns of Labour Market Entry and Early Career
123
the educational system and the labour market of European societies in terms of vocational specificity, educational signalling, tracking of the school system, employment protection legislation, and the insider versus outsider character of the labour market. On the other hand, previous research focused on a broader circle of school leavers and was not restricted to graduates. This brings some limitations in the applicability of the prior results to the present study, even if the main concepts outlined in the chapter are thought to be relevant for higher education and for the specific labour market for graduates as well. In line with the goals of providing an explorative view on the similarities and differences in these 18 countries, the cluster types as such turned out to be well interpretable. At the same time, it is not always easy to link the empirical findings to the conceptual predictions in some countries, whereas other countries conform more closely to the theory. The next paragraphs will deal with this issue and attempts to connect the empirical finding to the predictions. In theory, labour market entry ought to be easier and faster and the match between education and job ought to be better in those countries where vocational specificity and educational signalling is stronger, that operate under an OLM and where employment protection legislation is weaker, providing less protection for insiders in the labour force against new labour market entrants. These societies are not the same even in theory. On the contrary, the classic examples of OLMs like Germany and Austria are typically characterized by strict employment protection legislation. Contrary to expectations on the basis of the OLM hypothesis, graduates in Germany did not enter the labour market much faster than average. The German case could however be accounted for by the EPL concept, where insiders are protected in the labour market, making entry into the labour force more difficult. In some other OLM countries like Austria, the Netherlands and the Czech Republic, the data show quite a fast entry for graduates. Slovenian respondents turned out to be in an advantageous situation as well, but this was due to the large proportion of graduates who already started to work during their studies. For the other part of the Slovenian graduates, it took quite a long time to find the first job, and this is in accordance with the strict EPL there. Graduates in some of the ILM countries like the UK and Spain, and also in the Southern European states (Italy, Portugal, Turkey), needed a much longer time to enter the labour market. Finding a first job was rather quick in Norway and Finland where EPL is weak, although vocational specificity and educational signalling is not high. This holds for Estonia and Lithuania as well, but these cases contradict the predictions, as both operate along ILM, and EPL is strict. Labour market entry before graduation was also high in these two countries. Germany and Austria confirm the theory of OLM with the good match between education and current job. But countries like France and Estonia fail to conform to expectations: these societies operate under ILMs, but qualifications and jobs seem nonetheless to be well harmonized. Countries where graduates are strongly underemployed, and feel that their job does not match their field of study and that their skills are underutilized (Spain, the United Kingdom, Hungary) belong to the ILM setting. One could expect a better match in the Netherlands or Slovenia as typical OLM countries according to previous studies, but underemployment and over-education is about average in these countries. The mismatch between qualifications and jobs appears due to the opinion of graduates that their field of study does not fit their current occupation. Theory predicts that mobility out of first employment ought to be stronger in countries where EPL is weak and less frequent in societies where the labour market is more

Competencies and Early Labour Market Careers of Higher Education Graduates in Europe
124
regulated. Similarly, chances for unemployment are expected to be higher in those societies where EPL is weak, but periods of unemployment should be shorter. The United Kingdom and Norway support the first assumption of high mobility due to weak EPL. However, in Lithuania and Estonia, where the EPL is stricter, even mobile graduates spend longer than a year in their first employment. Degree holders in the UK have many unemployment spells (though no more than average) but with a rather short duration in total. In fact, this is how liberal labour markets with weak EPL are expected to work: employees lose their jobs easily, but do not remain unemployed for a long time because they can find again a new job fast enough. The pattern represented by Spain and Turkey is also rather straightforward. Mobility out of first employment as well as first job is high in both countries and the same holds for graduates’ unemployment experiences. In fact, labour market entry turned out to be particularly difficult in these two countries and graduates seemed to be underemployed as well. These facts can perhaps provide good explanation for their high mobility, namely the occurrence of unintended job changes. Graduates’ circumstances seem to be the most flexible and unfavourable in Spain and Turkey. Indeed, these two countries end up in the “worst” cluster of the general typology in Table 6.7. Another mobile country, Norway, looks like a completely different story. Here graduates’ labour market entry was quick, the match between qualification and job was good, and graduates left their first employment quite rapidly. Since Norwegian graduates experienced far less unemployment than average, both in terms of number and duration of spells, a large part of the mobility was most probably intentional. Thus, it seems that the labour market operates quite favourably for graduates in Norway. The same holds for Finland, the Netherlands and Estonia as well. Graduates were able to find a first job quite fast; the match between qualifications and jobs was good (and definitely not worse than the average); and graduates did not face much unemployment in these countries. For this reason, these are the countries in the “best” cluster of the general typology in Table 6.7. The expected link between low mobility and strict EPL is present for Germany and Slovenia. But mobility is similarly low in Italy and the Czech Republic, where other explanations, perhaps again the imperfect match between qualifications and jobs, should be present. In fact, graduates in Italy experienced unemployment quite frequently and definitely for a longer time. Unemployment experiences were rather frequent and lasted longer in Portugal as well, while the duration of unemployment was also longer in France where EPL is quite strict. In terms of the link between the country patterns found in the analysis and the conceptual predictions based on the literature, we have observed a mix of both good and bad examples for the concrete countries. Some countries conformed quite strongly to expectations, and other countries clearly less so. It is apparent that even if the explorative picture seems to be believable in terms of the structure and of the existence of the various types presented, sometimes it is more difficult to explain why certain countries belong to certain types. One possible reason has been mentioned above: the concepts and the predictions are not specific to higher education and the graduates labour market. If nothing else, the chapter is hopefully convincing enough that the approach of a search for country patterns by applying a cluster methodology (as done already before) is not a dead end street but leads to relevant results. It is clear that the labour market in these countries does not provide homogeneous returns to the human capital investments of graduates. The institutional differences of OLM versus ILM as well as of the degree of EPL create variation from a theoretical perspective (see Table 6.1), and this is broadly shown in the empirical results as well.
Country Patterns of Labour Market Entry and Early Career
125
Both the “old” and the “new” EU member states were represented in the study in an appropriate manner, and they turned out to differ from each other but not simply on this basis. It may be less surprising that Western societies are dissimilar (there are more comparative studies on them) but the former socialist countries constitute a heterogeneous group as well. Apparently, as the general pattern of the countries show (Figure 6.5. Table 6.7) Estonia and Hungary are similarly far from each other as Norway from Spain. Further analysis of the same data by choosing other dimensions and/or defining other indicators will definitely bring further new insights and will hopefully clarify existing ambiguities.


Conclusions and Policy Implication
127
Chapter 7 Conclusions and Policy Implications Rolf van der Velden and Jim Allen
7.1 Conclusions In general, European higher education graduates enjoy a rather smooth transition to the world of work. Most graduates find work within a few months of graduation, and although the first job is sometimes less than ideal, five years after graduation most are employed in jobs that fit well with their qualifications. Graduates typically work fulltime, enjoy a high degree of job security and earn good wages. There is of course room for improvement. For example, in most countries only around a quarter to a third of graduates reported that the current job offers good career prospects, and although most graduates are satisfied with their current job, around a third of graduates in most countries indicate that they are not particularly satisfied. Even in terms of those aspects on which most graduates perform well, there are countries and fields of study that do less well. However, the main conclusion that can be drawn from this study is that the new and candidate member states (NCMS) cannot be placed as a uniform block into this category. In fact, the differences between the individual NCMS are in most cases more striking than their differences with respect to the southern and northern European REFLEX countries. Different NCMS can be found across the full spectrum of countries according to a range of dimensions, including labour market entry, early career mobility, match between qualifications and work and unemployment experience. On a general typology of countries, Estonia forms together with Norway, Finland and the Netherlands a group of countries with generally a short unemployment duration, and a low incidence of unemployment, underemployment, overeducation and underutilization of skills. The same analysis places Turkey together with Spain as the countries most likely to experience problems on these dimensions. Key factors contributing to a successful transition from higher education to the labour market include the acquisition of study-related work experience during higher education and strong links between HE institutions and the labour market. Graduates also appear to benefit from attending programmes that are academically prestigious, but not necessarily demanding. Experience abroad is also positively related to wages, particularly in the NCMS. Good grades also appear to reduce search duration in the NCMS. The work environment encountered by graduates can be described as dynamic, innovative, competitive, quality-oriented, and often international. As many as half of all graduates across all countries have undergone a reorganization within the last 12 months, and a similar proportion work in organizations that can be described as

Competencies and Early Labour Market Careers of Higher Education Graduates in Europe
128
innovative, and that rely heavily on higher education graduates for the introduction of their innovations. The vast majority of graduates working in the private sector across all countries report working in an organization experiencing high or very high levels of competition. Arguably more remarkable is the fact that around two in every five graduates working in the public sector also report high levels of competition. Competition by quality rather than price prevails across all countries/regions. Many graduates work in organizations with an international scope of operations. A large majority of graduates in all countries/regions work as professionals, but in comparison with graduates in northern and southern European REFLEX countries, those in the NCMS work relatively more often as managers. Those working as managers usually assume responsibility for setting their own goals, and many also set goals for their organization. Not surprisingly, those working as professionals and in other occupations are less likely to take on these typical managerial responsibilities. Contrary to expectations however, it is the managers again who most often function as a source of professional knowledge in their organizations, either directly by providing advice to colleagues, or indirectly through network ties to others outside the organization. Professionals are significantly less likely to assume such a role, which may indicate that the work of professionals is more solitary, applying high levels of professional knowledge mainly in the execution of one’s own work, and only to a lesser extent in facilitating the work of colleagues. In the world of work, graduates are expected to be competent in a broad range of areas, comprising both field-specific and generic skills, as well as technical abilities in the areas of computer and internet usage. The competences that are most often required at a high to very high level in tertiary-level jobs held by graduates in the NCMS are the ability to use computers and the internet, the ability to use time efficiently, and the ability to work productively with others. Most graduates are highly competent in these areas, particularly with respect to the ability to use computers and the internet, but there are some shortages, of these and other competences, notably the mastery of one’s own field or discipline and the ability to perform well under pressure. There are also competences for which a relatively large number of graduates report a surplus (a significantly higher own level than is required in their work). The main surpluses are found for the competences ability to write and speak in a foreign language, the willingness to question one’s own and others’ ideas, and the ability to use computers and the internet (the latter despite being the competence most often required at a high level: most graduates possess sufficient skills in this area for their work). Foreign language skills are notable in being relatively often in shortage as well as in surplus, which seems to indicate that – at least with respect to this competence – there is a misallocation of graduates across jobs. There is a strong relation between certain characteristics of organizations and jobs on one hand and the required level and utilization of competences graduates on the other. The organizational characteristic that shows the strongest effects on the required level and utilization of competences is the extent of innovation. However, the role actually played by graduates in introducing innovations at the job level has very little effect on the required level of any of the competences. This seems to suggest that innovative firms are extremely focused on deploying high-level competences, but do not thereby draw a strong distinction between those actually involved in introducing innovations and those who are not involved. However, innovation at the job level does have a much clearer effect on utilization of knowledge and skills in general, especially in the NCMS. It may be that graduates involved in introducing innovations mainly need to be creative, but do not need to be particularly adept in the competences included in the analyses. Working in a competitive environment provides a strong boost for the demand for graduates’
Conclusions and Policy Implication
129
competences, particularly management competences. Strangely, the effect of competition on the overall utilization of knowledge and skills is rather modest, and it is rather the extent to which such competition is based on quality rather than price that has the strongest effects in this respect. Both the managerial and the professional character of jobs have very strong effects on required competences and the utilization of knowledge and skills in general. Volatility of the work environment in the form of unstable demand and reorganizations is generally related to lower levels of utilization. In the five countries that participated in the HEGESCO project, the time spent on a range of knowledge management activities was asked of graduates. In general, graduates were most often engaged in social learning - involving various forms of social interaction and knowledge exchange with co-workers - and in data management. Much less time was spent on physical work, codification – involving the recording of work-related knowledge and experiences - and internalization. The latter is the activity that most closely resembles the prevailing learning type in higher education. Some clear effects of these knowledge management activities on both the demand for competences and the utilization of knowledge and skills were observed. Social learning is strongly related to required teamworking abilities in all countries. Physical work is strongly related to lower required levels of computer and internet skills. Codification emerges as an important factor related to demand for and utilization of competences in Turkey, showing strong effects on required computer and internet skills, time management skills and mastery of one’s own field or discipline, as well as on the utilization of knowledge and skills in general. It is interesting that this activity shows such clear effects in Turkey, where the time spent on codification is much higher than in other countries. Data management is strongly associated with higher required levels of computer and internet skills in all countries, but in other respects seems to decrease rather than increase demand for high-level competences, also decrease the overall level of utilization of knowledge and skills. The data management activity that is most strongly associated with high levels of mastery of one’s own field or discipline is internalization or information-process learning, and this activity also has a strong effect on overall utilization of knowledge and skills. Although graduates are generally quite positive when it comes to the extent to which they feel higher education has prepared them for the world of work, it is striking that they were even more positive about the role higher education played in their personal development. Equally remarkable was the poor opinion most graduates have of higher education as a contributor to their entrepreneurial skills. This even applied to fields of study that cater heavily to the private sector, such as business and engineering studies. In general there was little difference between the NCMS and northern and southern European REFLEX countries in any of these assessments. Although a majority of graduates in most countries reported that they would choose the same study programme again at the same HE institute if they were in a position to choose again, this percentage is considerably lower in general in the NCMS than in the northern and southern European REFLEX countries. Especially Turkish graduates would often be reluctant to repeat their initial choice if they were free to choose again. Countries also share much in common in terms of the main characteristics and experiences graduates reported with respect to their higher education programme and of their acquired competences. According to the assessment of graduates, higher education in Europe is quite demanding, with a broad focus but relatively little freedom offered to students to compose their own programme. Despite the increasing interest in more innovative methods in recent years, European higher

Competencies and Early Labour Market Careers of Higher Education Graduates in Europe
130
education is at heart still rather traditional, with strong emphasis on classroom-style teaching. Nonetheless, graduates are more likely than not to have acquired some form of hands-on experience outside the classroom setting while in higher education. The most common form of experience is a work placement or internship, but other work experience is also often seen, and although experience abroad and positions held in student organizations are less prevalent, they are not uncommon in many countries. To be sure, there are some deep-rooted differences between higher education in different countries in terms of content, modes of teaching and learning, links to the labour market and such. Some countries are much more vocationally oriented than others, although these differences show surprisingly little relation with the extent to which employers are familiar with the content of higher education, which is quite low in almost all countries. Countries also differ strongly in the extent to which high education is mainly theoretical or more practical in its content. However, there is little or no systematic difference between the NCMS and REFLEX countries in any of these aspects. When we look at study behavior however, it is striking that graduates in the NCMS report low average study hours compared to their northern and southern European peers. However, this is not related to any systematic difference in the way graduates perceive their own study motivation, with graduates in the NCMS being no more or less likely to report a willingness to work harder than necessary to achieve a passing grade. Graduates in different countries seem to have different ideas of what it means to study hard. In most countries students seem to be more extrinsically motivated than intrinsically motivated, with a high proportion of graduates in most countries reporting a strong orientation towards achieving high marks, but few indicating a willingness to work harder than necessary to achieve this. Although certain aspects of higher education show significant effects on both competences and labour market outcomes, differences in these aspects across countries do not appear to account for country-level differences in outcomes. Demanding HE programmes appear to foster all kinds of competences, particularly mastery of one’s own field or discipline. The reported level of mastery of one’s own field or discipline was also significantly related to a vocational orientation of the study programme and the acquisition of relevant work experience during higher education, and depends more on practical than theoretical modes of teaching and learning. The latter finding suggests that disciplinary knowledge is more practical than academic in most countries. Group learning promotes both computer and teamworking skills. Given the strong amount of attention paid in recent years to innovative educational methods, the effects of modes of teaching and learning on the selected competences are surprisingly modest. There was little evidence that innovative methods are any more or less effective in producing competences than more traditional methods. There was some evidence that the mode of assessment makes a difference for the acquisition of competences, with written assignments appearing to be somewhat more effective than multiple choice exams, but the effects were generally quite modest.
7.2 Policy Implications When it comes to policy implications we would like to distinguish the following main stakeholders: national governments, employers, higher education institutions and students.

Conclusions and Policy Implication
131
National governments Strengthen links between higher education and the world of work We have found strong evidence that graduates of study programmes in higher education with strong links to the labour market enjoy a smoother transition to the world of work and greater success and satisfaction in their early career. Programmes that are strongly anchored in the world of work are also highly effective in enhancing the level of discipline-specific knowledge and skills of graduates.
Encourage the acquisition of relevant work experience during higher education Links between higher education and work are especially beneficial when graduates are able to acquire relevant work experience during higher education. This applies especially to work experience that is formally not part of the study programme, but that is nonetheless strongly related to the content of the study. Although less evidence was found that work experience that is part of the study programme – work placements, internships – produce competences and facilitating a smooth and successful transition to the world of work, this does not mean that such formal activities are not important. Because such activities are compulsory for many study programmes, it is difficult to distinguish their positive effects from the general labour market prospects of graduates who followed the programmes in question. By contrast, there is little evidence that spending time on non-relevant work during higher education is useful apart from providing students with additional income during study.
Create incentives to make higher education more demanding Demanding higher education programmes foster the development of all kinds of competences, particularly discipline-specific knowledge and skills. However, since graduates are rewarded more for the links that the programme has with the labour market and for its general level of academic prestige, higher education institutions often lack a direct incentive to make programmes more demanding, since this may discourage some potential students from enrolling. Consequently, there is a role for governments in creating an incentive structure that rewards institutions for excellence as well as volume.
Employers
Employers should be aware of the large reserves of underutilized human capital at their disposal One out four graduates indicates that their knowledge and skills are not optimally used in their work. This seems particularly true for competences in the area of innovation and knowledge management. Especially in the private sector and in firms operating in an unstable market, employers do not make optimal use of the human capital at their disposal. Interestingly, organizations that strongly involved in innovation make better use of the potential of the graduates. Reaching the Lisbon goals may be more attainable if employers more fully exploit their highly educated employees’ potential.
Employers should look for better signals of quality Our results show that graduating from programmes with strong links to the labour market and or a high level of academic prestige is highly rewarding, even though these programs may not necessarily produce better graduates. It seems that employers heavily rely on such signals to reduce uncertainty. However, this strategy

Competencies and Early Labour Market Careers of Higher Education Graduates in Europe
132
does not necessarily result in hiring the best graduate and there may be a need for more diversity in the hiring process. Although both governments (see above) and higher education institutions (see below) have a role to play in improving the relevance of signals of educational quality, employers can contribute by taking more note of such things as the demandingness of the study programme and the effort and motivation shown by graduates while in education. This not only has the immediate benefit of providing employers with better employees, but should also contribute to a tightening of the link between the prestige and reputation of higher education institutions on one hand and the excellence of the education they provide on the other.
Higher education institutes
Study programs should be more demanding One of the prime goals of higher education should be to optimally develop the talents of students. As ‘time on task’ is the best predictor of learning outcomes, this implies increasing the study load and creating a culture in which hard work and striving for excellence is valued and rewarded. Although a majority of graduates indicated that their programme was (highly) demanding, many graduates reported that this was not the case, especially in some countries. Although both governments and employers have a role to play in shoring up the quality of higher education, it is only the higher education institutions themselves that can implement the necessary changes to make higher education more challenging for students.
Establishing more (or better) links with employers One of the aspects of higher education that is most valuable to graduates when they enter the world of work is the degree to which links exist between higher education and the world of work. At the same time, this appears to be only weakly related to the degree to which higher education is demanding. This implies that, while it is likely to be beneficial to graduates in the short term if the links between higher education and work are strengthened, in the longer term this is likely to be beneficial to all actors involved – employers, higher education institutes, graduates and ultimately the taxpayers who foot a large part of the bill – if such links are used to make higher education more challenging and fruitful, by involving employers in developing curricula that take account of the latest developments in the world of work, while not losing sight of the importance of imparting competences that will enhance the employability of graduates in the longer term.
Don’t overstate the important of modes of teaching and learning There is a tendency in education to think that knowledge in itself is not important anymore, as technological developments seem to render knowledge and skills obsolete soon after graduates have left higher education. Student-centred methods like project and problem based learning have often been touted as essential for the development of so-called key skills that are important in all areas of work. However, our results indicate that the precise modes of teaching and learning show surprisingly little relation with developing high levels of competence in most areas. Both traditional and more innovative forms of education appear to be similarly effective when it comes to competence development.
Give credits for relevant work experience Work experience closely related to the field of study has a positive effect on the development of relevant skills. Higher education institutes could foster this by giving
Conclusions and Policy Implication
133
credit points to students who perform such relevant work. This would encourage students to engage in relevant work instead of non-relevant work activities.
Pay more attention to the development of entrepreneurial skills In most countries graduates are critical about HE program providing a good basis for starting to work or development of entrepreneurial skills. This should be taken seriously.
Students
Follow your interest and talent Although graduates from some fields of study (such as Humanities and Agriculture and veterinary) find it more difficult to enter the labour market and acquire a good job, this by no means indicates that these fields of study should be avoided. For all fields of study we find that two thirds (or more) of the graduates are satisfied with their job, and this also applies to the two fields mentioned (Humanities and Agriculture and veterinary studies). Moreover, we find only small differences between fields of study in the percentages of graduates who regret the choice of their program. In our view, students should primarily follow their own interest and talent when choosing a study program in higher education. Information about labour market prospects can of course play a secondary role in helping students choose between programmes they are equally interested in.
Acquire relevant experience outside higher education Our findings show that acquiring work experience that is related to the study program is beneficial for the later labour outcomes. The same holds for holding a position in student or other voluntary organizations (e.g. chair, committee member) or spending time abroad for study and/or work. These experiences have a positive effect on the development of skills and serve as a signal to future employers. Although many students are engaged in non-relevant work to cover the costs of living, it is far better to focus on relevant work experience. Non-relevant work does not pay off in the long run, and – if it leads to an extension of the study duration - it might be better to rely on study loans.

References
135
References Allmendinger, J. (1989). Educational Systems and Labour Market Outcomes.
European Sociological Review 5: 231—250 Batt, R. and V. Doellgast (2005). Groups, Teams and the Division of Labor:
Interdisciplinary Perspectives on the Organization of Work', pp. 138—61. In S. Ackroyd, R. Batt, P. Thompson and P.S. Tolbert (eds) The Oxford Handbook of Work and Organization. London: Oxford University Press.
De Grip, A. and J. Van Loo (2002) The Economics of Skills Obsolescence: A review.
In: A. de Grip, J. Van Loo and K. Mayhew (eds.) The Economics of Skills Obsolescence: Theoretical Innovations and Empirical Applications, Research in Labor Economics, 21: 1—26.
European Commission (2000). Lisbon European Council: Presidency conclusions,
Brussels: European Commission. European Commission (2003). The Role of Universities in the Europe of Knowledge,
Communication from the Commission, COM (2003) final. Freeman, R. B. (1976).The Overeducated American. New York: Academic Press. Freidson, E. (2001). Professionalism: The Third Logic. Cambridge: Polity Press. Gangl, M. (2001). European Patterns of Labour Market Entry. A Dichotomy of
Occupationalized Systems vs. Non-Occupational Systems?’ European Societies, 3: 471—494.
Gangl, M. (2002). Changing labour market and early outcomes: labour market entry
in Europe over last decade. Work, employment and society. 16: 67—90. Gangl, M. (2003a). Structure of Labour Market Entry. In W. Müller and M. Gangl
(eds) Transition from Education to Work in Europe. The Integration of Youth into EU Labour Markets, Oxford: Oxford University Press. Pp. 107—128.
Gangl, M. (2003b). The Only Way is Up? Employment Protection and Job Mobility
among Recent Entrants to European Labour Market. European Sociological Review, 19: 429—449.
Kogan, I., Unt, M. and Saar, E. (2007). Youth Unemployment in the Enlarged Europe.
In: S. Scherer, R. Pollak, G. Otte and M. Gangl (eds). From Origin to Destination. Social Stratification, Education and the Life Course. Frankfurt am Main and New York: Campus. Pp. 182—213.

Competencies and Early Labour Market Careers of Higher Education Graduates in Europe
136
Kogan, I., Gebel, M. and Nolke, C. (eds.) (2008). Europe Enlarged. A handbook of education, labour and welfare regimes in Central and Eastern Europe. Abingdon: The Policy Press.
Livingstone, D. W. (1998). The Education-Jobs Gap. Underemployment or Economic
Democracy. Boulder: Westview Press Marsden, D. (1999). A Theory of Employment Systems. Micro-Foundations of
Societal Diversity. Oxford: Oxford University Press. Maurice, M. Sellier, F. and Silvestre, J.-J. (1986). The Social Foundations of
Industrial Power: A Comparison of France and Germany. Cambridge, Mass.: MIT Press.
Müller, W. and Shavit, Y. (1998). The institutional embeddedness of the stratification
process: a comparative study of qualifications and occupations in thirteen countries. In: Y. Shavit and W. Müller (eds.), From School to Work. A Comparative Study of Educational Qualifications and Occupational Destinations, Oxford: Clarendon Press. Pp. 1—48.
Nonaka, I. and Takeuchi, H. (1995). The Knowledge–Creating Company: How
Japanese Companies Create the Dynamics of Innovation. Oxford University Press.
Pavlin, S., and Svetlik, I. (2008). Razvoj profesionalnih kompetenc v slovenskem
visokošolskem prostoru – elementi in izhodišča [The Development of Professional Competencies in Slovenian Higher Education – Elements and Origins]’. Ljubljana: University of Ljubljana.
Saar, E., Unt, M. and Kogan, I. (2008). Transition from educational system to labour
market in the European Union: A comparison between new and old members. International Journal of Comparative Sociology. 49: 31—59.
Smyth, E., Gangl, M., Raffe, D., Hannan, D.F. and McCoy, S. (2001). A Comparative
Analysis of Transition from Education to Work in Europe (CATEWE). Dublin: ESRI.
Spence, Michael A. (1974). Market Signaling: Informational Transfer in Hiring and
Related Screening Processes. Cambridge: Harvard University Press. Unt, M. (2007). Transition from school to work in enlarged Europe. Tallinn: Tallinn
University.
Index
137
Index
A agriculture and veterinary 15, 22, 30, 41, 55, 58, 63,
76-‐77, 89,-‐90 Austria 7, 9, 13, 27, 29, 45, 54, 92-‐97, 103, 110, 124,
130-‐147, 150-‐151
B business and law ... 15, 22, 30, 41, 55, 58, 63, 75, 77,
89, 90
C career .. 7, 9-‐10, 19, 33, 37, 43-‐44, 47, 50-‐53, 56, 59,
60 66, 129-‐133, 146-‐149, 154, 158 competences .. 4, 6, 10, 25, 67-‐92, 111-‐127, 155-‐160 current job ...... 5, 7, 46-‐54, 65-‐67, 132-‐141, 146-‐154 curriculum ........................................... 20, 25, 78, 83 Czech Republic 7, 9, 10, 17, 20, 29, 36-‐37, 43-‐51, 70,
92-‐98, 100-‐103, 125, 130-‐138, 140-‐147, 150-‐152
D diploma ......................................... 132-‐140, 147-‐149 discrepancies ................................................. 67, 126
E early career ................................ 10, 33, 65, 129, 154 economic sectors ....................................... 10, 92-‐97 employer ....................................... 33-‐39, 42-‐43, 142 employment ...... 4, 5, 33, 40, 43, 47, 51, 65, 97, 100,
129-‐135, 141-‐151, 163 engineering, manufacturing and construction
programmes ............................................... 15, 76 Estonia ..... 7, 9-‐13, 16, 36, 44-‐ 48, 54, 65-‐66, 70, 92-‐
108, 124-‐125, 130-‐146, 150-‐154
F field of study ... 14, 21-‐30, 47, 62-‐65, 77, 88-‐89, 135,
139, 140, 146, 151, 160 Finland .. 7, 9, 13, 20, 27-‐29, 34, 39, 45, 62, 104-‐108,
125, 135-‐146, 150-‐154 first job ................... 7, 33-‐41, 46, 52-‐53, 65, 131-‐154 formal education ................................................... 25 France ..... 7, 9, 14-‐17, 23-‐ 29, 52-‐53, 62-‐63, 95, 100-‐
108, 125, 135-‐152, 164
G Germany .... 7, 9, 13, 94-‐97, 105, 124, 130-‐143, 150-‐
151, 164 group assignments ................... 16, 21-‐22, 30, 80, 91
H health and welfare .. 15, 22, 30, 41, 55-‐58, 63, 76-‐77,
89-‐90 humanities and arts 15, 22, 30, 41, 55-‐58, 63, 76-‐77,
89-‐90 Hungary 7-‐13, 20, 26, 36, 45-‐53, 61-‐65, 70, 95, 100-‐
108, 122-‐125, 130, 131-‐152
I income ..................................................... 49-‐50, 158 international ....................... 29, 97-‐99, 121-‐124, 155 internships ............. 19-‐31, 42, 56-‐59, 66, 83-‐86, 158 Italy 7-‐9, 17-‐ 21, 28-‐34, 53-‐54, 92-‐97, 104, 124, 130-‐
152
J job satisfaction ................................ 10, 33, 47, 54-‐59 job security ..................... 10, 33, 47, 51-‐54, 101, 154
K knowledge .... 6-‐10, 17, 60-‐83, 91-‐92, 104-‐127, 133,
155-‐160
L labour market ...... 6-‐11, 33, 42-‐43, 56-‐59, 66-‐78, 97,
124-‐129, 130-‐164 learning experiences .......................................... 9-‐11 lectures ............................... 16-‐17, 21-‐22, 30, 80, 91 Lithuania 7-‐12, 16-‐26, 36, 44-‐50, 61, 70, 92-‐97, 105,
123-‐151
M mathematics and computing ... 15, 22, 30, 41, 55-‐58,
63, 76-‐77, 89-‐90 mobility ......................... 130-‐133, 141-‐143, 149-‐154 modes of teaching and learning .. 5, 9-‐11, 16, 21-‐22,
78-‐83, 91, 157-‐160 multiple choice exams .................. 20-‐22, 84, 91, 158
N Netherlands 7-‐17, 20-‐29, 37-‐38, 44-‐46, 92, 103, 108,
130-‐138, 140-‐154 Norway 7-‐9, 13, 17, 20-‐21, 34-‐39, 44, 52-‐54, 62, 95,
100, 106, 136-‐154
O occupational groups 4, 10, 92-‐94, 108-‐109, 115, 120 oral presentations ...................................... 21-‐22, 84
Competencies and Early Labour Market Careers of Higher Education Graduates in Europe
138
P personal and background characteristics .. 41, 55-‐59 personal development ................ 10, 33, 61-‐ 66, 156 Poland ..... 7-‐12, 21, 29, 36-‐38, 45-‐52, 65-‐70, 95-‐103,
123-‐147 policy ......................................................... 6, 10, 158 Portugal 7-‐9, 29, 44, 53, 94, 100-‐108, 130-‐136, 141-‐
152 practical knowledge ....................... 17-‐22, 30, 81-‐ 83 problem-‐based learning .................. 16-‐22, 30, 81-‐83 programme characteristics ....... 10-‐15, 33, 42, 78-‐80
R research projects ............................ 19-‐22, 30, 81-‐83
S science .......... 15, 22, 30, 41-‐43, 55-‐63, 75-‐77, 88-‐90 skills ............. 5-‐11, 20-‐21, 27-‐29, 42, 60-‐99, 112-‐161 Slovenia7-‐9, 24, 29, 36-‐52, 60, 70, 98, 101-‐110, 124-‐
151 social learning ...................................... 122-‐126, 156 social sciences ...................... 41-‐43, 55-‐58, 75, 88-‐90 Spain ........ 7-‐9, 17, 20-‐29, 34-‐43, 53, 94-‐95, 130-‐154 study behaviour ............................... 9-‐11, 23, 31, 84 study programme . 4, 10-‐21, 26-‐31, 40-‐41, 55, 58-‐67,
74-‐79, 85-‐86, 156-‐159
Switzerland ............. 7-‐13, 34-‐39, 63, 92-‐95, 101-‐105
T teacher-‐centred learning ........................... 17, 83, 91 theories and paradigms ....................... 17-‐22, 30, 83 transition ..... 7-‐9, 33-‐34, 42-‐44, 56, 65-‐67, 130-‐132,
150-‐158 Turkey ... 7-‐17, 20, 23-‐70, 92-‐ 110, 122-‐127, 135-‐156
U unemployment ...... 33, 44-‐46, 65, 130-‐133, 143-‐154 United Kingdom 7-‐9, 20-‐28, 34, 39, 44, 51-‐52, 95-‐99,
105-‐106, 125-‐151
V vocational orientation 12-‐20, 42, 56-‐59, 66, 80, 157
W work experience .. 5, 25-‐31, 41-‐42, 55-‐60, 66, 85-‐91,
154-‐161 work placement .......... 20, 22, 25-‐28, 39, 81-‐83, 157 work placements ... 19-‐26, 31, 39-‐42, 56, 66, 83, 158 world of work 6, 10, 19, 25, 43-‐44, 60, 66-‐67, 78, 90-‐
92, 111, 122, 154-‐159 written assignments ..................... 20-‐22, 84, 91, 158

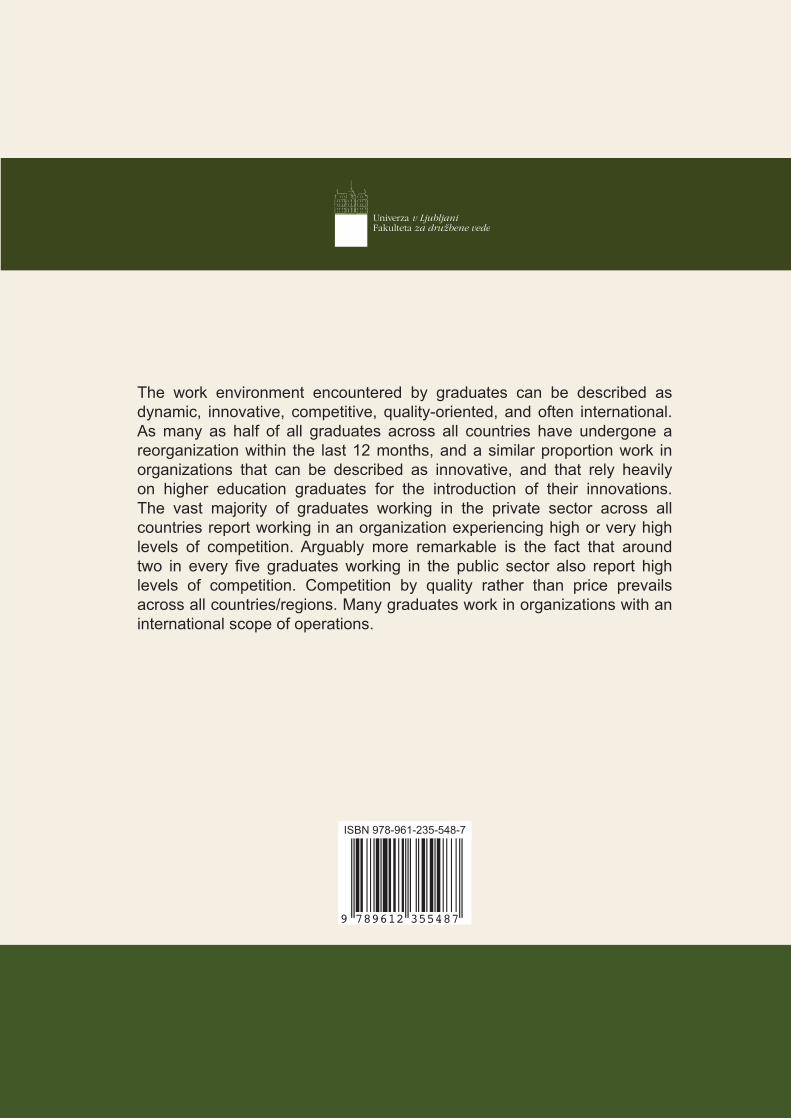
Competencies and Early Labour Market Careers of Higher Education Graduates in Europe
Editors:Jim Allen, Samo Pavlin and Rolf van der Velden
Authors: Jim Allen, Johan Coenen, Martin Humburg, Samo Pavlin, Peter Robert,
Ivan Svetlik and Rolf van der Velden
ISBN 978-961235548
9 789612 355487
The work environment encountered by graduates can be described as dynamic, innovative, competitive, quality-oriented, and often international. As many as half of all graduates across all countries have undergone a reorganization within the last 12 months, and a similar proportion work in organizations that can be described as innovative, and that rely heavily on higher education graduates for the introduction of their innovations. The vast majority of graduates working in the private sector across all countries report working in an organization experiencing high or very high levels of competition. Arguably more remarkable is the fact that around two in every five graduates working in the public sector also report high levels of competition. Competition by quality rather than price prevails across all countries/regions. Many graduates work in organizations with an international scope of operations.
ISBN 978-961-235-548-7
Final report Cover B5 170 x 240.indd 1 14. 12. 11 19:46
Related Documents