McGarraghy, Seán et al. Article — Published Version Conceptual system dynamics and agent-based modelling simulation of interorganisational fairness in food value chains: Research agenda and case studies Agriculture Provided in Cooperation with: Leibniz Institute of Agricultural Development in Transition Economies (IAMO), Halle (Saale) Suggested Citation: McGarraghy, Seán et al. (2022) : Conceptual system dynamics and agent- based modelling simulation of interorganisational fairness in food value chains: Research agenda and case studies, Agriculture, ISSN 2077-0472, MDPI, Basel, Vol. 12, Iss. 2 (Article No.:) 280, https://doi.org/10.3390/agriculture12020280 This Version is available at: http://hdl.handle.net/10419/251273 Standard-Nutzungsbedingungen: Die Dokumente auf EconStor dürfen zu eigenen wissenschaftlichen Zwecken und zum Privatgebrauch gespeichert und kopiert werden. Sie dürfen die Dokumente nicht für öffentliche oder kommerzielle Zwecke vervielfältigen, öffentlich ausstellen, öffentlich zugänglich machen, vertreiben oder anderweitig nutzen. Sofern die Verfasser die Dokumente unter Open-Content-Lizenzen (insbesondere CC-Lizenzen) zur Verfügung gestellt haben sollten, gelten abweichend von diesen Nutzungsbedingungen die in der dort genannten Lizenz gewährten Nutzungsrechte. Terms of use: Documents in EconStor may be saved and copied for your personal and scholarly purposes. You are not to copy documents for public or commercial purposes, to exhibit the documents publicly, to make them publicly available on the internet, or to distribute or otherwise use the documents in public. If the documents have been made available under an Open Content Licence (especially Creative Commons Licences), you may exercise further usage rights as specified in the indicated licence. https://creativecommons.org/licenses/by/4.0/

Welcome message from author
This document is posted to help you gain knowledge. Please leave a comment to let me know what you think about it! Share it to your friends and learn new things together.
Transcript
McGarraghy, Seán et al.
Article — Published VersionConceptual system dynamics and agent-based modelling simulationof interorganisational fairness in food value chains: Researchagenda and case studies
Agriculture
Provided in Cooperation with:Leibniz Institute of Agricultural Development in Transition Economies (IAMO), Halle (Saale)
Suggested Citation: McGarraghy, Seán et al. (2022) : Conceptual system dynamics and agent-based modelling simulation of interorganisational fairness in food value chains: Researchagenda and case studies, Agriculture, ISSN 2077-0472, MDPI, Basel, Vol. 12, Iss. 2 (ArticleNo.:) 280,https://doi.org/10.3390/agriculture12020280
This Version is available at:http://hdl.handle.net/10419/251273
Standard-Nutzungsbedingungen:
Die Dokumente auf EconStor dürfen zu eigenen wissenschaftlichenZwecken und zum Privatgebrauch gespeichert und kopiert werden.
Sie dürfen die Dokumente nicht für öffentliche oder kommerzielleZwecke vervielfältigen, öffentlich ausstellen, öffentlich zugänglichmachen, vertreiben oder anderweitig nutzen.
Sofern die Verfasser die Dokumente unter Open-Content-Lizenzen(insbesondere CC-Lizenzen) zur Verfügung gestellt haben sollten,gelten abweichend von diesen Nutzungsbedingungen die in der dortgenannten Lizenz gewährten Nutzungsrechte.
Terms of use:
Documents in EconStor may be saved and copied for yourpersonal and scholarly purposes.
You are not to copy documents for public or commercialpurposes, to exhibit the documents publicly, to make thempublicly available on the internet, or to distribute or otherwiseuse the documents in public.
If the documents have been made available under an OpenContent Licence (especially Creative Commons Licences), youmay exercise further usage rights as specified in the indicatedlicence.
https://creativecommons.org/licenses/by/4.0/

Citation: McGarraghy, S.; Olafsdottir,
G.; Kazakov, R.; Huber, É.; Loveluck,
W.; Gudbrandsdottir, I.Y.; Cechura, L.;
Esposito, G.; Samoggia, A.; Aubert,
P.-M.; et al. Conceptual System
Dynamics and Agent-Based
Modelling Simulation of
Interorganisational Fairness in Food
Value Chains: Research Agenda and
Case Studies. Agriculture 2022, 12,
280. https://doi.org/10.3390/
agriculture12020280
Academic Editors: Wojciech J.
Florkowski, Francesco Caracciolo
and Sanzidur Rahman
Received: 30 November 2021
Accepted: 14 February 2022
Published: 16 February 2022
Publisher’s Note: MDPI stays neutral
with regard to jurisdictional claims in
published maps and institutional affil-
iations.
Copyright: © 2022 by the authors.
Licensee MDPI, Basel, Switzerland.
This article is an open access article
distributed under the terms and
conditions of the Creative Commons
Attribution (CC BY) license (https://
creativecommons.org/licenses/by/
4.0/).
agriculture
Article
Conceptual System Dynamics and Agent-Based ModellingSimulation of Interorganisational Fairness in Food ValueChains: Research Agenda and Case StudiesSeán McGarraghy 1,* , Gudrun Olafsdottir 2 , Rossen Kazakov 2, Élise Huber 3, William Loveluck 3,Ingunn Y. Gudbrandsdottir 2 , Lukáš Cechura 4, Gianandrea Esposito 5, Antonella Samoggia 6 ,Pierre-Marie Aubert 3, David Barling 7 , Ivan Ðuric 8 , Tinoush J. Jaghdani 8 , Maitri Thakur 9 ,Nína M. Saviolidis 2 and Sigurdur G. Bogason 2
1 School of Business, University College Dublin, D04 V1W8 Dublin, Ireland2 Faculty of Industrial Engineering, Mechanical Engineering and Computer Science, University of Iceland,
Dunhagi 5, 107 Reykjavik, Iceland; [email protected] (G.O.); [email protected] (R.K.); [email protected] (I.Y.G.);[email protected] (N.M.S.); [email protected] (S.G.B.)
3 Institute for Sustainable Development and International Relations (IDDRI), 41 Rue Du Four,75007 Paris, France; [email protected] (É.H.); [email protected] (W.L.);[email protected] (P.-M.A.)
4 Department of Economics, Faculty of Economics and Management of the Czech University of Life SciencesPrague, Kamýcká 129, 16500 Prague, Czech Republic; [email protected]
5 ART:ER—Attractiveness Research Territory, Via P. Gobetti, 101, 40129 Bologna, Italy;[email protected]
6 Department of Agriculture and Food Science, University of Bologna, Viale Fanin 50, 40125 Bologna, Italy;[email protected]
7 Centre for Agriculture, Food and Environmental Management Research, University of Hertfordshire,College Lane, Hatfield, Herts AL10 9AB, UK; [email protected]
8 Leibniz Institute for Agricultural Development in Transition Economies (IAMO), 06120 Halle, Germany;[email protected] (I.Ð.); [email protected] (T.J.J.)
9 SINTEF Ocean, Postboks 4762, Torgard, N-7465 Trondheim, Norway; [email protected]* Correspondence: [email protected]
Abstract: System dynamics and agent-based simulation modelling approaches have a potential astools to evaluate the impact of policy related decision making in food value chains. The context is thata food value chain involves flows of multiple products, financial flows and decision making amongthe food value chain players. Each decision may be viewed from the level of independent actors, eachwith their own motivations and agenda, but responding to externalities and to the behaviours of otheractors. The focus is to show how simulation modelling can be applied to problems such as fairnessand power asymmetries in European food value chains by evaluating the outcome of interventions interms of relevant operational indicators of interorganisational fairness (e.g., profit distribution, marketpower, bargaining power). The main concepts of system dynamics and agent-based modelling areintroduced and the applicability of a hybrid of these methods to food value chains is justified. Thisapproach is outlined as a research agenda, and it is demonstrated how cognitive maps can help in theinitial conceptual model building when implemented for specific food value chains studied in the EUHorizon 2020 VALUMICS project. The French wheat to bread chain has many characteristics of foodvalue chains in general and is applied as an example to formulate a model that can be extended tocapture the functioning of European FVCs. This work is to be further progressed in a subsequentstream of research for the other food value chain case studies with different governance modes andmarket organisation, in particular, farmed salmon to fillet, dairy cows to milk and raw tomato toprocessed tomato.
Keywords: food value chain; system dynamics; agent-based modelling; hybrid method; governance;interorganisational fairness
Agriculture 2022, 12, 280. https://doi.org/10.3390/agriculture12020280 https://www.mdpi.com/journal/agriculture
Agriculture 2022, 12, 280 2 of 30
1. Introduction
A food system constitutes a series of actors performing activities and making deci-sions involved in bringing products from primary production, through processing anddistribution to the final consumer [1]. It is generally acknowledged that industrialised foodsystems are neither sustainable nor resilient and a major transformation is needed [2,3].Pressures to address and implement measures within Food Value Chains (FVCs) to increasethe sustainability of food systems have been mounting in recent years [4,5]. The EuropeanGreen Deal [6] and, in particular, the Farm to Fork strategy have been instrumental driversof change for FVCs and have placed emphasis on sustainability and resilience as keypriorities to address for European food systems [7].
Food system transformation highly depends on the collaboration and cooperation ofFVC actors which is where the issue of fairness plays an important role since actors areless likely to collaborate and coordinate activities when they perceive themselves to beimpacted by unfair trading practices (UTPs) [8]. Earlier findings have indicated that thenegative impact of unfair trading practices on small and medium size enterprises (SMEs)in the EU food sector is affecting the competitiveness of the industry [9]. Another topicof concern is the effect of EU competition law on collaborative practices which has beenidentified to be a barrier to collaborative sustainability initiatives in food value chains [10].
The problem of interorganisational fairness in FVCs is associated with power asym-metries and fair value distribution among actors. In general, profit in a market drivensystem is a prerequisite for the continued operation of businesses and the price is one ofthe most important factors that will increase the fairness perceptions of FVC actors [11].However, the short-term vision to generate profit may have detrimental impact on sup-ply chain relations if power asymmetries in the supply chain undermine the operationalprofitability of smaller agents in the chain [11,12]. Bargaining power in interorganisationalrelationships is a consequence of both the relative strategic significance of the partners(i.e., size of supplier or buyer) and the availability of alternatives (i.e., number of availablesuppliers/buyers and ease of switching supplier/buyer) [13,14]. Bargaining power isconsidered relevant to capture the behaviour of complex modern food value chains whichare characterised by strategic coordination and horizontal concentration in retail and foodmanufacturing [15,16].
The organisation of food value chains as part of the overall food system entails variousgovernance forms and structural characteristics. Strategic coordination through mergersand acquisitions in food manufacturing and retail and the formation of horizontal allianceshas shifted the balance of power in food value chains [12,15,17,18]. The resulting weakposition of farmers, in particular agricultural producers, has been of concern as they maybe placed under pressure and have limited bargaining power in negotiations with largerbuyers such as food manufactures and retail [19–21]. In response to this concern, the EUDirective (2019/633) on unfair trading practices (UTP) aims at protecting weaker suppliers,primarily farmers, including their organisations (e.g., cooperatives) against their buyers, aswell as suppliers of agri-food products which are further downstream [22].
In an effort to assess the influence of policy measures to enhance fairness in FVCs,simulation modelling is of interest. Fairness is a complex issue and often defined alongtwo main dimensions as distributive fairness and procedural fairness. Procedural fairnessconcerns the procedures leading to outcomes. The outcomes can be perceived as fairor unfair (i.e., distributive fairness) but the procedures leading to these outcomes canthemselves also be considered fair or unfair (i.e., procedural fairness). The proceduresin place certainly affect outcomes, although a high level of procedural fairness does notautomatically lead to high levels of distributive fairness. Stakeholders’ views on fairnessare focused on price setting and how pricing decisions are made. The perception offairness is often subjective and highly influenced by where in the supply chain the actorsare embedded [8,23]. Various factors can influence the outcome, such as different firmstrategies related to, e.g., transaction costs, capacities, collaboration, entry barriers or equalpower among partners to define prices, access to relevant information and the treatment

Agriculture 2022, 12, 280 3 of 30
of different partners in a supply chain on behalf of a powerful party [11,12]. Furthermore,the link between supplier fairness and relationship quality has been emphasised; andsupplier dependence is another important factor that can affect the trust between suppliersand retailers [24]. The uncertainty of prices linked to the volatility of commodity pricesand various requirements set by the more powerful actor in buyer and supplier relations,including sustainability criteria, needs to be considered when assessing the outcome ofprice negotiations and distributive fairness.
With a focus on interfirm relations and modelling interorganisational fairness, quan-titative indicators must take into account bargaining power and the importance of pricefor FVC agents, in their effort to maximise their profit or utility. Social concepts morequalitative in nature are excluded from the scope of this study. This paper builds on theconceptualisation and operationalisation of interorganisational fairness in [25] where indi-cators for use in a quantitative model were proposed, e.g., profit margin as an indicatorof distributive fairness and indicators for procedural fairness related to market powerand bargaining power [25]. The product flows can be simulated using system dynamics(SD) which is well suited for modelling such flows [26–28]. The decisions controlling theproduct flow and pricing, which are the principal part of the model, can be modelled usingagent-based modelling (ABM). The main advantage of ABM is its ability to model socialinteractions and so it can aid the study of subjects such as cooperation, competition, andcollaboration in supply chains [29]. The aim is not to determine an absolute measure offairness using these indicators, but rather to ascertain transitions towards fairer outcomes.This approach is in keeping with the European Parliament’s depiction, which, rather thanproviding a strict value measure of UTPs, emphasises the presence of gross deviationsaway from good commercial conduct.
There seems to be a shortage in the literature of research that considers hybrid systemdynamics & agent-based models of the whole food supply chain, from producers to con-sumers, thereby incorporating the full extent of interaction and feedback within the chain;one contribution of this paper is to address this gap in the literature.
The main research question to be addressed here is: Can simulation of food valuechains be used to assess: (a) the effect of strategic interventions on power structure; and(b) the impact on price negotiations between actors in food value chains; where distributivefairness is assessed by profit margin received by value chain actors and power structure isassessed by a proxy for market power and bargaining power?
Hence, the objective of this paper is threefold:
• To set an agenda for research into simulation models of FVCs which hybridise systemdynamics (SD) and agent-based modelling (ABM) methods, and to communicate thebenefits of this approach to an audience of experts in agriculture and FVCs.
• To present how interorganisational fairness is related to governance and power asym-metries and thus identify potential sources of unfair marketing condition. This charac-terises the “real world problem” to be addressed by the simulation model.
• To select the most important elements of the real-world problem using methods suchas cognitive maps and so derive a conceptual model to address the interorganisationalfairness problem.
The structure of the rest of this paper is as follows. Section 2 introduces the mainconcepts of SD and ABM, and the use of a hybrid model is proposed and argued forthe applicability to FVCs. Section 3 provides the background of the study including anoverview of the food system structure and aspects of the fairness problem and governancein FVC case studies. In Section 4 the methodologies applied for the conceptualisation ofthe model are detailed. The results in Section 5 present an outline on how this approach isconceptualised for a particular FVC case study by use of cognitive maps for the wheat tobread chain and we show at a high level how a conceptual hybrid of SD and ABM can modelFVCs and the problem of fairness. Section 6 is discussion and Section 7 gives conclusions.

Agriculture 2022, 12, 280 4 of 30
2. Simulation Modelling Background
For any business operating in a dynamic environment, such as agri-food businesses,optimisation and exact solution techniques cannot give a full and realistic picture of thebusiness for a number of reasons, not least the underlying variability and complexityof the environment [30]. In such complex applications, simulation approaches can givean understanding of how factors such as labour variability, shortages or obsolescence ofmaterials, etc. can affect overall performance [30]. Such simulation models are extensivelyused in the literature [31–33] and specifically in the agri-food domain [29]. Analyticalclosed-form solutions for multitier supply and value chains exist only in very simple cases,e.g., a two-tier supply chain; in other cases, the only practical approach to modelling isto simulate supply and value chains and so analyse the flow of money, information andmaterial through the chain. There are several simulation approaches [33], including systemdynamics, agent-based modelling and discrete-event simulation. In this section, we givean overview of the main simulation modelling approaches extant and the reasoning forour choice of a hybrid approach involving system dynamics and agent-based modelling:namely, that distributive and procedural interorganisational fairness can be captured bythe flows of money and information (distributive) and the relations between interactingagents (procedural).
The endogenous and exogenous characteristics of organisational and market com-plexity are a source of causal ambiguity, emergent behaviour and self-organisational dy-namics [34]; understanding of these is enhanced by general systems theory [35,36] and thesystem dynamics field of research [27,28,37–39]. System dynamics (SD) is an approach tounderstanding the nonlinear behaviour of complex systems over time using stocks, flows,internal feedback loops, functions and time delays. It is a mathematical modelling tech-nique and methodology to frame, understand, and discuss complex issues and problems.Its basis is the recognition that the structure of a system—the many circular, interacting,sometimes time-delayed relationships among its components—can be just as important indetermining its behaviour as the individual components themselves. There have been someapplications in agriculture, e.g., [40] and food supply chains using system dynamics [41–44].However, earlier studies rarely included the flow of money through the system; and, evenwhen included its impact on decision making and the dynamics of the system were usuallyneglected. Financial factors greatly impact on decision making and therefore the physicalflow of products and services; hence, our focus on value chains.
A more contemporary method for exploring complex adaptive systems is agent-basedmodelling and simulation (ABM or ABS) which, in contrast to the system dynamics top-down “macroscopic” perspective, takes a bottom-up “microscopic” view for explainingagent-specific emergent system behaviour (Figure 1). ABM has several features that makeit an appropriate approach for modelling complex characteristics of value chains suchas actor behaviours and interactions [45,46]. An agent is a model of a real-world actor.Agents in such systems act in parallel within an environment, interacting and competingfor control over resources in an adaptive manner, subject to a condition/action rule patternconnected to a specific behavioural decision-making structure [47–50]. Agents may beintelligent, e.g., using ordering rules evolved by learning algorithms [51]. The environmentrepresents all real-world factors not represented by agents. Agent-based simulation modelsare typically built from the bottom up by identifying agents in the system and definingtheir behaviours, including how they interact with other agents and their environment. Thebehaviour of the system as a whole emerges out of multiple concurrent individual agentbehaviours. Each agent is: self-contained (an identifiable, discrete individual with a set ofcharacteristics or attributes, behaviours, and decision-making capability [49]); autonomous(controls its internal state and its own behaviour); situated (in the environment); and social(interact with other agents). Agents have:
• attributes such as capacity, number of employees, production level;• behaviours: the agent senses the environment, decides and acts (within constraints):
responds to actions of other agents, regulations, flows of goods, money, information;

Agriculture 2022, 12, 280 5 of 30
• goals that drive its behaviour (maybe to optimise, maybe to satisfy requirements);• memory and the ability to learn and/or adapt based on experience;• (possibly) resources or stocks.
Agriculture 2022, 12, x FOR PEER REVIEW 5 of 31
• attributes such as capacity, number of employees, production level;
• behaviours: the agent senses the environment, decides and acts (within constraints):
responds to actions of other agents, regulations, flows of goods, money, information;
• goals that drive its behaviour (maybe to optimise, maybe to satisfy requirements);
• memory and the ability to learn and/or adapt based on experience;
• (possibly) resources or stocks.
Agent-based modelling, compared to traditional approaches to modelling economic
systems, can be a more viable approach when there are reasons to think in terms of agents;
for example, when the problem or research question to be explored is naturally repre-
sented by a large number of actors whose decisions and behaviours can be well-defined,
which adapt and change, which learn, which engage in dynamic strategic interactions and
relationships with other actors, and which can have spatial or temporal components to
their behaviours and interactions [52]. An ABM can capture the structure of a system
which has endogenously emerging mechanisms affecting its future evolution. In the food
value chain context, an agent could be a consumer, retailer, producer or indeed any chain
actor: these are independent actors, each with its own motivations and agenda, but each
influenced by the environment.
Discrete event simulation (DES) is a methodology for modelling the behaviour of a
complex real-world system comprising a number of separate processes where stochastic
variability is an important consideration. A DES models the real system as discrete entities
(individual items, e.g., a FVC order) which move through a network of queues (places
where entities wait for processing) and activities (processing of entities, e.g., food pro-
cessing or packing). Thus, each process consists of a discrete time-ordered sequence of
events (discrete changes in system state) considered important by the modeller, and each
event occurs at a particular time (timestamp); for example, if modelling a bakery, the
events studied could be baking and packing events. Time moves forward in discrete steps
(the moments at which events occur), and in a general DES, not all time steps need have
the same duration. Standard applications of DES include modelling of manufacturing sys-
tems and queuing systems with stochastic aspects. As this paper does not consider queue-
ing in the system, but only uses a single system clock, the model developed has only minor
elements of a DES; however, this description is included for completeness. For further
details, see [33] and the references therein. Hybrid simulation comprising ABM to capture
the autonomous and interacting decision making behaviour of the supply chain actors,
together with DES, has been used to model the production processes within a food value
chain [53]. Figure 1 illustrates the relative levels of abstraction of SD, DES and ABS.
Figure 1. Level of abstraction of different simulation approaches. Figure 1. Level of abstraction of different simulation approaches.
Agent-based modelling, compared to traditional approaches to modelling economicsystems, can be a more viable approach when there are reasons to think in terms of agents;for example, when the problem or research question to be explored is naturally representedby a large number of actors whose decisions and behaviours can be well-defined, whichadapt and change, which learn, which engage in dynamic strategic interactions and rela-tionships with other actors, and which can have spatial or temporal components to theirbehaviours and interactions [52]. An ABM can capture the structure of a system which hasendogenously emerging mechanisms affecting its future evolution. In the food value chaincontext, an agent could be a consumer, retailer, producer or indeed any chain actor: theseare independent actors, each with its own motivations and agenda, but each influenced bythe environment.
Discrete event simulation (DES) is a methodology for modelling the behaviour of acomplex real-world system comprising a number of separate processes where stochasticvariability is an important consideration. A DES models the real system as discrete entities(individual items, e.g., a FVC order) which move through a network of queues (placeswhere entities wait for processing) and activities (processing of entities, e.g., food processingor packing). Thus, each process consists of a discrete time-ordered sequence of events(discrete changes in system state) considered important by the modeller, and each eventoccurs at a particular time (timestamp); for example, if modelling a bakery, the eventsstudied could be baking and packing events. Time moves forward in discrete steps (themoments at which events occur), and in a general DES, not all time steps need have thesame duration. Standard applications of DES include modelling of manufacturing systemsand queuing systems with stochastic aspects. As this paper does not consider queueingin the system, but only uses a single system clock, the model developed has only minorelements of a DES; however, this description is included for completeness. For furtherdetails, see [33] and the references therein. Hybrid simulation comprising ABM to capturethe autonomous and interacting decision making behaviour of the supply chain actors,together with DES, has been used to model the production processes within a food valuechain [53]. Figure 1 illustrates the relative levels of abstraction of SD, DES and ABS.
In the process of developing a simulation model to capture behaviour of actors in afood system, a crucial stage is the initial conceptualisation. This involves analysis of theunderlying feedback structure of the system to formulate hypotheses about the system’sdynamic behaviour. A system dynamics modelling approach is useful for studying changesover time in complex supply systems with the aim of building both the understanding of

Agriculture 2022, 12, 280 6 of 30
complexity needed to find effective policies, and the confidence to use that understandingto take action [28].
A food supply system can be viewed as integrated downstream physical flows, up-stream financial flows and decision chains that link these flows. Central to this idea is thatsupply systems are driven by profit and regulated by market dynamics [54]. Using thisapproach, the qualitative conceptual VALUMICS model of the macroscopic structure ofa generic food system was initially presented as a simplified causal loop diagram (CLD)based on supply, demand, and price. Each step in the supply chain (e.g., farming, process-ing, and retail) was captured as a part of a food supply chain feedback structure describingthe relationship between a supplier and a customer: it is natural to model these as agents.Therefore, the chain of agents, each aiming at maximising profit and minimising cost, is inaggregate a reinforcing supply system. Studying the structure and dynamics of food chainsystems in VALUMICS as integrated supply-, value- and decision chains underscores thecomplexity of such systems [54]. Additionally, to use a model of a supply system to foreseepolicy implications, it is useful to consider not only the physical flow of products in thesystem but also the associated flow of funds and the effect it has on decision making. Thedynamics of the systems being studied, with continuous and discrete elements, as well asthe heterogeneity of the actors within them, motivates us to investigate a hybrid simulationmethodology that can capture both system flows and actor behaviours in food value chains.The product flows can be simulated using SD, which is well suited for modelling suchflows. The decisions controlling the product flow and pricing, which are the principal partof the model, were modelled using ABM. Since time passes in discrete steps, the modelis also a DES. Hybrid models are of growing importance in operational research [33] butseem to be less commonly used in the agri-food context, though there has been some recentwork on short supply chains [55].
A major aim of the VALUMICS project was to develop an integrated hybrid SD/ABMquantitative simulation model for use by policy makers and other stakeholders, and socontribute both academically and practically. The model developed is regarded as a lab-oratory for experiments and simulations to explore if and how regulatory interventionsand changes in individual actor behaviour may drive overall system behaviour. It focusseson fairness issues, especially unfair trading practices in food value chains, and underpinsother VALUMICS work on scenario development with a broader remit (e.g., resilience,sustainability, and integrity in general). The food systems studied comprise a large andcomplex system as discussed in Section 3: these can only be interpreted from a limitedviewpoint both because of the modellers’ need to select and simplify, and the lack of avail-ability of complete and exhaustive information on the system: thus, many simplificationsand assumptions are needed.
This paper derives a conceptual model giving a functional specification: what thehybrid simulation model will do. It highlights the main relevant decisions of each marketactor in each FVC, and their explanations based on procedural and other aspects, includingconditional factors and what-if questions. The conceptual modelling is addressed usingqualitative techniques such as cognitive maps, agent interaction and agent behaviour rulemaps. These also aid the modeller in reframing the main research question in terms of themodel, exploring the model boundary, and generating dynamic hypotheses for simulationtesting. The description of this conceptualisation stage is exemplified only by the Frenchwheat to bread case study, which is the focus of the modelling work presented in thispaper. Other case studies investigated are presented in the following section to provide anoverview of real-world issues concerning fairness in FVCs.
All modelling approaches assume certain properties of the real-world situation beingmodelled, that is, represent it in a simplified way for reasons of economy of description,mathematical tractability or computational cost). The hybrid SD/ABM approach can cap-ture flows of money, materiel and information in the FVC (SD) and choices/decisions/actionsof individual actors based on what they see around them (ABM). The level of detail of themodel constrains what can be studied and so what questions can be addressed. Computa-
Agriculture 2022, 12, 280 7 of 30
tional cost considerations and available hardware constrain the number of agents modelledto a fraction of the number of real-world actors (though careful adherence to real-world pro-portions may mitigate this provided the numbers of agents can give statistically significantconclusions). Furthermore, we as modellers select for inclusion in the model what we re-gard as important; and we may potentially exclude important aspects of the real world fromthe model. In this case, the agent attributes and behaviours chosen are those relevant tointerorganisational fairness as measured by our chosen metrics; attributes and behavioursnot connected to this (e.g., to do with cultural aspects or sustainability) have not beencaptured and so questions involving those attributes and behaviours cannot be answeredby this paper’s approach. For example, such important real-world concepts as communityresilience, long-term sustainability, and cultural diversity have been excluded from thescope of the model. The attributes and behaviours could also be extended to address otherquestions, which would make the model more complex and indeed cumbersome, if notcomputationally intractable. By the same token, other simpler approaches (e.g., a pure SDmodel with no modelling of actors as agents) could address some questions—if to a lesserextent of richness—at a lower computational cost.
All models are simplifications but can be useful when populated with reliable data.Conversely, data gaps can limit the quality of a model. Lack of data turned out to be amajor limiting factor in the later building of this model, and high-impact assumptionsneeded to be made when data gaps were encountered, especially concerning firm leveldata and particularly for non-farmer actors. Secondary data from different European leveldata, national level data and regional level data was available on e.g., Eurostat, FAOSTAT,Euromonitor databases and national databases, while FADN and Amadeus databases wereused for micro data respectively at farm and company level:
• Secondary data from different databases have different structures caused by divergentproduct classifications, time periods covered, commodity aggregations, and geograph-ical reach. At the farm level the FADN data was detailed and possible to reconstructto meet the modelling and analysis needs. However, at the processing industry level,the data available does not provide physical volumes passing through the processingindustries; thus, it is difficult to link biophysical flows and socio-economic outcomes.
• Other limitations constraining the research and development of the model were thefacts that data is aggregated at the national level and that no data is available regardingthe share of differentiated vs. commodified/standardised production.
• Data is available at the firm level for specific firms; however, it is often incomplete(e.g., few data on business expenses) and big firms are often over-represented inthe sample.
• Another factor causing difficulties is that firms are classified based on their sector ofactivity. For firms operating in more than one sector, all data values are assigned tothe dominant sector. Also, some of the food processing is also realised by retailers(e.g., cutting and packing meat) so it is difficult to separate their main business fromthe processing activities.
3. Food System Background—Case Studies
In a conceptual modelling exercise, it is crucial to examine as much of the contextof the problem as possible to avoid the possibility of omitting some vital concept or data.This is done here, to convey the richness of the real-world system being modelled andthe compromises necessary to arrive at a simplified yet requisite model. This research ispart of the EU H2020 VALUMICS project which aims at improved understanding of thedynamics of food value chains. The general objective is to provide tools and approachesto enable decision makers to evaluate the impact of strategic and operational policiesaimed at enhancing fairness, integrity, and resilience in future scenarios of sustainable foodvalue chains (FVCs). The VALUMICS project applied a systems approach and involved aninterdisciplinary group of experts to perform analysis of food system related issues. Thisprovided insights on the structure, material flows, governance, economics, environmental
Agriculture 2022, 12, 280 8 of 30
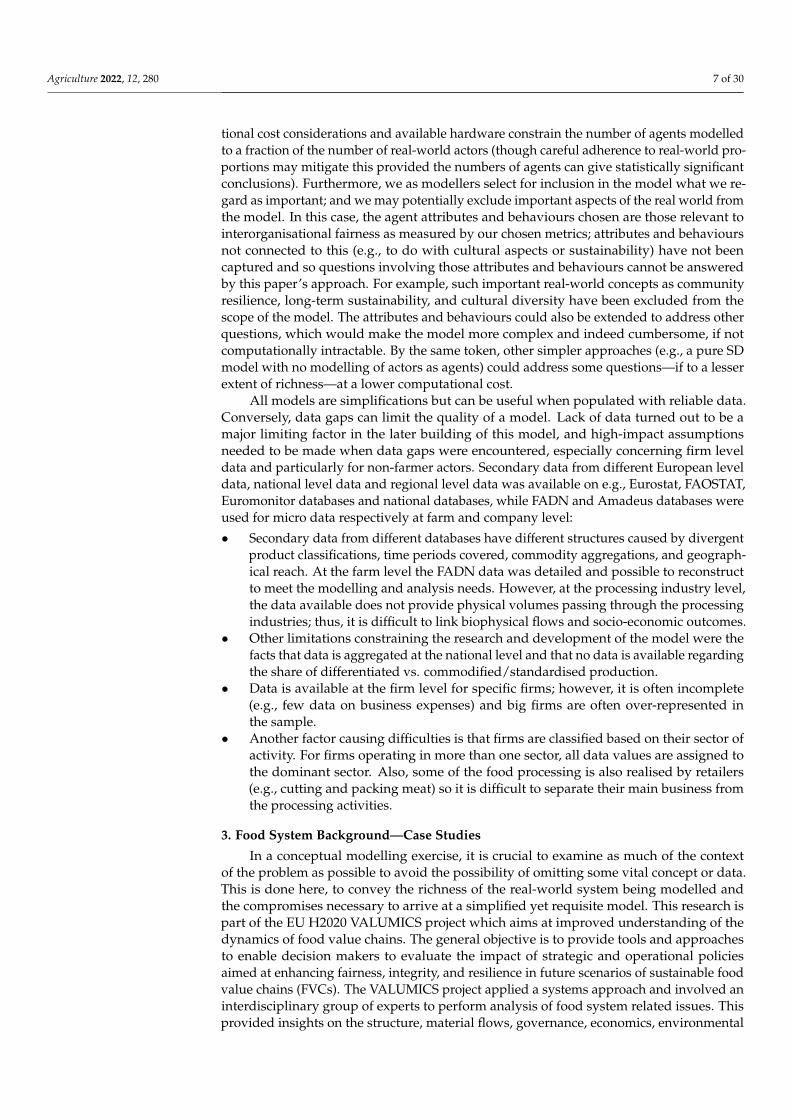
impacts, and consumer behaviour related to different food value chain [56,57]. The researchactivities were carried out through the following case studies: Dairy cows to milk, Beefcattle to steak, Wheat to bread, Farmed salmon to fillets and Tomato to processed tomato.The FVCs all have a similar structure as depicted in Figure 2, showing the integration offlow charts of the selected case studies with the flow of products through similar stages ofthe supply chains.
Agriculture 2022, 12, x FOR PEER REVIEW 8 of 31
compromises necessary to arrive at a simplified yet requisite model. This research is part
of the EU H2020 VALUMICS project which aims at improved understanding of the dy-
namics of food value chains. The general objective is to provide tools and approaches to
enable decision makers to evaluate the impact of strategic and operational policies aimed
at enhancing fairness, integrity, and resilience in future scenarios of sustainable food value
chains (FVCs). The VALUMICS project applied a systems approach and involved an in-
terdisciplinary group of experts to perform analysis of food system related issues. This
provided insights on the structure, material flows, governance, economics, environmental
impacts, and consumer behaviour related to different food value chain [56,57]. The re-
search activities were carried out through the following case studies: Dairy cows to milk,
Beef cattle to steak, Wheat to bread, Farmed salmon to fillets and Tomato to processed
tomato. The FVCs all have a similar structure as depicted in Figure 2, showing the inte-
gration of flow charts of the selected case studies with the flow of products through simi-
lar stages of the supply chains.
Figure 2. An overview of the food system approach demonstrating the key stages in food value
chains and the associated flow of stocks for the food supply chains case studies in the VALUMICS
project (adapted from [57]).
It is generally understood that primary production, in particular intensive farming,
cause the main environmental burden in the whole life cycle of agri-food, including meat,
dairy, and aquaculture products, where the use of feed connects the challenges of the food
supply chains (Figure 2). The end market of products also matters, since the use of fuel
during transport can also contribute considerable climate change impacts of exported
products in distant markets and the waste generated throughout all stages [58,59].
Although most food value chains share many sustainability challenges, they differ in
several aspects affecting the prevalence and extent of interorganisational fairness prob-
lems associated with profit distribution which is the focus of this paper and the scope of
the simulation model described herein. Differences regarding interorganisational fairness
can, to some extent, be attributed to the governance and the strategic coordination in terms
of horizontal or vertical collaboration, and the rules for distributing value added [60–62].
This was demonstrated in the governance analysis in case studies in the VALUMICS pro-
ject [8]. This section provides a summary of the main findings of governance analysis in
terms of interfirm relations in four case study FVCs. Moreover, economic analysis in the
selected case studies provide evidence to substantiate the findings. These include studies
on market power, price formation and price transmission [63], assessment of economies
of scale and technical efficiency [64], persistence of supply chain relations [65], including
also statistical analysis of agribusiness profitability [66]. The economic analysis provided
Figure 2. An overview of the food system approach demonstrating the key stages in food valuechains and the associated flow of stocks for the food supply chains case studies in the VALUMICSproject (adapted from [57]).
It is generally understood that primary production, in particular intensive farming,cause the main environmental burden in the whole life cycle of agri-food, including meat,dairy, and aquaculture products, where the use of feed connects the challenges of thefood supply chains (Figure 2). The end market of products also matters, since the use offuel during transport can also contribute considerable climate change impacts of exportedproducts in distant markets and the waste generated throughout all stages [58,59].
Although most food value chains share many sustainability challenges, they differ inseveral aspects affecting the prevalence and extent of interorganisational fairness problemsassociated with profit distribution which is the focus of this paper and the scope of thesimulation model described herein. Differences regarding interorganisational fairness can,to some extent, be attributed to the governance and the strategic coordination in terms ofhorizontal or vertical collaboration, and the rules for distributing value added [60–62]. Thiswas demonstrated in the governance analysis in case studies in the VALUMICS project [8].This section provides a summary of the main findings of governance analysis in terms ofinterfirm relations in four case study FVCs. Moreover, economic analysis in the selectedcase studies provide evidence to substantiate the findings. These include studies on marketpower, price formation and price transmission [63], assessment of economies of scale andtechnical efficiency [64], persistence of supply chain relations [65], including also statisticalanalysis of agribusiness profitability [66]. The economic analysis provided useful insightsto the functioning of FVCs [67] and further underpinned the conceptual modelling workdescribed in Sections 4 and 5. Considering the socio-economic impacts, the profitabilityand competitiveness of the enterprises constituting food value chains are key elements toensure employment and livelihoods.
A snapshot of the key results of the governance analysis (Figure 3) shows the mosttypical governance modes in these FVCs and, thus, possible sources of unfair marketconditions. There is complexity in the governance modes, the size of firms has an impact,and various externalities have shaped the food value chains and motivated changes in the

Agriculture 2022, 12, 280 9 of 30
interfirm relations over time. Examples of factors which can influence decision makingand contribute to procedural fairness in the food value chains are shown in Figure 3(top). These factors are related to laws and regulations, power, environmental stability,collaboration, civil society pressure which motivates for example the uptake of voluntarystandards including third party certification. Also, there are common macroeconomicfactors that affect commodities’ prices like global supply and demand, energy prices andtrade agreements, including tariffs and quotas.
Agriculture 2022, 12, x FOR PEER REVIEW 9 of 31
useful insights to the functioning of FVCs [67] and further underpinned the conceptual
modelling work described in Sections 4 and 5. Considering the socio-economic impacts,
the profitability and competitiveness of the enterprises constituting food value chains are
key elements to ensure employment and livelihoods.
A snapshot of the key results of the governance analysis (Figure 3) shows the most
typical governance modes in these FVCs and, thus, possible sources of unfair market con-
ditions. There is complexity in the governance modes, the size of firms has an impact, and
various externalities have shaped the food value chains and motivated changes in the in-
terfirm relations over time. Examples of factors which can influence decision making and
contribute to procedural fairness in the food value chains are shown in Figure 3 (top).
These factors are related to laws and regulations, power, environmental stability, collab-
oration, civil society pressure which motivates for example the uptake of voluntary stand-
ards including third party certification. Also, there are common macroeconomic factors
that affect commodities’ prices like global supply and demand, energy prices and trade
agreements, including tariffs and quotas.
Figure 3. Governance and externalities influencing the functioning of the food system and the type
of interfirm relations between key actors in the FVC case studies (authors’ interpretation based on
[8]. Note: PO: Producer Organisation, IBO Interbranch Organisation, Coop: Cooperative.
The governance modes in the FVCs were explored through the Global Value Chain
(GVC) governance framework [60] using the typologies of interfirm relations which are
defined by the degree of strategic coordination ranging from; (i) free market exchanges
where partners can easily switch between buyers; (ii) modular where products are cus-
tomised and the seller takes responsibility of investment needed to provide technology
used; (iii) relational implies mutual dependence where trust and reputations are key ele-
ments but there is complexity in transactions, (iv) captive refers to strict monitoring from
the lead firm and where switching to other partners is costly; and (v) hierarchies refers to
vertically integrated firms where key actor has power over e.g., subsidiaries in the chain.
In fact, there is complexity in these relations especially concerning large firms which is
pointing to hybrid forms of governance. An example is when one firm can have different
relations with their partners and may interact differently depending on e.g., markets, sales
channels, and logistic priorities [68]. Governance structures are complex and include in-
ternational as well as national regulations, and public (i.e., government regulations), pri-
vate (i.e., cooperatives), and social (i.e., non-governmental organisations) forms of gov-
ernance, acting vertically (e.g., along the chain) or horizontally (e.g., within a single level
Figure 3. Governance and externalities influencing the functioning of the food system and the typeof interfirm relations between key actors in the FVC case studies (authors’ interpretation based on [8].Note: PO: Producer Organisation, IBO Interbranch Organisation, Coop: Cooperative.
The governance modes in the FVCs were explored through the Global Value Chain(GVC) governance framework [60] using the typologies of interfirm relations which aredefined by the degree of strategic coordination ranging from; (i) free market exchangeswhere partners can easily switch between buyers; (ii) modular where products are cus-tomised and the seller takes responsibility of investment needed to provide technologyused; (iii) relational implies mutual dependence where trust and reputations are key ele-ments but there is complexity in transactions, (iv) captive refers to strict monitoring fromthe lead firm and where switching to other partners is costly; and (v) hierarchies refers tovertically integrated firms where key actor has power over e.g., subsidiaries in the chain.In fact, there is complexity in these relations especially concerning large firms which ispointing to hybrid forms of governance. An example is when one firm can have differentrelations with their partners and may interact differently depending on e.g., markets, saleschannels, and logistic priorities [68]. Governance structures are complex and include inter-national as well as national regulations, and public (i.e., government regulations), private(i.e., cooperatives), and social (i.e., non-governmental organisations) forms of governance,acting vertically (e.g., along the chain) or horizontally (e.g., within a single level of thechain) [69]. In all the FVCs in Figure 3, retail is the lead actor, with different relations withtheir suppliers often being captive ones (red arrows). Various types of interfirm relationsare identified between actors in the different value chains; and strategic coordination (greenbroken lines) is evidently influencing the bargaining power of producers in the tomato andsalmon chain. Various strategies and interventions such as interbranch organisations (IBO),producer organisations (PO), cooperatives, voluntary codes of practice, and mandatorylegislation have been implemented to achieve fairer trading and working conditions, and

Agriculture 2022, 12, 280 10 of 30
greater transparency and information flow in food value chains. These interventions andmechanisms need to be suitable for each respective food sector and consider the overallfood system [8]. Cooperative and PO membership is one of the main mechanisms used byfarmers to improve their bargaining position [14] and research indicates that members areless likely to be subject to UTPs [23]. The POs are recognised and regulated by the EU (Reg1308/2013) as part of the European Common Agricultural Policy (CAP) [70].
The interfirm relations in the wheat to bread chain in France point to a captive situationof farmers towards their cooperatives (red arrow in Figure 3) who coordinate with largemillers. The captive situation of traditional bakers towards millers is possibly a risk ofunfair trading practices in price negotiations between these actors. Moreover, the retaileras lead firm has a strong position towards millers and industrial bakers. Indeed, marketimperfections were detected within the output and input markets for both the millingand baking sectors in France and the UK when market power was assessed by ‘Mark-up’and ‘Mark-down’, or ‘Lerner’ index [71]. The French wheat market is integrated withthe world market and leads the EU market concerning wheat price formation, but it iscurrently facing high competition from Black Sea grain exporters (i.e., Russia, Ukraine andKazakhstan) [72].
The dairy to milk chain is characterised by bipolar governance where raw milk pro-ducers are captive suppliers towards processors and dairy cooperatives, the ‘lead firms’.Modular or relational interfirm relations are identified where retailers are ‘lead firms’ anddairy cooperatives and private dairy processors are ‘turn-key’ suppliers or modular rela-tions (Figure 3). Milk producers in Germany, France and the UK face a negative price/costratio in the long run, indicating low bargaining power despite being a part of producercooperatives. Support available for producers includes POs and provision for mandatorycontracts (under the EU “milk package” of reforms). A legal change to the frameworkfor setting contracts has been introduced in France, and the UK has experimented witha voluntary code of best practice on contractual relationships between producers andprocessors. Currently, the POs are beginning to negotiate over volume management as wellas price in France [73].
To substantiate further the governance analysis in the dairy chain in France, UK andGermany, economic analysis identified certain level of oligopsony and oligopoly powerat the level of producers and processors [63]. Similarly, in another study a certain level ofoligopoly for dairy processors in France, Italy and Spain has been reported [74]. Resultsfrom technical efficiency analysis in the European dairy industry indicate a certain degree ofsystematic failure, e.g., permanent managerial failures and structural problems in Europeandairy processing industry [75]. Stakeholder concerns exist around setting of prices betweenthe producers as sellers and the processor and or retailer as main buyer, and volumes ofmilk supply agreed upon. Price negotiation of milk between the farmers and cooperativeshas been pointed out as a potential UTP, since some producers may have a vested interestby being part-owners of the cooperatives. Price dynamics from producer level are almostcompletely transmitted to the wholesale level of the dairy value chain [63].
Contrary to the captive situation of producers in the dairy and wheat chains, theproducers in the tomato and salmon chains have relational modes through contracts withtheir buyers. (Figure 3). This demonstrates the effect of strategic coordination of upstreamactors (as indicated by the green broken lines) through POs and Inter-Branch Organisations(IBOs) in the raw tomato to processed tomato chain in the Emilia-Romagna region ofNorthern Italy. The IBOs play a crucial role in price setup and balancing of power betweenproducers and processors. The market power has switched towards producers after creationof the regional IBO, ensuring higher competitiveness and sustainability through mutualagreement on quality criteria and prices which benefits all. The governance between theproducers (PO) and the processors is relational; but retailers, as lead firms in the chain, showaspects of both the modular and captive modes towards processors (Figure 3). Processorsface significant “pressure” on their selling price when it comes to dealing with retailers(not part of the IBOs). The economic analysis indicates that price dynamics present at

Agriculture 2022, 12, 280 11 of 30
the producer and processing levels are not reflected at the retail level. Most of the retailpurchases go through auctions where processors usually need to squeeze their marginsduring the negotiation process. Indeed, the reverse auction of retailers has been identifiedas a potential UTP [8,63]. The small tomato producers have taken advantage to improvescale efficiency by increasing the scale of operations, resulting in growth of total factorproductivity at the producer level [76].
In the farmed salmon to fillet chain, the upstream consolidation of aquaculture compa-nies through mergers and acquisition has reduced the number of farming companies; andhas helped companies take advantage of scale and strengthened their position on globalmarkets. The producers in the global aquaculture value chain benefit from favourablemarket conditions (e.g., demand far exceeding supply). The key players are large vertically-integrated aquaculture producers who have a strong bargaining position and a relationalgovernance mode with the supermarket ‘lead firms’ (Figure 3, green dotted line). Third-party assessment and certification schemes enable hybrid governance forms and inter-firmrelationships can have a range of forms from free market exchange where products are soldon spot market, to long-term relational contracts between large integrated companies andretail or large secondary processors. Small secondary processors may be captive towardsretail [8,77]. Economic studies on market power in the salmon chain identified a “low-level”of market imperfectness [78], however, price transmission analysis shows that the salmonexport price of Norway directly influences price development in the selected EU markets,France and Poland. Different value chain governance and interfirm relations directly definewhich actor of the value chain dominates price formation in the exporting country: retailersin France (having direct contractual relations with Norwegian exporters) and processors inPoland (directly owned by Norwegian companies) [63]. There are potential risks of UTPsconcerning the strong position of producers and the possibility of influencing prices at thestock market [77].
4. Materials and Methods4.1. Developing a Conceptual Hybrid System Dynamics/Agent-Based Model
In this section, the steps of the method for development of a conceptual hybridsimulation model are explained, showing how the defined problem and objectives areincorporated. In the VALUMICS project, this work was carried out iteratively using an agileapproach, jointly by the modelling team and the food value chain case study subject matterexperts. The conceptual modelling followed established practice to ensure the design andimplementation of a valid and robust simulation model capable of providing means forvirtual policy experimentation and decision analysis and optimisation. The modellingapproach followed five general steps [28]: problem definition (boundary selection), dy-namic hypothesis generation, simulation model formulation, model testing and use inpolicy evaluation. A similar approach is given by Randers [38], emphasising that mod-elers need to follow stages of conceptualisation (incorporating the first two of Sterman’ssteps), formulation, testing and implementation. Similarly, Richardson & Pugh [79] andRoberts [80] propose the modelling stages as problem definition, system conceptualisation,model formulation/representation, model behaviour and analysis, evaluation and policyanalysis and use. In Figure 4, the stages used in the VALUMICS project for simulationmodelling of food value chains are given.
This paper’s focus is the first conceptualisation stage: this is the process of developingthe modellers’ conceptual understanding of the components of the system and how thesecomponents influence each other’s behaviour [38]. In system dynamics, the main compo-nents are resources, flows, variables, and feedback resource interrelations. In ABM, themain components are agents, their attributes and behavioural rules, and agent interrela-tions [49].

Agriculture 2022, 12, 280 12 of 30
Agriculture 2022, 12, x FOR PEER REVIEW 12 of 31
formulation/representation, model behaviour and analysis, evaluation and policy analy-
sis and use. In Figure 4, the stages used in the VALUMICS project for simulation model-
ling of food value chains are given.
Figure 4. Key stages of the modelling approach in VALUMICS (Authors own conceptualisation pre-
viously presented in project deliverable [67]).
This paper’s focus is the first conceptualisation stage: this is the process of developing
the modellers’ conceptual understanding of the components of the system and how these
components influence each other’s behaviour [38]. In system dynamics, the main compo-
nents are resources, flows, variables, and feedback resource interrelations. In ABM, the
main components are agents, their attributes and behavioural rules, and agent interrela-
tions [49].
Once the conceptualisation stage has identified the system and the agents, as well as
their states, relationships, behaviours and interactions, the next step is to formalise these
concepts. This is the formulation stage, which includes the quantitative model building.
Formalisation is needed because even though the identified concepts may seem well-de-
fined to the stakeholders, they may be far more context-dependent or situation-specific
than the stakeholders realise—and models and computers cannot deal with ambiguity
and context-dependency. That is, the model of the world needs to be made explicit, for-
mal, and computer-understandable (as well as being human-understandable). Once for-
malised in pseudocode, this can then be implemented as a computer simulation. The idea
is to design a simple enough, yet sufficient, SD/ABM architecture capable of capturing the
system components common to all FVCs and agent levels and categories (in connection
to the focus on fair value and fair contractual relations) and their interrelations, and then
later to adjust and fine tune it to each specific FVC case study, including exploration of
connections to anticipatory scenarios and transition pathways. Formalisation in SD com-
prises the stock and flow formal diagrams needed to account for the system structure and
the proper mathematical interrelations among the model variables; whereas, in ABM it
comprises the coding of agent behaviour in the model.
The subsequent testing stage covers model calibration and verification, with the pur-
pose of proving the proper quantification of the simulation model. The final implementa-
tion stage involves the application of the simulation model to policy evaluation by carry-
ing out “what-if” scenario simulations to test previously identified hypotheses and find
how variation in key input variables influences the behaviour of the whole system. Future
work will follow a research agenda completing these stages.
Figure 4. Key stages of the modelling approach in VALUMICS (Authors own conceptualisationpreviously presented in project deliverable [67]).
Once the conceptualisation stage has identified the system and the agents, as well astheir states, relationships, behaviours and interactions, the next step is to formalise theseconcepts. This is the formulation stage, which includes the quantitative model building.Formalisation is needed because even though the identified concepts may seem well-defined to the stakeholders, they may be far more context-dependent or situation-specificthan the stakeholders realise—and models and computers cannot deal with ambiguity andcontext-dependency. That is, the model of the world needs to be made explicit, formal, andcomputer-understandable (as well as being human-understandable). Once formalised inpseudocode, this can then be implemented as a computer simulation. The idea is to designa simple enough, yet sufficient, SD/ABM architecture capable of capturing the systemcomponents common to all FVCs and agent levels and categories (in connection to thefocus on fair value and fair contractual relations) and their interrelations, and then later toadjust and fine tune it to each specific FVC case study, including exploration of connectionsto anticipatory scenarios and transition pathways. Formalisation in SD comprises thestock and flow formal diagrams needed to account for the system structure and the propermathematical interrelations among the model variables; whereas, in ABM it comprises thecoding of agent behaviour in the model.
The subsequent testing stage covers model calibration and verification, with the pur-pose of proving the proper quantification of the simulation model. The final implementationstage involves the application of the simulation model to policy evaluation by carryingout “what-if” scenario simulations to test previously identified hypotheses and find howvariation in key input variables influences the behaviour of the whole system. Future workwill follow a research agenda completing these stages.
4.2. Sources of Domain Knowledge
To ensure a common understanding between the modelling team and the case studyexperts, joint practical workshops took place where the methodological approach wascarried out, including the use of qualitative techniques such as cognitive maps according tocognitive mapping theory [81,82] as detailed by [83] (see Section 4.5). The team performedinitial group modelling work on the conceptual model by using agent maps, decisiontables and cognitive maps linked to the FVC case studies on tomato, wheat, salmon,and dairy. Following this, the expert teams worked together through online meetingsand documentation of the problem structuring and problem definition, further using thecognitive maps to elucidate the agents’ behaviours and interactions. A crucial purpose wasto increase understanding among the modellers and the expert team working on futurescenario developments in the VALUMICS project and for this purpose to put forwardrelevant “what-if” questions which the model was to be designed to answer. This process

Agriculture 2022, 12, 280 13 of 30
was also vital for the modellers to frame the main research question, explore the modelboundary and generate dynamic hypotheses for simulation testing.
The details of the functioning of the French wheat to bread chain, including the gov-ernance and functioning of the value chain, are based on background knowledge of theVALUMICS expert team gained through the various analysis and empirical findings in thecase studies as reported in the project´s deliverables and published papers (see Section 3).This includes findings from governance analysis through expert or élite interviews, an-alyzed in conjunction the documentary and secondary data sources [8]. Furthermore,economic analysis on market power, price formation, technical efficiency and persistencyof relations [63–65] and specifically in the context of the wheat to bread case study [71,72]provided insights to the real world system being modelled. The documentation of theconceptual model development was through agent tables and cognitive maps in groupmodelling workshops.The validation of the simulation modelling conceptualisation wascarried out through the process of iterative group conceptual model building workshops(application of cognitive and agent maps), based on expert and stakeholders’ opinion inrelation to gaining agreement on the true representation of the system components andtheir interrelations. Where important information was missing, informed assumptionsneeded to be made based on documented expert opinion or published sources.
4.3. Fairness Metrics
The VALUMICS project considered two dimensions of fairness: procedural and dis-tributive fairness. As mentioned in the introduction, interorganisational fairness can bemeasured by gross profit margin as a proxy for distributive fairness The choice of fairnessmetrics in this paper is based on the conceptualisation and operationalisation of interorgan-isational fairness in [25]. When calculating gross profit margin, revenues were adjustedto include any subsidies and support, including environmental public financing (e.g., di-rect payments under CAP). The emergent pattern of interest is the observed distributionof adjusted gross profit: a desired emergent pattern is a fairer distribution of adjustedgross profit.
To measure procedural fairness, the VALUMICS project investigated the degree ofmarket power by using as a proxy the Lerner Index for output market and relative mark-down index for input market. The Lerner Index L is a very widely adopted metric thatprovides an estimate of market power in an industry, measuring the price-cost marginthrough the difference between the output price of a firm and the marginal cost dividedby the output price [84]. The index ranges from a high value of 1 to a low value of 0,with higher numbers implying greater market power. For a perfectly competitive firm,L = 0 and such a firm does not exercise market power; equally, when L = 1, a firm hasmonopolistic power. Analogously, one can define a mark-down index for the input market.Both indexes can be used as measures of the departure from perfect competition and so canbe considered as good measures of fairness according to economic theory. Cechura andJaghdani [71] show that the Lerner Index, Ld for markdown or input market and Lu formarkup or output market, respectively, can be calculated as
Ld =MRPx − wx
MRPx(1)
andLu =
P − MCP
(2)
where MRPx represents marginal revenue product of input x, wx is the price of input x, MCstand for marginal costs and P is the price of product. The Lerner index was originallydefined only for the output market [85]. Cechura and Jaghdani [71] redefined it for theinput market as well, building on work in [86].

Agriculture 2022, 12, 280 14 of 30
4.4. Modelling Scope—Boundary and Hypothesis Generation
All modelling is about making informed choices of selection: what should be includedin the model and what may be (reasonably) safely excluded without significant degradationof quality of results. In the “Conceptualisation” stage covered in this paper the focus is onproblem definition and boundary selection (model scope), including relevant hypothesisgeneration. Scope is restricted according to the “Einstein’s razor” modelling maxim: “assimple as possible, but no simpler”. The boundary must not only be related to the mainresearch question on distributive and procedural fairness in food value chains, but alsoto the choice of geographical location (country market) and number of agents involved.In VALUMICS, the wheat to bread chain was investigated in the context of the Frenchmarket. This boundary selection is necessary for every simulation model due to technical(computational) and other constraints such as complexity, timing, access to and availabilityof relevant qualitative and quantitative data and resources for design and production. Thepurpose of the simulation modelling is not to produce an exact replica of the entire systemand how it functions (impossible technically, and indeed unnecessary); but rather to capturethe main factors and interrelations among system components with a reasonable trade-offbetween accuracy and simplicity, to ensure it can provide insights for the proper analysis ofthe system behaviour in relation to the main research questions, and exploration of optionsfor solutions.
For reasons of available computational power, the number of tiers in the value chainwas restricted to five (producer, collector, processor, retailer, consumer); and the numberof actors (agents) at a given tier was restricted to a number for which simulations can becarried out in a reasonable time, at a reasonable computational cost. For each case studyexamined, this generic five-tier base FVC was then adapted to capture the attributes andcharacteristics of that case study FVC. This approach allowed for the greatest possible reuseof design and computer code, and minimised redundancy of effort.
At each tier, actors (agents) of three categories, small, medium, and large, weremodelled, with the number of agents in each category informed by the real-world prepon-derance together with the technical feasibility of running a computer program instantiatingthat number of agents. This allowed modelling of the heterogeneity of real-world FVCs.Typically, there may be three to five large players at a given tier, with greater numbers ofmedium and/or small players. Since these limitations only become clear at the implemen-tation stage, the exact numbers were to be decided at a later stage. The characteristics of thedifferent categories of actors were also required, and the values of necessary parameters.In cases where the technical limitations did not allow modelling of the full population ofactors in a given FVC, the approach taken was to model a proportion of them as agents.
To further constrain the simulation model scope, it was decided to focus on existingvalue chain structures, assuming that these will remain valid at least until 2030. Scenariodevelopment in subsequent VALUMICS work uses existing FVC structures (numbers oftiers and types of actors and interactions among them, though possibly changing numbersof actors at each tier) up to the year 2030. One reason for this was that it would be easierfor stakeholders to relate to: there is a lot of uncertainty after 2030. It was decided that if atransition pathway to a future scenario envisaged specific changes to FVCs (e.g., certainactors join the chain, certain actors leave), that would be addressed in future work.
The focus on interorganisational fairness required the specification of one or moreresearch questions related to the fairness problem definition. For that purpose, and todetermine of the scope of the model, a cognitive mapping technique was applied to defineagent decisions and interactions. While the model developed focussed on fairness, it hadto do so while considering other constraints related to sustainability—that are not to bemodelled per se, but that are considered as external constraints from the environment.Otherwise, it might well be the case that a way to make a FVC fairer is simply to continuedepleting the environment or externalise the costs of social regulation to the environment(as is already the case in many FVCs, where farmers simply “pass on” to the environmentthe constraints they receive from downstream players).

Agriculture 2022, 12, 280 15 of 30
4.5. Stages of Conceptual Modelling: Cognitive Maps and Related Techniques
The modelling effort applies techniques including cognitive mapping and agent be-haviour mapping for system analysis and agent rules definition, to determine the modelcontent including the physical and social elements of the system and the links betweenthem. The VALUMICS conceptual model derived is described in the Results section. Thegoal of this qualitative agent modelling approach is to support the conceptual, functional,and technical specification for the quantitative modelling phase.
The behaviour of each agent can be captured in a story/narrative which explainswhich agent does what with whom and when. This requires detailed input from the subjectmatter experts of the case study teams, to define agents and their decisions, behaviours,and interactions. A useful high-level approach to this is to consider what actors there are ina particular value chain and, for each one, think of how that actor (modelled as an agent)will behave in practice:
• What happens in “a day in the life” of this actor—what does this actor do?• What interactions has this actor with other actors, whether in the same tier or not
(which agent rules affect which other agent rules)?• What interactions has this actor with the environment?• What decisions does this actor make (related to fairness, e.g., pricing decisions)?• What influences these decisions (prices, regulations, environmental factors)?
Cognitive maps are used to capture what system element influences what, and decisiontables are used to identify the agent decisions together with what influences them andtheir other characteristics. In the VALUMICS hybrid model the behaviour of agents wasdefined in terms of decision rules executed upon special events and in interactions withother agents.
Cognitive mapping [87,88] is related to mapping individual and group mental modelsabout a research question and to Cognition theory [81,82]. For example, Elsawah et al. [83]use cognitive mapping to capture and analyse qualitative information from stakeholders onthe issue of viticulture irrigation in Australia, and further to inform a better approach forcapturing agents’ decision-making procedures. They demonstrate how cognitive mappingbrings advantages for ABM design and parameterisation: ‘The action-oriented natureof concepts in the map makes it explicit about “what action is taken”, and “by whom”.Therefore, the structure and flow of decision making becomes explicitly represented in acognitive map. Thus, the cognitive map allows for capturing behaviour rather than justattributes of agents, as well as the interactions between actors’ perceptions, states of theirworlds, and choice states’ [83].
Agent interaction mapping (AIM) and Agent behaviour mapping (ABM) are tech-niques, associated with the cognitive mapping technique but with a different aim, to analyseagents, agents’ rules and interrelations [89]. The design purpose and theoretical frameworkof the cognitive and agent mapping techniques are presented in Table 1. The results of thecognitive mapping are presented in detail in this paper using as an example the wheat tobread case study (Section 5.3).
Table 1. Cognitive and agent mapping techniques.
Mapping Technique Design Purpose Theory
Cognitive Map (CoM)
Mapping key marketresources, agents, influencing
factors and variables andeliciting feedback
interrelations;Analysis of market structure
and feedback dynamic;
Cognitive mapping theory[81,82]
RDT [90,91]

Agriculture 2022, 12, 280 16 of 30
Table 1. Cont.
Mapping Technique Design Purpose Theory
Agent Interaction Map(AIM)
Analysis of agents’interactions and
influencing dynamics;Mapping agent interactionsincluding identifying each
agent’s key behaviouraldecision rules and key
influencing factors;
BDT [92–94]Stakeholders Management
mapping concept [87]
Agent Behaviour Map(ABM)
Mapping each agent’sbehavioural decision rule in
more detail through an agentbehavioural map;
Analysis of agent decisionrules and behaviour;
BDT [92,95]
5. Results
In a conceptual modelling exercise, the “result” is the model derived. Initial workto lay the foundation for the modelling is to provide a depiction of the FVC structure.This is carried out in conjunction with subject matter experts. It entails (1) identifying thedifferent tiers of agents which play a role in the supply chain, as well as (2) determiningrelevant categories of agents within each tier. Most food supply chains have the same basicstructure (i.e., producers, collectors, processors, retailers, consumers). However, some ofthose categories may merge or, conversely, be divided into several tiers depending on thesupply chain. Notwithstanding such variations among specific FVCs, we may reiteratethat most FVCs have the same basic structure. This allows us to create a general hybridSD/ABM simulation modelling architecture (prototype conceptualisation) applicable forall FVCs being studied. All the main system components relevant to the research focus(problem definition and boundary selection) are taken into consideration, including theirinterrelations (between financial resources and production resources and between agentsand agents, and agents and resources).
For each case study, the physical and social elements of the food system are listed up.These elements can be agents (capable of independent decision making) or stocks, flows orcontrols (the SD elements). Having identified these elements, the problem definition thenleads to “what-if” questions.
5.1. What-If Questions
“What-if” questions capture the hypotheses the model is intended to address and test.Here, the range of such questions for the VALUMICS case studies is discussed.
Procedural fairness can be addressed by the model as experimental factors using what-if questions. Such questions can address different procedural fairness issues, includingunequal power among partners to define prices and unequal access to information resultingfrom the way in which the individual FVC is governed (e.g., producer organisations andprice auctions). Examples of procedural fairness what-if questions to be addressed includethe lists of prohibited practices in business-to-business relationships according to theDirective on UTPs. These include customs which may be considered of a procedural nature,e.g., relating to payment terms (such as late payments) and other elements of contractualrelations (such as short-notice cancellations).
Further questions of interest to explore within the model include aspects of the linkbetween the degree of market/bargaining power of FVC actors and the gross margin profitin terms of fair value distribution by exploring the impact of financial markets, referenceprice negotiation etc. By observing to what extent gross margins vary in different what-ifexperiments, it may be possible to indicate when the FVC is becoming fairer.
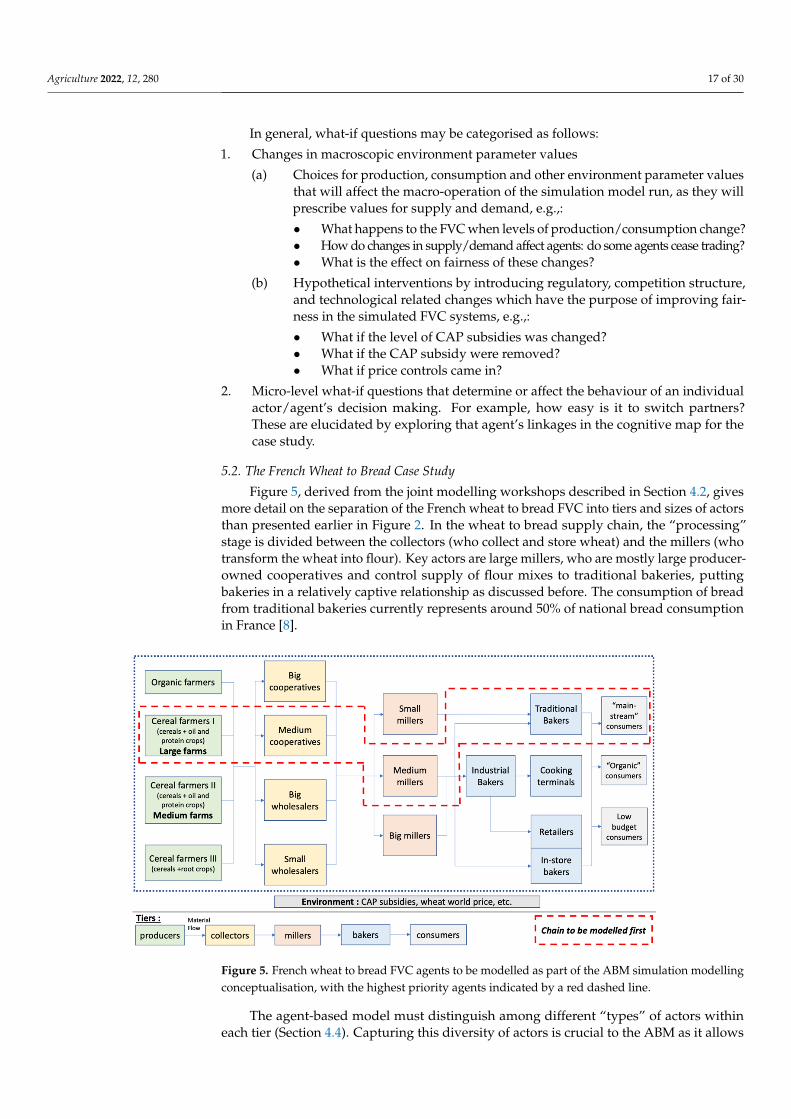
Agriculture 2022, 12, 280 17 of 30
In general, what-if questions may be categorised as follows:
1. Changes in macroscopic environment parameter values
(a) Choices for production, consumption and other environment parameter valuesthat will affect the macro-operation of the simulation model run, as they willprescribe values for supply and demand, e.g.,:
• What happens to the FVC when levels of production/consumption change?• How do changes in supply/demand affect agents: do some agents cease trading?• What is the effect on fairness of these changes?
(b) Hypothetical interventions by introducing regulatory, competition structure,and technological related changes which have the purpose of improving fair-ness in the simulated FVC systems, e.g.,:
• What if the level of CAP subsidies was changed?• What if the CAP subsidy were removed?• What if price controls came in?
2. Micro-level what-if questions that determine or affect the behaviour of an individualactor/agent’s decision making. For example, how easy is it to switch partners?These are elucidated by exploring that agent’s linkages in the cognitive map for thecase study.
5.2. The French Wheat to Bread Case Study
Figure 5, derived from the joint modelling workshops described in Section 4.2, givesmore detail on the separation of the French wheat to bread FVC into tiers and sizes of actorsthan presented earlier in Figure 2. In the wheat to bread supply chain, the “processing”stage is divided between the collectors (who collect and store wheat) and the millers (whotransform the wheat into flour). Key actors are large millers, who are mostly large producer-owned cooperatives and control supply of flour mixes to traditional bakeries, puttingbakeries in a relatively captive relationship as discussed before. The consumption of breadfrom traditional bakeries currently represents around 50% of national bread consumptionin France [8].
Agriculture 2022, 12, x FOR PEER REVIEW 18 of 31
Figure 5. French wheat to bread FVC agents to be modelled as part of the ABM simulation modelling
conceptualisation, with the highest priority agents indicated by a red dashed line.
The agent-based model must distinguish among different “types” of actors within
each tier (Section 4.4). Capturing this diversity of actors is crucial to the ABM as it allows
the factoring in of the diversity of responses/strategies that agents might have in the sup-
ply chain and therefore how the supply chain might evolve in different scenarios.
The main question then is how or on what basis to differentiate actors within each
tier. Agents can be categorised according to different criteria e.g., size of the agent—which
can reflect the number of employees, or the production volume, or value of production,
etc.—type of production system, type of business model, etc.
For some tiers in the supply chain, the categorisation may be relatively straightfor-
ward. For example, this is the case for the wheat to bread FVC retailers, which can be
clearly divided into traditional bakers, industrial bakers and in-store bakers: these have
very different business models, economic productivity levels, etc. The topic of categoris-
ing certain specific actors (e.g., industrial bakers) according to size (e.g., medium and
large) is a question in itself.
In other less straightforward cases, the objective of the model, i.e., what output vari-
ables are most important to the model, can drive out relevant agent distinctions. For the
VALUMICS wheat to bread model, the key output variables include the number of work-
ers, size of agents and value added. It is thus pertinent to make a distinction between
agents characterised by very different levels of workers employed or productivity, as op-
posed to different levels of value-added or revenue (a variable which is potentially con-
nected to the type of outlet the agents mainly have). For example, small millers have a
lower material productivity than big millers but mainly sell their flour to traditional bak-
eries, at higher prices than those attained by an industrial bakery; while medium and large
millers have a higher material productivity but sell a high share of their flour at lower
prices to industrial bakers.
In addition, the distinction between FVC agents may be more generally bounded by
constraints such as data availability. When looking for data to characterise the different
agents, it may be that the available data only allows the distinguishing of actors in a very
limited way (e.g., by size). One may thus choose to differentiate agents from a qualitative
perspective (for example, based on the nature—private or cooperative—of the agent) ra-
ther than from a quantitative perspective. Such a distinction derived from more qualita-
tive aspects must be based on the fact that these types of actors behave differently when
facing a certain type of constraint.
Figure 5. French wheat to bread FVC agents to be modelled as part of the ABM simulation modellingconceptualisation, with the highest priority agents indicated by a red dashed line.
The agent-based model must distinguish among different “types” of actors withineach tier (Section 4.4). Capturing this diversity of actors is crucial to the ABM as it allows
Agriculture 2022, 12, 280 18 of 30
the factoring in of the diversity of responses/strategies that agents might have in the supplychain and therefore how the supply chain might evolve in different scenarios.
The main question then is how or on what basis to differentiate actors within eachtier. Agents can be categorised according to different criteria e.g., size of the agent—whichcan reflect the number of employees, or the production volume, or value of production,etc.—type of production system, type of business model, etc.
For some tiers in the supply chain, the categorisation may be relatively straightforward.For example, this is the case for the wheat to bread FVC retailers, which can be clearlydivided into traditional bakers, industrial bakers and in-store bakers: these have verydifferent business models, economic productivity levels, etc. The topic of categorisingcertain specific actors (e.g., industrial bakers) according to size (e.g., medium and large) isa question in itself.
In other less straightforward cases, the objective of the model, i.e., what outputvariables are most important to the model, can drive out relevant agent distinctions. For theVALUMICS wheat to bread model, the key output variables include the number of workers,size of agents and value added. It is thus pertinent to make a distinction between agentscharacterised by very different levels of workers employed or productivity, as opposedto different levels of value-added or revenue (a variable which is potentially connectedto the type of outlet the agents mainly have). For example, small millers have a lowermaterial productivity than big millers but mainly sell their flour to traditional bakeries, athigher prices than those attained by an industrial bakery; while medium and large millershave a higher material productivity but sell a high share of their flour at lower prices toindustrial bakers.
In addition, the distinction between FVC agents may be more generally bounded byconstraints such as data availability. When looking for data to characterise the differentagents, it may be that the available data only allows the distinguishing of actors in a verylimited way (e.g., by size). One may thus choose to differentiate agents from a qualitativeperspective (for example, based on the nature—private or cooperative—of the agent) ratherthan from a quantitative perspective. Such a distinction derived from more qualitativeaspects must be based on the fact that these types of actors behave differently when facinga certain type of constraint.
It is also important to determine the unit/scale of the agent which is considered in themodel. For example, processors may be considered at the processing unit level or at thecompany level. It is important to make an informed decision about whether to considerone or the other in the model. Again, one choice may be favoured by the data to hand. Thecase of retailers is a good example: the number of units might be high, but the numberof groups is usually low (less than ten in most EU countries). In a model concerned withfairness, that considers the equity of value distribution, it may be more relevant to work atthe group level, since even if different units are part of the group, only a few (or sometimeseven one) central purchasing departments manage purchases for all units.
This initial modelling step starts the process of collecting quantitative data on the FVC,e.g., number of actors in each tier, type of actor, volumes handled, number of workers,productivity, etc. This data then feeds into the next quantitative formalisation step.
5.3. Cognitive Map for the French Wheat to Bread Chain
A cognitive map seeks to capture and display links or relationships among the previ-ously listed elements of the FVC. The group modelling sessions mentioned in the previousSection 4.2 led to the cognitive map for price negotiation in the French wheat to bread casestudy food value chain shown in Figure 6 and subsequent explanatory notes.
The content of this map is now explained in more detail. All wheat to bread valuechain actors depend on the international market because: (a) there are low trade barriersfor imported wheat; (b) there are changing markets with different requirements; and (c) thedomestic market is saturated.

Agriculture 2022, 12, 280 19 of 30
Agriculture 2022, 12, x FOR PEER REVIEW 19 of 31
It is also important to determine the unit/scale of the agent which is considered in the
model. For example, processors may be considered at the processing unit level or at the
company level. It is important to make an informed decision about whether to consider
one or the other in the model. Again, one choice may be favoured by the data to hand. The
case of retailers is a good example: the number of units might be high, but the number of
groups is usually low (less than ten in most EU countries). In a model concerned with
fairness, that considers the equity of value distribution, it may be more relevant to work
at the group level, since even if different units are part of the group, only a few (or some-
times even one) central purchasing departments manage purchases for all units.
This initial modelling step starts the process of collecting quantitative data on the
FVC, e.g., number of actors in each tier, type of actor, volumes handled, number of work-
ers, productivity, etc. This data then feeds into the next quantitative formalisation step.
5.3. Cognitive Map for the French Wheat to Bread Chain
A cognitive map seeks to capture and display links or relationships among the pre-
viously listed elements of the FVC. The group modelling sessions mentioned in the pre-
vious Section 4.2 led to the cognitive map for price negotiation in the French wheat to
bread case study food value chain shown in Figure 6 and subsequent explanatory notes.
Figure 6. Example of cognitive map for price negotiations in the French wheat to bread FVC (Au-
thors’ own conceptualisation first presented at a conference [96]) Note: Value chain actors and cer-
tain regulations/directives are shown in boldface; External (environment) variables affecting wheat
volume/quality are in boxes; External (environment) economic variables are in boldface red; Sup-
plies of wheat are shown in boldface italic; Decisions involving negotiation and/or calculation are
shown in upright red; Other factors are shown in upright or italic font.
The content of this map is now explained in more detail. All wheat to bread value
chain actors depend on the international market because: (a) there are low trade barriers
Figure 6. Example of cognitive map for price negotiations in the French wheat to bread FVC (Authors’own conceptualisation first presented at a conference [96]) Note: Value chain actors and certainregulations/directives are shown in boldface; External (environment) variables affecting wheatvolume/quality are in boxes; External (environment) economic variables are in boldface red; Suppliesof wheat are shown in boldface italic; Decisions involving negotiation and/or calculation are shownin upright red; Other factors are shown in upright or italic font.
5.3.1. Factors Influencing the Price Negotiation for Wheat between Farmers and Collectors
Collectors may be either cooperatives, which control 70% of the wheat market, orwholesalers, which control 30% [8]. Producers tend to be captive suppliers towards cooper-atives. The main factors influencing the price negotiation between farmers and collectorsare the world price and the volumes/quality produced by French producers. This worldprice is based on
• the volumes produced (mainly the volume produced in the Northern hemispherein July, and to a lesser extent the volume produced in the Southern hemisphere inDecember/January),
• the state of the world wheat stocks,• the state of the global demand for wheat (both for milling wheat and for feed wheat),• the production costs of the most efficient competitors on the world market (currently
Russia) and• the extant trade policies (tariff barriers, import quotas).
The most influential publication on world prices is the “World Agricultural Supplyand Demand Estimates” (WASDE) published every month [97].
In terms of policies, cereal production is dominated by tariff barriers. This barriercan be lower for quotas negotiated for some countries. Trade agreements on these quotastherefore have a strong influence (e.g., future negotiations with Ukraine) on both theevolution of prices of wheat and volumes of wheat produced in France and the EU.
Agriculture 2022, 12, 280 20 of 30
The policies of the importing countries, which may vary or even undergo significantchanges (crisis, embargo, etc.), may also cause variations in the market. The price of oil,impacting both the price of farm inputs and transport, also has a strong impact on worldprices. The euro/dollar exchange rate also influences the ability of EU countries to export.
The ability to reach the quality required for milling wheat (as measured by humidity,Hagberg index, baking strength and, in particular, protein content rate) depends on: (i) theevolution of requirements for these indicators (especially protein rate); (ii) the climate(which influences most aspects of wheat quality); and (iii) fertilisation conditions (whichinfluence the protein rate). The fertilisation conditions are framed by the nitrate directive,which regulates the level of nitrogen input allowed. This directive can therefore influencethe priorities of selection of wheat varieties, by motivating the favouring of varieties whichoptimise the use of nitrogen. For some years, there has been an obligation for collectors tostate the protein content in contracts, in order to apply differential tariffs according to thisprotein level. The effect of the protein rate on the market is as follows:
• if the protein rate is low: the price on the domestic market decreases and possibilitiesfor export decrease, increasing the stocks of unsold wheat; and
• if the protein rate is high: prices rise on the domestic market and the possibilities forexport increase.
Pesticide residues, heavy metal, and mycotoxin levels are analysed for wholesalemarket allotments. When these sanitary controls are negative, the wheat is very rarelydestroyed, but simply mixed with other healthier volumes.
Climate also influences the annual volume and quality of wheat produced. Forexample, if spring is too rainy in France, the wheat will be potentially inappropriate formilling (and will therefore partly be assigned to feed), which may raise the issue of supplyfor millers and the issue of proper valuation for producers.
The global supply of wheat and the quality of this wheat influence the way it isvalorised. On the domestic market, wheat firstly is processed by millers (around 6MT/year),and then sold for feed, starch production or biofuels. On the international market, wheatis mainly used for bakery, if it reaches the protein rate requirements of buyers. The pricedifferential between bread wheat and feed wheat depends on the world price of corn andfeed barley. Two other important factors influencing the average price for wheat betweenfarmers and collectors are the storage/sales policy and the use of hedging tools (futuresmarkets). Finally, the price negotiation for wheat differs according to the productioncontracts negotiated before the campaign.
The premium value added to the average price of wheat is less for red label than it is forno pesticide residues chains. For organic wheat, the evolution of the price follows differentmarket dynamics: most of the time, organic wheat is twice the price of conventional wheat,but the ratio between the two productions can evolve differently from year to year. Thevolumes of organic wheat are low at present, but the growth rate is substantial.
The question, as for any differentiation, is “will the premium be kept if the differenti-ated production becomes the norm”? And if not, at which level of differentiated production(compared to overall production) will the level of premium become negligible?
5.3.2. Factors Influencing the Price Negotiation for Wheat between Collectors and Millers
The price negotiation for grain between collectors (cooperatives or wholesalers) andmillers mainly depends on the wheat prices (and therefore on average campaign prices).The premium prices are valorised all along the chain, involving different prices for wheatand different prices for the flour. Big mills may get cheaper prices for grain than mediumand small mills, but to a small extent, as collectors try to keep their margins positive.
The milling industry in France is very concentrated and most wheat production formilling is collected by the biggest cooperatives, then processed through their own mills.More than 50% of flour production is ground by millers that belong to collectors. However,even in this integrated situation, millers negotiate prices for wheat allowing them to keeptheir margins at the mill level, so that they can generate profits to invest in modernisation

Agriculture 2022, 12, 280 21 of 30
of the mill. Mills are managed as if they were independent production units. In terms ofstrategies (of both sourcing and selling), one can distinguish small, medium, and largemillers (4–5 millers grind around 50% of the production which is turned into flour) [8].
Two different markets must be distinguished: (i) the traditional bakery market, withprices including both flour and services (financial, advisory and logistic) offered to bakersby millers; (ii) the industrial bakery and the retailer market, where prices of flour are abouthalf those for the traditional bakery market. The contracts are fully indexed to the priceof wheat. However, the market of flour is an over-the-counter market, meaning that it isnot transparent at all compared to the wheat market. Medium size mills have the besteconomic conditions: they mainly—but not only—work with traditional bakeries (allowingthem to better valorise flour) and specialise in specific kind of flour. Large mills have aweaker economic position, especially those which invested the most in flour export in the1980’s, as export is now marginal, meaning that their structural expenses are somewhattoo high. Small mills only work with traditional bakeries but cannot supply the industrialmarket, and so are unable to increase their activity, with fierce competition among them.
5.3.3. Factors Influencing the Price Negotiation for Wheat between Millers andBakers/Retailers
Small and medium millers mainly sell their flour to traditional bakeries (mediumbakers may also sell some volume to industry) while big millers mainly sell their flour totraditional bakeries within their franchise, industrial bakeries, and retailers. Traditionalbakeries have low bargaining power and are considered as “price takers”. Industrialbakeries and retailers (which can purchase their flour from actors outside France, and inbigger quantities, follow the evolutions of the flour market) are usually able to purchaseflour for lower prices (mainly influenced by EU competition on flour, as they less commonlypurchase flour from outside EU, largely for quality reasons).
The ability of millers to control a flour mix (the mix between flour and additives) thatis adapted to a bakery puts them in a rather dominant position in the negotiation of flourprices. However, the larger the volumes purchased by the industrial bakers and retailers(compared to the volumes purchased by traditional bakeries), the less dominant is themillers’ position in this negotiation.
5.3.4. Factors Influencing the Price Negotiation for Bread
The price of bread is influenced by several factors:
(i) the price at which flour was purchased (which depends on the quality of flour pur-chased). Wheat represents around 5% to 7% of the price of bread. Flour (includingwheat) represents about 15% of the price of bread (this proportion is about 30% fororganic bread). This means that raw materials play a small role in the price of bread,relative to personnel costs and other factors;
(ii) the quality of bread produced (which affects the level of labour force required);(iii) the local competition on bread/food items locally sold. This refers to several di-
mensions: the ability to park easily to buy bread (especially in suburban areas), thediversity of baked products proposed, etc.;
(iv) the position/importance of bread in the overall market strategy of the actor sellingbread. For example, in the case of retailers, data from the OFPM (the French Obser-vatory of Price and Margins Formation for Food Products) shows that the sale ofbread in supermarkets can be done without any margin at the scale of the bakerysection, with the simple aim of being able to offer bread to customers within the entireshopping basket purchased.
5.4. Subsequent Steps in Developing the Hybrid SD and ABM Hybrid Model
The structure of the generic FVC model is based on the problem at hand (the fairnessissue) and the objective of the modelling (test fairness improvement options with differentexperimental factors based on scenarios). Therefore, the agents that are part of the model
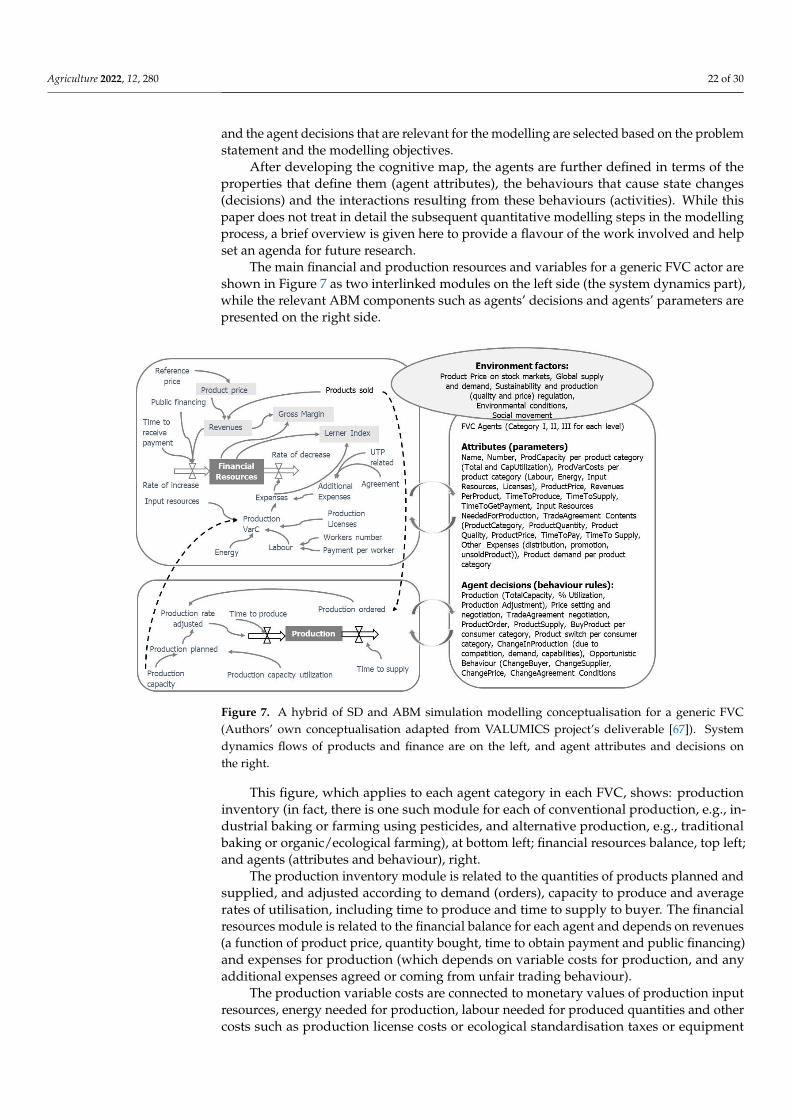
Agriculture 2022, 12, 280 22 of 30
and the agent decisions that are relevant for the modelling are selected based on the problemstatement and the modelling objectives.
After developing the cognitive map, the agents are further defined in terms of theproperties that define them (agent attributes), the behaviours that cause state changes(decisions) and the interactions resulting from these behaviours (activities). While thispaper does not treat in detail the subsequent quantitative modelling steps in the modellingprocess, a brief overview is given here to provide a flavour of the work involved and helpset an agenda for future research.
The main financial and production resources and variables for a generic FVC actor areshown in Figure 7 as two interlinked modules on the left side (the system dynamics part),while the relevant ABM components such as agents’ decisions and agents’ parameters arepresented on the right side.
Agriculture 2022, 12, x FOR PEER REVIEW 23 of 31
Figure 7. A hybrid of SD and ABM simulation modelling conceptualisation for a generic FVC (Au-
thors’ own conceptualisation adapted from VALUMICS project’s deliverable [67]). System dynam-
ics flows of products and finance are on the left, and agent attributes and decisions on the right.
This figure, which applies to each agent category in each FVC, shows: production
inventory (in fact, there is one such module for each of conventional production, e.g., in-
dustrial baking or farming using pesticides, and alternative production, e.g., traditional
baking or organic/ecological farming), at bottom left; financial resources balance, top left;
and agents (attributes and behaviour), right.
The production inventory module is related to the quantities of products planned
and supplied, and adjusted according to demand (orders), capacity to produce and aver-
age rates of utilisation, including time to produce and time to supply to buyer. The finan-
cial resources module is related to the financial balance for each agent and depends on
revenues (a function of product price, quantity bought, time to obtain payment and public
financing) and expenses for production (which depends on variable costs for production,
and any additional expenses agreed or coming from unfair trading behaviour).
The production variable costs are connected to monetary values of production input
resources, energy needed for production, labour needed for produced quantities and
other costs such as production license costs or ecological standardisation taxes or equip-
ment costs. To differentiate between conventional production and alternative production,
we need to have monetary values for conventional and alternative input resources, tradi-
tional and renewable energy and payment rate per worker including social security and
health care taxes.
To parameterise the production inventory and financial resources modules, the fol-
lowing information is needed: average or min to max values for product quantities pro-
duced every production period (once or more times per year), and euros received and
spent per production volume per relevant time period (every month or three months or
per year or other). For the agent module, it is necessary to clearly define the agent’s attrib-
utes (parameters such as name and number of agents in each category and values for the
main variables in the production and financial resource modules), and the agent decision
routines controlling or managing the variables from these modules.
The decisions are fleshed out in agent decision tables. Table 2 illustrates the decisions
of agents in a generic FVC. These tables are tools for collecting and organising qualitative
Figure 7. A hybrid of SD and ABM simulation modelling conceptualisation for a generic FVC(Authors’ own conceptualisation adapted from VALUMICS project’s deliverable [67]). Systemdynamics flows of products and finance are on the left, and agent attributes and decisions onthe right.
This figure, which applies to each agent category in each FVC, shows: productioninventory (in fact, there is one such module for each of conventional production, e.g., in-dustrial baking or farming using pesticides, and alternative production, e.g., traditionalbaking or organic/ecological farming), at bottom left; financial resources balance, top left;and agents (attributes and behaviour), right.
The production inventory module is related to the quantities of products planned andsupplied, and adjusted according to demand (orders), capacity to produce and averagerates of utilisation, including time to produce and time to supply to buyer. The financialresources module is related to the financial balance for each agent and depends on revenues(a function of product price, quantity bought, time to obtain payment and public financing)and expenses for production (which depends on variable costs for production, and anyadditional expenses agreed or coming from unfair trading behaviour).
The production variable costs are connected to monetary values of production inputresources, energy needed for production, labour needed for produced quantities and othercosts such as production license costs or ecological standardisation taxes or equipment
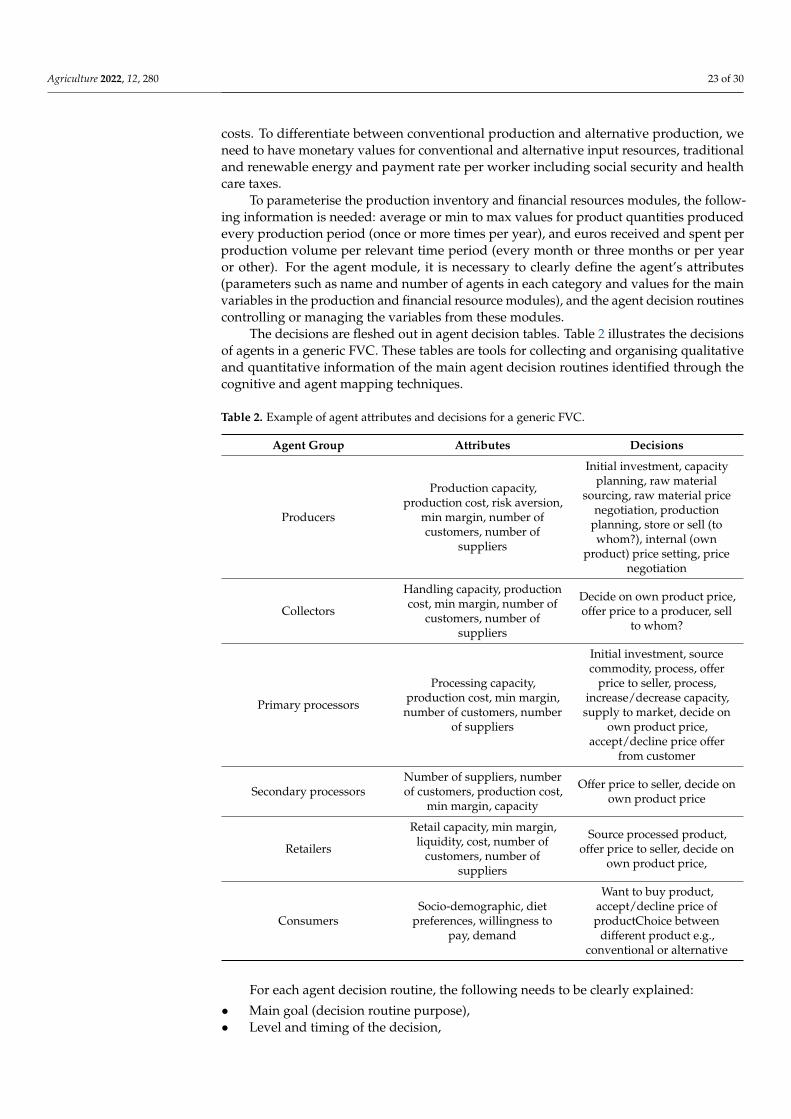
Agriculture 2022, 12, 280 23 of 30
costs. To differentiate between conventional production and alternative production, weneed to have monetary values for conventional and alternative input resources, traditionaland renewable energy and payment rate per worker including social security and healthcare taxes.
To parameterise the production inventory and financial resources modules, the follow-ing information is needed: average or min to max values for product quantities producedevery production period (once or more times per year), and euros received and spent perproduction volume per relevant time period (every month or three months or per yearor other). For the agent module, it is necessary to clearly define the agent’s attributes(parameters such as name and number of agents in each category and values for the mainvariables in the production and financial resource modules), and the agent decision routinescontrolling or managing the variables from these modules.
The decisions are fleshed out in agent decision tables. Table 2 illustrates the decisionsof agents in a generic FVC. These tables are tools for collecting and organising qualitativeand quantitative information of the main agent decision routines identified through thecognitive and agent mapping techniques.
Table 2. Example of agent attributes and decisions for a generic FVC.
Agent Group Attributes Decisions
Producers
Production capacity,production cost, risk aversion,
min margin, number ofcustomers, number of
suppliers
Initial investment, capacityplanning, raw material
sourcing, raw material pricenegotiation, production
planning, store or sell (towhom?), internal (own
product) price setting, pricenegotiation
Collectors
Handling capacity, productioncost, min margin, number of
customers, number ofsuppliers
Decide on own product price,offer price to a producer, sell
to whom?
Primary processors
Processing capacity,production cost, min margin,
number of customers, numberof suppliers
Initial investment, sourcecommodity, process, offer
price to seller, process,increase/decrease capacity,supply to market, decide on
own product price,accept/decline price offer
from customer
Secondary processorsNumber of suppliers, numberof customers, production cost,
min margin, capacity
Offer price to seller, decide onown product price
Retailers
Retail capacity, min margin,liquidity, cost, number of
customers, number ofsuppliers
Source processed product,offer price to seller, decide on
own product price,
ConsumersSocio-demographic, diet
preferences, willingness topay, demand
Want to buy product,accept/decline price ofproductChoice between
different product e.g.,conventional or alternative
For each agent decision routine, the following needs to be clearly explained:
• Main goal (decision routine purpose),• Level and timing of the decision,

Agriculture 2022, 12, 280 24 of 30
• Detailed procedural description of each food value chain agent decision routine,• Any quantitative parameters associated with the decision routine,• Main related factors (endogenous and exogenous variables) conditioning the deci-
sion routine,• What if questions (hypothetical changes in the system) that can affect the agent deci-
sion routine.
The decision table then gives detailed information about each decision type for eachagent in the food value chain being considered.
The particular agent behaviours and decisions chosen for quantitative formulationare those relevant to the what-if questions identified as important for the problem to bemodelled. These questions will then drive out the agent decisions that need to be modelledto answer the questions. The relevant agent decisions will then be modelled quantitativelyand used to derive fully specified algorithms, represented either as pseudocode or (as inFigure 8) as formal flowcharts.
Agriculture 2022, 12, x FOR PEER REVIEW 25 of 31
Figure 8. Example of decision rules for processor selling to retailer.
Agent-specific variables and decisions are taken as endogenous to the modelled sys-
tem and will produce the emergent behaviour of the whole system. Other variables (fac-
tors) such as stock exchange prices, global supply and demand, relevant macroeconomic
indicators, and market regulation are exogenous to the modelled system; a requirement
for further work is to develop understanding of their influence on the system components
(on agent decisions related to price setting and negotiation, UTP, production quantities
etc.). Future papers will present details of this ongoing work.
6. Discussion
Major food systems need to contribute to the UN’s Sustainable Development Goals
(SDGs) by increasing sustainable production efficiencies (more food with less impact), re-
ducing food waste and loss, and shifting diets towards more plant-based food [4,5]. The
Green Deal and the Farm to Fork strategy of the European Commission were launched
with ambitious aims to tackle the challenges of the European food system and motivate
transition to sustainable food system [6,7]. The simulation model described here is de-
signed to assess the impact of intervention strategies e.g., for food value chain actors in
future scenarios and how this may influence the gross profit margin and level of employ-
ment. An example is the implementation of regulations or policies set to influence transi-
tions of the food system such as the Farm to Fork strategy to enhance the sustainability of
European food systems.
As discussed earlier, food system transitions towards sustainability depend on fair
procedures and outcomes. Exploration of the interorganisational fairness problem needs
to account for interconnected effects between distributional fairness and procedural fair-
ness, and effects of related and unrelated regulation: (a) how fair or unfair interrelations
affect fair or unfair value distributions; (b) how bargaining power affects distributional
and procedural fairness; and (c) how related and unrelated regulations affect the degree
of fairness in value distribution and procedural interrelations. Gross margin can be used
as a proxy indicator for fair value distribution, and for procedural fairness the Lerner in-
dex can give an estimate of the degree of market power, while the sizes and numbers of
suppliers or buyers and the availability of alternatives can indicate bargaining power po-
sition [13,14,25,77].
The problem researched here (fair value distribution and fair procedural interrela-
tions among food value chain agents) is not isolated but is connected to the overall global
food system challenges of making food value chains economically, environmentally, and
socially sustainable and resilient [1,3,98,99]. Simulation can help decision makers to assess
the impact of interventions aimed at enhancing sustainability and resilience and how
Figure 8. Example of decision rules for processor selling to retailer.
Agent-specific variables and decisions are taken as endogenous to the modelledsystem and will produce the emergent behaviour of the whole system. Other variables(factors) such as stock exchange prices, global supply and demand, relevant macroeconomicindicators, and market regulation are exogenous to the modelled system; a requirement forfurther work is to develop understanding of their influence on the system components (onagent decisions related to price setting and negotiation, UTP, production quantities etc.).Future papers will present details of this ongoing work.
6. Discussion
Major food systems need to contribute to the UN’s Sustainable Development Goals(SDGs) by increasing sustainable production efficiencies (more food with less impact),reducing food waste and loss, and shifting diets towards more plant-based food [4,5]. TheGreen Deal and the Farm to Fork strategy of the European Commission were launchedwith ambitious aims to tackle the challenges of the European food system and motivatetransition to sustainable food system [6,7]. The simulation model described here is designedto assess the impact of intervention strategies e.g., for food value chain actors in futurescenarios and how this may influence the gross profit margin and level of employment. Anexample is the implementation of regulations or policies set to influence transitions of thefood system such as the Farm to Fork strategy to enhance the sustainability of Europeanfood systems.
As discussed earlier, food system transitions towards sustainability depend on fairprocedures and outcomes. Exploration of the interorganisational fairness problem needs to
Agriculture 2022, 12, 280 25 of 30
account for interconnected effects between distributional fairness and procedural fairness,and effects of related and unrelated regulation: (a) how fair or unfair interrelations affectfair or unfair value distributions; (b) how bargaining power affects distributional andprocedural fairness; and (c) how related and unrelated regulations affect the degree offairness in value distribution and procedural interrelations. Gross margin can be usedas a proxy indicator for fair value distribution, and for procedural fairness the Lernerindex can give an estimate of the degree of market power, while the sizes and numbersof suppliers or buyers and the availability of alternatives can indicate bargaining powerposition [13,14,25,77].
The problem researched here (fair value distribution and fair procedural interrelationsamong food value chain agents) is not isolated but is connected to the overall global foodsystem challenges of making food value chains economically, environmentally, and sociallysustainable and resilient [1,3,98,99]. Simulation can help decision makers to assess theimpact of interventions aimed at enhancing sustainability and resilience and how these in-terventions can subsequently impact fairness in food value chains. Fairness considerationsare integral to the success of sustainability transitions since sustainable food consumptionpolicies and intervention tools require the engagement and acceptance of key stakehold-ers including FVC actors [100]. In addition, power asymmetries in FVCs may contributeto resistance to change by actors with more power in the system thus hampering moretransformative change down the line [101]. Given the complexity in the power structure offood value chains and the potential occurrence of unfair trading practices, there is valuein exploring the problem of fairness using simulation models that can capture the FVCdynamics through operational indicators.
The result of the work is the conceptual model. It builds on key common featuressuch as reference price, which influences trading prices and price negotiation; productionseasonality and production inventory planning and adjustment according to orders anddemand; financial resources management connected to sales revenues; public financing andproduct variable costs including additional costs related to unfair trading practices. Also,there are common macroeconomic factors that affect commodities prices such as globalsupply and demand, energy prices, trade tariffs and quotas which need to be considered.However, there are differences in connection to market competition structure and regulationin every FVC, and in connection to timing of production, supply, and demand, includingdifferences in consumption patterns, which will need to be reflected in actors’ decisions.These distinctive aspects of different FVCs can then be added to the generic conceptualmodel to capture appropriately the specifics of the FVC being modelled.
The applicability and appropriateness of the hybrid SD/ABM modelling approachadopted for the other FVCs (see Section 3) provides motivation for continuing the mod-elling exercise through the further stages of formulation, implementation and validationdiscussed in Section 4 and outlined at the end of Section 5; and extending this approach toother FVCs. This will allow users of the model to experiment on and test various what-ifpolicy and market interventions and to inform the development of transition pathwaystowards more environmentally sustainable and socially fair food value chains. Examplesof such experimental interventions include: (a) testing how a change in volumes pro-duced/consumed may impact the whole of the food value chain in terms of (i) structure ofthe chain, (ii) total number of jobs and (iii) value-added distribution along the chain; (b)different “scenarios” connected to production, external financing, governance e.g., marketled, or public/civil society led, changing level of CAP subsidies (“public financing”), andadjusting for fair value distribution.
In the context of the VALUMICS project, the future scenario development work con-sidered contrasting paradigms to encapsulate, in essence, a set of “generic” hypotheses ofhow the overall governance of European food chains will evolve and plausible pathwayson how to get there. This included scenario work to describe sustainable transitions of foodsystems while considering simultaneously socio-economic and environmental issues in ajust transition perspective. A design of “just transition pathways” were elucidated through

Agriculture 2022, 12, 280 26 of 30
a methodological framework including quantification of employment until 2030 for theFrench Dairy Sector, using the decarbonation pathway for the agricultural sector issuedfrom the French National Low-Carbon Strategy as reference [102]. As mentioned earlierthe needs of this work fed into the specifications of the conceptual modelling described inthis paper. The lack of data turned out to be a limiting factor in the model formulation andhigh-impact assumptions needed to be made when data gaps were encountered, especiallyconcerning firm level data and particularly for non-farmer actors. The formulation, imple-mentation, and use of the quantitative model in the future scenario work will be the subjectof a forthcoming stream of research.
7. Conclusions
The contribution of this paper is to apply a conceptual hybrid modelling methodologyto the problem of interorganisational fairness in FVCs. We have illustrated how techniquessuch as cognitive mapping can be used for system analysis and conceptual modelling ofthe fairness problem and argued that a hybrid system dynamics and agent-based model isappropriate for representing FVCs and fairness insights from the model conceptualisation,i.e., the cognitive and agent maps, as well as the longer-term goal of this stream of research,i.e., to explore how this conceptual model can be formulated quantitatively in terms ofequations and algorithms and implemented and validated as a policy scenario simulatorfor policy experimentation and optional recommendations. Thus, we have addressed thepaper’s objective to develop an agenda for research into hybrid simulation models of FVCsand so motivate further research in this area.
The overview from case studies explored through governance and economic analysischaracterised the “real world problem” to be addressed by the simulation model. Interor-ganisational fairness is related to governance resulting in power asymmetries and thus apotential for unfair trading practices. The FVC case studies presented here have commonfeatures in relation to the ABM focus on distributive and procedural fairness, using grossmargin and Lerner index as indicators. The wheat to bread case study was selected becauseit has many characteristics in common with the other FVCs. The main agent decisions anddecision heuristics related to the management of product inventory and financial resourceflows are also common to all food value chains. These common features give an opportu-nity for designing a generic hybrid SD/ABM production inventory, financial resource, andresource flow structure, where the components can be modelled from the perspective ofsystem dynamics, while the main actors’ decision and actions related to managing theseresources will be modelled from an agent-based modelling and simulation perspective.This approach meets the objective of hybridisation of the two simulation perspectives ofSD and ABM.
As has been demonstrated, our approach using cognitive maps to derive a conceptualmodel is flexible yet comprehensive enough to capture the most important elements ofreal-world FVCs, and in particular address the interorganisational fairness problem whichwas a major objective of this study. This conceptual model will be built upon to develop acomputational simulation model, the results of which will be reported in a forthcomingstream of research.
Author Contributions: Conceptualisation, S.M. and G.O.; methodology, S.M., R.K. and I.Y.G.; back-ground and resources, G.O., D.B., A.S., G.E., I.Ð., L.C., T.J.J., P.-M.A., W.L., É.H., M.T. and S.G.B.formal analysis, S.M., R.K., É.H., W.L., G.O. and I.Y.G.; validation, S.M., R.K., É.H., W.L. and P.-M.A.;investigation, S.M. and R.K; data curation, R.K., É.H., W.L. and P.-M.A.; writing—original draftpreparation, G.O, S.M., I.Y.G., É.H., R.K. and W.L.; writing—review and editing, S.M., G.O. andN.M.S.; visualisation, G.O., S.M., W.L., É.H. and R.K.; project administration, S.G.B., S.M., G.O.,P.-M.A., D.B., A.S., I.Ð. and M.T.; funding acquisition, S.G.B., S.M., G.O., P.-M.A., D.B., A.S., I.Ð. andM.T. All authors have read and agreed to the published version of the manuscript.
Funding: The research on which this paper is based formed part of the VALUMICS project “Under-standing Food Value Chain and Network Dynamics” funded from the European Union’s Horizon2020 research and innovation programme under grant agreement No 727243.

Agriculture 2022, 12, 280 27 of 30
Institutional Review Board Statement: Not applicable. Ethical review and approval were waivedfor this study because the study did not involve the processing of personal data. The study adheredto ethical standards for the VALUMICS project in accordance with EU Horizon 2020 regulations ondata management concerning ethical and societal aspects (Directive (EU) 2016/680).
Informed Consent Statement: Written informed consent was obtained from subjects involved inproviding background information regarding the value chain governance.
Data Availability Statement: Not applicable.
Acknowledgments: We would like to thank members of ASSIST Software for useful discussions.
Conflicts of Interest: The authors declare no conflict of interest. The funders had no role: in the designof the study; in the collection, analyses, or interpretation of data; in the writing of the manuscript; orin the decision to publish the results.
References1. Sustainable Food Systems: Concept and Framework; FAO, 2018. Available online: http://www.fao.org/3/ca2079en/CA2079EN.pdf
(accessed on 28 October 2021).2. Springmann, M.; Clark, M.; Mason-D’Croz, D.; Wiebe, K.; Bodirsky, B.L.; Lassaletta, L.; De Vries, W.; Vermeulen, S.J.; Herrero, M.;
Carlson, K.M.; et al. Options for keeping the food system within environmental limits. Nature 2018, 562, 519–525. [CrossRef]3. European Commission. Towards a Sustainable Food System: Group of Chief Scientific Advisors; COM, 2020. Available online:
https://ec.europa.eu/info/sites/default/files/research_and_innovation/groups/sam/scientific_opinion_-_sustainable_food_system_march_2020.pdf (accessed on 10 October 2021).
4. Glauber, J.W. Developed Country Policies: Domestic Farm Policy Reform and Global Food Security. In 2018 Global Food PolicyReport; International Food Policy Research Institute (IFPRI): Washington, DC, USA, 2018; Chapter 7; pp. 54–61. [CrossRef]
5. Willett, W.; Rockström, J.; Loken, B.; Springmann, M.; Lang, T.; Vermeulen, S.; Garnett, T.; Tilman, D.; Declerck, F.; Wood, A.;et al. Food in the Anthropocene: The EAT–Lancet Commission on healthy diets from sustainable food systems. Lancet 2019, 393,447–492. [CrossRef]
6. COM (European Commission). The European Green Deal. COM/2019/640 Final. 2019. Available online: https://eur-lex.europa.eu/legal-content/EN/TXT/?uri=CELEX:52019DC0640 (accessed on 25 November 2021).
7. COM (European Commission). Farm to Fork Strategy for a Fair, Healthy and Environmentally-Friendly Food System. 2020. Availableonline: https://ec.europa.eu/food/farm2fork_en (accessed on 5 October 2021).
8. Barling, D.; Gresham, J. Governance in European Food Value Chains; The VALUMICS Project Funded by European Union’s Horizon2020 No 727243. Deliverable D5.1; University of Hertfordshire: Hartfield, UK, 2019; 237p. [CrossRef]
9. Wijnands, J.H.; van der Meulen, B.M.; Poppe, K.J. Competitiveness of the European Food Industry: An Economic and Legal As-sessment 2007; Office for Official Publications of the European Communities, 2007; ISBN 978-92-79-06033-5. Available on-line: https://www.researchgate.net/publication/254832310_Competitiveness_of_the_European_Food_Industry_An_economic_and_legal_assessment (accessed on 28 October 2021).
10. Barling, D.; Sharpe, R.; Gresham, J.; Mylona, K. Characterisation Framework of Key Policy, Regulatory and Governance Dynamics andImpacts upon European Food Value Chains: Fairer Trading Practices, Food Integrity, and Sustainability Collaborations; The VALUMICSproject funded by European Union’s Horizon 2020 No 727243. Deliverable D3.3; University of Hertfordshire: Hatfield, UK,2018; 416p. [CrossRef]
11. Busch, G.; Spiller, A. Farmer share and fair distribution in food chains from a consumer’s perspective. J. Econ. Psych. 2016, 55,149–158. [CrossRef]
12. Kumar, N. The power of trust in manufacturer-retailer relationships. Harv. Bus. Rev. 1996, 74, 92–106.13. Cox, A.; Ireland, P.; Lonsdale, C.; Sanderson, J.; Watson, G. Supply Chains, Markets and Power: Managing Buyer and Supplier Power
Regimes; Routledge: New York, NY, USA, 2002.14. Gorton, M.; Angell, R.; Dries, L.; Urutyan, V.; Jackson, E.; White, J. Power, buyer trustworthiness and supplier performance:
Evidence from the Armenian dairy sector. Ind. Mark. Manag. 2015, 50, 69–77. [CrossRef]15. Bonanno, A.; Russo, C.; Menapace, L. Market power and bargaining in agrifood markets: A review of emerging topics and tools.
Agribusiness 2017, 34, 6–23. [CrossRef]16. Deconinck, K. Concentration and Market Power in the Food Chain, OECD Food, Agriculture and Fisheries Papers, No. 151; OECD
Publishing: Paris, France, 2021. [CrossRef]17. Brown, J.R.; Cobb, A.T.; Lusch, R.F. The roles played by interorganizational contracts and justice in marketing channel relationships.
J. Bus. Res. 2006, 59, 166–175. [CrossRef]18. Griffith, D.A.; Harvey, M.G.; Lusch, R.F. Social exchange in supply chain relationships: The resulting benefits of procedural and
distributive justice. J. Oper. Manag. 2006, 24, 85–98. [CrossRef]19. Duffy, R.; Fearne, A.; Hornibrook, S. Measuring distributive and procedural justice: An exploratory investigation of the fairness
of retailer-supplier relationships in the UK food industry. Br. Food J. 2003, 105, 682–694. [CrossRef]
Agriculture 2022, 12, 280 28 of 30
20. DG IPOL (2015) Directorate-General for Internal Policies, Policy Department C, Citizens’ Rights and Constitutional Affairs (2015)The General Principles of EU Administrative Procedural Law (PE 519.224), European Parliament. Available online: https://www.europarl.europa.eu/RegData/etudes/IDAN/2015/519224/IPOL_IDA(2015)519224_EN.pdf (accessed on 28 October 2021).
21. Fałkowski, J.; Ménard, C.; Sexton, R.J.; Swinnen, J.; Vandevelde, S. Unfair Trading Practices in the Food Supply Chain: A LiteratureReview on Methodologies, Impacts and Regulatory Aspects, European Commission; Joint Research Centre: Brussels, Belgium, 2017.[CrossRef]
22. European Parliament Directive (EU) 2019/633 on unfair trading practices in business-to-business relationships in the agriculturaland food supply chain. Off. J. Eur. Union 2019. Available online: http://data.consilium.europa.eu/doc/document/PE-4-2019-INIT/en/pdf. (accessed on 28 October 2021).
23. Barathova, K.; Cacchiarelli, L.; Di Fonzo, A.; Lai, M.; Lee, H.; Menapace, L.; Pokrivcak, J.; Rahbauer, S.; Rajcaniova, M.;Russo, C.; et al. Pass-Through of Unfair Trading Practices in EU Food Supply Chains; Publications Office of the European Union:Luxembourg, 2020. [CrossRef]
24. Sun, Y.; Liu, Z.; Yang, H. How Does Suppliers’ Fairness Affect the Relationship Quality of Agricultural Product Supply Chains? J.Food Qual. 2018, 2018, 1–15. [CrossRef]
25. Gudbrandsdottir, I.Y.; Olafsdottir, G.; Oddsson, G.V.; Stefansson, H.; Bogason, S.G. Operationalization of InterorganizationalFairness in Food Systems: From a Social Construct to Quantitative Indicators. Agriculture 2021, 11, 36. [CrossRef]
26. Conrad, S.H. The dynamics of agricultural commodities and their responses to disruptions of considerable magnitude. KoreanSyst. Dyn. Rev. 2005, 6, 17–32.
27. Meadows, D.L. Dynamics of Commodity Production Cycles; Wright-Allen Press: Cambridge, MA, USA, 1970.28. Sterman, J.D. Business Dynamics: Systems Thinking and Modeling for a Complex World; Irwin/McGraw-Hill: Boston, MA, USA, 2000.29. Utomo, D.S.; Onggo, B.S.; Eldridge, S. Applications of agent-based modelling and simulation in the agri-food supply chains. Eur.
J. Oper. Res. 2018, 269, 794–805. [CrossRef]30. Ingalls, R.G. The value of simulation in modeling supply chains. In Proceedings of the 30th Conference on Winter Simulation,
Washington, DC, USA, 13–16 December 1998; ISBN 0-7803-5134-7.31. Beamon, B.M. Supply chain design and analysis: Models and methods. Int. J. Prod. Econ. 1998, 55, 281–294. [CrossRef]32. Terzi, S.; Cavalieri, S. Simulation in the Supply Chain Context: A Survey. Comput. Ind. 2004, 53, 3–16. [CrossRef]33. Brailsford, S.C.; Eldabi, T.; Kunc, M.; Mustafee, N.; Osorio, A.F. Hybrid simulation modelling in operational research: A
state-of-the-art review. Eur. J. Oper. Res. 2019, 278, 721–737. [CrossRef]34. Morel, B.; Ramanujam, R. Through the Dynamics the of Looking Glass of Complexity: Adaptive Organizations as Systems and
Evolving. Organ. Sci. 1999, 10, 278–293. [CrossRef]35. Von Bertalanffy, L. General System Theory: Foundations, Development, Applications; Georg Braziller: New York, NY, USA, 1968.36. Andrew, A.M. General systems theory: Ideas and applications. Kybernetes 2003, 32, 571–574. [CrossRef]37. Forrester, J. Origin of System Dynamics. System Dynamics Society: 1961. Available online: http://www.systemdynamics.org/DL-
IntroSysDyn/start.htm. (accessed on 28 October 2021).38. Randers, J. Guidelines for Model Conceptualization. In Elements of the System Dynamics Method; Randers, J., Ed.; Pegasus
Communications, 1980; pp. 117–138. Available online: http://cau.ac.kr/~thmoon/lecture/udyn/Randers1.pdf (accessed on28 October 2021).
39. Morecroft, J. Visualising and Rehearsing Strategy. Bus. Strategy Rev. 1999, 10, 17–32. [CrossRef]40. Rahim, F.H.A.; Hawari, N.N.; Abidin, N.Z. Supply and demand of rice in Malaysia: A system dynamics approach. Int. J. Sup.
Chain. Mgt. 2017, 6, 1–7.41. Minegishi, S.; Thiel, D. System dynamics modeling and simulation of a particular food supply chain. Simul. Pract. Theory 2000, 8,
321–339. [CrossRef]42. Georgiadis, P.; Vlachos, D.; Iakovou, E. A system dynamics modeling framework for the strategic supply chain management of
food chains. J. Food Eng. 2005, 70, 351–364. [CrossRef]43. Stave, K.A.; Kopainsky, B. A system dynamics approach for examining mechanisms and pathways of food supply vulnerability. J.
Environ. Stud. Sci. 2015, 5, 321–336. [CrossRef]44. Brzezina, N.; Kopainsky, B.; Mathijs, E. Can Organic Farming Reduce Vulnerabilities and Enhance the Resilience of the European
Food System? A Critical Assessment Using System Dynamics Structural Thinking Tools. Sustainability 2016, 8, 971. [CrossRef]45. Choi, T.Y.; Dooley, K.J.; Rungtusanatham, M. Supply networks and complex adaptive systems: Control versus emergence. J. Oper.
Manag. 2001, 19, 351–366. [CrossRef]46. Higgins, A.J.; Miller, C.J.; Archer, A.A.; Ton, T.; Fletcher, C.S.; McAllister, R.R.J. Challenges of operations research practice in
agricultural value chains. J. Oper. Res. Soc. 2010, 61, 964–973. [CrossRef]47. Holland, J.H. Complex adaptive systems. Daedalus 1992, 121, 17–30.48. Anderson, P. Complexity theory and organization science. Organ. Sci. 1999, 10, 216–232. [CrossRef]49. Macal, C.M.; North, M.J. Tutorial on agent-based modelling and simulation. J. Simul. 2010, 4, 151–162. [CrossRef]50. van Dam, K.H.; Nikolic, I.; Lukszo, Z. Agent-Based Modelling of Socio-Technical Systems; Springer: Berlin/Heidelberg, Germany,
2013; ISBN 9400749325.51. Phelan, M.; McGarraghy, S. Grammatical evolution in developing optimal inventory policies for serial and distribution supply
chains. Int. J. Prod. Res. 2016, 54, 336–364. [CrossRef]
Agriculture 2022, 12, 280 29 of 30
52. Axtell, R. Why Agents? On the Varied Motivations for Agent Computing in the Social Sciences; Brookings Institution, Center on Socialand Economic Dynamics: Washington, DC, USA, 2000. Available online: https://www.brookings.edu/research/why-agents-on-the-varied-motivations-for-agent-computing-in-the-social-sciences/ (accessed on 28 October 2021).
53. Vempiliyath, T.; Thakur, M.; Hargaden, V. Development of a Hybrid Simulation Framework for the Production Planning Processin the Atlantic Salmon Supply Chain. Agriculture 2021, 11, 907. [CrossRef]
54. Gudbrandsdottir, I.Y.; Olafsdottir, A.H.; Sverdrup, H.U.; Bogason, S.G.; Olafsdottir, G.; Stefansson, G. Modeling of IntegratedSupply-, Value- and Decision Chains within Food Systems. In System Dynamics and Innovation in Food Networks; 2018; pp. 341–348.Available online: https://www.researchgate.net/publication/326426301_MODELING_OF_INTEGRATED_SUPPLY-_VALUE-_AND_DECISION_CHAINS_WITHIN_FOOD_SYSTEMS (accessed on 28 October 2021).
55. Taghikhah, F.; Voinov, A.; Shukla, N.; Filatova, T.; Anufriev, M. Integrated modeling of extended agro-food supply chains: Asystems approach. Eur. J. Oper. Res. 2021, 288, 852–868. [CrossRef] [PubMed]
56. Olafsdottir, A.H.; Gudbrandsdóttir, I.Y.; Sverdrup, H.U.; Bogason, S.G.; Olafsdottir, G.; Stefansson, G. System Analysis andSystem Dynamics Applied in Complex Research Projects—The Case of VALUMICS. Int. J. Food Syst. Dyn. 2018, 9, 409–418.[CrossRef]
57. Gudbrandsdottir, I.Y.; Olafsdottir, G.; Bogason, S.G. Modelling food supply networks. Aquac. Eur. 2019, 44, 32–36. Available online:https://valumics.eu/wp-content/uploads/2019/10/AE-vol44-1-VALUMICS.pdf (accessed on 28 October 2021). [CrossRef]
58. Ziegler, F.; Winther, U.; Hognes, E.S.; Emanuelsson, A.; Sund, V.; Ellingsen, H. The carbon footprint of Norwegian seafoodproducts on the global seafood market. J. Ind. Ecol. 2013, 17, 103–116. [CrossRef]
59. Chen, W.; Jafarzadeh, S.; Thakur, M.; Ólafsdóttir, G.; Mehta, S.; Bogason, S.; Holden, N.M. Environmental impacts of animal-basedfood supply chains with market characteristics. Sci. Total Environ. 2021, 783, 147077. [CrossRef]
60. Gereffi, G.; Humphrey, J.; Sturgeon, T. The governance of global value chains. Rev. Int. Political Econ. 2005, 12, 78–104. [CrossRef]61. Ponte, S.; Gibbon, P. Quality standards, conventions and the governance of global value chains. Econ. Soc. 2005, 34, 1–31.
[CrossRef]62. Ponte, S.; Sturgeon, T. Explaining governance in global value chains: A modular theory-building effort. Rev. Int. Political Econ.
2014, 21, 195–223. [CrossRef]63. Svanidze, M.; Cechura, L.; Duric, I.; Jaghdani, T.J.; Olafsdottir, G.; Thakur, M.; Samoggia, A.; Esposito, G.; Del Prete, M. Assessment
of Price Formation and Market Power along the Food Chains; The VALUMICS Project Funded by European Union’s Horizon 2020No 727243; Deliverable: D5.5; Leibniz Institute of Agricultural Development in Transition Economies (IAMO): Halle, Germany,2020; 114p.
64. Cechura, L.; Kroupová, Z.Z.; Rumánková, L.; Jaghdani, T.J.; Samoggia, A.; Thakur, M. Assessment of Economies of Scale and TechnicalChange along the Food Chain; The VALUMICS Project Funded by European Union’s Horizon 2020 No 727243. Deliverable: D5.6;Czech University of Life Sciences: Prague, Czech Republic, 2020; 169p.
65. Jaghdani, T.J.; Johansen, U.; Thakur, M.; Ðuric, I. Assessment of Persistence of Business Trade Relationships along the Selected FoodChains of Different European Countries and Sectors; The VALUMICS Project Funded by European Union’s Horizon 2020 No 727243.Deliverable: D5.3; Leibniz Institute of Agricultural Development in Transition Economies (IAMO): Halle, Germany, 2020; 43p.
66. Aditjandra, P.; Pang, G.; Ojo, M.; Gorton, M.; Hubbard, C. Report on Statistical Analysis of Agribusiness Profitability; The VALUMICSproject, funded by European Union’s Horizon 2020 No 727243. Deliverable: D5.4; Newcastle University: Newcastle, UK, 2019; 48p.[CrossRef]
67. Olafsdottir, G.; McGarraghy, S.; Kazakov, R.; Gudbrandsdottir, I.Y.; Aubert, P.M.; Cook, D.; Cechura, L.; Bogason, S.G. FunctionalSpecifications and Design Parameters for the Implementation of the Quantitative Modelling; The VALUMICS Project Funded by EuropeanUnion’s Horizon 2020 No 727243. Deliverable 5.2; University of Iceland: Reykjavik, Iceland, 2019; 47p. [CrossRef]
68. Carbone, A. Food supply chains: Coordination governance and other shaping forces. Agric. Food Econ. 2017, 5, 3. [CrossRef]69. Gereffi, G.; Lee, J. Economic and social upgrading in global value chains and industrial clusters: Why governance matters. J. Bus.
Ethics 2016, 133, 25–38. [CrossRef]70. European Parliament. Regulation (EU) 1308/2013 Establishing a common organisation of the markets in agricultural products. Off.
J. Eur. Union 2013. Available online: https://eur-lex.europa.eu/LexUriServ/LexUriServ.do?uri=OJ:L:2013:347:0671:0854:EN:PDF(accessed on 28 October 2021).
71. Cechura, L.; Jaghdani, T.J. Market Imperfections within the European Wheat Value Chain: The Case of France and the UnitedKingdom. Agriculture 2021, 11, 838. [CrossRef]
72. Svanidze, M.; Ðuric, I. Global Wheat Market Dynamics: What Is the Role of the EU and the Black Sea Wheat Exporters? Agriculture2021, 11, 799. [CrossRef]
73. French Competition Authority: Avis n 18-A-04 du 3 mai 2018 Relatif au Secteur Agricole. 2018. Available online: https://www.autoritedelaconcurrence.fr/sites/default/files/commitments//18a04.pdf (accessed on 25 November 2021).
74. Koppenberg, M.; Hirsch, S. Output market power and firm characteristics in dairy processing: Evidence from three EU countries.J. Agric. Econ. 2021, 1–28. [CrossRef]
75. Cechura, L.; Žáková Kroupová, Z. Technical Efficiency in the European Dairy Industry: Can We Observe Systematic Failures inthe Efficiency of Input Use? Sustainability 2021, 13, 1830. [CrossRef]
76. Cechura, L.; Žáková Kroupová, Z.; Samoggia, A. Drivers of Productivity Change in the Italian Tomato Food Value Chain.Agriculture 2021, 11, 996. [CrossRef]
Agriculture 2022, 12, 280 30 of 30
77. Olafsdottir, G.; Mehta, S.; Richardsen, R.; Cook, D.; Gudbrandsdottir, I.Y.; Thakur, M.; Lane, A.; Bogason, S.G. Governance of thefarmed salmon Value Chain from Norway to the EU. Aquac. Eur. 2019, 44, 5–19. [CrossRef]
78. Jaghdani, T.J.; Cechura, L.; Ólafsdóttir, G.; Thakur, M. Market power in Norwegian Salmon Industry. In Proceedings of the 60thAnnual Meeting of the Gesellschaft für Wirtschafts- und Sozialwissenschaften des Landbaues e.V. (Society for Economic andSocial Sciences of Agriculture) (GEWISOLA), Halle, Germany, 23–25 September 2020. [CrossRef]
79. Richardson, G.; Pugh, A. Introduction to System Dynamics Modeling with DYNAMO. J. Oper. Res. Soc. 1997, 48, 1146. [CrossRef]80. Roberts, N.H. An Evaluation of Introduction to Simulation: The System Dynamics Approach. In Proceedings of the 1981
International System Dynamics Research Conference, Rensselaerville, NY, USA; p. 303. Available online: https://systemdynamics.org/wp-content/uploads/assets/proceedings/1981/rober303.pdf (accessed on 28 October 2021).
81. Elzinga, K.G.; Mills, D.E. The Lerner index of monopoly power: Origins and uses. Amer. Econ. Rev. 2011, 101, 558–564. [CrossRef]82. Lerner, A.P. The Concept of Monopoly and the Measurement of Monopoly Power. Rev. Econ. Stud. 1934, 1, 157–175. [CrossRef]83. Kumbhakar, S.C.; Baardsen, S.; Lien, G. A New Method for Estimating Market Power with an Application to Norwegian
Sawmilling. Rev. Ind. Organ. 2012, 40, 109–129. [CrossRef]84. Ackermann, F.; Eden, C. Strategic Management of Stakeholders: Theory and Practice. Long Range Plan. 2011, 44, 179–196.
[CrossRef]85. Eden, C.; Ackermann, F. SODA—The Principles. In Rational Analysis for a Problematic World Revisited: Problem Structuring Methods
for Complexity, Uncertainty and Conflict; Rosenhead, J., Mingers, J., Eds.; Wiley: Hoboken, NJ, USA, 2001; pp. 21–42.86. Kelly, G. The Psychology of Personal Constructs: A Theory of Personality; Norton: New York, NY, USA, 1955.87. Huff, A.S.; Eden, C. Managerial and organizational cognition. Int. Stud. Manag. Organ. 2009, 39, 3–8. [CrossRef]88. Elsawah, S.; Guillaume, J.H.A.; Filatova, T.; Rook, J.; Jakeman, A. A methodology for eliciting, representing, and analysing
stakeholder knowledge for decision making on complex socio-ecological systems: From cognitive maps to agent-based models.J. Environ. Manag. 2015, 151, 500–516. [CrossRef]
89. Kazakov, R.; Howick, S.; Morton, A. Managing complex adaptive systems: A resource/agent qualitative modelling perspective.Eur. J. Oper. Res. 2021, 290, 386–400. [CrossRef]
90. Pfeffer, J.; Salancik, G.R. The External Control of Organizations: A Resource Dependence Perspective; Stanford University Press:Stanford, CA, USA, 1978.
91. Hillman, A.J.; Withers, M.C.; Collins, B.J. Resource Dependence Theory: A Review. J. Manag. 2009, 35, 1404–1427. [CrossRef]92. Kahneman, D.; Tversky, A. The Simulation Heuristic. Judgment under Uncertainty: Heuristics and Biases; Cambridge University Press:
Cambridge, UK, 1982; pp. 201–208.93. Gigerenzer, G. Bounded rationality: The adaptive toolbox. Int. J. Psychology 2000, 35, 203–204.94. Kahneman, D. Maps of bounded rationality: Psychology for behavioral economics. Am. Econ. Rev. 2003, 93, 1449–1475. [CrossRef]95. Kahneman, D.; Tversky, A. Prospect Theory: An Analysis of Decision under Risk. Econometrica 1979, 47, 263–292. [CrossRef]96. McGarraghy, S.; Kazakov, R.; Huber, É.; Loveluck, W.; Gherasim, M.; Ailoaie, C.; Aubert, P.-M. Interventions on the French
Wheat-to-Bread Food Value Chain and Their Effects on Equitable Value Distribution: Insights from a Policy Scenario Simulator.In Proceedings of the EURO XXXI, Athens, Greece, 11–14 July 2021. Available online: https://www.euro-online.org/conf/euro31/treat_abstract?frompage=search&paperid=2285 (accessed on 26 November 2021).
97. WAOB World Agricultural Outlook Board (n.d). World Agricultural Supply and Demand Estimates. Available online: https://www.usda.gov/oce/commodity/wasde (accessed on 25 November 2021).
98. UN [United Nations]. Goal 12: Ensure Sustainable Consumption and Production Patterns: Facts and Figures. Available online:https://www.un.org/sustainabledevelopment/sustainable-consumption-production (accessed on 28 October 2021).
99. The State of Food Security and Nutrition in the World 2021. Transforming Food Systems for Food Security, Improved Nutrition andAffordable Healthy Diets for All; FAO: Rome, Italy, 2021. [CrossRef]
100. Aubert, P.-M.; Gardin, B.; Huber, É.; Schiavo, M.; Alliot, C. Designing Just Transition Pathways: A Methodological Framework toEstimate the Impact of Future Scenarios on Employment in the French Dairy Sector. Agriculture 2021, 11, 1119. [CrossRef]
101. Saviolidis, N.M.; Olafsdottir, G.; Nicolau, M.; Samoggia, A.; Huber, E.; Brimont, L.; Gorton, M.; von Berlepsch, D.; Sigurdardottir,H.; Del Prete, M.; et al. Stakeholder Perceptions of Policy Tools in Support of Sustainable Food Consumption in Europe: PolicyImplications. Sustainability 2020, 12, 7161. [CrossRef]
102. Gudbrandsdottir, I.Y.; Saviolidis, N.M.; Olafsdottir, G.; Oddsson, G.V.; Stefansson, H.; Bogason, S.G. Transition Pathways for theFarmed Salmon Value Chain: Industry Perspectives and Sustainability Implications. Sustainability 2021, 13, 12106. [CrossRef]
Related Documents