TECHNICAL NOTE on Conceptual Framework for the Updated Methodology and Tool of Wetland Inventory (WI) A Working Document Prepared by Environmental Management Division 3 May 2019 Technical Note No. 2/2017

Welcome message from author
This document is posted to help you gain knowledge. Please leave a comment to let me know what you think about it! Share it to your friends and learn new things together.
Transcript

TECHNICAL NOTE
on
Conceptual Framework for the Updated Methodology and Tool of Wetland Inventory (WI)
A Working Document
Prepared by Environmental Management Division
3 May 2019
Technical Note No. 2/2017

Document history
Version Revision Description Issue date Issued by
1 0 Draft for review by International Expert on Wetland
30 June 2017 ED
1 1 Revised version disseminated to NMCs for comments and feedbacks
5 July 2017 ED
1 2 Revised Draft based on TNMC’s comments and submitted to TNMC
18 October 2017 ED
2 1 ED
2 2 ED

___________________________________________________________________________
CONTENTS 1. Why an Updated Methodology and Tool for Wetland Inventory (WI)?................................... 1
2. Introduction .............................................................................................................................. 2
2.1. Definition of Wetland ....................................................................................................... 2
2.2. Wetland Types .................................................................................................................. 2
2.3. Wetland Ecosystem Services and their value ................................................................... 3
2.3.1. Ecosystem Services ....................................................................................................... 3
2.3.2.Ecosystem service values ............................................................................................... 4
2.4. Wetland Governance and Management .......................................................................... 7
2.5. Wise Use and the Sustainable Development of Wetlands ............................................... 9
2.6. Status and trends of wetlands .......................................................................................... 9
2.7. Challenges and opportunities for Wetland Management and Wise Use ....................... 11
2.7.1. Challenges ................................................................................................................... 11
2.7.2.Opportunities ............................................................................................................... 12
2.8. Wetland Inventory .......................................................................................................... 14
2.9. Wetland Assessment ...................................................................................................... 15
3. Summary of Wetlands in the Lower Mekong Basin ............................................................... 16
3.1. Types of Wetland ............................................................................................................ 16
3.1.1 Man-made Wetlands of the LMB ............................................................................. 17
3.1.2 Natural Wetlands of the LMB ................................................................................... 19
3.2. Permanent and Seasonal Wetlands ................................................................................ 22
3.3. The Most Important Wetlands in the LMB ..................................................................... 23
3.3.1 Cambodia .................................................................................................................. 25
3.3.2 Lao PDR ..................................................................................................................... 28
3.3.3 Thailand .................................................................................................................... 30
3.3.4 Viet Nam ................................................................................................................... 33
4. Previous wetland inventories and results in the LMB countries ............................................ 35
5. Downscaling: applying an inventory methodology in the LMB countries .............................. 35
6. Conceptual Framework for Updated Methodology and Tool of Wetland Inventory (WI) ..... 36
6.1. Guiding Principles ........................................................................................................... 36
6.2. An Integrated Approach ................................................................................................. 36

___________________________________________________________________________
6.3. Key Steps in the Wetland Inventory Process .................................................................. 37
Step 1: Form a multidisciplinary team .................................................................................. 37
Step 2: Identify purpose and objectives ............................................................................... 37
Step 3: Review existing knowledge ....................................................................................... 37
Step 4: Determine the scale and scope of the inventory ..................................................... 37
Step 5: Establish parameters and core data set ................................................................... 38
Step 6: Plan and prepare the inventory process .................................................................. 40
Step 7: Identify and engage key people at the local level .................................................... 41
Step 8: Data collection .......................................................................................................... 41
Step 9: Further planning and preparation of field work ....................................................... 42
Step 10: Implement field assessment/s ................................................................................ 42
Step 11: Analyze and integrate the data .............................................................................. 42
Step 12: Reporting and presentation of results ................................................................... 43
Step 13: Feedback and policy engagement .......................................................................... 43
Step 14: Monitoring and evaluation ..................................................................................... 43
7. References .............................................................................................................................. 45
Annex 1: MRC wetland database .............................................................................................. 48
Annex 2: Planning matrix for wetlands inventory .................................................................... 50
Annex 3: Draft Wetland Inventory Data Collection Form......................................................... 54
Annex A: MRC Wetland Classification Coding Supporting Inventory ....................................... 72
Annex B: Ramsar Classification ................................................................................................. 73

_____________________________________________________________________________
1
TECHNICAL NOTE
on
Conceptual Framework for the Updated Methodology and Tool of
Wetland Inventory (WI)
1. Why an Updated Methodology and Tool for Wetland Inventory (WI)? Some methodological and information gaps partly explain the omission of wetland values in planning, investment and management leading to wetlands loss and degradation. This conceptual framework for an updated version of a wetland inventory methodology and tool for the Lower Mekong Basin (LMB) is designed to guide the collection of more comprehensive information needed as one way to close the information gap. By compiling essential baseline information on wetland resources an improved wetland inventory will help underpin better policy development, investment choices and wetlands management outcomes. This will help wetlands to achieve their full potential to assist Member Countries of the LMB to achieve sustainable development. Management decisions affecting wetlands (for example relating to investment, infrastructure or management of land and water resources) do not fully and properly consider the wider biological, ecological, developmental or economic values of wetlands. Furthermore, governance of wetlands has typically not effectively considered the interests of those constituencies depending on the wetlands and their provision of “public goods”, and has typically favored maximizing some benefits of wetlands, in particular their more visible benefits such as particular foods, at the expense of less visible benefits, such as additional food sources, water regulation or storm protection. Short-term gains, including those motivated by converting wetlands in order to increase private gain, have often over-ridden the more important long-term benefits of wetlands. Wetlands in the LMB contain biodiversity of exceptional conservation significance, comprising many unique ecosystems and a wide array of nationally and globally-threatened species. At the same time, they typically form essential components of local, national and even regional economies, as well as underpinning the livelihoods of nearby, and sometimes distant, human communities. Wetland goods and services are often particularly important for poorer and more vulnerable groups, which have limited alternative sources of income and subsistence, and have weak access to basic services. An improved wetlands inventory methodology and tool, guided by this document, will help improve attention to sustaining the benefits of wetlands to underpin the environmental, social and economic dimensions of sustainable development at local through national to regional scales.
_____________________________________________________________________________
2
2. Introduction This section introduces wetlands and the concept of wetlands inventory. It includes introductions to:
• Wetland types, wetland ecosystem services, threats to wetlands and management challenges and opportunities
• Wetlands inventory and assessment
• The purpose and principles of wetland inventory
• The integrated approach
2.1. Definition of Wetland Wetlands are defined by the Ramsar Convention as: “…areas of marsh, fen, peatland or water, whether natural or artificial, permanent or temporary, with water that is static or flowing, fresh, brackish or salt, including areas of marine water the depth of which at low tide does not exceed six metres.” Wetlands occur everywhere, from the poles to the tropics. There are only broad estimates of how much of the earth’s surface is presently made up of wetlands. The UNEP-World Conservation Monitoring Centre, for example, estimates that about 570 million hectares (5.7 million km2), or roughly 6% of the Earth’s land surface, is composed of wetlands (Ramsar Convention website: www.ramsar.org). Wetland extent can be difficult to assess, particularly for those wetlands that are composed mainly of wet soils and covered with vegetation (where open water is not a good measure of extent), and seasonal wetlands which can vary greatly in extent according to hydrological conditions (e.g. flood versus dry season extents).
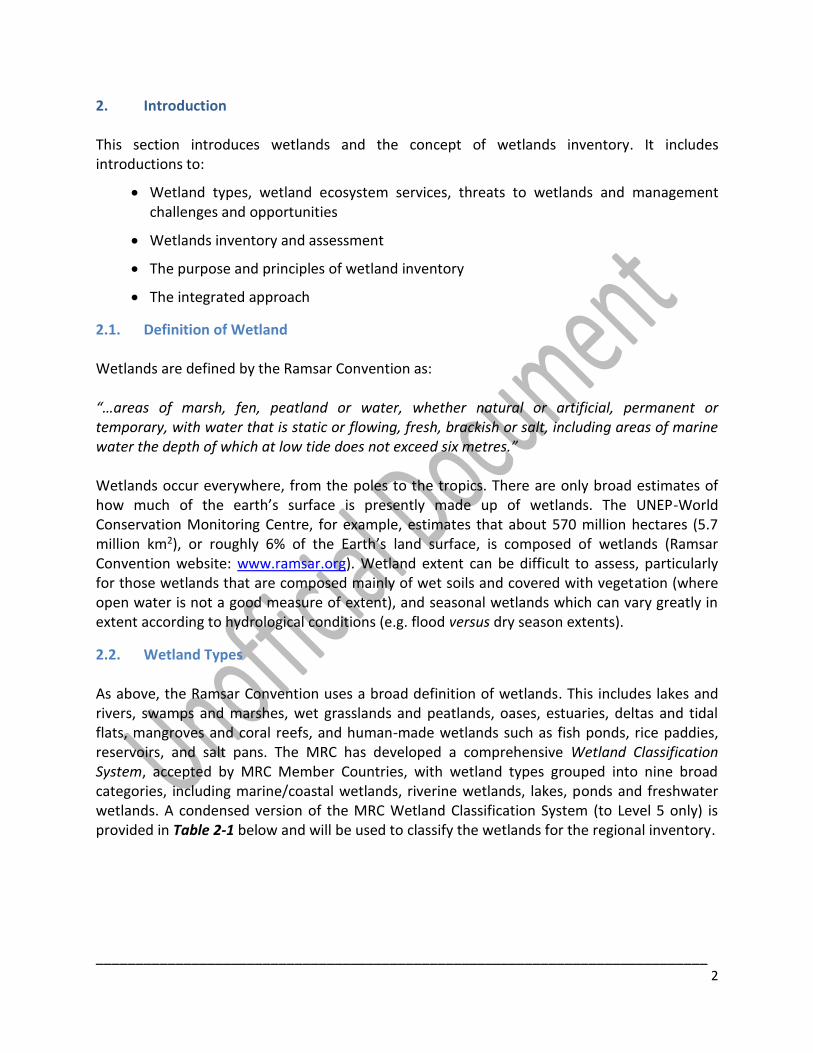
2.2. Wetland Types As above, the Ramsar Convention uses a broad definition of wetlands. This includes lakes and rivers, swamps and marshes, wet grasslands and peatlands, oases, estuaries, deltas and tidal flats, mangroves and coral reefs, and human-made wetlands such as fish ponds, rice paddies, reservoirs, and salt pans. The MRC has developed a comprehensive Wetland Classification System, accepted by MRC Member Countries, with wetland types grouped into nine broad categories, including marine/coastal wetlands, riverine wetlands, lakes, ponds and freshwater wetlands. A condensed version of the MRC Wetland Classification System (to Level 5 only) is provided in Table 2-1 below and will be used to classify the wetlands for the regional inventory.

___________________________________________________________________________________________________________
2
Table 2-1: MRC Wetland Classification Coding Supporting Inventory (Source: MRC, 2011)
MRC WETLAND CLASSIFICATION CODING_SUPPORTING INVENTORY
MARINE ESTURINE RIVERINE FRESHWATER WETLANDS/VEGETATION
Wetland types/habitats
(Level 2- 5) Coding
Wetland types/habitats (Level
2- 5) Coding
Wetland types/habitats
(Level 2- 5) Coding
Wetland types/habitats (Level 2- 5) Coding
subtidal/permanent flooding neutral/permanent flooding neutral/permanent flooding
non-vegetated deep pool RRa wet grassland/marsh (nature) FW1
bare - rocky/consolidated MS1a bare - rocky/consolidated ES1a natural channel RRb wet grassland/marsh (manmade) FW1m
bare - unconsolidated MS1b bare - unconsolidated ES1b artificial channel RRbm rice/agriculture (recession) FW2rr
mariculture MS1dm mariculture ES1dm rapid/riffles RRc rice/agriculture (rainfed) FW2rf
salt works MN1im salt works ES1im waterfall RRd rice/agriculture (irrigated) FW2i
coral and vegetated thermal spring RRe swamp/woody scrub FW3
coral MS2a coral ES2a subterranean spring/stream RRf swamp/woody scrub (introduced/alien species) FW3m
artificial coral MS2am artificial coral ES2am temporary flooding Emergent woody scrub FW3a
seagrass MS2b seagrass ES2b deep pool RRta flooded forest (nature) FW4
seaweed MS2c seaweed ES2c natural channel RRtb flooded forest (plantation) FW4m
seaweed farm MS2cm seaweed farm ES2cm artificial channel RRtbm other wet crops FW5
mariculture MS2dm aquaculture ES2hm rapid/riffles RRtc other wet crops (irrigated) FW5m
watercourse MS3 watercourse ES3 waterfall RRtd peatlands: bryophytes/sedges/rushes FW6
intertidal/temporary flooding thermal spring RRte Peatlands: woody shrubs/trees FW6a
non-vegetated subterranean spring/stream RRtf temporary flooding
beach/sandy MI1c beach/sandy EI1c wet grassland/marsh (nature) FWt1
mudflat/silty MI1d mudflat/silty EI1d BEACH/BANK/BAR/ROCKY wet grassland/marsh (manmade) FWt1m
cliff/rocky MI1f cliff/rocky EI1f beach/bank/bar RB rice/agriculture (recession) FWt2rr
tidal pool MI1g tidal pool EI1g rocky outcrop RK rice/agriculture (rainfed) FWt2rf
salt works MI1im salt works EI1im rice/agriculture (irrigated) FWt2i
aquaculture MI1hm aquaculture EI1hm LAKE swamp/woody scrub FWt3
coral and vegetated Lake > 8 ha swamp/woody scrub (introduced/alien species) FWt3m
coral MI2a coral EI2a neutral flooding Emergent woody scrub FW3at
artificial coral MI2am artificial coral EI2am natural LL flooded forest FWt4
seagrass MI2b seagrass EI2b manmade LLm flooded forest (plantation) FWt4m
seaweed MI2c seaweed EI2c temporary flooding other wet crops FWt5
seaweed farm MI2cm seaweed farm EI2cm LLt - natural LLt other wet crops (irrigated) FWt5m
mangrove/forest MI2d mangrove/forest EI2d LLtm - manmade LLtm
mangrove/plantation MI2dm mangrove/plantation EI2dm pond/lake < 8 ha
saltmarsh/forbs MI2e saltmarsh/forbs EI2e neutral flooding
agriculture MI2jm agriculture EI2jm natural LP
Marine - lagoon ML other EI2k manmade LPm
aquaculture LPma
sewage treatment LPmb
farm LPmc
cooling LPmd
borrow pit/quarry Lpme
other LPmf
temporary flooding
natural LPt
manmade LPtm
Saline lake > 8 ha LS

_____________________________________________________________________________
3
2.3. Wetland Ecosystem Services and their value
2.3.1. Ecosystem Services As noted by the Ramsar Secretariat, wetlands are among the world's most productive environments. They host important and unique biological diversity, providing the water and primary productivity upon which countless species of plants and animals depend for survival. Wetlands, for example, are important storehouses of genetic resources. Rice, for example, is a common wetland plant and the staple diet of more than half of the world’s population. Similarly, fish from wetlands are an important source of food and livelihood, notably in the Mekong. The natural diversity of rice and fish varieties that wetlands support are mportant assets that will be needed as a source of genetic material to support the continued development of strains and varieties to improve the farming of fish, rice and other crops, including in order to enable farming to adapt to change, including climate change. These, and other, benefits that wetlands provide to people are called ecosystem services. The multiple roles of wetland ecosystems and their value to human populations have been increasingly understood and documented in recent years. The various ecosystem services can be grouped into:
• provisioning services - products obtained from the wetland (e.g. food)
• regulating services - benefits obtained from the regulation of ecosystem processes such as climate, water, and natural hazard regulation
• supporting services - services necessary for the production of all other ecosystem services such as primary production, water cycling, nutrient cycling and habitat for biota; and
• cultural services - the non-material benefits people obtain from ecosystems such as through spiritual enrichment, cognitive development, reflection, recreation, and aesthetic experiences
Table 2-2 provides some examples of these services in more detail.

_____________________________________________________________________________
4
Table 2-2: Ecosystem services provided by or derived from wetlands (Source: Springate-Baginski et al., 2009)
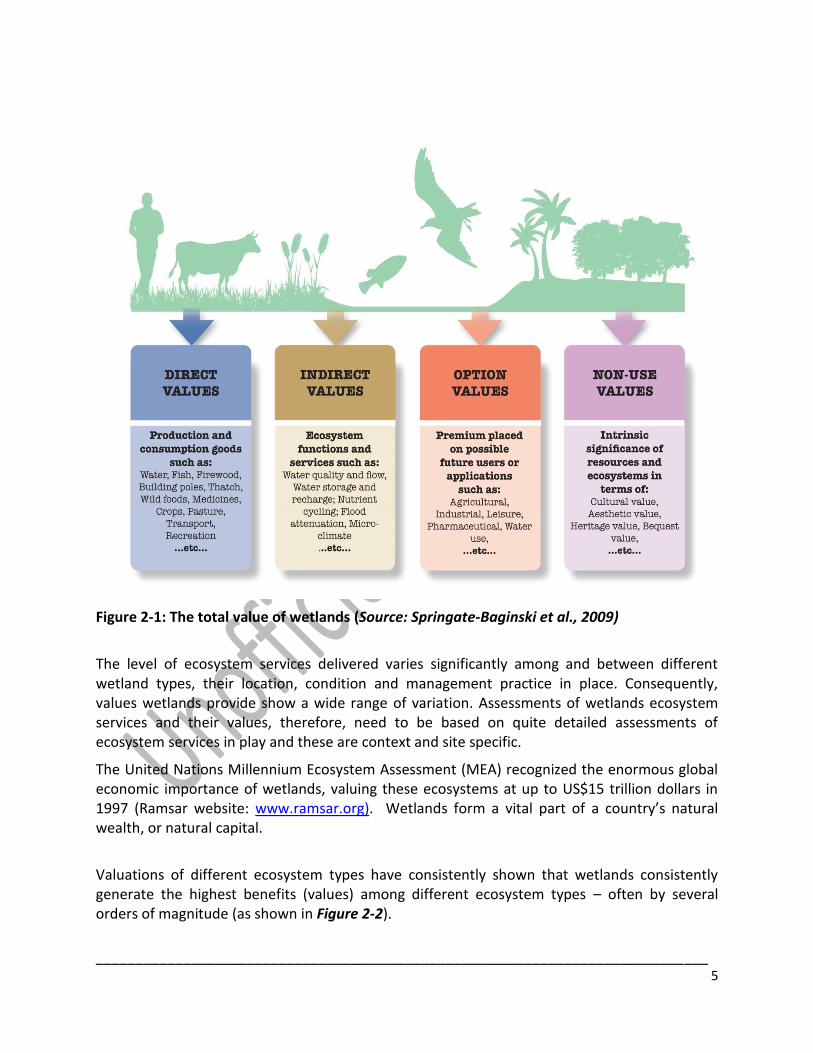
2.3.2. Ecosystem service values Goods and services derived from ecosystems are often categorized into those providing direct values (e.g. fisheries) and indirect values (e.g. flood prevention), as illustrated in Figure 2-1.
_____________________________________________________________________________
5
Figure 2-1: The total value of wetlands (Source: Springate-Baginski et al., 2009)
The level of ecosystem services delivered varies significantly among and between different wetland types, their location, condition and management practice in place. Consequently, values wetlands provide show a wide range of variation. Assessments of wetlands ecosystem services and their values, therefore, need to be based on quite detailed assessments of ecosystem services in play and these are context and site specific.
The United Nations Millennium Ecosystem Assessment (MEA) recognized the enormous global economic importance of wetlands, valuing these ecosystems at up to US$15 trillion dollars in 1997 (Ramsar website: www.ramsar.org). Wetlands form a vital part of a country’s natural wealth, or natural capital.
Valuations of different ecosystem types have consistently shown that wetlands consistently generate the highest benefits (values) among different ecosystem types – often by several orders of magnitude (as shown in Figure 2-2).

_____________________________________________________________________________
6
Figure 2.2: Ranges of monetary values of all ecosystem services combined for various types of ecosystem (in Int.$/ha purchasing power parity corrected, year 2007) based on published studies (number of studies in brackets). The majority of value across ecosystem types is delivered by the water-related ecosystem services they provide (except coral reefs, which are an outlier, where high values are due to eco-tourism). Note the logarithmic scale – inland and coastal wetlands are roughly 10 – 200 times more valuable per unit area than forests or grasslands, largely due to their water-related services. Star signs = average values. (Source: de Groot et al. 2012 building on TEEB 2010).
The goods and services provided by wetlands play a particularly important role in supporting the livelihoods and security of people in the Lower Mekong Basin. The wise use of wetlands will be essential to support the sustainable development of the LMB. The Mekong River and its numerous tributaries, lakes and swamps support many unique ecosystems and maintain habitats, and species. For example, with over 1,300 species of fish, the river’s diversity rivals that of the Amazon or the Congo, on a diversity per unit area basis. This biodiversity is also fundamental to the livelihoods of approximately 55 million people (IUCN, 2009). The inland fisheries of the Mekong River Basin, for example, are among the most productive in the world, potentially supplying one quarter of freshwater fish catches globally and worth an estimated US$2-3 billion annually (Baran, Jantunen and Chong, 2008). Mekong wetlands also provide other essential high value, and less visible, services such as providing clean water, regulating water flows and protecting communities and infrastructure from hydrological extremes (droughts and floods) and the impacts of severe storms. Such services will become increasingly important in the face of climate change.

_____________________________________________________________________________
7
2.4. Wetland Governance and Management Wetlands are connected with the broader landscapes in hydrological and ecological terms, and also exist within an important human context. Socio-economic processes and influences, both on- and off-site, determine wetland status, use, and management. In many cases, the ecological character of, and services provided by, wetlands are determined fundamentally by human activity; for example, the health and status of rice-paddies. There are, therefore, important links between wetland goods and services, the ecological and biological processes that support them, and socio-economic processes both on and off-site. Wetland landscapes thus involve interplay of several key factors resulting in complex Socio-Ecological Systems (SES):
▪ Hydrology and topography of the physical wetland; ▪ Ecology and biodiversity of the wetland ecosystems; ▪ Ecosystem services to human communities, both local and more distant; ▪ Local livelihood and management systems; and ▪ Policies, governance, institutions, and markets.
Each of these elements needs to be understood in order to understand the overall management context, challenges and effective policy and management responses. These interlinkages and interconnectivity mean that the relationships and drivers that affect wetland status can be extremely complex, concern both biophysical and socio-economic elements, and involve a series of interactions between them (as shown in Figure 2-3).
Figure 2-3: Interlinked aspects of a wetland landscape (Source: Springate-Baginski et al., 2009).

_____________________________________________________________________________
8
Without addressing all of these elements it is neither possible to understand the conditions and status of a wetland within the broader physical and human landscape, nor to assess the likely outcomes and implications of different policy and management scenarios. Such integration reflects the need for a broader, more holistic, ecosystem approach to wetland management (See Box 2.1).
Box 2.1: The ecosystem approach The ecosystem approach, as established and defined by the Convention on Biological Diversity, recognizes the need for a holistic approach to wetland assessment and management. The ecosystem approach involves “a strategy for the integrated management of land, water and living resources that promotes conservation and sustainable use in an equitable way”. It supports participatory planning guided by adaptive management to respond to the dynamic nature of ecosystems, in doing so involving all stakeholders and balancing local interests with the wider public interest. It advocates the decentralization of management to the lowest appropriate level, to achieve greater efficiency, effectiveness and equity. The ecosystem approach in both theory and practice is mirrored closely by the “wise-use” approach to wetlands that is a foundation for the sustainable development of wetlands under the Ramsar Convention (section 2.5). Source: Springate-Baginski, 2009.
There are also a number of wetland management scales relating both to the physical wetland and to governance structures at different levels:
▪ The river basin level is the largest practical scale, and is likely to be regional, national or even international (like the Mekong River itself);
▪ Site level, which may be defined by specific physical features, and/or convenience for management; and
▪ Local level, referring to the scale at which local people access, manage and use the resource on a frequent basis.
The boundaries of these scales do not always coincide with the boundaries of administrative responsibility (such as villages, districts, provinces and states). For most wetlands, effective management requires the cooperation of different sectors and stakeholders and harmonization of policies and governance structures across scales. Guidance on assessing and tracking wetland site management effectiveness is available in Annex H7 of the document Preliminary Guidelines for The Implementation of the LMB Wetland Inventory using the Methodology and Tool of Wetland Ecosystem Functions, Assets and Services Assessment and Management (WEFASAM) and Wetland Biodiversity Indicator Assessment (WBIA) (Guideline No. 1/2017 First Draft). This is based on the Ramsar Site Management Effectiveness Tracking Tool (R-METT) from Ramsar Resolution XII.15 Annex 1.

_____________________________________________________________________________
9
2.5. Wise Use and the Sustainable Development of Wetlands The “wise use” concept is a central pillar of the Ramsar Convention and is defined as “the maintenance of their ecological character, achieved through the implementation of ecosystem approaches, within the context of sustainable development” (Ramsar website: www.ramsar.org). The Convention emphasizes that human use on a sustainable basis is compatible with wetland conservation. Under Article 3.1 of the Convention, the Parties agree to “formulate and implement their planning so as to promote the conservation of the wetlands included in the List, and as far as possible the wise use of wetlands in their territory”. The Ramsar wise use concept applies to all wetlands and water resources in a country, not only to those designated as Ramsar Sites. The relationship between “conservation” and “development” has, in the past, tended to be regarded as one of trade-offs – where development has been seen as the priority and its impacts on the environment an unfortunate but necessary cost. This approach is now widely agreed to be out-dated and, previously, contributed to unsustainable development. Modern approaches recoginsise that conservation and development need to be mutually reinforcing if truly sustainable development is to be achieved. This is for two main reasons. First, achieving “conservation” objectives in itself is now widely accepted to be part of sustainable development. Second, delivering overall improved wetlands benefits is a chief means of achieving conservation objectives – properly valuing the benefits of wetlands for people is the best way of ensuring they are conserved. The recognition that the environment (or “conservation”) and development are mutually supporting under a sustainability framework is the corerstone of the 2030 Agenda for Sustainable Development and the Sustainable Development Goals.
2.6. Status and trends of wetlands Despite their importance, wetlands are under increasing pressure. According to the Millennium Ecosystem Assessment (MEA) 2005, freshwater biodiversity is in a worse condition than that of any other ecosystem; it was estimated that 50% of inland water area (excluding large lakes) has been lost globally. The best recent estimate of reported global total loss of natural wetland area due to human activity averages between 54–57%, but loss may have been as high as 87% since 1700 AD, with a 3.7 times faster rate of wetland loss during the 20th and early 21st centuries, equating to a loss of 64–71 % of wetlands extent since that existing in 1900 AD (Davidson 2014). Losses have been larger and faster for inland than coastal natural wetlands. Although the rate of wetland loss in Europe has slowed, and in North America has remained low since the 1980s, the rate has remained high in Asia, where large-scale and rapid conversion of coastal and inland natural wetlands is continuing. These rates of loss are much higher than for terrestrial ecosystems,

_____________________________________________________________________________
10
including forests. Rates of loss of biodiversity from freshwaters has consistently been much more rapid than for terrestrial or marine areas. The implications of this rate of loss extend well beyond loss of biodiversity. Humans are directly and indirectly affected. For example, the vast majority of reviews concluded that wetlands either increase or decrease a particular component of the water cycle (Bullock and Acreman 2003). The extent of their loss, therefore, has significant implications for hydrology. There is ample evidence that wetlands loss has increased risks and vulnerability and in many cases is the primary factor setting risk levels (Renaud et al. 2013). There is vicious spiral between climate change impacts, ecosystem degradation and increased risk of climate-related disasters. It is well established that intact coastal wetlands, including mangroves, can protect coastal communities from extreme weather events (and sea-level rise) and their loss increases risk and vulnerability. Increasing sediment loads is a worldwide water-quality problem but when sediments become trapped behind dams, natural levels of sediment transport downstream can become interrupted undermining sediment flows required to sustain the integrity of coastal wetlands. For example, the loss of wetlands in the Mississippi Delta, and their related storm and flood protection services, due to dam construction and operation upstream, was a primary factor contributing to the severity of the impacts of Hurricane Katrina in 2005 (Batker et al. 2010). Many major urban settlements, and most mega cities, are located in deltas with similar, if not higher, levels of risk through similar (mis-) management approaches to land and water. The question is not if most of these will be similarly impacted – but when. There are many other ecosystem services that have been lost. Many of these are supporting local communities directly on a daily basis. Ecosystem services have been referred to as “the GDP of the poor” since they often rely more directly on them relative to income (TEEB 2010); although rich societies rely on them too – e.g. food and water and disaster risk reduction.
As for other regions, wetlands loss in the Mekong has continued at an alarming pace and many existing Mekong wetlands are also heavily degraded. For example, only 1.3% of the Mekong Delta is now in a natural or even semi-natural condition (MWBP website: www.mekongwetlands.org). The MRCS Environment Management Division is currently preparing a basin-wide assessment of the status and trends in the LMB. The degradation and loss of Mekong wetlands poses a severe threat to both development and conservation goals, and impacts disproportionately on some of the regions poorest communities.

_____________________________________________________________________________
11
2.7. Challenges and opportunities for Wetland Management and Wise Use
2.7.1. Challenges Wetlands are one of the most threatened ecosystems because there are there are many more competing demands on the land and natural resources that comprise and surround wetlands. According to the Ramsar Convention, the main causes of the degradation and loss of wetlands are:
• Major changes in land use, especially an increase in agriculture and grazing animals;
• Water diversion through dams, dikes and canalization;
• Infrastructure development, particularly in river valleys and coastal areas; and
• Air and water pollution and excess nutrients. These, and other, drivers of loss and degradation must be addressed, and reversed, if wetlands are to be managed sustainably. This can be challenging, not least because most of these drivers, pressures and threats arise from outside of the wetland. Wetlands also have distinctive ecological characteristics due to their hydrology that are central to their management challenges: “Hydrological regime and topography are generally the most important determinants of the establishment and maintenance of specific types of wetland and wetland processes, creating the unique physicochemical conditions that make wetlands different from both deepwater aquatic systems and well-drained terrestrial systems. Hydrological conditions affect numerous abiotic factors, including nutrient availability, soil anerobiosis, and salinity in both coastal and inland wetlands, which in turn determine the biota that establish in a wetland. These biotic components can alter the hydrology and other physicochemical features of the wetland…[M]aintaining the hydrological regime of a wetland and its natural variability is necessary to maintain the ecological characteristics of the wetland, including its biodiversity.” (MEA 2005, in Springate-Baginski et al., 2009) In terrestrial areas, site-based management (e.g. protecting resources within a defined boundary) can be effective. However, the above, and other, factors essentially mean that site-based management measures on their own for wetlands are unlikely to be effective, unless accompanied by management of external threats, mainly delivered through hydrological connectivity. Some of these challenges for the protection and sustainable use of wetlands are:

_____________________________________________________________________________
12
▪ Controlling or preventing the conversion of wetlands to other uses, such as agricultural or residential land;
▪ Managing the impacts of human induced floods and droughts (and potentially climate change) on wetlands;
▪ Reducing the impact of invasive alien species; ▪ Managing the input of pollutants into wetlands and connected waterways; ▪ Making sound decisions on more sustainable water extraction for drinking water,
agriculture, and industrial use; ▪ Improved infrastructure development and planning, including urban development,
that minimizes wetlands loss and degradation; ▪ Managing the harvesting of wetland products, including hunting of animals, collection
of non-timber forest and wetland products, and fishing so that they remain within sustainable limits;
▪ Working cooperatively with neighboring countries in managing shared wetlands, water resources and basins.
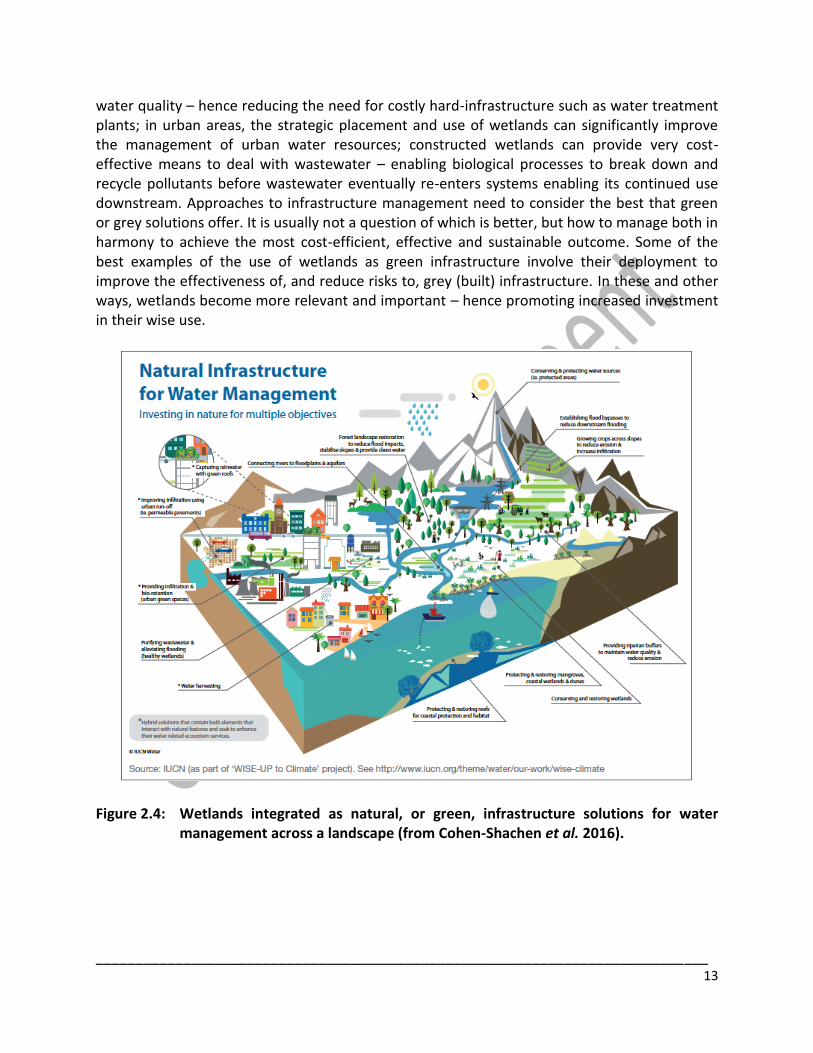
2.7.2. Opportunities The greatest opportunities for successful wetland management lie in aligning wetlands conservation and sustainable development. Because most of the pressures on wetlands arise from outside wetlands it is essential to make wetlands relevant to other agendas, and stakeholders, beyond the conservation community. Because wetlands, when properly and fully evaluated, can be shown to deliver very valuable benefits across a large range of interests, making the relevant connections is the greatest opportunity for mobilizing interest and investment in wetlands management. Although conservation goals and development objectives can sometimes be incompatible at local scale, requiring trade-offs, more often conservation and development are mutually reinforcing. Whatever the relationship between conservation and development in an individual case, the resolution of management actions and policy debates requires information about both and an understanding of the linkages between them (Springate-Baginski et al., 2009). An ecosystem services framework or approach is the best and most effective means to establish linkages between wetlands and sustainable development – because it describes wetlands in their most powerful way – through demonstrating their economic value across stakeholder groups. Wetlands need to be seen much more from the point of view of how their conservation and improved management can deliver on sustainable development outcomes. For example, better knowledge of the products obtained from wetlands, such as fish, can raise attention to them regarding the food and nutrition security agenda. In terms of hydrology, wetlands perform hydrological functions in the same or similar, and in many cases more effective, ways to build (grey) infrastructure. Considering wetlands as “green infrastructure” enables their value and potential uses to be better understood by engineers, policy makers and investment agencies (as shown in Figure 2-4). For example: wetlands play a significant role in regulating water flow and, therefore, as infrastructure to help manage flood and drought risk; coastal wetlands in particular can provide significant protection from storms and sea-level rise; wetlands regulate
_____________________________________________________________________________
13
water quality – hence reducing the need for costly hard-infrastructure such as water treatment plants; in urban areas, the strategic placement and use of wetlands can significantly improve the management of urban water resources; constructed wetlands can provide very cost-effective means to deal with wastewater – enabling biological processes to break down and recycle pollutants before wastewater eventually re-enters systems enabling its continued use downstream. Approaches to infrastructure management need to consider the best that green or grey solutions offer. It is usually not a question of which is better, but how to manage both in harmony to achieve the most cost-efficient, effective and sustainable outcome. Some of the best examples of the use of wetlands as green infrastructure involve their deployment to improve the effectiveness of, and reduce risks to, grey (built) infrastructure. In these and other ways, wetlands become more relevant and important – hence promoting increased investment in their wise use.
Figure 2.4: Wetlands integrated as natural, or green, infrastructure solutions for water management across a landscape (from Cohen-Shachen et al. 2016).

_____________________________________________________________________________
14
2.8. Wetland Inventory Wetland inventory is defined by the Ramsar Secretariat as “the collection and/or collation of core information for wetland management, including the provision of an information base for specific assessment and monitoring activities.” An inventory is a key step in the delivery of the conservation and wise use of wetlands and hence ensuring their contribution to sustainable development of the LMB. The steps involve (as modified from Ramsar Secretariat, 2005):
▪ Establishing the location and ecological characteristics of wetlands and the overall ecosystem services delivered by wetlands and hence their importance to people, both locally and beyond the wetland (baseline inventory);
▪ Assessing the status, trends and threats to wetlands, their biodiversity and their benefits (assessment);
▪ Monitoring the status and trends, including the identification of reductions in existing threats and the appearance of new threats (monitoring); and
▪ Taking actions (both in situ and ex situ) to redress any such changes causing or likely to cause damaging change in ecological character and loss of wetland ecosystem services (management).
Essentially, wetland inventory is used to collect information to describe the character and benefits of wetlands and to provide the basis for guiding the development of appropriate assessment and monitoring measures. The Ramsar Secretariat (2005) notes that wetland inventory has multiple purposes. These include:
▪ listing particular types, or even all, wetlands in an area; ▪ listing wetlands of local, national and/or international importance; ▪ describing the occurrence and distribution of wetland taxa; ▪ describing the occurrence of natural resources such as peat, fish or water and other
ecosystem services delivered by the wetland; ▪ establishing a baselines for measuring change in the ecological character and benefits
of wetlands; ▪ assessing the extent and rate of wetland loss or degradation; ▪ promoting awareness of the value of wetlands; ▪ providing a tool for conservation planning and management; and ▪ developing networks of experts and cooperation for wetland conservation and
management. An inventory is thus one of a number of tools for assessing and updating the status and trend in wetland values in order to support planning and management of wetland resources. As it can be conducted at different levels and serve different planning and management purposes, the goals and objectives of each inventory must be clearly defined at the outset of the process.
_____________________________________________________________________________
15
2.9. Wetland Assessment Wetland inventory and wetland assessment, although related and sometimes conducted in parallel, are two different processes. According to the IUCN Integrated Wetland Assessment Toolkit (Springate-Baginski et al., 2009) wetland assessment is the process of determining and describing the status, characteristics, or worth (benefits) of a particular wetland. It involves measuring certain variables which are considered important in conservation and/or development terms, and can be taken as indicators of the health of the wetland itself, its attributes, functions, and workings, of the goods and services that it generates, and of the human and natural processes it supports. Wetland assessment does not normally take place in isolation, but is prompted by a particular management or policy issue that needs to be addressed, or a particular decision that needs to be made about the use of funds, land or other resources. The information generated by the assessment therefore aims to assist in understanding or dealing with this issue, or in making this decision. Although wetland assessment does not form a key part of this framework, inventories may include assessment components, and as such, it will be included in the step-by-step guide to wetland inventory provided in Section 6.
_____________________________________________________________________________
16
3. Summary of Wetlands in the Lower Mekong Basin The Mekong River, one of the world’s great river systems, flows for a length or around 4800 km, from the Tibetan Plateau to the South China Sea. It drains an area of about 795,000 km2, covering six countries: China, Myanmar, Thailand, Lao PDR, Cambodia and Viet Nam. The biodiversity and productivity of the Mekong River Basin is immense, driven by the systems flood pulse hydrology (Mather, 2009). The river, its tributaries and associated wetlands support a range of ecosystems and a wide array of species of conservation and economic significance as well as providing other ecosystem services that are needed to underpin socio-economic development. Approximately 1500 species of fish are found in the Mekong River, more than any other river in Asia (Mather, 2009). The biodiversity of the basin is fundamental to supporting the livelihoods and food security of some 60 million people in the lower Mekong countries (more than 90% of the basin’s population live in the LMB) (MRC, 2010; Mather, 2009). The Mekong supports the world’s most productive inland fisheries; around 3 million tons of fish valued at about US$3 billion are caught each year, providing up to 80% of the animal protein for the LMB population (Mather, 2009).
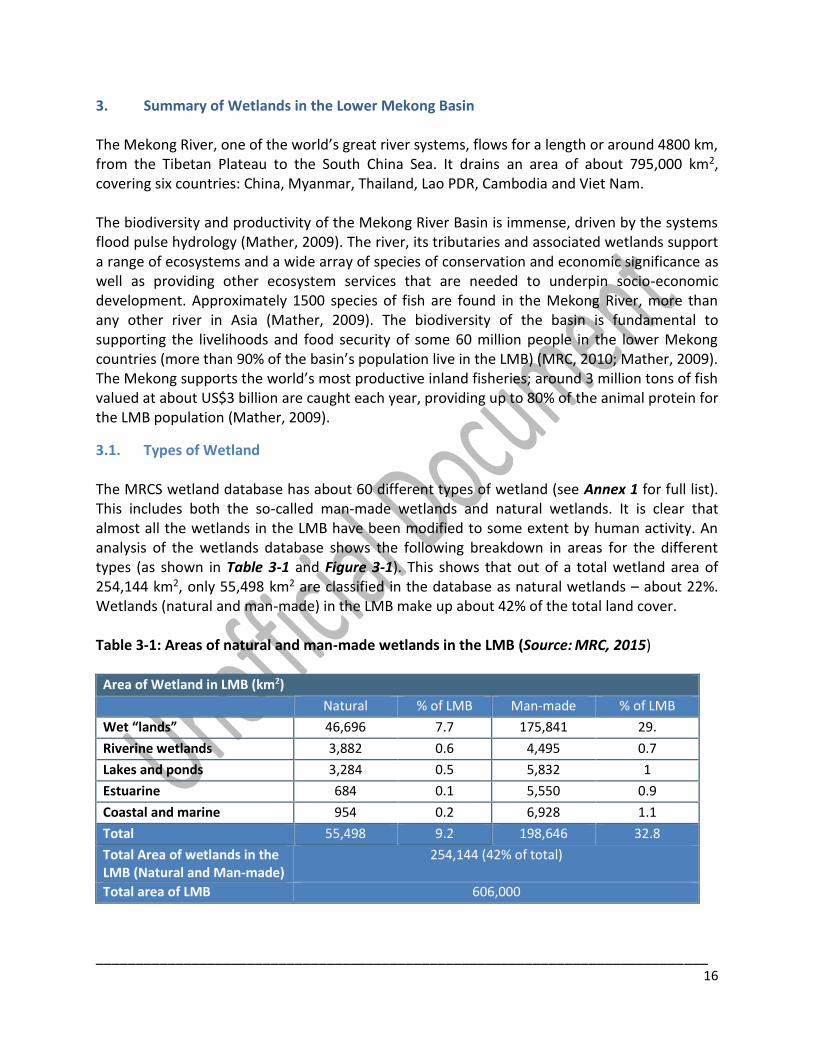
3.1. Types of Wetland The MRCS wetland database has about 60 different types of wetland (see Annex 1 for full list). This includes both the so-called man-made wetlands and natural wetlands. It is clear that almost all the wetlands in the LMB have been modified to some extent by human activity. An analysis of the wetlands database shows the following breakdown in areas for the different types (as shown in Table 3-1 and Figure 3-1). This shows that out of a total wetland area of 254,144 km2, only 55,498 km2 are classified in the database as natural wetlands – about 22%. Wetlands (natural and man-made) in the LMB make up about 42% of the total land cover. Table 3-1: Areas of natural and man-made wetlands in the LMB (Source: MRC, 2015)
Area of Wetland in LMB (km2) Natural % of LMB Man-made % of LMB
Wet “lands” 46,696 7.7 175,841 29.
Riverine wetlands 3,882 0.6 4,495 0.7
Lakes and ponds 3,284 0.5 5,832 1
Estuarine 684 0.1 5,550 0.9
Coastal and marine 954 0.2 6,928 1.1
Total 55,498 9.2 198,646 32.8
Total Area of wetlands in the LMB (Natural and Man-made)
254,144 (42% of total)
Total area of LMB 606,000

_____________________________________________________________________________
17
Figure 3-1: Pie chart of wetland areas in the LMB (Source: MRC, 2015)
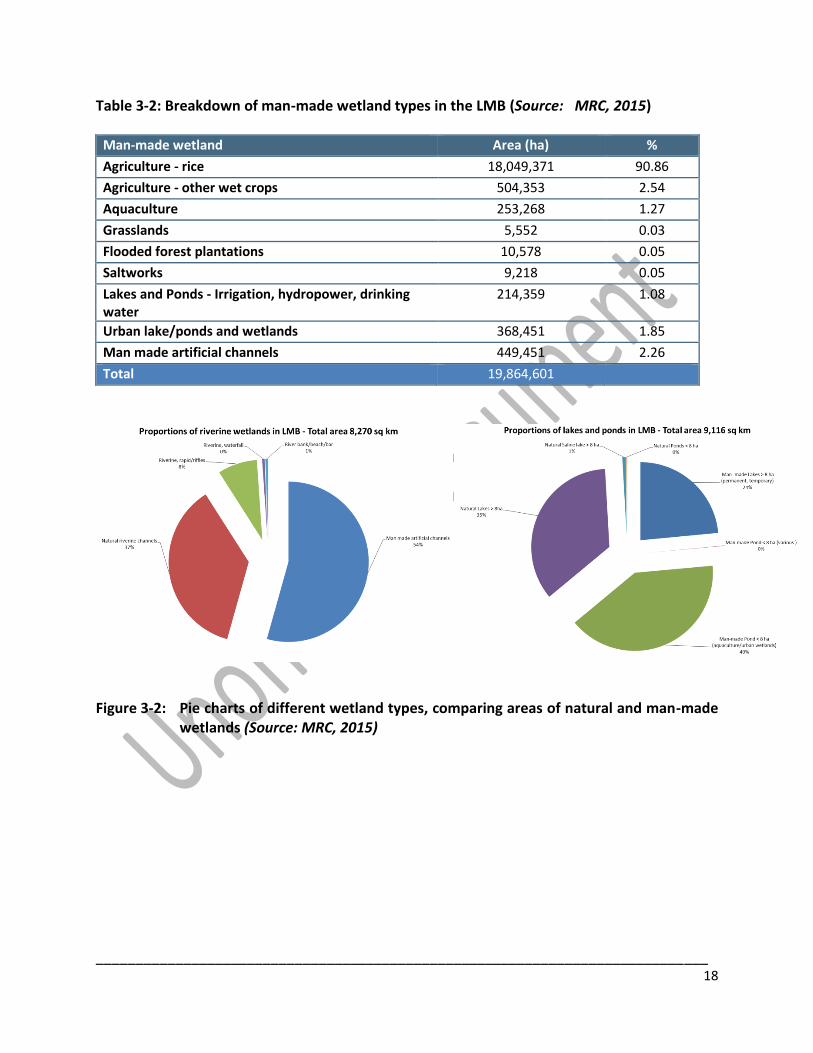
3.1.1 Man-made Wetlands of the LMB Table 3-2 and Figure 3-2 show an analysis of the different sorts of man-made wetlands. From this it is clear that rice paddy, recession agriculture and other wet agricultural crops make about 95% of the man-made wetlands in the LMB. Lakes and ponds including hydropower and irrigation reservoirs only make up 1.08%, although hydropower reservoirs have increased significantly in size and number since the database was compiled in 2006. Man-made artificial channels, e.g. canals and drainage ditches, make up about 2.3%
_____________________________________________________________________________
18
Table 3-2: Breakdown of man-made wetland types in the LMB (Source: MRC, 2015)
Man-made wetland Area (ha) %
Agriculture - rice 18,049,371 90.86
Agriculture - other wet crops 504,353 2.54
Aquaculture 253,268 1.27
Grasslands 5,552 0.03
Flooded forest plantations 10,578 0.05
Saltworks 9,218 0.05
Lakes and Ponds - Irrigation, hydropower, drinking water
214,359 1.08
Urban lake/ponds and wetlands 368,451 1.85
Man made artificial channels 449,451 2.26
Total 19,864,601
Figure 3-2: Pie charts of different wetland types, comparing areas of natural and man-made wetlands (Source: MRC, 2015)
_____________________________________________________________________________
19
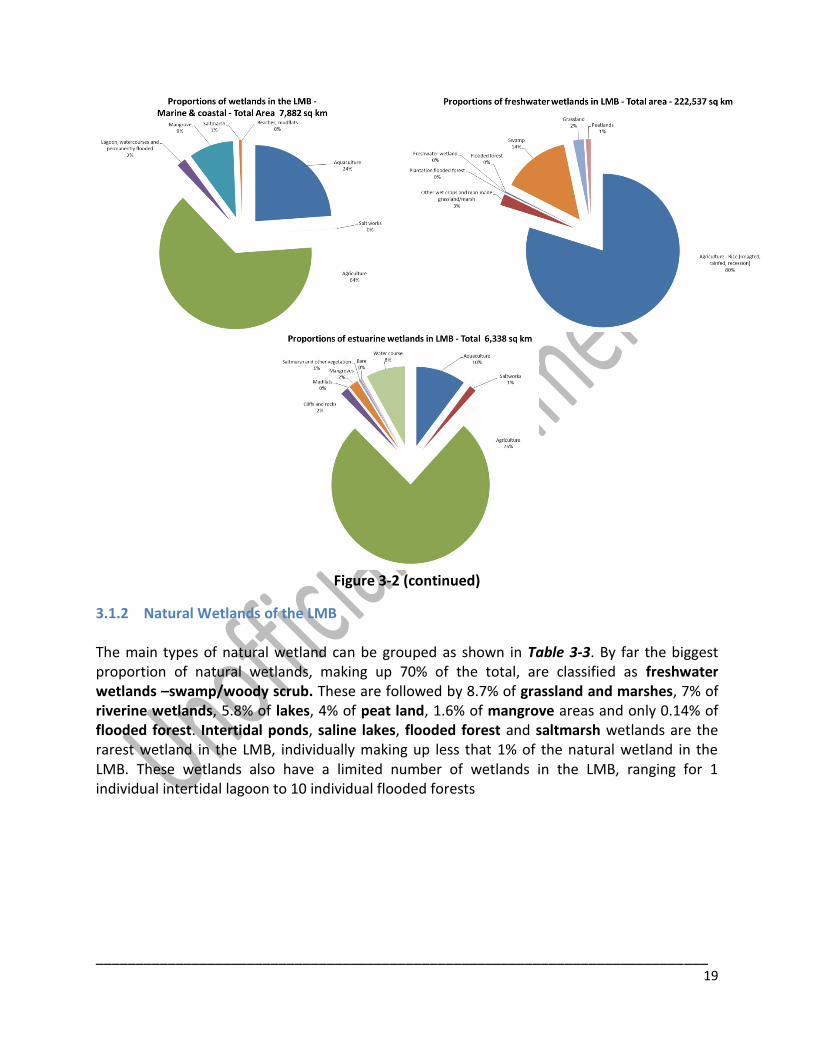
Figure 3-2 (continued)
3.1.2 Natural Wetlands of the LMB The main types of natural wetland can be grouped as shown in Table 3-3. By far the biggest proportion of natural wetlands, making up 70% of the total, are classified as freshwater wetlands –swamp/woody scrub. These are followed by 8.7% of grassland and marshes, 7% of riverine wetlands, 5.8% of lakes, 4% of peat land, 1.6% of mangrove areas and only 0.14% of flooded forest. Intertidal ponds, saline lakes, flooded forest and saltmarsh wetlands are the rarest wetland in the LMB, individually making up less that 1% of the natural wetland in the LMB. These wetlands also have a limited number of wetlands in the LMB, ranging for 1 individual intertidal lagoon to 10 individual flooded forests

_____________________________________________________________________________
20
Table 3-3: Areas and number of the main natural wetland types in the LMB (Source: MRC, 2015)
Wetlands Total (ha) %
Wet 'lands' 4688327 84
Flooded forest 7,570.3 0.14
Swamp/woody scrub 3,966,671.0 71.21
Grassland and Marsh 486,062.2 8.73
Peat Swamp 228,023.2 4.09
Open Water 330,946.5 5.9
Lakes >8ha 322,764.8 5.79
Ponds <8ha 1,536.0 0.03
Saline lakes >8ha 6,645.7 0.12
Flowing Water 391,008.0 7.0
Riverine and Streams 391,008.0 7.02
Estuarine, Coastal & Marine 160,289.3 2.9
Watercourse 64,202.0 1.15
Intertidal lagoon 335.4 0.01
Saltmarsh 7,992.4 0.14
Non-vegetated, bare, sand 3,502.3 0.06
Mangrove 84,257.2 1.51
Total 5,570,570.5 100.00
Though classified as natural, the majority of remaining natural wetlands in the LMB will have experienced some level of human modification or are under some form of use. For the purposes of the analysis in this study, the different types of wetland have been arranged into four major groupings. These include:
1. Wet “lands”, which include flooded forest, swamp/woody scrub, grasslands and marshes and peat swamps.1
2. Open water, which includes lakes >8ha, ponds <8 ha and saline lakes >8ha 3. Flowing water, which includes the rivers and streams, the Mekong mainstream and the
tributaries 4. Estuarine, coastal and marine, which include watercourses, intertidal lagoons,
saltmarsh, non-vegetated (mudflats, beaches etc.) and mangroves
1 The term wet “lands” has been used in this study to cover all the freshwater wetlands that is more land- than water-based, and more exposed to temporary flooding. This includes the flooded forests, swamp/woody scrub, grasslands/marshes, and peat swamps. The main difference between swamps and marshes is the presence/absence of woody vegetation – marshes tend not to have woody vegetation and are dominated by grasses and reeds.

_____________________________________________________________________________
21
Figure 3-3 shows the distribution of natural wetland types in the LMB.
Figure 3-3: The distribution of natural wetland types in the LMB (Source: MRC, 2015)

_____________________________________________________________________________
22
3.2. Permanent and Seasonal Wetlands The MRC wetland database differentiates between permanent wetlands and seasonal wetlands based on the year-round presence of surface water. For this study these have not been separated out, however, a brief analysis of the areas of permanent and seasonal natural wetlands for each wetland type illustrates the dynamic character of wetlands throughout the year (as shown in Table 3-4). Table 3-4: Proportions of temporary and permanent natural wetlands in the LMB
(Source: MRC, 2015)
Wetland group Wetland type Ha %
Temp 17,034 85.0
Perm 3,008 15.0
Total 20,042
Temp 3,946,569 98.5
Perm 60,112 1.5
Total 4,006,681
Temp 336,846 67.2
Perm 164,441 32.8
Total 501,287
Temp - 0.0
Perm 226,069 100.0
Total 226,069
Temp 5,983 1.8
Perm 323,581 98.2
Total 329,564
Temp 4,841 1.2
Perm 385,825 98.8
Total 390,666
Temp 999,469 69.8
Perm 432,047 30.2
Total 1,431,516
Non-vegetated 354,610 24.8
Salt marsh 6,875 0.5
Mangrove 977,169 68.3
Intertidal lagoon 1,535 0.1
Watercourse 91,327 6.4
Wet "lands"
Open water
Flowing water
Estuarine, coastal and
marine
Flooded forest
Swamp, woody scrub
Grassland/marsh
Peat swamp
Open water
Rivers and streams
Estuarine, coastal and marine

_____________________________________________________________________________
23
More than 98% of open water and flowing water wetlands are permanent. However, the wet “lands” vary significantly, Peat swamps are almost exclusively permanent, while the majority of flooded forests (85%), swamp/woody scrub (98.5%) and some 67% of grasslands and marsh would be seasonally flooded. Further breakdown of the grassland/marsh category would reveal that the majority of the permanently flooded wetlands under this category are marshes, while the grasslands would constitute the majority of the temporarily flooded areas of the category. Nearly 70% of the estuarine, coastal and marine wetlands are temporarily flooded, whilst 30% are permanently flooded. This can be explained mainly by the tidal nature of these wetlands. All of the mangroves would be temporarily flooded by the tide, and a smaller part of the non-vegetated mudflats and watercourses would remain underwater.
3.3. The Most Important Wetlands in the LMB
In 2003, the MRC commissioned a series of country studies through the National Mekong Committees to review the wetland and aquatic ecosystems in the LMB. These studies identified a number of important wetland sites in each country. These important wetland sites have been used to identify the case study sites for the assessment of vulnerability of wetlands to climate change. At the end of the study a brief assessment of the potential vulnerability of each of these 97 wetland sites will be undertaken based upon the findings of the case studies. The important wetland sites are shown in Figure 3-4. When considering all these important wetland sites, it is clear that wetlands rarely consist of one wetland type, but there may be a mosaic of several different wetland types in one site.

_____________________________________________________________________________
24
Figure 3-4: Important wetland sites in the LMB (Source: MRC, 2015)

_____________________________________________________________________________
25
3.3.1 Cambodia In Cambodia, the 2003 CNMC study identified seven important wetland types and estimated the areas of each as shown in Table 3-5. They also identified 24 wetland sites as shown in Table 3-6 and these are shown on the map in Figure 3-5. Table 3-5: Wetland areas in Cambodia (Source: Vathana 2003)
Wetland Type Area, ha % of Area of
Cambodia
Flooded evergreen forest 361,700 7.2
Flooded forest, fallow land 157,200 3.2
Swampy vegetation 379,100 7.6
Grassland susceptible to flooding 822,900 16.5
Paddy fields (rainfed) 2,686,300 53.9
Receding rice fields 29,300 0.6
Mangrove 61,400 1.2
Open water areas, lakes, etc. 487,600 9.8
Total 4,985,500 100
Total area of Cambodia 18,103,500 27.5

_____________________________________________________________________________
26
Table 3-6: Important wetland sites in Cambodia (Source: Vathana 2003)
No. Wetland Site Location Area (ha)
Mar
sh
Riv
er/
Cre
ek
Lake
Flo
od
ed
Fo
rest
Ric
e F
ield
Lotu
s Fi
eld
Stre
am
1Stung Treng Mekong River
Flooded Forest
Stung Treng Provincial
Town
13o 11' 50" -
13o 56' 00" N
105o 52' 00" -
106o 03' 50" E
48,000 X X X
2 Tonle Sekong River System Stung Treng 13o 31' 00" -
14o 28' 00" N
105o 57' 30" -
106o 26' 00" E
34,750 X X
3 Tonle Sesan River System35 km from Ratanakiri
Provincial Town
13o 32' 00" -
14o 06' 00" N
105o 58' 00" -
107o 27' 50" E146,250 X
4 Tonle Sre Pork River System
30 km from Ratanakiri
Provincial Town in the
South
13o 01' 15" -
13o 33' 20" N
106o 17' 30" -
107o 30' 00" E157,500 X X X X
5 Kratie River System Kratie12
o 08' 35" -
13o 12' 00" N
105o 28' 50" -
106o 09' 00" E142,250 X X X
6Peam Chileang Mekong
River System
10 km from Kampong
Cham Provincial Town in
the N-E
12o 00' 00" -
12o 18' 30" N
105o 28' 50" -
105o 52' 00" E63,750 X X X
7Siem Bok Mekong River
SystemKampong Cham
11o 50' 10" -
12o 00' 00" N
105o 02' 00" -
105o 29' 00" E
8 Boeung Veal Sam Nap10 km in the North-East
of Phnom Penh
11o 33' 17" -
11o 38' 25" N
105o 00' 15" -
105o 06' 00" E10,850 X X X
9 Boeung Prang11 km in the North-East
of Phnom Penh
11o 32' 00" -
11o 45' 25" N
105o 07' 00" -
105o 15' 00" E12,600 X X X X
10 Boeung Pring
Prey Veng Province
about 30 km from Neak
Loeung
11o 22' 15" -
11o 29' 27" N
105o 23' 00" -
105o 26' 15" E16,000 X X X
11 Boeung Khsach Sor Prey Veng 11o 23' 00" -
11o 22' 15" N
105o 19' 17" -
105o 23' 28" EX X X
12Upper Stung Sen Creek
System
55 km in the South-West
of Preah Vihea Province
13o 48' 00" -
14o 13' 00" N
104o 32' 20" -
104o 58' 30" E80,000 X X X
13 Prek Toal Battambang12o 59' 00" -
13o 20' 30" N
103o 26' 30" -
103o 43' 25" EX X X X
14 Moat Peam
15 km in the South of
Siem Reap Provincial
Town
13o 03' 00" -
13o 19' 00" N
103o 43' 00" -
104o 12' 00" E45,000 X X X X
15 Stung Daun Try
60 km from Pursat
Provincial Town in the
North-East
12o 44' 00" -
13o 00' 00" N
103o 37' 00" -
103o 53' 00" E103,000 X X X X X
16 Pursat Great Lake System25 km in the North of
Pursat Provincial Town
12o 28' 00" -
12o 51' 00" N
103o 52' 30" -
104o 23' 35" E55,000 X X X X
17 Moat Khla Siem Reap12o 44' 15" -
13o 04' 00" N
103o 08' 00" -
104o 15' 00" E45,000 X X X X
18 Boeung Chhmar Kampong Thom12o 44' 25" -
12o 55' 20" N
104o 15' 10" -
104o 22' 00" E33,000 X X X X X
19 Lower Stung Sen15 km in the West of
Kampong Thom Town
12o 31' 50" -
12o 49' 00" N
104o 27' 40" -
104o 47' 00" E61,200 X X X X X
20 Boeung Veal Pork10 km from Kampong
Chhnang Provincial Town
12o 17' 00" -
12o 32' 00" N
104o 02' 00" -
104o 45' 00" E56,500 X X X X X
21 Boeung Thom
About 5 km in the last of
Kampong Chhnang
Provincial Town
12o 09' 00" -
12o 31' 10" N
104o 42' 00" -
104o 59' 00" E72,500 X X X X X
22 Boeung Sam Rong Kandal11o 39' 10" -
11o 42' 00" N
104o 46' 20" -
104o 48' 10" EX X X X X
23 Boeung Ta Mouk Kandal11
o 37' 00" -
11o 40' 00" N
104o 46' 25" -
104o 48' 20" EX X X X X
24 Prasat Tuyav Lake
South-East of Phnom
Penh about 57 km
(Kandal Province)
11o 07' 00" -
11o 12' 20" N
105o 05' 27" -
105o 10' 00" E
72,000 X X X X X
Coordinates

_____________________________________________________________________________
27
Figure 3-5: Important wetland sites in Cambodia (Source: MRC, 2015)

_____________________________________________________________________________
28
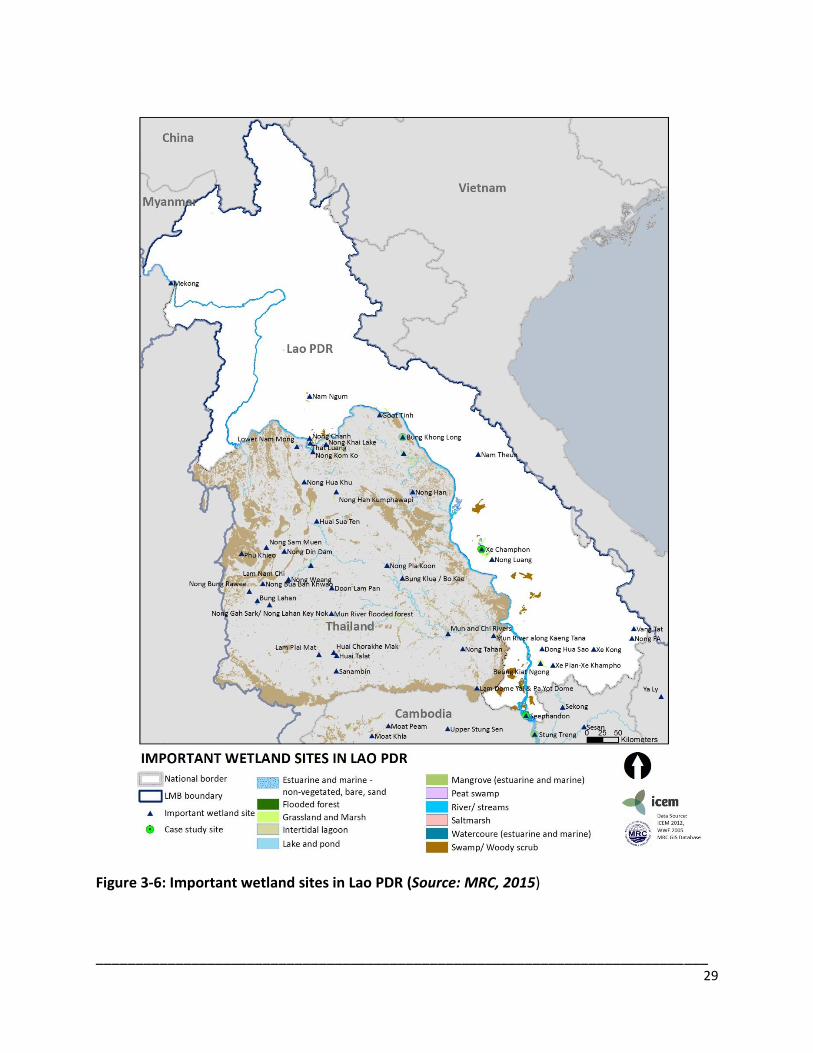
3.3.2 Lao PDR The review of wetlands in Lao PDR drew upon the 30 wetland sites of about 968,180 ha in the central and southern parts of Lao PDR that had been identified by Claridge in 1996. Out of these 13 sites were identified to be of national or regional importance. Two of the sites have recently been designated as Ramsar sites. No analysis of the area extent of wetlands in the country was provided, but the five most important types of wetlands were prioritized:
• Permanent and seasonal flooded forest (Swamp)
• Large pools in rivers
• Perennial rivers
• Permanent dam/reservoir
• Rice fields Table 3-7 and Figure 3-6 show the important wetland sites in Lao PDR Table 3-7: Important wetland sites in Lao PDR (Source: Phittayaphone, 2003; MRC, 2015)
Areas
ha
1 Nam Ngum ReservoirVientiane & Vientiane
Prefecture18°12’N -102°48’E 25,000 x x x x x x
2 That Luang Swamp Vientiane Prefecture 17º56’N- 102º39’ E 2,000 x x x x
3 Nong Chanh Vientiane Prefecture 17º56’N-02º37’30” E 2,300 x x x
4 Nam Theun Khammuane 17º45’N -105º10’ E 5,000 x x x x
5 Nongluang Wetland Group Savannakhet 16º15’N -105º22’ E x x x x x
6 Xe Champhon Savannakhet16º 35’N - 16º18’N/
105º12’E -105º18’E 24,000 x x x x x x x x x x x
7 Dong Hua Sao Champasack 14º58’N -106º06’ E 30,000 x x x x x
8Bung Nong Ngom Wetland
GroupChampasack 14º46’N-06º3’30”E 800 x x x x x
9 Seephandon Wetland Champasack14º 56’N- 14º40’N/
105º59’E-106º 06’E 6,000 x x x x x
10 Xe Kong Plain Champasack, Attapeu14º 27’N - 14º 39’E/
106º17’N-106º29’E 35,000 x x x
11 Xe pian-Xe hampho Attapeu 14º 44’N-106º 24’E 2,000 x x x
12 Nong FA Attapeu 15º6’30” N-107º25’20”E 100 x
13 Vang Tat Wetland Sekong-Attapeu 15º2’30” N-107º28’E 100 x x x
14 Nong Kham Sean Sithanua, Vientiane 15 x x
15 Nong Veng Sithanua, Vientiane 30 x x
16 Limestone lake Hinboun, Khammouane 1 x
Flo
od
ed f
ore
st
Larg
e p
oo
ls in
rive
r
Per
ren
nia
l riv
er
Seas
on
al r
iver
Ric
e fi
eld
s
Riv
erin
e
flo
od
pla
in
Per
man
ent
lake
s
Dam
/res
ervo
ir
Per
man
et p
on
ds
Pas
ture
/gra
ss
Mar
sh/S
wam
p
No Wetland Location/ Province Geographic coordinate
_____________________________________________________________________________
29
Figure 3-6: Important wetland sites in Lao PDR (Source: MRC, 2015)

_____________________________________________________________________________
30
3.3.3 Thailand The Thailand review identified 39 important wetland sites listed in Table 3-8 and shown in Figure 3-7. An analysis of the areas of wetland types within 50 km of the Mekong mainstream in Thailand is shown in Table 3-9 and the areas of wetland types within north-eastern Thailand in Table 3-10. Table 3-8: Important wetland sites in Thailand (Source: MRC, 2015)
Names of Sites Province(s)Geographic
coordinates
Areas /
Length
Floo
dpla
ins
Riv
ers
and
stre
ams
Riv
er p
ools
Rap
ids
Lake
s
Pond
s
Mar
shes
Gra
ssla
nd
Ric
efie
lds
Floo
ded
fore
sts
Res
ervo
ir
1
Chiang Saen Basin including
Nong Bong Khai Wildlife Non-
Hunting Area
Chiang Rai20.24549 N /
100.05019 E6,240 ha x x x x x
2 Nong Luang Chiang Rai19.84459 N /
99.94636 E1,471 ha x x x x
3 Nong Hang Chiang Rai19.49296 N /
99.79610 E279 ha x
4 Nong Leng Sai Phayao19.35629 N /
99.82786 E960 ha x
5 Kwan Phayao Phayao19.16333 N /
99.90584 E2,053 ha x x
6 Kok River Chiang Rai, Chiang Mai19’ 30” – 20’ 12” N, 99’
10” – 100’ 08” E290 km x x
7Bung Khong Long Wildlife Non-
Hunting AreaNong Khai
17.96158 N /
104.03189 E1,290 ha x x
8 Lower Nam Mong Basin Nong Khai17’ 48-57” N, 102’ 31-
38” E240 ha x x x x x
9Nong Hua Khu Wildlife Non-
Hunting AreaUdorn Thani
17’ 35” N, 102’ 37” E
(17.58821 N /
102.59868 E)
11 ha x
10 Nong Han Kumphawapi Udorn Thani17.11328 N /
103.02025 E4,500 ha x x x
11 Nong Han Sakhon Nakhon17.26017 N /
104.15562 E12,520 ha x x
12Nong Waeng Wildlife Non-
Hunting AreaChaiyaphum
15’ 55-56” N, 102’ 16-
17” E20 ha x
13 Bung Lahan Chaiyaphum15.599063 N /
101.894060 E2,909 ha x x
14 Mun River and flooded forestsMaha Sarakham, Buriram, Surin,
Sisaket
15’ 28” N, 103’ 00” E –
15’ 08” N, 104’ 25” E60,400 ha x x x x x x
15Mun River alongside Kaeng
Tana National ParkUbon Ratchathani 15’ 18” N, 105’ 29” E 8,000 ha x x x
16 Lam Nam Chi Chaiyaphum15’54” N, 102’ 20” E –
15’59”N, 102’ 24” E1,000 ha x x x x
17Confluence of the Mun and Chi
RiversSisaket, Ubon Ratchathani
15’ 10-15” N, 104’ 35-
50” E 9,750 ha x x x x x x
18 Lam Plai Mat Buriram14’ 47-50” N, 102’ 52-
58” E1,900 ha x x x x x x
19Huai Chorakhe Mak Reservoir
Wildlife Non-Hunting AreaBuriram
14.90878 N /
103.05183 E620 ha x
20Huai Talat Reservoir Wildlife
Non-Hunting AreaBuriram
14’ 51-53” N, 103’ 03-
06” E709 ha x
21Sanambin Reservoir Wildlife
Non-Hunting AreaBuriram
14’ 38-39” N, 103’ 04-
06” E571 ha x x x x
22
Lam Dome Yai and wetlands of
Pa Yot Dome Wildlife
Sanctuary
Ubon Ratchathani14’ 13-30” N, 104' 59" -
105’ 07” E
30 km;
22,540 hax x x x
23 Goot Ting Reservoir Nong Khai18.29675 N /
103.66212 E2,200 ha x
24 Nong Kom Ko Nong Khai17.82969 N /
102.72790 E944 ha x x
25 Nong Din Dam Chaiyaphum 16’ 24” N, 102’ 07” E 22 ha x x
26 Nong Bua Ban Khwao Chaiyaphum 15’ 46” N, 101’ 55” E 12 ha x
27 Nong Tahan Ubon Ratchathani 14’ 58” N, 104’ 56” E 11 ha x
28 Nong Khai Lake Nong Khai 17’ 52” N, 102’ 48” E 400 ha x
29Nong Gah Sark/Nong Lahan
Key NokChaiyaphum 15’ 36” N, 102’ 03” E 235 ha x
30 Nong Bung Rawee Chaiyaphum 15’ 46” N, 101’ 47” E 250 ha x x
31Wetlands of Phu Khieo Wildlife
SanctuaryChaiyaphum
16’ 05-35” N, 101’ 21-
55” E
156,000
hax x x
32 Mekong River Chiang Rai, Loei, 20’ 00-10” N, 100’ 15-
30” E
> 2,400
kmx x x
32 Mekong River
Nong Khai, Nakhon Phanom,
Mukdahan, Amnaj Charoen, Ubon
Ratchathani
20’ 00-10” N, 100’ 15-
30” E
> 2,400
kmx x x
33Songkhram River and its
floodplains
Udorn Thani, Sakhon Nakhon,
Nong Khai, Nakhon Phanom
17.63888 N /
104.24416 E
1,300,100
hax x x
34Doon Lam Pan Wildlife Non-
Hunting AreaMaha Sarakham
15’ 46-47” N, 103’ 01-
02” E50 ha x x
35 Nong Pla Koon Roi Et 16’ 02” N, 104’ 02” E 80 ha x x
36 Bung Klua / Bo Kae Roi Et16.018181 N /
104.020068 E75 ha x
37 Nong Sam Muen Chaiyaphum16’ 23-25” N, 102’ 00-
07” E560 ha x x
38 Kaeng La Wa Khon Kaen16’ 05-11” N, 102’ 40-
43” E1,120 ha x x
39 Huai Sua Ten Khon Kaen16’ 45-48” N, 102’ 45-
48” E1,040 ha x x x

_____________________________________________________________________________
31
Table 3-9: Wetland types and areas within 50 km of the Mekong River in Thailand (Source: Choowaew 2003)
Table 3-10: Types, number and areas of wetlands in north-eastern Thailand (Source:
Choowaew 2003)
Hectares %
FRR1c Riverine : Permanent rivers & streams with perennial rapids 81,794.08 1.83
FRB Riverine : Banks, beaches and bars 1,900.45 0.04
FRF1mnRiverine floodplain : Floodplains wet rice, including rainfed &
irrigated rice770,593.30 17.28
FRF2Riverine floodplain : Seasonally flooded trees, shrubs & grass in
river flats or flooded river basins55,774.18 1.25
FRF5 Riverine floodplain : Seasonal backswamps & marshes 14,891.90 0.33
FLL1 Lacustrine : Permanent freshwater lakes 18,522.17 0.42
FLL1m Lacustrine : Permanent dams & reservoirs 32,025.92 0.72
FLL2 Lacustrine : Seasonal freshwater lakes, including floodplain lakes 9,650.79 0.21
985,152.79 22.08
Uc Non-wetlands 3,475,583.40 77.92
4,460,736.19 100
Codes Wetland typesArea
Total wetland area
Total
Codes Wetland typeNumber
of sites
Area
(sqkm)
FRR, FRF Riverine : rivers, streams, floodplains 8,053 1,091.54
FLL, FLP Lacustrine : lakes, ponds, reservoirs 6,168 836
FPP, FPS Palustrine : marshes, swamps 368 49.79
FRR1c, FRR1d,
FRR2c, FRR2d, FRBOthers 161 21.8
Total 14,750 1.999.13

_____________________________________________________________________________
32
Figure 3-7: Important wetland sites in Thailand (Source: MRC, 2015)

_____________________________________________________________________________
33
3.3.4 Viet Nam In the wetland review of 2003, Viet Nam identified 10 important wetlands in the Mekong delta. In 2005, the Viet Nam Environment Protection Agency (2005) prepared a paper on the status of Vietnam wetlands which identified a total of 68 important wetland sites throughout the country, including the 10 wetlands in the Delta and a further 7 wetlands in the Central Highlands, which also fall within the Lower Mekong Basin. These are shown in Table 3-11 and Figure 3-8. Viet Nam thus has coastal and floodplain wetlands and upland lake systems. The upland lakes include both natural crater lakes such as Bien Ho Lake and Lak Lake, and the reservoirs created for hydropower and irrigation, such as Yaly. The small lakes of Ea Ral and Trap K Sor also contain the Critically Endangered Swamp cypress, Glyptostrobus pensilis. Nam Ka Lake and Lak Lake in a conservation area is also reported to contain crocodiles. Table 3-11: Important wetlands in the Mekong delta and Central Highlands (Source: Duc et
al. 2003 for Delta, and VEPA 2005 for Central Highlands)
No Wetland siteLocation/
ProvinceCoordinates Area (ha)
Me
lale
uca
fo
rest
Pe
at la
nd
Swam
p
Lotu
s sw
amp
Gra
ssla
nd
Ric
e f
ield
Op
en
wat
er
Nat
ura
l lak
e
Re
serv
oir
Wat
erw
ays
Inla
nd
we
tlan
ds
Estu
ary
we
tlan
ds
Sub
-tid
al a
nd
co
asta
l
we
tlan
ds
Man
gro
ve
Mu
dfl
at
San
dy
be
ach
Shri
mp
po
nd
s
1 U Minh Thuong Kien Giang 9o 31’- 9o 39’N 105o 03’ - 105o 07’E 8154 x x x x x x
2 Tram Chim Dong Thap 10o40’-10o47’N 105o26’-105o36’ 7588 x x x x
3 Lang Sen Long An 10o44’-10o48’N 105o4 – 105o48’E 3280 x x x x x
4 Thanh Phu Ben Tre Estuaries of Mekong River 4800 x x x x x x
5 Tra Su An Giang 10o33’-10o36’N 105o02’-105o04’E 860 x x x
6 Lam truong Tinh Doi An Giang 10o18’-10o23’N 105o02’-105o05’E 2053 x x x
7 Ha Tien grass plain Kien Giang10o20’-10o29’N 104o32’-104o39’E). Kien
Luong district (10o09’-10o17’N 104o34’-16,000 x x x
8 Lung Ngoc Hoang Can Tho 9o 41’ - 9o 45’ N 105o 39’- 105o 43’ E 2800 x x x
9 Vo Doi Ca Mau 9o 11’ – 9o 18’ N 104o 52’ - 104o 59’ E 3724 x x x x x
10 Mui Ca Mau Ca Mau 8o 38’ – 8o 47’ N 104o 45’ - 104o 54’ E ` 24,000 x x x x
11 Yaly Lake Kon Tum14o12’ – 15o 15’ N 107o 28’ - 108o 23’
E6,450 x x
12 Bien Ho Lake Gia Lai 14o05’ N 108o E 300 x x
13 Ayun Ha Lake Gia Lai 13o25’ N 108o 22' E 700 x x
14 Nam Ka Lake Dak Lak 12o25’ N 108o 06' E 1,240 x x x
15 Lak Lake Dak Lak12o21’ – 12o 25’ N, 108o 08’ - 108o 18’
E500 x x
16 Ea Ral Lake Dak Lak 13o21’ N 108o 14' E 102 x x x
17 Trap K Sor Lake Dak Lak 13o06’52" N 108o 17'21" E 96 x x x
18 Lo Go Xa Mat Dong Nam Bo 11°24′30″N 106°00′30″E x x

_____________________________________________________________________________
34
Figure 3-8: Important wetland sites in the Mekong Delta, Viet Nam (Source: MRC, 2015)

_____________________________________________________________________________
35
4. Previous wetland inventories and results in the LMB countries The most recent effort to gather comprehensive information on the wetlands of the LMB was conducted by the MRC in cooperation with Thailand, Lao PDR, Cambodia and Vietnam in 2002-2003. This led to the identification of 87 important wetland sites across the four countries, prioritisation of what they considered to be their key wetland types, and the collection of more detailed information for a number of priority sites in each country. The countries involved also attempted to apply the MRC Wetland Classification system during this process. The studies also focused on Mekong wetlands, i.e. those occurring within the Mekong Basin. Thailand identified 12 main wetland types and at least 42,653 wetland sites covering about 7.5% of the country’s land area. These were divided into three levels of importance: international, national and local (Choowaew, 2003). Vietnam focused on the Mekong Delta, identified five important wetland types, and presenting more detailed information for 10 sites (Thinh, 2003). The Lao PDR study also identified 5 important types and lists 13 important sites (based on the MRC classification) (Phittayaphone, 2003). Cambodia identified 29 important sites from a 1999 project, along with another three regionally significant sites and three Ramsar sites (Vathana, 2003). Although these inventories provided an important picture of the main types and distribution of wetlands in the LMB, limitations in the availability of information and the methodologies used means that the baseline information for LMB wetlands still needs improvement. All four countries in 2002-2003 used a broadly similar methodology of gathering and reviewing existing data, prioritising types and sites with stakeholders and experts, and holding a national stakeholder workshop. However, each study uses slightly different wetland classifications, map scales, time periods, indicators and information sources. For example, each country approached the provision of detailed information on key sites in different ways, presenting previous work, Ramsar Information Sheets, field work, and so on, resulting in different products for each study.
5. Downscaling: applying an inventory methodology in the LMB countries As noted above, the underlying problems from previous inventory and wetland classification efforts in the LMB countries have been a lack of coordination between countries and a lack of a standardized method and approach. This has led to difficulties in integrating and comparing data to develop a comprehensive picture of the state of wetlands across the region. This conceptual framework for an updated inventory process therefore will use a more detailed methodology, including data sheet for specific wetland sites, in order to obtain more comparable data across the LMB countries. For example, to downscale the methodology:
• It recommends that similar multi-disciplinary teams be formed in each country and at the local level;

_____________________________________________________________________________
36
• It recommends a standard 14 steps to be applied in all countries;
• All countries are to use the MRC wetland classification system provided in this methodology;
• It includes detailed parameters and data requirements in the attached wetland site data sheet (as shown in Annex 3); this sets out minimum requirements for mapping scales, key indicators, ecosystem services examination, etc.
Recognizing that differences do exist between the LMB countries and how they govern and understand wetlands, the methodology does build in some flexibility. For example, it provides a range of options for data collection and indicators, where possible, so that different approaches may be used to obtain similar levels of information.
6. Conceptual Framework for Updated Methodology and Tool of Wetland Inventory (WI) This section provides:
• Guiding principles and the approach to this framework; and
• A step-by-step guide to conducting a wetland inventory
6.1. Guiding Principles The updated methodology and tool is based on two key principles:
▪ The importance of identifying and describing wetland values; an understanding and record of the core values of wetlands is considered vital to making informed decisions regarding conservation and development where wetlands are concerned; and
▪ The benefit of using an integrated approach; this enables the inventory process to bring together key actors and sources of information on wetlands, from the various sectors that influence them or are involved in their management.
6.2. An Integrated Approach This conceptual framework is based on the principle that for a wetland inventory to be useful to real-world wetland management planning and decision-making, it must adopt an integrated approach: one which brings together biodiversity, economics and livelihood elements, as well as key stakeholders from the range of sectors involved in wetland management. Ideally a wetland inventory will be conducted in an integrated manner from its very conceptualization and design right through to the presentation of results to decision-makers. A fully integrated approach has a number of benefits:
▪ Exchange of ideas between key people involved in wetlands management takes place at all stages, from defining objectives, through to carrying out fieldwork, to data analysis and presentation;

_____________________________________________________________________________
37
▪ Subsequent decisions are based on more comprehensive information, covering environmental, economic and management features of the wetlands involved; and
▪ Cooperation and information-sharing between different organizations and actors is encouraged.
6.3. Key Steps in the Wetland Inventory Process
Step 1: Form a multidisciplinary team Form a multi-disciplinary team and allocate roles and responsibilities. An existing multi-sector organization, such as a national Ramsar Committee, may be utilized, or a new working group formed. Ideally, the team will include representatives from the key agencies and stakeholders involved in decision-making and management of wetlands. In addition to ensuring access to the range of information and actors involved in governing wetlands, this approach also promotes cross-sectoral cooperation, which may carry further than the inventory process.
Step 2: Identify purpose and objectives Working together, the team should next identify and state the reasons for undertaking the inventory: Why is the information required? What will the information be used for? The objectives of the inventory will help to determine its scope and scale, as well as a minimum required data set. This process should involve as many national, regional and local stakeholders as possible; ideally, hold a stakeholder consultation to identify the purpose and objectives of the inventory, or if not possible, contact stakeholders widely for their comments and suggestions.
Step 3: Review existing knowledge Assign team members (or potentially an external party or consultant) to review the available information, including published and unpublished literature, maps and methodologies, on the wetlands and areas in question. Identify any gaps in information that will affect the inventory. The team should also develop a clear picture of the institutional and legal framework for wetland management and review available methodologies. If possible, seek expert technical advice to: a) choose the methods that can supply the required information; and b) ensure that suitable data collection and management processes are established.
Step 4: Determine the scale and scope of the inventory Determine the scale, scope and resolution required to achieve the purpose and objectives of the inventory, as defined in Step 1. For example, which geographic areas will need to be covered? What level of detail will be required in the data collected? What will constitute a wetland site for the purposes of the inventory?

_____________________________________________________________________________
38
Step 5: Establish parameters and core data set Identify the parameters, or core data set, sufficient to describe the wetlands for the inventory. What data must be gathered? What level of data will be needed to sufficiently describe location and size of the wetlands and any special features? This can be complemented by additional information on factors affecting the ecological character of the wetlands and other management issues, if required. A summary of the recommended parameters for a wetland inventory according to this conceptual framework are provided in Table 6-1 below. A full list of data for collection is provided in the Wetland Inventory Data Collection Form (Annex 3). Table 6-1: Core data fields for biophysical and management features of wetlands2
Biophysical Features
Site name - Official site name - Official name of catchment area
Area and boundary - Size of the site (in hectares) - Description of the boundary
Location - Map coordinates - Map centroid - Elevation - Description of location, including administrative
location (e.g. district) and distance from nearest town/city, protected area, etc
Geomorphic setting - Biogeographical region - Where it occurs in the landscape - Linkage to other aquatic habitat, waterways
General description - Shape - Cross-section / plan view - Wetland type (using Ramsar Classification) - Main habitat types, ecological features - Permanent/seasonal features
Climate - Climatic zone - Seasons - Average temperature
2 These parameters for wetland inventory are based on those set out in the Ramsar Strategic Framework and Guidelines (2012), the latest
Ramsar Information Sheet (2012, http://www.ramsar.org/sites/default/files/documents/pdf/cop11/res/cop11-res08-e-anx1.pdf) and those used in Claridge’s inventory of Lao wetlands (1996).

_____________________________________________________________________________
39
- Average rainfall
Soil - Soil structure - Soil colour
Water regime - Periodicity - Extent & depth of flooding - Source of surface water - Links with groundwater
Water chemistry - Water salinity - Water pH - Colour - Transparency - Nutrients
Biota - Vegetation zones and structure - Animal populations and distribution, including fish - Special features, including any endangered species
Management Features Land and water-related resource use
- Local land and water use - Land and water use in the river basin/coastal zone - Any other economic uses of the wetland, or
significant economic activities around the wetland (eg mining, plantations, etc)
Social and cultural significance
- Social and cultural uses of the wetland - Social and cultural management practices
Pressures, disturbances and threats
- Pressures, disturbances and threats in the wetland site (e.g. conversion to other uses, water offtake for irrigation, hunting, over-fishing)
- Pressures from outside, eg in basin/coastal zone, affecting the wetland (e.g. mining, hydropower)
Land tenure and administrative authority
- Land tenure for the wetland and critical parts of the basin/coastal zone
- Administrative authority for the wetland and river basin/coastal zone
- Any other management actors influencing the wetland

_____________________________________________________________________________
40
Conservation and management status of the wetland
- Formal instruments for management/conservation - Informal/social/cultural traditions that influence
management - Research and education programmes/facilities - Measures needed/recommended
Management plans and monitoring programs
- Management plans and programmes in place for the wetland
- Management plans and programmes planned for the wetland
- Management plans and programmes for the river basin/coastal zone
Ecosystem Services and Values Ecosystem values and benefits (goods and services) derived from the wetland (benefits for human well-being)
- Wetland benefits and values; e.g.: o Wetland products, including fishing
practices/equipment o Tourism and recreation o Hydrological benefits o Cultural benefits o Carbon storage o Number of people benefitting: (i) on site; (ii)
beyond the wetland o etc.
References - References to any literature/data sources used
Step 6: Plan and prepare the inventory process The inventory process needs to be carefully planned, with appropriate time and resources allocated. This should include selecting appropriate methods and developing a work plan for: a) preparation; b) collecting, processing and interpreting the data collected; c) reporting the results; and d) monitoring and evaluation. It is important to establish clear protocols for collecting, recording and storing data, including what format it will follow and how material will be saved in electronic or hardcopy formats. This serves two main purposes:
▪ To enable future users to determine the source of the data, and its accuracy and reliability; and

_____________________________________________________________________________
41
▪ To ensure that different data gatherers are using the same categories, classifications, terms and structure for recording data, helping to integrate data from a variety of sources.
Determine what reporting requirements will be required for the inventory, including progress reports, final reports, etc. Should reporting be required, establish a procedure for reporting all results in a timely and cost effective manner. Establish a monitoring and evaluation process for the inventory at an early stage of planning and preparation to ensure the effectiveness of all procedures, including reporting and, when required, whether to adjust the project. The work plan for the inventory should be in accordance with the level of resources and people available to complete it, as well as the timeframe for the project. Assess whether or not the program, including reporting of the results, can be undertaken within under the current institutional, financial and staff resources and situation. Determine if the costs of data collection and analysis are within budget and that a budget is available for the program to be completed. A planning matrix for this step is provided at Annex 2.
Step 7: Identify and engage key people at the local level Depending on the scope and scale of the wetland inventory, it is likely that data collection will need to be carried out at the local level (e.g. province, state, region). Engaging local-level managers and/or officials can help the team to gather data and further provides an opportunity to build the capacity of people involved in wetlands monitoring and management. Like the national inventory team, local level teams should also be multi-disciplinary or multi-sectoral. Using the core data sets required, draft a data collection form to guide work at the local level and train the participants in its use. A trial of the collection form at a local wetland site will help to train local personnel and test the process. An example data collection form is provided in Annex 3, based on the parameters for wetland inventory in Table 6-1. This form can also be adapted to specific inventory needs. Also ensure that local data collection personnel have the necessary equipment and knowledge to gather all the necessary data, such as GPS units, ability to use GPS/GIS, etc.
Step 8: Data collection The next step is to carry out data collection, according to the selected methodology and workplan. Make sure sufficient time and resources have been allocated for this process, including setting aside a contingency fund for unexpected needs (e.g. 5% of the total budget). Communicate regularly with local data collection teams to ensure the process is being followed correctly and to deal with any problems as they arise. This is easier to do during the data

_____________________________________________________________________________
42
collection process, as opposed to trying to fix mistakes and gather more information at a later stage. Regularly check and review data that is returned; for example, check the data forms against existing information and maps.
Step 9: Further planning and preparation of field work Some inventory processes may include field work in specific sites to gather in-depth data, depending on resources and chosen resolution. For example, the inventory may need more comprehensive assessment of the ecological status and management needs of priority sites. Field work, if required, should be planned as part of the inventory in the early stages, and may be carried out at the same time as data collection (Step 8). However, if possible and convenient, the inventory team can also wait until after an initial data gathering process to select the most appropriate sites for any further assessment. Once sites are selected, plan in detail, for e.g. using a similar planning matrix as in Annex 2. It is recommended that an integrated approach using a multidisciplinary team also be utilized for an assessments or fieldwork. Preparation for a field assessment should include a pilot study: test and adjust the method and specialist equipment being used, assess the training needs for staff involved, and confirm the means of collating, collecting, entering, analyzing and interpreting the data.
Step 10: Implement field assessment/s Carry out the field assessment/s of wetland sites, according to methodology selected and work plan. Ensure that any fieldwork associated with the inventory is timed according to the work plan of the whole project.
Step 11: Analyze and integrate the data Check, collate and analyze the data collected. This may include existing literature and statistics, data collection forms from around the country/region, and the results of any assessments of particular sites. Data collection and collation should follow the data management plan determined by the team in Step 7; i.e. all data collection, as much as possible, should have followed the same protocols, used the same classifications, and presented results in similar ways. This will help in the integration and presentation of data from a variety of sources. It is recommended that analysis of the results be carried out by the multidisciplinary team, making use of the different perspectives of the various people involved in wetland management.

_____________________________________________________________________________
43
Step 12: Reporting and presentation of results The team needs to determine how the inventory results will be presented. In addition to a traditional written report, it is recommended that the presentation of results make use of images or multimedia. Some of these options may need forward planning. For example:
▪ GIS maps (requiring collection of GPS data as well as access to appropriate software) ▪ Satellite images (e.g. Google Earth) ▪ Community mapping/diagrams of the wetland area ▪ Photos showing key wetland functions and values ▪ Video/video interviews with key informants
Step 13: Feedback and policy engagement The findings of the inventory should be presented to stakeholders and their feedback encouraged. Before finalizing the report/products, the team should therefore hold a stakeholder workshop to discuss the findings and make revisions if necessary. Further, wetland inventory is often aimed at informing policy and decision-making about wetlands conservation and development. However, a clear effort must be made to engage policy-makers and other stakeholders and to gain their feedback. Measures may include:
▪ Involving policy-makers and other stakeholders in discussions at an early stage of the inventory process, e.g. getting their feedback at the planning stage;
▪ Involving decision-makers directly in the inventory process, e.g. having them participate in training or data collection;
▪ Presenting the results in formats aimed at specific audiences, such as policy briefs, posters, presentations, slide-shows, etc.; and
▪ Presenting results to a wide group of stakeholders in a final workshop.
Step 14: Monitoring and evaluation Any reporting and follow-up requirements for the wetland inventory should be planned at the start of the process. During the inventory process, keep a record of the positive impacts of the project, such as the number of people trained and any associated benefits (e.g. increased press coverage for wetlands). Ideally, should adequate resources be available, a wetland inventory should be followed up regularly, for example with ten-yearly updates. However, because of the strong development pressures on wetlands as well as a frequent lack of funding and capacity for wetlands management organizations, it is clear that other options for monitoring wetlands must be considered. For example, if possible, the inventory team can make wetland monitoring (using a similar or perhaps simpler data collection form or participatory methods with local

_____________________________________________________________________________
44
communities) part of the training for the inventory process. Key indicators that may be used for monitoring wetlands in the future can also be included in the inventory data collection process.
_____________________________________________________________________________
45
7. References Asian Wetland Inventory. Website. http://www.wetlands.org/RSIS/WKBASE/awi/default.htm
(accessed July 2017).
Baran, E. and Jantunen, T. and Chanton, K.C. (2008) Values of inland fisheries in the Mekong river basin. In: Tropical river fisheries valuation: background papers to a global synthesis. WorldFish Center Studies and Reviews (1836). WorldFish Center, Penang, Malaysia, pp. 227-290.
Batker, D., de la Torre, I., Costanza, R., Swedeen, P., Day, J., Boumans, R. and Bagstad, K. (2010). Gaining Ground. Wetlands, Hurricanes and the Economy: The Value of Restoring the Mississippi River Delta. Earth Economics, Tacoma, Washington. Available at: http://www.eartheconomics.org/FileLibrary/file/Reports/ Louisiana/Earth_Economics_Report_on_the_Mississippi_River_Delta_compressed.pdf.
Bullock A., and Acreman, M.C. (2003) The role of wetlands in the hydrological cycle. Hydrology and Earth System Sciences. 7,3, 75-86.
Chooowaew et.al. 2003. Status of wetlands in Thailand. Report produced for Thai National Mekong Committee
Choowaew, Sansanee. 2003. “Classification and Inventory of Wetland/Aquatic Ecosystems in the Lower Mekong River Basin of Thailand”. Thailand National Mekong River Commission Secretariat and the Mekong River Commission Secretariat.
Claridge, Gordon (comp.). 1996. An Inventory of Wetlands of the Lao PDR. Bangkok, Thailand: IUCN.
Cohen-Shacham, E., Walters, G., Janzen, C. and Maginnis, S. (eds.). 2016. Nature-based Solutions to address global societal challenges. Gland, Switzerland: IUCN. xiii + 97pp.
Davidson, N. C. 2014. How much wetland has the world lost? Long-term and recent trends in global wetland area. Marine and Freshwater Research, 65(10), 934-941.
de Groot R., Brander L., van der Ploeg S., Costanza R., Bernard F., Braat L., Christi, M., Crossman N., Ghermandi A., Hein L., Hussain,S., Kumar P., McVittie A., Portela R., Rodriguez L.C., ten Brink P., van Beukering P. 2012. Global estimates of the value of ecosystems and their services in monetary units. Ecosystem Services 1, 50–61.
Duc et al. 2003. Status of wetlands in Vietnam. Report produced for Vietnam National Mekong Committee
_____________________________________________________________________________
46
IUCN, International Union for Conservation of Nature, Lao PDR Office. 2009. “Factsheet: Upstream-Downstream”.
Mather, Robert. 2009. “Wetlands in the Mekong Basin”. Asian Water, November 2009: 19-22.
Mekong River Commission (MRC). 2010. State of the Basin Report, 2010. MRC. Vientiane.
Mekong River Commission (MRC). 2011. MRC Wetland Classification Coding Supporting Inventory 2011. MRC. Vientiane.
Mekong River Commission (MRC). 2015. Basin-wide Climate Change Impact and Vulnerability Assessment for Wetlands in the Lower Mekong Basin for Adaptation Planning. Mekong River Commission, Vientiane; ICEM Australia.
Mekong Wetlands Biodiversity Conservation and Sustainable Use Programme (MWBP). “About the Programme”. http://www.mekongwetlands.org/Programme/mekong.htm (accessed April 2010).
Millennium Ecosystem Assessment, MEA. 2005. Millennium ecosystem assessment: Ecosystems and human wellbeing. Washington, DC: Island Press.
Phittayaphone, Saleumsy. 2003. “Classification and Inventory of Wetland/Aquatic ecosystem, Lao PDR”. Mekong River Commission, Vientiane.
Phittayaphone, et al. 2003, Status of wetlands in Lao PDR. Report produced for Lao National Mekong Committee
Ramsar Secretariat. 2005. Integrated Framework for Wetland Inventory, Assessment and Monitoring (IF-WIAM). Resolution IX.I (Annex E). 9th Meeting of the Conference of the Parties to the Convention on Wetlands, Kampala, Uganda, 8-15 November 2005.
Ramsar Secretariat. 2005. Guidelines for the Rapid Assessment of Inland, Coastal and Marine Wetland Biodiversity. Resolution IX.I (Annex E, i). 9th Meeting of the Conference of the Parties to the Convention on Wetlands, Kampala, Uganda, 8-15 November 2005.
Ramsar Strategic Framework and Guidelines (2012). Strategic Framework and guidelines for the future development of the List of Wetlands of International Importance of the Convention on Wetlands (Ramsar, Iran, 1971) – 2012 revision. Resolution XI.8 Annex 2. http://www.ramsar.org/sites/default/files/documents/pdf/cop11/res/cop11-res08-e-anx2.pdf
Ramsar Secretariat. “FAQs: What are Wetlands?” http://www.ramsar.org/cda/en/ramsar-about-faqs-what-are-wetlands/main/ramsar/1-36-37%5E7713_4000_0__ (Accessed July 2017).

_____________________________________________________________________________
47
Renaud, F. G., Sudmeier-Rieux, K., & Estrella, M. (2013). The role of ecosystems in disaster risk reduction. United Nations University Press.
Scott, Derek A. (comp.). 1989. Directory of Asian Wetlands. IUCN, The World Conservation Union.
Springate-Baginski, O., Allen, D. and Darwall, W.R.T. (eds.) 2009. An Integrated Wetland Assessment Toolkit: A guide to good practice. Gland, Switzerland: IUCN and Cambridge, UK: IUCN Species Programme.
TEEB 2010. The Economics of Ecosystems and Biodiversity: Ecological and Economic
Foundations. Editor: Kumar P. Earthscan, London and Washington.
Thinh, Pham Trong. 2003. “Findings from Wetland Classification and Inventory of Wetlands/Aquatic Ecosystem in the Mekong Basin, Vietnam”. Vietnam National Mekong Committee and the Mekong River Commission.
Vathana, Kol. 2003. “Review of Wetland and Aquatic Ecosystem in the Lower Mekong River Basin of Cambodia”. Cambodian National Mekong River Commission Secretariat and the Mekong River Commission Secretariat.
Vathana, K et al. 2003 Status of wetlands in Cambodia. Report produced for Cambodia National Mekong Committee
VEEPA. Viet Nam Environment Protection Agency. 2005.Overview of Wetlands Status in Viet Nam Following15 Years of Ramsar Convention Implementation. Hanoi, Viet Nam. 72 pp.

__________________________________________________________________________________
48
Annex 1: MRC wetland database
Wetland classification LMB (ha)
Fresh water/temporary flooding/swamp/woody scrub 2,931,419
Freshwater wetland 43,201
Freshwater wetland, neutral flooding, flooded forest 3,008
Freshwater wetland, peatlands - ombro-oligotrophic/soligenous, woody s 226,069
Freshwater wetland, temporary flooding, swamp/woody scrub 2,549
Freshwater wetland, temporary, flooded forest 4,541
Freshwater wetland, temporary, flooded forest, plantation 10,578
Freshwater wetland, temporary, other wet crops 504,353
Freshwater wetland, temporary, rice/agriculture 13,045,035
Freshwater wetland, temporary, rice/agriculture, rainfed 713,239
Freshwater wetland, temporary, rice/agriculture, recession 3,305,322
Freshwater wetland, temporary, swamp/woody scrub 878,565
Freshwater wetland, temporary, swamp/woody scrub, introduced/alien spe 97,688
Freshwater wetland, temporary, wet grassland/marsh 321,673
Freshwater wetland, temporary, wet grassland/marsh, manmade 5,552
Freshwater wetland, wet grassland/marsh 160,924
lake > 8 ha 143
lake > 8 ha, manmade 213,678
lake > 8 ha, natural 314,787
lake > 8 ha, temporary, manmade 488
lake > 8 ha, temporary, natural 5,347
pond < 8 ha, manmade, borrow pit/quarry 176
pond < 8 ha, manmade, drinking/irrigation/ hydropower 18
pond < 8 ha, natural 1,519
Pond < 8 ha, neutral flooding, manmade, aquaculture 374
pond < 8 ha, neutral flooding, manmade, urban with wetland 368,451
Saline lake > 8 ha 6,625
River bank/beach/bar 4,841
Riverine, artificial channel 134
Riverine, natural channel 302,815
Riverine, rapid/riffles 65,758
Riverine, temporary flooding, artificial channel 449,317
Riverine, waterfall 4,167
Estuarine, intertidal/temporary flooding, non-vegetated, aquaculture 58,789
Estuarine, intertidal/temporary flooding, non-vegetated, cliff/rocky 10,622
Estuarine, intertidal/temporary flooding, non-vegetated, mudflat/silty 198
Estuarine, intertidal/temporary flooding, non-vegetated, salt works 9,139
Estuarine, intertidal/temporary flooding, vegetated, agriculture 481,055
Estuarine, intertidal/temporary flooding, vegetated, mangrove/plantati 12,488
Estuarine, intertidal/temporary flooding, vegetated, other 2,413
Estuarine, intertidal/temporary flooding, vegetated, saltmarsh/forbs 691
Estuarine, subtidal/permanent flooding, non-vegetated, bare - unconsol 1,256
Estuarine, subtidal/permanent flooding, vegetated, aquaculture 6,060
Estuarine, watercourse 51,121
Intertidal/temporary flooding,lagoon 342
Marine/coastal, intertidal/temporary flooding, non-vegetated, aquacul 188,046
Marine/coastal, intertidal/temporary flooding, non-vegetated, beach/s 308
Marine/coastal, intertidal/temporary flooding, non-vegetated, mudflat 25
Marine/coastal, intertidal/temporary flooding, non-vegetated, salt wo 80
Marine/coastal, intertidal/temporary flooding, vegetated, agriculture 504,719
Marine/coastal, intertidal/temporary flooding, vegetated, mangrove/fo 2,888
Marine/coastal, intertidal/temporary flooding, vegetated, mangrove/pl 71,795
Marine/coastal, intertidal/temporary flooding, vegetated, saltmarsh/f 4,795
Marine/coastal, subtidal/permanent flooding, non-vegetated 2,490
Marine/coastal, subtidal/permanent flooding, watercourse 12,736
TOTAL 25,414,408
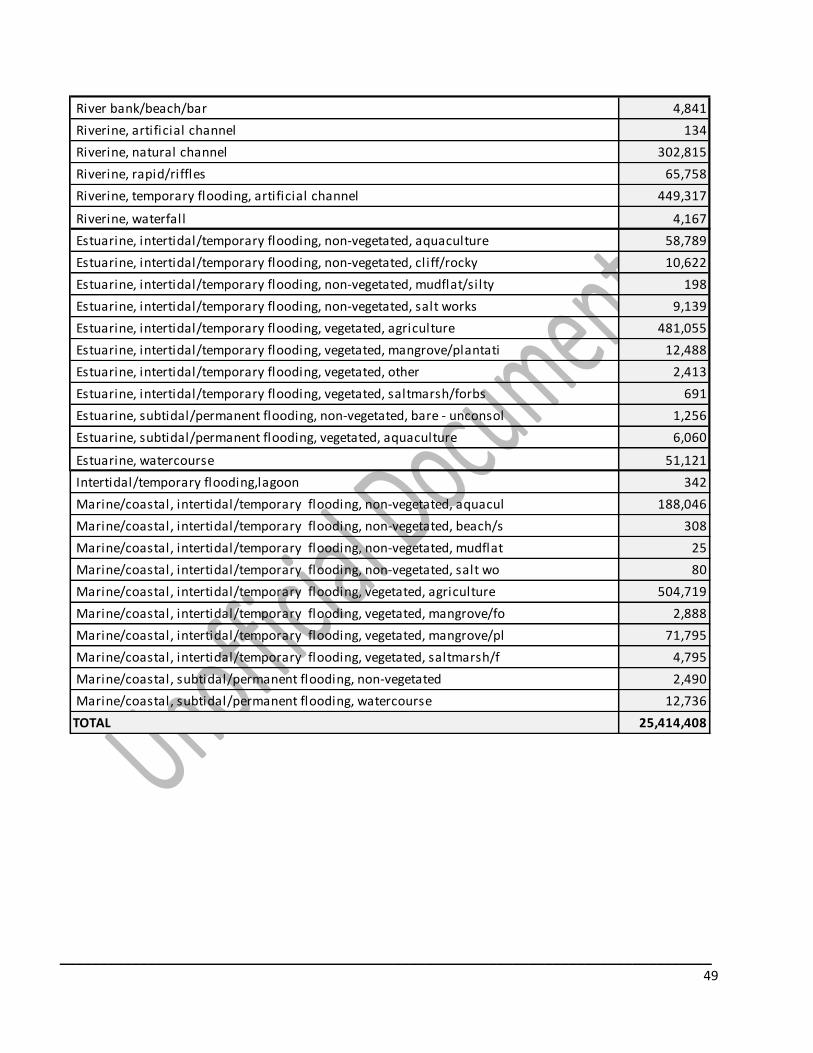
__________________________________________________________________________________
49
Wetland classification LMB (ha)
Fresh water/temporary flooding/swamp/woody scrub 2,931,419
Freshwater wetland 43,201
Freshwater wetland, neutral flooding, flooded forest 3,008
Freshwater wetland, peatlands - ombro-oligotrophic/soligenous, woody s 226,069
Freshwater wetland, temporary flooding, swamp/woody scrub 2,549
Freshwater wetland, temporary, flooded forest 4,541
Freshwater wetland, temporary, flooded forest, plantation 10,578
Freshwater wetland, temporary, other wet crops 504,353
Freshwater wetland, temporary, rice/agriculture 13,045,035
Freshwater wetland, temporary, rice/agriculture, rainfed 713,239
Freshwater wetland, temporary, rice/agriculture, recession 3,305,322
Freshwater wetland, temporary, swamp/woody scrub 878,565
Freshwater wetland, temporary, swamp/woody scrub, introduced/alien spe 97,688
Freshwater wetland, temporary, wet grassland/marsh 321,673
Freshwater wetland, temporary, wet grassland/marsh, manmade 5,552
Freshwater wetland, wet grassland/marsh 160,924
lake > 8 ha 143
lake > 8 ha, manmade 213,678
lake > 8 ha, natural 314,787
lake > 8 ha, temporary, manmade 488
lake > 8 ha, temporary, natural 5,347
pond < 8 ha, manmade, borrow pit/quarry 176
pond < 8 ha, manmade, drinking/irrigation/ hydropower 18
pond < 8 ha, natural 1,519
Pond < 8 ha, neutral flooding, manmade, aquaculture 374
pond < 8 ha, neutral flooding, manmade, urban with wetland 368,451
Saline lake > 8 ha 6,625
River bank/beach/bar 4,841
Riverine, artificial channel 134
Riverine, natural channel 302,815
Riverine, rapid/riffles 65,758
Riverine, temporary flooding, artificial channel 449,317
Riverine, waterfall 4,167
Estuarine, intertidal/temporary flooding, non-vegetated, aquaculture 58,789
Estuarine, intertidal/temporary flooding, non-vegetated, cliff/rocky 10,622
Estuarine, intertidal/temporary flooding, non-vegetated, mudflat/silty 198
Estuarine, intertidal/temporary flooding, non-vegetated, salt works 9,139
Estuarine, intertidal/temporary flooding, vegetated, agriculture 481,055
Estuarine, intertidal/temporary flooding, vegetated, mangrove/plantati 12,488
Estuarine, intertidal/temporary flooding, vegetated, other 2,413
Estuarine, intertidal/temporary flooding, vegetated, saltmarsh/forbs 691
Estuarine, subtidal/permanent flooding, non-vegetated, bare - unconsol 1,256
Estuarine, subtidal/permanent flooding, vegetated, aquaculture 6,060
Estuarine, watercourse 51,121
Intertidal/temporary flooding,lagoon 342
Marine/coastal, intertidal/temporary flooding, non-vegetated, aquacul 188,046
Marine/coastal, intertidal/temporary flooding, non-vegetated, beach/s 308
Marine/coastal, intertidal/temporary flooding, non-vegetated, mudflat 25
Marine/coastal, intertidal/temporary flooding, non-vegetated, salt wo 80
Marine/coastal, intertidal/temporary flooding, vegetated, agriculture 504,719
Marine/coastal, intertidal/temporary flooding, vegetated, mangrove/fo 2,888
Marine/coastal, intertidal/temporary flooding, vegetated, mangrove/pl 71,795
Marine/coastal, intertidal/temporary flooding, vegetated, saltmarsh/f 4,795
Marine/coastal, subtidal/permanent flooding, non-vegetated 2,490
Marine/coastal, subtidal/permanent flooding, watercourse 12,736
TOTAL 25,414,408

__________________________________________________________________________________
50
Annex 2: Planning matrix for wetlands inventory
Area Key questions Example Answers
1. Purpose & objectives
Why is this inventory needed? Province X is undergoing rapid development; its wetland sites have been degraded and there is risk of further degradation and conversion.
What will be the purpose/s of this inventory?
To provide a clear picture of the status of wetlands in Province X to assist in development planning.
What are the objectives of this inventory?
- Better understanding of the number, location and status of wetlands in Province X
- Better understanding of the province’s wetland values
- Improved knowledge/awareness about wetlands among decision-makers in Province X
Who is the target audience? - Decision-makers in Province X - Residents of Province X
2. Scale and scope
What geographical scope needs to be covered?
- All of Province X
Will all wetland types/sites be covered? If not, what are the criteria for sites to be included?
- Inland wetlands only; not paddy - Will set size limit after consultation
with stakeholders & local teams, e.g. 8 ha and above
What scale of information is needed? How much detail?
- Enough to show basic status/condition and values of each wetland in the province
3. Data require-ments
What information already exists about the wetlands or areas in question? How reliable and comprehensive is that information?
- Land use master plan (1993) - Provincial environmental inventory
(1996) - Study of Wetland Y climate change
vulnerability (2002) - RIS for proposed Ramsar Site Z (2003) - Information on specific wetlands largely
lacking; most information now out-of-

__________________________________________________________________________________
51
Area Key questions Example Answers
date, especially given recent development pressures.
What are the important gaps in the available information?
- Only a few key wetlands have detailed information, especially on values & status
- Lack of recent maps showing wetland sites
What data needs to be collected in order to achieve the purpose and objectives of the inventory?
For all wetlands in the province (fitting Ramsar criteria but excluding paddies):
- Basic outline of wetlands governance system in province
- Location, boundaries, map - Climate, basic hydrology and geology - Key flora and fauna - Key social, cultural and economic uses,
incl. land use - Important wetland values/functions
and products - Threats to wetland, pressures - Current management measures - Recommended measures
How should this data be managed? E.g. what protocols will be set for data collection/recording? Will a database be used?
Data collection forms will include instructions on recording data, including minimum requirements. Institute Y will be responsible for compiling all data forms into a synthesized excel database.
4. Data gathering
Is it possible to gather this data?
Yes
Which sectors or local-level actors will need to help gather data?
Provincial Ministry for Economic Planning Provincial Ministry for Water & Fisheries District officials for Water & Fisheries District officials for Agriculture
Is there an available and appropriate methodology for
Yes – MRC LMB wetland inventory methodology will be used with data collection

__________________________________________________________________________________
52
Area Key questions Example Answers
this inventory?
forms at district level
Will any field work be required for this inventory?
Basic visit to each site by district officials to in their own district to fill out data form, take GPS readings, hold district meeting.
5. Resources Is there sufficient funding to carry out the inventory? How much is required?
c. $45,000 (have $37,000)
Is there sufficient time to carry out the inventory? What is the minimum time required?
Minimum: 9 months
Are there enough people to carry out the inventory? Are there any significant gaps in their knowledge/capacity?
District officials sufficient but lack knowledge of GPS & wetland issues (training to be provided)
6. Stakeholders Who are the key stakeholders who should be involved at the international, national and local levels?
- MRCS - International/regional NGOs - Key national ministries (Water &
Fisheries, Agriculture, Economic Planning, etc)
- Provincial ministries (as above) - District officials - Local communities in sites - National University and College of
Province X
How should they be involved?
- National inception meeting to review plan and priorities
- District meetings for each district to identify wetlands & values, discuss data collection, including village reps.
- Final national workshop to present results
7. Reporting, monitoring and
How will the results be presented?
- Main report on wetland inventory of Province X
- Produce map showing wetlands, urban

__________________________________________________________________________________
53
Area Key questions Example Answers
evaluation centres, main roads, waterways, concessions, and parks
- Policy brief to inform update of provincial master plan
How will it reach its target audience/s?
- Report & brief distributed to all districts and key provincial ministries
- Radio interviews to be scheduled
Are there any other reporting requirements? E.g. progress reports
- Interim progress report to donor - Final financial report - Final report
How will the inventory process be monitoring and evaluated?
- Interim progress report preparation: brief report in excel format to be sent in from all teams
- Inventory to be updated every 10 years
8. Risks What challenges might the inventory face?
- Funds/resources may not be enough for full inventory
- Provincial govt reluctance to accept results (hinder development?)
How can these challenges be addressed or mitigated?
- District meeting prior to data gathering to determine if all sites worth visiting/recording data- each district must prioritize
- Emphasize wise use and need to consider wetlands in development plans, use existing tools eg EIA

___________________________________________________________________________________________________________
54
Annex 3: Draft Wetland Inventory Data Collection Form
Wetland inventory data collection form Form number : ……………………………………………………………………………………. D : information can come from the desk study I : information can come from the interviews F : information can come from the field visit
1.GENERAL INFORMATION (D,I)
1.1 Date of data collection Dd/mm/yy
1.2 Location/s for data collection
General description of the location of the wetland using landscape features or closest roads, If the wetland is assessed in sector please provide a description of the location of the sector.
1.3 Officer position/ Organization/contact details
1.4 Site name (English and local
name)
1.5 Site code
Proposition : country code (L = Laos; C = Cambodia, T = Thailand, V = Viet Nam),initials of the province- initials of the English name (example That Luang Marsh : L-VTC-TL)
1.6 Sector name (English and local name)
1.7 Sector code
1.8 Photos numbers Proposition : Wetland code – number (example That Luang marsh : VTN-TL-001)
1.9 Location (D,F)
1.9.1 Province
1.9.2 District
1.9.3 Nearest city/town and City name: Distance

___________________________________________________________________________________________________________
55
distance to the site/sector Use official record or maps
1.9.4 GPS coordinates
GPS Marks of key locations of the site/sector
Longitude (UTM) Latitude (UTM)
Northern point
Southern point
Western point
Eastern point
Centroid
! Insert GIS MAP of the site’s or sector’s boundary and location in 5.1
1.9.5 Topo map number and scale
2 BIOPHYSICAL FEATURES (D,I,F)
2.1 General description (D,F)
2.1.1 Area of the site or sector (ha)
Literature
According to interviews
Field mapping
2.1.2 Shape of the wetland
Description of the shape and structure of the site/sector and of the boundary Example: large elongated wetland; series of interconnected ponds…wetlands boundary borders road Y to the north, NPA X to the west, town Z to the south, river w to the east…
Dimensions Major length(m)
Major width (m) Major depth (m)
Elevation (GPS reading) :
Upstream (m)
Middle reaches (m)
Downstream (m)
Key point (m)
Provide a cross-section / plan view of the wetland (fig 5.2)

___________________________________________________________________________________________________________
56
2.2 Geomorphic setting (D,F)
Biogeographical region
Occurrence in the landscape Upland Plateau Lowland Floodplain Coastal Other (explain):
2.3 Wetland classification (D,F)
2.3.1 MRC classification code(s) (if different type of wetlands list the different types by order of dominance (by area) starting with the wetland with the largest area). (See Annex A)
2.3.2 RAMSAR classification code (if different type of wetlands list the different types by order of dominance (by area) starting with the wetland with the largest area). (See Annex B)
2.4 Climate (D)
Seasonality Dry season
MM to MM Wet season MM to MM
Annual average temperature range (C) Average minimum temperature
Average maximum temperature
Average annual rainfall (mm) Record from the closest weather station and literature
2.5 Soil-sediment (D,I,F)
Bottom sediment (circle appropriate(s))
Stony
Coarse sand
Fine sand
Muddy sand
Mud or silt
Clay
Peat
Ooze
Other (write)
If any major difference in bottom

___________________________________________________________________________________________________________
57
sediment in the site/sector please record GPS data for each type.
2.6 Hydrology and Water Regime (D,I,F)
2.6.1Water source (circle appropriate(s))
Local runoff (rain, infiltration)
Flooding from nearby stream
Stream (direct source) Groundwater Spring (nearby)
Artificial (canal, irrigation) Marine
Explain : Cross-check connections on existing maps. Be aware that connections to other water bodies can change over time.
Draw connection to other water bodies (include in map in 5.1)
Official name of catchment area From reports
Surface of catchment area (ha) From reports
2.6.2 Water regime (circle appropriate(s))
Permanent
Seasonal Other (episodic, semi-permanent…) (Explain)
Explain:
GIS Map of the 3 envelops a) dry season; b) wet season; and c) Higher level of water known and show in map in 5.1
2.7 hydrological importance for sustaining nearby ecosystems/biodiversity (D,I,F) This section refers to the role/importance of the hydrology of the wetland for supporting ecosystem functions and biodiversity (the importance of the hydrology of the site for people is covered in section 4). For example, the site provides surface or groundwater to support a nearby important biodiversity site.
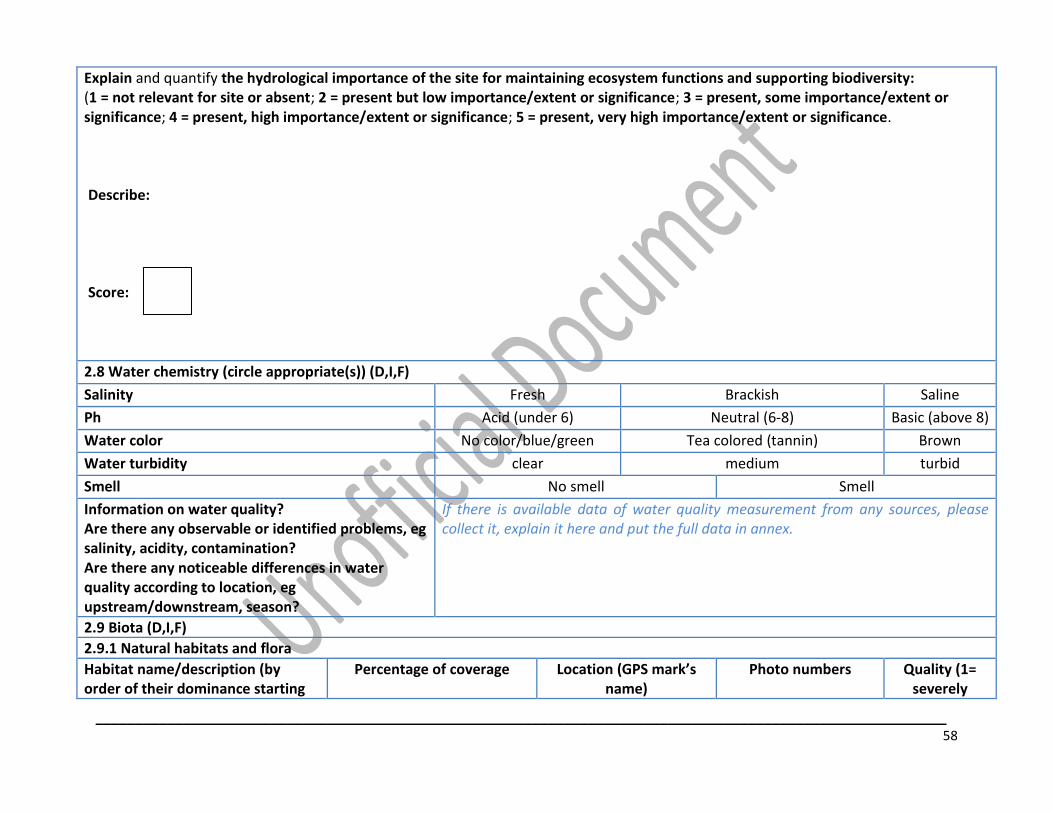
___________________________________________________________________________________________________________
58
Explain and quantify the hydrological importance of the site for maintaining ecosystem functions and supporting biodiversity: (1 = not relevant for site or absent; 2 = present but low importance/extent or significance; 3 = present, some importance/extent or significance; 4 = present, high importance/extent or significance; 5 = present, very high importance/extent or significance. Describe: Score:
2.8 Water chemistry (circle appropriate(s)) (D,I,F)
Salinity Fresh Brackish Saline
Ph Acid (under 6) Neutral (6-8) Basic (above 8)
Water color No color/blue/green Tea colored (tannin) Brown
Water turbidity clear medium turbid
Smell No smell Smell
Information on water quality? Are there any observable or identified problems, eg salinity, acidity, contamination? Are there any noticeable differences in water quality according to location, eg upstream/downstream, season?
If there is available data of water quality measurement from any sources, please collect it, explain it here and put the full data in annex.
2.9 Biota (D,I,F)
2.9.1 Natural habitats and flora
Habitat name/description (by order of their dominance starting
Percentage of coverage Location (GPS mark’s name)
Photo numbers Quality (1= severely

___________________________________________________________________________________________________________
59
with the habitat type with the largest area)
In the buffer zone or main site?
degraded to 5=pristine)
(bamboo forest, mixed deciduous forest, reed beds, rice paddy, mangrove…)
Include main habitats location in 5.1 ( GIS map)
2.9.2 Fauna
Diversity (estimate) Key economic species Key conservation species
Fish Start with lists according to secondary sources. Hold focus group discussion Use picture/flashcards/posters/field guides Ask for population size and any major trends
According to villagers, fishermen, traders… According to status of the specie and population trend in the site
Birds
Mammals
Reptiles
Amphibians
Invertebrates
2.9.3 Endangered flora and fauna, and Red List classification (check on www.iucnredlist.org)

___________________________________________________________________________________________________________
60
Scientific name Local name Red list classification Key habitat/location in the wetland
2.9.4 Exotic species
Scientific name Local name Classification
Invasive – non invasive
Invasive – non invasive
Invasive – non invasive
Invasive – non invasive
Invasive – non invasive
Invasive – non invasive
Invasive – non invasive
Comments/explanation: date of occurrence of invasive species in the wetland, major impacts caused by these species…
3 SOCIO-ECONOMIC and CULTURAL FEATURES This section provides a general description of the socio-economic and cultural setting of the wetland. Estimates of the degree of benefits/values of these benefits (ecosystem services) is included in section 4 below.
3.1 Population in the site/sector(estimate number and density) (D,I)
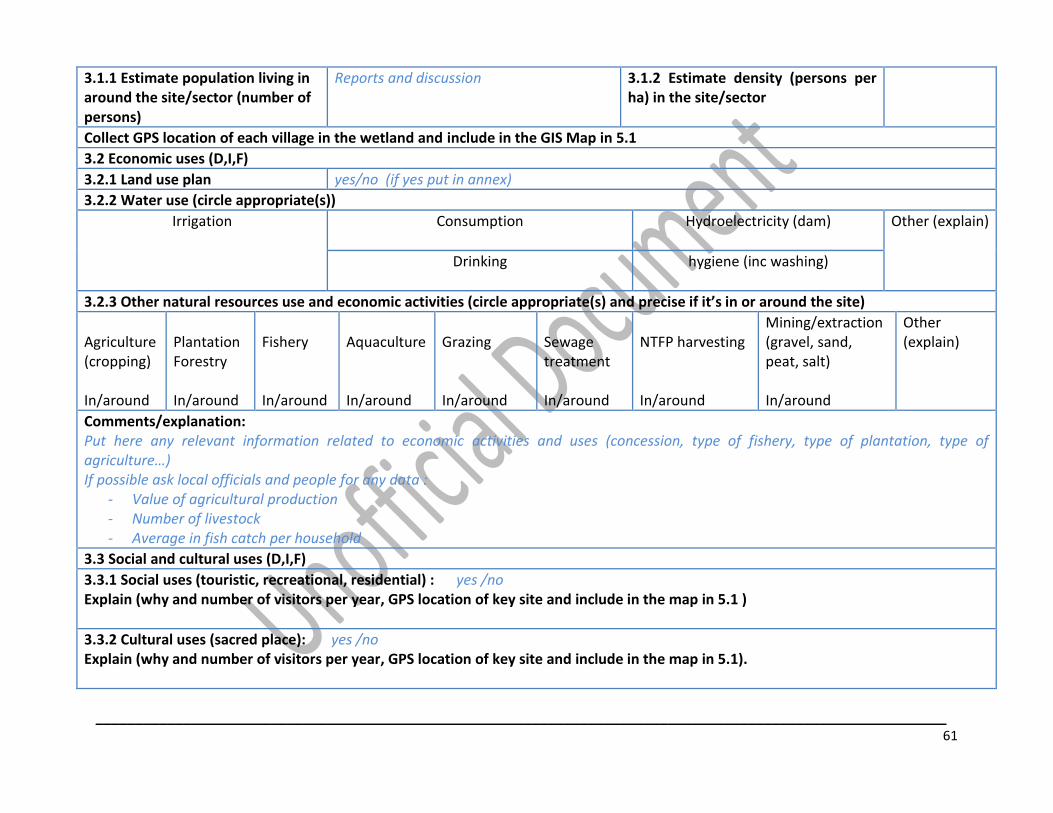
___________________________________________________________________________________________________________
61
3.1.1 Estimate population living in around the site/sector (number of persons)
Reports and discussion 3.1.2 Estimate density (persons per ha) in the site/sector
Collect GPS location of each village in the wetland and include in the GIS Map in 5.1
3.2 Economic uses (D,I,F)
3.2.1 Land use plan yes/no (if yes put in annex)
3.2.2 Water use (circle appropriate(s))
Irrigation Consumption
Hydroelectricity (dam)
Other (explain) Drinking
hygiene (inc washing)
3.2.3 Other natural resources use and economic activities (circle appropriate(s) and precise if it’s in or around the site)
Agriculture (cropping) In/around
Plantation Forestry In/around
Fishery In/around
Aquaculture In/around
Grazing In/around
Sewage treatment In/around
NTFP harvesting In/around
Mining/extraction (gravel, sand, peat, salt) In/around
Other (explain)
Comments/explanation: Put here any relevant information related to economic activities and uses (concession, type of fishery, type of plantation, type of agriculture…) If possible ask local officials and people for any data :
- Value of agricultural production - Number of livestock - Average in fish catch per household
3.3 Social and cultural uses (D,I,F)
3.3.1 Social uses (touristic, recreational, residential) : yes /no Explain (why and number of visitors per year, GPS location of key site and include in the map in 5.1 )
3.3.2 Cultural uses (sacred place): yes /no Explain (why and number of visitors per year, GPS location of key site and include in the map in 5.1).

___________________________________________________________________________________________________________
62
4 ECOSYSTEM SERVICES/BENEFITS Quantify the values of the wetland 1 = not relevant for site or absent 2 = present but low importance/extent or significance 3 = present, some importance/extent or significance 4 = present, high importance/extent or significance 5 = present, very high importance/extent or significance Score
4.1 Provisioning services – products obtained from the wetland (D, I, F)
4.1.1 Food for humans
Fisheries (Fish/molluscs/other invertebrates)
Plants
Other (describe)
4.1.2 Drinking water
For human use at the site
For human use beyond the site
For animals at the site
4.1.3 Wetland non-food products
Timber
Fuel-wood
Reeds and Fires
Peat (for human use)
Livestock fodder

___________________________________________________________________________________________________________
63
Other (list and describe)
4.1.4 Biochemical products (Extraction of non-living goods from local biota)
Describe:
4.1.5 Genetic materials
Medicinal products
Genes for tolerance to certain conditions (e.g. drought/salinity, plant pathogens) (existence of important crop and livestock wild relatives)
Ornamental species (live or dead)
Other (describe)
Explain/Comment the main provisioning services (process, importance, knowledge…)
4.2 Regulating services – benefits obtained from the regulation of ecosystem processes such as climate, water, and natural hazard regulation (D, I, F)
4.2.1 Maintenance of hydrological regimes
Groundwater recharge
Groundwater discharge
Storage and delivery of water as part of water supply systems for agriculture and industry
Flood storage/mitigation
Drought (water supply during drought periods)

___________________________________________________________________________________________________________
64
4.2.2 Erosion regulation
Significant erosion of sediments occurs on the site
Significant accretion or deposition of sediments occurs on the site
Significant transportation of sediments occurs on or through the site
Sediment regime is highly variable, either seasonally or inter-annually
Sediment regime unknown
4.2.3 Pollution control/detoxification (water purification, waste treatment or dilution) Describe:
4.2.4 Climate regulation (local/regional climate regulation/buffering of change – including temperature and precipitation)
4.2.5 Pest regulation (source of biological control of pests and diseases)
Human pests/diseases
Livestock pest/diseases
Crop pests/diseases
4.2.6 Hazard reduction
Flood control/storage
Storm protection
Coastal shoreline protection
River bank protection
Describe: (give an indication of area, populations and infrastructure protected)
Explain/Comment the main regulating services (process, importance, knowledge…)

___________________________________________________________________________________________________________
65
4.3 Supporting services – services necessary for the production of all other ecosystem services such as water cycling, nutrient cycling and habitat for biota (D, I, F)
4.3.1 Biodiversity - Supports a variety of all life forms including plants, animals and microorganisms, the genes they contain, and the ecosystems of which they form a part
4.3.2 Storage, recycling, processing and acquisition of nutrients
4.3.3 Carbon storage
The site is a significant store of carbon
The site significantly continues to sequester carbon
Site degradation is leading to significant carbon emissions
Site degradation will lead to significant carbon emissions
4.3.4 Pollination
The site is a significant source of wild pollinators for nearby crops
The site is a significant source of wild pollinators for wild plants
Explain/Comment the main supporting services (process, importance, knowledge…)
4.4 Cultural services – the non-material benefits people obtain from ecosystems such as through spiritual enrichment, cognitive development, reflection, recreation, and aesthetic experiences (D, I, F)
4.4.1 Recreation and tourism

___________________________________________________________________________________________________________
66
Recreational hunting and fishing (for “sport”; for food is under provisioning above)
Water sports and activities (e.g. boating, swimming for pleasure)
Picnics/outings and touring
Nature base observing and tourism (eco-tourism)
4.4.2 Spiritual and inspirational
The site is a significant sacred/spiritual/cultural/religious place for local communities Describe:
The site has significant archaeological or historical importance Describe:
The site has significant contemporary cultural significance, including for arts and creative inspiration, and including existence values Describe:
4.4.3 Scientific and educational values
The site is significantly important for educational purposes Describe:
The site is associated with important knowledge systems that are of value for research/knowledge Describe:
The site is of special scientific interest Describe:
The site is a model for the wise use of wetlands Describe:
Explain/Comment the main cultural services (process, importance, knowledge…)
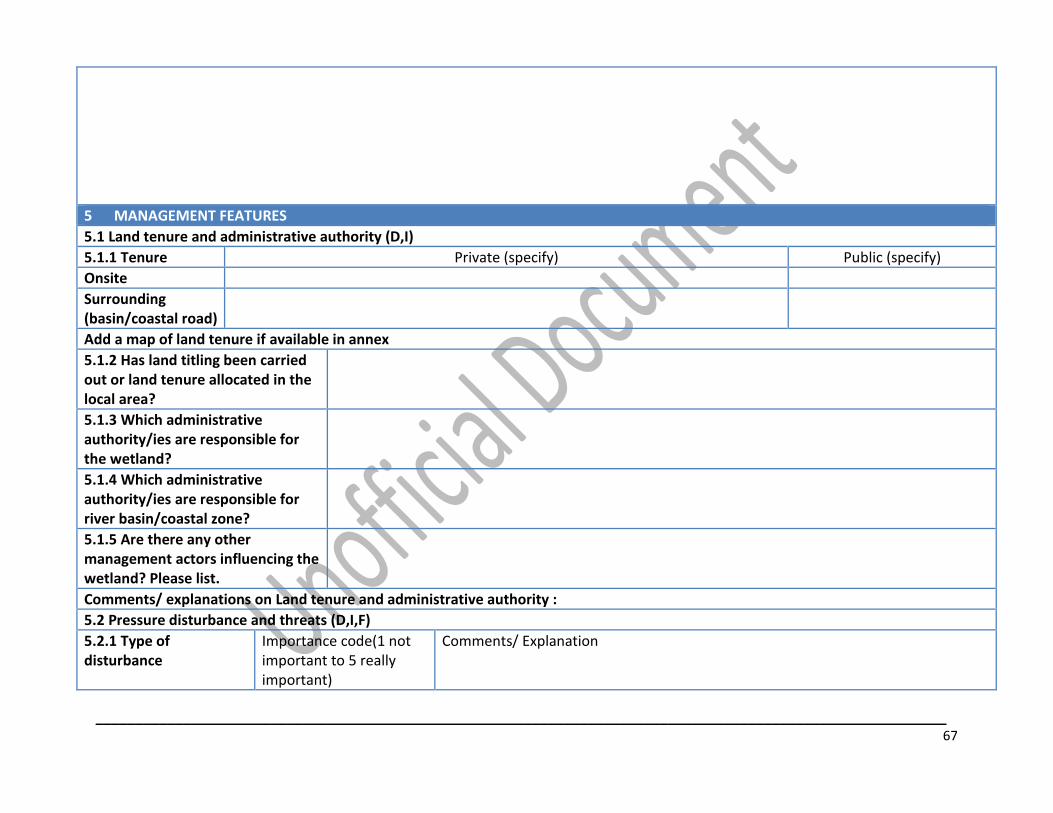
___________________________________________________________________________________________________________
67
5 MANAGEMENT FEATURES
5.1 Land tenure and administrative authority (D,I)
5.1.1 Tenure Private (specify) Public (specify)
Onsite
Surrounding (basin/coastal road)
Add a map of land tenure if available in annex
5.1.2 Has land titling been carried out or land tenure allocated in the local area?
5.1.3 Which administrative authority/ies are responsible for the wetland?
5.1.4 Which administrative authority/ies are responsible for river basin/coastal zone?
5.1.5 Are there any other management actors influencing the wetland? Please list.
Comments/ explanations on Land tenure and administrative authority :
5.2 Pressure disturbance and threats (D,I,F)
5.2.1 Type of disturbance
Importance code(1 not important to 5 really important)
Comments/ Explanation

___________________________________________________________________________________________________________
68
Altered water regime and hydrology (drainage, artificial flooding…)
• Ask local people and authorities what have been any changes in the wetland? What threats or problem do they identify? Can any evidence of threats be observed, e.g logging, dredging, invasive species…
• Explain if the pressure is directly in the site or outside the site , e.g. in the wider basin/coastal zone
Water pollution/ nutrient enrichment
Dumping
Encroachment
Habitats and wildlife destruction/overhunt overharvesting
Invasive species
Sedimentation
Other(s) : explain
Map the threats and disturbance on the GIS map in 6.1
5.3 Conservation and management status of the wetland (D,I)
5.3.1 Protected area (officially recognized by law) (if yes include in the map in 6.1
Yes/no/partially % of surface if partially Name
Comments (main management and conservation measures)
5.3.2 RAMSAR site (if yes include in the map in 6.1)
Yes/no/partially % of surface if partially Name
Comments (main management and conservation measures)

___________________________________________________________________________________________________________
69
5.3.3 Community protected area (spiritual site, community site) (if yes include in the map in 6.1
Yes/no/partially % of surface if partially 20% Name
Comments (main management and conservation measures)
5.3.4 Are there any formal instruments/ regulations for management/conservation of the wetland? Please describe.
From secondary sources/ reports, discussion with focus group and local stakeholder
5.3.5 Nearest protected area to wetland and distance (if the wetland is not protected)
PA name
Distance
5.4 Wetland conservation importance (1 not priority to 5 priority)
Biodiversity conservation importance(indicators: number of species, number of threatened species and habitats)
Livelihood conservation importance (indicators : number of people depending on the wetland, economic uses/values)
Ecosystem services conservation importance (indicators: section 4 on main services)
Site conservation value (average of the 3 previous)
Comments :
5.5 Importance of threads (1 low to 5 high)
Comments :

___________________________________________________________________________________________________________
70
5.6 Conservation and management recommendations
Are there any management/conservation measures needed/recommended?
6 MAPS and FIGURES
6.1 GIS Mapping (D,I,F)
This map should include : - The site boundary - Sectors’ location or boundaries if the survey has been done by sector - Relevant administrative boundaries (Province, district) - The water level for dry season, wet season and higher water level known until now for the whole site and/or each sector - Protected areas and Ramsar site boundary in and around the site/sector - Villages in the wetland - Main habitats location in the wetland - Main sacred site or touristic site in the wetland - Connection to other water bodies (streams, springs…) and arrows showing the water flow in the wetland. - Location of major threats identified - Edition: the map must be presented in Jpeg high resolution with the topo-map layer (1/25 000 if available) and aerial picture
(Google earth, most recent picture available).
6.2 Cross section of the wetland (D,I,F)
- Should present major difference of level in the wetland/sector and topography.
6.3 Picture of the wetland
- Should include general pictures of the wetland, any specific picture of habitats and threats. Pictures taken at different season
would be an asset.
7 REFERENCES AND ANNEXES
7.1 References to any literature/data sources used

___________________________________________________________________________________________________________
71
7.2 Annexes
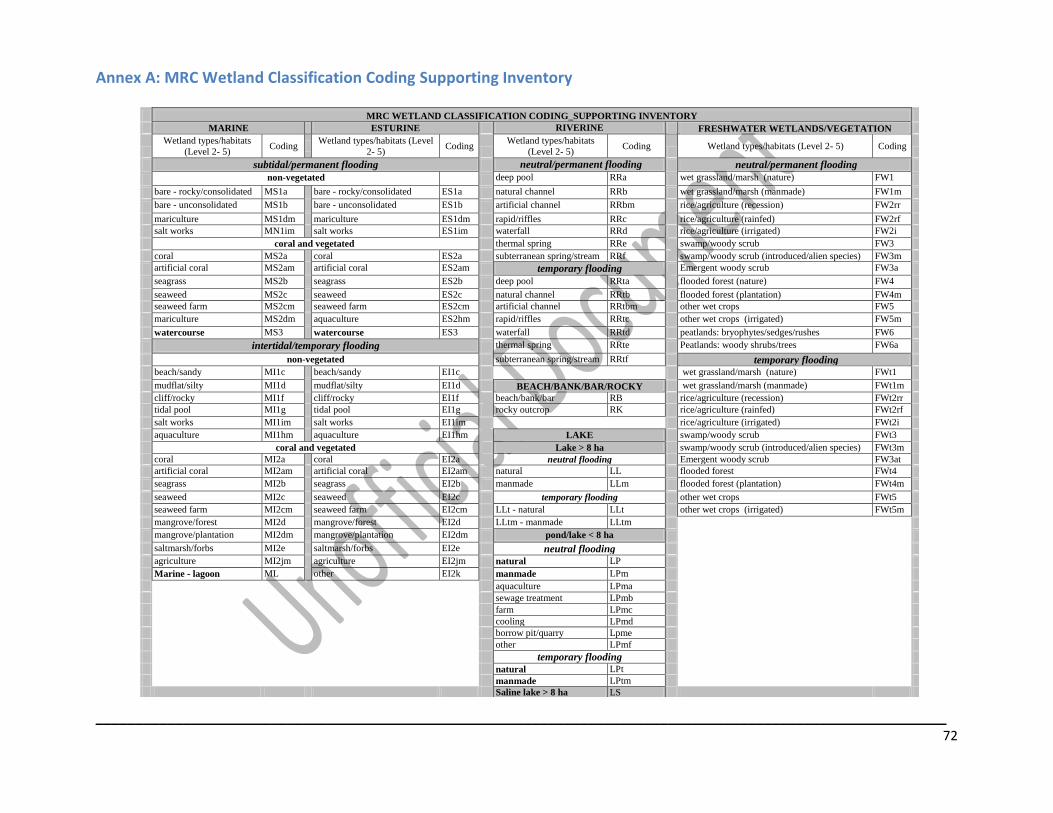
___________________________________________________________________________________________________________
72
Annex A: MRC Wetland Classification Coding Supporting Inventory
MRC WETLAND CLASSIFICATION CODING_SUPPORTING INVENTORY
MARINE ESTURINE RIVERINE FRESHWATER WETLANDS/VEGETATION
Wetland types/habitats
(Level 2- 5) Coding
Wetland types/habitats (Level
2- 5) Coding
Wetland types/habitats
(Level 2- 5) Coding
Wetland types/habitats (Level 2- 5) Coding
subtidal/permanent flooding neutral/permanent flooding neutral/permanent flooding
non-vegetated deep pool RRa wet grassland/marsh (nature) FW1
bare - rocky/consolidated MS1a bare - rocky/consolidated ES1a natural channel RRb wet grassland/marsh (manmade) FW1m
bare - unconsolidated MS1b bare - unconsolidated ES1b artificial channel RRbm rice/agriculture (recession) FW2rr
mariculture MS1dm mariculture ES1dm rapid/riffles RRc rice/agriculture (rainfed) FW2rf
salt works MN1im salt works ES1im waterfall RRd rice/agriculture (irrigated) FW2i
coral and vegetated thermal spring RRe swamp/woody scrub FW3
coral MS2a coral ES2a subterranean spring/stream RRf swamp/woody scrub (introduced/alien species) FW3m
artificial coral MS2am artificial coral ES2am temporary flooding Emergent woody scrub FW3a
seagrass MS2b seagrass ES2b deep pool RRta flooded forest (nature) FW4
seaweed MS2c seaweed ES2c natural channel RRtb flooded forest (plantation) FW4m
seaweed farm MS2cm seaweed farm ES2cm artificial channel RRtbm other wet crops FW5
mariculture MS2dm aquaculture ES2hm rapid/riffles RRtc other wet crops (irrigated) FW5m
watercourse MS3 watercourse ES3 waterfall RRtd peatlands: bryophytes/sedges/rushes FW6
intertidal/temporary flooding thermal spring RRte Peatlands: woody shrubs/trees FW6a
non-vegetated subterranean spring/stream RRtf temporary flooding
beach/sandy MI1c beach/sandy EI1c wet grassland/marsh (nature) FWt1
mudflat/silty MI1d mudflat/silty EI1d BEACH/BANK/BAR/ROCKY wet grassland/marsh (manmade) FWt1m
cliff/rocky MI1f cliff/rocky EI1f beach/bank/bar RB rice/agriculture (recession) FWt2rr
tidal pool MI1g tidal pool EI1g rocky outcrop RK rice/agriculture (rainfed) FWt2rf
salt works MI1im salt works EI1im rice/agriculture (irrigated) FWt2i
aquaculture MI1hm aquaculture EI1hm LAKE swamp/woody scrub FWt3
coral and vegetated Lake > 8 ha swamp/woody scrub (introduced/alien species) FWt3m
coral MI2a coral EI2a neutral flooding Emergent woody scrub FW3at
artificial coral MI2am artificial coral EI2am natural LL flooded forest FWt4
seagrass MI2b seagrass EI2b manmade LLm flooded forest (plantation) FWt4m
seaweed MI2c seaweed EI2c temporary flooding other wet crops FWt5
seaweed farm MI2cm seaweed farm EI2cm LLt - natural LLt other wet crops (irrigated) FWt5m
mangrove/forest MI2d mangrove/forest EI2d LLtm - manmade LLtm
mangrove/plantation MI2dm mangrove/plantation EI2dm pond/lake < 8 ha
saltmarsh/forbs MI2e saltmarsh/forbs EI2e neutral flooding
agriculture MI2jm agriculture EI2jm natural LP
Marine - lagoon ML other EI2k manmade LPm
aquaculture LPma
sewage treatment LPmb
farm LPmc
cooling LPmd
borrow pit/quarry Lpme
other LPmf
temporary flooding
natural LPt
manmade LPtm
Saline lake > 8 ha LS

__________________________________________________________________________________
73
Annex B: Ramsar Classification
Related Documents

![CS 377 Project 1 Conceptual Design [Updated]](https://static.cupdf.com/doc/110x72/55612d72d8b42a70718b56e6/cs-377-project-1-conceptual-design-updated.jpg)