Western Michigan University Western Michigan University ScholarWorks at WMU ScholarWorks at WMU Dissertations Graduate College 6-2014 Conceptual Framework Alignment between Primary Literature and Conceptual Framework Alignment between Primary Literature and Education in Animal Behaviour Education in Animal Behaviour Andrea Marie-Kryger Bierema Western Michigan University, [email protected] Follow this and additional works at: https://scholarworks.wmich.edu/dissertations Part of the Curriculum and Instruction Commons, Higher Education Commons, and the Science and Mathematics Education Commons Recommended Citation Recommended Citation Bierema, Andrea Marie-Kryger, "Conceptual Framework Alignment between Primary Literature and Education in Animal Behaviour" (2014). Dissertations. 272. https://scholarworks.wmich.edu/dissertations/272 This Dissertation-Open Access is brought to you for free and open access by the Graduate College at ScholarWorks at WMU. It has been accepted for inclusion in Dissertations by an authorized administrator of ScholarWorks at WMU. For more information, please contact [email protected].

Welcome message from author
This document is posted to help you gain knowledge. Please leave a comment to let me know what you think about it! Share it to your friends and learn new things together.
Transcript
Western Michigan University Western Michigan University
ScholarWorks at WMU ScholarWorks at WMU
Dissertations Graduate College
6-2014
Conceptual Framework Alignment between Primary Literature and Conceptual Framework Alignment between Primary Literature and
Education in Animal Behaviour Education in Animal Behaviour
Andrea Marie-Kryger Bierema Western Michigan University, [email protected]
Follow this and additional works at: https://scholarworks.wmich.edu/dissertations
Part of the Curriculum and Instruction Commons, Higher Education Commons, and the Science and
Mathematics Education Commons
Recommended Citation Recommended Citation Bierema, Andrea Marie-Kryger, "Conceptual Framework Alignment between Primary Literature and Education in Animal Behaviour" (2014). Dissertations. 272. https://scholarworks.wmich.edu/dissertations/272
This Dissertation-Open Access is brought to you for free and open access by the Graduate College at ScholarWorks at WMU. It has been accepted for inclusion in Dissertations by an authorized administrator of ScholarWorks at WMU. For more information, please contact [email protected].
CONCEPTUAL FRAMEWORK ALIGNMENT BETWEEN PRIMARY LITERATURE
AND EDUCATION IN ANIMAL BEHAVIOUR
by
Andrea Marie-Kryger Bierema
A dissertation submitted to the Graduate College
in partial fulfillment of the requirements
for the degree of Doctor of Philosophy
Mallinson Institute for Science Education
Western Michigan University
June 2014
Doctoral Committee
Renee’ S. Schwartz, Ph.D., Chair
Brandy A. Skjold, Ph.D.
Sharon A. Gill, Ph.D.
CONCEPTUAL FRAMEWORK ALIGNMENT BETWEEN PRIMARY LITERATURE
AND EDUCATION IN ANIMAL BEHAVIOUR
Andrea Marie-Kryger Bierema, Ph.D.
Western Michigan University, 2014
In 1963, Tinbergen revolutionized the study of animal behaviour in his paper On
aims and methods of ethology (Zeitschrift Tierpsycholgie, 20, 410-433) by revamping the
conceptual framework of the discipline. His framework suggests an integration of four
questions: causation, ontogeny, survival value, and evolution. The National Research
Council Committee (U.S.) on Undergraduate Biology Education to Prepare Research
Scientists for the 21st Century published BIO2010: Transforming Undergraduate
Education for Future Research Biologists (Washington, DC: The National Academies
Press, 2003), which suggests alignment between current research and undergraduate
education. Unfortunately, alignment has been rarely studied in college biology, especially
for fundamental concepts. The purpose of this study, therefore, is to determine if the
conceptual framework used by animal behaviour scientists, as presented in current
primary literature, aligns with what students are exposed to in undergraduate biology
education. After determining the most commonly listed textbooks from randomly-
selected animal behaviour syllabi, four of the most popular textbooks, as well as the
course descriptions provided in the collected syllabi, underwent content analysis in order
to determine the extent that each of Tinbergen’s four questions is being applied in
education. Mainstream animal behaviour journal articles from 2013 were also assessed
via content analysis in order to evaluate the current research framework. It was
discovered that over 80% of the textbook text covered only two of Tinbergen’s questions
(survival value and causation). The other two questions, evolution and ontogeny, were
rarely described in the text. A similar trend was found in journal articles. Therefore,
alignment is occurring between primary literature and education, but neither aligns with
the established conceptual framework of the discipline. According to course descriptions,
many instructors intend to use an integrated framework in their courses. Utilizing an
integrated framework within textbooks and teaching this framework is recommended in
order to increase the number of scientists in the next generation that study evolution and
ontogeny of behaviour. In order to use an integrated framework in animal behaviour
textbooks and courses primary literature from mainstream and less mainstream behaviour
journals, as well as broader biology journals, are necessary.

Copyright by
Andrea Marie-Kryger Bierema
2014
ii
ACKNOWLEDGEMENTS
There are several people that I personally thank for their assistance and guidance.
I thank my committee chair, Dr. Renee’ Schwartz. She pushed me to excel while in the
program. Although I originally thought that my Chapter 2 was going to be way too broad,
I trusted her and she led me in the right direction. I also have a lot to thank her for that
goes beyond my dissertation, such as the several national conferences in which I
presented. Moreover, I thank my committee members, Dr. Brandy Skjold and Dr. Sharon
Gill. Brandy provided a unique perspective as she recently finished her dissertation.
Sharon taught me a great deal about the discipline of animal behaviour. Moreover, I give
her special recognition for helping me code textbooks, course descriptions, and articles in
order to check for inter-coder reliability. She really went above and beyond as a
committee member.
I also thank my department, Mallinson Institute for Science Education.
Throughout the program, I learned a great deal regarding the theoretical framework,
including what a theoretical framework even is, and the methods that I used in this study.
Moreover, I thank the department and Dr. Jacqueline Mallinson for their financial
assistance. Heather White, the office coordinator, was also of great help with taking care
of all of the endless paperwork. The Writing Center at Western Michigan University,
especially Kim Ballard, was also extremely helpful in providing a different perspective
on content analysis. The statistician consultant provided through the Graduate College
gave excellent suggestions for how to analyze the results.
iii
Acknowledgements—Continued
The textbook publishers provided free textbooks, and I thank them for that.
Additionally, I am appreciative of the many professors who took the time to send me
their course syllabi- especially those that were out in the field at the time doing their own
research. Many were very interested in my dissertation, which provided me further
motivation to move forward.
Finally, I thank my family. I thank my parents, who have stayed positive through
my many years of working on my degrees. I thank my husband, Brad Bierema, for being
patient with my late hours typing on the computer and coding textbooks and articles.
Also, I thank him for his positive attitude and motivation to press on with my doctoral
program and dissertation. I also thank my step-children, Gavin and Caitlin, especially my
step-daughter who blinded three of the four textbooks for me- she did a fantastic job and I
would not have been able to continue my work without her help. My husband blinded the
fourth, which I am also extremely thankful. Lastly, I thank my dog, Pumba, who kept me
company and my feet warm while I sat at the computer.
Andrea Marie-Kryger Bierema
iv
TABLE OF CONTENTS
ACKNOWLEDGEMENTS ........................................................................................ ii
LIST OF TABLES .................................................................................................... vii
LIST OF FIGURES .................................................................................................... ix
I. INTRODUCTION .............................................................................................. 1
Animal Behaviour Conceptual Framework ................................................... 1
Trends in Animal Behaviour .......................................................................... 6
Statement of the Problem ............................................................................... 9
Purpose of Study .......................................................................................... 11
Significance of Study ................................................................................... 12
Research Questions ...................................................................................... 13
Overview of Methods .................................................................................. 14
Delimitations and Limitations of the Study ................................................. 15
Definitions of Key Terms ............................................................................ 16
Biological Terms ...................................................................................... 16
Methods Terms ........................................................................................ 18
Chapter One Summary ................................................................................. 19
II. LITERATURE REVIEW OF COLLEGE BIOLOGY CURRICULAR
RESOURCES ................................................................................................... 21
Textbooks ..................................................................................................... 21
Topics in Textbooks ................................................................................. 22
Textbook Features .................................................................................... 42
Textbook Selection .................................................................................. 59
Textbook Impact on Students .................................................................. 61
Conclusion ............................................................................................... 78
Laboratory Manuals ..................................................................................... 78
Trade Books ................................................................................................. 83

v
Table of Contents‒Continued
CHAPTER
Primary Literature ........................................................................................ 87
Uses of Primary Literature ....................................................................... 88
Student Perceptions .................................................................................. 93
Student Performance .............................................................................. 102
Conclusion ............................................................................................. 103
Videos …………………………………………………………………….104
Animations ................................................................................................. 111
Simulations ................................................................................................ 143
Podcasts...................................................................................................... 177
Course Web Sites ....................................................................................... 192
Other Curricular Resources ........................................................................ 206
Conclusion ................................................................................................. 214
III. METHODS ................................................................................................... 216
Resource Selection ..................................................................................... 218
Syllabus Selection .................................................................................. 218
Textbook Selection ................................................................................ 219
Primary Literature Selection .................................................................. 219
Content Analysis ........................................................................................ 220
Identification of Intended Conceptual Framework .................................... 221
Extent of Tinbergen’s Four Questions ....................................................... 224
Textbook Coding ................................................................................... 225
Journal Article Coding ........................................................................... 228
Alignment .................................................................................................. 230
Blinding Process ........................................................................................ 231
Reliability ................................................................................................... 231
IV. RESULTS .................................................................................................... 236
vi
Table of Contents‒Continued
CHAPTER
Syllabi …………………………………………………………………….236
Textbooks ................................................................................................... 238
Textbook #1: Alcock, 2013 ................................................................... 240
Textbook #2: Dugatkin, 2013 ................................................................ 242
Textbook #3: Breed and Moore, 2012 ................................................... 245
Textbook #4: Drickamer et al., 2002 ..................................................... 247
Textbook Comparison ............................................................................ 249
Course Descriptions ................................................................................... 252
Alignment within Education ...................................................................... 256
Primary Literature ...................................................................................... 258
V. CONCLUSIONS AND IMPLICATIONS .................................................... 263
Conclusions ................................................................................................ 263
Alignment between Primary Literature and Education ......................... 263
Mayr’s Proximate and Ultimate Causation Framework ........................ 267
Implications................................................................................................ 271
Implications for Animal Behaviour Curriculum Developers ................ 271
Implications for Animal Behaviour Instructors ..................................... 273
Implications for Science Education Researchers ................................... 274
REFERENCES ................................................................................................... 280
APPENDICES
A. HSIRB Approval Request .................................................................... 294
B. HSIRB Letter........................................................................................ 296
C. Intended Framework Codes ................................................................. 298
vii
LIST OF TABLES
1. Topics examined via content analysis which are listed in chronological order. .......... 23
2. Published articles on the use of primary literature in the college biology classroom
listed in chronological order. ...................................................................................... 89
3. Topics of videos and online photographs discussed in the primary literature in
chronological order. .................................................................................................. 105
4. Primary literature articles on the use of animations. .................................................. 111
5. Primary literature articles on the use of simulations. ................................................. 144
6. Published examples of how podcasts have been integrated into the college biology
classroom. ................................................................................................................. 179
7. Published examples of how course web sites have been integrated into the college
biology classroom. .................................................................................................... 192
8. Other curricular resources and their purpose or general topic. .................................. 207
9. List of research questions and the respective data sources that were collected to
answer the questions. ................................................................................................ 217
10. Coding dictionary for Tinbergen’s four questions. ................................................... 223
11. Percentage of resources that was checked for reliability. ........................................ 232
12. Percentage consistency for inter-coder and intra-coder reliability for textbook text.232
13. Percentage consistency for inter-coder and intra-coder reliability for each
resource, excluding textbook text. ............................................................................ 232
14. Order of coverage for each textbook. ....................................................................... 251
viii
List of Tables‒Continued
15. Number of syllabi for each listed framework divided by if the syllabus explained
coverage of ultimate and proximate causation (columns) and separated by which
of Tinbergen's questions were/was expected to be covered (rows). ......................... 253
16. Listed textbooks from syllabi for each listed syllabus framework divided by if the
syllabus explained coverage of ultimate and proximate causation (columns) and
separated by which of Tinbergen's questions were/was expected to be covered
(rows). ....................................................................................................................... 257
ix
LIST OF FIGURES
1. The relationship between Mayr's (1961) and Tinbergen's (1963) conceptual
frameworks. .................................................................................................................. 5
2. Expected conceptual framework alignment between resources. ................................. 10
3. Data sources used for finding the intended conceptual framework of journal
editors, textbook authors, and course instructors. ..................................................... 222
4. Data sources used for finding the extent of use of Tinbergen's four questions. ........ 225
5. Syllabi totals for first-listed textbook (n = 99). ......................................................... 238
6. Percentage of textbook coverage of Tinbergen's four questions. .............................. 239
7. Percentage of textbook coverage of Mayr's ultimate and proximate causation. ........ 239
8. The coverage of Tinbergen's four questions for the three main parts (intended
coverage labeled for each part) of Alcock's (2013) textbook. .................................. 241
9. Percentage of text covering each of Tinbergen's questions for Chapters 2 through 6
of Dugatkin's (2013) textbook with intended coverage below chapter numbers. ..... 244
10. Coverage of Tinbergen’s questions for Chapters 7 through 17 of Dugatkin's
(2013) textbook. ........................................................................................................ 244
11. Percentage of text covering each of Tinbergen's questions for Chapters 2 through
8 of Breed’s and Moore’s (2012) textbook with intended coverage below chapter
numbers. .................................................................................................................... 246
12. Coverage of Tinbergen’s questions for Chapters 9 through 14 of Breed’s and
Moore’s (2012) textbook. ......................................................................................... 247
x
List of Figures‒Continued
13. The coverage of Tinbergen's four questions for four of the five main parts since
Part 1 covered an introduction to animal behaviour (intended coverage labeled for
each part) of Drickamer’s et al. (2002) textbook. ..................................................... 248
14. Proportion of literature answering Tinbergen's questions. ....................................... 258
15. Proportion of the literature answering Tinbergen's questions, for each journal. ...... 259
16. Proportion of literature describing (in introduction, goals, and/or implications)
Tinbergen's questions. ............................................................................................... 260
17. Proportion of the literature describing (in introduction, goals, and/or implications)
Tinbergen's questions, for each journal. ................................................................... 260
18. The percentage of articles that answered and described one, two, three, or four of
Tinbergen's questions. ............................................................................................... 262
19. Proportion of review literature reviewing Tinbergen's questions. ............................ 262
20. Extent of alignment between primary literature, education, and the intended
framework. ................................................................................................................ 276
1
CHAPTER I
INTRODUCTION
Animal Behaviour Conceptual Framework
The study of animal behaviour is a relatively new discipline of biology but has its
roots in the work done by naturalists. Traditionally, naturalists primarily identified and
described various species. Some naturalists began to make field observations about the
behaviour that they were witnessing, which was the beginning of the modern discipline.
One of the promoters of field observations, who is also considered as one of the fathers of
modern animal behaviour (Tinbergen, 1963), was Julian Huxley. He suggested that field
observations on behaviour would provide much more new information to the discipline of
zoology and help increase our scientific knowledge in addition to continuing
documentation and classification of new species (1914). Moreover, he also advised
empirical research be done in studying behaviour.
Not only did Huxley promote observing behaviour in the field, but he also began
to lay the foundation for the main questions of animal behaviour. He suggested that in
order to understand a behaviour, biologists should study three questions:
1. Causation: How does a behaviour occur? For instance, what triggers the
display of tail feathers in the male peacock?
2. Survival Value: How does the behaviour affect survival and reproductive
success? For instance, does the tail feather display impact the number of
mating opportunities?
2
3. Evolution: Why did the behaviour evolve? For instance, did the ancestor
of the peacock also exhibit tail feather displays?
Forty years later, Niko Tinbergen (1963) added another question to the study of
animal behaviour. In addition to causation, survival value, and evolution, he added
ontogeny: how did the behaviour develop during an individual’s lifetime? In keeping
with the peacock example, this question could ask: at what age do male peacocks begin to
display their tail feathers? Another possible question is: is performing the display a
learned behaviour? All four questions are now referred to as “Tinbergen’s questions.” For
simplicity purposes, in this paper, we will simply refer to each question as causation,
ontogeny, survival value, or evolution.
In addition to adding a fourth question, Tinbergen (1963) argued that “…it is
useful both to distinguish between them [the four questions] and to insist that a
comprehensive, coherent science of Ethology has to give equal attention to each of them
and to their integration” (p. 411). In other words, these four questions should be
represented evenly in the literature. Although it is unlikely that all four questions are
answered in a single research article, in examining the literature over time, the trend
should be that there are a relatively equal number of articles pertaining to each question.
Moreover, study implications should address Tinbergen’s other questions that are not
being answered in the current article, and review articles regarding specific types of
behaviour should attempt to answer all four questions, if the primary research is
available. Since Tinbergen’s time, research from people that call themselves behavioural
ecologists or ethologists (ethology is the study of animal behaviour, but not everyone that
studies behaviour refers to themselves as ethologists) as well as psychologists contribute
3
to the field of animal behaviour, yet synthesis of information between these groups of
scientists rarely occurs. Therefore, Tinbergen (1963) predicted that the discipline was
going to break apart into smaller disciplines if it was not soon united. With this
integration in mind, Tinbergen (1963) even suggested that the field should be renamed
the “biology of behaviour” (p. 30).
Since Tinbergen’s (1963) publication titled On Aims and Methods of Ethology, he
has been recognized by not only the animal behaviour community but by the larger
scientific community. In 1973, the Nobel Prize in Physiology or Medicine was awarded
to three ethologists, including Tinbergen. This was the first time a Nobel Prize had been
awarded to ethologists, solidifying the study of animal behaviour as a scientific discipline
(Strassmann, 2014). As Tinbergen stated in the introduction of his Nobel lecture “Many
of us have been surprised at the unconventional decision of the Nobel Foundation to
award this year’s prize ‘for Physiology or Medicine’ to three men who had until recently
been regarded as ‘mere animal watchers’” (p. 113).
The integration of the four questions has also more recently been suggested by
other scientists. For instance, MacDougall-Shackleton (2011), who studies songbirds,
recommended that since these four questions are not mutually exclusive, they should not
compete with one another. Instead, these questions should be integrated when studying a
behaviour since results found in regards to one of Tinbergen’s questions, or level of
analysis as he described, can provide more information or new directions to another
(MacDougall-Shackleton, 2011). Laland et al. (2011) and MacDougall-Shackleton (2011)
suggested that scientists should collaborate more often, which would decrease the number
of debates among scientists with different backgrounds. For example, if the survival
4
value of a particular behaviour is studied and it appears that the behaviour is maladaptive,
such as an over-consumption of food, then answering the other questions may help
explain why the behaviour exists (Dawkins, 2013). As Tinbergen (1963) argued,
integration would help unite the discipline of animal behaviour.
Moreover, Tinbergen’s four questions and the integrated use of these four
questions are also pushed by current grant solicitations, such as from the National
Science Foundation (NSF). The Animal Behavior Program of the (NSF) states that
“Research in this area…covers a wide range of scientific fields and levels of analysis to
study the development, mechanisms, adaptive value, and evolutionary history of
behavior” (n.d., Synopsis section, para. 1). Furthermore, “the cluster encourages… [to]
explore overarching principles of the biology of behavior and to advance a fully
integrated understanding of the behavioral phenotype from genes to ecosystems” (n.d.,
Synopsis section, para. 1).
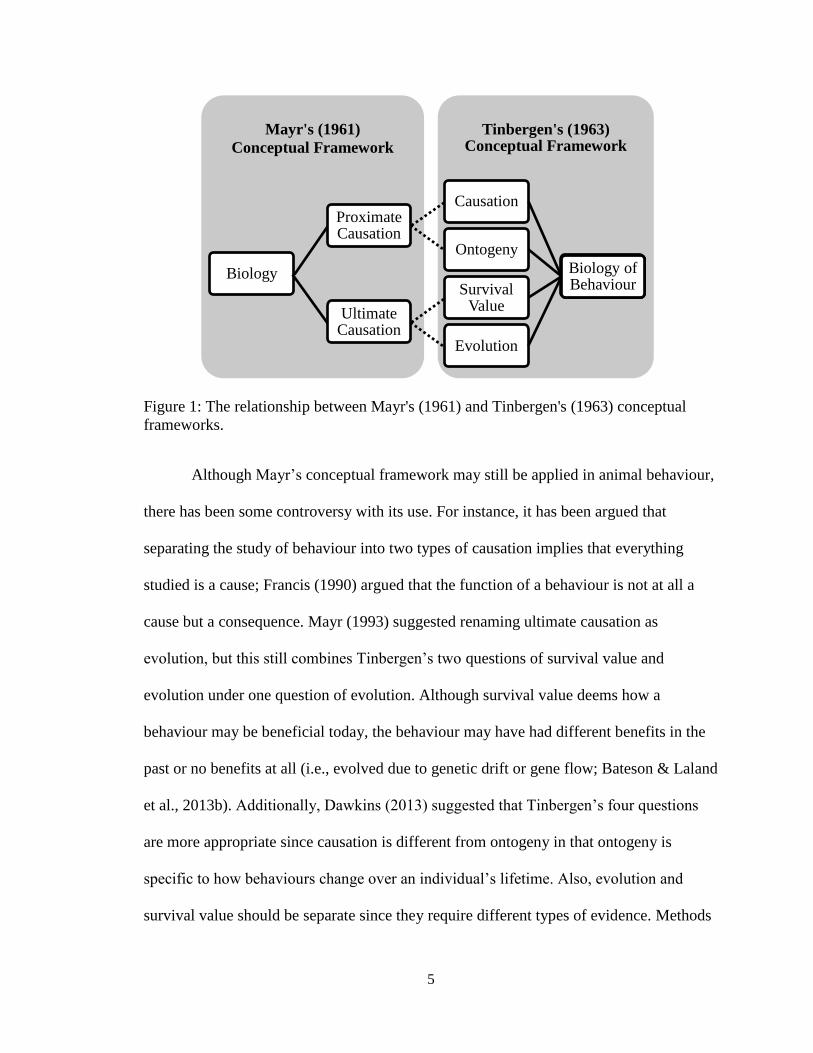
Another conceptual framework for animal behaviour that is still used today was
described before Tinbergen’s framework, although Tinbergen did not acknowledge it in
his 1963 paper. This division separates the discipline into two main questions: proximate
and ultimate causation. Causation was one of Tinbergen’s (1963) four questions;
however, from his description, he was really referring to proximate causation (Hogan,
2009). Proximate causation reflects on what immediately caused the behaviour, such as
the genetics, hormones, neurons (Tinbergen’s causation) or development (ontogeny),
while ultimate causation refers to why the behaviour may exist (i.e., survival value) or
why it evolved (Mayr, 1961; see Figure 1).
5
Figure 1: The relationship between Mayr's (1961) and Tinbergen's (1963) conceptual
frameworks.
Although Mayr’s conceptual framework may still be applied in animal behaviour,
there has been some controversy with its use. For instance, it has been argued that
separating the study of behaviour into two types of causation implies that everything
studied is a cause; Francis (1990) argued that the function of a behaviour is not at all a
cause but a consequence. Mayr (1993) suggested renaming ultimate causation as
evolution, but this still combines Tinbergen’s two questions of survival value and
evolution under one question of evolution. Although survival value deems how a
behaviour may be beneficial today, the behaviour may have had different benefits in the
past or no benefits at all (i.e., evolved due to genetic drift or gene flow; Bateson & Laland
et al., 2013b). Additionally, Dawkins (2013) suggested that Tinbergen’s four questions
are more appropriate since causation is different from ontogeny in that ontogeny is
specific to how behaviours change over an individual’s lifetime. Also, evolution and
survival value should be separate since they require different types of evidence. Methods
Tinbergen's (1963) Conceptual Framework
Mayr's (1961)
Conceptual Framework
Biology
Proximate Causation
Causation
Ontogeny
Ultimate Causation
Survival Value
Evolution
Biology of Behaviour
6
for studying evolution often include phylogenetic analysis; whereas, survival value can
be studied via observations or experiments.
Moreover, the use of Mayr’s (1961) division may not only promote the separation
of the discipline, which was what Tinbergen was working to avoid (Dewsbury, 1994;
Laland et al., 2013), but it may also imply a lack of connection of animal behaviour to
other disciplines (Laland et al, 2011). Therefore, Tinbergen’s four questions, including
their integration, should remain as the framework of the entire discipline of animal
behaviour (Dewsbury, 1994), although there has been some recent controversy over the
labels given to each question. For instance, survival value suggests that only survival, not
reproductive success, is important in determining why a behaviour exists. Other terms
such as “current utility” (Bateson & Laland, 2013a, 2013b) or “adaptive significance”
(Nesse, 2013) may be more appropriate as they recognize the importance of reproductive
success. Moreover, “mechanism” may be more appropriate than “causation” since causes
can include developmental history (Bateson and Laland, 2013a). Evolution can also be
confusing since the term sometimes includes both survival value and evolution; therefore,
“phylogeny” may be more appropriate (Nesse, 2013). In recognition of Tinbergen’s
work, this dissertation continues to use the terms “survival value,” “causation,”
“evolution,” and “ontogeny.”
Trends in Animal Behaviour
Although Tinbergen (1963) advocated for the integration of the four main
questions within the discipline, research suggests that the questions are not utilized
equally. Instead, one or two of the main four questions may be popular for certain lengths
7
of time. For example, Hogan (2009) performed an analysis on articles published in the
journal Animal Behaviour from 1963 to 2003. He coded each article with one of
Tinbergen’s questions. Then he examined the pattern of 10-year intervals. He found that
most articles, no matter the decade, covered either causation or survival value; very few
of the articles related to ontogeny or evolution. Because of this pattern, Hogan (2009)
categorized the few articles found regarding development as causation and the few on
evolution as survival value, similar to Mayr’s framework of proximate and ultimate
causation. In examining trends over time, he discovered that proximate causation (i.e.,
Tinbergen’s causation and ontogeny) were most popular (about 90% of the articles) in the
1960’s and early 1970’s. Tinbergen (1963) did suggest that most of the research
completed during the time of his publication was on causation. In the mid-1970’s, a shift
occurred in the research when ultimate causation (i.e., survival value and evolution)
became more popular; by the 1990’s about 80% of the research was on ultimate
causation. Ord et al. (2005), which used library databases and 25 journals related to
animal behaviour to examine the trends for the last 30 years (1963 to 2003), also
concluded that the number of articles related to survival value and evolution has
increased over time, but causation and ontogeny were still most popular. In other words,
the two sets of questions were fairly equally represented in the literature; therefore, they
concluded that the discipline of animal behaviour was becoming more integrated.
Anecdotally, Bateson and Laland (2013b) and Barrett et al. (2013) suggested that survival
value is researched much more often than causation, while Taborsky (2014) proposed
that a more integrated framework is being utilized. Whether or not survival value and
causation are equally applied in research, rarely have all four questions been answered
8
regarding a single behaviour (Bateson & Laland, 2013b). Barrett et al. (2013) argue that,
with new technologies, this trend may be disappearing and researchers may be more
likely to incorporate multiple questions into one study.
Similar trends may have also occurred in textbooks. Alcock (2003)- although he
separated the four main questions into proximate and ultimate causation- suggested that
research on proximate causation (i.e., Tinbergen’s causation and ontogeny) was popular
in textbooks until 1975, when ultimate causation (i.e., survival value and evolution)
gained ground in textbooks. However, methods describing textbook selection were
limited and therefore, may not be representative of all textbooks, although Alcock is the
author of the most commonly-used animal behaviour textbook (Burton, 2011; current
study).
Moreover, Alcock (2003) described in his article why the emphases occurred at
these specific times. The nature versus nurture debate was quite heated until the 1970’s.
During the time of this debate, many studies on causation, such as on genetics causing a
behaviour, and ontogeny, such as learning a behaviour, were being published in order to
resolve the nature versus nurture debate. As it began to be clear that the concept should
not be nature versus nurture, but instead behaviours are typically influenced by a
combination of both nature (genetics) and nurture (ontogeny), a shift occurred in the
discipline. This happened in mid-1970. At this time, new questions arose, such as if
natural selection acts on an individual or the species; in other words, do individuals
display behaviours for the good of the species? With this question in mind, studies on
survival value and evolution became popular. Unfortunately, this study was published in
2003 and does not reflect the trends of the 21st century.
9
Statement of the Problem
The American Association for the Advancement of Science (AAAS, 2010) stated
in their Vision and Change in Undergraduate Biology Education report that alignment
between biological undergraduate education and current research should exist. However,
according to the National Research Council Committee (NRC, U.S.) on Undergraduate
Biology Education to Prepare Research Scientists for the 21st
Century (2003), biology
curricula are not portraying current biological research frameworks, methods, and
findings and instead are teaching future biologists biology geared toward the past. The
committee recommends updating the curriculum, including curricular resources such as
textbooks, to reflect our current understandings of biology. This basis includes both
classical research that has set the current foundation and recent research that has
increased our understanding of the current science. Even AAAS (2010) acknowledges the
limitation of current textbooks by suggesting that instructors go beyond the textbook and
include primary literature in the curriculum.
Although the NRC (2003) committee suggests that older scientific frameworks
are being taught in the classroom, there is little published regarding textbooks, which
often form the basis of curriculum (detailed review provided in Chapter 2). Of the studies
published on college biology textbooks, most examined specific topics such as aging
(Krupka et al., 1980), Down syndrome (Bordson & Bennett, 1983), and pneumococcal
type transformation (Baxby, 1989) instead of the discipline’s fundamentals, such as cell
theory. Furthermore, often the design of the study was either poorly created or described.
For instance, rarely did any study attempt to validate the selection of their textbooks
beyond choosing textbooks for a specific type of course (e.g., Baxby, 1989; Blackwell &
10
Powell, 1995; Bordson & Bennett, 1983; Duncan et al., 2011; Gibbs & Lawson, 1992;
Hughes, 1982). Some studies also provided little information on the coding process (e.g.,
Baxby, 1989; Hughes, 1982). Additionally, in a literature search, nothing was found
regarding how fundamental topics are portrayed in syllabi, another important curricular
resource. Therefore, there is a need to examine commonly-used resources, such as
textbooks and course syllabi, to better understand how well they align with current
scientific practices.
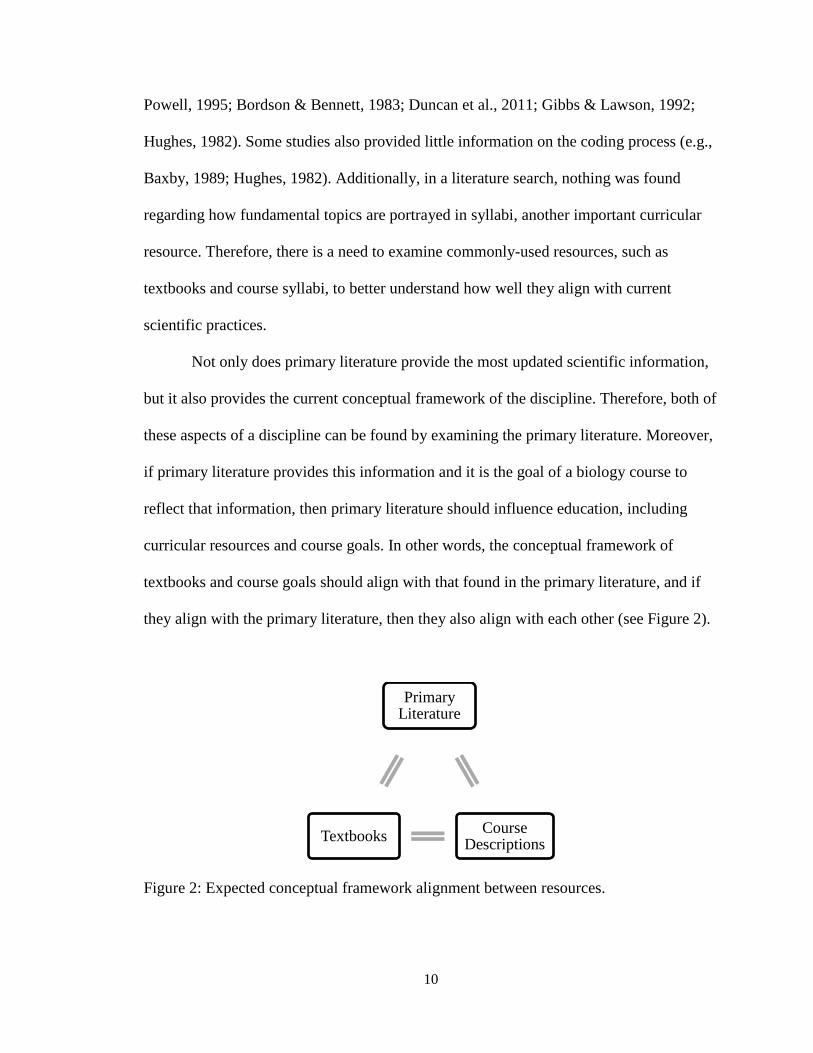
Not only does primary literature provide the most updated scientific information,
but it also provides the current conceptual framework of the discipline. Therefore, both of
these aspects of a discipline can be found by examining the primary literature. Moreover,
if primary literature provides this information and it is the goal of a biology course to
reflect that information, then primary literature should influence education, including
curricular resources and course goals. In other words, the conceptual framework of
textbooks and course goals should align with that found in the primary literature, and if
they align with the primary literature, then they also align with each other (see Figure 2).
Figure 2: Expected conceptual framework alignment between resources.
Primary Literature
Course Descriptions
Textbooks
11
Purpose of Study
In order to study the relationship between primary literature and education further,
the conceptual framework for the discipline of animal behaviour was examined in the
primary literature, textbooks, and syllabi course descriptions. This study examined to
what extent Tinbergen’s four questions are being used within textbook content and
journal articles. Furthermore, it studied if Tinbergen’s (1963) and/or Mayr’s (1961)
conceptual framework is explicitly described by journal editors, textbook authors, and
course instructors. Although the literature has criticized the use of Mayr’s (1961)
framework, Mayr’s framework, nevertheless, is still used in behaviour, and, therefore, is
included in this study.
If alignment of the conceptual framework does occur between the primary
literature and education resources (i.e., textbooks and course descriptions), then
undergraduates are being exposed to the current research framework of animal behaviour
and the recommendations made by AAAS (2010) are met. The study of animal behaviour
was selected for this project since it is a sub-discipline of biology that is more likely to
contain future biologists and no other majors, such as medical majors, in their
classrooms. Additionally, the conceptual framework, as described earlier, was established
50 years ago and is still considered relevant for the present. Moreover, although the
framework was developed for animal behaviour, it can also be utilized in other biology
fields to study nearly any phenotype (Bateson & Laland, 2013b), so findings from the
current study might be significant for other disciplines.
12
Significance of Study
This study estimates the degree of alignment of the conceptual framework
between primary literature and education. Both the National Research Council
Committee (U.S.) on Undergraduate Biology Education to Prepare Research Scientists
for the 21st Century (2003) and AAAS (2010) suggest that alignment should occur
between the current research and undergraduate education, including its conceptual
framework. If alignment occurs in the discipline of animal behaviour between primary
literature, which are publications of authentic research, and undergraduate textbooks and
course descriptions, then the goals of the committee are being met in this particular
discipline. If not, then the committee suggests that curriculum be updated so that courses
can effectively prepare future scientists. In other words, changes in education will be
necessary, which could include changing textbooks and/or making professors aware that
the current frameworks of their courses are not preparing future biologists.
Additionally, this study aids in understanding what instructors can use in
evaluating the framework of textbooks. The textbook preface and first chapter were
coded in order to determine the intended coverage of Tinbergen’s questions in each
textbook. If, for instance, the description in each textbook preface and first chapter align
with the actual coverage, then instructors can use the textbook preface to determine the
conceptual framework of the textbook. If the preface and first chapter do not align with
the text, then instructors should study textbooks in more depth than just examining the
preface and first chapter before determining if a textbook meets their intended conceptual
framework.
13
Research Questions
The overarching research question for the present study is: to what extent do the
conceptual frameworks of the primary literature for animal behaviour align with
undergraduate biology education (i.e., textbooks and course descriptions)? In order to
study this question, several other research questions needed to be addressed.
Which conceptual framework do instructors from the United States acknowledge
and intend to use in their animal behaviour courses?
Which conceptual frameworks are textbook authors intending to use in their
textbooks?
Which conceptual frameworks are journal editors intending to use in the animal
behaviour journals, Animal Behaviour, Behavioral Ecology, Behavioral Ecology
and Sociobiology, Ethology, and Behaviour?
To what extent are Tinbergen’s four questions being applied in popular animal
behaviour textbooks?
To what extent do the animal behaviour instructors’ intended frameworks align
with their chosen textbooks and selected textbook chapters?
To what extent are Tinbergen’s four questions being applied in the animal
behaviour journals, Animal Behaviour, Behavioral Ecology, Behavioral Ecology
and Sociobiology, Ethology, and Behaviour?
To what extent do the preface and first chapter reflect the conceptual framework
of the text of the textbook?

14
Overview of Methods
Syllabi were collected from 99 randomly-selected instructors of animal behaviour
courses from the United States in order to determine which textbooks are most commonly
utilized. Course descriptions, from syllabi, and textbooks underwent content analysis in
order to determine which framework and the extent that each of Tinbergen’s four
questions is being applied in undergraduate biology education. Deductive or directed
content analysis was employed in order to code the text using predetermined themes
(Berg, 2009; Elo & Kyngäs, 2007). The textbook preface and introductory chapter were
analyzed in order to determine if the frameworks portrayed in the text align with the
intended framework of the textbook author(s). Journal aim and scope and all research and
review articles from the past year (2013) of the journals Animal Behaviour, Behavioral
Ecology, Behavioral Ecology and Sociobiology, Ethology, and Behaviour were also
assessed via content analysis in order to evaluate the utilized framework. Finally, the
frameworks of the textbooks and course descriptions were compared to those found
within the primary literature. This process aided in determining to what extent the
conceptual frameworks of the primary literature align with what students are exposed to
in undergraduate biology education, which is the main goal of this study. The results of
this study assisted in determining if undergraduate education is preparing students to
become scientists that will contribute to the field of animal behaviour.
15
Delimitations and Limitations of the Study
Although this study provided a much more in depth understanding of the
alignment between primary literature and education, there were also several delimitations
and limitations of the current study. For one, only syllabi from the United States were
selected; therefore, this study can only be generalized to animal behaviour courses taught
in the United States. On the other hand, the journals selected are available worldwide and
should represent the most recent overall trends in animal behaviour research.
Additionally, although various journals were selected, not all articles that involve
animal behaviour research was assessed. Other journal articles may also provide
important findings to the discipline of animal behaviour. However, mainstream
discipline-specific journals were of interest because they are intended to appeal to the
entire discipline of animal behaviour. Of the journals specific to animal behaviour
(described in Ord et al., 2005), these five particular journals were selected since they
have the highest five-year impact factor (according to ISI Web of Knowledge Journal
Citation Reports for 2012). Moreover, articles were assessed manually, not by online
database engine tools, which limited the number of articles that could be assessed.
Another aspect of this study was to determine if the conceptual framework of the
journal aim or scope aligned with the journal articles. Although alignment can be
measured, if they do not align, it cannot be determined why. Possibly, the journal editors’
intentions may not be met due to editor selection of articles or limitations of the articles
being submitted.
Although one of the aims of this study was to determine animal behaviour
instructors’ intended conceptual frameworks for their classes, this was only assessed via
16
syllabi. The assumption was that the syllabi represented what instructors felt students
should know about the conceptual framework of animal behaviour. In order to validate
this assumption, surveys and interviews should be done; however, these methods are
beyond the scope of the present study. Moreover, it is unclear which framework was
actually being used in the classroom since actual instruction can only be assessed by
evaluating lesson plans, which are likely rarely written, and observing the class. Lastly, it
should be noted, as many of the instructors have expressed, courses are continuously
undergoing changes; therefore, the syllabi collected only provide a snapshot of the course
from a specific time.
Definitions of Key Terms
Biological Terms
Ethology: Although ethology is the study of animal behaviour, not everyone that
studies the behaviour of animals calls him or herself an ethologist. Ethology sometimes
only references animal behaviour field work (Tinbergen, 1963).
Tinbergen’s Conceptual Framework: This conceptual framework for the study of
animal behaviour was developed from Tinbergen’s (1963) manuscript. It is composed of
four questions which this paper will refer to them as causation, ontogeny, survival value,
and evolution. The framework also includes the integration of these four questions.
Mayr’s Conceptual Framework: This conceptual framework of animal behaviour-
although in his 1961 manuscript he referred to biology, in general- was made popular by
Mayr (1961, 1993). It involves a distinction between proximate and ultimate causation.
17
Causation: In Tinbergen’s (1963) conceptual framework, causation refers to how
a behaviour may occur, such as via genetics, neurons, and hormones. Mayr’s (1961)
framework used the term ‘causation’ more broadly and divided it into proximate and
ultimate causation.
Ontogeny: The development of a behaviour, beginning before conception
(Bateson & Laland, 2013b), and continuing during the life of an individual, including
learned behaviour (Tinbergen, 1963).
Survival Value: The function of a behaviour, such as why doing the behaviour
increases the likelihood of surviving and producing offspring (i.e., how it increases an
organism’s fitness; Tinbergen, 1963).
Evolution: In Tinbergen’s (1963) conceptual framework, evolution refers to why
and when the behaviour may have evolved.
Proximate Causation: In Mayr’s (1961) framework, proximate causation is how a
behaviour may occur, such as via genetics or learning. This encompasses two of
Tinbergen’s (1963) questions: causation and ontogeny.
Ultimate Causation: In Mayr’s (1961) framework, ultimate causation is why a
behaviour may occur, such as how it impacts an organism’s fitness or how it may have
evolved. This incorporates two of Tinbergen’s (1963) questions: survival value and
evolution.
Integration: The use of all four of Tinbergen’s questions to study a single
behaviour, which was advocated by Tinbergen (1963). Although likely not done in a
single research article, if integration is occurring, the trend over time is a relatively equal
18
number of articles being published pertaining to each question. Moreover, review articles
regarding specific types of behaviour should attempt to answer all four questions.
Methods Terms
Content Analysis: This method is used to either code text and to identify major
themes of the text or code text with predetermined themes, and is often referred to as a
qualitative method of data collection, although quantitative analyses can be used on the
codes obtained (Auerbach & Silverstein, 2003; Berg, 2009; Elo & Kyngäs, 2007;
Saldaña, 2011; Schreiber & Asner-Self, 2011; Shields & Twycross, 2008;).
Unfortunately, there is no single description on how to use this method; instead, it differs
with the research question (Shields & Twycross, 2008).
Deductive or Directed Content Analysis: Coding text with predetermined themes
instead of examining text for emerging themes (i.e., inductive or grounded content
analysis; Berg, 2009; Elo & Kyngäs, 2007).
Inter-Coder Reliability: In order to measure the reliability of coding methods
employed in content analysis, two or more coders, who have been trained on the coding
methods, code randomly-selected sections of the text independently. Then comparisons
are made between the two. If coders are consistent with at least 70% of the codes
(Lauriola, 2004), although 80% is preferable (Shields & Twycross, 2008), then inter-
coder reliability is established and only one of the coders needs to continue coding.
Intra-Coder Reliability: In order to measure if the coder is continually coding text
in the same way, occasionally a coder will re-code portions of previously coded text. This
is referred to as intra-coder reliability (Chen & Krauss, 2004). If the coding of the text
19
during the two different times is consistent at least 70% of the time, then intra-coder
reliability is established (Lauriola, 2004).
Coding Dictionary: In content analysis, a coding dictionary is typically developed
before coding of the text begins in order to ensure consistent coding (Berg, 2009). The
coding dictionary provides the codes for each theme. Although the coding dictionary is
created beforehand, codes may be added to the dictionary during the coding process. On
the other hand, codes are not switched between themes while in the process of coding.
Alignment: In the present study, ‘alignment’ refers to the condition in which the
conceptual framework (either which conceptual framework or the frequencies of each of
Tinbergen’s four questions) is the same between different data sources, such as textbook
and primary literature.
Chapter One Summary
The conceptual framework of animal behaviour encompasses four questions,
which were suggested by Tinbergen (1963). These questions are of causation, ontogeny,
survival value, and evolution. This framework is similar to another proposed conceptual
framework of animal behaviour, which was made popular by Mayr (1961) and divides
animal behaviour into proximate causation (Tinbergen’s causation and ontogeny) and
ultimate causation (survival value and evolution). Although Mayr’s (1961) framework
may still be used, it is broader than Tinbergen’s four questions, which is part of the
reason why Tinbergen’s (1963) conceptual framework is considered the foundation of
animal behaviour (Dewsbury, 1994). However, Tinbergen’s (1963) four questions may
not be equally utilized in animal behaviour research (Hogan, 2009; Ord et al., 2005) or
20
undergraduate textbooks (Alcock, 2003). Whether the four questions are or are not evenly
practiced, their application should be consistent between primary literature and education.
The NRC (2003) suggests that alignment should occur between the current research and
undergraduate education, including its conceptual framework. If alignment occurs in the
discipline of animal behaviour between primary literature, which are publications of
authentic research, and undergraduate textbooks, then the goals of the committee are
being met in this particular discipline. If not, then the committee suggests that curriculum
be altered so that courses can effectively prepare future scientists. The purpose of this
study, therefore, was to determine if the conceptual framework used by animal behaviour
scientists, as presented in current primary literature, aligns with what students are
exposed to in undergraduate biology education. Assessment occurred via content analysis
of the research articles, journal aims and scopes, textbook content, textbook prefaces, and
syllabi course descriptions.
21
CHAPTER II
LITERATURE REVIEW OF COLLEGE BIOLOGY CURRICULAR RESOURCES
The current study examines how the conceptual framework of animal behaviour is
portrayed in textbooks, syllabi, and primary literature. In order to identify an appropriate
methodology to use for the current study, previous research was reviewed and critiqued.
Due to the limited number of studies on animal behaviour textbooks, syllabi, and primary
literature, this review was broadened to college biology curricular resources. By
expanding the review to this extent, it was expected that a rich array of possible methods
would be discovered. This review examines the studies for each type of curricular
resource (e.g., textbooks) independently and then the possible methods for all types of
curricular resources will be summarized at the end of the review.
Textbooks
Textbooks are the classic curricular resource. They are commonly used in the
classroom both as a teacher’s and student’s resource. Research on textbooks has varied
and has included how specific topics are portrayed in textbooks, various features of
textbooks, why instructors select certain textbooks, and how students can learn from
textbooks. This section examines each type separately. Most of the research has been on
topics within textbooks. Therefore, the section on topics in textbooks ends with a
description of possible ways to improve methodology in this area of research based on
the methods of previous studies. Otherwise, discussions focus on the main findings and
any large gaps in the literature.
22
Topics in Textbooks
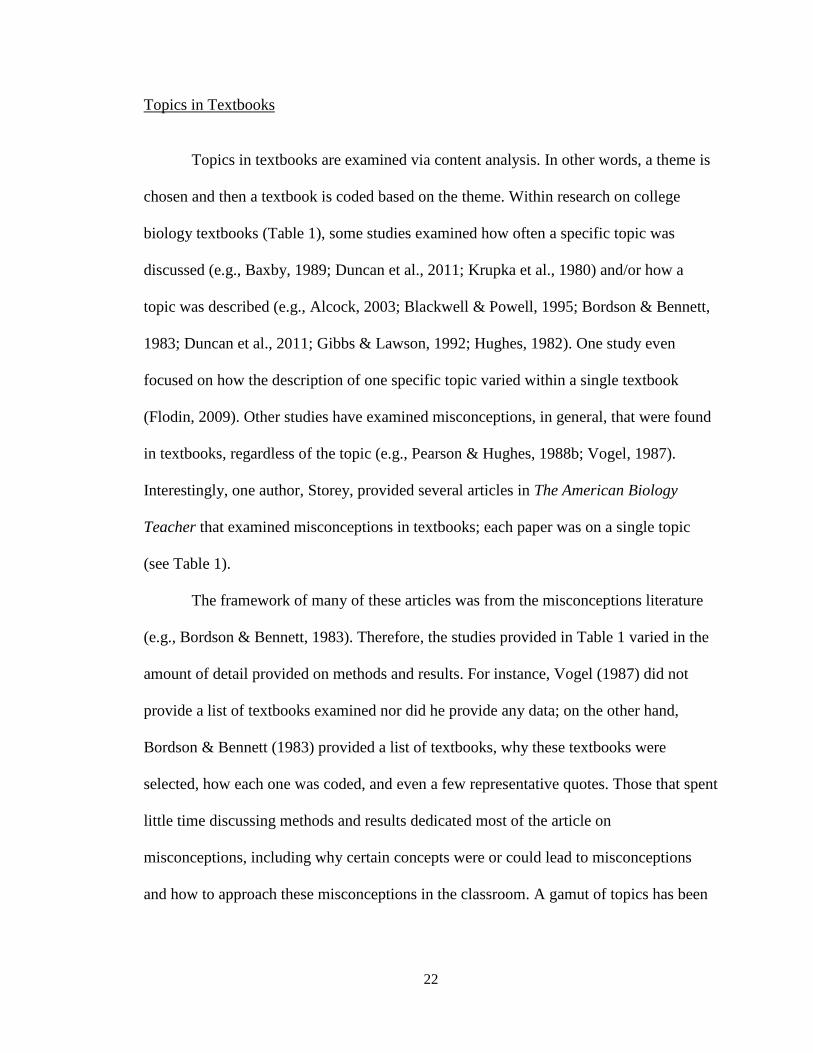
Topics in textbooks are examined via content analysis. In other words, a theme is
chosen and then a textbook is coded based on the theme. Within research on college
biology textbooks (Table 1), some studies examined how often a specific topic was
discussed (e.g., Baxby, 1989; Duncan et al., 2011; Krupka et al., 1980) and/or how a
topic was described (e.g., Alcock, 2003; Blackwell & Powell, 1995; Bordson & Bennett,
1983; Duncan et al., 2011; Gibbs & Lawson, 1992; Hughes, 1982). One study even
focused on how the description of one specific topic varied within a single textbook
(Flodin, 2009). Other studies have examined misconceptions, in general, that were found
in textbooks, regardless of the topic (e.g., Pearson & Hughes, 1988b; Vogel, 1987).
Interestingly, one author, Storey, provided several articles in The American Biology
Teacher that examined misconceptions in textbooks; each paper was on a single topic
(see Table 1).
The framework of many of these articles was from the misconceptions literature
(e.g., Bordson & Bennett, 1983). Therefore, the studies provided in Table 1 varied in the
amount of detail provided on methods and results. For instance, Vogel (1987) did not
provide a list of textbooks examined nor did he provide any data; on the other hand,
Bordson & Bennett (1983) provided a list of textbooks, why these textbooks were
selected, how each one was coded, and even a few representative quotes. Those that spent
little time discussing methods and results dedicated most of the article on
misconceptions, including why certain concepts were or could lead to misconceptions
and how to approach these misconceptions in the classroom. A gamut of topics has been

23
studied. Since most papers focused on misconceptions, their cited sources were studies
indicating misconceptions of certain topics, seldom did they validate their methods.
What follows is a review of the articles provided in Table 1; they are described
individually due to the wide range of topics and methodology. The order in which these
studies are discussed does not necessarily follow chronologically; instead, it is set up so
that the first articles discussed are those that provided little information on methods and
results and each study that follows provided more detail on how the study was done. The
study by Flodin (2009) is discussed last in part because of the detailed methods section
but also because it was unique compared to the rest of the studies in that it examined only
one textbook and how a single concept varied within that textbook. This section ends
with a discussion on possible ways to enhance textbook content analysis.
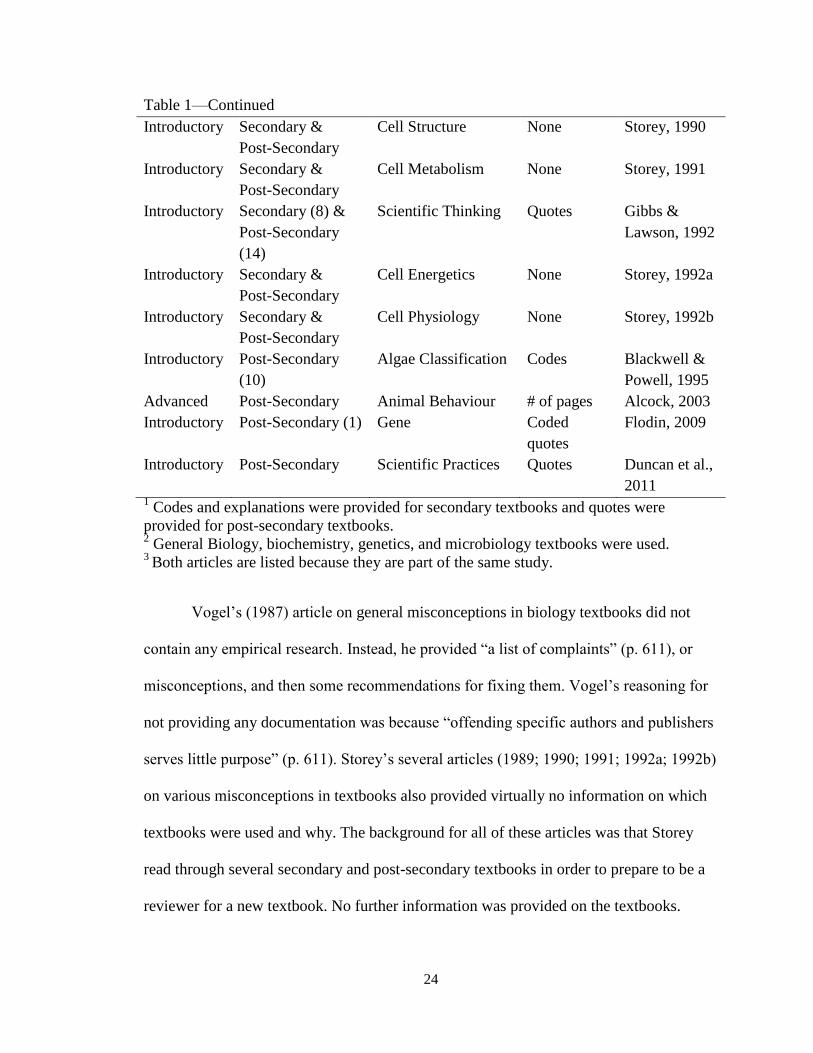
Table 1. Topics examined via content analysis which are listed in chronological order.
Textbook
Type
Level (# of
textbooks, if
known)
Topic/Theme Display of
Data in
Article
Source
Introductory Post-Secondary
(43)
Aging # of pages Krupka et al.,
1980
Introductory Secondary (20) &
Post-Secondary
Evolution Codes or
quotes1
Hughes, 1982
Genetics Post-Secondary
(27)
Down Syndrome Codes &
quotes
Bordson &
Bennett, 1983
Introductory Post-Secondary General
Misconceptions
None Vogel, 1987
Introductory Post-Secondary (4
and one paper)
Misconceptions in
Genetics
List of terms
& # of
textbooks
Pearson &
Hughes,
1988a, 1988b3
Introductory
& others2
Secondary &
Post-Secondary
(~122 total)
Pneumococcal Type
Transformation
# of
textbooks
Baxby, 1989
Introductory Secondary &
Post-Secondary
Photosynthesis None Storey, 1989
24
Table 1—Continued
Introductory Secondary &
Post-Secondary
Cell Structure None Storey, 1990
Introductory Secondary &
Post-Secondary
Cell Metabolism None Storey, 1991
Introductory Secondary (8) &
Post-Secondary
(14)
Scientific Thinking Quotes Gibbs &
Lawson, 1992
Introductory Secondary &
Post-Secondary
Cell Energetics None Storey, 1992a
Introductory Secondary &
Post-Secondary
Cell Physiology None Storey, 1992b
Introductory Post-Secondary
(10)
Algae Classification Codes Blackwell &
Powell, 1995
Advanced Post-Secondary Animal Behaviour # of pages Alcock, 2003
Introductory Post-Secondary (1) Gene Coded
quotes
Flodin, 2009
Introductory Post-Secondary Scientific Practices Quotes Duncan et al.,
2011 1 Codes and explanations were provided for secondary textbooks and quotes were
provided for post-secondary textbooks. 2 General Biology, biochemistry, genetics, and microbiology textbooks were used.
3 Both articles are listed because they are part of the same study.
Vogel’s (1987) article on general misconceptions in biology textbooks did not
contain any empirical research. Instead, he provided “a list of complaints” (p. 611), or
misconceptions, and then some recommendations for fixing them. Vogel’s reasoning for
not providing any documentation was because “offending specific authors and publishers
serves little purpose” (p. 611). Storey’s several articles (1989; 1990; 1991; 1992a; 1992b)
on various misconceptions in textbooks also provided virtually no information on which
textbooks were used and why. The background for all of these articles was that Storey
read through several secondary and post-secondary textbooks in order to prepare to be a
reviewer for a new textbook. No further information was provided on the textbooks.
25
Hughes (1982) was interested in how secondary and post-secondary textbooks
portrayed a fundamental topic of biology, evolution, since some areas of the United
States were, and still are, fighting to keep evolution out of textbooks. He (1982) listed 20
secondary-level biology textbooks analyzed, but did not describe how they were chosen,
stating only that they were “modern” (p. 31). Of these 20 textbooks, only one considered
evolution as fact, while most treated evolution as theory, in the everyday usage of the
term. Data provided included how each textbook was coded (i.e., if it treated evolution as
fact or theory) and then a brief description on why, but no direct quotes.
Unlike the analysis on secondary-level textbooks, Hughes (1982) did not provide
a list the college textbooks that he examined. Four were quoted from; therefore, the
reader knew at least four of the books used. It is not clear if more textbooks were used or
not since total number was not provided. In order to select which textbooks to use, “a
random survey of college texts” was found (p. 31). All four quotes described evolution as
fact. Hughes (1982) concluded that college textbooks, but seldom secondary textbooks,
treated evolution as fact. Although interesting, the findings of the study are questionable
due to limited description of methods and results.
Similar to Hughes (1982), Alcock (2003) examined the fundamental framework
of a discipline, animal behaviour. His study was different from the rest, likely because it
was published in a science research journal and not a science education research journal.
Although the title of the study was “A textbook history of animal behaviour,” Alcock
(2003) also focused on the general trends within the study of animal behaviour.
Unfortunately, there were little data provided, and textbooks were selected based on what
the author thought may be commonly used, including a textbook that he had written.
26
Within the study of animal behaviour, his focus was on the conceptual framework that
was made popular by Mayr (1961), which divided the discipline into proximate and
ultimate causation. Proximate causation refers to how a behaviour may develop over time
in an individual and what may cause the behaviour, such as hormones or neurons.
Ultimate causation reflects on how or why a behaviour may have evolved. Alcock
(2003), therefore, focused on which type (proximate or ultimate causation) animal
behaviour textbooks have focused on over the last 50 years.
Alcock’s (2003) first textbook that he discussed was published in 1951, and he
selected the textbook since he suggested that many students, including himself, used this
textbook (data not provided). He found that five chapters (135 pages) were dedicated to
proximate causation while only two chapters (60 pages) were on ultimate causation.
Another textbook selected, which Alcock (2003) suggested was another important book,
was published in 1966. This textbook almost exclusively covered proximate causation,
which the authors of the textbook admitted in the text itself. Lastly, a textbook published
in 1982 had 23 chapters covering proximate causation and eight chapters on ultimate
causation. Alcock (2003) suggested that proximate was more popular at this time since
the ‘nature versus nurture’ argument was underway.
Alcock (2003) found the textbooks began changing to focus more on ultimate
causation in the mid-1970s. He listed two textbooks, one of which Alcock was the author,
that both focused on ultimate causation and even used the term ‘evolution’ in the title.
Alcock (2003) commented that this change probably occurred because evidence was
accumulating for the concept that natural selection works on individuals, not on entire
species. Although he suggested that textbooks were focusing more on ultimate causation,

27
he also suggested that textbooks were merging the two concepts more often, making for
more rounded textbooks.
Animal behaviour chapters within introductory biology textbooks were also
briefly discussed in Alcock’s (2003) paper, although data on page numbers were not
provided. Alcock (2003) claimed that a textbook, which was published in 1967, was a
popular textbook, although no data were provided to support this comment. The author
studied animal behaviour and included almost 50 pages on animal behaviour within his
textbook, most of which were on proximate causation (Alcock, 2003). Alcock then
briefly described several textbooks. No data were provided on the number of pages that
covered proximate or ultimate causation, but he did describe changes in topics. For
example, types of learning were commonly covered in textbooks, and later kin selection
(ultimate causation) became popular. All in all, Alcock (2003) suggested that the
introductory biology textbooks were becoming more integrated, as he described in the
animal behaviour textbooks. Although this trend may exist in animal behaviour
textbooks, little data were provided to actually support this conclusion.
Interested in a narrower topic, Baxby (1989) examined how often pneumococcal
transformation (discovered by Griffith, Avery, and others) was mentioned in high school,
college, and first-year university textbooks. As Baxby (1989) described, this topic was
important to discuss since it inadvertently led to discoveries of DNA being the genetic
material. Because of this, it was, and appears to still be, often included in textbooks, but,
during that time, Griffith, Avery, and others were actually more well known for their
work on type transformation than their evidence of DNA as the genetic material.
28
In Baxby’s (1989) study, it was unclear which specific textbooks were used
(although three were provided as specific examples in the results) and how the textbooks
were selected, but the sample size was larger than any of the other studies discussed here.
Also, this study was unique compared to the rest since it surveyed textbooks from more
than one field (i.e., general biology, genetics, biochemistry, and microbiology).
Pneumococcal transformation was at least mentioned in 82 textbooks: general
biology (n = 24), genetics (n = 22), biochemistry (n = 13), and microbiology (n = 23). Of
all original textbooks examined, 13% of general biology, 45% of genetics, 54% of
biochemistry, and 15% of microbiology textbooks did not mention pneumococcal
transformation (given the percentages, it appeared that the entire sample size was about
122 textbooks). Most textbooks (between 77% and 96%, depending on sub-discipline) at
least mentioned Griffith and Avery. As mentioned earlier, within the topic of
transformation, Baxby (1989) argued that type transformation was the most important
subtopic to discuss since that was what Griffith, Avery, and others were well known for
in the scientific community. Only a small number of textbooks described type
transformation (3 general biology, 10 genetics, 7 biochemistry, and 19 microbiology).
Additionally, the author included how many textbooks described type transformation
“adequately” (p. 213) but it was unclear what “adequately” meant besides it being
measured with “an assessment of the clarity of description” (p. 213; 1 general biology, 9
genetics, 1 biochemistry, and 16 microbiology). Unfortunately, results were combined for
all education levels, which is problematic given the large differences that may exist
between secondary and post-secondary textbooks (Hughes, 1982). Baxby (1989)
concluded that few textbooks, especially in general biology and microbiology, discussed

29
type transformation; even fewer described it well. However, given that very little
information was provided on how adequate was adequate enough, some caution was
necessary in accepting that some textbooks that included type transformation did not
describe it well.
Another topic surveyed in textbooks was aging. Krupka et al. (1980) studied how
often introductory biology college textbooks published in the 1970’s described aging
(selection of textbooks was not described). The purpose of examining this, according to
Krupka et al. (1980) was in part because everyone experiences aging, and also because
there was a large body of literature on aging, from which Krupka et al. (1980) provided
several citations. Within the introduction of the paper, both aging and death were
described, but then only the term ‘aging’ was used; therefore, it was assumed that only
aging was studied. Forty-three textbooks (citation information provided for all) were
examined, and the number of pages within each textbook that at least mentioned aging
was tallied (total number of pages for entire textbook was also provided). Unfortunately,
actual length (e.g., number of sentences or paragraphs) dedicated to this topic was not
assessed. The authors stated that their method overestimated how much the topic was
described which further supported their conclusion of a lack of discussion on this topic;
however, not having number of sentences/paragraphs also made it difficult to compare
textbooks to each other. Krupka et al. (1980) suggested that growth and development
were discussed much more than aging. This may be true since only about half of the
textbooks mentioned aging, but no comparison was actually made; in other words, they
never counted the number of pages that mentioned growth and development. Therefore,
although relatively few pages (0 to 7 pages per textbook) mentioned aging, it was
30
difficult to conclude if this was adequate or not since the number of pages of this topic
was not compared to any other topics.
Blackwell and Powell (1995) did a more thorough job describing both their
methods and results than the previously described studies. The purpose of their study was
to examine how algae was classified in various textbooks (N = 10), since it was, and still
is, a term that no longer has evolutionary significance (i.e., they are not a monophyletic
group); they also described how many kingdoms were provided in textbooks. Although
the authors did not describe how specifically the ten textbooks were selected, they did
state that all were introductory general biology texts, and zoology and botany textbooks
were not used since they would not cover all major taxa. Blackwell and Powell (1995)
also provided the categories (21 total) and which codes each textbook received for each
category. Categories included how major algae taxa were classified and the total number
of kingdoms described, although, they did not provide any direct quotes to support the
categories. This lack of quotes may be due to their coding system being much more
straightforward, since they were more interested in how different taxa of algae were
classified than how they were qualitatively described. As was indicated by the coding
provided, Blackwell and Powell (1995) concluded that textbooks varied on how they
classified different types of algae, whether they classified them as plants, protists, or in a
separate group; further discussion on the classification of algae in the textbooks was
limited.
All but one textbook described the five kingdom system, which was appropriate
since this was published in 1995 when this classification was still being used (Blackwell
& Powell, 1995). The other textbook provided eight kingdoms, including Kingdom
31
Chromista, which included the brown algae, golden algae, yellow-green algae, and
oomycetes. Before the domain classification system was common (i.e., eukaryotes,
bacteria, and archaea), it was argued that more than five kingdoms was appropriate since
the “current” classification system of five kingdoms did not describe the evolutionary
relationship as accurately; actually, even Blackwell and Powell (1995) recommended the
six-kingdom classification system at the end of their study. Further, they suggested that
algae should be classified into different kingdoms since they are not in a monophyletic
group.
One of the earlier studies that described a topic in college biology textbooks was
completed by Bordson and Bennett in 1983. Their study was fairly unique compared to
the ones that were later published. For instance, although most studies examined
introductory textbooks (e.g., Blackwell & Powell, 1995), Bordson and Bennett (1983)
surveyed genetics texts. Down syndrome was, and still is, fairly common and was the
first described chromosomal mutation; therefore, it is a commonly-used example in
textbooks. Because of this trend and because of recent findings about associated parental
characteristics of Down syndrome children, Bordson and Bennett (1983) studied how
Down syndrome was described in genetics textbooks. Twenty-seven texts were used and
all were published between 1975 and 1981. Further, this early study did describe how the
textbooks were selected, which several others later did not indicate (e.g., Krupka et al.,
1980). The reasoning was that they were provided free from publishers for possible
adoption into their genetics course. Although this approach could cause bias, at least it
was described; additionally, the sample size was fairly large. Similar to the
aforementioned study by Blackwell and Powell (1995), major categories and codes for
32
each textbook were provided. Coding included if figures were present, which was not
noted in the previously discussed studies. Additionally, some representational quotes
from different textbooks were provided in order to support their coding system.
Within these textbooks, the authors examined how Down syndrome was
described, especially its possible causes. As Bordson and Bennett (1983) described it was
originally thought that the main cause of Down syndrome was the age of the mother but,
as explained by the authors, studies have since shown that it also could be due to the age
of the father, and some have even suggested that cause is independent of the mother’s or
father’s age, making the cause unknown. However, as Bordson and Bennett (1983)
indicated, many textbooks still explained that the age of the woman was the primary
cause, and only two of the 27 textbooks described the correlation between male age and
Down syndrome. Therefore, their study suggested that there was a discrepancy between
current research, which showed inconclusive results, and portrayal in textbooks, which
portrayed the cause as only due to the mother’s age. However, when discussing studies
that question the cause as being primarily based on the mother’s age, most of the studies
were from the mid-1970’s, which was when several of the textbooks examined were
published. The authors did not describe this limitation, but, it would only make sense that
they appeared to lag behind. In fact, the two textbooks that did provide correlation
between the father’s age and Down syndrome were both published in 1980. Therefore,
although Bordson and Bennett (1983) argued that textbooks were lagging behind, it may
simply be due to the new information being too new. Other variables examined,
therefore, may be more important, such as all textbooks examined did describe Down
syndrome as Trisomy-21 and over half included an image in their description of Trisomy-
33
21. It would be interesting to discover if the causes described in today’s textbooks still
reflect older hypotheses or if they match current understanding of the condition.
Pearson and Hughes’ (1988a, 1988b) study described first in great detail some of
the common issues provided in previous research that lead to misconceptions (mostly
from high school studies; 1988a) and then described/assessed whether these issues were
found in college biology textbooks (1988b). Some of the provided issues that could lead
to misconceptions included using more than one term for the same concept or one term to
describe multiple concepts, applying terms incorrectly, and including terms that were no
longer used in science (1988a). This is the first study described here that included validity
on its methodology by citing several previous studies that have used a similar approach
for analyzing textbooks.
Textbooks were selected only if they were recently published and sold, commonly
used (which they tried to assess by contacting publishers for sales numbers, but not all
publishers responded), and contained genetics sections for introductory courses. Four
textbooks and one paper, which was written with recommended genetics terms by the
same authors as this study (i.e., Pearson & Hughes), were examined and data on terms
were combined altogether. Although this study included relatively few textbooks
compared to previously described studies, this may be because the authors examined
entire sections on genetics instead of just one specific topic (e.g., 27 textbooks on Down
syndrome; Bordson & Bennett, 1983). Including the paper with the textbooks in the same
analysis is questionable, especially as it was also by Pearson and Hughes. It would be
more meaningful if they did the textbook comparison and then compared those results
with the paper, but this was not the case. This was especially interesting since they began
34
their article by stating “the nature of the source, in this instance is self-identifying, that is
textbooks” (Pearson & Hughes, 1988, p. 267).
Genetics chapters were used, along with sections with genetic terms found in
evolution chapters. For the textbooks, only bold terms were included in the analyses,
which Pearson and Hughes (1988b) justified doing since they, and others that they cited,
assumed that bold terms were likely what the publishers interpreted as the most
significant terms. All terms, including their original source, were provided in an
appendix. The authors did describe the difficulty that they experienced when trying to
determine which terms to exclude. They decided that for non-genetic sections, such as
evolution, they would record terms that were at least “marginally related to genetics”
(Pearson & Hughes, 1988b, p. 271). From all five resources, 439 genetics terms were
identified, of which only 13 were in all five resources. According to the appendix, 30 of
the terms were unique to the paper. The most terms any individual resource used was 223
terms. The paper had 146 terms and the textbook with the lowest number had 152 terms.
Pearson and Hughes (1988b) concluded that there was a large variation in terms used in
genetics, which they suggested could lead to confusion for both students and teachers.
However, it could also be that some of these terms were used in other texts but were not
considered important enough to be in bold (since they coded only bold terms). Pearson
and Hughes (1988b) never commented on whether they looked for any of these terms
after making the lists. Therefore, it cannot be concluded that some of these terms were
completely excluded, only that publishers determined different terms as being important
enough to have in bold. Several examples of terms, including direct quotes for each type
of issue, were included, such as going back and forth between using the terms ‘back-
35
cross’ and ‘test-cross,’ stating a gene is dominant when in reality a certain allele of the
gene is dominant, having multiple definitions of the term ‘chromosome,’ and attributing
all genetic diseases to recessive alleles. However, the paper was not analyzed using the
same methods as the textbooks. Pearson and Hughes (1988b) stated that since the paper
was only a list of terms, not complete with definitions, that it was inappropriate to use for
this portion. They ended their discussion with a list of terms that they recommended
using in order to avoid some of the issues discussed above that can lead to
misconceptions.
The previously described articles all examined biological concepts, whereas
Gibbs and Lawson (1992) studied how scientific thinking was portrayed in high school (n
= 8) and college (n = 14) introductory biology textbooks (source information was
provided for each textbook). Gibbs and Lawson (1992) suggested that since the standards
included scientific thinking and there was, and likely still is, a lack of scientific literacy in
the United States, it was important to discover how textbooks portrayed scientific
thinking. They stated that “the selection [of textbooks] was based on a representative
sample of textbooks available to us [the authors]” (p. 137). However, it was not stated if
representation was actually measured. Further, similar to Bordson and Bennett (1983),
they commented that although they used textbooks that they could readily access, the
sample was still likely representative of introductory biology textbooks, especially since
they had a large sample size. Including this statement, however, does not actually make
them representative. Moreover, the publication dates of these textbooks ranged from
1978 to 1990, which is a large span of time; one textbook was even an older edition of
another. Within each textbook, the authors examined the section that was dedicated to the
36
scientific method and then they looked through the rest of the text for anything else
related to scientific thinking. It was unclear if there were specific terms or possibly
examples of studies that they were looking for to determine this. Only one textbook, a
college textbook, described scientific thinking beyond the introductory scientific method
section. Interestingly, which the authors never discussed, the one textbook that described
scientific thinking throughout was also the oldest textbook examined, which was
published in 1978; the rest of the textbooks ranged from 1983 to 1990.
Although exact coding was not provided in this study, as in some of the previous
studies discussed (e.g., Blackwell & Powell, 1995), Gibbs and Lawson (1992) did a much
more thorough job in providing multiple quotes for different ideas and from several
different textbooks. For instance, the use of the scientific method varied between
textbooks. Most textbooks described the scientific method (quotes were provided from
three high school and three college textbooks), while two college and two high school
textbooks did not mention ‘scientific method;’ they instead described how various
possible methods can be used in science (heading names were provided for each). Of
those that discussed the scientific method, three provided a statement describing how
scientists did not always adhere to it and another used the term rather loosely instead of
describing exact steps (quotes from each textbook provided). Specific terms related to
scientific thinking were also analyzed; one of the main terms that they focused on in the
results was ‘theory.’ In pointing out how multiple textbooks referred to theories as
maintained hypotheses, quotes were provided from four high school and three college
textbooks. Quotes from two college and one high school textbook were also provided in
explaining how some textbooks referred to theories as having extensive evidence. Gibbs
37
and Lawson (1992) also pointed out how these definitions contradicted later points in
these textbooks since they referred to theories that were no longer valid (e.g., theory of
spontaneous generation). Other terms examined extensively were ‘hypothesis’ and ‘law.’
All in all, they concluded that scientific thinking was poorly portrayed in introductory
biology textbooks, for both high school and college, due to it rarely being discussed and
the misuse of several scientific thinking terms. It would have been interesting if they
examined other older textbooks to determine if older textbooks discussed scientific
thinking more often than newer textbooks.
Nearly 20 years after Gibbs’ and Lawson’s (1992) study was published, Duncan,
Lubman, and Hoskins (2011) published a study on the portrayal of scientific processes in
introductory biology textbooks. They did so due to the recent reports documenting a need
for science curriculum to represent science (e.g., Vision and Change, AAAS, 2010).
Duncan et al. examined figures within six textbooks that were published in 2008.
Textbooks ranged in their overall age (i.e., their edition number); otherwise, it was not
stated why these particular textbooks were chosen. For each textbook, figures that were
part of the main narrative, not part of activities or questions or in supplemental material,
were analyzed. For each figure, the type of figure (e.g., photographs or line drawing) and
if the figure portrayed any scientific practices (i.e., at least three steps) was documented.
For those that did include scientific practices, which parts of scientific practices (e.g.,
developing alternative hypotheses) was recorded. Figures with only data were not
considered as displaying scientific practices. Each page of the textbook was coded by two
or more coders, but inter-coder reliability was not described.
38
The average number of figures per textbook was 1180, but many of these had
multiple panels; since this was noted, it was assumed that the unit of analysis was panel,
not figure, but this was not specifically addressed. All textbooks provided at least one
figure covering scientific practices. The textbook with the largest percentage of figures
portraying scientific practices had 9%, and the average percentage was 4.5%. Most
scientific practices figures were found in introductory chapters, but the percentage of
figures was not provided except that one textbook only included these figures in the
introductory chapter. In the introductory chapter, all textbooks had at least one figure that
described hypotheses, methods, predictions, and results, but only four described questions
and conclusions. Moreover, only two textbooks explained alternative hypotheses, with
one of these textbooks describing alternative hypotheses throughout the entire book. Of
the five textbooks that included at least one scientific practices figure after the
introduction, all of them had at least one figure that provided methods and results, three
provided at least one figure on hypotheses, and only one provided a prediction. Three of
the four that described conclusions in the introduction also did so after the introduction.
All in all, the results indicated that scientific practices are rarely portrayed in
textbook figures. These results are similar to what Gibbs and Lawson (1992) found, but
their study was never described in the article. Duncan et al. (2011) recommended that
textbooks should include explanations on how we know what we know more often in
textbooks in order to prepare future biologists.
Pearson and Hughes (1988b) and Gibbs and Lawson (1992) both investigated
how some scientific terms may have multiple meanings in the same textbook. Flodin’s
(2009) study specifically addressed this by examining how the gene concept varied
39
within a single textbook. Flodin (2009) began by describing several studies that
concluded students have misconceptions regarding genes and then providing definitions
of the term ‘gene’ from three textbooks, each a different sub-discipline of biology. Then
she presented a case study on a single textbook that covered multiple sub-disciplines of
biology: Campbell and Reece’s (2005) introductory Biology textbook. Although only one
textbook was used in this study, Flodin (2009) thoroughly explained why this particular
textbook was used, such as it was purchased in the United States and Europe and the
publishers described the book as being the most commonly purchased English scientific
textbook. Within this textbook, five main functions, or definitions of the gene concept
were found: “the gene as a trait, the gene as an information-structure, the gene as an
actor, the gene as a regulator, and, last, the gene as a marker” (Flodin, 2009, p. 83). For
each function, related chapters and quotes (4 to 6 per function) were provided as evidence
for the definition. Interestingly, there was no overlap in the chapters. Coding was likely
not blinded, so she may have been inadvertently looking for differences between
chapters. Quotes were supplied, but it was not stated if they were from the same chapter
or not. Provided quotes also had certain terms in bold to represent how the term ‘gene’
was linked to other terms, which showed how the quotes were coded (only body text was
coded). From there, Flodin (2009) described how each function related to one of five sub-
disciplines within biology: transmission genetics, molecular biology, genomics,
developmental genetics, and evolutionary biology. Flodin (2009) concluded that
textbooks that covered multiple sub-disciplines in biology vary their use of the gene
concept since different sub-disciplines focus on different aspects of genes. This can lead
40
to confusion since, as Flodin (2009) described, a common misconception is that a term
has only one meaning.
All in all, a variety of topics have been examined via content analysis in college
biology textbooks (see Table 1). Most of these have focused on biological concepts such
as evolution (Hughes, 1982) or aging (Krupka et al., 1980), but two studies, including a
very recent study, did examine scientific thinking (Duncan et al., 2011; Gibbs & Lawson,
1992). Of the biological concepts considered (see Table 1), most of them were rather
specific, such as the topic of Down syndrome (Bordson & Bennett, 1983). Before
examining these narrowly-focused topics, broader topics should be analyzed. Two studies
did discuss evolution in textbooks, but little data were provided for college textbooks
(Alcock, 2003; Hughes, 1982). Other fundamental ideas such as cell theory should also
be studied.
Due to the diverse array of topics, it is difficult to summarize the findings from all
of these papers, which is why they were discussed individually above. Generally, though,
most noted that textbooks either had misconceptions (i.e., errors; Gibbs & Lawson, 1992)
or were written in such a way that they could lead to misconceptions, such as using the
same term for multiple concepts (Flodin, 2009).
Although some studies referred to previous textbook analyses in K-12 textbooks
(e.g., Pearson & Hughes, 1988a), none of these papers cited each other except for
Storey’s (1990; 1991; 1992a, b) papers citing the previous ones and Vogel’s (1987)
paper. Instead, most of these studies referred to research on students’ misconceptions
(e.g., Flodin, 2009); a few others also related to current political issues (e.g., Duncan et
al., 2011; Gibbs & Lawson, 1992; Hughes, 1982), new scientific findings (e.g., Blackwell
41
& Powell, 1995; Bordson & Bennett, 1983), or scientific trends (Alcock, 2003). Although
these main areas can provide important reasons why these various topics in textbooks
should be examined, it is also important to validate the methodology used by referring to
previous textbook analysis studies.
Furthermore, many of these articles provided little information on methods and
results. Several, such as Vogel (1987), were more focused on why certain topics led to
misconceptions and how to work on these misconceptions in the classroom than
providing empirical research on textbooks. For those that did explain their methods,
rarely did they perform any research on which textbooks were most commonly used so
that they could justify their selection of textbooks. The exceptions are Pearson and
Hughes (1988b) and Flodin (2009) who contacted publishers for sale totals. Even so,
many publishers would have to be contacted in order to gain a deeper understanding on
which textbooks are used. It may be helpful, instead, to go directly to instructors and their
syllabi to survey which textbooks are most commonly used. Today, this may be fairly
easy to do given the number of syllabi available online, which was the approach of a
more recent study by Burton (2011; described later), and ease of contacting instructors
via e-mail. Additionally, nearly all of these studies looked at introductory textbooks,
except for Baxby (1989) who examined textbooks of various sub-disciplines and Bordson
and Bennett (1983) who examined genetics textbooks, leaving a huge gap in the literature
on texts used in advanced biology courses.
The presentation of data also varied between studies. For those that included their
data, most studies laid out the codes used for each textbook and/or provided
representational quotes. Which style was used depended on the research question. For
42
instance, Blackwell and Powell (1995) examined how algae was classified, so quotes
likely would have been of little use; instead, they only provided the codes (e.g., how each
type of algae was classified). On the other hand, Gibbs and Lawson (1992) examined
how scientific thinking was portrayed and as this was more of a qualitative question, it
made sense that they focused more on quotes than actual codes for each textbook.
Most of these articles were published in the 1980’s and early 1990’s, with the
exception of Alcock’s (2003), Flodin’s (2009), and Duncan’s et al. (2011) study. Content
analysis of textbooks then may appear to be an outdated topic of research. On the other
hand, with nearly all of these studies describing various problems with textbooks, and
few building upon a previous textbook study, it would be interesting to discover if
textbook publishers have taken these studies into account and improved their textbooks or
if the same problems still exist. Moreover, the more recent articles describe wider topics
such as the gene (Flodin) and scientific practices (Duncan et al., 2011). Therefore, the
trend may be heading in a direction to study more fundamental concepts in science. For
future studies using content analysis, some of the above recommendations should be
taken into consideration.
Textbook Features
Many studies regarding textbooks have examined specific topics and how they are
portrayed in textbooks. Another way to examine textbooks is to study the associated
features, such as textbook layout. This may be done to compare various features of
textbooks to each other (e.g., Mertens & Polk, 1980), to interpret how the layout and
length of textbooks had changed over time (e.g., Blystone & Barnard, 1988), to compare
43
the images in textbooks with those from primary literature (e.g., Rybarczyk, 2011), to
determine if textbooks were written at an appropriate reading level (e.g., Major &
Collette, 1961; Walker, 1980), to decide if textbooks provided students with appropriate
reflective cues (e.g., Goetz, Alexander, & Schallert, 1987), and to find how many and
how often scientific terms were used (e.g., Burton, 2011). Unlike the literature on the
topics of textbooks, one of these articles (Walker, 1980) was a continuation of a
previously completed study on college biology textbooks (Major & Collette, 1961). In
general, instead of using misconceptions literature, most articles cited other textbook
analyses, many of which were done on primary and secondary textbooks. All of these
articles provided about the same amount of background on their methods and data unlike
some of the literature on topics in textbooks; therefore, the order that these articles are
discussed is not in the order of amount of information that they provided but rather first
examines those that looked at general features of texts and then at those that related to
readability of textbooks.
Mertens and Polk (1980) examined and compared the various features of 13
general genetics textbooks published between 1975 and 1979 (textbook citation
information provided). Their ultimate goal was to provide instructors with information
that may help them decide which textbook to use in their own classroom. They stated that
the textbooks selected were “intended for, or often used as, textbooks for introductory
genetics courses for biology majors” (Mertens & Polk, 1980, p. 274), but further
description regarding textbook selection was not provided. They did, however, admit that
a limitation to this study was that new textbooks would likely be out once their article
was published, but the information provided should still be useful to instructors.
44
The textbooks, according to Mertens and Polk (1980) “were studied by both
authors of this article” (p. 274); my assumption was that they were referring to each
textbook being coded by both authors, but it was unclear. Information for each textbook
provided included total and average chapter total of pages and chapters, number of
illustrations, tables, and questions. Number of glossary terms and the price of each
textbook were also provided. Then they selected 15 major genetics topics (how these
topics were selected was not specified) and provided the number of pages that each
textbook dedicated to each topic. Although topics in textbooks were discussed in the
above section, this article was placed in this section since it examined various features of
the textbooks, not just topics. It did not appear that there was any overlap in their coding
of pages, but they did mention that they did not add up to the total number of pages since
some pages, such as for the glossary, were excluded. The purpose of separating each
textbook by topic was so that instructors could find which topics were most emphasized
and select a textbook that was most appropriate for their classes.
They also included a list of any published reviews on the textbooks as well as
their own personal opinions about each textbook, such as which ones seemed more
appropriate for biology or non-biology majors and which may need more supplemental
material than others. They admitted that these statements were based more on opinion
than evidence but they felt that it may still be helpful in textbook selection. Finally,
unique features were also listed for each textbook, such as using a lot of color. As the
authors noted, these features were not provided to identify a superior textbook, but only
to provide additional information about each textbook.
45
Textbooks ranged in number of pages (442 to 914) and number of chapters (15 to
36). The number of illustrations and tables also varied but the totals that Mertens and
Polk (1980) provided may have been misleading. Only illustrations and tables labeled as
such were included. Therefore, as Mertens and Polk (1980) discussed, some textbooks
included several images that were not labeled so they were not included and would
underestimate the actual number of images, while other textbooks labeled tables as
figures so they were coded as illustrations, which would underestimate the number of
tables and exaggerate the number of figures. It may be important in selecting textbooks
with labeled figures and tables and those without; however, this should be a separate
category and not completely dismissed from coding.
The average number of practice problems included with each chapter varied from
10 to 25 and just over half of the textbooks included keys with the problems. However, it
was not mentioned if the problems were basic or more thought provoking, which may be
another important consideration in selecting textbooks. Most but not all textbooks had a
glossary and the number of words ranged from 148 to 629 words. The authors argued that
having or not having a glossary should not determine the quality of a textbook. Others
may have definitions within the text with an index at the end, making a glossary
unnecessary.
Although Mertens and Polk (1980) did describe topics within textbooks, their
study differed from those previously described since they were also interested in the
general layout of these topics and used several different features in comparing textbooks
to each other. Their main intention was not to point out possible misconceptions or what
could lead to misconceptions, indicating a need for change in textbooks. Instead, they

46
provided a more detailed description in hopes of helping fellow instructors in choosing a
textbook.
Blystone and Barnard’s (1988) study differed from Mertens and Polk’s (1980)
aforementioned study in that instead of examining the most recent textbooks, they looked
at textbooks that were published over a span of about 35 years (between 1950 and 1987)
in order to comment on formatting trends within introductory college biology textbooks.
These trends were then used to predict what “future” (year 2000) textbooks would be
like. Mertens and Polk (1980) argued that making predictions is important in order to
reflect on if these trends should be continued. Formatting variables included number of
textbooks, the length of textbooks, and the number of illustrations. Trends and some
specific textbook examples were provided throughout (but not all textbooks examined
were cited). For examining the number and length of textbooks, textbooks were found
using the Library of Congress catalog; it was unclear if all textbooks found were used or
if only a sample since they also stated that textbooks selected were ones that “were or are
still commonly used in the United States” (Blystone & Barnard, 1988, p. 48). However,
with such a large sample size (N = 169), all textbooks found may have been used.
In comparing textbook trends over decades, it was found that more textbooks
were published in more recent decades. Another trend was that in more recent time more
textbooks were being published specifically for either biology majors or non-biology
majors. Blystone and Barnard (1988) commented on the increased number of textbooks
available due to the increased number of college students. For instance, they noted that as
the increase in number of college students slowed down, the increase in number of
textbooks being published also slowed down. Interestingly, they also noted that less
47
unique textbooks were being published than before (a few examples were provided),
making textbooks more similar to each other. They also argued that publishing a new
textbook may cost as much as $500,000 (which they cited a personal communication),
making it, according to the authors, too costly to constantly update or create new
textbooks. The increased cost may be due to advancements in technology; therefore,
these advancements may actually cause a decrease in textbook production rate, not
increase.
Increases in publishing costs may also be due to the trend of textbooks becoming
longer. The first 900-page textbook was published in 1957, the first 1000-page in 1971,
the first 1100-page in 1977, and the first 1200-page in 1985. As noted by the authors, it
was the majors’ textbooks that appeared to increase in length; the non-majors textbooks
tended to be shorter and were published more often than majors’ textbooks.
From the textbooks described above, 29 textbooks (11 from 1950-1954, 11 from
1955-1959, and 7 majors’ texts from 1982-1987) were studied in greater depth; all
textbooks were for majors but it was not stated how the texts were selected. Sample pages
were selected from the textbooks. The authors started on page 50 and sampled 10-page
sets, with 100 pages between each set. For each sample, the number of pages that just had
text, had drawings, or had photographs was recorded. Although not specifically
mentioned, it was assumed that the authors provided the average of all sections since
displayed graphs in the article indicated “number per ten pages” (Blystone & Barnard,
1988, p. 51) with an axis ranging from 0 to 6. The averages for the three groups showed
that the number of pages with only text dropped, the number of pages with drawings
increased slightly, and the number of pages with photographs nearly tripled from the
48
1950’s to the 1980’s. However, since it was unclear how the textbooks were selected,
these conclusions may not be generalized to all textbooks originally described.
Blystone and Barnard (1988) argued that several different factors contributed to
the increased length of textbooks throughout their paper. For instance, they argued that it
was due to trying to make textbooks less encyclopedic. Another argument was that
instructors wanted the newest information included without taking out the older
information. At one point they stated that the increased number of graphics was due to
trying to shorten the textbook since they take less room than text describing the same
concept. However, at another point, they described that graphics need a large amount of
room, making textbooks larger in number of pages and surface area. Overall, several
arguments were given, but very limited supporting evidence was provided.
In predicting what will happen to “future” (year 2000) textbooks, Blystone and
Barnard (1988) concluded that the number of textbooks published would either continue
to slightly increase or remain constant. They also predicted that textbooks would continue
to increase in size; in the year 2000, the average number of pages per textbook should be
about 1450 pages. In addition to this, they predicted a continued increase in the number
of graphics used in textbooks. With these predictions, Blystone and Barnard (1988)
questioned whether these textbook trends, if continued, would benefit the scientific
community (e.g., recruit new scientists).
The last two studies previously discussed (Blyston & Barnard, 1988; Mertens &
Polk, 1980) examined several different variables regarding textbook features. A much
more recently published study (Rybarczyk, 2011) narrowed its focus on textbook images.
Further, instead of comparing several textbooks to each other, he compared and
49
contrasted the images used in general biology textbooks, sub-discipline-specific
textbooks, and journal articles. The purpose of doing so was to look at an often neglected
part of scientific visual literacy. Students should be able to interpret images, such as
graphs, that are used in primary literature; however, it was unclear if textbooks prepared
students for this type of scientific literacy. This could be done, for instance, by using
similar images, such as graphs, within the textbooks and by incorporating questions that
required students to interpret these images.
Five college general biology textbooks and five sub-discipline specific textbooks
were examined (textbook citation information provided; CD bundles were excluded from
analyses). It was not described how these particular textbooks were selected; the
textbooks ranged in publication date from 1998 to 2010. Textbook sub-disciplines
included cell biology, biochemistry, developmental biology, genetics, and immunology.
Regardless of the length, ten chapters were randomly selected from each textbook. Seven
journals were selected by the author, which varied in sub-discipline in order to cover the
range of topics from all textbooks. However, since half of the textbooks were general
biology textbooks, it was unclear why Rybarczyk (2011) did not use journals that covered
a wide range of biology topics, such as Nature. From each journal, one or two issues
were selected and 30 articles were chosen (210 articles total for all journals combined). It
was not mentioned if the issues or articles were randomly selected. The journals, but not
the actual articles, were provided; it was also unclear if the articles were recently
published or ranged in publication date like the textbooks did.
All images within the selected textbook chapters and journal articles were
categorized into one or more of several main categories (e.g., graphics, tables,
50
photographs). Categories were defined after examining all chapters and articles;
Rybarczyk (2011) validated the categories by citing another source that found similar
ones. If an image was in more than one category it was considered more complex than if
it was in only one category. In the description of the analyses the term ‘figure’ seemed to
have multiple definitions. Sometimes it was described separate from tables and other
times it included the tables as well. For instance, “the number of figures and tables…were
added together to determine a total number of visual representations;” later it was
described “the number of visual representations in each category was then divided by the
total number of figures analyzed in the sample” (Rybarczyk, 2011, p. 109). One of the
categories of the visual representations was “table” so the total number likely included
figures and tables, not just figures. Unlike several of the other articles, Rybarczyk (2011)
also provided statistical analyses. In comparing the distribution of categories of different
types of texts, a Pearson’s chi-square test was used. A one-way ANOVA was used to
compare the distribution of texts within a category (it was not defined if data were
normal).
Rybarczyk (2011) also noted which images illustrated empirical data. This
category excluded images that were added to the original image for clarification or
emphasis and images that were used in the end-of-chapter questions, but included images
in “special case study sections.” End-of-chapter questions were analyzed separately.
It was found that textbook chapters contained mostly diagrams while journal
articles contained mostly graphs and gel images. More figures were classified in more
than one type of category in the articles than in the chapters, which Rybarczyk (2011)
suggested this meant that images were more complex in journals than textbooks. There
51
were significantly more images with empirical data in journal articles than textbook
chapters, which I did not find surprising since textbooks also need to depict basic
concepts that article authors expect the readers to understand. Sub-discipline-specific
textbooks had significantly more of these images than general biology textbooks.
Rybarczyk (2011) reflected that although all textbooks had some images that provided
technique, it would have been helpful to include data that resulted from the technique.
However, it was unclear how the textbooks were actually selected, so generalizations to
other textbooks in this field may be invalid.
As Rybarczyk (2011) commented on, students need explicit practice with reading
graphs and tables, which could be done in the end-of-chapter questions. Sub-discipline
specific textbooks had these types of questions more often than general biology courses,
but most questions were still geared toward content rather than data interpretation.
Rybarczyk (2011) concluded that instructors may have to go beyond the textbook to
primary literature in order to give their students practice reading and interpreting graphs
so that they may increase their scientific visual literacy. This could be done whether
students are given articles to read or graphs are projected in front of the class to discuss.
Another way to examine textbooks is to determine their readability. Major and
Collette (1961) and later Walker (1980) assessed the readability of college general
biology textbooks in order to compare to students’ actual reading abilities (summarized
from other studies). Major and Collette (1961) performed their study since most research
at that time had been completed on secondary-level textbooks, not college. Nearly 20
years later, Walker (1980) used similar procedures as Major and Collette (1961) so that
he could compare the findings of the two studies. Readability was measured using Flesch
52
Reading Ease formula, which had been validated before the 1961 study and again before
the 1980 study. The formula counts the number of syllables used in sections and the
number of words per sentence. The formula also takes human interest into account by
calculating the number of personal words used, such as personal pronouns. Walker
(1980) used the same formula for human interest but calculated readability with a
computer program.
In order to determine the selection of textbooks, surveys were sent out to
instructors in the United States asking if they used a general biology textbook, and if so,
which one. Major and Collette (1961) sent surveys out to 168 colleges; they selected
smaller universities since they were more likely to have one general biology course
instead of splitting up biology into two courses (botany and zoology). Of those
universities, 136 responded and 101 used general biology textbooks. Walker (1980) sent
out surveys to 75 colleges and 56 responded (he did not state why he did not try for a
larger sample size, like Major and Collette). Both studies selected universities that
offered general biology courses instead of separate zoology and botany courses. Major
and Collette (1961) chose the top ten textbooks and Walker (1980) selected the top eight
textbooks (since five textbooks were tied for 9th
place).
Sample selection slightly differed between the two studies. One hundred-word
samples were selected after every 10 pages in Major and Collette’s (1961) study while
Walker (1980) selected 100-word samples after every 12 pages. Walker stated that “a
previous study had shown that the 12-page sample did not produce results that varied
significantly from the ‘every tenth page’ chosen by Majors and Collette” (1980, p. 30)
but did not cite a previous study or describe it any further. The Flesch Reading Ease
53
formula was then used in each sample to determine readability and human interest; this
formula was also converted to grade level. Textbook findings were then compared to
previously found student reading ability. Walker (1980) used more recent studies on
student reading ability, which showed a lower reading ability of college freshmen (10th
-
grade level) than what Majors and Collette described (1961; 11th
grade for average
students; 12th
grade for above-average students). Walker (1980) then used a t-test to
compare the average readability that he found to the earlier study; human interest
comparisons were qualitatively described.
Overall, both studies showed that textbooks were written at a freshmen or
sophomore level, which was beyond the freshmen’s actual reading ability (Walker found
no significant difference between his study and the earlier study; p-value was not
provided). Interestingly, Major and Collette (1961) found that syllable count was the
more likely contributing variable to high readability scores since sentence length was
actually appropriate for ninth to 12th
grades, depending on the textbook, while syllable
counts were more appropriate for college sophomores or juniors (Walker did not
comment on this, which could have been simply because the printout from the computer
program did not provide it). They also found the level of difficulty remained the same
throughout each textbook. All textbooks in Major and Collette’s (1961) study were found
to be dull, which is the lowest human interest score; Walker (1980) had six of the eight
textbooks classified as dull, whereas one was found to be mildly interesting (the next
score level), and another one was interesting.
Major and Collette (1961) recommended that introductory college biology
textbooks be written at a lower reading level so that students may better understand the
54
content. As Walker (1980) found in his study, publishers likely did not take Major and
Collette’s (1961) conclusions into account when editing textbooks. On the other hand,
Walker (1980) questioned whether textbooks should be written at a lower level and
provided some quote examples from the previously described survey regarding which
textbook was used by instructors. Some instructors thought that textbooks should be
written at a lower level and others felt that students need to learn how to read at that
level. Walker (1980), however, did recommend that textbooks be written with a higher
human interest component so that students can experience this part of science.
Readability is one component that can impact students’ comprehension of
textbooks; another is providing cues throughout the textbook to students, which was what
Goetz et al. (1987) examined in their study. Cues found from previous studies to be
helpful for students’ understanding included providing objectives, describing personal
stories, asking questions, even rhetorical questions, listing possible additional readings,
and including summaries.
Goetz et al. (1987) used five general biology and five psychology textbooks in
their analyses (textbook citation information was not provided). Textbooks were selected
by talking to instructors who taught the respective courses. Since it was not stated if
surveys were sent out to various institutions, it was assumed that instructors were likely
from one institution, which does not necessarily reflect which textbooks instructors at
other institutions would select. Each textbook was split into three sections (beginning,
middle, and end) and a chapter (excluding the first chapter) was randomly selected from
each section. From each chapter, three samples were selected which included the first and
last page of the chapter and another randomly selected sample, which consisted of five
55
pages from the psychology textbooks and four pages from the biology textbooks.
According to Goetz et al. (1987), differences between disciplines were due to chapters in
biology textbooks being shorter than in psychology textbooks since many biology
chapters were only 15 pages. However, the total sample per chapter would be seven
pages instead of six, so it was unclear why a five-page sample would be impossible with
biology textbooks.
Coding categories were selected (from previous studies) before coding began and
then modified during coding (i.e, two codes were removed and two were added). Final
coding categories were “attention focusing, relating text to reader, interest enhancing,
information transformation: graphics, information transformation: textual, and
organizational aids” (Goetz et al., 1987, p. 5). General examples of each category were
provided, along with additional details, such as each objective and every key word in
bold being coded individually and each story having an individual code. Intercoder
reliability was assessed by comparing analyses of one chapter; correlation was high (r =
.97).
For the results, mean frequencies of each code were provided; these were
separated by type of textbook (psychology or biology) and section of textbook
(beginning, middle, or end). Mean frequencies of each major category of the codes were
also displayed for each textbook. Similarities and differences were found between the
two different disciplines of textbooks and among textbooks in general. For instance, as
indicated by the data provided, biology textbooks used more line drawings than
psychology, and psychology texts used more bolded terms than biology. Interestingly, as
seen in the data, the number of bolded terms increased in a psychology chapter but
56
decreased in a biology chapter. Neither discipline offered many cues that reflected
personal interest or humor. Regardless of discipline, some textbooks focused on several
different types of cues, while others only used a few.
Overall, Goetz et al. (1987) concluded that most cues used, regardless of
discipline, were very basic and did not promote much active learning. Examples included
providing summaries but never asking students to summarize for themselves and asking
questions about content but not on analyzing data or a situation. As Goetz et al. (1987)
argued (and provided several sources), active learning is important for students to
understand the material at hand.
Burton (2011) examined terms in animal behaviour textbooks. The number and
frequency of terms, regardless of what the actual term was, was examined. Burton (2011)
called this logodiversity. She selected textbooks by finding 100 animal behaviour syllabi
online (the first 100 that appeared using a search engine) and identifying the six most
common textbooks that also had an index and glossary (six from an original nine most
common textbooks were used since three of them did not have a glossary). The location
of these colleges/universities was not provided. The number of times each term from the
glossary appeared in the index was determined. However, it was unclear by what was
meant by number of times. This may have meant how many times that actual term was
used in the glossary, how many subcategories there were under the term, or the number
of pages that mentioned the term. Additionally, as Burton (2011) discussed, since only
the glossary and index were examined and not the actual text, some terms that were
important enough to be included in the glossary by one author may not have been deemed
important enough to be included by another author. This was also a limitation of Pearson
57
and Hughes’ (1988b) study since they used only terms that were in bold. Therefore, some
terms, or at least how often these terms were actually used, may not be accurately
reflected by using only the glossary and the index.
After terms were tabulated, each term was treated as a species and the index as a
community. The Shannon-Wiener Index of Diversity was used on each textbook. The
diversity index takes into account the number of species and the proportion of each
species within a community. The index score increases with the greater number of
species (or terms) and the more equal ratio of each species (or term). In using this index
with terms, Burton (2011) called it logodiversity, which had not been used before in
textbook analysis.
Logodiversity scores varied considerably between textbooks (3.44 to 29.5). This
meant that some textbooks used many terms but each one was used rarely (high score)
and others used fewer terms and used some of them more often than others (low score).
According to the collected syllabi, logodiversity did not correlate with popularity (R2
=
.11). Moreover, the most popular textbook (45% of all syllabi used) had the second
lowest index score (3.92) and the second most popular textbook (17%) had the highest
index score (29.5). Although Burton (2011) suggested that logodiversity should be taken
in to consideration, no data were provided on if logodiversity actually impacts student
performance.
Burton (2011) recommended that logodiversity should be taken into account when
selecting textbooks; however, since this can be time consuming, she suggested using the
number of terms in the glossary or the ratio of number of glossary terms per number of
pages, since these were highly correlated with logodiversity (R2= 0.9772, R
2= 0.9112
58
respectively). Although this can be helpful for some textbooks, as Burton (2011)
mentioned, not all textbooks had a glossary. Therefore, this method would not work for
all textbooks and requiring the use of this method would neglect some otherwise useful
textbooks. As Mertens & Polk (1980) argued in describing various genetic textbooks,
textbooks should not be ignored if they do not contain a glossary; if the text has an index
and definitions within the text, then a glossary may be unnecessary.
Various types of features have been examined in college biology textbooks, for
different reasons. The goals were similar for many of these studies; typically, it was to
assist other instructors in finding the most suitable textbook for their class, inform
textbook publishers of recommended changes, or both. For instance, Mertens and Polk
(1980) listed several features and gave personal opinions about several genetics textbooks
in order to aid genetics instructors, and Blystone and Barnard (1988) examined general
trends of textbooks and recommended that these trends should not continue in future
textbooks. Rybarzyk (2011) recommended that textbooks should start including more
graphs and questions that require students to interpret graphs, but he also proposed that
instructors go beyond the textbook and include primary literature in their classes. Primary
literature is another possible curricular resource that is discussed in more detail later in
this review.
Although some of these studies did provide recommendations to textbook
publishers, it remains a question if publishers are taking these studies into account. Only
one study actually checked for changes that were previously recommended. Major and
Collette (1961) found readability of general biology textbooks to be above students’
ability and suggested that textbook publishers should require books to be written at the
59
appropriate level of readability. Nearly 20 years later, Walker (1980) performed a similar
study and found that readability of general biology textbooks were statistically the same
even though students’ reading abilities had dropped even lower.
Textbook Selection
Thus far, various formatting issues of textbooks have been examined (e.g.,
Mertens & Polk, 1980); however, do instructors look at format when choosing textbooks?
Burton (2011) suggested that instructors of animal behaviour do not use logodiversity
(the number and frequency use of terms) when selecting textbooks since logodiversity
scale did not correlate with textbook popularity. However, other formatting trends were
not examined in Burton’s (2011) study. The only article found that specifically asked the
question of how instructors chose textbooks was by Harder and Carline (1988). They
surveyed instructors of anatomy and physiology courses for practical nurses and
registered nurses.
Harder and Carline (1988) validated their survey by having instructors comment
on possible criteria. First, they surveyed and interviewed six Washington State anatomy
and physiology instructors; the authors gave them 25 criteria and asked for other possible
ones, gaining 35 more criteria. The 60 criteria were then given to 15 other instructors;
instructors’ comments were used to lower the number of criteria to 41 (only criteria
explicitly discussed in the results section were provided). Each criterion was then placed
on a Likert scale, with a score of 1 meaning that the criterion would result in textbook
rejection, 7 indicating that the criterion would result in textbook acceptance, and 4 as a
neutral response. However, in the results section of this article, scores 1-2 meant
60
rejection, 6-7 meant acceptance, and 2.1-5.9 was neutral (which was a large neutral
range). One hundred schools that had a practical nurses program and one hundred schools
that had a program for baccalaureate nurses were randomly selected and sent a survey,
which was addressed to the main instructor that taught anatomy and physiology. All
states were surveyed; it was not stated if this just happened to occur after randomly
selecting schools or if this was actually a stratified random sample.
Instructors from seventy-two schools (36%) responded to the survey. Those that
taught the course for practical nurses were mostly nurses themselves (N=24 out of 30),
and those that taught the course for registered nurses were mostly scientists (N=19 out of
20). The scoring of these criteria was labeled as either consistent (Variance < 1.5) or
inconsistent. It was unclear why a variance of 1.5 was selected. The results provided
contradicted each other and it appeared that the wrong table may have been included
since it did not explain the text that referred to the table. For instance, it was stated that
“availability of a computer test-bank received equally neutral responses from both groups
(Table 2)” (Harder & Carline, 1988, p. 83). However, Table 2 only included positive
criteria and did not include the criterion of having a computer test-bank. Furthermore, in
the text, it was stated that “four [criteria] were absolutely required (response of 7) for
textbook selection: [each criterion was then listed]” (Harder & Carline, 1988, p. 83).
However, three of these criteria were in Table 2 and showed a mean score ranging from
6.2 to 6.7. Due to the large inconsistencies, valid conclusions cannot be made from this
paper.
61
Textbook Impact on Students
Previous studies have determined that readability of general biology textbooks
were beyond the students’ reading ability (Major & Collette, 1961; Walker, 1980). The
following studies examined how inserting questions within the text (Leonard & Lowery,
1984; Leonard, 1987; Smith et al., 2010) or working with students on their reading
strategies (Harder, 1989) may help students gain a deeper level of understanding while
they read textbooks.
As discussed earlier, Goetz and Schallert (1987) studied various cues provided in
textbooks that may assist students in their learning. One of the types of cues was the use
of questions, which seemed to be used occasionally throughout the chapters of
psychology textbooks but only at the end of biology textbook chapters. Before this study,
Leonard and Lowery (1984; Leonard, 1987) studied the effects on student learning of
having questions throughout a segment of a college biology textbook. They cited several
previous studies, mostly from social sciences and languages, that found students retained
more information with the use of questions at the beginning and end of textbooks, but
none looked at the importance of questions given throughout a chapter, which was why
Leonard and Lowery (1984; Leonard, 1987) studied this. In the first study, Leonard and
Lowery (1984) studied which types of questions may increase student understanding and
later, Leonard (1987) examined how the formatting of the questions may assist students
in understanding the material.
Students in the first study (N = 383) were from a university general biology
course for majors and non-majors (63% were non-science majors); most students (81%)
were freshmen. These students were then randomly placed in to six groups (number of
62
students per group varied); each group was given a different task (described below). The
reading assignment was administered in class and they were told that they would be given
a quiz over the reading that was worth points. The reading material (2769 words) was
from a textbook (citation information provided) and discussed multicellularity (subtopics
described). Students had not received any lecture over the material prior to the reading.
The first group (n = 54) read the passage before the quiz. Groups two through five had 24
questions inserted throughout the same passage; questions were placed at the beginning
of various paragraphs. Each group was given a different type of question: rhetorical
questions (n = 75), recall questions (n = 53), hypothetical questions (n = 79), and valuing
questions (n = 61). Further explanations and an example were provided for each type of
question. The sixth group was a control (i.e., did not complete any reading assignment
but took the quiz; n = 61).
The second study took place one year after the first study; from the description, it
was likely the same general biology course. This time, there were 425 students; 80%
were freshmen and 70% were non-science majors. These students were randomly placed
into seven different groups. Again, one group (n = 61) read the passage without inserted
questions; this time the passage was similar in length (2,354 words) to the first study but
was about bacterial adaptations. The rest of the groups had the same 11 questions (less
than half the number of questions from the first study), but the formatting was different
for each group. These questions were “descriptive or conceptual type” (Leonard, 1987, p.
30) which was a different description from the various types of questions used in the first
study. From the few examples provided, these may be more recall and some
hypothesizing questions. Three groups had a question built into the beginning of each
63
paragraph (like the first study) and the other three groups had a question set above each
paragraph. One of the three groups had the question underlined, another in all capital
letters, and another as the same regular format as the text. Sixty-three students had
questions built into the paragraph with no formatting changes, 66 had built-in, underlined
questions, 64 had built-in, all-caps questions, 56 had questions separate from the
paragraph with no font changes, 54 had separate, underlined questions, and 61 had
separate, all-caps questions. No control group was used in the second study due to the
results found in the first study.
For both studies, the quizzes consisted of 20 multiple choice questions, including
both basic recall and application questions. It was unclear how many of each type were
selected; the results were also never separated by type of question. The quizzes were
validated by three university biologists and both were given to a previous semester’s
class, underwent point-biserial analysis and edited accordingly. It was unclear if the
questions inserted into the texts underwent the same rigor and how similar they were to
the questions on the quizzes. For the first study, students took the quiz immediately after
the reading, two weeks later, and nine weeks after the initial quiz (Leonard & Lowery,
1984). A lecture over the material was given between two weeks and nine weeks.
Although that may present another variable, Leonard and Lowery (1984) argued that
completing the reading and then having a lecture was more reflective of what students
would do in class. The second study administered the quiz immediately following the
reading assignment and again four weeks later. It was never discussed if a lecture on the
material occurred before or during the study.
64
For the first study, every time the students took the quiz, the group that did not do
the reading assignment scored lower than the rest of the groups (which was why the
second study did not use a control group) and the group that did the reading assignment
without questions scored the highest. In fact, during the second week, the group without
questions did significantly better than all of the other groups (p < .05; Dunn Multiple
Comparison Test). The only group with questions during the second week that did
significantly better than the control group had hypothesizing questions. After nine weeks
and the lecture, those with factual questions and hypothesizing questions (and no
questions) still did significantly better than the control group (all groups, including the
control had the lecture). Groups with questions were not compared to each other.
Although the students that did the best for the first study read the text without
questions, the students in the second study without questions did worse than all but one of
the groups on the first test and scored the worst four weeks later. The students that did the
best on the first and second quizzes were those that had regular font questions inserted at
the start of the paragraph (significantly better at p < .05 on the first quiz but not on the
second). The next top two groups for the first quiz were the other two groups that had
questions at the beginning of the paragraph (one had it underlined and the other in all
caps; all significantly higher). The questions set above the paragraph received poorer
grades on the first quiz but that was not the case for the quiz taken four weeks later. None
of the groups did significantly better than the no-questions group on the second quiz.
Since the first study had the questions at the start of the paragraph, the second study
seemed to further contradict the first study.
65
This contradiction was never discussed in the second study. The first and second
study were fairly similar, yet the only time the first study was brought up by Leonard
(1987) was in the introduction when he stated
In one study, retention of biology concepts due to reading was found not to be
improved by occasional questions inserted in the passage at the beginning of
selected paragraphs, regardless of whether the questions were rhetorical, factual,
or oriented toward the use of science processes (Leonard & Lowery, 1983). In the
same study, inserted questions, even those oriented toward science processes,
were generally found to result in less learning, particularly over mid- and longer
range time intervals. Results of this study did not agree with most of the previous
studies using adjunct pre- and postquestions in text. (Leonard, 1987, p. 29).
It should also be noted that the year in the quote is a typographical error and does not
match with the citation put in the reference page. As seen in the quote, it was never
mentioned that this study was an extension of his previous (Leonard & Lowery, 1984)
study.
If questions do help students, as concluded in the second study (Leonard, 1987),
then it appeared that questions that were inserted at the start of the paragraph without any
formatting emphasis seemed to aid students the most. He suggested that this may be the
case since they share the same formatting as the rest of the text and, therefore, students
were less likely to skip over them. Additionally, it might be helpful not to have too many
questions; both studies had about the same number of words in the reading assignment,
but the second study used half as many questions as the first. This was not mentioned by
Leonard (1987), but it may have influenced the results.
All in all, the results of the first study indicated that reading the text, in general,
helped with understanding the material, even when the reading assignment occurred
several weeks before the lecture and quiz. Based on the methods used, it could also be
argued that receiving the information twice rather than only once would improve
66
comprehension, regardless of how the material was received. No control was used in the
second study for comparison. Interestingly, the readability of the textbook was a 13.5
grade level. As previously described by Major and Collette (1961) and Walker (1980),
college freshmen tend to read at a 10th
or 11th
grade reading level. Therefore, even if the
readability was higher than their capability they still comprehended at least some of the
material.
In order to overcome the high readability level of science textbooks, students
could be introduced to various reading strategies, which was what Harder (1989) did in
her study. She did this in order to find if these reading strategies would improve students’
attitudes toward reading anatomy and physiology textbooks and improve their
understanding of the content. The sample of students came from two different community
colleges; three anatomy and physiology lab sections from each college were used in this
study. All students began the study with a demographic and an attitude questionnaire.
The attitude questionnaire (with 10 questions) was modified from a published survey and
was validated by five doctoral students in science and educational psychology. It was
written with a bipolar scale, not a Likert scale; therefore, students were forced to answer
either positively or negatively for each question. According to Harder (1989), the
questionnaire measured students’ attitudes toward reading science textbooks. However,
each question (the questionnaire was provided) asked specifically about anatomy and
physiology, not science textbooks in general. Therefore, their responses cannot be
generalized to how they feel about all science textbooks.
After filling out the initial attitude questionnaire, each group received a different
10-minute lecture; it was assumed that “group” meant two lab sections, one from each
67
college. One group received a lecture on assessing their own understanding of the
material by using “the SPAR procedure: Scan passage, Plan reading strategies, Act on the
plan and Revise the plan if needed” (Harder, 1989, p. 209). Another group was taught to
write notes in the margin, either about the content or their thoughts on the content. The
third group was a control and they were taught the metric system, particularly the
prefixes.
This activity took place over a two-week time span. During this time, students
kept a calendar, recording each day that they used their prescribed reading strategy. After
the lecture, students read a passage from the textbook and took a quiz over the content
(no further information on the passage or the quiz was provided). They repeated this
process with a different passage one week later and then two weeks later. At two weeks,
students took another attitude questionnaire. It was not stated if students ever received
any classroom instruction over the material covered in the textbook passages.
According to Harder (1989), student attitudes were fairly positive for both tests.
The average score for the first group was 7.63, the second group was 8.44, and the
control group was 8.96. It was only mentioned that the maximum possible score was 10;
since this was the number of questions, it was assumed that a positive answer was coded
by “1” and a negative answer by “0” and score was the sum of all questions. Further,
although attitude was labeled as positive, due to the bipolar responses available, students
could not respond as feeling neutral for any questions. Further, it was not stated who
actually collected the data. If the instructors administered and collected the questionnaires
and were able to see them right away, students may have felt inclined to be positive. At
68
least for each question the positive answer varied from being the first or second possible
answer available.
When the first and second attitude questionnaires were compared, the two groups
with reading strategies increased by ½ point and the control group decreased by ¼ point.
However, this would require only ½ the students to respond positively to at least one
main question, which may happen by chance anyway. Each question was also analyzed
separately; but average scores for each were not provided. The methods were unclear, but
from reading the results it appeared that each group was analyzed separately and the
comparison was made between the first and second test for each question. Only one
question from one group had a significant change; however, the statistical test and results
were not actually provided. This question was for the second question of the first group.
According to Harder (1989), those students that were taught how to analyze their own
comprehension of the reading seemed to feel that reading the anatomy and physiology
textbook took about the same time as the non-science textbooks; whereas before they felt
that the science textbook took longer. The one question with a negative response was if
students could stay focused or drift while reading the textbook. However, I do not know
if this is necessarily a “negative” answer since textbooks are created to inform not
entertain. Students were split on the idea that reading the textbook was “torture” or
“informative” (these were the two possible answers for this question). Otherwise,
responses were fairly positive. Again, no averages per question were actually provided;
these were the points that Harder (1989) concluded. Harder (1989) also commented that
students from each group statistically did the same on the quizzes (statistical tests not
69
described). Due to the nature of the questionnaire and the lack of clear results, these
conclusions should be taken with caution.
Overall, students seemed to find assessing their own reading to be most helpful
since, according to the calendars, students, on average, used this method twice as often
(19.1 days) as those with the second method (9.5 days). The control group did hand in a
calendar but did not record any days. Therefore, although textbooks can be difficult for
students to read, they may find it beneficial to learn some specific ways to approach
reading the textbook.
Smith et al. (2010) sampled students from a non-majors biology course. Studies
were done in the laboratory sections; all sections were used except those that were taught
by the authors (Smith was the main instructor for the course) and those that took place in
the evening (15 sections were used; N = 294). Not only was this one of the few studies
done in the college biology classroom, but, according to Smith et al. (2010), it was also
one of the few that occurred in a more natural setting (i.e., the classroom rather than a
research station). The basic design of the study was that students first took a test on
human organ systems and then a test on verbal ability. One week later, students read a
passage copied from their textbook on digestion; half of the students had assigned
questions relevant to the text and the other half did not. After they had read through the
passage and the treatment group answered the questions, students handed in the material
and took a posttest over what they just read.
The first test was over six human organ systems, excluding digestion. A standard
pretest was not used since having participants take a test identical to the test that they will
take later can cause validity issues. Instead, it was assumed that students would know
70
about the same amount for each organ system, so they tested over several different ones
that did not include the digestive system. However, a comparison of similar scores for
each organ system tested was never actually described. The test consisted of 20 questions
taken from Advanced Placement biology practice tests. Verbal ability was measured by
the second test. Forty-eight multiple-choice vocabulary questions from the Kit of
Reference Tests for Cognitive Factors were used. Smith et al. (2010) cited several studies
that examined the reliability of these tests, but selected populations of study were not
mentioned.
One week after the pretests were administered, students read the passage (3,212
words) that was copied from their textbook (citation information provided) over
digestion. All images were removed; according to Smith et al. (2010) this was typical to
do in why-question studies. Half of the students also had a sheet of 21 why-questions that
went over material from the text about every 150 words (21 questions total). Each
question started with a paraphrased statement from the text (it was paraphrased so that
students could not just find the same line in the text) and was followed by “why is this
true?” (Smith et al., 2010, p. 368). Individual students, not entire sections, were randomly
assorted into either the control group (instructed to read the material twice but did not
have any questions) or the treatment group (instructed to read the material once and
answer the questions provided as they read). Instructions were provided on a piece of
paper. Before given any materials, students were shown via transparency and audio
recording a sample of text from a different chapter and possible posttest questions.
Students were told that there was no time limit and the timing it took for each student was
recorded. Only 248 that took the pretests were also present during this part of the study.
71
The questions given to the treatment group were free-response and were rated
using a similar method as previous studies (several were cited). They were rated as
adequate-linked (a scientifically correct statement that was relevant to the question being
asked), adequate-not linked (a scientifically correct statement but was not relevant to the
question being asked), inadequate (not a scientifically correct statement), and no
response. There were two raters; one rater rated all responses and the other, who was not
part of the study, rated one quarter of all of the responses. Inter-rater reliability was 92%.
After completing the reading assignment, students turned in the text and
questions, if they had any, and then they were given a posttest to take (all students took
the same posttest). According to Smith et al. (2010), the test consisted of 105 true-false
statements. However, there was really 21 “what” questions created from the 21 “why”
questions. The why questions asked why a certain statement was true and posttest
questions asked which statements were true. For each question, five statements were
provided and students had to circle all correct answers. Therefore, the posttest really
consisted of 21 questions, each with multiple (five) true-false statements, which made a
total of 105 true-false statements. An example from the text, the associated “why”
question and “what” question, and the five corresponding statements were provided.
Smith et al. (2010) argued, and cited others, that since the questions were paraphrased
from the text, the questions tested for comprehension and not just recall. Reliability was
measured with Cronbach’s alpha and was 0.60, which is on the low end of being
considered reliable.
Verbal ability and prior knowledge were the same for both groups, and correlated
with each other (correlation = .19). Both were positively correlated with posttests (.35
72
and .27, respectively). In other words, students with high verbal ability and/or high prior
knowledge tended to do better on the posttests for both groups. Student’s age or time
spent on the reading assignment did not correlate with posttest scores. The rest of the
statistics discussed were completed via one-way ANOVA, unless otherwise mentioned; it
was not mentioned if data passed tests of normality.
Posttest scores were significantly higher for the treatment group than the control
group (p < .001). Within the treatment group, those with higher prior knowledge also did
significantly better than the lower prior knowledge students (p < .001); the same was
found for the control group (p < .020) and for both groups combined (p < .001).
Those with higher verbal ability performed better on the posttests than those with
lower verbal ability (p < .035). In examining only those with lower verbal ability, those
in the treatment group did significantly better than those in the control group (p < .001),
but the same was not found for those with higher verbal ability (p < .227). Therefore, it
appeared that the why questions seemed to help those with lower verbal ability more so
than those with higher verbal ability. It was assumed that these types of differences were
not found for amount of prior knowledge since it was never discussed.
Why question responses were assessed for 2/3 of the students (99 students; 2,079
responses total). Most responses (75%) were rated as adequate-linked; 16% were
adequate but not linked, 7% were inadequate, and 1% did not have a response. Students
were then scored based on the number of adequate-linked responses; then they were
separated into two groups- higher scoring and lower scoring. It was found that those
students that provided more adequate-linked responses also scored higher on the posttests
(chi-square test, p < 0.029). The same was done for those that provided inadequate
73
responses and it was found that those that provided less inadequate responses did
significantly better on the posttest than those that provided more inadequate responses (p
< .005). The same was not found for adequate, not-linked (p < .562), and tests were not
done for students that did not provide any answers since the number of no responses was
too small.
All in all, students performed better when asked to answer questions while they
read the material. Furthermore, it was found that those that provided scientifically valid
and relevant answers did better than those that did not. Therefore, Smith et al. (2010)
recommended that college biology professors assign questions with reading assignments,
and not only assign questions but check answers to questions. Not checking for answers
at all may be why Leonard (and Lowery, 1984; 1987) found conflicting results for
inserting questions throughout the reading. Further, Smith et al. (2010) suggested that this
should be only occasionally done; not for every reading statement that they read, but only
for certain portions of the reading assignment. Having too many questions may also be
why Leonard and Lowery (1984) found questions to hinder students’ understanding.
Unlike the previous studies that discussed the incorporation of questions into text,
Barsoum et al. (2013) examined how the integration of math into a biology textbook
would impact student learning of both biology content and math skills (summarized in
Feser et al., 2013). In order to do so, they (two biology and one math faculty member)
created a new textbook that aligned with AAAS Vision and Change document (2010).
The textbook was separated into five topics, instead of separating by molecular and
organismal. Additionally, they attempted to minimize the level of jargon and made it a
rule that a vocabulary term would have to be used at least three times in a textbook in
74
order to be incorporated into the textbook at all. Moreover, students were expected to
determine some conclusions on their own so that the textbook was not just a list of facts.
There were also occasional case studies that showed how the math topics applied to
society. The main concern, however, was the integration of math into the biology
textbook. Barsoum et al. (2013) developed BioMath Expectations, which utilized figures
from published literature and used basic math to explore biological topics.
Once the textbook was created, it was piloted in an introductory biology course.
One section of the course (30 students) used the textbook and two others (63 students)
used a commercial textbook that they had used for years. The textbook was the only
intended difference between the courses, although each course was taught by different
teachers. All courses used the same activities and tests (periodic ungraded data
interpretation tests and graded content tests), and all teachers used a modified Socratic
method. The same figures from the new textbook were shown to the class as well, but it
was unclear if they were shown to all sections or only the section that used the new
textbook. It was stated that the only difference between the courses was the textbook, so
it would make sense that the PowerPoint was shown to all sections.
In order to assess learning, biological content tests and interpretation quizzes were
administered four times during the semester. An ungraded attitudinal survey was also
provided during the first week and during the last week of class. All three assessments
were given again at the end of the following semester, which was the second course of
the introductory sequence. The content tests were given in class, and the interpretation
quizzes and attitudinal surveys were provided online. All assessments were created by the
authors and course instructors. The content test contained 16 multiple-choice questions
75
that covered content covered in class. For the last content test given at the end of the
second semester, four questions from each test were selected (two with the best average
score and two with the worst average score). The interpretation quiz consisted of figures
from published articles covering content that had not been covered in class, along with a
description of the study. Students were given five to 10 possible conclusions and students
had to indicate if each conclusion was true or false, given information from two articles
(figure and description). The final test given at the end of the second semester had 14
possible conclusions. All quizzes were not compared together; instead, they were
compared individually in order to determine trends throughout the semester. The
attitudinal test asked students how they felt about their own biology abilities and the
definition of biology, using a five-point Likert scale. The last test given at the end of the
second semester also asked students to compare the two semesters. Data were analyzed
by the authors that did not participate in the textbook development and course instruction.
t-tests were used to compare the experimental course with the traditional courses.
The two groups of students performed the same on the content tests during the
first semester (average for experimental was 61.1% and for traditional was 61.8%; p =
.737). On the other hand, at the end of the second semester, students in the experimental
group (25 of the original 30) performed the same as those that took the traditional course
(40 of the 63; p < .062), although Thompson et al. (2013) still described that the
experimental group did better than the traditional and suggested that the experimental
group retained the information better than the traditional group. For the interpretation
quizzes, students in both groups performed about the same on the first two quizzes of the
semester (experimental 1st average: 62.9%; traditional 1
st average: 63.1%; experimental
76
2nd
average: 55.5%; traditional 2nd
average: 56.4%). But, the experimental group did
significantly better than the traditional on the third test (74.0%, 65.5%; p < .01) and
fourth test (68.1%, 63.8%; p < .05). On the other hand, at the end of the second semester,
both groups, again, did equally well (63.1%, 63.6%; p = .917).
For the attitudinal surveys, the students that were in the experimental group
initially rated themselves significantly higher in their perception of their ability to apply
concepts to novel situations (p < .001) and to interpret data (p < .01), even though
students were unaware of the experiment while signing up for courses. They both
perceived their knowledge of biological concepts the same. Interestingly, at the end of the
semester, the traditional group’s perception on their ability increased while the
experimental group’s perception decreased on the same statements (p < .05 for all
statements). Both groups had the same perception at the beginning of class pertaining to
biology being a set of facts, but the experimental group changed their attitude at the end
of the semester (p < .05) and continued with similar attitude at the end of the second
semester while the traditional group did not change their perception. At the end of the
second semester, students were asked to compare their current course with the previous
course (which was the course that the experiment took place). Both groups believed that
they were different, but when specifically asked about amount of memorization, 80% of
students in the experimental group but only 12% of the traditional group thought the
second course required more memorization than the first one.
All in all, it is not clear if the new textbook helped students with their math skills
and biology content. Both groups performed the same the following semester regarding
77
math skills. Moreover, both groups learned about the same content, although group of
students that used the new textbook retained the biological content longer.
Of the studies discussed in this section, only the last two (Barsoum et al., 2013;
Smith et al., 2010) provided clear and appropriate methodology. Leonard’s (1987) results
seemed to contradict his earlier results that he found with Lowery (1984), but he never
discussed this discrepancy. Harder’s (1989) study appeared to be full of possible validity
issues. Therefore, this section concludes only with Smith’s et al. (2010) and Barsoum’s et
al.’s (2013) findings. Smith et al. (2010) described how having questions to answer, and
answering those questions adequately, can help students gain a deeper understanding of
what they just read. Their results were similar to several other previous studies from
different disciplines and grades (reviewed in Smith et al., 2010). As Smith et al. (2010)
concluded, it has been established that having why questions inserted into the text seemed
to aid students while they were reading. They recommended that further details should be
examined such as how often questions should be inserted and what possible reading
strategies could further aid students’ understanding of the reading material. Barsoum et
al. (2013) found other aspects of textbook formatting may be helpful, but it was
inconclusive which formatting changes impacted learning. It may have been the reduction
in jargon, the change in set-up of topics, the case studies, or the example figures from
primary literature. More research is necessary in order to determine which of these
formatting issues impact student learning.
78
Conclusion
Several studies have been completed on various topics and formatting issues in
college biology textbooks. However, topics were often narrowly focused. How are
textbooks portraying the fundamental aspects of biology, such as evolution? Additionally,
no consistent method was discovered for studying textbooks. How should textbook
analysis be completed?
Laboratory Manuals
Although textbooks are an important curricular resource for the college biology
classroom, much of the class time, especially for introductory courses, is also spent in the
classroom laboratory. One of the main resources used in the laboratory are lab manuals,
which is why an entire section is dedicated to lab manuals in this review. Yet, only two
studies have been completed on college biology laboratory manuals. Both of these studies
focused on the level of inquiry found in them (Basey, Mendelow, & Ramos, 2000;
Tweedy & Hoese, 2005), although Basey et al. (2000) also were interested in the various
biological topics covered in exercises while Tweedy & Hoese (2005) only used exercises
on diffusion. The purpose of analyzing the level of inquiry in the exercises was due to the
benefits of using inquiry (several studies provided by both) and the lack of inquiry found
in high school biology lab manuals (both cited studies).
Colorado community colleges were the population of interest for Basey et al.
(2000). Six of these colleges (names provided) were randomly selected and their lab
manuals (names provided when commercial ones were used) and syllabi for their general
biology courses were collected. Exercises were defined as weekly exercises unless two
79
topics that were treated as separate exercises for one school were combined in another;
then those two topics were coded separately for everyone. The type of technology used
(e.g., microscope) was also included.
Tweedy and Hoese (2005), on the other hand, selected 10 manuals (citation
information provided). Selection was based on obtaining variety, not on popularity.
Manuals varied based on whether they were commercially or non-commercially
published, for a community college or four-year college/university and for non-majors or
majors. Most manuals were for general biology courses, except one for botany and
another for zoology. From each manual, the chapter on diffusion was selected, which
contained multiple exercises in most lab manuals. A total of 63 exercises were analyzed,
each as a separate unit.
Both studies based their analysis for the level of inquiry on the Laboratory Task
Analysis Instrument, which was created in 1978 for high school textbooks that contained
lab exercises. It had since been modified for use on lab manuals for high school biology
classes (both cited same studies). Analyses were similar to many of the previously
described studies on topics in textbooks in that they used content analysis. The modified
instrument separated a lab activity by major task: “problems/hypotheses, inference
variables, methods, performance, solutions, [and] extensions” (Basey et al., 2000, p. 81);
Basey et al. (2000) also separated the task of solutions into two tasks, analysis and
interpretation, since they argued that providing the results is different from interpreting
what the results meant. Later, Tweedy and Hoese (2005) modified the task names, but
they were still similar tasks: “pre-lab activity, student planning and design, student
performance, student analysis and interpretation, [and] student application” (p. 152).
80
Tweedy and Hoese (2005) also provided all codes for each main task and assessed each
activity by the frequency of each code; whereas, Basey et al. (2000) defined inquiry
based on whether the manual had students create at least 50% of the material themselves
(versus providing the material to them). If this occurred then the task was coded as one
point, making up to seven points possible for each exercise.
Both studies also checked the reliability of their coding methods. In Basey’s et al.
(2000) study, each of the three authors coded the lab manual for one college; then, for
each exercise, they compared the level of inquiry each author determined. An ANOVA
(unclear if data passed tests of normality) test was used and no significant difference was
found between the authors (p > .05, exact p-value was not provided but t = 2.31, d.f.=
12,2 was found, making the p-value quite large). Therefore, Basey, alone, did the rest of
the coding. For Tweedy and Hoese’s (2005) study, first Tweedy and two others (unclear
if Hoese was one of these people) coded one activity from each lab manual and compared
results. They stated that “inter-rater reliability was 80%” (Tweedy & Hoese, 2005, p.
152); however, this was actually inter-coder reliability. Due to the high reliability,
Tweedy coded the remaining exercises.
For Basey’s et al. (2000) study, two schools used lab manuals in which all
exercises were created by the instructors, one school used only commercialized lab
exercises and the three others used a mix. From all of the lab manuals, 24 different topics
were covered, but only four were covered by all manuals (the scientific method, mitosis,
meiosis, and photosynthesis). Several other topics were covered by all but one lab manual
(microscopy, diffusion and osmosis, cells, Mendelian genetics, respiration, and enzymes).
The exercise with the highest level of inquiry across the board was the scientific method,
81
which ranged from a score of three to six (average levels of inquiry are discussed below).
Technology used included mostly microscopes, but gel electrophoresis, a computer,
spectrophotometer, and manometer were other types that were occasionally used. A
computer was only used for Mendelian genetics simulations and a graphing exercise.
Interestingly, the level of inquiry was lower for the lab exercises that included technology
(p < .01); however, when those that used microscopes were taken out, no difference was
found in the level of inquiry (t = .88; d.f. = 51; p > .05).
Basey et al. (2000) found the level of inquiry in the labs was generally low (mean
ranged from 1.6 to 2.8 for lab manuals; highest score available was seven). Since Tweedy
and Hoese (2005) did not measure the level of inquiry, the studies cannot be compared in
this way. On the other hand, both studies commented on which major tasks were
performed by students and which were provided to students; Tweedy and Hoese (2005)
broke each task even down further.
The pre-lab included very little inquiry for both studies and Tweedy and Hoese
(2005) commented that they contained mostly reading; half of the exercises also had
students answer questions. Moreover, both studies found that about a quarter of the
exercises had students question, make predictions and/or create a hypothesis. Most
exercises (~80%) from both studies provided the methods for students to complete, and
Tweedy and Hoese (2005) further explained that 18% of exercises had teacher
demonstrations instead. In Tweedy and Hoese’s (2005) study, the two exercises that had
students create their own methods were for non-biology majors (six exercises from
Basey’s et al. (2000) study had students develop their own methods). For data analysis,
38% of Basey’s et al. (2000) exercises had students provide some sort of data analysis
82
(e.g., graphs, statistics), but the percentage appeared lower in Tweedy and Hoese’s
(2005) study (percentage of exercises for each sub-task ranged from 8% to 22%).
Interestingly, exercises more often asked for conclusions rather than any data analyses
(~54% from Basey et al., 2000 and 60% from Tweedy & Hoese, 2005). Tweedy and
Hoese (2005) further reflected that rarely (14%) did exercises ask for supporting evidence
and most exercises did not ask students to critique the exercise (only two asked for how
accurate it was and three asked to list limitations). Both studies found that exercises
rarely asked students to apply what they learned to new situations.
These two studies differed in their results pertaining to commercialized and non-
commercialized exercises. Basey et al. (2000) found that although the general level of
inquiry was low, it was higher for commercial lab exercises than non-commercial
exercises (.05 < p < .01). Yet, Tweedy and Hoese (2005) found little difference between
the two types. This could possibly be due to Tweedy and Hoese more qualitatively
describing the differences since even Basey et al. (2000) commented that half of the
exercises that had a higher level of inquiry (score of five or higher) were non-commercial
exercises. Both articles suggested that instructors should try to incorporate inquiry into
custom-made lab exercises.
All in all, these two studies on inquiry use in college biology laboratory manuals
found similar results. This is particularly interesting due to the differences in selection of
laboratory exercises. Basey et al. (2000) selected laboratory manuals based on what was
used in their state’s community colleges and Tweedy and Hoese (2005) decided to use a
variety of laboratory manuals without trying to seek which ones were actually being used
in the classroom. Further, Basey et al. (2000) examined exercises from a variety of topics

83
while Tweedy and Hoese (2005) only examined within one topic. The most common
trends found was that most exercises provided the methods to students but most allowed
students to complete the exercise themselves. Perhaps more alarming, however, was that
many exercises did not ask for any data analysis and instead just asked for a conclusion.
Trade Books
Gibbs and Lawson (1992) and Duncan et al. (2011) found that general biology
textbooks provided little information on the nature of science and scientific inquiry
(although they did not use these specific terms). Therefore, other resources have been
used in the classroom for students to better understand the nature of science and scientific
inquiry, such as trade books. Trade books are non-fictional accounts of scientific
discovery that are typically written by scientists for the general public; they are made to
hold one’s interest while also portraying the nature of science and scientific inquiry.
Although trade books can be a useful resource, few articles have actually been
published on the use of trade books in the classroom. In 1988, Carter and Mayer
published a list of recommended trade books, but a more recent list for college students
was not found. The list was created by sending a free-response survey to “108 friends
who are teaching, conducting research, or retired. Ranging in age from 35 to 85 years,
they span most of the sub-disciplines of biological sciences and science education”
(Carter & Mayer, 1988, p. 491). Although this was not a random sample, it was a fairly
large sample; 77 sent back lists of recommended books. The most commonly suggested
trade books (10 or more people suggested) were, in descending order, The Double Helix
by James Watson (1968; n = 36), The Origin of Species by Charles Darwin (1859; n =
84
33), Lives of a Cell by Lewis Thomas (1976; n = 20), Silent Spring by Rachel Carson
(1962; n = 15), Ever Since Darwin (1977) and The Panda’s Thumb (1980), both by
Stephen Gould (n = 10 for both), The Sand County Almanac by Aldo Leopold (1968; n
=10), and Growth of Biological Thought by Ernst Mayr (1982; n = 10).
Although having a list of trade books to use in the biology classroom is useful,
how to use them in the classroom is also important for instructors to know. Jensen and
Moore (2008) described how they incorporated trade books into their introductory
anatomy and physiology course and how the new reading assignment impacted their
students. When they first started using them, they had students read one trade book and
submit a formal book report. With the time that it took to carefully read and grade each
book report, they changed the assignment to handwritten notes (half page per chapter).
They were handwritten so that students were less likely to copy from another source, and
since they were just notes, grading them consisted of only scanning quickly through
them. They were then only graded as pass/fail and worth 4% of the entire course grade.
At first students had to select from two trade books that the instructors found
engaging, but students found them confusing and boring. For the next few years, students
were allowed to select any trade book that related to anatomy and/or physiology. From
the books that students chose and seemed to enjoy, the instructors selected three of them
and made it so that students had to select one of those three. None of these trade books
were on the list provided by Carter and Mayer (1988); they were all published after 1988.
Students were then allowed to read up to two extra books for extra credit (added
percentage points were 2% for the first and 1% for the second); these could be any book
that related to anatomy and/or physiology, but a list of recommended books was
85
provided. From reading the description, it sounded like they still had to receive approval
since it was noted that a few students asked to read a textbook rather than a trade book,
which was declined.
After these kinks were worked out, Jensen and Moore (2008) completed a study
to find if students enjoyed the trade books and if those students that chose to read more
trade books differed at all in gender and/or ethnicity and if they also performed better in
the class (i.e., received better exam/quiz scores). One of the research questions was
worded as “were there any statistical differences in the overall course performances
among students, who read one, two, or three books?” (Jensen & Moore, 2008, p. 207).
However, this question, although technically worded correctly, was also misleading.
Students were not randomly assigned to read either one, two, or three books; students
could choose how many to read; therefore, these data were not able to answer the
question if reading more books actually impacted course performance; only if there was
some sort of correlation.
One hundred twenty students took part in the study. Most students (n = 84) read
one book, 24 decided to read two books, and 11 chose to read three books. The sex ratio
was somewhat skewed (62.5% female; 36.7% male), but ethnicity was quite skewed. Just
over half (n = 75) of the students were white, almost a quarter was black (n = 27), 20
students were Asian, with other ethnic groups included in the study but the total number
of students for each was quite low (two Hispanic, one Native American, and 4 unknown).
Although comparisons in gender could be reliable, the results on ethnicity are likely not
generalizable. These numbers were even smaller when divided by number of books read
(e.g., 5 zeros and 3 ones). Nevertheless, a chi-square test was performed on gender and
86
ethnicity to determine if there were differences in the number of books that they chose to
read, for which they found no difference with ethnicity (p = .099) or gender (p = .392).
Jensen and Moore (2008) did comment on the possible unreliable nature of the ethnicity
statistics by pointing out that half of the black students read at least one extra book
whereas less than a quarter (23%) of white students chose to read at least one extra book.
These statistics may have been more reliable if the rest of the ethnic groups (i.e., Asian,
Hispanic, Native American, and unknown) were placed into one category of “other;”
thereby having 19 reading one book, five reading two books, and three reading three
books (42% choosing to read at least one extra book) instead of several zeros and ones.
Performance also did not seem to differ between those that chose to read only one
book and those that read at least one extra book (t = -.801, p = .424). Again, these results
are also likely unreliable; not only did most students read just one book (70%), but
students were able to decide if they would like to read one or two additional books for
extra credit. Therefore, several other variables were likely at play. Although it may be
ethically questionable to assign a different number of books to different students, they
could have possibly changed the number of books each semester so that students would
not feel that they were given more work than others in the same class.
Student attitude toward the reading assignment was measured by the general
course survey. On this, students were asked, in general, what they liked and disliked most
about the course. Then they were asked how they felt about the reading assignment. For
the first two questions only a couple of students mentioned the reading assignment; one
student, who read three books, stated that it was their favorite task, and another student,
who read only one book, stated that it was their least favorite task (quotes provided for
87
both). When students were specifically asked about the assignment, all students that read
more than one book (n = 35) and 88% of the students who read only one book stated that
they enjoyed the assignment. According to the provided quotes, those that enjoyed it
appeared to find it helped in understanding the content (although the authors mentioned
that they never explicitly discussed the trade books in class) and found it interesting.
Those that did not enjoy it appeared to find it more like busy work.
Although some of the findings of the study may be questionable, this article was
still interesting in that it described how the authors used trade books in their classroom,
including the issues that came up and how they fixed these issues. Also, most students
enjoyed reading the books, which may have heightened their interest in science. In
summary, Jensen and Moore (2008) found it most useful to first have students select
trade books and then make a list of books from that. They also found it easiest to grade
when students just had to turn in handwritten notes instead of formal book reports.
Primary Literature
Often the purpose of including primary literature in the curriculum is for students
to gain a deeper appreciation of where the information in their textbooks came from and
of the process of obtaining scientific knowledge (Petzold et al., 2010; Wiegant et al.,
2011). As seen in Table 2, several studies have described how primary literature has been
incorporated into the classroom for a variety of courses. Similar to the research on topics
in textbooks, articles have varied greatly in the amount of information provided. Some
have only described how they used primary literature in the classroom, a few others have
described results from student surveys, and one even attempted to assess student learning
88
through the use of primary literature. For this section of the review, the possible ways
that primary literature has been used in the classroom and then the results of the few
assessments that have been done are explained.
Uses of Primary Literature
Primary literature has been used in the classroom in different ways. The course
grade may either be completely dependent on various activities involving journal articles
(e.g., Janick-Buckner, 1997; Muench, 2000; Wiegant et al., 2011) or only partly
(Beaumont et al., 2012; Camill, 2000; Herman, 1999; Larios-Sanz et al., 2011; Mulnix,
2003; Petzold et al., 2010). Some instructors have provided articles throughout the course
for students to read and discuss (e.g., Herman, 1999; Muench, 2000). Students may also
have to present a critique of an article (e.g., Muench, 2000) or write a report using
multiple articles (Beaumont et al., 2012). Mulnix (2003) had her students work in pairs or
groups of three on a single article. Students then participated in a poster session in the
class. The session was treated as a conference and students were expected to be experts.
Also having students work in small groups, Wiegant et al. (2011) described a
course that focused on a single project in which students created research program
proposals consisting of four related projects that would meet the standards of one of the
national science foundations (the university was in the Netherlands). Primary literature
was used to first select the program topic, to find the gaps in the literature and to develop
the methodology of the projects. Class time varied from working on the project with their
team, presenting articles, and discussing updates to their project. At the end of the course,
students presented a defense to several experts.
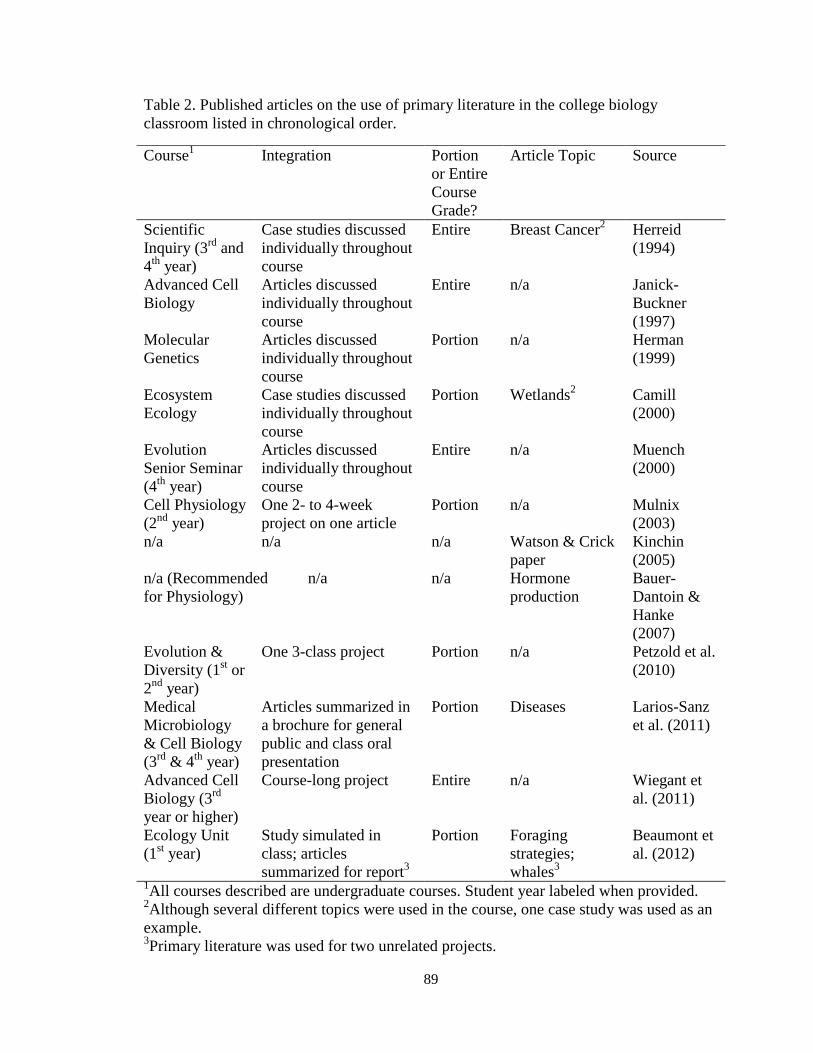
89
Table 2. Published articles on the use of primary literature in the college biology
classroom listed in chronological order.
Course1
Integration Portion
or Entire
Course
Grade?
Article Topic Source
Scientific
Inquiry (3rd
and
4th
year)
Case studies discussed
individually throughout
course
Entire Breast Cancer2
Herreid
(1994)
Advanced Cell
Biology
Articles discussed
individually throughout
course
Entire n/a Janick-
Buckner
(1997)
Molecular
Genetics
Articles discussed
individually throughout
course
Portion n/a Herman
(1999)
Ecosystem
Ecology
Case studies discussed
individually throughout
course
Portion Wetlands2
Camill
(2000)
Evolution
Senior Seminar
(4th
year)
Articles discussed
individually throughout
course
Entire n/a Muench
(2000)
Cell Physiology
(2nd
year)
One 2- to 4-week
project on one article
Portion n/a Mulnix
(2003)
n/a n/a n/a Watson & Crick
paper
Kinchin
(2005)
n/a (Recommended
for Physiology)
n/a n/a Hormone
production
Bauer-
Dantoin &
Hanke
(2007)
Evolution &
Diversity (1st or
2nd
year)
One 3-class project Portion n/a Petzold et al.
(2010)
Medical
Microbiology
& Cell Biology
(3rd
& 4th
year)
Articles summarized in
a brochure for general
public and class oral
presentation
Portion Diseases Larios-Sanz
et al. (2011)
Advanced Cell
Biology (3rd
year or higher)
Course-long project Entire n/a Wiegant et
al. (2011)
Ecology Unit
(1st year)
Study simulated in
class; articles
summarized for report3
Portion Foraging
strategies;
whales3
Beaumont et
al. (2012)
1All courses described are undergraduate courses. Student year labeled when provided.
2Although several different topics were used in the course, one case study was used as an
example. 3Primary literature was used for two unrelated projects.
90
Larios-Sanz et al. (2011) had upper-level undergraduate students, while working
in small groups, investigate the primary literature on a chosen disease. Since the students
were upper-level undergrads, the instructors expected students to be familiar with
searching the primary literature and writing scientifically. Students developed a brochure
on the disease (5% of the final grade). The brochures were later administered to local
clinics to pass out to patients, once the content was verified. Therefore, the brochure had
to be written for the general public to understand and be taken seriously by students since
patients would read them. Then students presented similar material to the rest of the class,
but was presented in a more scientific way (5% of the final grade). Over 2.5 years, 84
students, mostly fourth-year students, took part in the activity, which was completed in
medical microbiology courses and cell biology courses. Eighty percent of the students
received a grade of over 80% on both the brochure and presentation, and the average final
grade was 92%.
In order for students to understand where scientific information from textbooks
really came from, Petzold et al. (2010) developed a project to have students trace
textbook information back to its original sources (i.e., primary literature). Students
completed several steps before actually obtaining journal articles. At first, class
discussions regarding citing sources were held and students listed out reasons to cite; then
students practiced citing journal articles. Next, they had to select topics of interest from a
list of subjects related to the course and locate encyclopedia articles describing the topics
so that they could narrow down the topic to one. Three assignments were used to aid
students in making their decision. Another assignment was used to help students critique
web sites, since students were more likely used to using web sites than other sources of
91
information. Finally, students learned how to use the library’s search engines for finding
articles. All of the information found from the various sources (i.e., encyclopedia articles,
web sites, and journal articles) were synthesized in a report, which included the
preliminary information found from encyclopedia articles, how they searched for journal
articles, and what they found from the articles. Lastly, students had to select one graph
from their articles, write up a one-page critique and then present the critique to the class.
Students may also simulate a specific study found in the primary literature.
Beaumont et al. (2012) described a laboratory activity that simulated foraging strategies,
which students later had to develop their own simulation, modeling a published study
from the primary literature. For the initial simulation, which instructions were provided to
students, groups of students simulated various foraging strategies using chick peas (prey)
and chop sticks (mandibles). Students had to pick up as many chick peas as possible in a
limited amount of time using the chop sticks. This process was repeated five times and
then the simulation changed slightly, where some chick peas had a mark on them and
were worth more energy. Finally, students repeated the simulation again, but various
chick peas had different-colored marks, which meant different amounts of energy.
After students completed the simulation, their next task was to create their own
simulation that the rest of the class would complete, using chick peas and chop sticks,
that modeled a published study on vertebrate foraging strategies. Students developed
various simulations, such as simulating changing the amount of prey available, changing
the background of the container so that prey were camouflaged, adding a top predator
that would place a sticker on the students back whenever they were not looking.

92
Journal articles may also be used to create case studies for students without
having students read the actual article, which was what Camill (2000) did in his
ecosystem ecology course. Students first read an introduction (created by the instructor)
on the problem so that students could come up with possible questions and methods to
research the questions. Then Camill (2000) described what the author(s) did in their
study. Students made predictions before being provided the actual data (i.e., figures from
the article). Finally, students had to write a paper, using a typical scientific article format.
Students repeated this process throughout the course. Herreid (1994) also used journal
articles as case studies in his class, but he instead gave students the introduction of the
article and some of the figures and tables. Then students had to figure out the methods,
written results, and conclusion. Providing actual figures and tables to students was also
recommended by Rybarczyk (2011) after finding that textbooks rarely incorporated
figures similar to the ones found in journal articles.
In using primary literature in the classroom, instructors may either select articles
for students or have students pick their own articles. Students may also be able to choose
one from a group of selected articles (e.g., Mulnix, 2003). Muench (2000) suggested that
it is important to keep in mind the ultimate goals of providing the paper to students when
determining which articles students should use. For instance, the choice of article may
differ depending on if students are supposed to focus on content or method and if they are
expected to read for basic understanding of articles or ability to critique. If for basic
understanding, then articles should be easy to follow and conclusions should make sense
with the results; if for critiquing, then maybe the conclusions are not supported by the
results or do not answer the original questions. The students’ background knowledge
93
should also be taken into consideration. If students are allowed to select their own
articles, the instructor may want to provide articles to students for the first half of the
semester and then have students select their own during the second half of the semester
(Muench, 2000). Petzold et al. (2010) also had students select their own articles, but they
first had to pick a topic from their textbook to study and then trace the idea back to the
primary literature.
There are also multiple ways to deciding how students should approach reading
and making sense of a journal article. For each of the articles that she had students read,
Herman (1999) first gave students an assignment that related to the background
information necessary for understanding the article. Then students read the article,
underlined anything that did not make sense, and discussed misunderstandings in small
groups while the instructor assisted each group. Finally, students reread the article and
answered questions regarding it before discussing it as an entire class. This process may
help students make sense of a journal article, but Kinchin (2005) recommended that
students use concept mapping as a way to straighten out all of the information in an
article. Others have provided a list of questions that students should keep in mind while
they read an article (e.g., Janick-Buckner, 1997; Wiegant et al., 2011).
Student Perceptions
Many of these articles described did not include any form of assessment; a few,
on the other hand, at least included the results of student evaluations and one attempted to
evaluate students’ learning outcomes (described last in this section). Janick-Buckner
(1997), whose course was entirely dedicated to writing and discussing critiques of journal
94
articles, had her students (n = 16) rate the course at the end of the semester using the
IDEA Form Survey (Center for Faculty Evaluation and Development, Kansas State
University; assuming that it used a Likert scale) and open-ended questions. The average
for the class was then compared (using percentile ranking) to other courses that used the
same evaluation form (there was a national database for this form). The course scored
quite high for the overall evaluation (97%), for being able to enhance students’ attitudes
toward biology (98%), and for wanting to take another one of the instructor’s classes
(98%). Only these three questions were provided. Janick-Buckner (1997) described that
Overall, students like the format of the course and felt that their critical
reading, writing, and analytical skills improved due to their experience in
the course. They also felt that the written article reviews turned in before
the discussion were essential to helping them read and critique primary
literature. Several students indicated to me that the course helped them
tremendously with their undergraduate research.
Although these findings were described by Janick-Buckner (1997), how they were
obtained (e.g., other multiple choice questions, the open-ended questions, or some sort of
informal communication) and the number of students declaring these points was not
provided. Therefore, although it appeared from the evaluation form that students enjoyed
the course, it was unclear from the results provided what exactly they liked about it.
Using a general course evaluation for Janick-Buckner’s (1997) use of primary
literature was likely appropriate since the entire course revolved around primary
literature. However, for Mulnix (2003), this would be misleading since only one project
for the course was of interest. Therefore, instead of using a general course evaluation,
Mulnix (2003) provided students with an evaluation after students completed their poster
presentations of an article. The evaluation was specifically designed for this project.
However, since this was collected during class, it was likely that the instructor collected
95
the evaluation forms; therefore, students may have been more likely to make positive
statements than if it was part of the end-of-course evaluation.
Compared to Janick-Buckner’s (1997) study, Mulnix (2003) had one major
project dedicated to one article instead of using articles throughout the course. This
project was done in two different classes during different semesters. One class was taught
by two instructors and the other class by a third instructor. Both courses combined had 77
students and over half of the students were sophomores. The biology department at this
university was unique compared to the typical department since several of their courses
incorporated primary literature into their curriculum; on average, students in this course
had already read articles in previous courses and most (84%) felt at least somewhat
confident in reading peer-reviewed articles.
The evaluation form consisted of open-ended questions and 17 statements with a
5-point Likert scale. Averages and standard deviations for each statement were provided;
the two years were analyzed separately but occasionally combined within the text.
Therefore, the results discussed below either provide one or two averages; one average
indicates the average for both years combined and two averages indicate each year’s
average. Examples from the open-ended responses were summarized and the summaries
provided aligned with the results from the statements.
Students’ tended to find that although they enjoyed the project (average: 3.70,
3.60), they also found it frustrating (average: 2.57, 2.97). Students tended to agree that
the project helped their understanding of the course material (average for all five
statements pertaining to this: 3.24). Mulnix (2003) stated that “the responses were not
significantly different between the 2 years” (p. 251) but did not state if a statistical test
96
was performed. Students also believed that this project helped them with their
communication skills, particularly their oral skills (oral skill averages: 4.12, 3.74; written
skill averages: 3.10, 2.94).
Students were also asked how many hours they spent on the project, which 98%
(94% for the other year) spent more than five hours on the project and many students
(75% and 65%) stated they spent more than five hours working with their partner on the
project. This indicated that they spent a lot of the total time working with each other on
the project, but the exact number of hours (only those between five and six hours and
greater than six hours) was not provided. The data were depicted on a scale (i.e., 1-2 h, 3-
4h, 5-6h, >6h); it was unclear if students were required to answer using this scale or if the
authors converted their answers to this scale.
Students also believed that the project assisted them with their ability to read and
critique articles (four statements; average: 3.60). Students were also asked how much
they depended on each major section of the article (i.e., abstract, introduction, etc.) in
projects for previous courses and for this particular project. These were also answered on
a 5-point Likert scale. A repeated-measures ANOVA was used (it was not indicated if
data passed tests of normality) to compare their previous courses to the current course.
Students indicated that they used the introduction, methods, and results significantly
more than in previous projects (p < .05); they used the abstract and discussion/conclusion
about the same for all projects. Mulnix (2003) expected this since the introductory
courses only required students to have a basic understanding of articles read while this
project’s expectations included students being experts of the article. Although interesting,
these questions were given to students at the end of the project, so students had to think
97
back to when they were first working on the project, as well as back to previous
semesters, to determine how often they used each section, which could cause some
inaccuracy in their responses.
Although responses were fairly positive, again, they might be slightly skewed
since the instructor likely passed out and collected the evaluations herself. Mulnix (2003)
admitted that she was only able to measure students’ perceptions of the project and not
what they actually learned from doing the project. The course underwent a complete
transformation when this project was added so comparing final grades to previous
semesters was impractical. She did feel that students learned from this project, though,
since at first students asked her very basic questions about the articles and questions
gradually became more advanced as time went on. Many (67%) of the students
mentioned some sort of biological content that they learned on the free-response
questions.
Like Janick-Buckner (1997), Wiegant’s et al. (2011) study was on a course
dedicated to the use of primary literature and, therefore, the end-of-course evaluation was
used to measure students’ perceptions, as well as another form on students’ perceptions
of their skills. The course was designed for students to work in small groups (four to six
students) to develop a research proposal consisting of four projects (described in more
detail above). Data were summarized for six years, which was how long the course was
taught using this format. Number of students varied every semester from 12 to 25
students (N = 78).
The course evaluation form, which was a standard form for the college, consisted
of 16 statements placed on a 5-point Likert scale and three free-response questions.
98
Eleven of the statements were used for this study since the rest referred to the instructor’s
lecturing. The statements were provided and were general course-related questions such
as if they enjoyed and learned from the course and how much time they spent outside of
class on this course. The average for all classes (six semesters) combined was provided
for each question and was compared to the results of all other 300-level courses from the
same science department for the same semesters (N = 717; the present course was level
300). Responses on the five-point Likert scale ranged from 3.4 to 4.7 for the course and
3.4 to 4.3 for all 300-level courses in the department; therefore, the overall average was
fairly similar to other courses, but some differences were found within the individual
statements. The highest score for the course was for “I learned a great deal in this course”
(Wiegant et al., 2011, p. 88), which also had the greatest difference between the current
course and all department courses (0.8). The highest (4.3) for all 300-level courses was
“the instructor is an expert in his/her field” (Wiegant et al., 2011, p. 88), which was also
high for this particular course (4.5). The lowest score for the course (3.4; average for all
courses: 3.6) was given for “assessment methods are appropriate” (Wiegant et al., 2011,
p. 88). Wiegant et al. (2011) argued that “according to the students’ comments” (p. 88)
this was due to the assessments not being clearly described for the course since it was
fairly open, but it was not stated if these comments were from the open-ended questions
or from oral feedback during class. For the statement “how would you evaluate the
overall quality of this course? (1=fail; 5=very good)” (Wiegant et al., 2011, p. 88),
students scored the course 4.5 and the average for all 300-level department courses was
3.9. Wiegant et al. (2011) stated that it was “significantly higher” (p. 88) but did not
provide any statistical tests or results for this statement.
99
The other evaluation was designed for the particular course, and validation was
not mentioned. It also used a five-point Likert scale and was intended to measure “their
learning gains… which focused on the development of specific skills” (Wiegant et al.,
2011, p. 88). However, the wording from the evaluation form was not provided; only the
skills, such as oral communication, were listed. Therefore, it was unclear if students were
responding based on how often they had to use certain skills, how much they felt each
skill improve, etc. Whichever it was, averages for each skill were high (4.53 to 4.76). For
the free response questions on the standard evaluation, students were asked to describe
what they really learned from the course. It was unclear if this was given before or after
the skills evaluation form. If after the skills form, then they may have already been
thinking about the listed skills. Students mentioned a variety of skills and quoted
examples were provided for each course objective. No negative statements were given in
the article, but of course, that does not mean that students never included them.
Thirty alumni were also given a questionnaire (validation not provided). It was
unclear if more were contacted but did not send a completed form back. The
questionnaire consisted of four statements with a five-point Likert scale and five open-
ended questions. Again, scores were fairly high (3.6 to 4.8). The lowest was for “the
course has been helpful for my ability to design my master research plan” and the highest
was “the course improved my critical-thinking skills” (Wiegant et al., 2011). Several
quotes were provided for the open-ended questions and all were positive; again no
negative statements were provided.
The experts that graded students’ proposals also filled out a questionnaire with a
five-point Likert scale. They rated students’ defenses high (4.6); the lowest score was
100
given for actual feasibility of the proposal (3.2). Although not required, they also
provided qualitative feedback. The few provided in the article were reflective of the
questionnaire scores. All in all, it appeared, especially from the college’s course
evaluation statements, that students likely found the course helpful, but qualitative data,
such as quotes, may or may not have been representative of all feedback provided.
Beaumont et al. (2012) had two different activities that utilized primary literature.
One activity was a report summarizing primary literature regarding humpback whales,
which they wrote after viewing a PowerPoint presentation with videos in class. The other
activity was a simulation on foraging strategies where students had to model a published
study using chick peas and chop sticks. At the end of the unit, students were given an in-
class attitude survey to complete. The attitude survey had eight Likert scale (1-5)
questions and two open-ended questions; students answered the survey based on both
activities (n = 89; 115 completed activities but not survey). Although the survey had been
used previously (study cited), all statements were positive. When creating surveys, there
should be a mix of positive and negative statements in order to ensure that students are
reading the statements and not just filling it in blindly.
Results from two of the eight questions were provided. For the statement “this
exercise helped me to understand underlying biological material”, most students (60%)
strongly agreed with the statement (Likert value of 5) when asked about the foraging
activity. About 15% agreed (Likert value of 4) and about 25% felt neutral. On the other
hand, only 35% of students strongly agreed or agreed to the statement regarding the
report activity. The difference was statistically significant using a paired t-test; it was
assumed that results of strongly agree and agree were used in this comparison (p < .001).
101
Another statement was “this exercise developed skills I will need in employment,”
although students’ majors were only described as “various bachelor degree programmes”
(Beaumont et al., 2012, para. 3). Nevertheless, nearly 60% of students strongly agreed
with this statement regarding the foraging activity versus only about 23% who strongly
agreed for the report activity. About 30% agreed for both activities, but about half of
students (~45%) felt neutral about the report activity helping them prepare for future
employment. Again, the difference between the two activities was significant (p < .001).
For the open-ended questions regarding what they enjoyed about the activities and what
they suggested, some of the suggestions were provided (percentages of students not
included). Suggestions provided were that students wished to have more time to work on
the activity, to be able to do more simulations, and have oral presentations since students
were curious regarding the results. Comments regarding the report activity were not
described.
According to these results, students may enjoy using primary literature for more
than modeling, such as using multiple articles to write a report, although results of only
two of the eight Likert statements were provided. Beaumont et al. (2012) provided
several alternative reasons for the differences. They suggested that students may have
enjoyed the more active learning aspect of the foraging activity, working with groups (the
foraging activity was completed in groups but the report was written individually), or the
specific subjects covered. Unfortunately, although students self-reported that the foraging
activity was more helpful for covering the material, learning outcomes were not
measured.
102
Student Performance
Unlike the previously described articles that assessed students’ perceptions of a
course or project, Petzold et al. (2010) attempted to evaluate if students’ learning
outcomes met the standards of the ACRL (Association of College and Research
Libraries’ Information Literacy Competency Standards for Higher Education). These
standards included being able to locate useful resources, critique them, synthesize them,
and understand the various issues surrounding them (e.g., ethical, economical). This
study was also unique compared to the previously described articles because the first two
authors were librarians, not instructors, which may explain the variation in goals.
Petzold’s et al. (2010) project (described in more detail above) was designed to inform
students of the path that scientific information follows before being found in textbooks.
The course was a large class that was broken up into ‘learning groups’ (8 to 30 students
in each group) that met weekly. Three of these meetings took place in the library in order
for students to work on this particular project. Over half (57%) of the students had not
had any previous library instruction.
The study used a pretest/posttest format. The test was provided in an appendix
and included four free-response questions and seven multiple choice questions, each
having a possible “I don’t know” response. Validation of the test was not described. Two
other questions asked for demographic information and three others asked for their
previous experience with primary literature. Although the methods used seemed
appropriate, the results displayed were lacking. For instance, Petzold et al. (2010) stated
“the following table describes the overall results” (results section, 1st para.), but the table
103
primarily summarized which activities met which standards (only the results for one of
the questions was provided, which is described below). The primary results provided
were for the multiple choice questions (seven questions) and they were the mean, mode,
and median for the pretest (score of 3 for each) and posttest (4.6, 6, and 4.0, respectively).
It was also mentioned that students either did really well or really poorly on the posttest,
which might be why the mode was higher than the mean or median, but was the second
highest score a very low score then? A graph displaying everyone’s results would have
depicted this much better; providing only the mean, median, and mode for a bimodal
distribution is relatively pointless. Additionally, it was not described which questions
students had most difficulty with or if it varied with everyone. The only specific question
addressed in the results was for the question “what type of document or information
source provides the strongest, most authoritative support for an academic paper?”
(Petzold et al., 2010, appendix). Eighteen percent more students selected primary
literature on the posttest than the pretest but the pretest/posttest percentages were not
provided, nor were the most common answers. Students apparently found this project
helpful since 81.3% of them on the end-of-course evaluation recommended using this
project again. All in all, although the project may have been quite helpful for students, the
results were not described clear enough to support this conclusion.
Conclusion
Few studies (i.e., Beaumont et al., 2012; Janick-Buckner, 1997; Mulnix, 2003;
Petzold et al., 2010; Wiegant et al., 2011) provided student perceptions of the use of
articles, and they appeared to be mostly positive. The previously described articles
104
explained several ways that primary literature can be used in the college biology
classroom. Courses may incorporate several opportunities for reading and critiquing
articles or may only contain a single project. That single project, however, may range
from taking only a few hours to an entire course. With all of these described possible
ways to incorporate primary literature, only one article (Petzold et al., 2010) attempted to
measure student learning outcomes; however, the results were poorly described.
Additionally, even if Petzold’s et al. (2010) study had a great deal of evidence, it only
examined one way to use primary literature and for only one type of student population;
it has not been assessed if some ways are more helpful for students than others, which
could also differ based on students’ prior experiences with primary literature.
Furthermore, although several articles argued that primary literature is beneficial to use in
the classroom in addition to textbooks, or even in replacement of textbooks, no study has
actually assessed if this is true for the college biology classroom.
Videos
Little has been published on the use of videos in the college biology curriculum.
This may be due to the popularity of animations since many more articles have been
published on animations (discussed in the next section). For the purpose of this review
the difference between videos and animations is that videos primarily contain real life
images.
Hinchliffe (1972) created a list of videos useful in the teaching of animal
development; he published an updated list in 1975 and then Downie and Alexander
published another list ten years later (1986). These were merely lists, whereas Watters
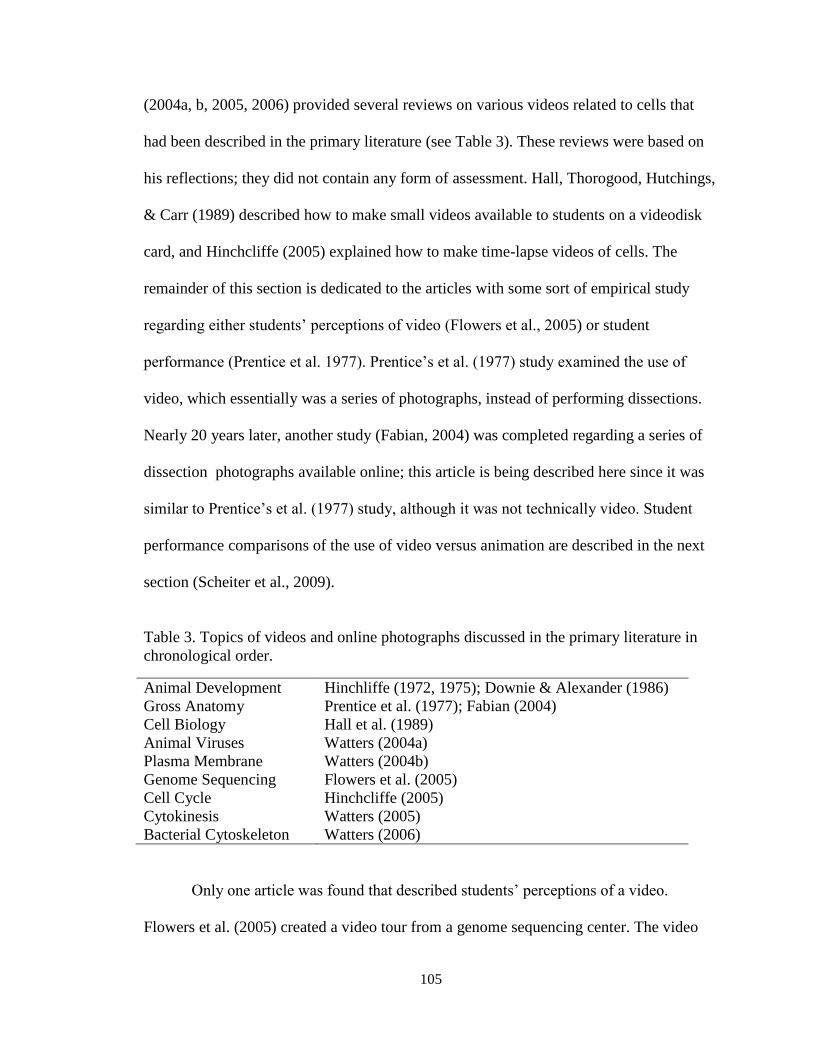
105
(2004a, b, 2005, 2006) provided several reviews on various videos related to cells that
had been described in the primary literature (see Table 3). These reviews were based on
his reflections; they did not contain any form of assessment. Hall, Thorogood, Hutchings,
& Carr (1989) described how to make small videos available to students on a videodisk
card, and Hinchcliffe (2005) explained how to make time-lapse videos of cells. The
remainder of this section is dedicated to the articles with some sort of empirical study
regarding either students’ perceptions of video (Flowers et al., 2005) or student
performance (Prentice et al. 1977). Prentice’s et al. (1977) study examined the use of
video, which essentially was a series of photographs, instead of performing dissections.
Nearly 20 years later, another study (Fabian, 2004) was completed regarding a series of
dissection photographs available online; this article is being described here since it was
similar to Prentice’s et al. (1977) study, although it was not technically video. Student
performance comparisons of the use of video versus animation are described in the next
section (Scheiter et al., 2009).
Table 3. Topics of videos and online photographs discussed in the primary literature in
chronological order.
Animal Development Hinchliffe (1972, 1975); Downie & Alexander (1986)
Gross Anatomy Prentice et al. (1977); Fabian (2004)
Cell Biology Hall et al. (1989)
Animal Viruses Watters (2004a)
Plasma Membrane Watters (2004b)
Genome Sequencing Flowers et al. (2005)
Cell Cycle Hinchcliffe (2005)
Cytokinesis Watters (2005)
Bacterial Cytoskeleton Watters (2006)
Only one article was found that described students’ perceptions of a video.
Flowers et al. (2005) created a video tour from a genome sequencing center. The video
106
consists of the tour guide leading the cameraman through the center and answering
questions as well as periodic animations to help further describe what the tour guide was
explaining. The video lasted 30 minutes and was created for high school students in an
advanced biology course or college students in an introductory biology course. Along
with the video were available supplemental materials such as interviews with employees
pertaining to careers in the field and handouts to aid students.
Flowers et al. (2005) created a survey for students and another for teachers to use
after viewing the video (validation was not mentioned). The survey for students consisted
of four statements on a five-point Likert scale and the instructor’s survey consisted of
seven statements. Twenty-four lower-level undergraduate biology majors who had taken
a molecular biology class viewed the video and took the student survey. Their responses
were fairly positive. It seemed to help students better understand what genome
sequencing is (4.0 ± .7) and what happens at the genome-sequencing center (4.4 ± .8). It
was fairly easy to follow (3.9 ± .8) but fewer seemed to find it interesting (3.4 ± .9).
High school students (n = 27) also watched the video and filled out the survey but
seemed much less enthusiastic about the video. It seemed to help them understand what
happens at the genome sequencing center (3.0 ± 1.4), but fewer felt that it helped them
understand genome sequencing (2.5 ± 1.4), possibly because they found it difficult to
follow (2.4 ± 1.4 for easy to follow). Far fewer found it interesting (1.3 ± 1.5). Not only
are these scores much lower for high school students than college students, they also
varied more in their responses making it possible that students found it informative and
others much less so. However, this was only one course and cannot be generalized to all
high school students.
107
Thirty-one high school teachers that taught genetics were also surveyed after they
watched the video. It was not mentioned how this sample was obtained or if they watched
the video with or without their class. They predicted that their students would be able to
understand the video (4.0 ± .9), hold their interest (3.8 ± 1.1), and teach them about
genome sequencing (4.4 ± .8). However, their predictions were much higher than the
class that was surveyed. It was unclear if the teacher of these students was one of the
surveyed teachers. Additionally, the teachers felt that they would have to prepare students
before watching the video (4.3 ± 1.2), pause the video at times to further explain some
parts (4.4 ± .8), and give them a diagram to follow (3.9 ± 1.3). If teachers did do this then
the high school students may have gained from watching the video. Regardless of the
additional necessary steps, most instructors would show the video to their class (4.0 ±
1.1). All in all, these surveys were just preliminary and the variances were large. A much
larger, more representative sample would have to be used in order to discover if this
video was also appropriate for high school students. Furthermore, other evaluations
would have to be done in order to find if students actually learn from watching the video.
Prentice et al. (1977) described a program (Stereoscopic Anatomy Auto-
Instructional (SAA) Program) created as an alternative to live dissection to be used by
institutions that cannot afford cadavers. Several pictures of labeled (organs named and
arteries, veins, nerves, and lymphatics color-coded with paint) dissected cadaver sections
were taken and made into a video. This program also used premade scripts that were
available to students via written script and audiocassette.
Gain scores were compared between two groups of students. Both groups were in
human gross anatomy courses that had the same learning objectives and similar anatomy
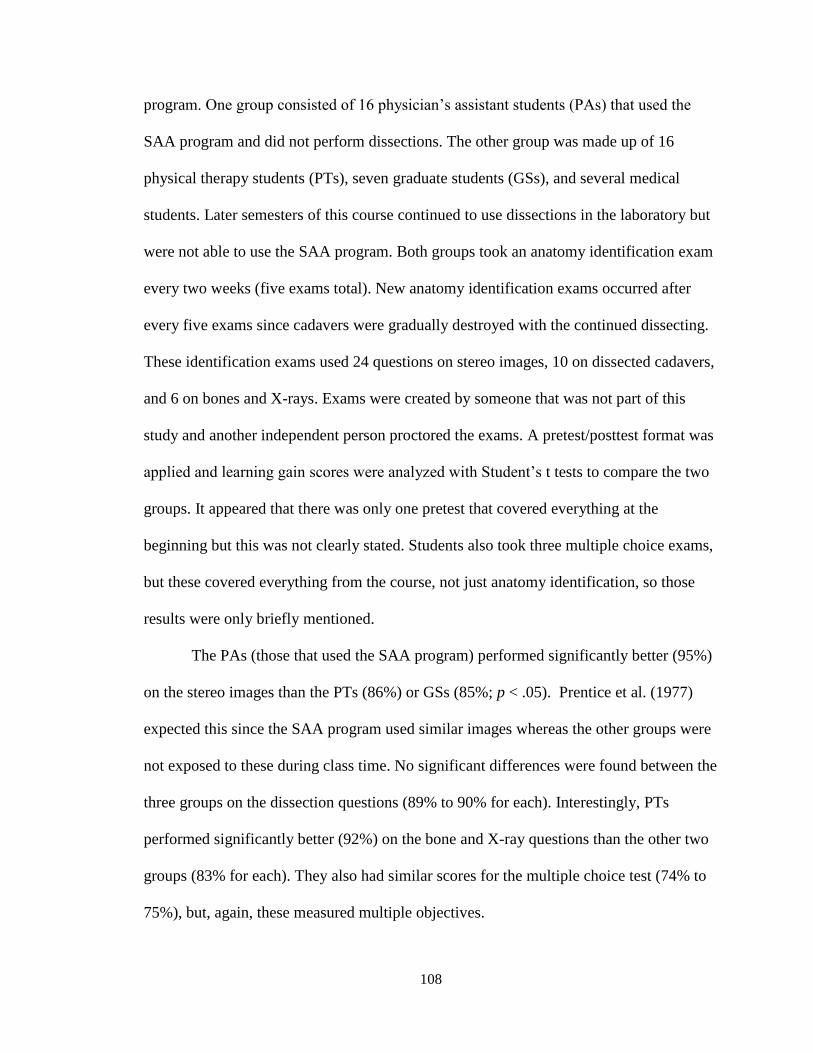
108
program. One group consisted of 16 physician’s assistant students (PAs) that used the
SAA program and did not perform dissections. The other group was made up of 16
physical therapy students (PTs), seven graduate students (GSs), and several medical
students. Later semesters of this course continued to use dissections in the laboratory but
were not able to use the SAA program. Both groups took an anatomy identification exam
every two weeks (five exams total). New anatomy identification exams occurred after
every five exams since cadavers were gradually destroyed with the continued dissecting.
These identification exams used 24 questions on stereo images, 10 on dissected cadavers,
and 6 on bones and X-rays. Exams were created by someone that was not part of this
study and another independent person proctored the exams. A pretest/posttest format was
applied and learning gain scores were analyzed with Student’s t tests to compare the two
groups. It appeared that there was only one pretest that covered everything at the
beginning but this was not clearly stated. Students also took three multiple choice exams,
but these covered everything from the course, not just anatomy identification, so those
results were only briefly mentioned.
The PAs (those that used the SAA program) performed significantly better (95%)
on the stereo images than the PTs (86%) or GSs (85%; p < .05). Prentice et al. (1977)
expected this since the SAA program used similar images whereas the other groups were
not exposed to these during class time. No significant differences were found between the
three groups on the dissection questions (89% to 90% for each). Interestingly, PTs
performed significantly better (92%) on the bone and X-ray questions than the other two
groups (83% for each). They also had similar scores for the multiple choice test (74% to
75%), but, again, these measured multiple objectives.
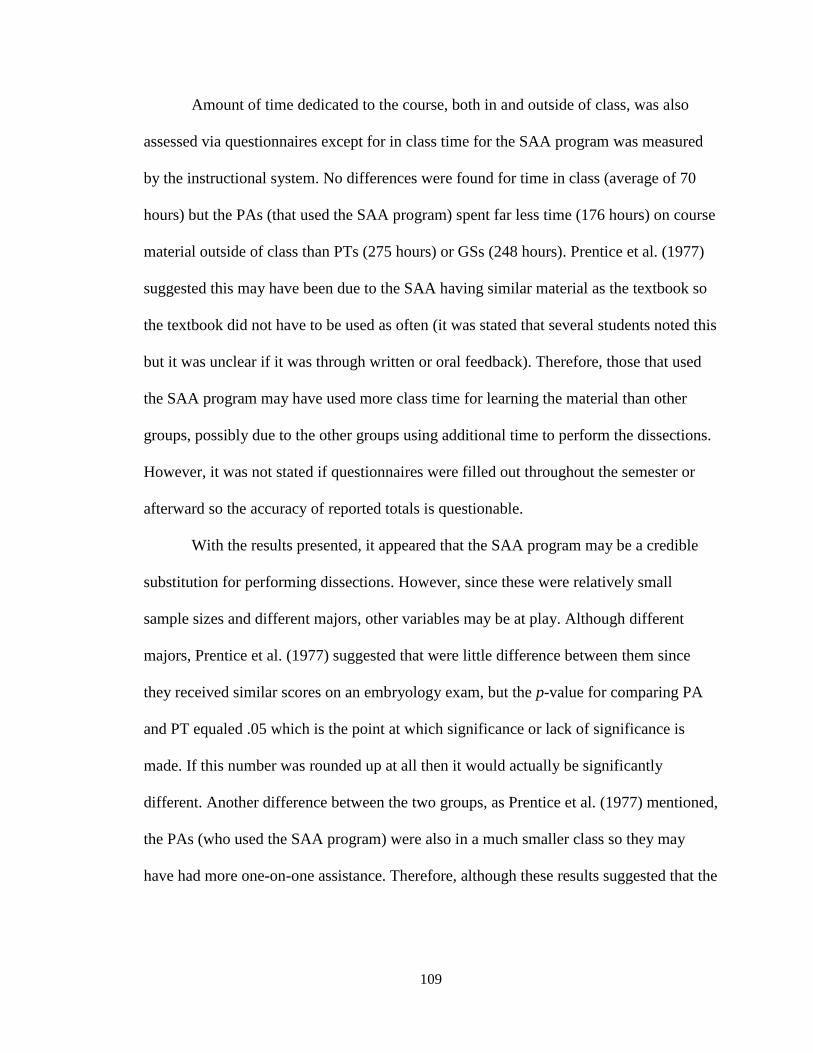
109
Amount of time dedicated to the course, both in and outside of class, was also
assessed via questionnaires except for in class time for the SAA program was measured
by the instructional system. No differences were found for time in class (average of 70
hours) but the PAs (that used the SAA program) spent far less time (176 hours) on course
material outside of class than PTs (275 hours) or GSs (248 hours). Prentice et al. (1977)
suggested this may have been due to the SAA having similar material as the textbook so
the textbook did not have to be used as often (it was stated that several students noted this
but it was unclear if it was through written or oral feedback). Therefore, those that used
the SAA program may have used more class time for learning the material than other
groups, possibly due to the other groups using additional time to perform the dissections.
However, it was not stated if questionnaires were filled out throughout the semester or
afterward so the accuracy of reported totals is questionable.
With the results presented, it appeared that the SAA program may be a credible
substitution for performing dissections. However, since these were relatively small
sample sizes and different majors, other variables may be at play. Although different
majors, Prentice et al. (1977) suggested that were little difference between them since
they received similar scores on an embryology exam, but the p-value for comparing PA
and PT equaled .05 which is the point at which significance or lack of significance is
made. If this number was rounded up at all then it would actually be significantly
different. Another difference between the two groups, as Prentice et al. (1977) mentioned,
the PAs (who used the SAA program) were also in a much smaller class so they may
have had more one-on-one assistance. Therefore, although these results suggested that the
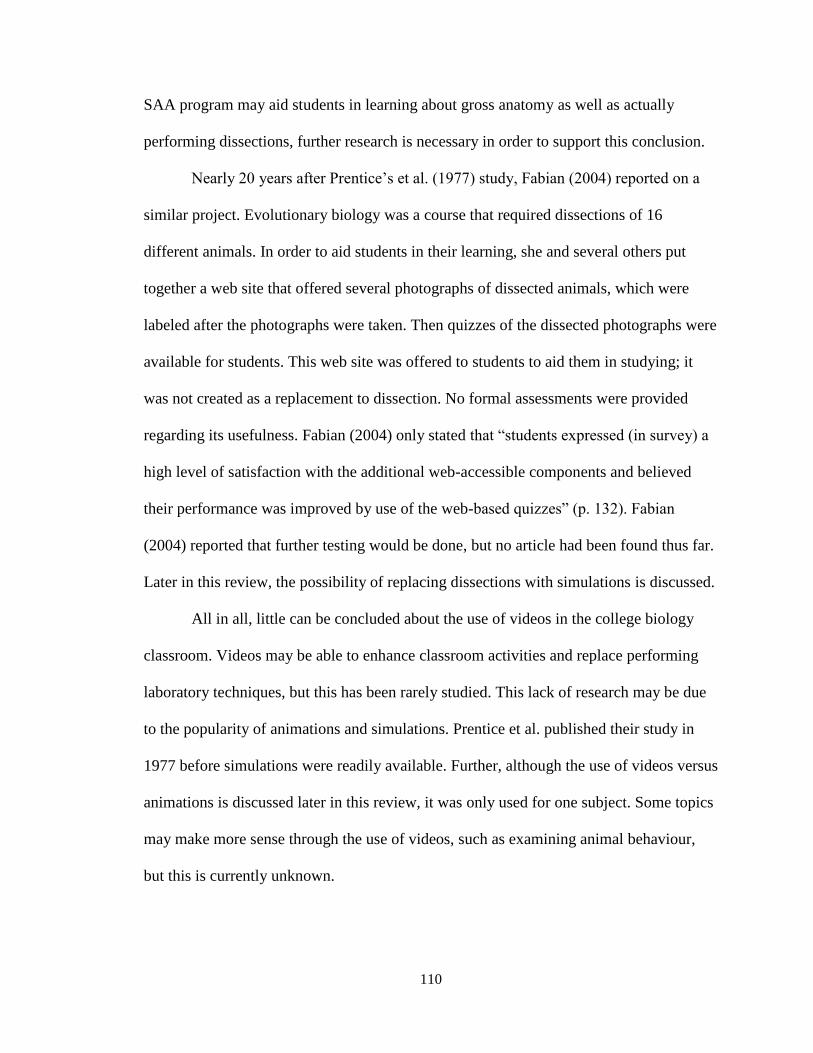
110
SAA program may aid students in learning about gross anatomy as well as actually
performing dissections, further research is necessary in order to support this conclusion.
Nearly 20 years after Prentice’s et al. (1977) study, Fabian (2004) reported on a
similar project. Evolutionary biology was a course that required dissections of 16
different animals. In order to aid students in their learning, she and several others put
together a web site that offered several photographs of dissected animals, which were
labeled after the photographs were taken. Then quizzes of the dissected photographs were
available for students. This web site was offered to students to aid them in studying; it
was not created as a replacement to dissection. No formal assessments were provided
regarding its usefulness. Fabian (2004) only stated that “students expressed (in survey) a
high level of satisfaction with the additional web-accessible components and believed
their performance was improved by use of the web-based quizzes” (p. 132). Fabian
(2004) reported that further testing would be done, but no article had been found thus far.
Later in this review, the possibility of replacing dissections with simulations is discussed.
All in all, little can be concluded about the use of videos in the college biology
classroom. Videos may be able to enhance classroom activities and replace performing
laboratory techniques, but this has been rarely studied. This lack of research may be due
to the popularity of animations and simulations. Prentice et al. published their study in
1977 before simulations were readily available. Further, although the use of videos versus
animations is discussed later in this review, it was only used for one subject. Some topics
may make more sense through the use of videos, such as examining animal behaviour,
but this is currently unknown.
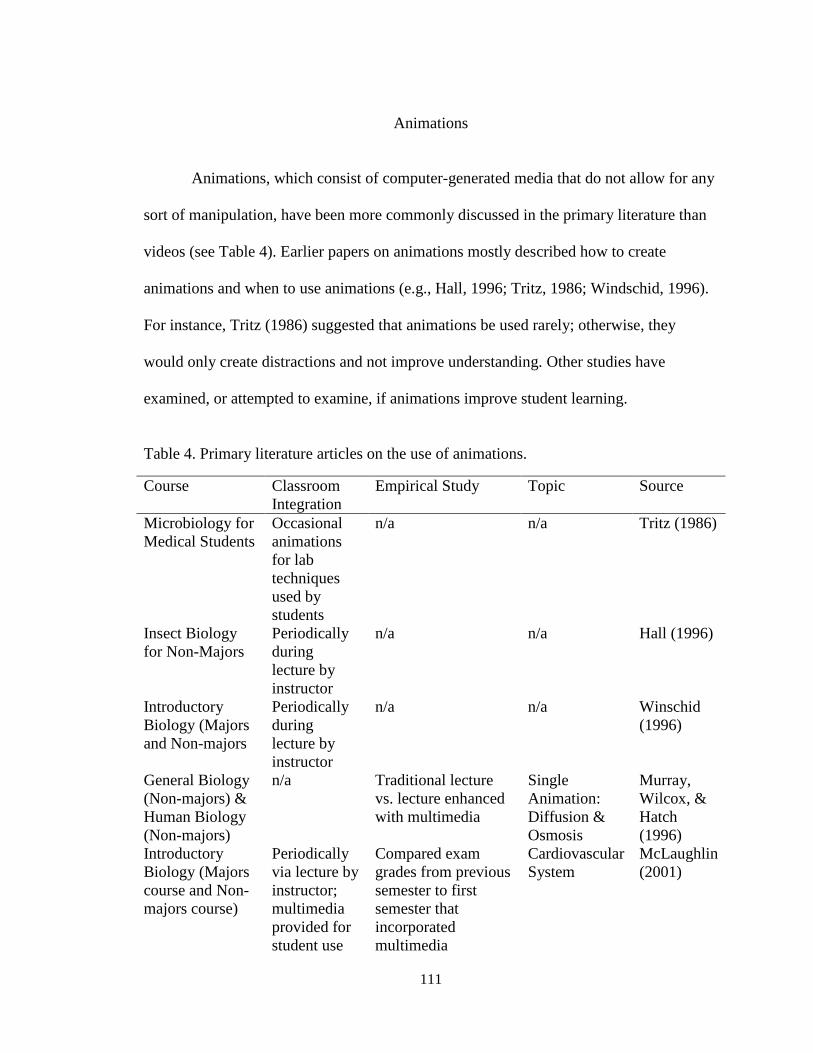
111
Animations
Animations, which consist of computer-generated media that do not allow for any
sort of manipulation, have been more commonly discussed in the primary literature than
videos (see Table 4). Earlier papers on animations mostly described how to create
animations and when to use animations (e.g., Hall, 1996; Tritz, 1986; Windschid, 1996).
For instance, Tritz (1986) suggested that animations be used rarely; otherwise, they
would only create distractions and not improve understanding. Other studies have
examined, or attempted to examine, if animations improve student learning.
Table 4. Primary literature articles on the use of animations.
Course Classroom
Integration
Empirical Study
Topic Source
Microbiology for
Medical Students
Occasional
animations
for lab
techniques
used by
students
n/a n/a Tritz (1986)
Insect Biology
for Non-Majors
Periodically
during
lecture by
instructor
n/a n/a Hall (1996)
Introductory
Biology (Majors
and Non-majors
Periodically
during
lecture by
instructor
n/a n/a Winschid
(1996)
General Biology
(Non-majors) &
Human Biology
(Non-majors)
n/a Traditional lecture
vs. lecture enhanced
with multimedia
Single
Animation:
Diffusion &
Osmosis
Murray,
Wilcox, &
Hatch
(1996)
Introductory
Biology (Majors
course and Non-
majors course)
Periodically
via lecture by
instructor;
multimedia
provided for
student use
Compared exam
grades from previous
semester to first
semester that
incorporated
multimedia
Cardiovascular
System
McLaughlin
(2001)
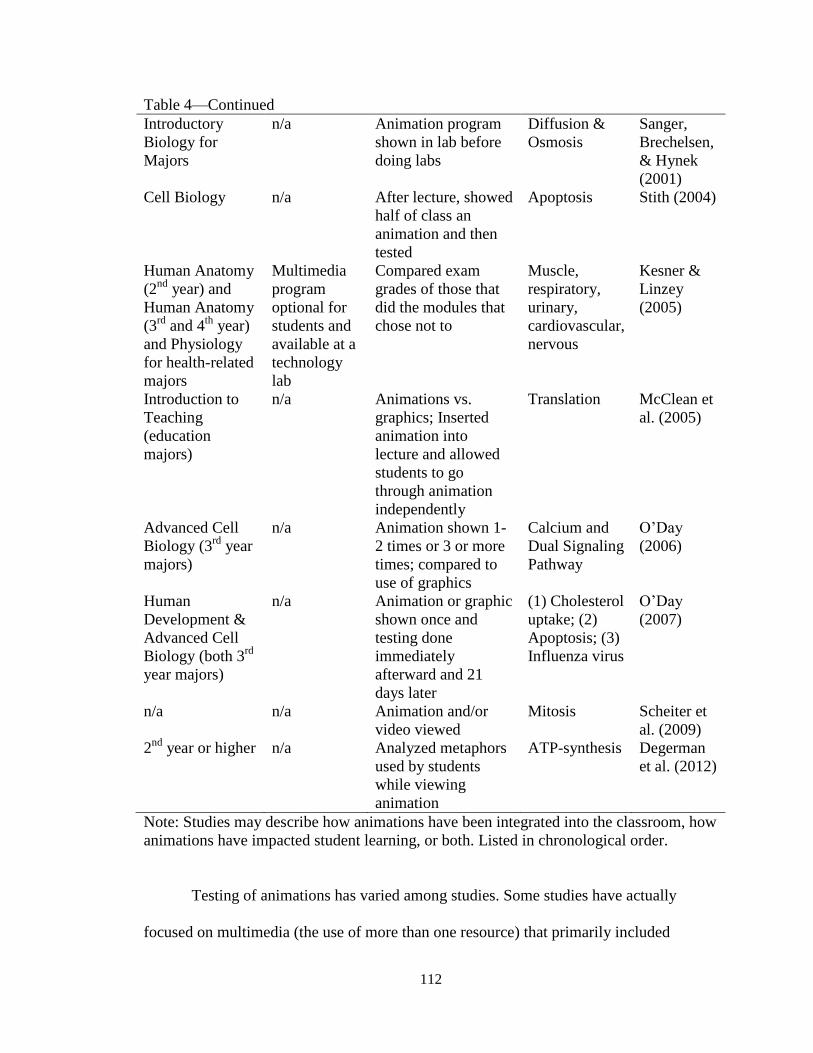
112
Table 4—Continued
Introductory
Biology for
Majors
n/a Animation program
shown in lab before
doing labs
Diffusion &
Osmosis
Sanger,
Brechelsen,
& Hynek
(2001)
Cell Biology n/a After lecture, showed
half of class an
animation and then
tested
Apoptosis Stith (2004)
Human Anatomy
(2nd
year) and
Human Anatomy
(3rd
and 4th
year)
and Physiology
for health-related
majors
Multimedia
program
optional for
students and
available at a
technology
lab
Compared exam
grades of those that
did the modules that
chose not to
Muscle,
respiratory,
urinary,
cardiovascular,
nervous
Kesner &
Linzey
(2005)
Introduction to
Teaching
(education
majors)
n/a Animations vs.
graphics; Inserted
animation into
lecture and allowed
students to go
through animation
independently
Translation McClean et
al. (2005)
Advanced Cell
Biology (3rd
year
majors)
n/a Animation shown 1-
2 times or 3 or more
times; compared to
use of graphics
Calcium and
Dual Signaling
Pathway
O’Day
(2006)
Human
Development &
Advanced Cell
Biology (both 3rd
year majors)
n/a Animation or graphic
shown once and
testing done
immediately
afterward and 21
days later
(1) Cholesterol
uptake; (2)
Apoptosis; (3)
Influenza virus
O’Day
(2007)
n/a n/a Animation and/or
video viewed
Mitosis Scheiter et
al. (2009)
2nd
year or higher n/a Analyzed metaphors
used by students
while viewing
animation
ATP-synthesis Degerman
et al. (2012)
Note: Studies may describe how animations have been integrated into the classroom, how
animations have impacted student learning, or both. Listed in chronological order.
Testing of animations has varied among studies. Some studies have actually
focused on multimedia (the use of more than one resource) that primarily included
113
animations and therefore were placed into this section of the review. For instance,
Murray et al. (1996) created a program that included questions geared toward facing
misconceptions and followed these with animations. Kesner and Linzey (2005) had
modules available that included animations, self-quizzes, and a glossary. Similarly,
McLaughlin (2001) discussed a software package that included animations, reviews, and
practice activities; her class, though, primarily focused on the animations and summaries.
Of the studies that focused on animations, most tested one single animation that
either the authors created (e.g., McClean et al., 2005; Murray et al., 1996; O’Day, 2006;
Scheiter et al., 2009) or were published (e.g., Sanger et al., 2001; Degerman et al., 2012;
Stith, 2004). O’Day (2007) examined two animations that he created and one that was
published. Others have tested software that supplied several animations and were used
throughout the course (e.g., Kesner & Linzey, 2005; McLaughlin, 2001). These studies
were sometimes done in different classes but during the same semester (e.g., Murray et
al., 1996; O’Day, 2007), different semesters of the same course (McLaughlin, 2001), or
sorting a class into groups (McClean et al., 2005; O’Day, 2006; Degerman et al., 2012;
Stith, 2004). The second-to-last study discussed in this review actually did not perform
their study in a classroom; instead, it was done in a private room with each student one at
a time (Scheiter et al., 2009).
Of the tests performed, two studies compared the use of animations versus no
animations or any other additional resource (Sanger et al., 2001; Stith, 2004). Although
these studies may be helpful, since the control group received less instruction than the
treatment group, the methods did not allow for any particular conclusions to be made
about the use of animations specifically. On the other hand, a few others compared the
114
use of animations to the use of graphics (McClean et al., 2005; O’Day, 2006, 2007), and
one study compared an animation to a video (Scheiter et al., 2009). This review first
begins with programs that included animation among other resources, followed by studies
that only compared animations to no other instruction. Then studies that compared the
use of animations to other resources, such as graphics or video are discussed. The last
study described examined the metaphors that students use when examining an animation,
and the metaphors were analyzed to determine if they would lead to misconceptions.
Murray et al. (1996) developed a program to aid in teaching diffusion and
osmosis. It contained a series of modules; each module had an image and a multiple
choice question which was followed by a screen asking students to explain their
reasoning in writing. Animations were then used to explain the correct answer. The
program was created using the theoretical framework of conceptual change. Previous
articles on students’ misconceptions regarding diffusion and osmosis were examined and
students were interviewed before and after a lecture on osmosis in order to find common
misconceptions. These were used to create multiple-choice questions that would address
misconceptions. Then students individually went through the program and answered
questions; their responses were used to improve the program. How this sample of
students was obtained and how the number of students was chosen not mentioned.
After preliminary testing, the program was used in two university courses for non-
majors, general biology and human body biology, to test if using the program would
assist students in understanding diffusion and osmosis more so than a traditional lecture.
Therefore, the study examined the use of the entire program, not just the use of
animations. This study took place over the course of four semesters. For the general
115
biology course, nine sections were used. Three sections were the control groups, which
meant that they were exposed to the typical, traditional lecture. It was not mentioned if
the lecture was aided by a PowerPoint, writing on the board, etc. Three other sections
used the program which included writing out their explanations, as described above, and,
lastly, three sections used the program but did not have to write their explanations out.
Instead, they only discussed them via think-pair-share. For these general biology courses,
the lecture, or program, took place soon after completing a lab on diffusion and osmosis,
which was toward the end of the semester. Three sections of the human body course were
also used; each section was exposed to the program, including the written portion. There
was not a lab portion to this course and the program was used during the first week.
There were three different instructors total. One instructor of general biology taught one
control and one of each type of treatment group. Another taught two control sessions and
one of each type of treatment group. The third instructor taught two general biology
courses that both used the program with the writing session and taught the three human
body courses.
This study used a pretest/posttest format. The test consisted of predicting results
and explaining those results for various diffusion or osmotic events (similar to the written
portion of the program) and then defining six terms. It was not stated if any questions
were similar to the program’s questions or how the test was validated, only that it was
created by the authors. Answers were coded as either correct or incorrect; the total
number of points possible was 12. General biology and human body courses were treated
as independent groups due to the differences in their curriculum. Sections within general
biology and within human body courses were combined due to no statistical differences
116
in responses on the pretest for all courses (one-way ANOVA; p = .40). Possible
differences between males and females were also tested. Statistical tests used three-way
MANOVA, but tests of normality were not mentioned.
All general biology courses improved on the posttest (p < .001), regardless of
gender or treatment. This indicated that even the traditional lecture aided students’
learning, although students in the treatment groups had a higher improvement score than
the control groups (p < .001). Those that wrote out the explanations for their initial
responses to the questions did poorer on the posttest than those that did not write out the
explanations. Murray et al. (1996) were surprised by this since it contradicted previous
studies but suggested that it may had been due to students writing explanations that
commonly included misconceptions, thereby, reinforcing the misconception. The human
body course sections, which all completed the program, also improved on the posttests (p
< .001) with no find differences between males and females (p = .568).
All in all, the program seemed to aid students in understanding diffusion and
osmosis. However, as Murray et al. (1996) also pointed out but did not explain why,
students still had a fairly poor understanding according to the posttest since the scores
were still quite low. The average for general biology students that also did the written
portion was 4.19 (maximum possible was 12), those that did not complete the written
portion had an average of 5.45 and students from the human body course averaged 5.11.
With students scoring less than half of the questions correctly, the program may still
contained serious flaws. On the other hand, the pretest/posttest was not validated, so the
test may not have accurately measured conceptions of diffusion and osmosis. Further, it
was not stated if students did worse on predicting outcomes, describing why the
117
outcomes would occur, or defining terms. Although the questions used in the program
were not provided in the article, it seemed to aid students’ understanding on various
scenarios, not necessarily on actual definitions. Therefore, measuring students’
conceptions by asking for definitions may be inaccurate. Presently, it is unclear which
contributed to low scores. Either way, those that took part in the program still improved
more so than those that took part in the traditional lecture.
Unlike Murray et al. (1996) who described a program created and validated to aid
in teaching about diffusion and osmosis, McLaughlin (2001) described her use of
published software that offered modules for a variety of topics. These modules included
key concepts that incorporated animations for each concept, review sections, practice
problems, and a self-assessed quiz. For her classroom, McLaughlin (2001) integrated the
key concept, animations, and review sections into her lecture. Students, however, had the
entire module available to them. McLaughlin (2001) stated that “homework is self-
explanatory, since each student is responsible for the entire module and what was covered
extraneously in class” (p. 113). However, it was unclear if that meant that parts were
assigned as graded homework assignments or if only exams covered all of the material.
Further, the textbook was still required for the course for assigned readings that were
covered on the exam.
Evidence supporting the usefulness of the software program included several
quotes from students explaining how enjoyable and helpful the program was and
improved grades. It was not stated if the quotes provided were from end-of-course
student evaluations. Additionally, negative comments were not included or mentioned,
which does not mean that they did not exist. Averages for one of the exams before and
118
after integrating the program into the course were provided. The same exam was used all
semesters. The article primarily focused on the cardiovascular system modules. For the
biology-majors course, students received an average of 85% on the exam during previous
semesters but obtained a 92% on it the first semester the program was used. The non-
majors course averaged 72% one semester on the exam and then the following year when
the program was implemented the average for the exam was 84%. No further analyses
were provided. The focus of this article was primarily covering McLaughlin’s (2001) use
of the program, not on the assessment of it. Therefore, although, there appeared to be
some improvement, it is currently unclear if this improvement was due to the program or
if these differences would be expected. Additionally, similar to Murray et al. (1996),
changes made to the course were more than just adding animations; therefore, neither of
these articles can conclude if the use of animations during lecture improved student
learning.
Kesner and Linzey (2005) also tested the use of published software from a
textbook. This software provided brief reviews, similar to the key concepts from
McLaughlin’s software, followed by animations. Students could also use the software to
quiz themselves and look up terms from a glossary. Unlike McLaughlin (2001), Kesner
and Linzey (2005) did not incorporate the program into the course lecture; instead, the
program was made available to students at a technology lab (with lab technicians), which
was open during normal work hours and three evenings per week. Students then had the
option of going through the modules throughout the semester. Several tests were
administered throughout the semester and each module matched up with only one exam
(muscle, respiratory, urinary, cardiovascular, and nervous) but some exams did not have a
119
corresponding module. Kesner and Linzey (2005) admitted that randomly assorting the
students into either control or treatment groups would make for a stronger study;
however, they made it optional for all because they thought it would be unethical to
provide the resource to some students but not others.
They tested the effectiveness of the optional software during three different
semesters of a human anatomy course (mostly second-year students; n = 150) and two
semesters of a human anatomy and physiology course (mostly third- and fourth-year
students; n = 96); both were for health-related majors. Both courses had more females
(70% and 65%, respectively) than males. Human anatomy students were given written
notes regarding which modules corresponded with particular lecture content, whereas the
anatomy and physiology course were given this information orally. All students were
given extra credit for trying the software out at least once, but no more was provided after
that. Students were also asked to record the amount of time they used the software;
however, it was not stated if the time was collected each time students used it or if they
were expected to submit the times at the end of the semester. Therefore, timing provided,
may or may not have been accurate. This issue may have been resolved by placing time
spent on the module in categories of zero time, time less than one hour, or greater than
one hour.
Student performance was measured using exams that had a corresponding
module, but they were not created to correspond with the module. Instead, similar exams
had been used for the course for 12 years; each semester, only slight modifications based
on the previous semester’s responses were made. Exam questions varied from basic
content questions to application and consisted of a variety of question types, such as
120
multiple choice, true/false, short answer, and essay questions. Student performance on
each exam was compared to the amount of time using the module, sex (since visual
spatial abilities had been shown, based on cited studies, to differ between males and
females), non-module exam grades, science GPA, non-science GPA, SAT verbal score,
and SAT math score via ANCOVA (tests for assumptions were completed). Students
were not told about the study until the end of the semester, which was when they were
asked to fill out a consent form and a questionnaire regarding how useful they found each
module by way of a five-point Likert scale.
Exam questions passed the test of reliability (Cronbach’s alpha; .731 for anatomy
and .858 for anatomy and physiology). Of everything that was compared to the exam
scores, most often, for both courses, the grade resulting from the non-module exams was
the best predictor for the module exams. This relationship was significant for all five
exams for the anatomy and physiology course (p < .001 for each) and four of the five
exams for the anatomy course (p ≤ .001 for each but the muscle exam). Sex occasionally
had a significant relationship with the exam grades (p = .042 for muscle exam for
anatomy course and p = .034 for cardiovascular exam for anatomy and physiology
course). The time spent using the module was only found significant for the nervous
system exam taken by the anatomy course. The other possible variables, GPA and SAT
scores, were either not significant or did not meet the assumptions of the test for all
exams except science GPA was found to be significant for the muscle test (p = .002).
Nothing further was done for any data that did not meet the assumptions of the test.
Although time spent using the module did not seem to matter for the exam,
students that used it did seem to find it useful, especially those in the anatomy course.
121
The five-point scale was rated as “1 ‘useless’, 2 ‘of some help’, 3 ‘good’, 4 ‘very useful’
and 5 ‘extremely useful’” (Kesner & Linzey, 2005, p. 209). Students in the anatomy and
physiology course rated each module as somewhat useful (2.81 - 3.06) and the anatomy
course rated each module as useful (3.16 – 3.49). Kesner and Linzey (2005) suggested
that the modules may have made studying more efficient, which would explain why
students found it helpful but did not improve exam grades. The differences between the
two courses were significant (two-way ANOVA; p < .001) and Kesner and Linzey (2005)
were surprised that students in the anatomy course rated the modules higher than students
in the other course since the modules mostly helped with processes, not anatomical
features. They suggested that this difference may have been due to anatomy students
being given written notes regarding which modules to use for which lecture content and
the anatomy and physiology course given the information orally only. None of the
modules were scored significantly higher than the others; exam scores for each module
were not provided.
In conclusion, Kesner and Linzey (2005) discovered that students found the
modules to be helpful but they did not improve exam scores. These results were
contradictory to the aforementioned studies that found the programs using animations to
aid in student learning. It is possible that modules are only effective if they are used
during lecture, which was what McLaughlin (2001) and Murray et al. (1996) did.
Offering them to students to work on them outside of class but at the university may not
be enough to improve exam scores.
Murray et al. (1996), McLaughlin (2001), and Kesner and Linzy (2005) all
examined programs that had incorporated animations. Sanger et al. (2001), on the other
122
hand, examined if showing students animations regarding diffusion and osmosis before
completing lab exercises exploring these topics would enhance student understanding and
reduce misconceptions. Two animations were of interest. One showed particles diffusing
in the air and the other illustrated the movement of water between a thistle tube with
water and sugar and a beaker of water. Although not explicitly mentioned, the animations
may have come from their textbook materials since the conclusion discussed using
animations from textbook CDs in the classroom.
The experiment was performed in an introductory biology course for biology
majors. The course consisted of 149 students and was split into six laboratory sections of
21 to 28 students. Each laboratory section was randomly assigned to be a control or
treatment group. The treatment group (N = 76) watched both animations three times in a
row, with Sanger narrating the diffusion animation each time. For the osmosis animation,
students first watched it without narration, then discussed which molecules were moving
(water or sugar). After the discussion, students counted the number of traveling water
molecules while watching the video and then they watched it a third time. Each
animation was watched three times since a previous study (which was cited) indicated
that students needed to watch an animation at least three times in order to make sense of
it. After watching the animation, students completed several exercises regarding diffusion
and osmosis. Sanger et al. (2001) did not state if the control group (N = 73) received any
type of lecture before completing the same exercises.
After the labs, students took a test on diffusion and osmosis called the Diffusion
and Osmosis Diagnostic Test. Two studies were cited regarding the test, and Sanger et al.
(2001) stated that questions were developed from students’ misconceptions found in
123
surveys and interviews. The test contained 12 questions. For each question, students were
first asked a multiple choice question over content and then a multiple choice question
regarding an explanation for the first question. Answers were then analyzed by the
percentage of students displaying misconceptions that were described in previous studies
that used the Diffusion and Osmosis Diagnostic Test. It was not clearly described why,
but z-scores were used as the statistical test for comparing the control and treatment
groups; t-tests would likely have been more accurate since this was a sample from a
population with unknown characteristics. Therefore, caution is necessary when
interpreting the statistical significance; percentages, though, are at least provided.
Five misconceptions were described; three were more common in the control
group and two in the treatment group. It was assumed that these five were the only ones
described since they were the only statistically significant responses (based on z scores).
The control group more commonly had the misconception that particles stopped moving
once at equilibrium (36%; treatment group = 19%; p = .026) and that if molecules of blue
dye did keep moving then the solution would have different shades of blue (8%;
treatment group = 0% and p = .014). The animation addressed this misconception by
showing the molecules constantly moving. On the other hand, the treatment group (11%)
more often thought that the sugar did not dissolve into the water (3%; p = .040). The
animation may have led to this misconception since it showed the water molecules and
sugar molecules. As Sanger et al. (2001) suggested students may have related the
individual sugar molecules to entire grains of sugar and therefore thought that they were
not dissolved. This would have to be explicitly addressed while narrating this animation
in the classroom. Occasionally, students, more so in the treatment group, had the
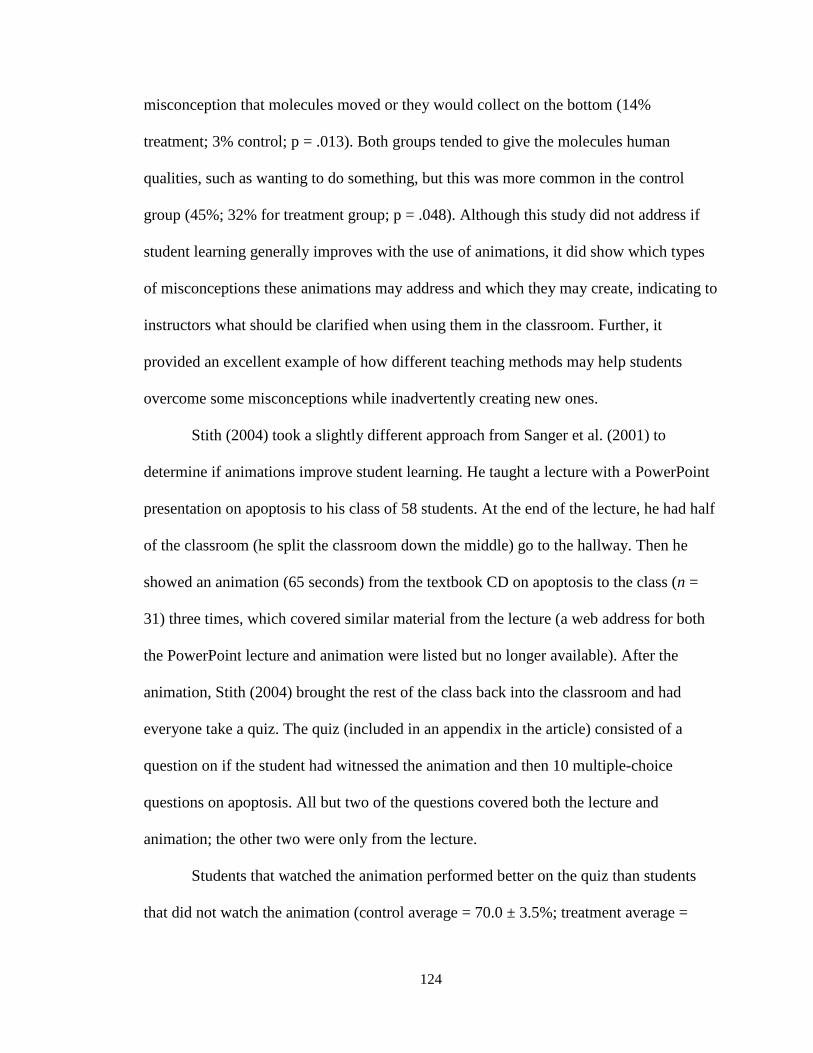
124
misconception that molecules moved or they would collect on the bottom (14%
treatment; 3% control; p = .013). Both groups tended to give the molecules human
qualities, such as wanting to do something, but this was more common in the control
group (45%; 32% for treatment group; p = .048). Although this study did not address if
student learning generally improves with the use of animations, it did show which types
of misconceptions these animations may address and which they may create, indicating to
instructors what should be clarified when using them in the classroom. Further, it
provided an excellent example of how different teaching methods may help students
overcome some misconceptions while inadvertently creating new ones.
Stith (2004) took a slightly different approach from Sanger et al. (2001) to
determine if animations improve student learning. He taught a lecture with a PowerPoint
presentation on apoptosis to his class of 58 students. At the end of the lecture, he had half
of the classroom (he split the classroom down the middle) go to the hallway. Then he
showed an animation (65 seconds) from the textbook CD on apoptosis to the class (n =
31) three times, which covered similar material from the lecture (a web address for both
the PowerPoint lecture and animation were listed but no longer available). After the
animation, Stith (2004) brought the rest of the class back into the classroom and had
everyone take a quiz. The quiz (included in an appendix in the article) consisted of a
question on if the student had witnessed the animation and then 10 multiple-choice
questions on apoptosis. All but two of the questions covered both the lecture and
animation; the other two were only from the lecture.
Students that watched the animation performed better on the quiz than students
that did not watch the animation (control average = 70.0 ± 3.5%; treatment average =
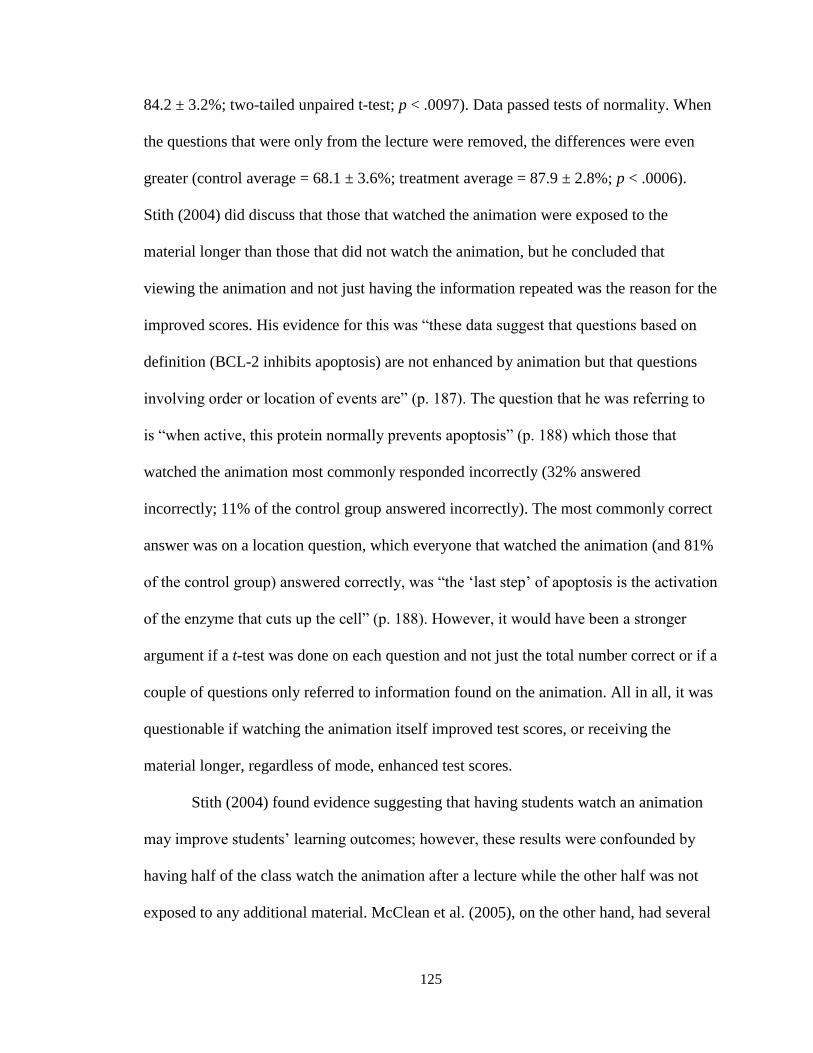
125
84.2 ± 3.2%; two-tailed unpaired t-test; p < .0097). Data passed tests of normality. When
the questions that were only from the lecture were removed, the differences were even
greater (control average = 68.1 ± 3.6%; treatment average = 87.9 ± 2.8%; p < .0006).
Stith (2004) did discuss that those that watched the animation were exposed to the
material longer than those that did not watch the animation, but he concluded that
viewing the animation and not just having the information repeated was the reason for the
improved scores. His evidence for this was “these data suggest that questions based on
definition (BCL-2 inhibits apoptosis) are not enhanced by animation but that questions
involving order or location of events are” (p. 187). The question that he was referring to
is “when active, this protein normally prevents apoptosis” (p. 188) which those that
watched the animation most commonly responded incorrectly (32% answered
incorrectly; 11% of the control group answered incorrectly). The most commonly correct
answer was on a location question, which everyone that watched the animation (and 81%
of the control group) answered correctly, was “the ‘last step’ of apoptosis is the activation
of the enzyme that cuts up the cell” (p. 188). However, it would have been a stronger
argument if a t-test was done on each question and not just the total number correct or if a
couple of questions only referred to information found on the animation. All in all, it was
questionable if watching the animation itself improved test scores, or receiving the
material longer, regardless of mode, enhanced test scores.
Stith (2004) found evidence suggesting that having students watch an animation
may improve students’ learning outcomes; however, these results were confounded by
having half of the class watch the animation after a lecture while the other half was not
exposed to any additional material. McClean et al. (2005), on the other hand, had several
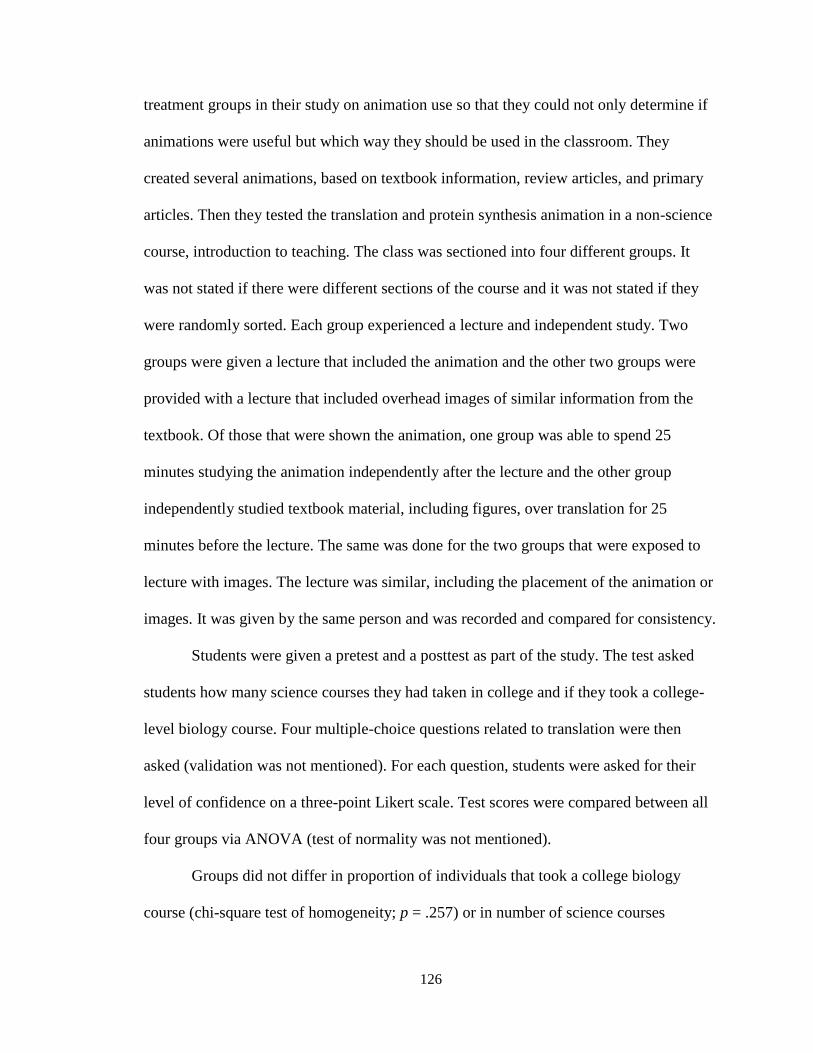
126
treatment groups in their study on animation use so that they could not only determine if
animations were useful but which way they should be used in the classroom. They
created several animations, based on textbook information, review articles, and primary
articles. Then they tested the translation and protein synthesis animation in a non-science
course, introduction to teaching. The class was sectioned into four different groups. It
was not stated if there were different sections of the course and it was not stated if they
were randomly sorted. Each group experienced a lecture and independent study. Two
groups were given a lecture that included the animation and the other two groups were
provided with a lecture that included overhead images of similar information from the
textbook. Of those that were shown the animation, one group was able to spend 25
minutes studying the animation independently after the lecture and the other group
independently studied textbook material, including figures, over translation for 25
minutes before the lecture. The same was done for the two groups that were exposed to
lecture with images. The lecture was similar, including the placement of the animation or
images. It was given by the same person and was recorded and compared for consistency.
Students were given a pretest and a posttest as part of the study. The test asked
students how many science courses they had taken in college and if they took a college-
level biology course. Four multiple-choice questions related to translation were then
asked (validation was not mentioned). For each question, students were asked for their
level of confidence on a three-point Likert scale. Test scores were compared between all
four groups via ANOVA (test of normality was not mentioned).
Groups did not differ in proportion of individuals that took a college biology
course (chi-square test of homogeneity; p = .257) or in number of science courses
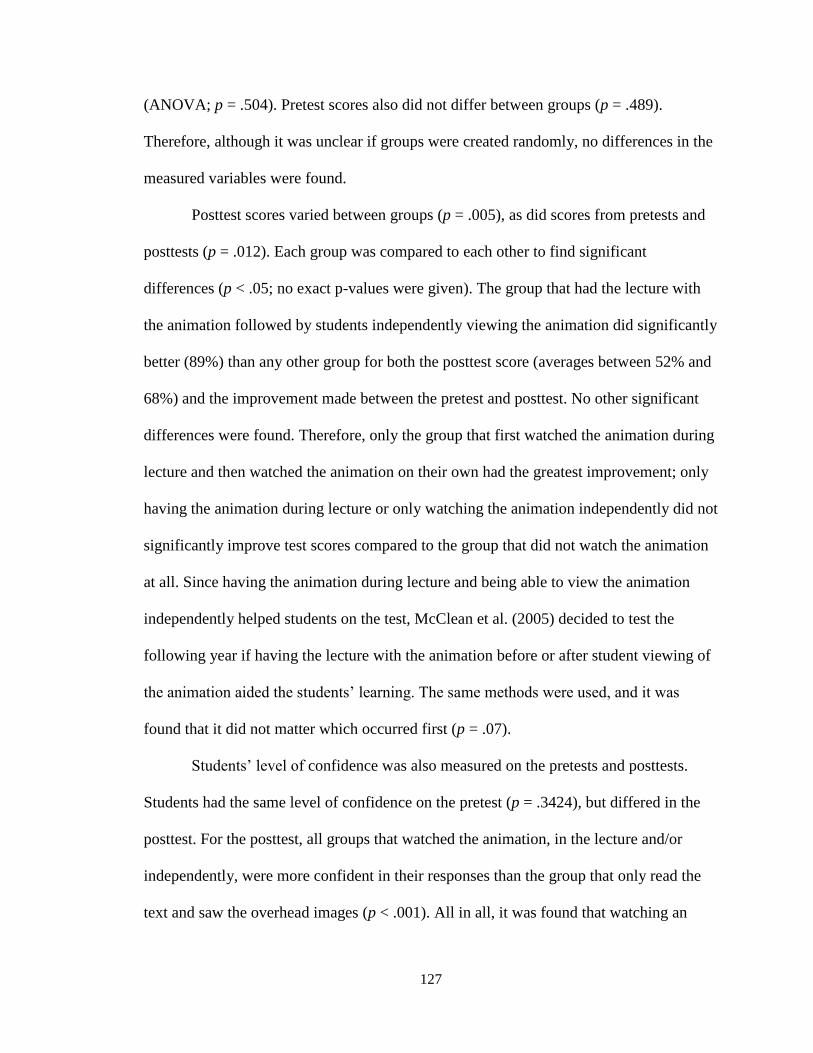
127
(ANOVA; p = .504). Pretest scores also did not differ between groups (p = .489).
Therefore, although it was unclear if groups were created randomly, no differences in the
measured variables were found.
Posttest scores varied between groups (p = .005), as did scores from pretests and
posttests (p = .012). Each group was compared to each other to find significant
differences (p < .05; no exact p-values were given). The group that had the lecture with
the animation followed by students independently viewing the animation did significantly
better (89%) than any other group for both the posttest score (averages between 52% and
68%) and the improvement made between the pretest and posttest. No other significant
differences were found. Therefore, only the group that first watched the animation during
lecture and then watched the animation on their own had the greatest improvement; only
having the animation during lecture or only watching the animation independently did not
significantly improve test scores compared to the group that did not watch the animation
at all. Since having the animation during lecture and being able to view the animation
independently helped students on the test, McClean et al. (2005) decided to test the
following year if having the lecture with the animation before or after student viewing of
the animation aided the students’ learning. The same methods were used, and it was
found that it did not matter which occurred first (p = .07).
Students’ level of confidence was also measured on the pretests and posttests.
Students had the same level of confidence on the pretest (p = .3424), but differed in the
posttest. For the posttest, all groups that watched the animation, in the lecture and/or
independently, were more confident in their responses than the group that only read the
text and saw the overhead images (p < .001). All in all, it was found that watching an
128
animation can make students more confident in their responses and if students are
subjected to an animation during lecture and then repeatedly watch it independently, then
animations can help students improve their understanding.
O’Day (2006, 2007) produced his own narrated animations via PowerPoint and
Camtasia Studio for his own courses. PowerPoint was used to show that programs that
many instructors already had access to can be used to create animations and that more
expensive software programs used by Stith (2004) and McClean et al. (2005) were not
necessary. Part of O’Day’s (2006) article described how instructors can use these two
programs to create animations for topics not yet depicted via professional animations.
O’Day published two different studies; in one study (2006) he examined the use of one
single animation and the other study (2007) he examined two that he had created himself
and one that had been published. These two studies are discussed here together.
In using one of his narrated animations, he tested if students would learn better
via a three-minute narrated animation or graphic and text (O’Day, 2006). In using two
other self-created animations and one published, he compared student retention of
information 21 days after viewing either an animation or graphic (O’Day, 2007). For both
studies, unlike previously discussed, he pulled six still images directly from each
animation so that the information obtained from the graphic would be similar to the
animation. Only slight modifications were made to the graphics to make them clearer.
For his 2006 study, he had students listen to the narration of the animation and had a
script of the narration available to those that had the graphic. His 2007 study did not have
any narration with any of the animations and only provided a written script for one of the
graphics. Students in his third year cell biology course were randomly placed into one of
129
four groups for the 2006 study. O’Day (2006) assumed they had similar education
backgrounds since they all were from the same course and met the prerequisites for the
course. Similarly, in the 2007 study, students from the third year cell biology course and
from a third year human development course were placed into five different groups.
For the 2006 study, two groups viewed the graphic and text and two others
viewed the narrated animation. One of each group type was only allowed to view the
graphic/animation one or two times and the other group was able to view it for up to 15
minutes. Eighty-six students participated in the study; 21 viewed the graphic once or
twice, 16 viewed the graphic for 15 minutes, 16 viewed the animation once or twice, and
33 viewed the animation over 15 minutes. The 2007 study used a total of five groups (N
= 196). Three groups watched one of the three non-narrated animations and the other two
groups were given graphics that related to two of the animations (one of the graphics also
had a written narration). It was not stated if students were randomly placed into groups or
how many students were in each group). Similarities between students were measured by
final course grades, for which no significant differences were found between any of the
groups (no statistical test or results were actually provided).
Afterward, students filled out a questionnaire. For each animation, the
questionnaire first asked about information regarding group placement. Next, students
were asked 10 multiple-choice questions regarding the content covered (validation was
not mentioned). Students were also asked about their opinion regarding if they had
enough time to see the material and if they thought it was helpful in answering the
questions. Then for the 2006 study, students were shown the other resource that they had
not seen earlier (either animation or graphic) and asked which one they thought would be
130
more helpful. It was not stated if the entire questionnaire was given to students at one
time. If so, they could have changed their responses on the content questions after seeing
the other resource, which would confound the results. Although it was stated that two
doctoral students, not the author, proctored the course during the study, 86 students were
in the course, so not all could be observed at the same time. For the 2007 study, students
were given the content questions again 21 days after viewing the animation or graphic.
Two doctoral teaching assistants also proctored the 2007 study, and they were given a
specific script to follow when providing directions to the students. Both studies compared
groups via ANOVA with a significant p-value of .05 and tests of equal variance were
used.
Results of the 2006 study is first described and followed by the results of the 2007
study. Then both studies are compared, as O’Day did in his 2007 article. Of all four
groups in the 2006 study, the group that viewed the animation for 15 minutes, on average,
scored significantly higher than the others (84.4 ± 4.1% SE) and those that watched the
animation only once or twice scored significantly lower than the rest (57.6 ± 2.1% SE).
Students that viewed the graphic and text for 15 minutes scored higher, but not
significantly higher, (71.3 ± 3.4% SE) than those that only saw the graphic and text once
or twice (69.4 ± 3.9% SE). Similar results were found when individual questions were
compared to each other. The four lowest scoring questions for the group that viewed the
graphic only once or twice were selected and compared to the averages of the other three
groups. The group that viewed the animation for 15 minutes scored the highest on each
question and the group that viewed the animation only once or twice scored the lowest
for two of the four questions.
131
Students that were able to see the graphic or animation for 15 minutes thought
that they had enough time to study it (90% and 94%, respectively), and those that just
saw them once or twice did not feel that they had enough time (43.8% and 23.8%,
respectively). These self-reports were also representative of the content scores since those
that viewed their resource longer had a higher score. Most students preferred the use of
the animation over the graphic, especially the students who viewed the animation for 15
minutes (94%; other groups averaged between 69% and 73%). Quotes from 18 students
were also provided. According to the quotes provided and O’Day (2006), students
seemed to prefer the animation for understanding the bigger concept but found the
graphic to also be useful for studying.
According to the results provided, students seemed to do best when they were
able to view the animation multiple times. If time constraints were placed, however,
students performed better with the graphic than the animation. Moreover, the necessity of
viewing an animation multiple times was also supported by McClean et al. (2005). Likely
because of these results, in O’Day’s later (2007) study, students were able to view an
animation more than three times. Caution is necessary when interpreting these results,
however, since not only did the groups differ on if they watched an animation or viewed
graphics but also on if they heard or read the script. Therefore, it was inconclusive if
grade differences were due to the animation, the narration, or both.
In O’Day’s (2007) study, scores from the test taken immediately after viewing the
animation or graphic were compared to results from the same test taken 21 days later
(animations/graphics were taken off of the web site during the 21 days between tests).
For the results listed below, the standard error was always less than .5% and therefore is
132
not listed with the associated mean. For nearly every animation and graphic, scores
significantly dropped between the immediate and delayed tests. The one exception was
one of the three animations (75% and then 63.1%). The associated graphic, which also
included a written script, averaged 80.6% at first and then 50.5% three weeks later.
Another animation averaged 77.9% and later on averaged 43% and the associated
graphic, which did not include a written script, averaged 58.1% at first and then dropped
to 35.8%. The last animation, which did not have an associated graphic, averaged 77.9%
and then 61.9%. These results were similar to O’Day’s earlier (2006) study since
averages were higher for the students who watched animation than viewed the graphic.
In comparing responses to individual content questions (10 total for each subject),
the animation that had the associated graphic without the text rather consistently
produced the same results. For the initial results, scores were higher for those that viewed
the animation rather than the graphic for every question except for one. This question was
one of three definition questions. As Stith (2004) concluded (which O’Day, 2007 cited)
animations appeared to help students more with process questions than definition
questions. For the test taken three weeks later, students who viewed the animation did
better for all but two questions, neither one of them, on the other hand, were definition
questions. Results were inconsistent when comparing the non-narrated animation and
graphic with text. For the initial test, students who viewed the graphic did better than the
other students on six questions, but after 21 days, those who viewed the animation did
better on six questions, two of which were ones that the graphics students performed
better initially. Although statistics were not provided for the individual questions, it was
assumed that those discussed were statistically significant since it was also mentioned at
133
one point that “students scored slightly higher for only two questions (4 and 9), but they
essentially scored the same as those who viewed the graphic” (O’Day, 2007, 221). In
comparing the results of these two scenarios, it appeared that when narration (verbal or
written) was not provided for either animation or graphic, students did better with the
animation; on the other hand, when a silent animation is compared to a graphic with text,
there are less differences in learning outcomes.
As indicated in the student feedback, most (80.9%) of the students found the
resource (animation or graphic) useful in learning. For this study (O’Day, 2007), O’Day
did mention that two negative comments were provided in the free-response portion,
which were essentially that one student thought that he/she should have been paid for
participating in this study and another thought his/her time would have been more wisely
spent sleeping than participating. The other study (2006) did not mention any negative
comments; therefore, it was unclear if any were given or if they were just ignored. Over
half of the students (54%) indicated that they found the animation useful. This number
was lower than the 2006 study, but this may be due to not all students viewing an
animation. Some students (10.3%) mentioned that a narration would have been helpful in
understanding the animation.
In order to have a better understanding of the usefulness of narration in
animations, O’Day (2007) compared the results of the two studies. He admitted that it
was not necessarily appropriate to do since they were from different student groups and
over different animation topics, but thought that the comparison could give some
indication, especially since previous studies (as he cited) have already concluded that
animations were more helpful when accompanied with narration. The average for the
134
non-narrated animations (from the 2007 study) was 76.9% for the initial tests and the
average for the narrated animations (from the 2006 study) was 87.5%. This was over a
10% difference and supported previous studies indicating that narration helps students
understand animations.
Unlike the previously mentioned studies, Scheiter et al. (2009) compared
animation to video instead of a graphic. Scheiter et al. (2009) first reviewed the debate on
if animations or videos were more helpful for students in comprehending basic aspects;
their study then took a basic biological process, mitosis, and compared non-biology major
university students’ conceptions of it when they were shown a video versus an animation
of the process. Also different from the other studies, this study did not take place in a
classroom; instead, each participant was paid and took part individually in a lab with as
much time as necessary.
Scheiter et al.’s (2009) study consisted of two experiments. In the first
experiment, participants were shown either an animation or video of mitosis in order to
find which resource helped students excel on a content test that covered both processes
and structures of mitosis. In the second study, participants were shown either one of the
resources twice or both resources. The order of the resources varied. Prior knowledge
was also analyzed as a possible covariate.
For both experiments, participants first took a 13 question, multiple-choice, prior
knowledge test. They were coded with one point for every correct answer. The test
included questions that covered basic knowledge that students should know before
learning about mitosis and questions over mitosis. Validation of this test, and the final
test, only consisted of whether the information came from a common textbook and one of
135
the authors had a PhD in biology. Then students underwent the learning phase. The first
part included a written introduction regarding basic knowledge that students should
know, such as regarding chromosomes, before undertaking mitosis. Then the treatment
(animation and/or video) were completed. Students could not go back to the basic
introduction once they began the animation or video. Both the animation and video
included six phases of mitosis, including interphase. Both were accompanied with the
same narration. The animation did not use any color coding or zooming in/out so that it
could be as similar as possible, except for taking out unnecessary parts of the cell, to the
video.
Treatments varied between the two experiments. For the first experiment,
participants were randomly selected to view either the animation (n = 19) or the video (n
= 18). Then, for the second experiment, participants were randomly sorted to view the
animation twice (n = 21), view the video twice (n = 20), view the animation and then the
video (n = 21), or view the video and then the animation (n = 21).
After viewing the animation and/or video, evaluations took place. Participants
evaluated the usefulness of the resource for learning certain aspects, such as structural
features, by using a 10-point Likert scale. Participants also had to indicate the level of
effort they used and level of stress on the 10-point Likert scale. For the second
experiment, participants rated the first-viewed resource immediately after viewing it and
then rated the second resource after viewing.
Then participants’ knowledge regarding mitosis was evaluated with two different
tests. Participants of the second experiment took the tests after their second viewing only.
One test was a 21-question multiple-choice test, which five of the questions were also
136
from the prior knowledge test. This test was given verbally; it was not mentioned if
students also received a hard-copy of the test while they were answering. Each multiple-
choice question was coded as one point if it was correct. Cronbach’s alpha was .59 for the
first experiment and .68 for the second experiment, which was acceptable.
Then students took a drawing test (on paper) that included six questions. Five of
the six questions were on schematic drawings, where they had to describe either incorrect
parts or what was missing in each drawing. The last question had students place realistic
pictures of different mitotic phases in the correct order. Each question was rated as two
points if it was completely correct, one point if it was partially correct, and zero if it was
incorrect. Rating was completed by two raters independently and then comparisons were
made. Only two responses were rated differently, which the raters were able to resolve in
discussion. All rates for all six questions were then summed and average totals were used
for comparisons. Since most questions dealt with schematic drawings, it would only
make sense if those that were taught using schematic drawings would perform better on
this part of the test, which Scheiter et al. (2009) mentioned in their conclusion.
Furthermore, Cronbach’s alpha was only provided for the first five questions; it did not
include the sixth question regarding realistic images. Cronbach’s alpha was .73 for the
first experiment (fairly high) and .41 (low) for the second experiment, indicating that
even the first five questions should not be grouped together for the second experiment as
a single score. Due to the unreliable nature of this portion of the test, the current review
of the results of this study are only describing the schematic drawings and realistic
drawings separately.
137
Tests of significance used ANOVA, ANCOVA, and MANCOVA; significance
was measured at .05 (actual p-values were typically not provided in the article if not
significant) and tests of equal variance were completed. The results are described
separately for the two experiments and then summarized together. For the first
experiment, participants either viewed the animation or the video. The two groups did not
differ in their prior knowledge (52.99 ± 18.82 SD and 55.87 ± 20.96). On the multiple
choice test, those that viewed the animation (52.88 ± 16.33%) performed significantly
better than those that viewed the video (43.66 ± 12.36; p = .03). Scheiter et al. (2009) did
not mention this, but either way, students, on average, answered only half of the
questions correctly; therefore, the test provided may not have been appropriate for the
animation and video. Scores on the multiple choice also varied with prior knowledge
scores (p = .001), but interactions between prior knowledge and type of resource was not
found.
Participants that were shown the animation did far better on the schematic
drawings test (73.68 ± 20.06 SD) than those that viewed the video (30.56 ± 20.14 SD; p <
.001); prior knowledge did not significantly influence their responses). For the realistic
images, those that viewed the video did better, but not significantly better (73.33 ± 31.44
SD) than those that viewed the animation (67.37 ± 32.80). Participants’ perceptions were
overall statistically similar whether they watched the animation or video. In a univariate
test, the only question (out of seven) that had a significant difference was following the
narration with the visual; those that viewed the video found it more difficult than those
that viewed the animation (p < .004). Otherwise, differences between the two groups of
students ranged from .04 to 2.43, scored on a 10-point Likert scale.
138
Participants’ prior knowledge also did not statistically differ in the second
experiment. Also similar to the first experiment, scores on the multiple-choice test were
influenced by prior knowledge. Moreover, students that viewed the video twice (42.62 ±
9.95 SD) did significantly worse on the multiple choice test than those that viewed the
video and then the animation (56.69 ± 21.18 SD, p = .02) and those that viewed the
animation twice (57.60 ± 15.13 SD, p = .008), but not significantly worse than those that
first viewed the animation and then the video (51.93 ± 16.14 SD, p = .25). The schematic
drawing test showed that participants who only viewed the video (twice) did significantly
worse (51.00 ± 16.51) than those that watched the video and then the animation (74.29 ±
19.89, p < .001), those that watched the animation and then the video (68.57 ± 16.82, p =
.01), and those that watch the animation twice (81.90 ± 18.87, p < .001). Although those
that only watched the simulation (twice) scored lower than the rest of the groups on the
realistic image test, none of the differences were significant. Prior knowledge also did not
impact the results on either of these image tests.
Students’ perceptions appeared fairly consistent for all seven questions asked
(individual questions analyzed via Bonferroni-adjusted pairwise comparisons). Students
that viewed the same resource twice scored the second time as more helpful, although not
significantly more (video p = .26, animation p = .87) and easier, relative to following the
narration (video p = .002, animation p < .001). Additionally, regardless of whether they
viewed the animation first or second, students found the animation more helpful (p < .001
for both) and easier, relative to following the narration (decreased score was only tested;
video and then animation p < .001). Prior knowledge did not significantly impact their
139
responses. Perceived stress level only significantly decreased for those that viewed the
animation a second time (p = .01).
Scheiter et al. (2009) concluded that students performed better and preferred the
animation over the video when learning about mitosis. However, this conclusion may or
may not be warranted, especially regarding performance. For one, although no significant
differences were found for the realistic image test, the test consisted of only one question,
which was to place the pictures of mitotic phases in the correct order, and was coded as
zero, one or two points. Then this was converted to a percentage. Therefore, as long as
most students had at least some of the phases correct, they scored a one, no matter how
many pictures were actually correctly labeled. On the other hand, the schematic drawings
test consisted of five separate questions that were each coded as zero, one or two points,
allowing up to 10 points which was then converted to a percentage. Scheiter et al. (2009)
did point out this discrepancy between the two types of tests in their discussion and
mentioned that future studies should include more questions with realistic images.
Moreover, although test scores on the multiple choice questions were higher for
those that viewed the animation and therefore those that viewed the animation performed
better, the scores were still around 50%. Therefore, neither the animation nor video
matched the expected learning outcomes, which Scheiter et al. (2009) did not discuss.
Scheiter et al. (2009), on the other hand, did discuss how similar the scores for the two
experiments were, even though the participants in the second experiment had double the
experience. They suggested that viewing the same material may not be helpful, which
was also indicated by previous studies that they cited. However, previous studies
described in this review, which were not cited by Scheiter et al. (2009) found that
140
students had to view an animation three or more times before improving their test score
(McClean et al., 2005; O’Day, 2006).
Unlike the rest of the studies described, Degerman et al. (2012) examined how
students interpret a single animation by examining the metaphors that students used while
discussing the animation in small groups. Degerman et al. (2012) showed 43 Swedish
university students an animation that had been published with textbook supplemental
materials that modeled ATP synthesis. Students had taken introductory courses in
chemistry and molecular biology but had not learned about ATP synthesis prior to
viewing the animation. These students were separated into groups and their discussions
on how to interpret the animation was recorded and transcribed. Which metaphors were
used and how they were used was the focus of this study. Methods used for analysis were
validated by previous studies. The animator that created the animation was also
interviewed to determine the intended interpretation of the animation. It was unclear if
the interview occurred before or after analyzing students’ transcripts. Transcription
checking, which has the interviewee check the typed transcript for accuracy, was
described in regards to the animator interview but not student group discussions. Code
cross-checking was also explained, and appears to be a form of inter-coder reliability,
since discussion transcripts were coded independently by the authors, after creating a
coding dictionary, and then compared after coding was complete (consistency percentage
not provided). Finally, a panel of specialists, which included biologists and experts in
education research, examined and validated the authors’ interpretations.
Degerman et al. (2012) found that all six groups used metaphors, and most
metaphors related to machines (examples and quotes provided). The two metaphors that
141
Degerman et al. (2012) focused on in the analysis were “machine” and “watermill.”
Many of the uses of these two metaphors were scientifically accurate, such as suggesting
that the ATP synthase reaction needs protons to work, just like machines need fuel and
watermills need water (six other examples provided). Some of these metaphors also led to
misconceptions. For instance, once a machine uses fuel, the fuel is depleted, but this is
not the case with protons used during ATP synthesis.
It was not described until later that the reason why “machine” and “watermill”
were so common was because a watermill was used in the animation. The animator,
during the interview, described that he was given specific instructions by the textbook
publishers, and these metaphors had been used in the textbook, itself. Therefore, he was
required to use them in the animation. His intended meaning was relatively
straightforward in that he wanted to show the process acting like a machine. In
conclusion, Degerman et al. (2012) explained that not only does the content in an
animation impact student learning but so do the symbols (e.g., metaphors). The symbols
used can help students understand a concept and hinder a students’ understanding by
introducing misconceptions.
Although relatively few studies have focused on the use of animation in college
biology, according to the studies provided and the literature reviews provided by these
studies, students appear to do better with the use of animations rather than the use of
graphics (McClean et al, 2005; O’Day, 2006, 2007), but students still can find graphics to
be helpful (O’Day, 2006). Students may also perform better on examinations when
provided with animations rather than video (Scheiter et al. 2009). Animations may also
be used with other supplements. For instance, Murray et al. (1996), McLaughlin (2001)
142
and Kesner and Linzey (2005) each described modules that they used in their classroom.
Although the focus of each was on the animations, they also incorporated summary slides
and quizzes that students could take.
Specific qualities were found to be necessary in order for animations, by
themselves, to be helpful. For instance, animations seemed to be more helpful when
narrated (O’Day, 2007). Animations may have to be shown multiple times as well.
Scheiter et al. (2009) did not find any differences in student learning whether an
animation was viewed once or twice, but O’Day (2006) found significant differences for
the same animation if it was viewed only a couple of times versus three or more times.
The length of the animation may also impact student learning, but this was not tested.
Furthermore, not only can incorporating animations into a lecture improve students’
scores (Stith, 2004), but in addition to lecture, giving students time to view it
independently can further improve their understanding (McClean et al., 2005). Moreover,
just making animations available to students may not improve their test grades, even for
those that do actually use it (Kesner & Linzy, 2005). Caution is necessary when first
incorporating new animations into the classroom. As Sanger et al. (2001) and Degerman
et al. (2012) discovered, animations can aid students in facing some misconceptions, but
other misconceptions can also be created.
Many studies have indicated the usefulness of incorporating animations into the
classroom. However, every topic studied thus far related to either cell biology or
physiology. What about other topics in biology? For instance, would students understand
animal behaviour or evolutionary biology better with the use of animation or with the use
of video? Even within the same topic, such as cell biology, the best mode of instruction
143
likely depends on which specific objectives are of interest. Scheiter et al. (2009) found
that students that viewed animations did better on schematic tests than those that viewed
videos, but as they suggested, results may have been different if students were expected
to label certain parts of the cell under a microscope.
Simulations
Simulation technology may vary, but is generally defined by allowing some sort
of manipulation by the user, unlike animations or videos. Simulations have been created
for a variety of courses and cover a gamut of topics (see Table 5). Articles have also
varied in their discussions regarding simulations. Articles may simply explain how
simulations were created (e.g., Kosinksi, 1984) while some described an available
simulation that others could use (e.g., Jones & Laughlin, 2010; Latham & Scully, 2008,
Toth, 2009). Still others have taken these simulations and either examined students’
perceptions of them and/or student performance after using them. The rest of this section
of the review is devoted to these studies.
Several studies have alluded to students’ preference for either simulations or
another form of instruction. Burrows (2010) described a simulation made available to
students so that they could continue to practice creating floral formulas, which were
based on floral structures, after completing dissections and exercises in class. He
described that students found the simulation to be useful, but no further data were
provided.
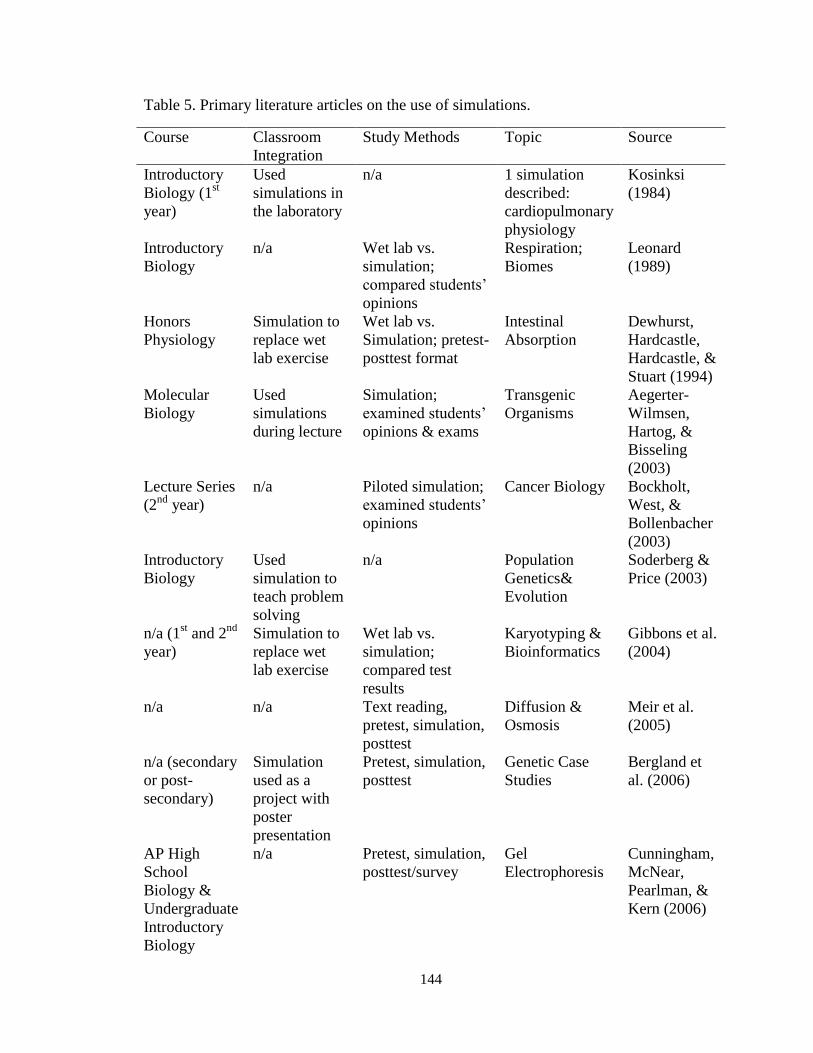
144
Table 5. Primary literature articles on the use of simulations.
Course Classroom
Integration
Study Methods
Topic Source
Introductory
Biology (1st
year)
Used
simulations in
the laboratory
n/a 1 simulation
described:
cardiopulmonary
physiology
Kosinksi
(1984)
Introductory
Biology
n/a Wet lab vs.
simulation;
compared students’
opinions
Respiration;
Biomes
Leonard
(1989)
Honors
Physiology
Simulation to
replace wet
lab exercise
Wet lab vs.
Simulation; pretest-
posttest format
Intestinal
Absorption
Dewhurst,
Hardcastle,
Hardcastle, &
Stuart (1994)
Molecular
Biology
Used
simulations
during lecture
Simulation;
examined students’
opinions & exams
Transgenic
Organisms
Aegerter-
Wilmsen,
Hartog, &
Bisseling
(2003)
Lecture Series
(2nd
year)
n/a Piloted simulation;
examined students’
opinions
Cancer Biology Bockholt,
West, &
Bollenbacher
(2003)
Introductory
Biology
Used
simulation to
teach problem
solving
n/a Population
Genetics&
Evolution
Soderberg &
Price (2003)
n/a (1st and 2
nd
year)
Simulation to
replace wet
lab exercise
Wet lab vs.
simulation;
compared test
results
Karyotyping &
Bioinformatics
Gibbons et al.
(2004)
n/a n/a Text reading,
pretest, simulation,
posttest
Diffusion &
Osmosis
Meir et al.
(2005)
n/a (secondary
or post-
secondary)
Simulation
used as a
project with
poster
presentation
Pretest, simulation,
posttest
Genetic Case
Studies
Bergland et
al. (2006)
AP High
School
Biology &
Undergraduate
Introductory
Biology
n/a Pretest, simulation,
posttest/survey
Gel
Electrophoresis
Cunningham,
McNear,
Pearlman, &
Kern (2006)
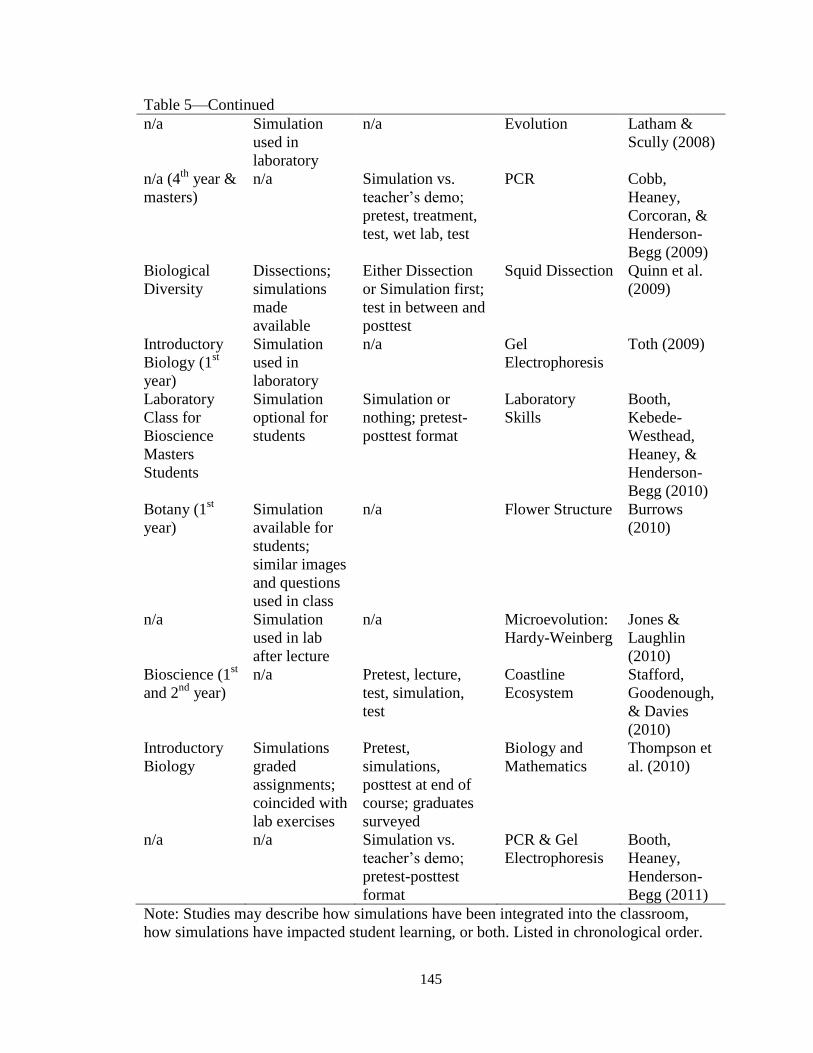
145
Table 5—Continued
n/a Simulation
used in
laboratory
n/a Evolution Latham &
Scully (2008)
n/a (4th
year &
masters)
n/a Simulation vs.
teacher’s demo;
pretest, treatment,
test, wet lab, test
PCR Cobb,
Heaney,
Corcoran, &
Henderson-
Begg (2009)
Biological
Diversity
Dissections;
simulations
made
available
Either Dissection
or Simulation first;
test in between and
posttest
Squid Dissection Quinn et al.
(2009)
Introductory
Biology (1st
year)
Simulation
used in
laboratory
n/a Gel
Electrophoresis
Toth (2009)
Laboratory
Class for
Bioscience
Masters
Students
Simulation
optional for
students
Simulation or
nothing; pretest-
posttest format
Laboratory
Skills
Booth,
Kebede-
Westhead,
Heaney, &
Henderson-
Begg (2010)
Botany (1st
year)
Simulation
available for
students;
similar images
and questions
used in class
n/a Flower Structure Burrows
(2010)
n/a Simulation
used in lab
after lecture
n/a Microevolution:
Hardy-Weinberg
Jones &
Laughlin
(2010)
Bioscience (1st
and 2nd
year)
n/a Pretest, lecture,
test, simulation,
test
Coastline
Ecosystem
Stafford,
Goodenough,
& Davies
(2010)
Introductory
Biology
Simulations
graded
assignments;
coincided with
lab exercises
Pretest,
simulations,
posttest at end of
course; graduates
surveyed
Biology and
Mathematics
Thompson et
al. (2010)
n/a n/a Simulation vs.
teacher’s demo;
pretest-posttest
format
PCR & Gel
Electrophoresis
Booth,
Heaney,
Henderson-
Begg (2011)
Note: Studies may describe how simulations have been integrated into the classroom,
how simulations have impacted student learning, or both. Listed in chronological order.
146
Additionally, Bergland et al. (2006) examined if students gained a deeper
appreciation of the ethics and biology behind genetic testing by simulated case studies.
Although results were only briefly described, interviews of students from one year and
students’ posttests and self-evaluations from another year showed a greater understanding
of both by completing the simulation. The remaining studies described in this section of
the review have described their methods and results in much more detail.
Aegerter-Wilmsen et al. (2003) were interested in using guided inquiry in their
classroom, and therefore, created several simulations of various experiments regarding
transgenic organisms. The simulation gave students background information and then had
them select possible methods to use in order to answer the research question provided.
There was a best method for each experiment, and students were given clues each time
they proposed a possible method that did not match the expected. The simulation ended
with a summary of the results and an explanation of the actual published study.
Afterward, all students filled out an opinion survey, and later students took an exam that
included questions pertaining to the simulation, such as the techniques used to make
genetically modified organisms.
The simulation was a requirement in the molecular biology course (lecture
course), and so students were not told until afterward that they were potential participants
in a study. According to Aegerter-Wilmsen et al. (2003), students were used to filling out
questionnaires after class exercises. Students’ responses were not compared to any other
groups of students. Therefore, Aegerter-Wilmsen et al. (2003) suggested that, on the five-
point Likert scale, an average of four would be acceptable since, on the course
evaluations, the university labeled anything above three as acceptable. One question was
147
on a 10-point scale and a score of 7.5 was deemed as acceptable, but an explanation was
not provided. Average scores on each of the five questions from the exam were also
provided and Aegerter-Wilmsen et al. (2003) declared that students’ answers needed to
be scored with at least a seven on these questions (questions were scaled one through 10,
but how this was done was not explained). Again, no actual explanation on the score of
seven was provided. The student survey and associated exam questions were provided
(validation was not given for either).
Aegerter-Wilmsen et al. (2003) explained that “nearly all students have enough
biology background knowledge and they have some practical experience with a number
of basic techniques” (p. 309), but there was no explanation how this was actually
measured or if it was just assumed. According to the opinion survey (n = 40) and the
acceptable score of 4.0, students seemed to enjoy the simulations (4.1), found them useful
(4.1), and would rather do the simulations than regular lecture (4.3). Overall, they rated
the simulations fairly well (7.8 out of 10). Exam grades (n = 35) varied, and four of the
five questions had acceptable answers (7.2 to 8.6); the fifth question received an average
score of 6.2. All in all, it was found that the simulations tested would be useful in the
classroom and their use would be continued in the course. Moreover, these results
supported that the inquiry-guided simulations may be enjoyable and helpful in the
classroom, but no comparisons were made in the study; therefore, it was questionable if
these simulations would be more useful than other possible options.
Similar to Aegerter-Wilmsen et al. (2003), Bockholt et al. (2003) collected
student feedback on a simulation. Moreover, though, their goal was to collect information
during a pilot study in order to improve the simulation. The simulation treated students as
148
doctors and they had to determine patients’ genetic mutations that caused their cancer
based on available data. At the end, students were asked more general questions to ensure
that they understood the material and were not simply guessing. When the simulation was
first created, it was tested by professionals in the field in order to obtain feedback. Then
undergraduate students in a lecture series course for sophomore students tried the
simulation after a lecture on cancer and provided feedback via survey and focus-group
discussion. More modifications were made to the simulation accordingly.
Then the simulation was used in the same course a year later. This was the latest
feedback obtained for the simulation, and therefore, details were provided for these
students’ perceptions. During class, students could either do the simulation and answer
questions or work on a different project for extra credit (24 of the 30 students did the
simulation). The simulation and survey were made available online. The survey was
completed on WebCT so students had to log in to complete it. If students skipped any
question on the survey, a window popped up letting them know of this, but they still
could submit without answering everything.
All but one student reported spending at least half an hour on the simulation, over
an hour was used by half of the students and nearly 2.5 hours was used by the other half.
The simulation allowed students to examine multiple patients. Over half of the students
examined two patients, two students examined only one patient, six students examined
three patients, and one examined four patients. Although they examined this many
patients, it did not mean that they completed the simulation for all of these patients. Most
students were able to complete two patients’ diagnoses (n = 14), but five were not able to
149
complete any of them. Three students completed only one, and one student completed
four.
On the survey (which was provided), students were provided with a list of 13
possible characteristics, which students used to characterize the simulation. It was not
stated if students had to choose a certain number of them, but from examining the total
number of responses, it appeared that, on average, students selected three characteristics.
The most common characteristics identified by Bockholt et al. (2003, characteristic
quotations on p. 45) were that it was “interesting” (n = 17) yet “challenging” (n = 15).
The next most common characteristic was identified by nine students, and that was that it
was “relevant”; five others indicated that it was “cool” and “intuitive and easy to
navigate.” The rest of the characteristics were only indicated by four or fewer students,
and they were “fun” (n = 4), “extremely difficult” (n = 3), “the right amount of
information” (n = 2), “boring” (n = 1), “easy” (n = 1), “too little information” (n = 1),
“too much information” (n = 0), and “difficult to navigate” (n = 0). Therefore, although
several negative characteristics were available, few students selected them.
Then students were asked free-response questions regarding what they enjoyed
the most and least and suggestions for improvement. Responses were coded and
tabulated. Total number of students and a representative quote for each category was
provided. The most common positive response was that students found the simulation to
be interesting and relevant (n = 5). Students also mentioned the challenge of it to be a
positive characteristic (n = 4) and they enjoyed the use of technology (n = 4). When
asked to list negative aspects, six students stated that they had nothing negative to say,
but six others mentioned that they thought the information provided was too complicated.
150
Similar answers were provided for possible suggestions in that seven stated that they had
no suggestions and six suggested making the information less complicated. All in all,
Bockholt’s et al. (2003) study, like Aegerter-Wilmsen’s et al. (2003) study was not an
experiment to test the relative likability of these simulations. Instead, both indicated that
students seemed to fairly enjoy the use of the provided simulations.
Meir et al. (2005) used a pretest-posttest format, where readings were completed
before the pretest and the treatment was applied between the pretest and posttest in order
to determine the usefulness of simulations on diffusion and osmosis. Most of the authors
of the paper worked for a professional simulation company. This study was not done in a
classroom; instead, college students from 11 different colleges and universities that had
taken at least one college-level biology course that discussed diffusion and osmosis were
recruited.
Students’ misconceptions were measured via a pretest (n = 46). One was made for
diffusion and the other for osmosis. Before the pretest, students were first asked to read
several pages from a textbook covering the topics of diffusion or osmosis (about 10
minutes of reading). The information covered similar written material as the simulation.
The purpose of having students read it before the pretest was so that any changes in
misconceptions on the posttest would be due to the actual simulation and not the
associated text. The test contained a variety of objective and free-response questions,
including drawings that were not exact duplicates of the images from the simulation.
Some of the questions had been taken from previously published studies. The test had
been validated by interviewing students on their responses to make sure that they
understood the question correctly. Meir et al. (2005) then stated that “questions that were
151
misinterpreted were rewritten” but within the same paragraph stated that “here we present
data from the 46 pretests we collected from students before they performed one of the
OsmoBeaker labs” (p. 236), making it sound like these were the same students that
performed the simulation. Therefore, it was unclear what the questions were rewritten for
or if they were used to revise the posttests (it was stated that the two tests were similar
but not identical). The test was coded by one of the authors and then 20% of the questions
were independently coded by another author. Inter-coder reliability was greater than
95%.
Misconceptions on the pretest were similar to misconceptions described in the
literature. They were categorized into eight main misconceptions, such as molecules
being still once equilibrium was met which was the most common misconception (80%,
12/15). Other common misconceptions included thinking that equilibrium was based on
the number of molecules and not the concentration (76.7%, 33/43), and that molecules
moved in a specific direction (73.3%, 11/15). It was not stated why the total number of
students varied for each misconception; it was assumed that others may have just left it
blank. Meir et al. (2005) stated that the simulation was created based on these
misconceptions, but it was not stated if they did not create the simulation until after the
pretest or if they just used the literature in creating it.
Students then were exposed to a simulation, either on diffusion or osmosis, which
took them about 45 to 60 minutes. The diffusion lab was based on a nerve cell and the
osmosis lab was based on a red blood cell being affected by IV fluids. Possible
manipulations included being able to move walls, make them permeable or impermeable,
and change the number of various types of molecules. Students that worked on the
152
diffusion simulation worked individually (n = 15) and those that worked on the osmosis
lab mostly worked in pairs (n =31). Only the total number of students, not the number of
pairs and individuals, was provided. All students took the tests individually.
Not all misconceptions had equal improvement. The most common correct
conceptions regarding diffusion found, according to Meir et al. (2005), were that
molecules do not follow a specific path, molecules do continue to move after equilibrium,
and speed of molecules depends on the concentration of solutes. Number of correct
responses for the pretest and posttest were only provided for questions that tested for
these misconceptions. Overall, students averaged 4.2 (2.5 SD) out of 10 points on the
pretest and then 6.7 (2.3 SD) on the posttest, which was a significant improvement (p <
.001). Furthermore, it was stated that 13 of the 15 students improved, but it was not stated
if this meant statistically improved. Two others had similar scores on the pretest and
posttest.
For osmosis, the most common correct conceptions found were that equilibrium is
dependent on concentration, not number of molecules, correct calculations for
concentration, and that solute impact is independent of type of molecule. A smaller
percentage of students increased their scores from the pretest to the posttest. Twenty-
three of 31 students increased their score, four did not change, and another four actually
decreased their score. On average, the posttest scores (10/18) were significantly higher
than the pretest scores (12.2/18; p < .001).
After completing the posttests, each student had to explain the answers that they
provided on the pretest and posttest that related to the interaction of different types of
molecules, calculations of concentration, and what happens to molecules after reaching
153
equilibrium. Several quotes were provided for each concept. For the interaction of
different types of molecules, most students seemed to understand the connection after the
simulation based on both the posttests and student explanations. Students appeared to not
understand that molecules still moved after reaching equilibrium according to the
posttests; however, students described it correctly orally, showing that the question was
not worded correctly to meet the objective. Both posttests and explanations showed that
students did not understand that molecules continue moving after reaching equilibrium.
Therefore, Meir et al. (2005) concluded that the simulation did not meet this
misconception and would have to be modified further in order to do so.
In order to discover if students that already knew a lot or knew next to nothing
about diffusion and osmosis received the same benefit from doing the simulation, the
authors sorted the students based on pretest scores and placed them into three groups to
compare their posttest increase. Meir et al. (2005) stated that those with the lowest scores
had the greatest percentage increase, but also that this would be expected since they had
more room for improvement. Instead, they should have measured adjusted learning gain
scores, which takes this problem into account by dividing the difference by the total
amount of available increase.
All in all, Meir et al. (2005) found that the simulation aided students’
understanding of diffusion and osmosis. Since students read the material first, they
concluded that the learning was only due to the simulation. However, since there was no
control group, the increased scores could also have been due to spending more time on
the material since the reading task only took about 10 minutes and the simulation lasted
about 45 to 60 minutes. Meir et al. (2005) did note that for commonly misunderstood

154
conceptions, the simulation showed the correct conception but did not have any
associated questions. Those conceptions that students improved on had questions linked
with the simulation. Therefore, they concluded that showing a simulation alone may not
help students confront misconceptions. Instead simulations should be accompanied with
questions.
Thompson et al. (2010) developed several modules, which include simulations
and questions, on various biology topics that also incorporate math skills; the program is
called MathBench (also summarized in Feser et al., 2013). They created these due to the
lack of quantitative data analysis found in the introductory biology curriculum. These
modules were made with biology and math objectives and were intended to prepare
students for upper-level biology courses. In order to determine if these modules enhance
math skills, nine of the 37 modules were incorporated into five sections of an
introductory biology course for biology majors and other related majors, like chemistry
(enrollment: 614 total). The modules were assigned as homework and aligned with
upcoming laboratory exercises. After each module was a quiz; the quizzes were worth
16% of the laboratory grade.
Students were given a pretest at the beginning of the course and posttest at the end
of the course. Both had the same 18 multiple-choice questions, just different numerical
values, which covered several math skills, such as interpreting graphs and calculating
molar weight. One of the optional answers for each question was “I do not know how to
approach this problem;” this was used to determine students confidence in answering
these questions. The posttest also asked students for feedback on the math modules. Data
analysis included separating results by previous math skill level, which is determined
155
once students are enrolled at the university through a standard university test. Also, since
the modules had been used for four years prior to this testing, Thompson et al. (2012)
added feedback questions regarding the MathBench modules to a survey that is already
administered to graduating students by the university.
Overall, students’ scores improved at the end of the semester. The pretest average
was 7.3 out of 18 and the posttest average score was 10.4 (MANOVA, unknown if
assumptions were met, p < .0001). Differences in the pretest, of course, occurred based
on math skill level, but improvement was independent of math skill level (p > .05).
Students that were also enrolled in a math class during the same semester made greater
improvement (p < .05). Thompson et al. (2012) described that students that did poorer on
the pretest had greater gains; however, this is only logical due to a potential ceiling effect.
Net gains, on the other hand, were not described. Students did not do equally well on all
questions. When questions were ordered by level of difficulty, which was determined by
pretest scores, the easiest questions also had the greatest gains. This suggests that the
MathBench program only helps up to a certain point in math skills. Which skills students
did particularly well on or poorly on was not provided. Students also self-reported on
how much their math skills improved on a four-point Likert scale (none, little, moderate,
a great deal). Most students reported that they thought their skills improved a little
(~47%) or by a moderate amount (~41%). Students were also asked which aspects of the
class helped in improving their skills. Over 70% contributed it to MathBench, but this
could be because one of the other questions was specific to MathBench, asking “what
role did the MathBench modules have in the development of your scientific content
knowledge and quantitative skills?” (Thompson et al., 2010, p. 281). Most (83%) were
156
positive statements; statements varied, but 31% stated that the modules helped in
reviewing high school courses. On the other hand, students with higher initial math skills
found the modules to be too easy (9%). When specific features of the modules were
mentioned, students most often described that they enjoyed it being interactive with them
being able to work on problems themselves and go at their own pace.
Of the graduating students that took the survey, 51% had taken a course using the
MathBench modules. The survey included several Likert scale statements. Most students,
whether they used the modules or not, indicated that they found that having math
incorporated into courses was useful. However, most of the students that were able to
identify the importance of math in biology were those that did the MathBench modules (p
< .001). All in all, Thompson et al. (2010) found that the modules helped students gain
math skills to an extent, as shown by students improving on some, but not all, questions.
The modules also helped students comprehend the importance of math in biology.
Although these modules were helpful, it is unclear if this particular mode of integrating
math into biology was particularly helpful or if just by incorporating math into the
classroom students would improve their math skills.
Leonard (1989) examined two different methods of instruction, unlike the
previous studies. He was interested in discovering if students found a simulation using
real video more useful than a traditional wet lab. Two labs, created by the author, were
used in this study with one covering respiration and the other on biomes. Each wet lab
had a corresponding simulation, and students either completed the wet lab or simulation.
The introductory biology course that was used had eight lab sections, each with about 20
students. Two lab sections were taught at one time and lab sections for each time slot
157
were randomly assigned to use either the wet lab or simulation. Seventy students
completed the simulation and 72 students did the wet lab. Instructors (four total) were
also randomly assigned to each lab section; it was unclear if instructors were assigned to
the lab sections for just the study or if instructors were randomly assigned for the entire
semester.
Wet labs were completed in the laboratory classroom at the normally scheduled
time. However, due to high costs, only one videodisc was available so students assigned
to the simulation had to find time to use it (was available in a study center for 18 hours
per day); they were given two weeks to complete the labs and the corresponding
assignments. Therefore, students in the wet lab also had two weeks to complete their
assignments, which were written reports. Students also filled out a questionnaire
regarding their opinions of each lab that they completed. The questionnaire consisted of
statements with five-point Likert scales (one being negative and five being positive) and
free-response questions (variables, but not actual statements, were provided). Multiple t-
tests were used to compare students’ answers between the two groups (α = .05).
Very similar results were found for both the respiration and biome labs. Students
that did the simulations felt more positive about the lab aiding them in understanding the
steps to take for the lab (p < .01) and learning from the lab (p < .01). For the biome lab,
students that completed the simulation also felt more positive about the lab being able to
hold their attention (p < .01). Interestingly, for the respiration lab, students that completed
the simulation felt that the lab helped them with comprehending the data (p < .01), but for
the biome lab, students that completed the wet lab indicated that the lab helped them
more with this (p < .05) than those that completed the simulation. Students that
158
completed the simulation also reported spending less time, both inside and outside of the
classroom, on the labs (p < .01). Several other statements, such as understanding the
biological content, feeling of boredom, and level of interest in science were not
significantly different between the two groups. Students’ comments were summarized by
Leonard (1989), and according to him, students mostly commented that they liked the
simulation since they could obtain data much quicker and if they did not follow
instructions correctly, they could easily go back and fix it. Others, on the other hand,
mentioned that the simulation seemed too unrealistic and they would have rather handled
apparatuses and organisms than complete a simulation.
Although nearly all significant responses reflected students feeling more positive
about the simulation, Leonard (1989) concluded that students did not differ in their
opinions about the two types of instruction. This may have been since nine of the 13
statements did not show a significant difference. Furthermore, convenience of the lab
may have impacted the results, which Leonard (1989) did not describe. Since students
had to find time outside of class to go to the study center to complete the simulations,
students may have felt more negative about the experience. Additionally, it was likely
that those that completed the wet lab were not thinking about comparing their lab to one
that consisted of a simulation. On the other hand, those that completed the simulation
were likely much more experienced with wet labs and, therefore, more likely to reflect on
the simulation in comparison to doing a wet lab, not another simulation. All in all,
although few differences were found between the two groups, it was difficult to conclude
if this meant that students would not have cared if they did the simulation or the wet lab,
once they had experienced both.
159
Similar to Meir et al. (2005), Cunningham et al. (2006) also used a pretest-posttest
format. Moreover, they were also interested in learning outcomes. In order to create the
simulation, they first performed a wet lab on creating gels for gel electrophoresis using
other solutions, such as beer and root beer. After obtaining the results from the lab, they
created a simulation due to the excessive length of time it took to do the lab. In the
simulation, students began by selecting a possible beverage and then made modifications
along the way based on hints that were applied after each modification. The simulation
was tested in an Advanced Placement high school biology course and an introductory
biology course, both of which were face-to-face courses. The simulation took high school
students about 15 to 30 minutes to complete and undergraduate students less than 15
minutes to complete (differences were significant, t-test, p < .001).
Students (20 high school and 38 undergraduates) took an opinion survey after
completing the simulation (survey statements provided but not validated), which had
them rate eight statements, such as if they found the simulation interesting, thought-
provoking, and informative, on a five-point Likert scale which was reduced to a three-
point scale during analysis (i.e., agree, neutral, or disagree). Both groups responded to
each statement in the same way (chi-square, p > .05). All but one statement was worded
in a positive manner. For each statement, students most commonly selected the positive
response and second most common was the neutral response.
Undergraduates also took a pretest and posttest (identical test) consisting of seven
multiple-choice questions over content information (quiz provided but not validated). The
pretest average scores were from 45 students and the posttest average scores were from
38 students. There was no way to pair the pretest with the appropriate posttest since tests

160
were taken anonymously online. Single-way paired t-test showed that students did not
perform any better on the posttest than the pretest for the first three questions, but this
was likely due to a ceiling effect since high scores on the pretest ranged from 92 to 100%.
The remainder of the questions illustrated a significant increase in posttest scores
compared to the pretests, which was also enough to make the overall average posttest
score significantly higher than the pretest score (p = .017). All in all, it appeared that
students seemed to enjoy the simulation and it helped them understand gel
electrophoresis. However, since the test was not validated and ceiling effects occurred for
the first three questions, these results may or may not be accurate.
In order to gain insight into the impact, if any, on students’ understanding of
experiments by completing virtual labs, Stafford et al. (2010) completed a quasi-
experiment using an ecology simulation, which they created, on a coastline ecosystem.
The simulation allowed students to use a limited possible number of experimental
methods to collect data for specific research questions. The simulation was tested in a
biology course for first- and second-year students. Throughout the semester, students
completed three tests; each test asked students to label which possible scenarios were
experiments, to critique experiments, to provide ways to analyze data, and to assess their
own understanding (tests were provided). The order of the tests was randomly assigned
for each student. One test was taken at the beginning of the course, another after
receiving lectures on experimental design, and one more after completing the lab
simulation. Since different tests (although each test used a similar format) were used,
each test was treated independently. Students did not disclose their name on their tests
and coding was initially done by one author and then checked by another author of the
161
paper. Overall scores, as well as scores for each section of each test, were evaluated via
two-way ANOVA, which met assumptions of normality, and Tukey post-hoc tests.
Possible interactions with level of study (first year or second year) were included. Only
six students from each level were used in the survey. Bad weather allowed only six of
level two students to complete all tests, and therefore, six individuals from each test were
randomly selected for the analysis in order to keep the sample numbers consistent.
No interactions with level of study were found for the test overall or for each
section of the test, except for the self-assessment (p = .020), where level one students
gave themselves a higher score on their understanding of experimental design at the
beginning of the course than after the lecture. Due to the minimal differences in level of
study, both years were combined for the rest of the tests. It was found that the overall test
score did not significantly increase until after the simulation, not immediately after the
lecture. These results were also true for the sections of the test that asked for students to
identify experiments from non-experiments and to provide possible data analyses, but not
for critiquing experiments. The graphs, however, did not necessarily match with the data
analyses. The total score and section regarding data analyses showed a fairly even
increase (about one point each time, beginning with 4 out of 17 for the total and half
point each time, beginning with 2 out of 10 for the section) with each test, but the section
regarding experiments versus non-experiments showed an increase of one point
immediately after the lecture (before the lecture, the average score was 0 out of 5 possible
points) and then a slight drop of ¼ point after the simulation.
Student end-of-course evaluations were also completed, and any comments
regarding the simulation were examined. It was stated that the information was gathered
162
by a student for each level of study and the number of students that agreed on a single
quote was provided, sounding like students discussed the evaluation together. The
second-level students, overall (60%), believed that the simulation would have been more
helpful during their first year and first year students (40%) thought that the simulation
was too irrelevant of a topic.
All in all, it appeared that students may have learned about experimental methods
by completing the simulation. On the other hand, the test was not validated and scores
remained low throughout the semester. Furthermore, which Stafford et al. (2010)
mentioned, students retook a similar test each time; therefore, it was impossible to
conclude if students improved scores due to the treatment or due to taking the same exam
repeatedly and being exposed to the material longer. Therefore, these results were only
preliminary.
Dewhurst et al. (1994) assisted in the development of a simulation that would
replace a time-intensive and expensive wet lab on intestinal absorption using rats. The
software was created with all of the same learning objectives as the wet lab except for
development of laboratory skills. They acknowledged that students still did other wet labs
that worked on their laboratory skills. The simulation would, on the other hand, still have
students create their own procedures and analyze their own data. Before doing the
simulation, the software contained introductory sections of graphics and text. Students
also had a workbook to use while performing the simulation.
This lab was normally performed in a college honors physiology course, so that
was where the simulation was tested. The class was split into two groups; eight students
did the same wet lab that had been done for years prior (labeled as the control group) and
163
six students did the simulation (labeled as the treatment group). It was not stated if
students were randomly sorted into groups. However, students were given an attitude
questionnaire before the simulation or wet lab, and students that were to complete the
simulation had a higher (test of significance was not performed) positive attitude toward
simulations than the group that was assigned to do the wet lab, although five of the eight
students had an overall positive attitude. No characteristics were used to ensure that
students did not differ in the two groups, but the average on pretest scores for both groups
were nearly the same (16.4 and 16.3). Both groups of students first were given a lecture
over the material and skills used in the wet lab, including a video of preparing the
intestine for the lab. During the lab, which expanded over three weeks, all students also
had four hours of a tutorial where they learned how to analyze their data. Four optional
hours with the instructor were provided, which many of the control group took advantage
of but only one of the treatment group used. Students in the control group took at least 15
hours, excluding time outside of class. Those using the simulation had to set up times to
use the simulation in a computer lab, and therefore, used as much or little time as needed
to complete it. They reported using 8 to 25 hours total on the project.
All students were given a pretest and posttest. Each covered both content and
student opinions. The content test consisted of primarily 50 short answer questions
(neither test nor validation provided) and the opinion survey had a few open questions
regarding students’ familiarity with computers and then 26 statements (both positive and
negative) on a five-point Likert scale (survey provided but not validated). Students did
significantly better on the content test after doing either the wet lab or simulation. A
statistical test was not shown, but the control group went from a score of 16.4% on the
164
pretest to 67% on the posttest. Similarly, the treatment group received an average score of
16.3% on the pretest and 70.2% on the posttest. The gain on the posttest was statistically
similar between groups (unpaired t-test, p > .05).
As stated earlier, students had an overall positive view on the use of simulations,
although students that were to complete the simulation had a more positive view than the
other group. Bar graphs of each individual’s total attitude score were provided. From
these graphs, it appeared that three of the eight students from the control group had a
negative view of the use of simulations. Two of the three became even more negative
after completing the wet lab, although for the entire group there was little change (Mann-
Whitney U test). Overall, five of the seven (one did not take the pretest) decreased their
approval of simulations. Five of the six students from the treatment group increased their
positive attitude toward simulations. One student decreased but still remained positive.
The treatment group’s attitude toward the use of simulations, overall, increased
significantly (p < .05). Some of the opinion statements were specifically discussed by the
authors. For instance, most from the treatment group suggested that simulations were a
better alternative to using real animals, but the control group felt just the opposite. On the
other hand, all students from both groups felt that students needed at least some lab work
using animals if they planned to do research in their future career.
One of the main reasons for creating the simulation was because the wet lab was
very expensive. An analysis of the expenses for both was included and it was estimated
that lab materials and instructor’s wage could cost over $2,000 more to do the wet lab
than the simulation, which included the cost of purchasing the simulation. Since it was
found that students performed about the same on the content test, Dewhurst et al. (1994)
165
determined that most of the wet lab would be replaced by the simulation for future
semesters. Part of the wet lab (one of the three weeks), however, was still going to be
included. As it was found, simulations can help save money on expensive wet labs and
students enjoy doing them, but not all wet labs should be replaced. Furthermore, learning
gains were shown to be about the same, but the test was not actually provided nor
validated. Therefore, it was difficult to determine if the students actually met the intended
learning objectives.
Gibbons et al. (2004) created two new computer simulations to replace previously
used exercises, one of which was to help save time. One of the replaced exercises, which
was a paper simulation, was on karyotyping. Students were given chromosomes to cut
out from a picture and then place in the correct order. Instead of having to go through the
process of cutting them out and possibly losing the pieces, a computer simulation was
created where students could drag and place chromosomes into a chart. The second
exercise was on bioinformatics. Traditionally, students had to go to gene sequencing
databases. For the simulation, a database was simulated and, therefore, could check to
make sure that students were following the correct process.
Both computer simulations were tested in separate courses. For the karyotyping
simulation, a course of first year biology majors was used (n = 47), although the
particular course name was not provided. Students were split into two groups based on
the results of a pretest of general genetic knowledge (results not provided). Both groups
first received a lecture on karyotyping that included an activity. The control group did the
traditional paper simulation of cutting out chromosomes and gluing them down in order.
Then a tutor provided formative feedback, and students repeated the process without

166
help. The treatment group did the computer simulation, but the program would not allow
chromosomes to be placed in the incorrect order. Then students did a second activity
where they dragged the chromosomes into the order that they believed that they went into
and the program assessed it at the end (a snapshot of the screen was provided). Although
validation was not explicitly described, students were tested using the same exercise that
they just practiced. Both groups were given the same picture of chromosomes for their
first and second simulations. The simulation was also evaluated by another group of
students (n = 10) in their fourth year with the use of a five-point Likert scale on 18
statements (validation was not mentioned).
The second simulation, on bioinformatics, was tested in a course with second-year
students (n = 30). Students were randomly assigned to one of two groups. Both groups
did both the simulation and traditional exercise. The order and topic, however, varied for
each. In other words, one group did the simulation and assessment with topic A and then
one week later they did the traditional exercise with assessment with topic B; the other
group did the traditional exercise with assessment with topic A and one week later did the
simulation and assessment with topic B. The traditional exercise included a lecture and
the simulation included similar material within the simulation. The same assessment was
used for both groups (neither question examples nor validation were included).
For the first simulation, students that completed the computer simulation did
slightly, but not significantly better, on the assessment (one-tailed t-test, p = .25).
Although not mentioned, both performed rather poorly on the assessment since those that
did the paper simulation averaged 43.2% (12.8 SD) and the computer simulation group
averaged 47.6% (15 SD). Furthermore, students that completed the computer simulation
167
spent less time on the exercises than the other group for both the practice (p < .001) and
the assessment (p < .001). The upper-level students that provided their perspective on the
computer simulation scored it very highly. The Likert scale was reduced to a three-point
scale (i.e., agree, neutral, or disagree). The only negative feedback provided was from
two students that thought the feedback provided on the computer assessment was
unhelpful. The tutor also found it less stressful since he or she did not have to help
explain to students how to cut out the chromosomes and worry about students losing
some of the pieces. The instructors determined that they will continue using the computer
simulation for the course.
For the second simulation, both groups combined, students that completed the
simulation scored about the same on the assessments as those that performed the
traditional exercise (p = .40). Differences were found according to topic. Those that
completed the simulation with the first topic performed better (53.0%) than those that did
the traditional exercise (45.6%, p = .04). This was not the case for topic two since those
that completed the traditional exercise did slightly, but not significantly, better on the
assessment (69.7%) than the simulation group (59.7%, p = .15). Unlike the previous
simulation, students took about the same amount of time for either the simulation or
traditional exercise. No comment was made on if the instructors were going to continue
to use this simulation.
Although Gibbons et al. (2004) concluded that “virtual laboratories can be
significantly more effective learning mechanisms than real ones in this subject area
[bioinformatics]” (p 267), this was only found for one of the topics used; the other
showed no significant differences. Therefore, although it may not be concluded that the
168
simulation improved understanding, the simulation seemed to be just as effective.
Furthermore, in some cases, such as when students are required to do prep work, such as
cutting pieces out, a computer simulation can save time. As Gibbons et al. (2004) stated
none of the learning objectives included the ability to cut chromosomes from a picture;
therefore, the computer simulation still met the learning objectives of the paper
simulation, but with less time.
Another study that examined the use of real versus simulated dissections was
completed by Quinn et al. (2009). In this study, students from a biological diversity
course were placed into two groups alphabetically (N = 104). The first group performed a
real dissection of a squid, took an assessment (n = 52), completed a simulated dissection
of a squid, and then took another assessment (n = 50). The first and second assessment
had the questions rearranged; otherwise, no further information was provided on the
assessment. The second group used a similar approach as the first group except they did
the opposite; in other words, they completed the simulated dissection, took the
assessment (n = 45), performed the real dissection, and took another assessment (n = 42).
Students (n = 95) filled out an opinion survey after completing the final assessment. The
survey included 10 statements with a five-point Likert scale and free-response questions
regarding what they enjoyed the most and least about the simulated dissection (survey
provided but not validated). Note that not all students submitted the assessments and
survey, which was why the totals did not add to 104.
The results were contradictory to previously discussed studies on the use of
simulations. Both groups, when analyzed separately, did better on the assessment that
followed the real dissection than the virtual dissection (Student’s t-test, p < .001).
169
Students that first did the real dissection averaged 80.8% and then the score dropped for
the second assessment after the simulated dissection (68.7%). The Second group, which
began with the simulated dissection, averaged 47.1% and then the score significantly
increased to 81.2% following the real dissection. No significant differences were found
between the sexes; although this was tested, the number or proportion of males and
females was not provided. Although students did poorer on the simulated dissection, they
still seemed to find it relevant (88.4% agreed or strongly agreed) and useful (83.2%).
Students did not think the simulation should replace the real dissection (76.8%), but they
would have found it useful to do the simulated dissection before the real dissection
(72.6%). Quinn et al. (2009) found that students performed better on the assessment after
the real dissection than the simulated dissection, but there was no description of the
assessment. Neither learning objectives nor assessment format was described. Therefore,
although Quinn et al. (2009) concluded that students performed better after the real
dissection, it was difficult to determine any definitive conclusions from this study.
Cobb et al. (2009) examined the use of a published virtual laboratory that
included simulations (Second Life). People take part in this virtual place via avatars, and
it has several rooms such as laboratories and conference rooms. A simulation for PCR
was created and tested in a commercial biotechnology course for upper-level
undergraduates and masters students. Students were placed into two groups by when they
entered the classroom (face-to-face, not virtual). The first 50 students were assigned to
the simulation and the rest of the students to a control group.
Both groups began with a pretest (no information was provided about the test).
Afterward, students in the simulation group opened the lab, took part in orientation for
170
the lab, and then completed the simulation after the instructor showed them how to do it.
Students in the control group observed a teacher demonstration (unclear if it was of the
simulation or wet lab). Afterward, all students took another test (unclear if same test as
before). Then all students performed the wet lab version of the simulation and the number
of questions asked by students was recorded. Finally, all students took another quiz and
students that performed the simulation earlier evaluated the simulation via survey. The
survey included a few free-response questions and 20 statements with a five-point Likert
scale (statements provided but not validated). Negative statements were included in the
survey.
Students that completed the simulation received a higher score on each test than
the rest of the students (ANOVA, assumption tests not completed, p < .001), although
both groups significantly increased their score from the one test to the next (p < .001).
Unfortunately, differences between the two groups also included the pretest, suggesting
that placing students into groups based on who attends early and who attends later does
not produce equal sampling. It was stated that this was done due to time constraints, but it
seemed just as possible to assign students to a group by every other student that entered
the room. Gain scores, on the other hand, were the same for both groups. During the wet
lab, students that completed the simulation asked fewer questions regarding the directions
than the other students (p < .001). This was associated with learning; however, it could
have also been due to differences in prior knowledge before the study began. Students
evaluated the simulation quite highly; 92% of students would use the simulation again.
Some of the trends found, using correlation tests, were that younger students tended to be
more satisfied with the simulation than older students (r = -.54, p < .001) and those that
171
found the simulation easier to use were also more satisfied, which should not come as a
surprise (r = .7, p < .001).
Cobb et al. (2009) concluded that “the use of the Virtual Lab prior to conducting
real-life experiments makes students better prepared for the real thing” (Discussion
section, para. 4). However, the results indicated that students who watched a
demonstration gained just as much knowledge than those that did the simulation.
Additionally, Cobb et al. (2009) pointed out that those that did the simulation asked more
conceptual-level questions, indicating that they learned more, but they also began the
study with more prior knowledge than the control group. All in all, it appeared that
watching a demonstration or performing a simulation helped students understand the
material and may have aided in understanding and being able to perform the associated
wet lab. Unfortunately, similar to several other studies, nothing was stated on how
learning was actually assessed.
Booth et al. (2010) attempted to test if a Flash simulation, that their university
produced, would improve students’ scores on a written assessment of laboratory skills.
Bioscience masters students in a course of 18 took a written pretest (confidence log and
knowledge test) regarding laboratory skills; the pretest was based on cited work of
different authors but question examples were not provided. Based on these responses,
students were then placed into two groups. Besides what was completed in the course,
which was unknown, one group had additional instruction by attending a workshop that
first showed students the possible uses of the laboratory simulation and then allowed
them to practice it. The simulation was made available to them to use for the following
two weeks; it was not worth points but they were told it would help them in the course.
172
Unfortunately, none of the students used it during the next two weeks, which they
indicated on a survey. All students took the posttest (confidence log and knowledge test)
and results were compared between the two groups. All students improved their scores on
the posttest compared to the pretest (treatment p = .031; control p = .051; statistical test
information not provided). However, neither posttest scores nor gain scores significantly
varied between the two groups (p = .659; p = .517, respectively). Since students from the
treatment group only used the simulation on the one day, these results were expected.
Students in the treatment group, on the other hand, felt much more confident on the
posttest than the control group (p < .05). Means and standard deviations were provided
for the confidence logs, but the total number of points available was not. Booth et al.
(2010) mentioned that “mean scores show that the flash group achieved higher
confidence gains than the control group and for the volume task this improvement was
significant (p > .05)” (para. 5). However, the “volume task” was not described. It may
have been one of the questions on the knowledge test, since in a later paper, Booth et al.
(2011) commented that the 2010 paper found significant differences between the
treatment and control groups in the test scores, which, overall, the differences were
insignificant.
Seven students filled out an opinion survey on the simulation and all stated that
they would recommend the simulation to a friend, but none of them actually used the
simulation themselves. The most common responses as to why they did not use it, based
on the survey and a focus group that four attended, was that they already knew the
information and/or they did not have time. However, according to the results of the
pretest and posttest, students did not know the information very well since the average
173
score on the pretest was 41% (10 total questions) and the posttest was 59%. It was not
stated if students were told their grades or if they had any idea on their grades received.
Therefore, students may not have realized that they did poorly on the test, the test may
not have aligned with the simulation’s objectives, and/or students were lying. Whichever
the case may be, although students did not use the simulation, they would recommend it,
especially to undergraduates.
After Booth et al. (2010) found that the Flash simulation produced higher gains,
and possibly higher quiz scores on one of the questions, they determined that another
study should be done. Additionally, they were interested in the results from Cobb et al.
(2009; two of the authors were the same for both studies), which suggested that Second
Life virtual labs also improved student knowledge gains. Therefore, they decided to
compare a Flash simulation and Second Life simulation to each other and a control
group.
Four classes were selected; although not directly stated, it appeared that two of the
classes were used a control and the other two classes as the treatment groups. It was made
clear, however, that for each of the treatment classes, students were randomly assigned to
either the Flash or Second Life simulation (n = 20 for both), and the students assigned to
the Second Life simulation completed it in a different room. The control group viewed a
demonstration of gel electrophoresis and PCR, but did not complete a wet lab.
Each class took a pretest over gel electrophoresis and PCR and they completed a
confidence log. Due to the set-up of the classes, the control classes took the pretest during
the first week of the semester, and the treatment classes took their pretest during the
second week. The knowledge test consisted of four questions over gel electrophoresis and
174
four over PCR and was coded as correct or incorrect (correct being worth one point);
validation was not mentioned. The confidence log was a visual scale that scored between
0 and 100; validation consisted of citing a previous study. Students also completed an
opinion survey that had a few free-response questions and 11 statements with a five-point
Likert scale. The survey was modified from Cobb et al. (2009).
The control group was shown the demonstration during the third week of the
semester, and the treatment group was first shown how to use their simulation and then
completed the simulation during the fourth week of the semester. After either the
demonstration or simulation, students took the survey and then posttest and confidence
log. Afterward, students had access to both simulations during the semester. At the end of
the semester, students were asked to participate in a focus group for a discussion on both
simulations (lunch was provided as an incentive).
Ninety-three students participated in this study. For those that did not take the
pretest, they were assigned the mean pretest score. Unfortunately, the control group had
significantly better scores on the quiz (t-test, p < .001) and on the confidence logs (p <
.05) than either treatment group (both treatment groups performed the same). The
difference could not be explained since even when the students who had completed the
simulations before were removed, differences were still found. It was not stated why
some students had already completed the simulation before.
Booth et al. (2011) stated, for PCR, that “T-tests results reported that there were
significant learning and confidence gains for all conditions” (p. 457) but the next
sentence stated that “there were no significant differences in confidence gains between
conditions” (p. 457). Therefore, it was unclear if differences were or were not actually
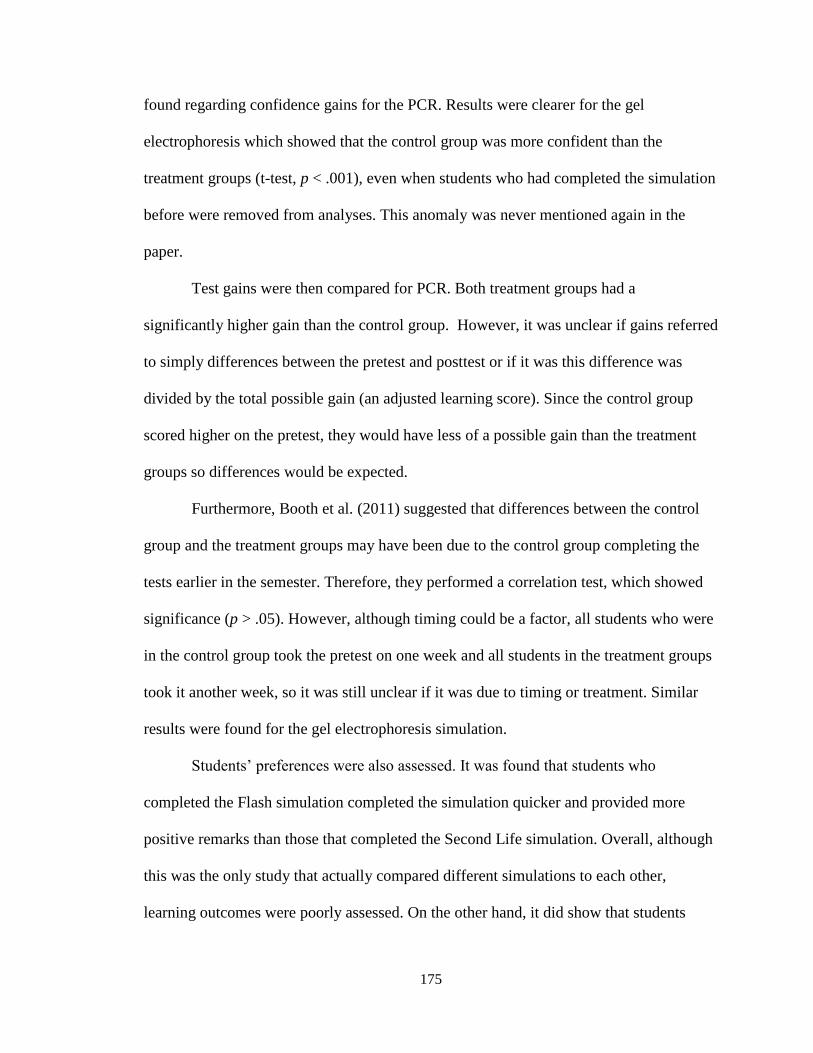
175
found regarding confidence gains for the PCR. Results were clearer for the gel
electrophoresis which showed that the control group was more confident than the
treatment groups (t-test, p < .001), even when students who had completed the simulation
before were removed from analyses. This anomaly was never mentioned again in the
paper.
Test gains were then compared for PCR. Both treatment groups had a
significantly higher gain than the control group. However, it was unclear if gains referred
to simply differences between the pretest and posttest or if it was this difference was
divided by the total possible gain (an adjusted learning score). Since the control group
scored higher on the pretest, they would have less of a possible gain than the treatment
groups so differences would be expected.
Furthermore, Booth et al. (2011) suggested that differences between the control
group and the treatment groups may have been due to the control group completing the
tests earlier in the semester. Therefore, they performed a correlation test, which showed
significance (p > .05). However, although timing could be a factor, all students who were
in the control group took the pretest on one week and all students in the treatment groups
took it another week, so it was still unclear if it was due to timing or treatment. Similar
results were found for the gel electrophoresis simulation.
Students’ preferences were also assessed. It was found that students who
completed the Flash simulation completed the simulation quicker and provided more
positive remarks than those that completed the Second Life simulation. Overall, although
this was the only study that actually compared different simulations to each other,
learning outcomes were poorly assessed. On the other hand, it did show that students
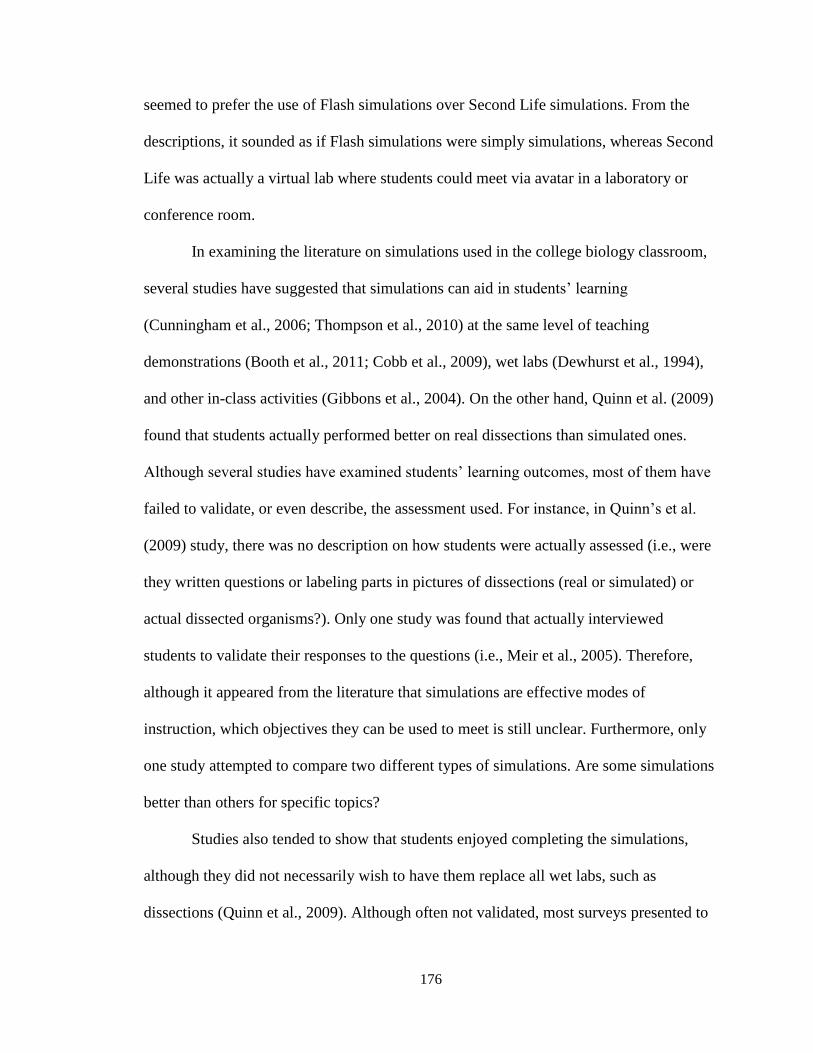
176
seemed to prefer the use of Flash simulations over Second Life simulations. From the
descriptions, it sounded as if Flash simulations were simply simulations, whereas Second
Life was actually a virtual lab where students could meet via avatar in a laboratory or
conference room.
In examining the literature on simulations used in the college biology classroom,
several studies have suggested that simulations can aid in students’ learning
(Cunningham et al., 2006; Thompson et al., 2010) at the same level of teaching
demonstrations (Booth et al., 2011; Cobb et al., 2009), wet labs (Dewhurst et al., 1994),
and other in-class activities (Gibbons et al., 2004). On the other hand, Quinn et al. (2009)
found that students actually performed better on real dissections than simulated ones.
Although several studies have examined students’ learning outcomes, most of them have
failed to validate, or even describe, the assessment used. For instance, in Quinn’s et al.
(2009) study, there was no description on how students were actually assessed (i.e., were
they written questions or labeling parts in pictures of dissections (real or simulated) or
actual dissected organisms?). Only one study was found that actually interviewed
students to validate their responses to the questions (i.e., Meir et al., 2005). Therefore,
although it appeared from the literature that simulations are effective modes of
instruction, which objectives they can be used to meet is still unclear. Furthermore, only
one study attempted to compare two different types of simulations. Are some simulations
better than others for specific topics?
Studies also tended to show that students enjoyed completing the simulations,
although they did not necessarily wish to have them replace all wet labs, such as
dissections (Quinn et al., 2009). Although often not validated, most surveys presented to
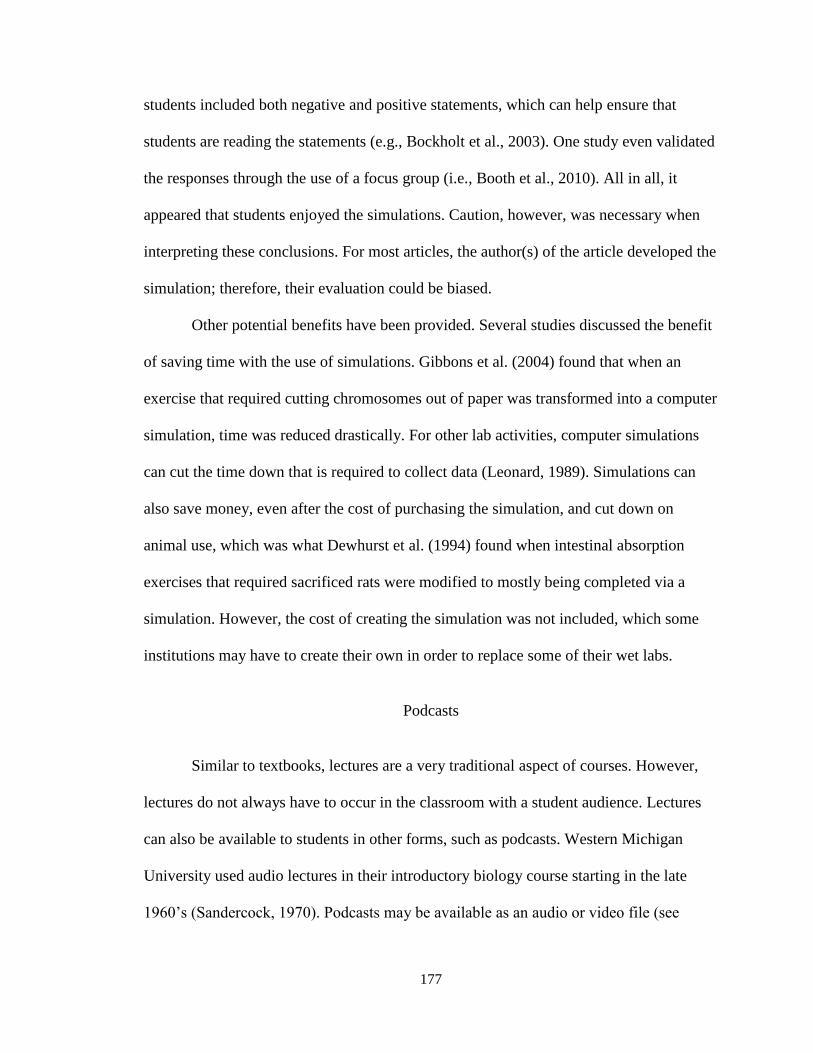
177
students included both negative and positive statements, which can help ensure that
students are reading the statements (e.g., Bockholt et al., 2003). One study even validated
the responses through the use of a focus group (i.e., Booth et al., 2010). All in all, it
appeared that students enjoyed the simulations. Caution, however, was necessary when
interpreting these conclusions. For most articles, the author(s) of the article developed the
simulation; therefore, their evaluation could be biased.
Other potential benefits have been provided. Several studies discussed the benefit
of saving time with the use of simulations. Gibbons et al. (2004) found that when an
exercise that required cutting chromosomes out of paper was transformed into a computer
simulation, time was reduced drastically. For other lab activities, computer simulations
can cut the time down that is required to collect data (Leonard, 1989). Simulations can
also save money, even after the cost of purchasing the simulation, and cut down on
animal use, which was what Dewhurst et al. (1994) found when intestinal absorption
exercises that required sacrificed rats were modified to mostly being completed via a
simulation. However, the cost of creating the simulation was not included, which some
institutions may have to create their own in order to replace some of their wet labs.
Podcasts
Similar to textbooks, lectures are a very traditional aspect of courses. However,
lectures do not always have to occur in the classroom with a student audience. Lectures
can also be available to students in other forms, such as podcasts. Western Michigan
University used audio lectures in their introductory biology course starting in the late
1960’s (Sandercock, 1970). Podcasts may be available as an audio or video file (see
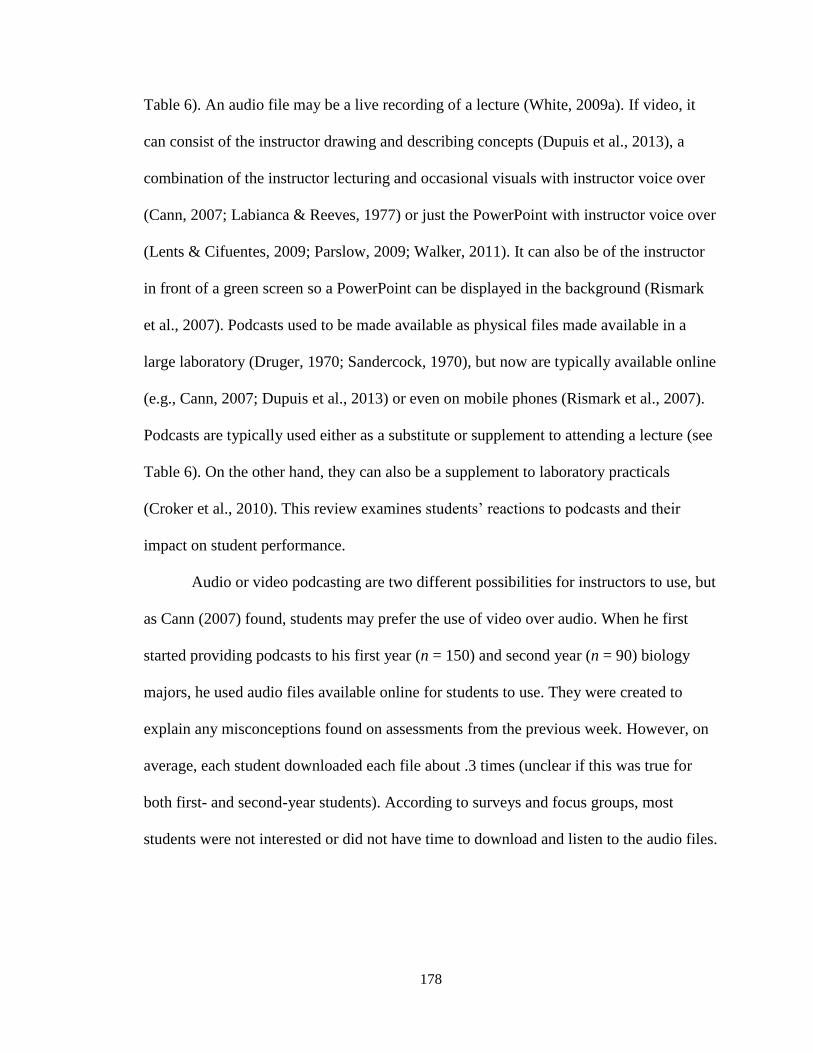
178
Table 6). An audio file may be a live recording of a lecture (White, 2009a). If video, it
can consist of the instructor drawing and describing concepts (Dupuis et al., 2013), a
combination of the instructor lecturing and occasional visuals with instructor voice over
(Cann, 2007; Labianca & Reeves, 1977) or just the PowerPoint with instructor voice over
(Lents & Cifuentes, 2009; Parslow, 2009; Walker, 2011). It can also be of the instructor
in front of a green screen so a PowerPoint can be displayed in the background (Rismark
et al., 2007). Podcasts used to be made available as physical files made available in a
large laboratory (Druger, 1970; Sandercock, 1970), but now are typically available online
(e.g., Cann, 2007; Dupuis et al., 2013) or even on mobile phones (Rismark et al., 2007).
Podcasts are typically used either as a substitute or supplement to attending a lecture (see
Table 6). On the other hand, they can also be a supplement to laboratory practicals
(Croker et al., 2010). This review examines students’ reactions to podcasts and their
impact on student performance.
Audio or video podcasting are two different possibilities for instructors to use, but
as Cann (2007) found, students may prefer the use of video over audio. When he first
started providing podcasts to his first year (n = 150) and second year (n = 90) biology
majors, he used audio files available online for students to use. They were created to
explain any misconceptions found on assessments from the previous week. However, on
average, each student downloaded each file about .3 times (unclear if this was true for
both first- and second-year students). According to surveys and focus groups, most
students were not interested or did not have time to download and listen to the audio files.
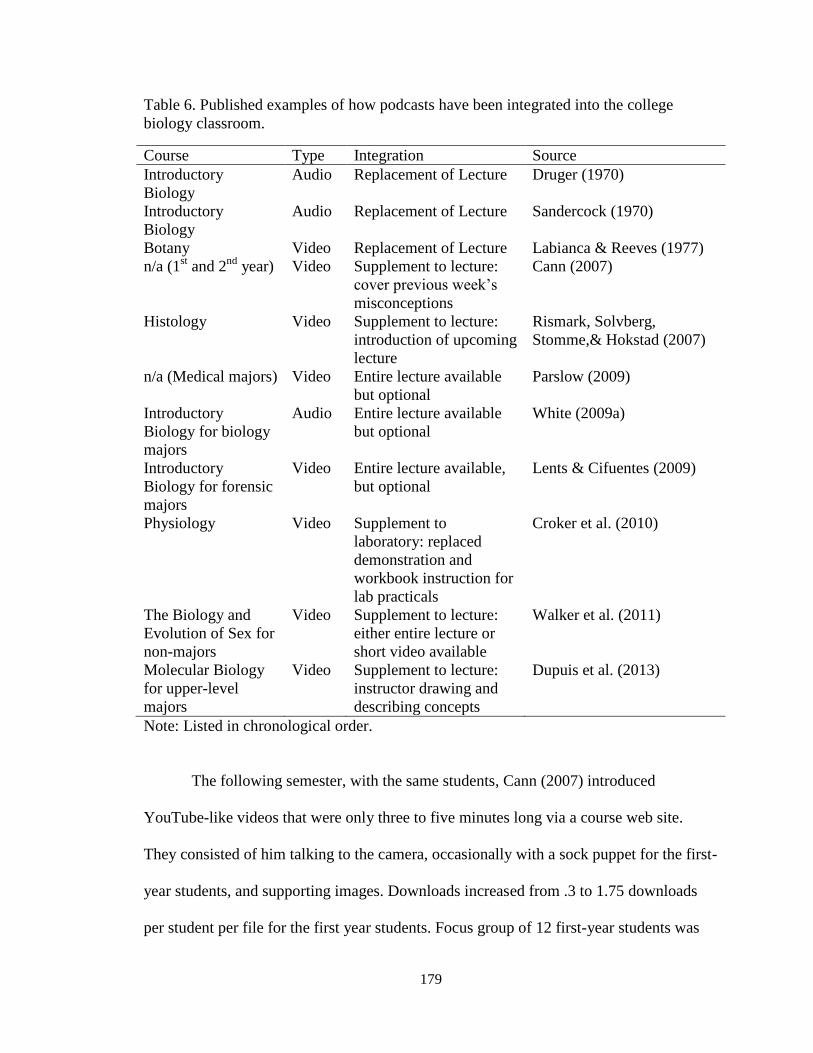
179
Table 6. Published examples of how podcasts have been integrated into the college
biology classroom.
Course Type Integration Source
Introductory
Biology
Audio Replacement of Lecture Druger (1970)
Introductory
Biology
Audio Replacement of Lecture Sandercock (1970)
Botany Video Replacement of Lecture Labianca & Reeves (1977)
n/a (1st and 2
nd year) Video Supplement to lecture:
cover previous week’s
misconceptions
Cann (2007)
Histology Video Supplement to lecture:
introduction of upcoming
lecture
Rismark, Solvberg,
Stomme,& Hokstad (2007)
n/a (Medical majors) Video Entire lecture available
but optional
Parslow (2009)
Introductory
Biology for biology
majors
Audio Entire lecture available
but optional
White (2009a)
Introductory
Biology for forensic
majors
Video Entire lecture available,
but optional
Lents & Cifuentes (2009)
Physiology Video Supplement to
laboratory: replaced
demonstration and
workbook instruction for
lab practicals
Croker et al. (2010)
The Biology and
Evolution of Sex for
non-majors
Video Supplement to lecture:
either entire lecture or
short video available
Walker et al. (2011)
Molecular Biology
for upper-level
majors
Video Supplement to lecture:
instructor drawing and
describing concepts
Dupuis et al. (2013)
Note: Listed in chronological order.
The following semester, with the same students, Cann (2007) introduced
YouTube-like videos that were only three to five minutes long via a course web site.
They consisted of him talking to the camera, occasionally with a sock puppet for the first-
year students, and supporting images. Downloads increased from .3 to 1.75 downloads
per student per file for the first year students. Focus group of 12 first-year students was
180
formed and 75% of them had downloaded at least one of the videos. Most students
preferred the videos over the audio files, including the sock puppet that randomly
appeared from time to time in the videos. Cann (2007) determined the use of the puppet
would break up the monotony of video and students seemed to agree (a few quotes were
provided). Similar videos were also used for the second-year students, except without the
use of the sock puppet. Downloads were not as high as the first-year students (.92
downloads per student per video). Cann (2007) suggested that the lower rate of
downloads were due to not having the sock puppet since that was the only variable that
he changed; however, it was also with a different population of students, so a number of
other variables could also explain the difference. Overall, it appeared that students
preferred the use of video versus audio podcasts. The length of the audio podcasts also
was not provided; if they were longer than the three- to five-minute videos, then the
length could also be a contributor.
Another possible reason to create video podcasts for students is to prepare them
for an upcoming lecture. Riskmark et al. (2007) posted videos that were similar in length
to Cann’s (2007) videos (about four to six minutes), but had the instructor discuss what
the upcoming lecture would be about and suggested ways to prepare for it. These videos
were professionally made in a studio and had the instructor recorded in front of a green
screen so that a PowerPoint could be played in the background. Another interesting point
about these podcasts, compared to any other study that is discussed in this review, is that
they were formatted for both the computer and two different types of mobile phones.
Therefore, students could access them without needing a computer. Riskmark et al.
181
(2007) performed a qualitative study to determine if students found these podcasts useful
and enjoyable.
A histology class was observed and seven students were interviewed. It was
unclear if the class only had seven students or if this was a portion of the students.
Students all had computers and mobile phones with 3G capability. Eleven (total number
for the course were not provided) of the lectures were observed in order to understand the
relationship between the lecture and the provided videos. Student interviews allowed the
researchers to know how often they used the videos, as long as they were being honest,
and what they thought of them. Interviews were held after the lectures, and interviewer(s)
referred to recent lectures in order to ensure that their observations matched with what the
students felt. Another interview was held toward the end of the course.
Most students agreed that not only having the videos but having them available on
mobile phones was very useful. All students at least tried them; some students used them
regularly and others did not (total counts were not provided; “regularly” was not defined).
Students commented that they sometimes just watched the video to prepare last-minute,
which they would have not bothered to do if it was not available on their phone. Other
students would also do the exercises that the instructor recommended. One student found
that having the videos on the phone rather pointless since other resources, such as the
textbook, were necessary anyway to properly prepare, while another student found it
useful since he or she did not always have access to a computer while he or she was
studying.
Cann (2007) and Riskmark et al. (2007) both examined the use of podcasts that
only supplemented lecture. White (2009a), on the other hand, provided students audio
182
files of every entire lecture for a face-to-face introductory biology course. The previous
semester’s files were also available so students could either listen to them before or after
lecture. The lecture, itself, included clicker questions that were required for points (small
percentage of grade, but exact percentage not provided), but no further description, such
as the use of PowerPoint, videos, etc., were described. White (2009a) was interested in
how often and why students used the podcasts and if having them available impacted
class attendance. Attendance was measured via clicker responses and use of podcasts was
measured on the podcast web site. The web site provided information on how many times
and when each podcast was downloaded by each computer IP address.
First of all, White (2009a) assumed that each computer IP address could be
associated with each student; however, more IP addresses (228) were found than number
of students (n = 185); therefore, this assumption was not valid. Further, White (2009a)
described another assumption, which was that each download represented one listening
time, but it could have been listened to more than once or not at all.
The number of downloads, which averaged 7.2 per computer, was much higher
after the lecture than before the lecture; moreover, students, on average, downloaded the
files 18.3 days after the lecture was given. From further analysis, it was found that
students typically downloaded files the week before each exam (61% of all downloads).
Therefore, instead of using the files to review what was recently discussed, most students
likely used them as a study tool to prepare for exams.
Attendance was measured via clicker responses (all but one student purchased a
clicker), with the proportion of students that attended the semester before podcasts were
introduced compared to five semesters with podcast usage. The semester average
183
beforehand was 75.3% and all other semesters combined were 75.8%, showing no impact
on attendance. Furthermore, there was no correlation between lectures that had poor
attendance and number of downloads for that particular lecture (correlation test but no
statistics provided). Although, White (2009a) used this information to conclude that
having podcasts available did not impact attendance, this lack of a relationship could also
be a negative thing since it also meant that if students missed a lecture for whichever
reason, they typically did not bother to listen to what they missed.
The lack of difference in attendance may be due to a number of reasons. For
instance, White (2009a) concluded that since clickers were used and worth course points,
students had a further incentive to attend lecture. Additionally, it was not stated how
much additional material may have been provided during lecture. For instance, the course
may have included animations and videos, which may or may not have been available to
students. Therefore, it may have been worthwhile to attend. Additionally, White (2009a)
described the download rate as 7.2 per student, but this was for all files combined. Thirty-
nine files were available; therefore, the rate was .18 downloads per student per file. This
could mean that students just simply were not interested in listening to the lecture with
any visual. Cann (2007) found that when he used audio files, the rate was .3 and then
when short video files were introduced, the rate increased to 1.75 downloads per student
per file. It is possible that attendance may have been impacted if videos, instead of audio
files, were used. Furthermore, students gained points by attending lecture; if this was not
the case, podcasts may have impacted attendance.
Thus far only podcasts made available for lectures have been discussed. On the
other hand, podcasts can also be used for the laboratory. Croker et al. (2010) created
184
videos for students to watch before and during lab practicals for a physiology course (N =
74). These videos replaced the introductory demonstration and workbook instructions for
three of the labs. They were created by the authors, although they had no training, with an
average hand-held video recorder and were edited with appropriate software. Instead of
using the original audio, it was replaced and labels were also introduced into the video.
While performing the lab exercises, demonstrators were still available, as they were
before, to assist students. Each video was broken down into two- to four-minute sections
that pertained to various aspects of the exercises. Videos were available online for
students one week before the lab and for the rest of the semester. Afterward, students and
staff members filled out a survey of questions with possible answers of yes, no, or no
preference. The survey was provided but not validated.
According to the demonstrators, students appeared to be comfortable with the use
of the videos since they immediately went to their groups and began. Students continued
to ask the demonstrators questions, but the demonstrators described the questions as
being more higher thinking questions, whereas before the videos they mostly asked how
to use the equipment and what exactly to do. Of course, these were only demonstrators’
opinions and although they were not the authors of this study, they were aware of the
treatment which could bias their thinking. Furthermore, the demonstrators noted that the
labs seemed to take less time so students had more time to discuss their results as a class.
Although it was mentioned that students’ output was about the same, no further
explanation was provided on what this actually meant.
According to students’ survey responses, most seemed to enjoy having the videos,
since 90% stated that they preferred the video over the written instructions and 70%
185
preferred the video over the demonstration. From students’ comments, on the other hand,
Croker et al. (2010) determined that most students seemed to prefer to have the
demonstration and then use the video. Students also reported feeling more confident in
the lab since they were able to see the videos ahead of time, although only about half of
the class (49%) viewed the videos before class (the question was worded vaguely and did
not ask if they saw at least one or all three, so students may have interpreted it
differently). Slightly unexpected due to comments found from the literature, students
(92%) reported that having the videos positively influenced their attendance. However,
this was self-reported; attendance was not actually measured.
According to Croker et al. (2010), other faculty members were skeptical of the
use of video since they assumed that others, such as students and deans, would think of
them as a good replacement of lab. However, these videos were created only to provide
direction to students; furthermore, students felt more encouraged to attend class since
they knew what was coming up. Again, these videos were designed to supplement lab,
not replace them, like some simulations are made to do. All in all, both the demonstrators
and students seemed to enjoy them.
Thus far, this review has described students’ reactions toward and use of podcasts.
Dupuis et al. (2013), on the other hand, were interested in how podcasts can impact
student performance. The study took place in an upper-level molecular biology course for
biochemistry and biology majors. The class was split into three segments, with each one
being taught by a different instructor and covering different topics. The second segment
was consistently taught by the same instructor, and the other two varied. Three years of
data collection were performed, with short (3 minute) podcast videos and clear objectives
186
being available to students during the third year in segment 2 only. Podcast videos,
although the authors only referred to them as videos, consisted of the instructor drawing
diagrams and verbally describing various concepts. Four sets of videos, each set
containing about eight videos, were available on the course’s online learning
management system during the segment. Dupois et al. (2013) explicitly explained that
clear objectives were given for lectures while podcasts were available but did not explain
if they were provided during other segments as well. Otherwise, similar content and
exams (which consisted of a mixture of multiple choice and short answer questions) were
created for each year, and lecture PowerPoints were made available for each year during
the segment before lectures. Exam scores from students that took three exams and were
not retaking the course were compared across years and across segments (N = 925).
Linear mixed-effect models were used to analyze the data. Fixed effects included
sex, cumulative GPA (cumulative up to semester taking the molecular biology course),
year, course segment, and availability of podcasts. When interactions were not
considered, it was found that both GPA and availability of podcasts significantly
impacted exam scores. Therefore, the interaction of GPA and availability of podcasts was
included in the model, and the interaction was significant. Those with a lower GPA
tended to perform better if they had access to the podcasts than those with higher GPA.
Although Dupois et al. (2013) did not discuss it, this may be due to ceiling effects since
some students were obtaining 100% on the exams without the podcasts being available.
How often podcasts were viewed was also assessed, but only the total number of
times the podcasts were viewed, not how many individuals actually viewed the podcasts.
Podcasts were viewed a total of 561 times for the first set of videos, 425 times for the

187
second set, 419 times for the third set, and 340 times for the fourth set (n = 317 for final
year). The fact that the number of times viewed dropped after each set was not discussed.
Dupois et al. (2013) explained that likely most students used the videos, but few
definitive conclusions can be made since it cannot be determined how often viewings
were done by the same person.
All in all, Dupois et al. (2013) determined that podcasts did improve student
grades. Since this study was completed over multiple years, with podcasts only being
offered during the final year, comparisons were justified. However, it is unclear if it was
only the availability of podcasts that impacted exam scores. Dupois et al. (2013)
mentioned during their description of the methods, but never again afterward, that the
“pedagogical tool” (p. 66) included providing both learning objectives and videos.
Therefore, it can only be concluded that the combination of the two contributed to
improved exam scores. It cannot be assumed that improvement was only due to the
availability of podcasts, as Dupuis et al. (2013) argued.
Dupuis et al. (2013) found that having podcasts and course objectives as a
supplement to lecture may improve exam scores. Lents and Cifuentes (2009), on the
other hand, were interested in if students that viewed recorded lectures would perform as
well as those that attended lecture. One section (n = 24) of an introductory biology course
for forensics majors was modified to occasionally replace face-to-face lectures with
PowerPoint voiceover lectures. Exam grades, particularly the questions that focused on
the podcast lectures, were compared to two other sections of the course, which did not
have podcasts available to them (n = 59). Actually, the podcasts that were created were
recordings from these sections (the two sections shared the same lecture, but the third
188
section had its own lecture; the author was the instructor for all courses). Grades from the
first introductory biology course as well as the lab grade and recitation grade from the
current course, were compared between the two groups of students, and no statistical
difference was found (p < .05). One difference between the two courses, however, was
that those that would be introduced to the podcasts were informed via the course catalog
information that the course included some online learning. Therefore, students knew
ahead of time which group they would be in.
Before the first exam, two of the lectures were replaced by podcasts. On the
questions that pertained to these lectures, students in the sections with the normal lecture
received 71.8% and section with the podcasts had a lower average of 63.4%, although
this difference was not significant due to the high variability. After the exam, the
instructor facilitated a discussion on the use of podcasts. Without the instructor
specifically asking, some of the students described to the other students some of the
possible benefits, such as being able to pause to take notes or look at the textbook and
rewind when something was unclear. According to Lents and Cifuentes (2009), all
students decided that they wanted to have a few podcast lectures before the next exam.
Three lectures were replaced with podcasts for the next exam and those sections that had
the podcasts scored higher (71.8%) than those that did not have the podcasts (67.2%) on
exam questions that pertained to the podcast material, but the difference was not
significant.
Before the third exam, students took an anonymous survey pertaining to possible
uses of podcasts for the class. Most students preferred the concept of having lecture
available, but not required to attend, and having podcasts of each lecture available;
189
therefore, the remainder of the class (except for one lecture) was designed this way. One
of these lectures was before the third exam. Exam grades were similar to the second
where those that had the podcasts scored slightly higher (73.9%) on the questions than
the other sections (72.0%). The fourth exam covered four of the optional lectures and one
required lecture; similar exam scores were still found (73.2% for podcast section and
71.6% for lecture only section). No correlation was found between attendance (the
number of days attended that were optional) and fourth exam scores or between
attendance and final course grade. Total attendance was not provided.
At the end of the course, students took an anonymous survey regarding their
opinions toward the podcasts. Sixteen of the 24 students agreed that the podcasts helped
them with their learning and 13 students felt that they helped more than the face-to-face
lecture (seven thought they both helped about the same amount). According to their self-
reports, students (n = 19) tended to watch the video at least twice and none reported not
watching them at all. On the other hand, students varied on if they would still watch the
podcast if they attended lecture.
According to these results, students performed just as well on the exams whether
they were present in lecture or viewed a podcast. However, Lents and Cifuentes (2009)
pointed out that this was only for a content-driven lecture; laboratories were not
impacted. Moreover, similar results may or may not be found for courses that expect
higher thought processes.
Thus far, short podcasts that focused on particular subjects or longer podcasts that
depicted an entire lecture have been reviewed. Walker et al. (2011) examined the
difference between the two, both in student preference and performance. This was done
190
in an introductory course for non-majors, the biology and evolution of sex. Two sections
of the course were taught by the same instructor, so courses were made as similar as
possible except that each had access to different resources. One section (treatment group;
n = 48) had access to 11 podcasts that included images, animations and videos with
voiceover. These were relatively short and were made to confront common
misconceptions regarding evolution, which was the central theme of the course. The other
section (control group; n = 35) was given 20 videos that consisted of the slides that were
projected during lecture accompanied by the associated audio recording. Class numbers
were actually much higher (306 students from both sections), but any of the students that
did not complete one or more of the required tests or reported not using either the
available resource were removed from the study. Of all students, 70.1% of the treatment
group and 75.0% control group reported using their available resource. Comparisons in
demographics were made between the remaining students and the entire university and
between the two sections. No significant differences (parametric tests) in ACT scores,
GPA, gender, or race were found. In order to assess student learning, students were given
a pretest and posttest on evolution (test was provided but not validated). No significant
differences for the pretest between the two sections was found (two-tailed t-test; p =
.867). Final grades were also compared (same grading procedures were used). At the end
of the course, students also completed a survey and attended a focus group.
Final grades differed according to ACT score, GPA, and sex (males scored
significantly higher), but not with the type of podcast or the amount the podcast was
used. Scores on the evolution posttest, on the other hand, differed only depending on the
type of podcast used; the treatment group performed significantly better on the test than
191
the control group (p = .006). Since differences were found for the evolution posttest but
not the final grade, it appeared that another variable may be involved. The evolution test
was based on broader ideas of evolution, such as ones that students are commonly
confused about. Furthermore, the treatment podcasts were created to confront students’
misconceptions about evolution. Therefore, although Walker et al. (2011) explained that
the podcast was not created to match with the test, it may have still happened.
Meanwhile, the final grade was reflective of the more specific topics that were discussed
in class. Therefore, both podcasts impacted students’ learning equally for the course
objectives.
On the other hand, students seemed to use the control podcasts just before exams,
similar to White’s (2009a) study which used lecture audio files, but Walker et al. (2011)
found that the short videos were watched throughout the semester. These findings were
verified by the focus groups. All in all, although short videos and lecture videos may not
differ in their impact on learning, students did enjoy the short videos more.
Unfortunately, lecture videos are much easier, cheaper, and take less time to make.
Parslow (2009) suggested that lectures are just as effective whether they are face-
to-face or available online. However, as Lents and Cifuentes (2009) noted, their study
was completed on a lecture that was content driven. What about classes that also include
some sort of active learning, such as including clicker questions? In these cases, podcasts
may be more helpful for students as a supplement to lecture instead of a replacement.
Although short videos may take more time and effort to create, if they are more general,
such as confronting typical misconceptions (Walker et al., 2009), the same ones, possibly
with small modifications, may be used each semester.
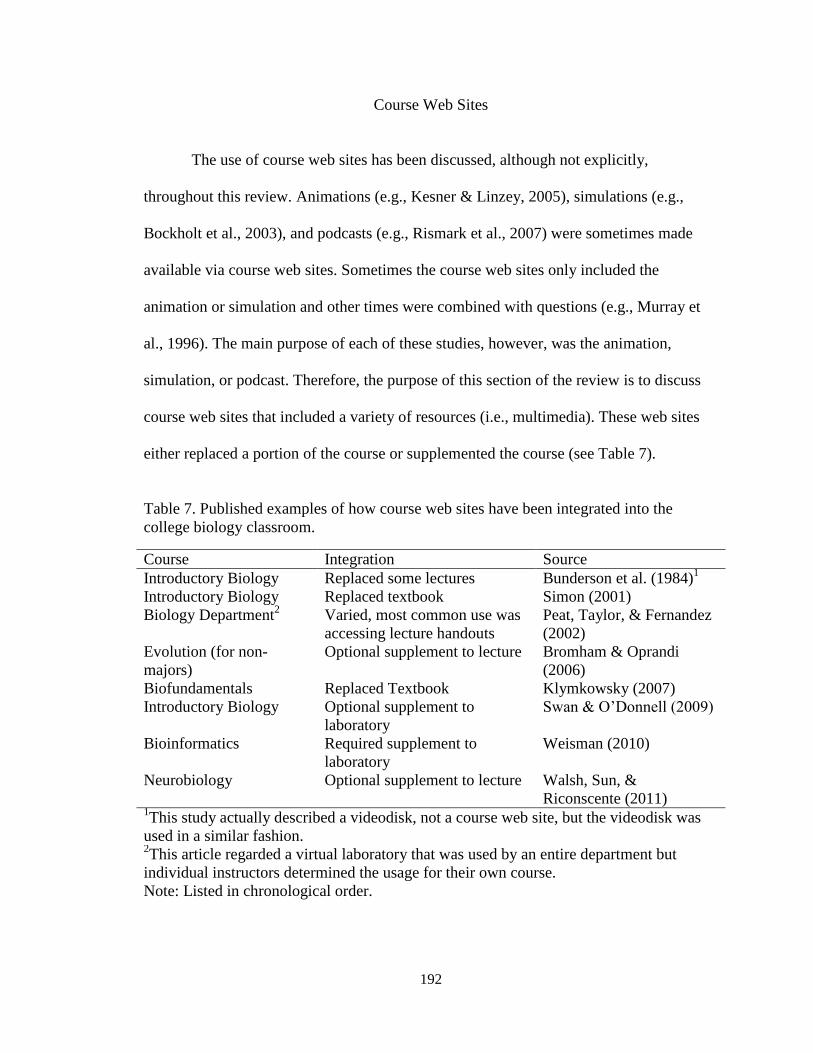
192
Course Web Sites
The use of course web sites has been discussed, although not explicitly,
throughout this review. Animations (e.g., Kesner & Linzey, 2005), simulations (e.g.,
Bockholt et al., 2003), and podcasts (e.g., Rismark et al., 2007) were sometimes made
available via course web sites. Sometimes the course web sites only included the
animation or simulation and other times were combined with questions (e.g., Murray et
al., 1996). The main purpose of each of these studies, however, was the animation,
simulation, or podcast. Therefore, the purpose of this section of the review is to discuss
course web sites that included a variety of resources (i.e., multimedia). These web sites
either replaced a portion of the course or supplemented the course (see Table 7).
Table 7. Published examples of how course web sites have been integrated into the
college biology classroom.
Course Integration Source
Introductory Biology Replaced some lectures Bunderson et al. (1984)1
Introductory Biology Replaced textbook Simon (2001)
Biology Department2
Varied, most common use was
accessing lecture handouts
Peat, Taylor, & Fernandez
(2002)
Evolution (for non-
majors)
Optional supplement to lecture Bromham & Oprandi
(2006)
Biofundamentals Replaced Textbook Klymkowsky (2007)
Introductory Biology Optional supplement to
laboratory
Swan & O’Donnell (2009)
Bioinformatics Required supplement to
laboratory
Weisman (2010)
Neurobiology Optional supplement to lecture Walsh, Sun, &
Riconscente (2011) 1This study actually described a videodisk, not a course web site, but the videodisk was
used in a similar fashion. 2This article regarded a virtual laboratory that was used by an entire department but
individual instructors determined the usage for their own course.
Note: Listed in chronological order.
193
Although not an actual course web site, Bunderson et al. (1984) published a paper
on the production, which took six years, and use of an interactive videodisk covering
various topics of molecular biology and genetics. The videodisk was a composite of
videos, animations, simulations, reviews, glossary, examples, quizzes, etc. This study was
included in this section of the review since it encompassed several different possible
resources, and was made to either replace or supplement lectures, and if the internet was
commonly available would have likely been produced into a course web site. There were
three main phases in the production of the videodisk. The first phase allowed for no
interaction in the videodisk, so students could only play the videodisk like a movie, being
allowed to pause, play, rewind and fast forward. The second phase included some
interaction, such as quizzing students and providing feedback according to their
responses. Simulations were not included until the third phase of the process. Each phase
was tested on a different sample of students. All students took a pretest and posttest of the
same test that covered primarily content. At the end of the first two phases, students also
filled out a survey of objective and free-response questions regarding their experiences,
and some students were interviewed.
For phase one, all students, which were undergraduate majors (n = 10) and non-
majors (n = 25), used the videodisk as a substitution for lecture for three different units.
The results showed that student scores significantly improved after using the videodisk
for each unit. Another group of students (n = 7), were then observed, completed a survey,
and then interviewed to identify how they used the videodisk and which components
caused any difficulty. Then both upper-level undergraduates and graduates, either in

194
biology (n = 22) or media (n = 16), critiqued the videodisk. Suggestions made from all
three groups were used in modifying the videodisk for the next phase.
For phase two and three, a control group (which had a normal lecture) and a
treatment group (which used the videodisk without any lecture or additional worksheets)
were used for comparisons for only one unit. In an introductory biology course,
volunteers (n = 25) were taken, due to the instructor’s preference, to complete the
videodisk rather than sit in lecture. The rest of the students (n = 60) were supposed to
attend class as normal, but only 24 actually took the pretest and posttests. In addition to
the pretest and posttest (taken the next day), students also took another posttest one week
later. Each time, the same test was taken and the test consisted of 58 objective questions
and 24 free-response questions. The free-response questions were blinded and inter-coder
reliability was between .96 and .99. Most of the material covered (3/4) was content-based
questions. Reliability (measured by Kuder-Richardson KR-20) of all tests was higher
than the acceptable score of .75. Demographic variables were compared between the two
groups using chi-square and pretests were compared via t-tests. No significant differences
were found.
In both posttests, the videodisk group scored significantly higher (t-tests; p < .05)
than the control group for the objective questions, short answer questions, and all
questions combined. According to the student surveys, the videodisk group spent about
30% less time studying but was more confident in the material than the control group. For
those that completed the videodisk, their learning strategies were observed. Only a few
students actually went through the entire videodisk without going back to any part, and
only a couple students skipped various informational slides. Most students either went
195
through the information once and then viewed it again to take notes (n = 7) or spent more
time on it the first time through (n =7). Some students also went through the software and
only went back to view items when they were confused (n = 6).
For the third phase, which included simulations, two introductory biology
courses, one from a university and one from a community college, were tested. It was
unclear why introductory biology courses were selected since Bunderson et al. (1984)
mentioned at the beginning of the article that the videodisk was intended for upper-level
undergraduates and graduate students. For both courses, students were randomly assigned
to either use the videodisk or attend lecture as normal. Lectures were observed and it was
found that the instructors covered the same material as the videodisk. Furthermore, it was
observed that lecture included overhead images, videos, writing on the blackboard, and
referring to the textbook. For both courses, instructors spent three 50-minute lectures on
the material and the videodisk took students about two hours to complete. For the
university, 24 students were randomly assigned to the videodisk, and 73 were assigned to
the lecture. The community college happened to have more even assignment; 28 students
were assigned to the videodisk and 25 assigned to the lecture. Students took the same
pretest and posttest as was used in phase two, but they did not take a second posttest.
Scores were analyzed via t-test (α = .05) and the two groups were kept separate from each
other.
Pretest scores of objective questions, free-response questions, and all questions
combined did not differ between the two groups for either course, which was expected
due to random assortment. Posttest scores, on the other hand, were significantly different
for the scores on the two types of questions individually and altogether. At both
196
institutions, those that used the videodisk performed better than those that continued
going to lecture. Additionally, those that did the videodisk reported about 30 to 40% less
time studying inside and outside of class.
Bunderson et al. (1984) found that the interactive videodisk seemed to improve
student grades compared to the typical lecture of overheads with images (although today
the typical lecture would more likely be via PowerPoint), videos, and writing on the
board. Some possible issues may have impacted these results; as Bunderson et al. (1984)
pointed out, they worked for the company that produced the videodisk so these results
may be slightly biased. On the other hand, they suggested that the findings were still
reliable due to the evaluators’ background in scientific research and education evaluation,
which began before working for the company. Interestingly, most studies that described a
simulation, animation, or course web site rarely mentioned this important point.
Simon (2001) also modified his introductory biology course and chemistry course
(each typically had about 24 students per semester) for non-majors to include a web site
instead of a textbook. At first, both were offered, but the web site was expanded every
semester. Not only was he periodically adding to lecture notes but every semester,
students had a project where they had to create something useful to add to the web site.
Students added helpful links, introduced more terms to the glossary, and created graphics.
Eventually, a CD was created for students and later an e-book so that students that did not
have internet access could still obtain the information.
For the five semesters and two summer sessions that the courses (introductory
biology and introductory chemistry) were utilized, students (N = 154) filled out a survey
that used a five-point Likert scale (provided but not validated). Results were summarized
197
for all semesters/sessions, although additions to the web site were created throughout this
time. Overall, students rated the web site as helpful (87%) and would recommend a
similar approach for other courses (89%). Compared to textbooks, students, on average,
did not feel that they were missing any possible learning experiences (87%). Free-
response questions of what students enjoyed the most and least, including suggestions,
was also asked. Students enjoyed that the web site was a cheaper (n = 60) and lighter in
weight (n = 28) alternative. Additionally, students found it helpful to have a more
condensed form of the material that was more specific to course objectives (n = 52).
Accessibility was also rated high (n = 26) but so was lack of accessibility for a less
enjoyed characteristic (n = 35). Another common negative aspect was the lack of
professional graphics (n = 16), which Simon (2001) pointed out was gradually being
fixed. Other characteristics were mentioned by less than 10 students. Suggestions mostly
included additions of things, such as more glossary terms, more web site links, more
graphics, etc. All in all, students rated having the web site instead of the textbook fairly
high. Moreover, the burden of creating such a web site was not carried just by the
instructor, but the students also contributed.
Bromham and Oprandi (2006) also replaced a course textbook but with a course
hand book and web site. Their course of interest was an introductory evolution course for
non-majors. The web site included supplemental material for the lectures. Students were
told that the exam information was from a mix of the lecture and online material. For five
of the 15 lectures, the instructor provided only the PowerPoint that was used in the
classroom. It was not stated when the lectures were first posted, but they were only
available for three weeks. An active learning lesson was provided for the remaining 10
198
lectures, which were also only available for three weeks around the time of the associated
lecture. Each lesson included several pages of information with only one to several
sentences on each page, open-ended questions, a list of related resources (which were
helpful for students since they also had a term essay), and two multiple choice questions
that the program graded only as formative feedback. Students were not given a grade for
completing these lessons. Results from this semester were contrasted with a prior year,
but the only actual description Bromham and Oprandi (2006) provided for that year was
“online material was presented in a non-interactive, text-based format” and “the text of
the online lecture support was similar in both 2004 and 2005, only the mode of
presentation changed” (p. 23).
Based on a five-point Likert scale, most students for both years found the web site
useful (score of 4 or 5). A few positive comments, but none of the negative comments, if
any, were provided. Although it was stated that usage logs would be used in the results,
when actually describing the usage amounts, only figures regarding self-reported usage
were referenced. Furthermore, on the questionnaire, students were asked if they used it
“never, once, several times, often, [or] every week” (Bromham & Oprandi, 2006, p. 24),
but it was not described what several times or often actually meant; therefore, these were
very subjective. Students described their usage during the first year as never using it (n =
9%; all percentages are only estimates from a graph), only trying it once (n = 27%), or
using it several times (n = 44%). Meanwhile, during the following year, students reported
using the more interactive web site several times (n = 40%), often (n = 28%), or weekly
(n = 29%). Moreover, only about 30% of students downloaded the online PowerPoint
slides while about 70% of students completed the interactive lessons.
199
It was also tested if reminding students often of the lessons would increase usage;
therefore, tutors (which students were required to meet with in small groups) reminded
half of the student groups about the online material (n = 45) while they did not mention it
to the other half (n = 48). No difference in number of times students went online
(unpaired t-test, p = .98) or number of interactive lessons completed (p = .632) was found
between the two groups.
A positive correlation was found between the number of completed lessons and
final grade in the course (p = .001). Unfortunately, due to the methods employed,
causation could have been either the number of completed lessons or students who were
higher achievers tended to complete the lessons more often. Moreover, a correlation was
found between the numbers of correct multiple choice answers on the formative
assessment and on the summative assessment; however, final grade was not mentioned.
Again, though, causation was unclear. All in all, it was discovered that students found the
online interactive lessons useful, but due to the methods used, it was unclear if they
helped students’ learning.
Similar to Bromham and Oprandi (2006), Swan and O’Donnell (2009) provided
an optional web site to students. On the other hand, they admitted to not being able to
assess the web site for learning assistance since students were not randomly assigned to
either use or not use the web site. Therefore, the study was on the qualities of students
that make them more likely to use the optional web site. This study was done in an
introductory biology course and it was a virtual laboratory that included seven different
modules. The laboratories matched with the laboratory exercises that they did on campus,
but they included images, animations, simulations, and other exercises. They were told
200
that completing the online exercises would help them understand the in-class exercises
better. The users of the virtual laboratory were compared to the non-users according to
the lecture exams (which the first one was given before any of the virtual laboratories
were completed), lab practical exam (38 of the 60 questions related to the virtual
laboratories), final exam and attitudes toward the virtual system (survey provided but not
validated). The attitude survey included four demographic questions and 34 statements on
a five-point Likert scale, 10 of which referred specifically to the available virtual
laboratories. This study was completed over the course of two semesters, where the
enrollment for the first semester was 1158 students and the second was 1320. The two
semesters were quite similar except the first semester took the attitude survey only as a
posttest and the second semester took it as a pretest and posttest. Additionally, usage data
were not available for the second semester, so users were defined by self-reports.
According to Swan and O’Donnell (2009) the only difference in instruction was that the
second semester was told that the prior semester had used the web site. Nineteen of the
students were also enrolled in a one-credit course where they were required to use the
virtual laboratories and reflect on what they learned from them.
The most commonly used virtual laboratories during the first semester regarded
(1) the microscope, (2) protists and fungi, and (3) plant evolution. One hundred seventeen
students used all three of these laboratories and they were compared to the rest of the
students. The second semester defined users as those that stated that they used five or
more of the modules (n = 113). MANCOVA followed by univariate tests (with the first
exam score as the covariate) was used for grade comparisons. The users of the first
semester did significantly (p < .01) better than the rest of the students on the first exam,
201
second exam, final exam, and laboratory practical. The second semester was similar in
that users did better than non-users for the laboratory practical, but not on the second or
final exam (first exam was not mentioned).
The first hour exam (which was given before the students began the virtual
laboratories) was used to match students from the two groups (users versus non-users).
Comparisons were made with t-tests and results from the MANCOVA were confirmed.
In examining the laboratory practical grades users and non-users were also compared by
the scores for the relevant questions and for the non-relevant questions. Users from both
semesters (analyzed separately) did significantly better on the relevant questions (t-test, p
< .05), but not on the non-relevant questions, suggesting the virtual laboratories may have
helped students better understand the labs.
Attitude surveys were also assessed. A factor analysis was completed on the
questionnaire, and four categories emerged for both semesters (analyzed separately)
regarding how students felt about the web site, how much motivation and effort was put
forth, self-efficacy, and attitude toward the use of technology. It was found, not
surprisingly, that users of the web site were more positive about it than non-users
(MANOVA then univariate tests; p < .05), but it was also found that, during the first
semester, students who used the web site self-reported a lower amount of effort put forth
than the non-users’ self-reported effort. But for the second semester, users’ self-reported
effort was significantly higher than non-users (p < .01). More information was found
about student attitudes and uses from those that took the one-credit course. They reported
it also being helpful. It was useful for the in-class lab if they did the virtual ahead of time
but the virtual was also helpful for studying for the laboratory practical. Students
202
suggested improvements included describing the intended learning objectives and
relating the material to the rest of the course. They also described wanting more visuals
available and an index to find them quickly.
The main focus of this study was to compare characteristics of students who
elected to use the virtual laboratory with those that did not use it or used it rarely.
However, Swan and O’Donnell (2009) also stated that the virtual laboratory appeared to
help students succeed in the laboratory, especially on the laboratory practical. This
conclusion was made based on comparisons between matched students on the first exam
and on comparing results from the non-related questions and related questions on the
laboratory practical. Therefore, although students that tended to succeed more
academically used the virtual laboratory more frequently, the virtual laboratories may
also have helped them succeed even more.
Walsh et al. (2011) also created a course web site, although it was created for
other courses, not their own course. Each module used the same basic structure that
incorporated images, animations, videos, key concepts, simulations, etc. At the time of
the publication of the article, only modules for neurobiology were created. Several
instructors that had used the modules in their classrooms and five others that attended a
conference tested it and rated it accordingly. Additionally, data on students’ opinions of
these modules and exam scores were collected from one neurobiology course and one
psychology course. These were face-to-face courses that used the modules as an optional
supplement to lecture. Therefore, similar to Swan and O’Donnell (2009), direct
conclusions pertaining to the web site’s impact on students’ learning could only be
suggested.
203
For the neurobiology course, which had 421 enrolled students, 63 of them
registered for the course web site. Since this was not a true experiment, grades on the first
exam and from an oral presentation (neither of which pertained to the modules) and
grades on the second and final exams (both pertained to the modules) were collected and
compared, similar to Swan and O’Donnell’s (2009) study. Exams and presentations were
described as mainly testing students’ knowledge about processes and application. Exam
grading was completed by teaching assistants who were unaware of student participation
on the course web site. Comparisons between users and non-users of the web site were
made with a two-tailed t-test. Users and non-users did not differ on the first exam (p =
.14) or the oral presentation (p = .15), but users did significantly better on the exams
related to the modules (second exam p < .004; final exam p < .009).
The psychology course was much smaller (n = 16) and only five registered with
the web site. The first two exams covered material from the modules and the last exam
did not. Unlike the biology course, no differences were found between the groups for any
of the exams (p > .10). Of course, part of this could be due to the very small sample size.
The student survey consisted of 10 statements with a six-point Likert scale and
free-response questions. Four courses from three different universities had used the
modules and therefore, took the survey (n = 84). Averages from each course and for all
courses combined were compared to the neutral score of 3.5 (between the slightly agree
and slightly disagree scores) using a two-tailed t-test. Most scores were significantly
different from the neutral score in the positive end. The averages and p-values were
provided for each college for each question. Although not discussed, it was unclear how
closely students read the questions since two questions were negative statements but one
204
had high averages, indicating that students felt that the web site was a poor use of their
time, even though they agreed to other statements reflecting how it increased their
interest in the subject and helped prepare them for the course. Free-responses to the other
questions indicated that students thought the web site could be improved by adding
interactive quizzes, learning objectives, and using YouTube videos since they took less
time to download. Faculty opinions were also quite positive about the usefulness of the
web site but recommended removing the registration requirement so students would be
more willing to try them out.
All in all, students and faculty tended to find the web site useful, but as Walsh et
al. (2011) explained, some instructors may not have aligned their course objectives to
match the modules, which would justify why some students may not have found it useful.
The most positive student responses were from courses where the faculty members
helped with the construction of the modules, and therefore, the modules more likely fit
with their course objectives. Therefore, although course web sites may be helpful for
students, students will more likely gain more out of them if the web sites matched the
course objectives.
Unlike the last few articles that discussed web sites that were optional for
students, Weisman (2010) required part of the course (bioinformatics) to use a virtual
laboratory that included peer discussion. The use of the virtual laboratory was mostly for
discussion. Forty-three students were enrolled and were put into groups of about five
students. For each group, students posted results from laboratory exercises, which mostly
included the use of online databases, and the entire group had to discuss each other’s
findings, which was part of the grade for the exercise. The other main use was for a final
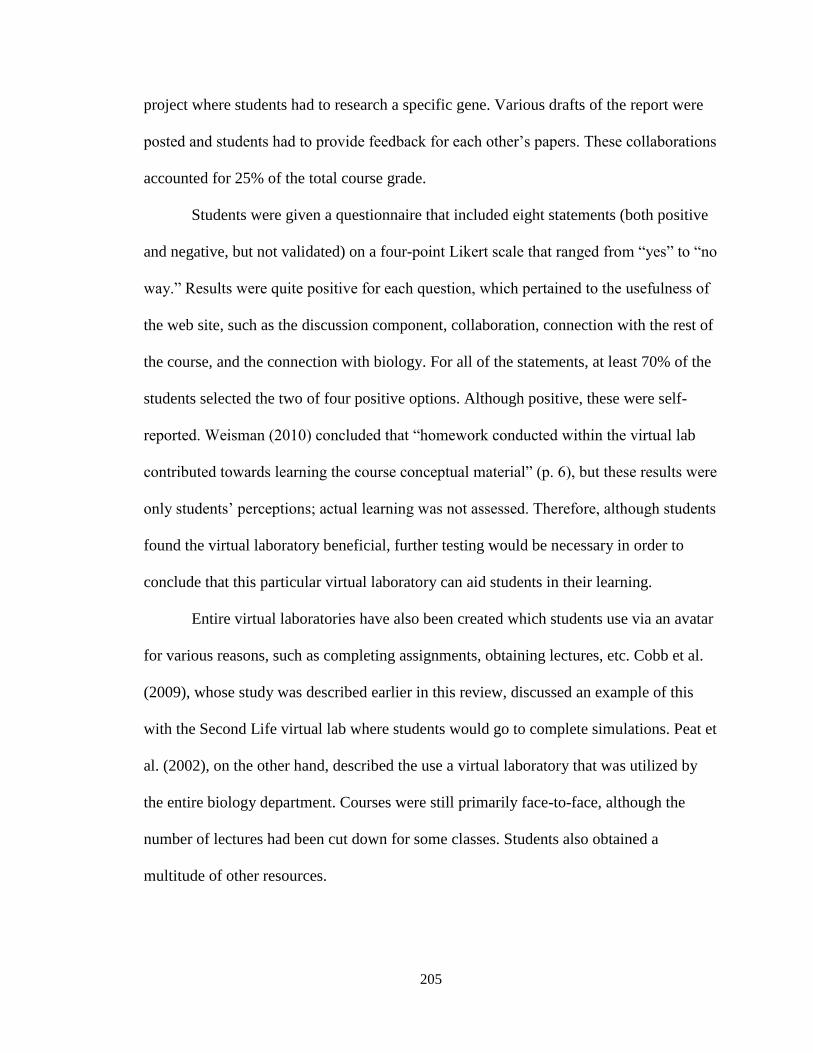
205
project where students had to research a specific gene. Various drafts of the report were
posted and students had to provide feedback for each other’s papers. These collaborations
accounted for 25% of the total course grade.
Students were given a questionnaire that included eight statements (both positive
and negative, but not validated) on a four-point Likert scale that ranged from “yes” to “no
way.” Results were quite positive for each question, which pertained to the usefulness of
the web site, such as the discussion component, collaboration, connection with the rest of
the course, and the connection with biology. For all of the statements, at least 70% of the
students selected the two of four positive options. Although positive, these were self-
reported. Weisman (2010) concluded that “homework conducted within the virtual lab
contributed towards learning the course conceptual material” (p. 6), but these results were
only students’ perceptions; actual learning was not assessed. Therefore, although students
found the virtual laboratory beneficial, further testing would be necessary in order to
conclude that this particular virtual laboratory can aid students in their learning.
Entire virtual laboratories have also been created which students use via an avatar
for various reasons, such as completing assignments, obtaining lectures, etc. Cobb et al.
(2009), whose study was described earlier in this review, discussed an example of this
with the Second Life virtual lab where students would go to complete simulations. Peat et
al. (2002), on the other hand, described the use a virtual laboratory that was utilized by
the entire biology department. Courses were still primarily face-to-face, although the
number of lectures had been cut down for some classes. Students also obtained a
multitude of other resources.
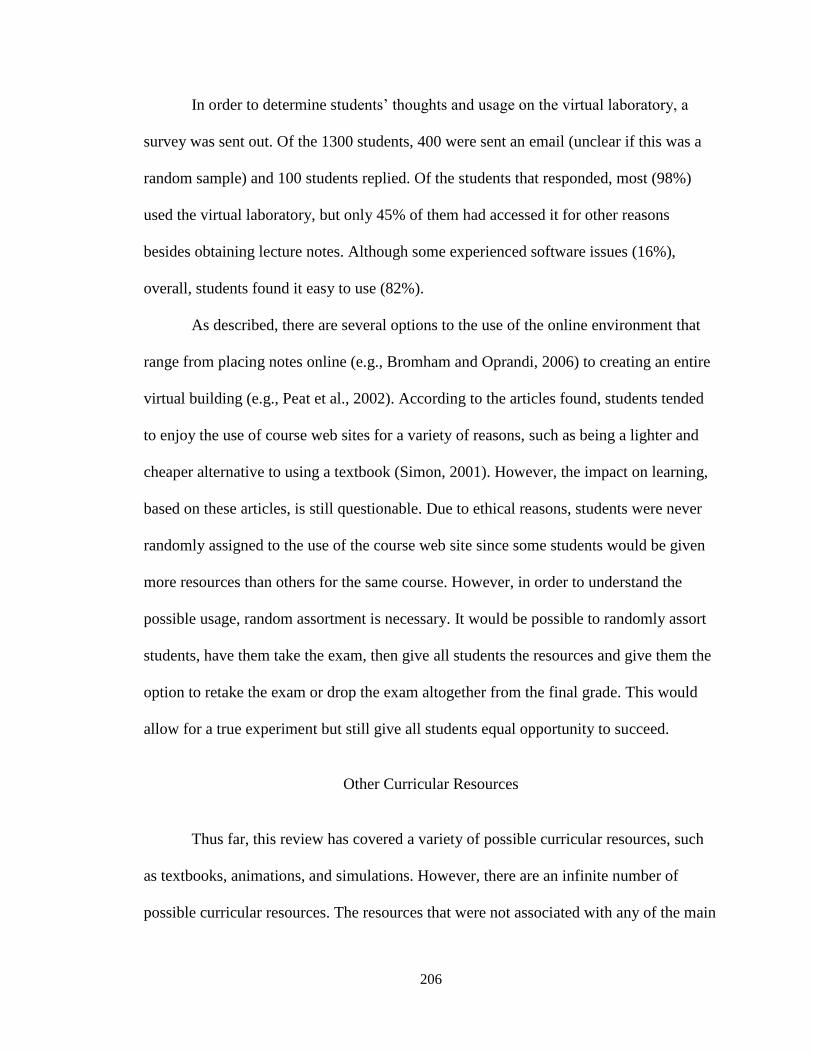
206
In order to determine students’ thoughts and usage on the virtual laboratory, a
survey was sent out. Of the 1300 students, 400 were sent an email (unclear if this was a
random sample) and 100 students replied. Of the students that responded, most (98%)
used the virtual laboratory, but only 45% of them had accessed it for other reasons
besides obtaining lecture notes. Although some experienced software issues (16%),
overall, students found it easy to use (82%).
As described, there are several options to the use of the online environment that
range from placing notes online (e.g., Bromham and Oprandi, 2006) to creating an entire
virtual building (e.g., Peat et al., 2002). According to the articles found, students tended
to enjoy the use of course web sites for a variety of reasons, such as being a lighter and
cheaper alternative to using a textbook (Simon, 2001). However, the impact on learning,
based on these articles, is still questionable. Due to ethical reasons, students were never
randomly assigned to the use of the course web site since some students would be given
more resources than others for the same course. However, in order to understand the
possible usage, random assortment is necessary. It would be possible to randomly assort
students, have them take the exam, then give all students the resources and give them the
option to retake the exam or drop the exam altogether from the final grade. This would
allow for a true experiment but still give all students equal opportunity to succeed.
Other Curricular Resources
Thus far, this review has covered a variety of possible curricular resources, such
as textbooks, animations, and simulations. However, there are an infinite number of
possible curricular resources. The resources that were not associated with any of the main
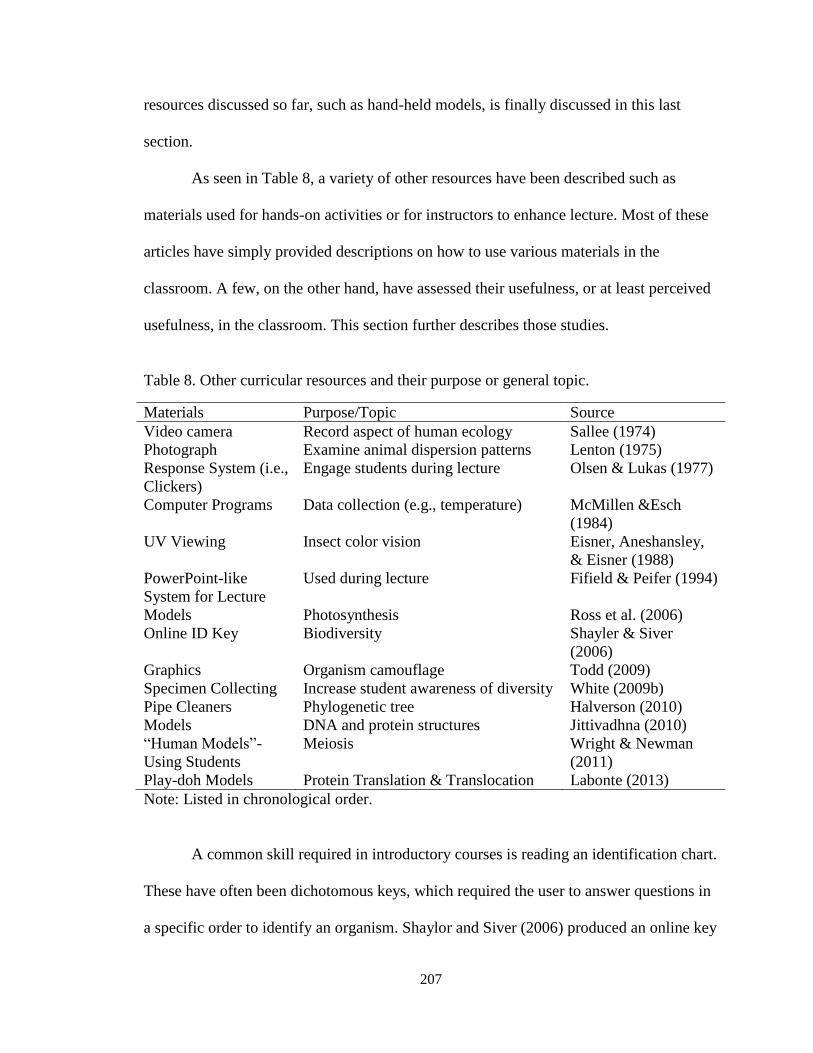
207
resources discussed so far, such as hand-held models, is finally discussed in this last
section.
As seen in Table 8, a variety of other resources have been described such as
materials used for hands-on activities or for instructors to enhance lecture. Most of these
articles have simply provided descriptions on how to use various materials in the
classroom. A few, on the other hand, have assessed their usefulness, or at least perceived
usefulness, in the classroom. This section further describes those studies.
Table 8. Other curricular resources and their purpose or general topic.
Materials Purpose/Topic Source
Video camera Record aspect of human ecology Sallee (1974)
Photograph Examine animal dispersion patterns Lenton (1975)
Response System (i.e.,
Clickers)
Engage students during lecture Olsen & Lukas (1977)
Computer Programs Data collection (e.g., temperature) McMillen &Esch
(1984)
UV Viewing Insect color vision Eisner, Aneshansley,
& Eisner (1988)
PowerPoint-like
System for Lecture
Used during lecture Fifield & Peifer (1994)
Models Photosynthesis Ross et al. (2006)
Online ID Key Biodiversity Shayler & Siver
(2006)
Graphics Organism camouflage Todd (2009)
Specimen Collecting Increase student awareness of diversity White (2009b)
Pipe Cleaners Phylogenetic tree Halverson (2010)
Models DNA and protein structures Jittivadhna (2010)
“Human Models”-
Using Students
Meiosis Wright & Newman
(2011)
Play-doh Models Protein Translation & Translocation Labonte (2013)
Note: Listed in chronological order.
A common skill required in introductory courses is reading an identification chart.
These have often been dichotomous keys, which required the user to answer questions in
a specific order to identify an organism. Shaylor and Siver (2006) produced an online key

208
for identifying protists, mostly freshwater. The key allowed students to skip questions
that they were not sure of and it provided colored photographs and movies for each taxon.
The key was utilized in an introductory botany (n = 10) and intermediate (n = 13) botany
course. For each course students had to identify protists within a culture using the online
key and then identify another culture using a dichotomous key. Shaylor and Siver (2006)
noted that the particular dichotomous key was used since it was the easiest one to
understand. Afterward, students wrote a reflection regarding the exercises. All students in
the introductory course and most (exact percentage not provided) of the intermediate
course preferred the use of the online key. Some students, moreover, recommended
having helpful hints of most important characteristics for identification purposes. All in
all, Shaylor and Siver (2006) provided a unique type of key that may be easier for
beginners, or even possibly more advanced students, to use.
Another way to identify organisms is with a field guide. Pfeiffer et al. (2009) used
the field guide concept to create DVDs that could be used to identify various species of
fish from the area. These DVDs included either photographs or videos of the fish.
Students from an upper-level marine biology field course were first trained on how to use
them and then identified fish during a snorkeling trip. Before any training, though,
students’ knowledge of fish identification was tested (no detailed were provided on the
test). Students’ responses were used to assign them to either use the DVD guide that had
pictures or the DVD guide that had videos (it was assumed that this was done in order to
have equal ability in both groups). Although the DVDs differed in the use of pictures or
video, they used the same audio and were in the same order. Students then practiced
using their DVD guide on a portable DVD player while in class. After this instruction,
209
students took a posttest where they had to identify 18 species of fish from videos without
the use of their DVD guide or notes (videos were taken at the same location as the videos
for the DVD guides). Then students went on the snorkeling trip where they brought their
DVD guides and notes but left them on the beach. The groups stayed separated from each
other by snorkeling at different spots within the bay and then switching spots half way
through. Students were told to identify as many fish as possible and they could talk to
each other for assistance. After the field trip, students took a final posttest, which was the
same test as the first posttest, and completed a student survey that used a five-point Likert
scale (survey was not provided nor validated).
Students correctly identified, on average, 14.51 out of 18 fish on the second
posttest but only 5.60 on the first posttest, which was a significant difference (mixed-
design ANOVA, p = .01). On the other hand, no significant differences were found
between the two groups of students that either used the pictures or video regarding the
first posttest (t-test, p = .28) or the second posttest (p = .098). However, Pfeiffer et al.
(2009) stated that the statistical test “revealed a tendency in the second post-test
indicating that the dynamic group outperformed the static group” (p. 194). Nevertheless,
this difference was non-significant, which illustrated that students performed the same
whether they used pictures, like a field guide, or videos. No matter which type, students
did find the DVD guide helpful (37.1%) or very helpful (60%). Unfortunately, it was not
stated if students had prior experience with field guides. If not, then they likely were not
comparing the helpfulness to anything in particular. Pfeiffer et al. (2009) concluded that
the DVD guide was not very helpful until they were used in a real-world experience.
Then again, students first learned how to use the guides with static images and only for
210
90 minutes, whereas they were assessed with video. The snorkeling activity provided
them with 240 minutes of additional practice. Therefore, it cannot be concluded if
students simply needed extra time to practice or if the real-world situation accounted for
the increase in identification ability. Furthermore, it cannot be determined if students
would have performed just as well with field guides, which was possible since those that
used the DVD with pictures did just as well as those with video.
Both Shayler and Siver (2006) and Pfeiffer (2009) described ways to enhance
students’ identification abilities. Another important aspect of biodiversity, is to have an
understanding and appreciation for the diversity of life. In order to meet this learning
objective, White (2009b) had students in his course collect specimens from 12 different
phyla. These had to be actual specimens, but could be from outside, from restaurants, etc.
Students had most of the semester to work on the collection before presenting them. After
presentations, the project wrapped up with a discussion on the diversity of life.
In order to assess if the project enhanced students’ knowledge of biodiversity,
during one semester, White (2009b) had students provide a list of five different animals
that were different from each other as much as possible and to do the same for plants
before and after the collections project. Although 185 students were enrolled in the
course, only 144 students completed both the pretest and posttest. Half of the students
took the posttest after the collections were made but before discussion and the other half
took the posttest after the final discussion. Tests were scored by one researcher (assumed
to be the author of the paper) and 30% of the tests were also independently scored by
another researcher. Inter-coder reliability was 96%.
211
It was found that whether before or after the project, students typically mentioned
chordates and angiosperms as their responses. No differences were found between the
two posttest groups, so their results were combined (statistical test not mentioned).
Comparisons of the pretest and posttest found that before the project, students, on
average, listed organisms from 1.57 phyla for animals and 1.75 phyla for plants. The
number of phyla significantly increased on the posttest to 1.95 phyla for animals and 2.80
phyla for plants (Repeated measures ANOVA, p < .001). Interestingly, students, on
average, incorporated more phyla for plant diversity than animal diversity into their lists.
Although students typically listed chordates and angiosperms, the number of students that
only provided organisms from these phyla decreased significantly after the project. For
animals, 58% of students only listed chordates, but this dropped to 43% on the posttest,
and for plants, 44% of students only listed angiosperms, but this then dropped to 16%
(McNemar’s test; p < .01). All in all, although the project may have helped students
increase their awareness of diversity, there was no way to conclude that this type of
project further enhanced students’ understanding than other diversity projects, such as
examining preserved organisms. It did, though, incorporate creativity, which other
projects may lack.
The last few studies described in this review pertained to biodiversity. Other
curricular resources have been provided for learning about molecules. For instance,
although graphics can be helpful for students, Jittivadhna et al. (2010) argued that 3D
models worked better in describing the structure of DNA, RNA, and protein. In their
study, they used both high school students and college freshmen and sophomores to test
this. First, students (N = 498) were given a nine-statement, multiple-choice pretest on
212
various structural features of these molecules while they also discussed in groups of four
to six and had access to a textbook. Some students (n = 28) then volunteered to complete
a free-response pretest of four questions. After the pretests were collected, students were
given 3D models to handle and the posttest to complete, which was the same as the free-
response pretest. Students were also allowed to have discussions during the posttest. The
students that completed the free-response tests were also interviewed afterward.
On the multiple-choice test, students did better on the posttest than the pretest
(although tests of significance were not completed). The percentage of students that first
scored each question incorrectly on the pretest and then correctly on the posttest were
analyzed. The gain score for each question ranged from 26.7 to 90.8%. Similar results
were also noted regarding the free-response questions, but results were provided as
representative quotes only. Interview responses were described as being positive, also
with representative quotes, but no quantitative data was presented.
Although it appeared that the models aided students in understanding the structure
of molecules, it was difficult to determine if it was because of the models or if it was due
to having more time to understand the material. Additionally, this was not an experiment,
so no comparisons against a control could be made.
Although 3D models may be helpful for understanding various structures or
processes, creating models with the students, themselves, may also be beneficial. Wright
and Newman (2011) taught students the process of meiosis by having the students act as
chromosomes. Other students acted as centrosomes and handed ropes (spindle fibers) to
the chromosome students to pull them apart from each other. During this time, the
213
instructor facilitated by asking students questions and occasionally leading them to the
next stage of meiosis.
This modeling exercise was completed due to students not understanding the
stages of meiosis, including which stages were diploid and which were haploid. These
results were found from pretests that asked for students to fill in all of the stages and label
each as haploid or diploid. This was given to the introductory biology class of interest (n
= 68), another introductory biology class (n = 63) as well as to a genetics course (n = 13).
Pretests of the three classes were coded (details not provided) and no differences were
found between them (chi-square analysis), suggesting that even upper-level
undergraduates had a very rudimentary understanding of meiosis.
Therefore, the modeling exercise was completed in class, and students were asked
about which stage the cell became haploid on the associated exam. More students gave
the correct response on the exam than on the pretest (from 12% to 39%). Although this
difference was significant, it was still rather low, which was not discussed in the article.
Furthermore, the other introductory course that performed equally poorly on the pretest
(Fisher’s exact test for difference, p = .796) but did not complete the modeling exercise,
did significantly worse on the posttest than the course that completed the modeling
(Fisher’s exact test, p = .008). Therefore, Wright and Newman (2011) argued that the
modeling exercise improved students’ understanding more so than a traditional lecture.
However, the format of the lecture from the other course was never described, only that it
was a “traditional, textbook-driven meiosis lesson” (Wright & Newman, 2011, p. 351).
All in all, although there was significant improvement in students’ knowledge of when
cells became haploid, the percentage of students successfully answering the question was
214
still rather low. This was not a concern that was brought up by the authors, so it could be
that low scores were common, given that this was an introductory course.
Conclusion
Several types of curricular resources were examined in this review, and it was
found that our knowledge regarding the use, content, and effectiveness of most of these
resources is quite limited. The most extensive research has been completed on textbooks.
Many of these articles have used multiple textbooks to determine general trends, whether
regarding how various topics are described in textbooks or on formatting features of
textbooks. Only one empirical study actually examined a single textbook (Flodin, 2009),
and she admitted that the investigation was only a case study due to that limitation.
The rest of the curricular resources have been examined in a very different, and
poorer, way. Often, only one example (such as one animation or simulation) was
assessed. Therefore, most of the articles are only case studies, which none of the authors
admitted. In these studies, the main assessment, or even its intended objectives, was
rarely described. This trend has also been discovered in studies regarding curriculum
improvement, such as group work (Ruiz-Primo et al., 2011). These resources are only
effective if they meet with course objectives, as seen in Walsh et al.’s (2011) study.
Furthermore, only one attempt was made to compare two different simulations (Booth et
al., 2011), but the study was poorly described. Moreover, unlike articles on textbooks,
those that discussed animations, simulations, podcasts, or course web sites were often the
creators of them, so the results may be biased. Only one article actually mentioned this
limitation (Bunderson et al., 1984). Furthermore, as Walker et al. (2011) described in a
215
recent paper, most studies of available resources have only examined students’
preferences of them. There is very little we know about their impact on student learning.
Due to these severe gaps in our current knowledge, the only time in this review when
specific suggestions for future research were made regarded textbooks. Otherwise, the
gaps in our current understanding of their content, uses, and effectiveness are enormous.
Although the most complete research regarding college biology curricular
resources was completed on textbooks, even that literature had several limitations. No
common methodological framework was applied; each article varied in how they selected
textbooks and analyzed content. Moreover, rarely was any literature cited for validating
the methodology used. Additionally, only one paper was found to examine a fundamental
topic in biology (i.e., evolution, Hughes, 1982). Otherwise, more specific topics were
studied, such as pneumococcal type transformation (Baxby, 1989). Before analyzing
these narrow topics, the fundamental aspects of biology, or a sub-discipline of biology,
should first be examined.
216
CHAPTER III
METHODS
Tinbergen’s (1963) conceptual framework is regarded as the foundation of animal
behaviour; however, the four questions of causation, ontogeny, survival value and
evolution may not be evenly applied (i.e., integrated) within the primary literature
(Hogan, 2009; Ord et al., 2005) or textbooks (Alcock, 2003). Hogan (2009) and Ord et al.
(2005) have proposed that the present discipline of animal behaviour (present in terms of
when the studies were published) was heavily based on questions of survival value and
causation. More recently, others have anecdotally suggested that survival value continues
to be the most commonly researched question (Bateson & Laland, 2013b). Alcock (2005)
has suggested similar trends in textbooks; however, textbook selection for his study was
not described.
The present study attempts to provide the current conceptual framework of the
research in animal behaviour via deductive content analysis, which uses predetermined
themes to code text. Moreover, the study attempts to describe a detailed account of the
conceptual framework in the most commonly used textbooks and intended conceptual
framework of randomly-selected animal behaviour courses. These sources are then
compared to determine if they align with one another and with the suggested conceptual
framework of the discipline. Since no common, validated methodology was found in the
literature review, the details of the methods described below rarely cite any particular
study. Instead, in order to complete the current study, a valid and reliable methodology
for analyzing textbooks was developed.
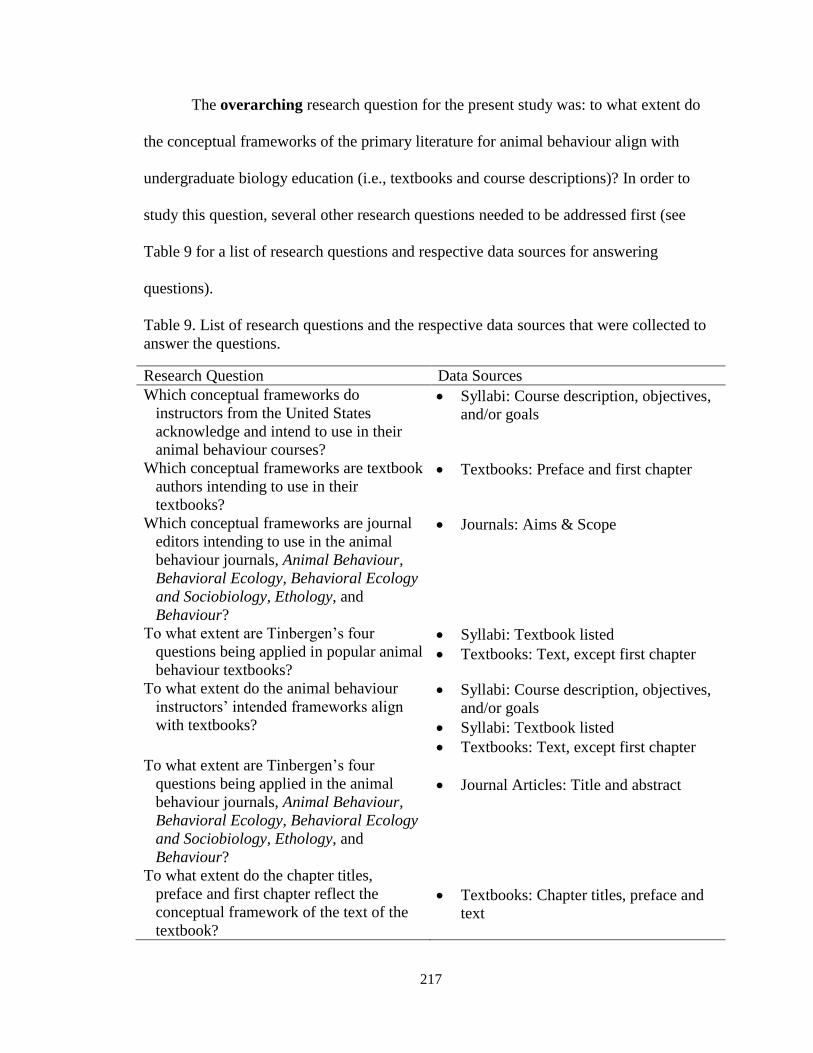
217
The overarching research question for the present study was: to what extent do
the conceptual frameworks of the primary literature for animal behaviour align with
undergraduate biology education (i.e., textbooks and course descriptions)? In order to
study this question, several other research questions needed to be addressed first (see
Table 9 for a list of research questions and respective data sources for answering
questions).
Table 9. List of research questions and the respective data sources that were collected to
answer the questions.
Research Question Data Sources
Which conceptual frameworks do
instructors from the United States
acknowledge and intend to use in their
animal behaviour courses?
Syllabi: Course description, objectives,
and/or goals
Which conceptual frameworks are textbook
authors intending to use in their
textbooks?
Textbooks: Preface and first chapter
Which conceptual frameworks are journal
editors intending to use in the animal
behaviour journals, Animal Behaviour,
Behavioral Ecology, Behavioral Ecology
and Sociobiology, Ethology, and
Behaviour?
Journals: Aims & Scope
To what extent are Tinbergen’s four
questions being applied in popular animal
behaviour textbooks?
Syllabi: Textbook listed
Textbooks: Text, except first chapter
To what extent do the animal behaviour
instructors’ intended frameworks align
with textbooks?
Syllabi: Course description, objectives,
and/or goals
Syllabi: Textbook listed
Textbooks: Text, except first chapter
To what extent are Tinbergen’s four
questions being applied in the animal
behaviour journals, Animal Behaviour,
Behavioral Ecology, Behavioral Ecology
and Sociobiology, Ethology, and
Behaviour?
Journal Articles: Title and abstract
To what extent do the chapter titles,
preface and first chapter reflect the
conceptual framework of the text of the
textbook?
Textbooks: Chapter titles, preface and
text
218
Resource Selection
Syllabus Selection
Syllabi were collected in order to code the description of animal behaviour
courses and to determine the most commonly used animal behaviour textbooks in the
United States. Syllabi were collected via a stratified-random sample from across the
nation. Post-secondary institutions were randomly selected until two institutions that
offer an animal behaviour course from each state and Washington, D.C. were identified,
when possible. The University of Texas at Austin provides a list of regionally-accredited
four-year institutions and this list was used in the selection process
(http://www.utexas.edu/world/univ/state/). For each institution, the selected course was
an undergraduate-level course offered through a biology, zoology, or related department.
Courses offered through psychology departments only were not utilized, although a few
of the courses were listed in both biology and psychology departments with instructors
from psychology departments. Additionally, the course was named ‘animal behaviour,’
‘ethology,’ or a similar name, such as ‘principles of animal behaviour.’ Courses such as
behavioural ecology or behavioural genetics were not used since the name implied that
they intended to cover only one or two of Tinbergen’s four questions.
Once the course was selected, either a syllabus for the course was located on the
Internet or the instructor of the course was contacted and a most current syllabus was
requested (dates ranged from fall 2009 to fall 2013). If the selected instructor did not
reply within one week, he or she was contacted again with a second request. If he or she
still did not respond one week after the second request or declined then another institution
219
from the same state was randomly selected in its place. However, if the original
institution sent the syllabus after a new institution was selected, the original institution
was used. Note that since private information was not being solicited, this project did not
require approval from the Human Subjects Institutional Review Board (see Appendix A
for HSIRB approval request and Appendix B for HSIRB letter).
Textbook Selection
Once all syllabi were collected, the first-listed textbook in each syllabus was
identified. Then the percentage of courses using each textbook was calculated. Textbook
usage was established from the syllabi only; if the instructor mentioned his or her
intention of using a different textbook in a later semester in the email, the textbook listed
in the syllabus was still used. Moreover, for some textbooks, more than one edition was
found from this analysis, but only the most recent edition was used for further analysis.
Textbooks used by at least 5% of selected instructors were selected for further analysis.
Primary Literature Selection
In order to determine if the four questions were being applied evenly within
animal behaviour literature, five mainstream journals of animal behaviour were
examined: Animal Behaviour, Behavioral Ecology, Behavioral Ecology and
Sociobiology, Behaviour, and Ethology. Although articles regarding the biology of
behaviour are also being published in other journals, discipline-specific journals were of
interest because they are intended to appeal to the entire discipline of animal behaviour.
Therefore, the purpose of the analysis is to determine what was considered as pure animal
220
behaviour research in 2013. Are only some of Tinbergen’s questions being classified as
animal behaviour? Of the journals specific to animal behaviour (described in Ord et al.,
2005), these five particular journals were chosen since they have the highest 2012 impact
factor and five-year impact factor (according to ISI Web of Knowledge Journal Citation
Reports for 2012). Moreover, articles were assessed manually, not by online database
engine tools, which limited the number of articles that could be assessed.
Studies performed in the last ten years (i.e., Hogan, 2009 and Ord et al., 2005)
found that animal behaviour journals focus on Tinbergen’s questions of survival value
and, to a lesser extent, causation. Additionally, articles published even in the last year
anecdotally suggested that research is still focused on survival value (i.e., Bateson &
Laland, 2013b). Therefore, only the most recent year, 2013, was analyzed.
Content Analysis
In order to assess the content of the textbooks and the primary literature, content
analysis was used. Content analysis is a qualitative method of data collection used to
either code text and to identify major themes of the text or code text with predetermined
themes (Auerbach & Silverstein, 2003; Berg, 2009; Elo & Kyngäs, 2007; Saldaña, 2011;
Schreiber & Asner-Self, 2011; Shields & Twycross, 2008). For this particular study, text
was coded with predetermined themes, which is called deductive or directed content
analysis (Berg, 2009; Elo & Kyngäs, 2007). Once text was coded, when appropriate,
codes were measured using quantitative methods. Reliability of content analysis is often
measured using inter-coder and intra-coder reliability (Lauriola, 2004). Both of these
were used in this study, which are discussed in more detail later. Another important
221
component of using content analysis, since it is a qualitative method of data collection, is
credibility. Credibility includes describing methods as detailed as possible, since they can
vary depending on the research question (Saldaña, 2011) and providing coding examples
that support the data analysis results (Berg, 2009). It also includes forming the
predetermined themes and dictionary of codes from reliable sources (Saldaña, 2011). The
coding dictionary for the present study was created before coding began in order to
enforce a consistent coding procedure (described in more detail later; Berg, 2009),
although occasional codes were added to the dictionary during the analysis. The themes
for this study are credible since they were based on the conceptual framework of the
discipline and the dictionary of codes was created using literary sources written by
experts in the field.
Identification of Intended Conceptual Framework
Which conceptual framework (i.e., Tinbergen’s, Mayr’s or a variation thereof)
journal editors, textbook authors, and course instructors intended to use was assessed.
This process was done by analyzing journal aims and scopes of each of the five journals,
the preface and introductory chapter of each textbook, and course descriptions,
objectives, and goals from each collected syllabus (Figure 3). How these resources were
collected was already described. This section describes the details of the coding and
analysis methods.
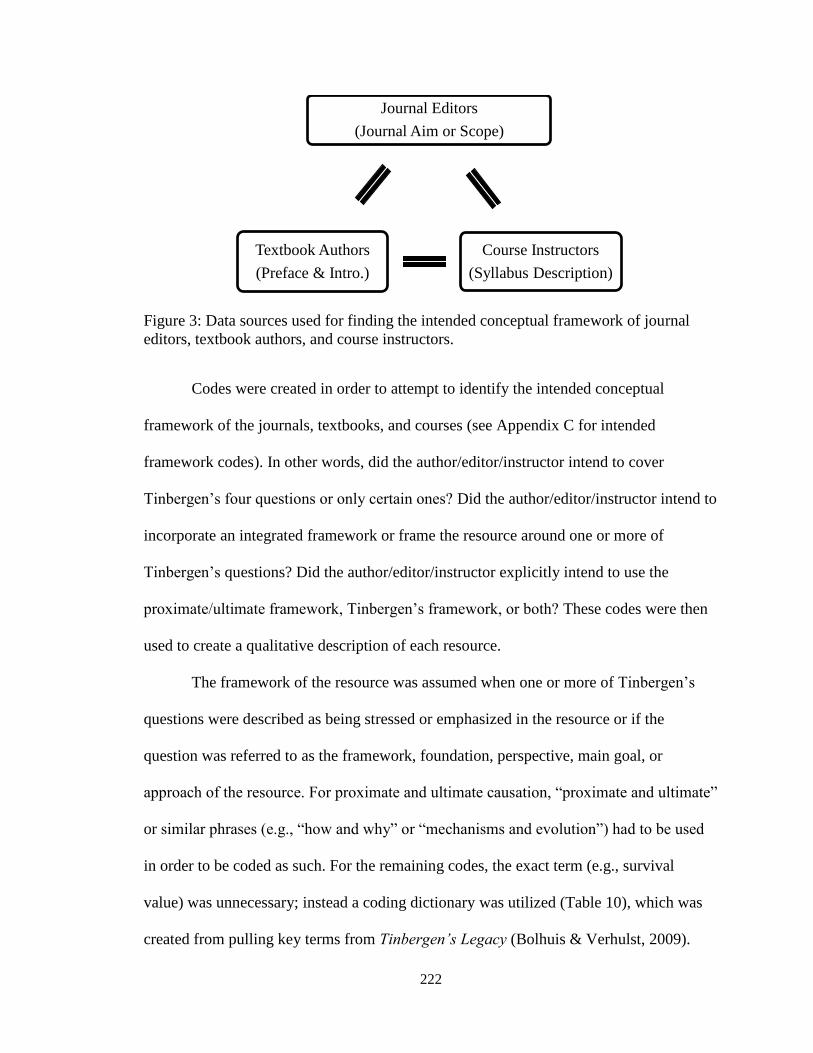
222
Figure 3: Data sources used for finding the intended conceptual framework of journal
editors, textbook authors, and course instructors.
Codes were created in order to attempt to identify the intended conceptual
framework of the journals, textbooks, and courses (see Appendix C for intended
framework codes). In other words, did the author/editor/instructor intend to cover
Tinbergen’s four questions or only certain ones? Did the author/editor/instructor intend to
incorporate an integrated framework or frame the resource around one or more of
Tinbergen’s questions? Did the author/editor/instructor explicitly intend to use the
proximate/ultimate framework, Tinbergen’s framework, or both? These codes were then
used to create a qualitative description of each resource.
The framework of the resource was assumed when one or more of Tinbergen’s
questions were described as being stressed or emphasized in the resource or if the
question was referred to as the framework, foundation, perspective, main goal, or
approach of the resource. For proximate and ultimate causation, “proximate and ultimate”
or similar phrases (e.g., “how and why” or “mechanisms and evolution”) had to be used
in order to be coded as such. For the remaining codes, the exact term (e.g., survival
value) was unnecessary; instead a coding dictionary was utilized (Table 10), which was
created from pulling key terms from Tinbergen’s Legacy (Bolhuis & Verhulst, 2009).
Journal Editors
(Journal Aim or Scope)
Course Instructors
(Syllabus Description)
Textbook Authors
(Preface & Intro.)
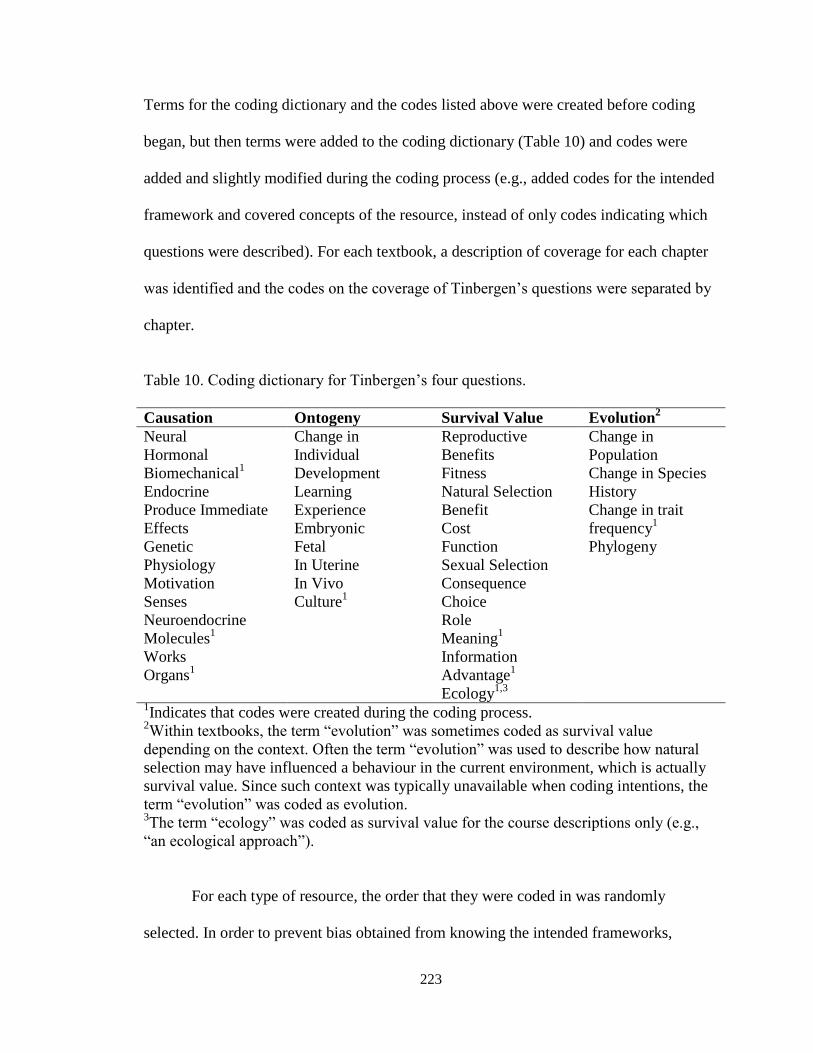
223
Terms for the coding dictionary and the codes listed above were created before coding
began, but then terms were added to the coding dictionary (Table 10) and codes were
added and slightly modified during the coding process (e.g., added codes for the intended
framework and covered concepts of the resource, instead of only codes indicating which
questions were described). For each textbook, a description of coverage for each chapter
was identified and the codes on the coverage of Tinbergen’s questions were separated by
chapter.
Table 10. Coding dictionary for Tinbergen’s four questions.
Causation Ontogeny Survival Value Evolution2
Neural
Hormonal
Change in
Individual
Reproductive
Benefits
Change in
Population
Biomechanical1 Development Fitness Change in Species
Endocrine Learning Natural Selection History
Produce Immediate
Effects
Experience
Embryonic
Benefit
Cost
Change in trait
frequency1
Genetic Fetal Function Phylogeny
Physiology In Uterine Sexual Selection
Motivation In Vivo Consequence
Senses Culture1 Choice
Neuroendocrine Role
Molecules1 Meaning
1
Works Information
Organs1 Advantage
1
Ecology1,3
1Indicates that codes were created during the coding process.
2Within textbooks, the term “evolution” was sometimes coded as survival value
depending on the context. Often the term “evolution” was used to describe how natural
selection may have influenced a behaviour in the current environment, which is actually
survival value. Since such context was typically unavailable when coding intentions, the
term “evolution” was coded as evolution. 3The term “ecology” was coded as survival value for the course descriptions only (e.g.,
“an ecological approach”).
For each type of resource, the order that they were coded in was randomly
selected. In order to prevent bias obtained from knowing the intended frameworks,
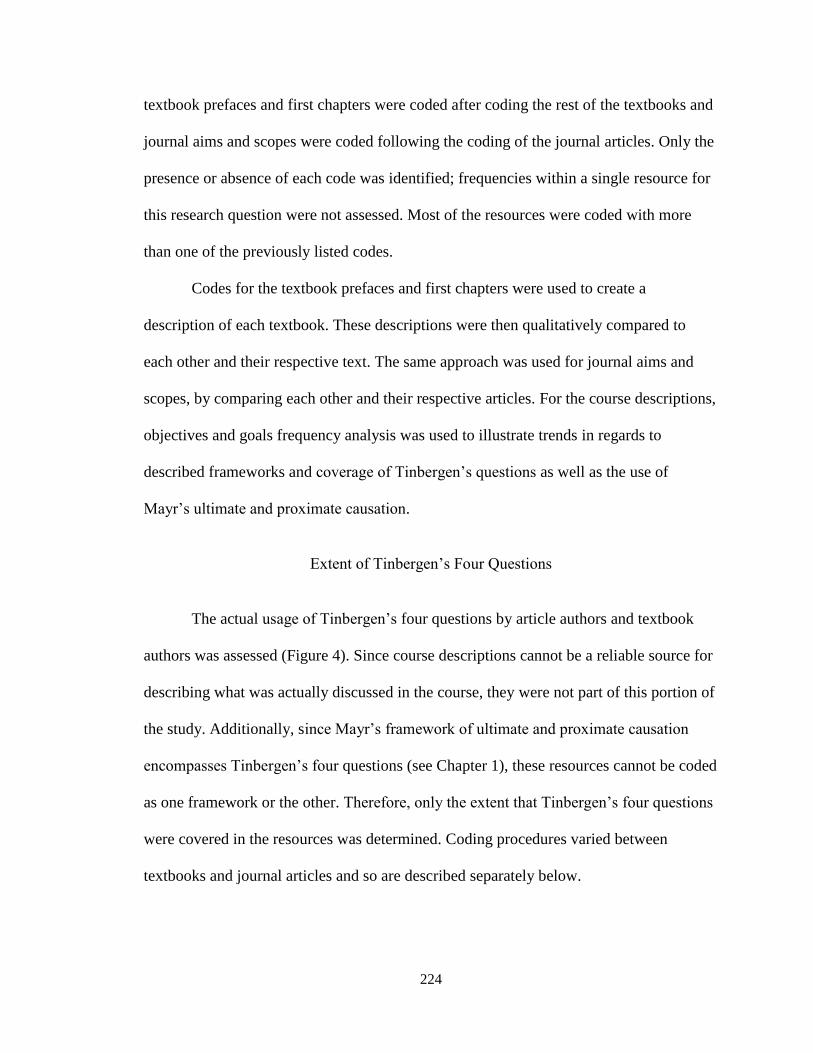
224
textbook prefaces and first chapters were coded after coding the rest of the textbooks and
journal aims and scopes were coded following the coding of the journal articles. Only the
presence or absence of each code was identified; frequencies within a single resource for
this research question were not assessed. Most of the resources were coded with more
than one of the previously listed codes.
Codes for the textbook prefaces and first chapters were used to create a
description of each textbook. These descriptions were then qualitatively compared to
each other and their respective text. The same approach was used for journal aims and
scopes, by comparing each other and their respective articles. For the course descriptions,
objectives and goals frequency analysis was used to illustrate trends in regards to
described frameworks and coverage of Tinbergen’s questions as well as the use of
Mayr’s ultimate and proximate causation.
Extent of Tinbergen’s Four Questions
The actual usage of Tinbergen’s four questions by article authors and textbook
authors was assessed (Figure 4). Since course descriptions cannot be a reliable source for
describing what was actually discussed in the course, they were not part of this portion of
the study. Additionally, since Mayr’s framework of ultimate and proximate causation
encompasses Tinbergen’s four questions (see Chapter 1), these resources cannot be coded
as one framework or the other. Therefore, only the extent that Tinbergen’s four questions
were covered in the resources was determined. Coding procedures varied between
textbooks and journal articles and so are described separately below.
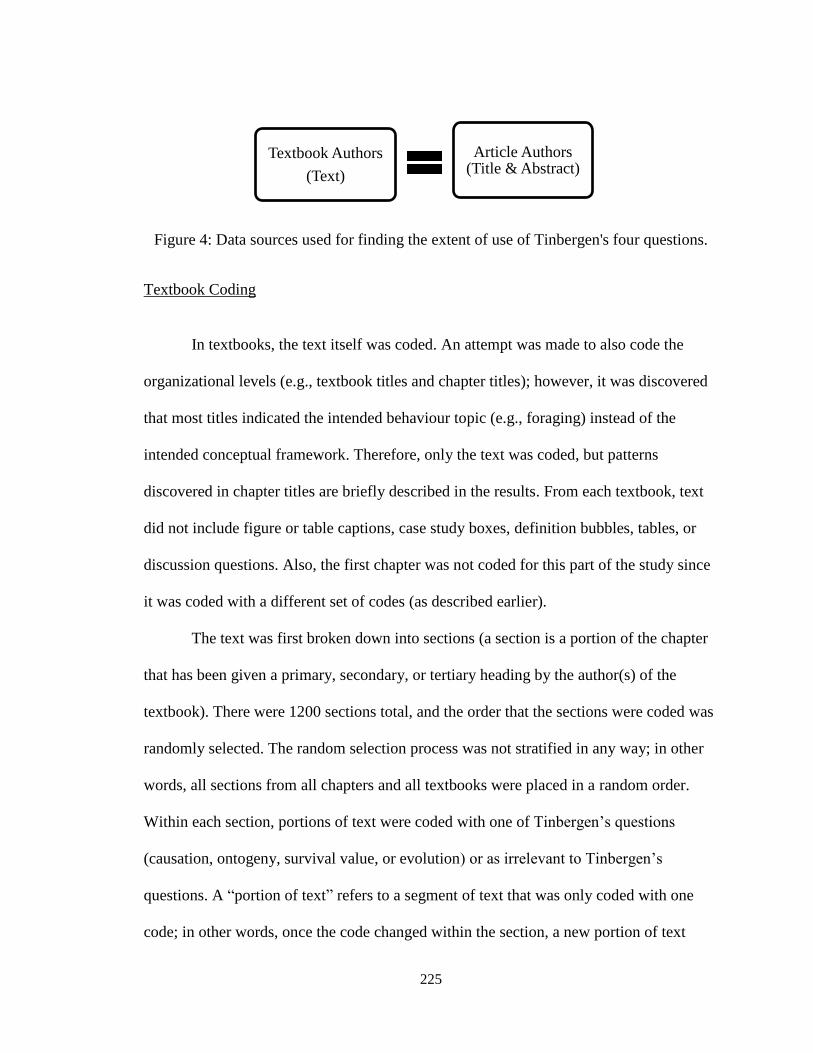
225
Figure 4: Data sources used for finding the extent of use of Tinbergen's four questions.
Textbook Coding
In textbooks, the text itself was coded. An attempt was made to also code the
organizational levels (e.g., textbook titles and chapter titles); however, it was discovered
that most titles indicated the intended behaviour topic (e.g., foraging) instead of the
intended conceptual framework. Therefore, only the text was coded, but patterns
discovered in chapter titles are briefly described in the results. From each textbook, text
did not include figure or table captions, case study boxes, definition bubbles, tables, or
discussion questions. Also, the first chapter was not coded for this part of the study since
it was coded with a different set of codes (as described earlier).
The text was first broken down into sections (a section is a portion of the chapter
that has been given a primary, secondary, or tertiary heading by the author(s) of the
textbook). There were 1200 sections total, and the order that the sections were coded was
randomly selected. The random selection process was not stratified in any way; in other
words, all sections from all chapters and all textbooks were placed in a random order.
Within each section, portions of text were coded with one of Tinbergen’s questions
(causation, ontogeny, survival value, or evolution) or as irrelevant to Tinbergen’s
questions. A “portion of text” refers to a segment of text that was only coded with one
code; in other words, once the code changed within the section, a new portion of text
Article Authors (Title & Abstract)
Textbook Authors
(Text)
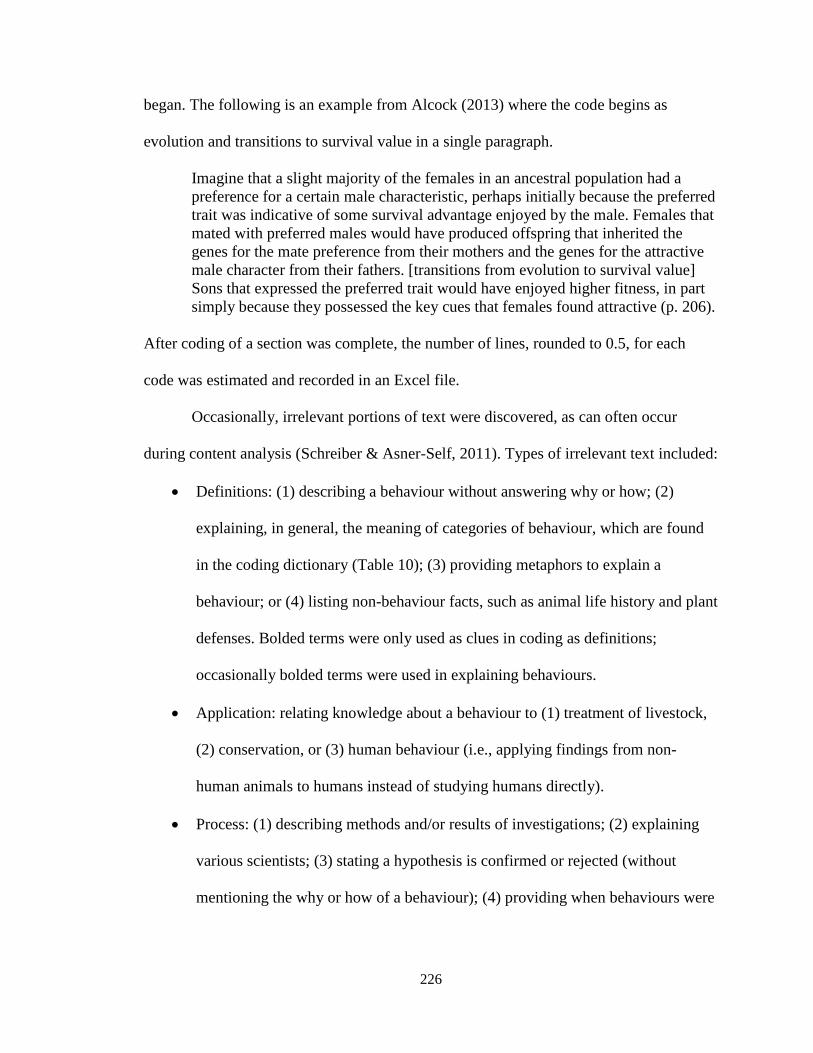
226
began. The following is an example from Alcock (2013) where the code begins as
evolution and transitions to survival value in a single paragraph.
Imagine that a slight majority of the females in an ancestral population had a
preference for a certain male characteristic, perhaps initially because the preferred
trait was indicative of some survival advantage enjoyed by the male. Females that
mated with preferred males would have produced offspring that inherited the
genes for the mate preference from their mothers and the genes for the attractive
male character from their fathers. [transitions from evolution to survival value]
Sons that expressed the preferred trait would have enjoyed higher fitness, in part
simply because they possessed the key cues that females found attractive (p. 206).
After coding of a section was complete, the number of lines, rounded to 0.5, for each
code was estimated and recorded in an Excel file.
Occasionally, irrelevant portions of text were discovered, as can often occur
during content analysis (Schreiber & Asner-Self, 2011). Types of irrelevant text included:
Definitions: (1) describing a behaviour without answering why or how; (2)
explaining, in general, the meaning of categories of behaviour, which are found
in the coding dictionary (Table 10); (3) providing metaphors to explain a
behaviour; or (4) listing non-behaviour facts, such as animal life history and plant
defenses. Bolded terms were only used as clues in coding as definitions;
occasionally bolded terms were used in explaining behaviours.
Application: relating knowledge about a behaviour to (1) treatment of livestock,
(2) conservation, or (3) human behaviour (i.e., applying findings from non-
human animals to humans instead of studying humans directly).
Process: (1) describing methods and/or results of investigations; (2) explaining
various scientists; (3) stating a hypothesis is confirmed or rejected (without
mentioning the why or how of a behaviour); (4) providing when behaviours were
227
first discovered; (5) describing the current state of animal behaviour; or (6)
describing previously supported answers to why and how questions.
Other irrelevant items: (1) providing transitions into a new topic; (2) introducing
a section; (3) discussing what was learned in previous sections; or (4) referring to
figures/tables without explaining the why or how of a behaviour (e.g., “please
refer to figure 1.1”).
These portions of text were ignored during analysis when their length met or exceeded
0.5 of a line (less than .5 of a line was included with other codes). For instance, the
following quote was considered to be irrelevant: “Some investigators have adopted the
practice by which animals are identified and recorded in the data by names such as
‘Swifty,’ ‘Old One,’ and the like” (Drickamer et al., 2002, p. 32). Moreover, the text was
coded directly; it was not interpreted. For instance, the following quote describes an
example of dispersal, which dispersal is an excellent example of a behaviour that can
increase reproductive success, but the quote does not explain why dispersal happens:
“Sherman knew that the males leave the area several months after birth and that the
females are sedentary and breed near their birthplaces” (Drickamer et al., 2002, p. 204).
Portions of text that were analyzed included those that described the why and how of a
behaviour during such instances as explaining (1) the interpretation of results of an
investigation; (2) an application of the behaviour; (3) specific examples, even at the
species level; or (4) simply providing the why and how without context.
The coding dictionary previously described was used in order to determine which of
Tinbergen’s questions were being explained (Table 10). Moreover, since “whether the
featured processes will be characterized as proximate or ultimate will depend on the
228
conceptual framework of the researcher” (Laland et al., 2013, p. 729), we created a
general definition of each of Tinbergen’s questions. These were based on the current
literature.
Causation: (1) How does a behaviour occur? (2) How does a behaviour work? (3)
Which events or cues may lead up to a specific behaviour?
Ontogeny: (1) How does a behaviour change during an individual’s lifetime,
excluding seasonal changes? (2) How do experiences and learning result in a new
behaviour? (3) Which circumstances create a new behaviour?
Survival Value: (1) What is the function of a behaviour? (2) How does a
behaviour impact an individual’s survival and/or reproductive success (i.e.,
fitness)? (3) Which behaviours are effective? (4) What are the results of doing a
behaviour? (5) How does the behaviour of one individual compare to the
behaviour of the rest of the population?
Evolution: (1) Does a behaviour, including its genetic basis, change or persist
over generations, either during micro- or macroevolution? (2) How has a
behaviour changed over generations, either during micro- or macroevolution?
Once coding was complete, frequency analysis was undertaken to determine the extent of
coverage of Tinbergen’s questions for each textbook and textbook chapter/part.
Journal Article Coding
For journal articles, both research and review articles of 2013 were analyzed (N =
849 articles) for the journals Animal Behaviour (n = 306), Behavioral Ecology (n = 163),
Behavioral Ecology and Sociobiology (n = 185), Behaviour (n = 81), and Ethology (n =
229
114). Book reviews, editor notes, letters, commentaries, methods papers, and the coders’
papers were excluded. The article abstract was read in full in order to determine which of
Tinbergen’s questions the study was attempting to answer and which of Tinbergen’s
questions was/were provided as the larger context of the study and/or the implications of
the study. The article title was also read for the first 50 articles, but often was not
informative, and so only the abstract was read for the remaining articles. Within the
abstract, a description of which of Tinbergen’s questions the study was attempting to
answer (i.e., the goal of the study) was typically found in the described purpose, methods
and results. For instance, if the study created a phylogeny of a specific behaviour, then
the study examined Tinbergen’s evolution. Since articles could be coded with more than
one theme (i.e., causation, ontogeny, survival value, and/or evolution), each article
equaled one point. The one point for each article was spread over all of the Tinbergen’s
relevant questions. Therefore, if an article was coded with one question/theme, then one
point was added to that theme, if an article was coded with two themes, then 0.5 points
were added to both themes, and so on. This point system was used in order to determine
the frequency of each of Tinbergen’s questions within the literature. A similar process
was used for discovering which of Tinbergen’s questions were used in a broader context
(i.e., the introduction, goals, and implications of each study).
After coding was completed, frequency analysis was undertaken in order to
determine to what extent Tinbergen’s questions were answered, in addition to what extent
Tinbergen’s questions were described in the broader context. In order to identify the level
of integration per article, a binomial distribution was created (0: only one of Tinbergen’s
questions; 1: two or more of Tinbergen’s questions) and tested using chi-square goodness
230
of fit test. Additionally, a second binomial distribution was created (0: only proximate or
ultimate causation; 1: both proximate and ultimate causation) and tested using chi-square
goodness of fit test. The chi-square test assumption of having all expected values greater
than five was met. Since two tests were used to answer the question of integration, the
significant p-value = .025. These tests were also run on review articles only (n = 50; 6%
of all articles).
Alignment
Once all resources were coded, alignment was assessed. Alignment was examined
within a resource (e.g., within a textbook), within education, and between the primary
literature and textbooks. Within the preface and/or first chapter of each textbook, both the
overall framework and a description of coverage for each chapter or part were provided
and, therefore, were qualitatively compared to their respective text frequencies. In
addition to comparing the preface and the text to each other, the chapter titles were also
qualitatively compared to the preface/first chapter descriptions and the text. Similarly,
each journal aims and scope was qualitatively compared to the article frequencies.
In order to measure alignment within a classroom, the framework and coverage
described within the course descriptions, objectives, and goals were compared to the
textbook and primary literature analyses results. In the final chapter, textbook and course
description analyses is compared to journal frequency analysis of the present and
previous studies (i.e., Hogan, 2009; Ord et al., 2005) in order to discuss the overarching
research question: to what extent do the conceptual frameworks of the primary literature
for animal behaviour align with undergraduate biology education (i.e., textbooks and
231
course descriptions)? The purpose of comparing to previous studies is that the content in
the textbooks is older than the one year examined.
Blinding Process
Textbooks were blinded by someone who was not part of the study. Since the text
was coded first, identifying labels (i.e., the section headings, chapter titles, textbook title,
and author names) were removed before coding began. Identifying labels were also
removed from the textbook prefaces and introductory chapters.
Syllabi course descriptions were not blinded for the primary coder, but they were
blinded for the secondary coder since she is familiar with the work done by various
instructors and institutions. The primary coder blinded them by copying and pasting
course descriptions, objectives, and goals from each syllabus into a separate document.
Similarly, the journal articles were not blinded for the primary coder, but they were for
the secondary coder. The primary coder created Word documents with only the title and
abstract. Each journal aim and scope was also copied and pasted into a Word document,
with journal titles removed, for blinding purposes.
Reliability
For content analysis, reliability can be measured in two ways: inter-coder and
intra-coder reliability (Lauriola, 2004). These two methods were combined in order to
code 20% of the total content twice. Please see Table 11 for the amount of units that were
coded a second time for inter-coder and intra-coder reliability and Tables 12 and 13 for
established reliability percentages.
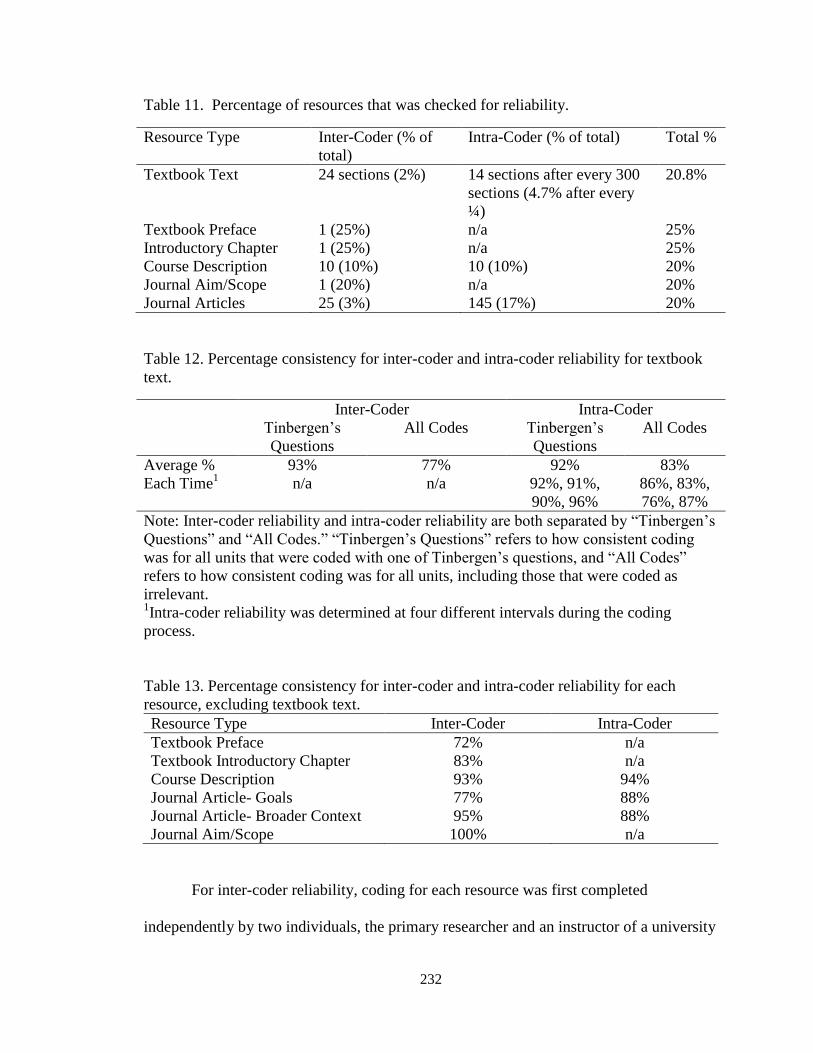
232
Table 11. Percentage of resources that was checked for reliability.
Resource Type Inter-Coder (% of
total)
Intra-Coder (% of total) Total %
Textbook Text 24 sections (2%) 14 sections after every 300
sections (4.7% after every
¼)
20.8%
Textbook Preface 1 (25%) n/a 25%
Introductory Chapter 1 (25%) n/a 25%
Course Description 10 (10%) 10 (10%) 20%
Journal Aim/Scope 1 (20%) n/a 20%
Journal Articles 25 (3%) 145 (17%) 20%
Table 12. Percentage consistency for inter-coder and intra-coder reliability for textbook
text.
Inter-Coder Intra-Coder
Tinbergen’s
Questions
All Codes Tinbergen’s
Questions
All Codes
Average % 93% 77% 92% 83%
Each Time1
n/a n/a 92%, 91%,
90%, 96%
86%, 83%,
76%, 87%
Note: Inter-coder reliability and intra-coder reliability are both separated by “Tinbergen’s
Questions” and “All Codes.” “Tinbergen’s Questions” refers to how consistent coding
was for all units that were coded with one of Tinbergen’s questions, and “All Codes”
refers to how consistent coding was for all units, including those that were coded as
irrelevant. 1Intra-coder reliability was determined at four different intervals during the coding
process.
Table 13. Percentage consistency for inter-coder and intra-coder reliability for each
resource, excluding textbook text.
Resource Type Inter-Coder Intra-Coder
Textbook Preface 72% n/a
Textbook Introductory Chapter 83% n/a
Course Description 93% 94%
Journal Article- Goals 77% 88%
Journal Article- Broader Context 95% 88%
Journal Aim/Scope 100% n/a
For inter-coder reliability, coding for each resource was first completed
independently by two individuals, the primary researcher and an instructor of a university
233
animal behaviour course who is also a behavioural ecologist. The textbook text was the
first resource that was coded. Before coding the textbook text, the two individuals met to
discuss how to code the text. After attempting to have one code per line, it was
determined that per clause would be more accurate. The coding dictionary was reviewed
and then the two coders coded independently. Of the codes that were coded as one of
Tinbergen’s questions by both coders, the two coders were consistent only 66% of the
time. The number of clauses also often varied between the two coders. Because of this,
the primary coder met with Western Michigan University’s Writing Center Director,
Donna Kim Ballard, who has a background in rhetoric, to discuss the unit of analysis. She
recommended avoiding the use of a clause and instead code by instance. In order to
quantify how often Tinbergen’s questions were discussed, the primary coder decided to
count the number of lines for each code after each section was coded. Once the unit of
analysis was established, the two coders met to discuss differences in codes. They
compared codes and created stricter guidelines. This was followed by the primary coder
coding the previously-coded sections and the secondary coder confirming the codes.
Another meeting occurred to discuss the few discrepancies in the codes and finalize the
codes of those sections.
Then the two coders coded 12 more sections independently. The codes for every
half line of text were compared (here-after, referred to as “half-line”). Of the half-lines
that were coded with one of Tinbergen’s questions, consistency between the two coders
was 93%. Of all of the half-lines coded (coded as causation, ontogeny, survival value,
evolution, or irrelevant to the research question), consistency was 77%. Therefore, the
234
two coders met once again to discuss the inconsistencies and, since inter-coder reliability
was established, the primary coder continued coding the rest of the text.
Intra-coder reliability was measured after every 25% of the sections were initially
coded. This was done to ensure that time, fatigue, and possible interpretation of the text
did not impact the coding process. The primary coder recoded randomly-selected sections
of the text at least seven days after initial coding (similar to the study by Jones et al.,
2009). Sections that were coded a second time (for intra-coder reliability) were selected
and copied before coding began since electronic copies of textbooks that were blinded
and numbered were not available. Printing occurred two weeks before any coding began
so that the coder would not remember which sections were selected for intra-coder
reliability. At least 70% consistency was met every time intra-coder reliability was
measured, indicating that intra-coder reliability was met (Table 12).
For the textbook preface and chapters, course descriptions, objectives, and goals,
journal articles, and journal aims and scopes, a similar procedure as described above took
place in order to code at least 20% of each type of resource twice. For inter-coder
reliability, the two coders met to discuss the coding process, themes, and dictionary
before coding the same resources independently. Then the coders met to discuss any
discrepancies. Percentage of consistency for textbook prefaces and first chapters and
course descriptions was measured by comparing all yes/no responses to the list of codes
provided in Appendix C (e.g., “defines survival value”). For each journal article, the
percentage of consistency was established by comparing all yes/no responses for each of
Tinbergen’s questions. For instance, if one coder coded an article as ontogeny and
causation and the other coder coded it as survival value and causation, then the
235
percentage for that article was 50% (both yes for causation, both no for evolution, but
inconsistent with survival value and ontogeny). Then the average percentage of all
articles was identified. Since at least 70% consistency was met for each resource, after
determining the final codes for the resources that both coders coded, the primary coder
continued the coding process. Intra-coder reliability was determined for course
descriptions, objectives, and goals, and journal articles (Table 13), following similar
procedures for establishing inter-coder reliability.
236
CHAPTER IV
RESULTS
In order to examine the overarching research question of alignment between the
resources, the results for each resource type (i.e., education or primary literature) need to
first be described. Therefore, this chapter discusses each resource type independently and
then the final chapter describes the extent of alignment between education and primary
literature.
Syllabi
Through the random-stratified selection process, 99 syllabi were collected. For
three states, one institution, instead of two, were used due to either not enough
universities that teach animal behaviour or not receiving the syllabi from some
instructors. All selected animal behaviour courses were classified as biology courses,
which was a selection requirement, but two of the instructors were from psychology
departments and one instructor had a dual-appointment in both biology and psychology
departments. Graduate-level degrees were identified for 53 of the instructors. Nearly all
of them had biology, sub-discipline of biology, or environmental science degrees. Two of
the three instructors in psychology departments had listed degrees in psychology (the
third was unknown). One other instructor had a Master’s in anthropology and a PhD in
biological anthropology, and another instructor had a Master’s in college teaching of
biology. Thirty-five of the instructors were women and 64 were men.
237
Of all of the syllabi, six did not have a required or recommended textbook (see
Figure 5). The most popular textbook, by far, was Alcock’s Animal Behavior: An
Evolutionary Approach. Fifty-three syllabi listed it as a required textbook and three listed
it as optional supplemental material. One syllabus that named a required different
textbook still had Alcock’s textbook on reserve at the institution’s library. Most syllabi
listed the ninth edition; five named the most recent, 10th
edition, four listed the eighth
edition, one listed the seventh edition, and one did not specify.
Fifteen syllabi listed Dugatkin’s Principles of Animal Behavior (three listed the
first edition, nine listed the second edition, two listed the most recent edition (2013), and
one did not specify), eight listed Breed’s & Moore’s Animal Behavior (only one edition is
published; 2012), and five listed Drickamer’s et al. Animal Behavior: Mechanisms,
Ecology and Evolution (four listed the most recent, fifth edition (2013), and one did not
specify). One syllabus for each of the above textbooks listed the textbook but did not
require it. Other textbooks listed, on occasion, were Goodenough’s et al. Perspectives on
Animal Behavior, Sherman’s & Alcock’s Exploring Animal Behavior, Martin’s &
Bateson’s Measuring Behavior: An Introductory Guide and two behavioural ecology
textbooks (Davies’ & Krebs’ An Introduction to Behavioural Ecology and Westneat’s &
Fox’s Evolutionary Behavioral Ecology). Although Martin’s & Bateson’s Measuring
Behavior was the primary textbook in one course, six others listed it as a second required
textbook.
Trade books were also, on occasion, required for courses, including Dawkin’s The
Selfish Gene (n = 3), Dennett’s Kinds of Minds: Toward an Understanding of
Consciousness (n = 1), Hrdy’s The Woman Who Never Evolved (n = 1), and Fouts’ Next
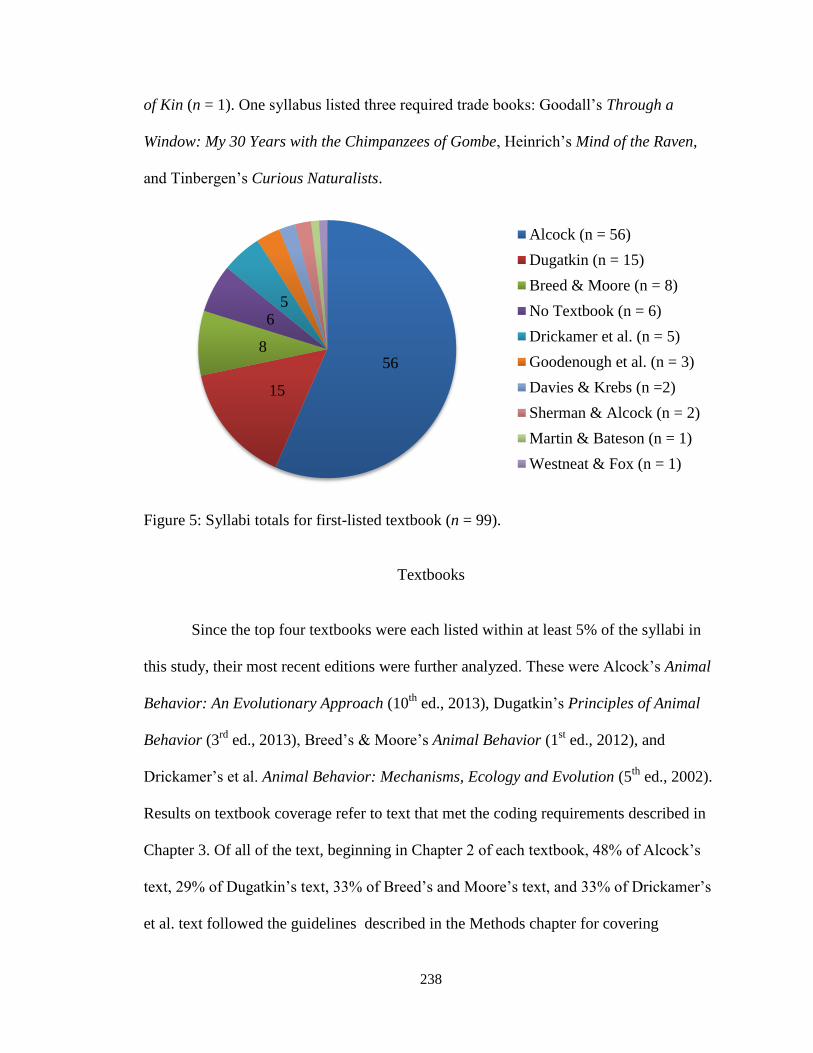
238
of Kin (n = 1). One syllabus listed three required trade books: Goodall’s Through a
Window: My 30 Years with the Chimpanzees of Gombe, Heinrich’s Mind of the Raven,
and Tinbergen’s Curious Naturalists.
Figure 5: Syllabi totals for first-listed textbook (n = 99).
Textbooks
Since the top four textbooks were each listed within at least 5% of the syllabi in
this study, their most recent editions were further analyzed. These were Alcock’s Animal
Behavior: An Evolutionary Approach (10th
ed., 2013), Dugatkin’s Principles of Animal
Behavior (3rd
ed., 2013), Breed’s & Moore’s Animal Behavior (1st ed., 2012), and
Drickamer’s et al. Animal Behavior: Mechanisms, Ecology and Evolution (5th
ed., 2002).
Results on textbook coverage refer to text that met the coding requirements described in
Chapter 3. Of all of the text, beginning in Chapter 2 of each textbook, 48% of Alcock’s
text, 29% of Dugatkin’s text, 33% of Breed’s and Moore’s text, and 33% of Drickamer’s
et al. text followed the guidelines described in the Methods chapter for covering
56
15
8
6 5
Alcock (n = 56)
Dugatkin (n = 15)
Breed & Moore (n = 8)
No Textbook (n = 6)
Drickamer et al. (n = 5)
Goodenough et al. (n = 3)
Davies & Krebs (n =2)
Sherman & Alcock (n = 2)
Martin & Bateson (n = 1)
Westneat & Fox (n = 1)
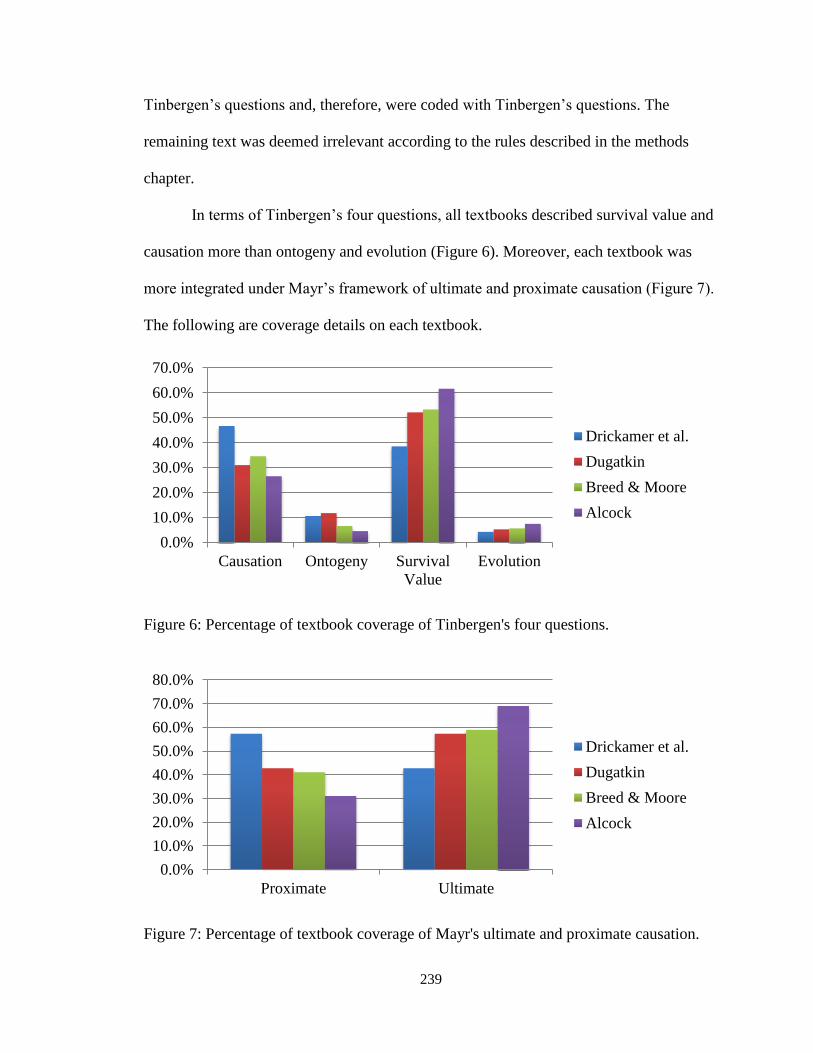
239
Tinbergen’s questions and, therefore, were coded with Tinbergen’s questions. The
remaining text was deemed irrelevant according to the rules described in the methods
chapter.
In terms of Tinbergen’s four questions, all textbooks described survival value and
causation more than ontogeny and evolution (Figure 6). Moreover, each textbook was
more integrated under Mayr’s framework of ultimate and proximate causation (Figure 7).
The following are coverage details on each textbook.
Figure 6: Percentage of textbook coverage of Tinbergen's four questions.
Figure 7: Percentage of textbook coverage of Mayr's ultimate and proximate causation.
0.0%
10.0%
20.0%
30.0%
40.0%
50.0%
60.0%
70.0%
Causation Ontogeny Survival
Value
Evolution
Drickamer et al.
Dugatkin
Breed & Moore
Alcock
0.0%
10.0%
20.0%
30.0%
40.0%
50.0%
60.0%
70.0%
80.0%
Proximate Ultimate
Drickamer et al.
Dugatkin
Breed & Moore
Alcock
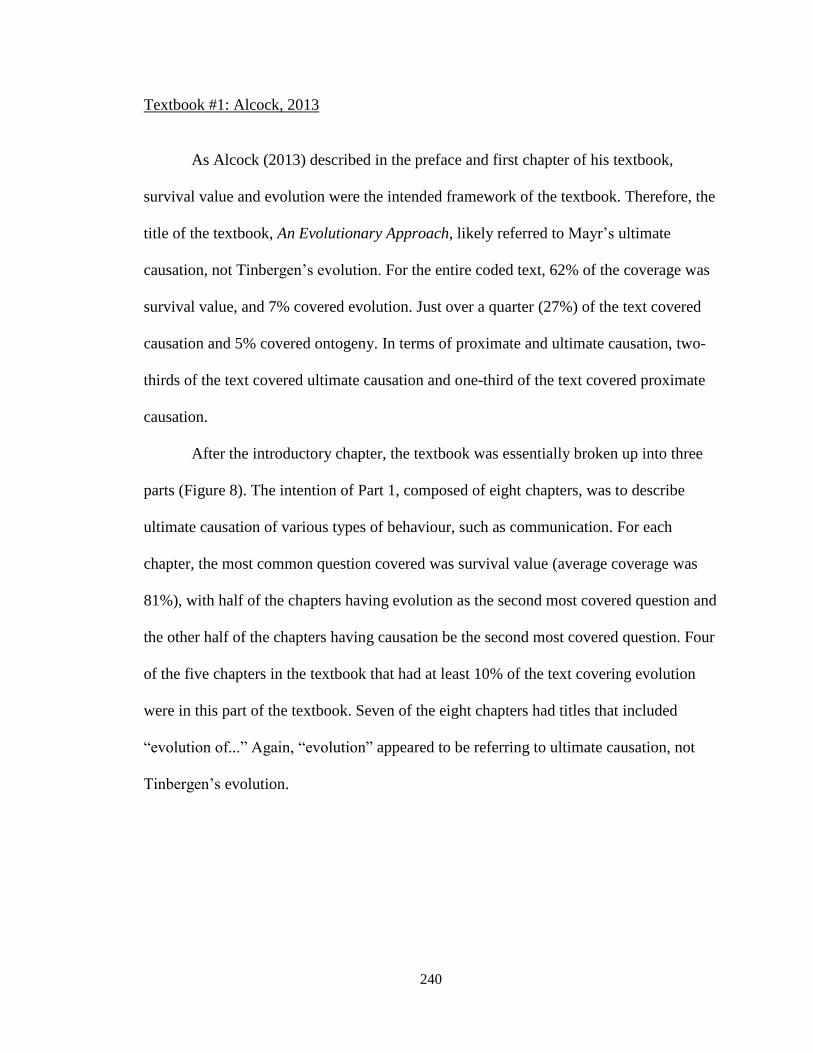
240
Textbook #1: Alcock, 2013
As Alcock (2013) described in the preface and first chapter of his textbook,
survival value and evolution were the intended framework of the textbook. Therefore, the
title of the textbook, An Evolutionary Approach, likely referred to Mayr’s ultimate
causation, not Tinbergen’s evolution. For the entire coded text, 62% of the coverage was
survival value, and 7% covered evolution. Just over a quarter (27%) of the text covered
causation and 5% covered ontogeny. In terms of proximate and ultimate causation, two-
thirds of the text covered ultimate causation and one-third of the text covered proximate
causation.
After the introductory chapter, the textbook was essentially broken up into three
parts (Figure 8). The intention of Part 1, composed of eight chapters, was to describe
ultimate causation of various types of behaviour, such as communication. For each
chapter, the most common question covered was survival value (average coverage was
81%), with half of the chapters having evolution as the second most covered question and
the other half of the chapters having causation be the second most covered question. Four
of the five chapters in the textbook that had at least 10% of the text covering evolution
were in this part of the textbook. Seven of the eight chapters had titles that included
“evolution of...” Again, “evolution” appeared to be referring to ultimate causation, not
Tinbergen’s evolution.
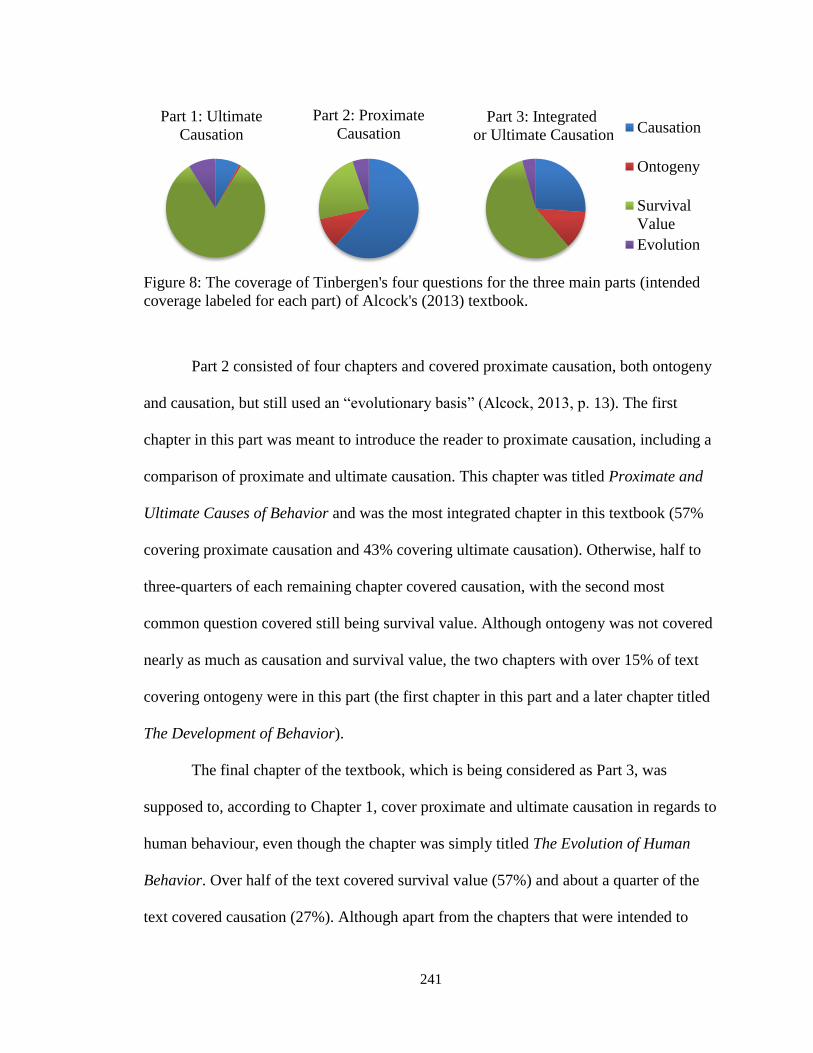
241
Figure 8: The coverage of Tinbergen's four questions for the three main parts (intended
coverage labeled for each part) of Alcock's (2013) textbook.
Part 2 consisted of four chapters and covered proximate causation, both ontogeny
and causation, but still used an “evolutionary basis” (Alcock, 2013, p. 13). The first
chapter in this part was meant to introduce the reader to proximate causation, including a
comparison of proximate and ultimate causation. This chapter was titled Proximate and
Ultimate Causes of Behavior and was the most integrated chapter in this textbook (57%
covering proximate causation and 43% covering ultimate causation). Otherwise, half to
three-quarters of each remaining chapter covered causation, with the second most
common question covered still being survival value. Although ontogeny was not covered
nearly as much as causation and survival value, the two chapters with over 15% of text
covering ontogeny were in this part (the first chapter in this part and a later chapter titled
The Development of Behavior).
The final chapter of the textbook, which is being considered as Part 3, was
supposed to, according to Chapter 1, cover proximate and ultimate causation in regards to
human behaviour, even though the chapter was simply titled The Evolution of Human
Behavior. Over half of the text covered survival value (57%) and about a quarter of the
text covered causation (27%). Although apart from the chapters that were intended to
Part 1: Ultimate
Causation
Part 2: Proximate
Causation Part 3: Integrated
or Ultimate Causation Causation
Ontogeny
Survival
Value
Evolution
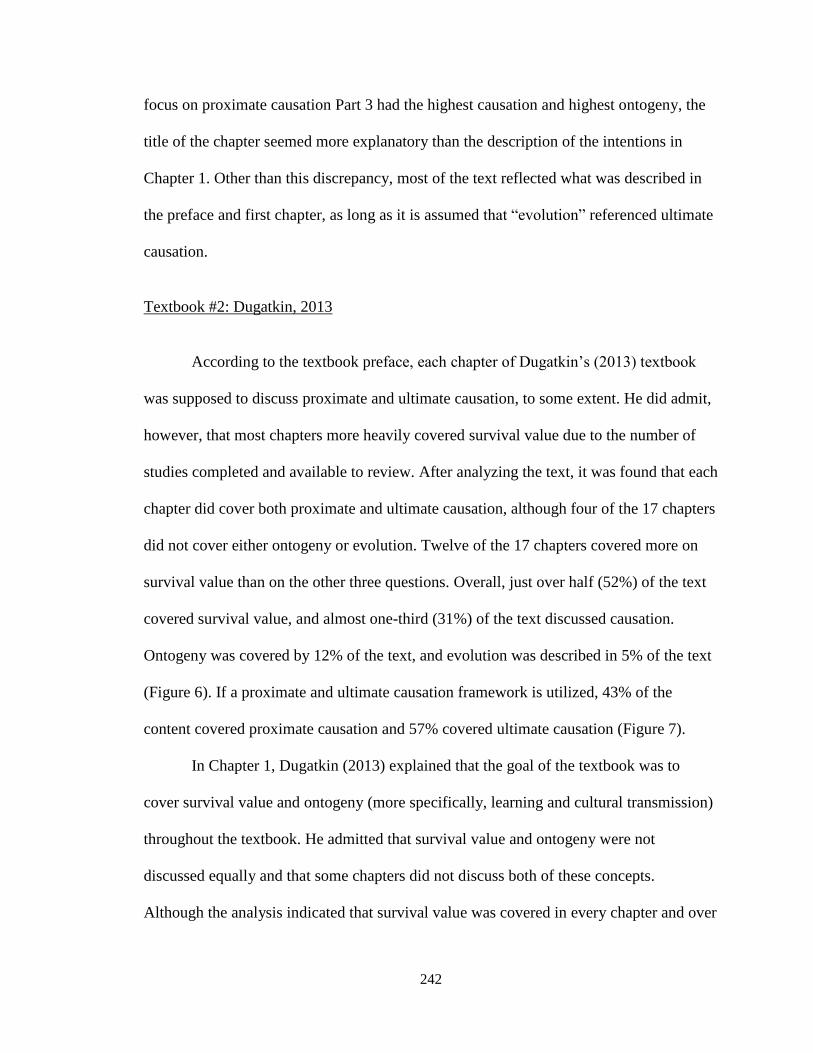
242
focus on proximate causation Part 3 had the highest causation and highest ontogeny, the
title of the chapter seemed more explanatory than the description of the intentions in
Chapter 1. Other than this discrepancy, most of the text reflected what was described in
the preface and first chapter, as long as it is assumed that “evolution” referenced ultimate
causation.
Textbook #2: Dugatkin, 2013
According to the textbook preface, each chapter of Dugatkin’s (2013) textbook
was supposed to discuss proximate and ultimate causation, to some extent. He did admit,
however, that most chapters more heavily covered survival value due to the number of
studies completed and available to review. After analyzing the text, it was found that each
chapter did cover both proximate and ultimate causation, although four of the 17 chapters
did not cover either ontogeny or evolution. Twelve of the 17 chapters covered more on
survival value than on the other three questions. Overall, just over half (52%) of the text
covered survival value, and almost one-third (31%) of the text discussed causation.
Ontogeny was covered by 12% of the text, and evolution was described in 5% of the text
(Figure 6). If a proximate and ultimate causation framework is utilized, 43% of the
content covered proximate causation and 57% covered ultimate causation (Figure 7).
In Chapter 1, Dugatkin (2013) explained that the goal of the textbook was to
cover survival value and ontogeny (more specifically, learning and cultural transmission)
throughout the textbook. He admitted that survival value and ontogeny were not
discussed equally and that some chapters did not discuss both of these concepts.
Although the analysis indicated that survival value was covered in every chapter and over
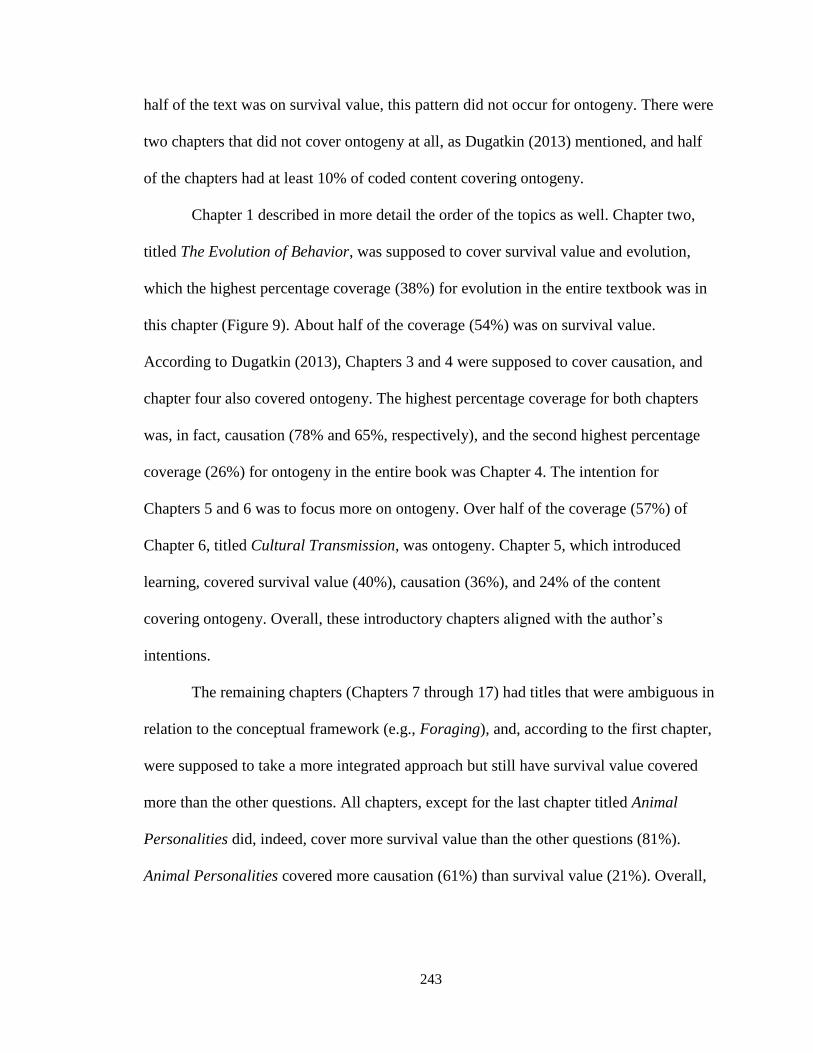
243
half of the text was on survival value, this pattern did not occur for ontogeny. There were
two chapters that did not cover ontogeny at all, as Dugatkin (2013) mentioned, and half
of the chapters had at least 10% of coded content covering ontogeny.
Chapter 1 described in more detail the order of the topics as well. Chapter two,
titled The Evolution of Behavior, was supposed to cover survival value and evolution,
which the highest percentage coverage (38%) for evolution in the entire textbook was in
this chapter (Figure 9). About half of the coverage (54%) was on survival value.
According to Dugatkin (2013), Chapters 3 and 4 were supposed to cover causation, and
chapter four also covered ontogeny. The highest percentage coverage for both chapters
was, in fact, causation (78% and 65%, respectively), and the second highest percentage
coverage (26%) for ontogeny in the entire book was Chapter 4. The intention for
Chapters 5 and 6 was to focus more on ontogeny. Over half of the coverage (57%) of
Chapter 6, titled Cultural Transmission, was ontogeny. Chapter 5, which introduced
learning, covered survival value (40%), causation (36%), and 24% of the content
covering ontogeny. Overall, these introductory chapters aligned with the author’s
intentions.
The remaining chapters (Chapters 7 through 17) had titles that were ambiguous in
relation to the conceptual framework (e.g., Foraging), and, according to the first chapter,
were supposed to take a more integrated approach but still have survival value covered
more than the other questions. All chapters, except for the last chapter titled Animal
Personalities did, indeed, cover more survival value than the other questions (81%).
Animal Personalities covered more causation (61%) than survival value (21%). Overall,
244
over half of the text in these chapters covered survival value and nearly one quarter
covered causation (Figure 10).
Figure 9: Percentage of text covering each of Tinbergen's questions for Chapters 2
through 6 of Dugatkin's (2013) textbook with intended coverage below chapter numbers.
Figure 10: Coverage of Tinbergen’s questions for Chapters 7 through 17 of Dugatkin's
(2013) textbook.
0%
10%
20%
30%
40%
50%
60%
70%
80%
90%
100%
Ch. 2:
Evolution
& Survival
Value
Ch. 3:
Causation
Ch. 4:
Causation
&
Ontogeny
Ch. 5:
Ontogeny
Ch. 6:
Ontogeny
Causation
Ontogeny
Survival Value
Evolution
24%
8%
63%
5%
Causation
Ontogeny
Survival Value
Evolution
245
Textbook #3: Breed and Moore, 2012
Breed and Moore (2012) intended to cover all four of Tinbergen’s questions,
instead of emphasizing the proximate and ultimate causation framework. Still, however,
they admitted that the textbook was “grounded in evolutionary principles” (p. 11), which
“evolution” likely meant ultimate causation. In examining the textbook overall, just over
half of the text covered survival value and 35% covered causation. Both ontogeny and
evolution were each covered by less than 10% of the text (7% and 6%, respectively;
Figure 6). In regards to the proximate and ultimate causation framework, proximate
causation was covered in 41% of the text and ultimate causation was covered in 59% of
the text.
After the introductory chapter, over half of the text in the next three chapters
covered causation (Figure 11), which the chapter titles named various types of causation,
such as learning. Then the next two chapters (Chapters 5 and 6) were supposed to focus
on ontogeny. Chapter 5 was on learning, and it was the chapter with the second highest
coverage of ontogeny (28%), but 42% of the text still covered survival value and 30%
covered causation. Chapter six was on cognition and, interestingly, was the most
integrated chapter in regards to Tinbergen’s four questions, with causation being most
covered (37%) and ontogeny the second most covered (26%) of Tinbergen’s questions.
The second half of the textbook had chapter titles naming types of behaviour
without identifying the conceptual framework. According to the preface, the first chapter
in this set, Chapter 7 on communication, was supposed to refer back to causation, but
55% of the text covered survival value and 37% covered causation. Chapter 8 was
supposed to begin with causation and then transition to survival value. In this chapter,
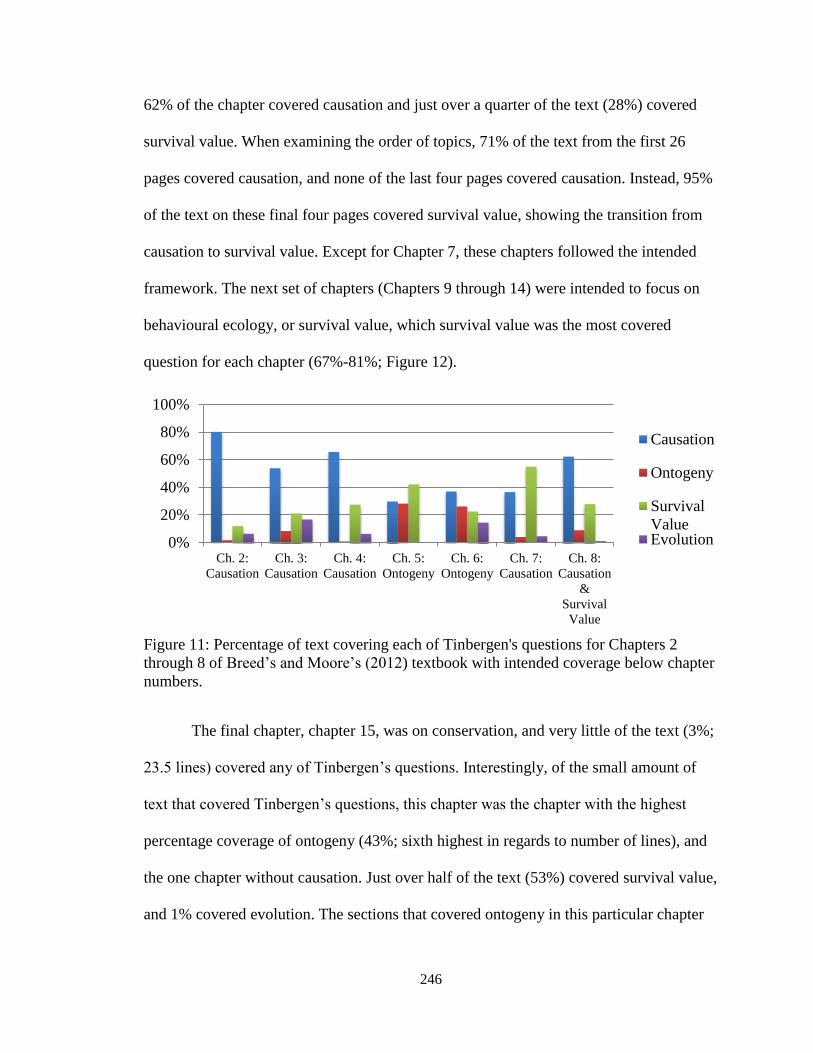
246
62% of the chapter covered causation and just over a quarter of the text (28%) covered
survival value. When examining the order of topics, 71% of the text from the first 26
pages covered causation, and none of the last four pages covered causation. Instead, 95%
of the text on these final four pages covered survival value, showing the transition from
causation to survival value. Except for Chapter 7, these chapters followed the intended
framework. The next set of chapters (Chapters 9 through 14) were intended to focus on
behavioural ecology, or survival value, which survival value was the most covered
question for each chapter (67%-81%; Figure 12).
Figure 11: Percentage of text covering each of Tinbergen's questions for Chapters 2
through 8 of Breed’s and Moore’s (2012) textbook with intended coverage below chapter
numbers.
The final chapter, chapter 15, was on conservation, and very little of the text (3%;
23.5 lines) covered any of Tinbergen’s questions. Interestingly, of the small amount of
text that covered Tinbergen’s questions, this chapter was the chapter with the highest
percentage coverage of ontogeny (43%; sixth highest in regards to number of lines), and
the one chapter without causation. Just over half of the text (53%) covered survival value,
and 1% covered evolution. The sections that covered ontogeny in this particular chapter
0%
20%
40%
60%
80%
100%
Ch. 2:
Causation
Ch. 3:
Causation
Ch. 4:
Causation
Ch. 5:
Ontogeny
Ch. 6:
Ontogeny
Ch. 7:
Causation
Ch. 8:
Causation
&
Survival
Value
Causation
Ontogeny
Survival
ValueEvolution
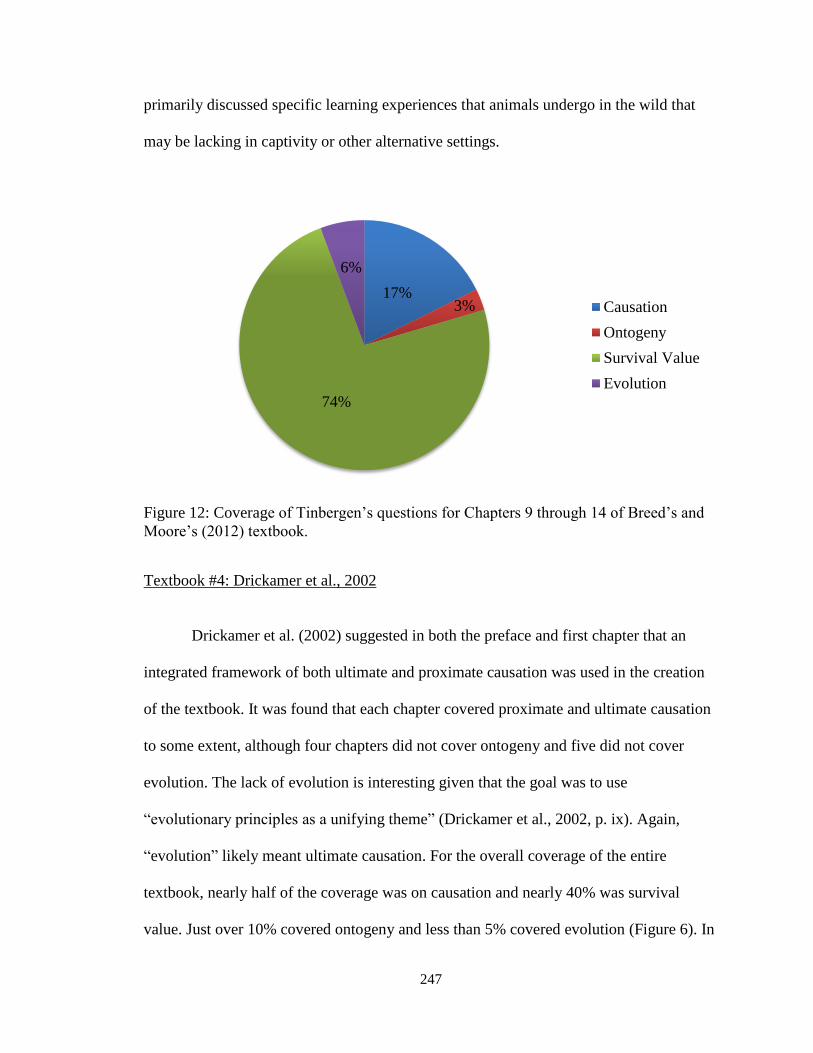
247
primarily discussed specific learning experiences that animals undergo in the wild that
may be lacking in captivity or other alternative settings.
Figure 12: Coverage of Tinbergen’s questions for Chapters 9 through 14 of Breed’s and
Moore’s (2012) textbook.
Textbook #4: Drickamer et al., 2002
Drickamer et al. (2002) suggested in both the preface and first chapter that an
integrated framework of both ultimate and proximate causation was used in the creation
of the textbook. It was found that each chapter covered proximate and ultimate causation
to some extent, although four chapters did not cover ontogeny and five did not cover
evolution. The lack of evolution is interesting given that the goal was to use
“evolutionary principles as a unifying theme” (Drickamer et al., 2002, p. ix). Again,
“evolution” likely meant ultimate causation. For the overall coverage of the entire
textbook, nearly half of the coverage was on causation and nearly 40% was survival
value. Just over 10% covered ontogeny and less than 5% covered evolution (Figure 6). In
17% 3%
74%
6%
Causation
Ontogeny
Survival Value
Evolution
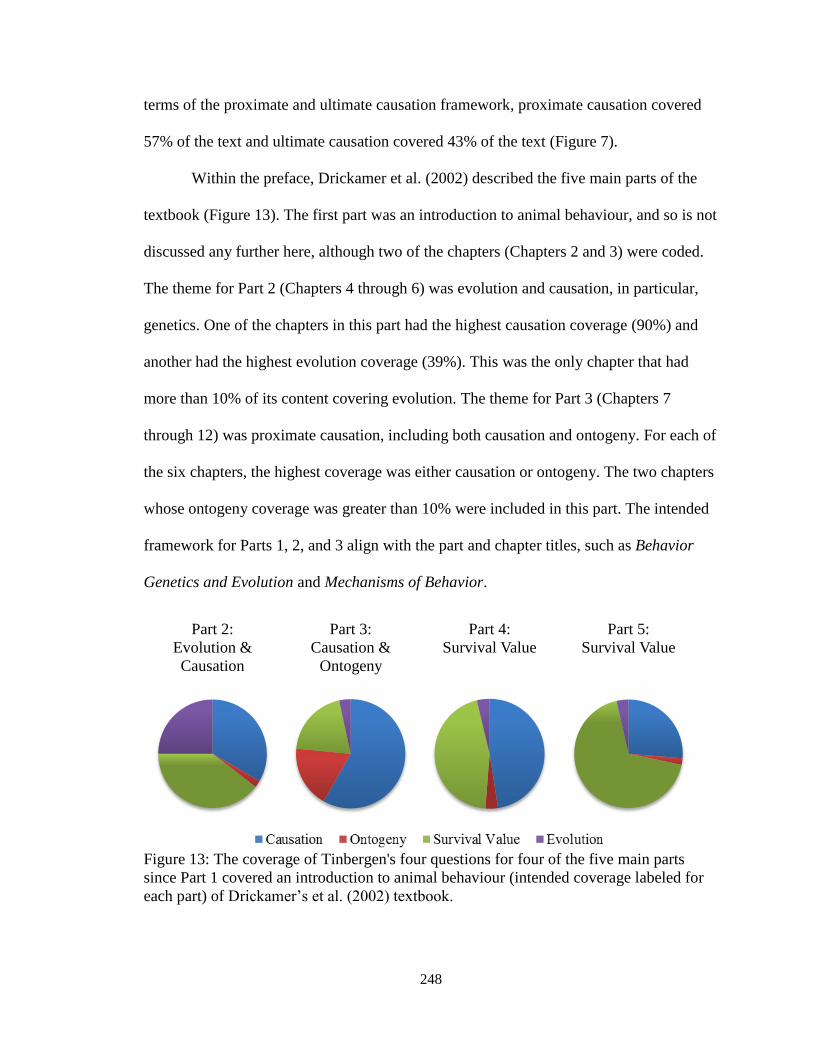
248
terms of the proximate and ultimate causation framework, proximate causation covered
57% of the text and ultimate causation covered 43% of the text (Figure 7).
Within the preface, Drickamer et al. (2002) described the five main parts of the
textbook (Figure 13). The first part was an introduction to animal behaviour, and so is not
discussed any further here, although two of the chapters (Chapters 2 and 3) were coded.
The theme for Part 2 (Chapters 4 through 6) was evolution and causation, in particular,
genetics. One of the chapters in this part had the highest causation coverage (90%) and
another had the highest evolution coverage (39%). This was the only chapter that had
more than 10% of its content covering evolution. The theme for Part 3 (Chapters 7
through 12) was proximate causation, including both causation and ontogeny. For each of
the six chapters, the highest coverage was either causation or ontogeny. The two chapters
whose ontogeny coverage was greater than 10% were included in this part. The intended
framework for Parts 1, 2, and 3 align with the part and chapter titles, such as Behavior
Genetics and Evolution and Mechanisms of Behavior.
Figure 13: The coverage of Tinbergen's four questions for four of the five main parts
since Part 1 covered an introduction to animal behaviour (intended coverage labeled for
each part) of Drickamer’s et al. (2002) textbook.
Part 2:
Evolution &
Causation
Part 3:
Causation &
Ontogeny
Part 4:
Survival Value
Part 5:
Survival Value
249
Parts 4 and 5 were both on behavioral ecology, which is traditionally survival
value. However, in Part 4, one of the three chapters covered survival value the most; in
Part 5, three of the four chapters covered survival value the most. This pattern still
occurred when ontogeny was combined with causation (proximate causation) and
evolution was combined with survival value (ultimate causation). Therefore, although
Drickamer et al. (2002) described these final two parts as behavioral ecology, when all
chapters were combined, they were actually fairly integrated. The part and chapter titles
for Parts 4 and 5 named types of behaviour, such as habitat selection, instead of
conceptual frameworks, so they cannot be used to clarify the intended conceptual
frameworks of these chapters. Moreover, although Part 4 is not primarily survival value,
it does provide a gradual transition in survival value from Part 3 to Part 5.
Textbook Comparison
All four textbooks covered all four of Tinbergen’s questions, but ontogeny and
evolution were rarely discussed. Each textbook spent 10% or less of their coded text on
evolution and less than 13% on ontogeny. Dugatkin (2013) stated in the preface that he
attempted to cover ontogeny throughout the textbook. Although the overall coverage of
ontogeny was the highest in his textbook at 12% compared to the rest of the textbooks,
two of the chapters did not at all describe ontogeny. Whereas, Breed & Moore (2012)
covered ontogeny, to some extent, in each chapter, their overall coverage was 7%.
Alcock (2013) and Drickamer et al. (2002) each had three chapters of their textbooks not
cover ontogeny at all.
250
Although evolution was often described as the framework for a textbook, such as
Alcock’s (2013) An Evolutionary Approach, Tinbergen’s evolution was rarely discussed.
Instead, it was likely that ultimate causation was actually being referenced. Ultimate
causation encompasses both evolution and survival value. In terms of Tinbergen’s
evolution, every textbook rarely explained the evolution of behaviour, with evolution
being completely neglected in some chapters. For instance, in Drickamer’s et al. (2002)
textbook evolution was not at all covered in five of the 19 chapters, Dugatkin’s (2013)
textbook did not cover evolution in two of 17 chapters, and Breed and Moore (2012) did
not cover evolution in one of 15 chapters. On the other hand, Alcock (2013) covered
evolution, to some extent, in every chapter of his textbook. All in all, in regards to
Tinbergen’s questions, none of the textbooks actually utilized an integrated approach.
All but Breed and Moore (2012) described Mayr’s proximate and ultimate
causation as being covered in the resource, and when using the proximate and ultimate
causation framework, the text appeared much more integrated. Interestingly, all but
Drickamer et al. (2002) covered ultimate causation more than proximate causation. The
most any textbook covered ultimate causation was found to be Alcock’s (2013) textbook,
which was appropriate, given the textbook title Animal Behavior: An Evolutionary
Approach. The most integrated textbooks were Drickamer et al. (2002) and Dugatkin
(2013). Drickamer’s et al. (2002) textbook coverage was 57% for proximate causation
and 43% for ultimate causation. Dugatkin’s (2013) textbook was the exact opposite: 43%
for proximate causation and 57% for ultimate causation.
Interestingly, each textbook used a similar outline, where they began with an
introduction to animal behaviour, then introduced ultimate causation (three of the four
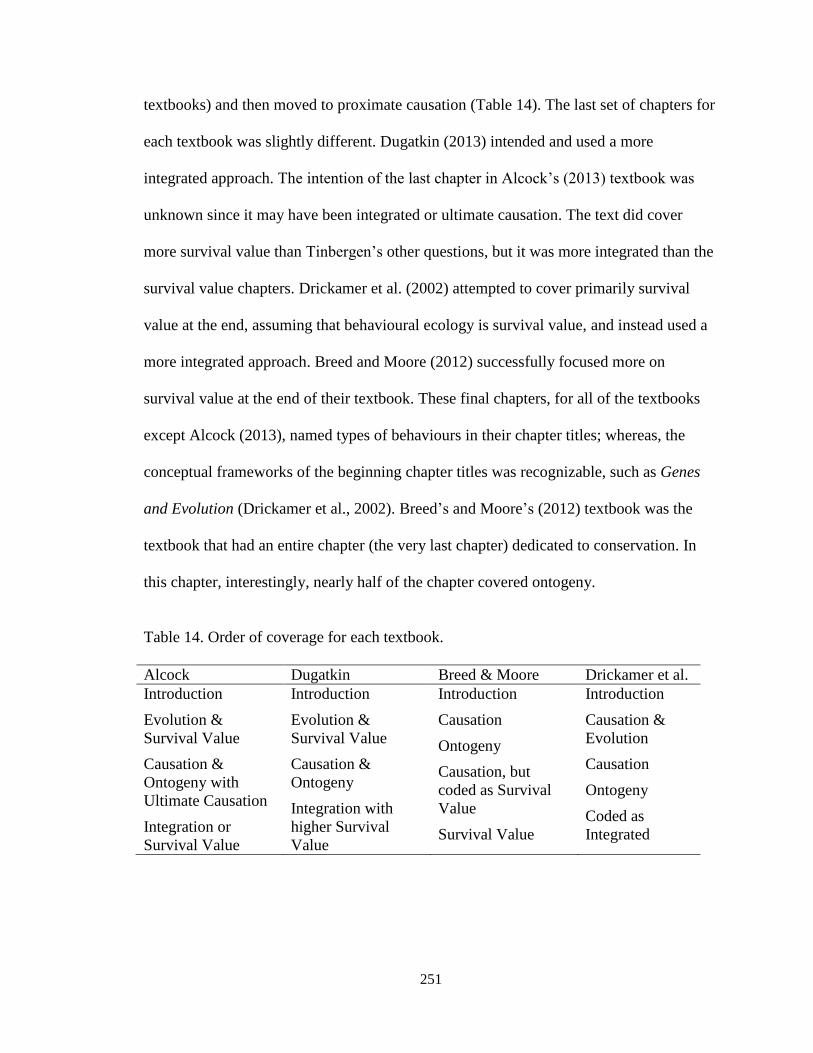
251
textbooks) and then moved to proximate causation (Table 14). The last set of chapters for
each textbook was slightly different. Dugatkin (2013) intended and used a more
integrated approach. The intention of the last chapter in Alcock’s (2013) textbook was
unknown since it may have been integrated or ultimate causation. The text did cover
more survival value than Tinbergen’s other questions, but it was more integrated than the
survival value chapters. Drickamer et al. (2002) attempted to cover primarily survival
value at the end, assuming that behavioural ecology is survival value, and instead used a
more integrated approach. Breed and Moore (2012) successfully focused more on
survival value at the end of their textbook. These final chapters, for all of the textbooks
except Alcock (2013), named types of behaviours in their chapter titles; whereas, the
conceptual frameworks of the beginning chapter titles was recognizable, such as Genes
and Evolution (Drickamer et al., 2002). Breed’s and Moore’s (2012) textbook was the
textbook that had an entire chapter (the very last chapter) dedicated to conservation. In
this chapter, interestingly, nearly half of the chapter covered ontogeny.
Table 14. Order of coverage for each textbook.
Alcock Dugatkin Breed & Moore Drickamer et al.
Introduction
Evolution &
Survival Value
Causation &
Ontogeny with
Ultimate Causation
Integration or
Survival Value
Introduction
Evolution &
Survival Value
Causation &
Ontogeny
Integration with
higher Survival
Value
Introduction
Causation
Ontogeny
Causation, but
coded as Survival
Value
Survival Value
Introduction
Causation &
Evolution
Causation
Ontogeny
Coded as
Integrated
252
Course Descriptions
Coding of the syllabi course descriptions, objectives, and goals (hereafter, simply
referred to as “syllabi” or “syllabus”) was done in order to determine the intended
framework and coverage of the courses. Nearly half (44%) of all syllabi described
proximate and ultimate causation to some extent. In regards to the coverage of
Tinbergen’s questions, 72 syllabi described evolution, 67 described survival value, 63
described causation, and 51 described ontogeny. In examining possible combinations of
Tinbergen’s questions, one-third of the syllabi explicitly intended to cover all four
questions (Table 15). For instance, one of the goals listed in a syllabus was “provide
students the opportunity to analyze behaviour according to Tinbergen’s four questions:
survival value, evolutionary history, proximate control [causation], and development
[ontogeny].” Most syllabi, however, were not this clear. For instance, “topics include …
evolution & genetics, mechanisms [causation], learning [ontogeny], [and] behavioural
ecology [survival value].” Half of the syllabi (n = 52) explained content that could be
coded as covering three or fewer of Tinbergen’s questions.
The coverage provided in 14 of the syllabi could not be coded with any of
Tinbergen’s questions, although seven of these did at least name proximate and ultimate
causation. A syllabus example that was coded as not describing course coverage since it
did not refer to any topics was “To gain a foundational understanding of animal behavior
principles. To learn to measure animal behavior in the field and to analyze and report
original findings in writing and orally.” For these syllabi, coverage was simply unclear;
Tinbergen’s questions may or may not be covered in the course. Moreover, none of the
syllabi explicitly stated that any of Tinbergen’s questions were not going to be covered,
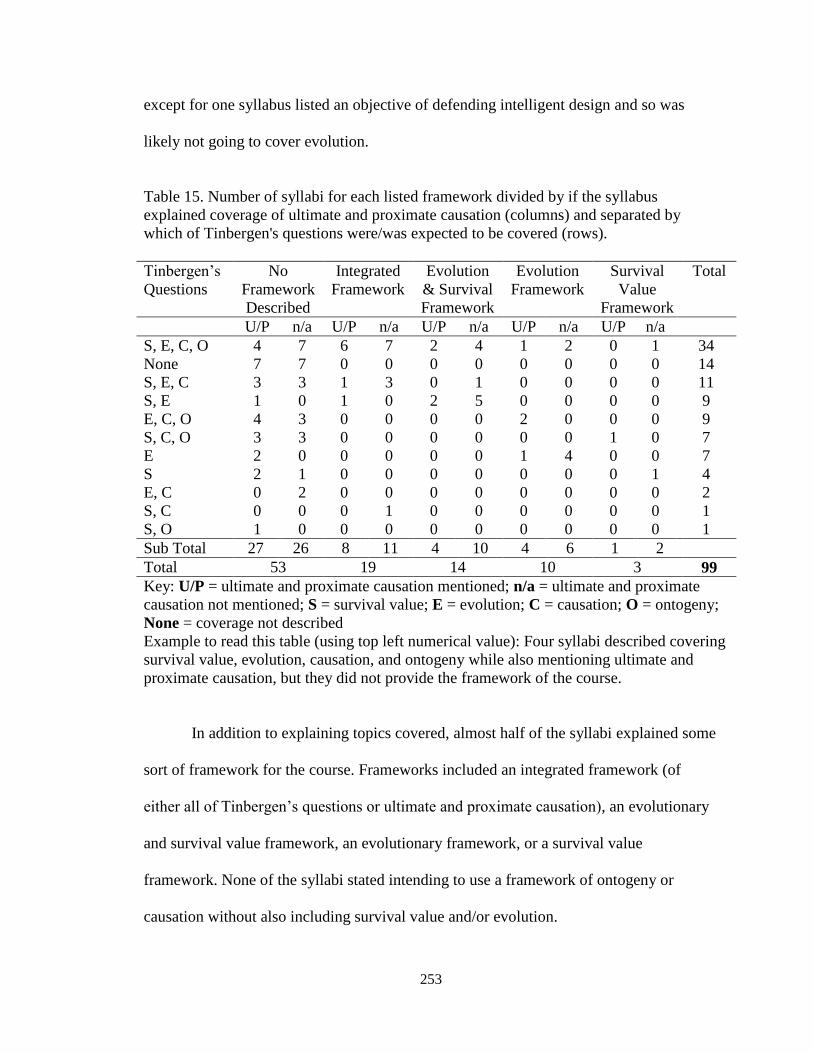
253
except for one syllabus listed an objective of defending intelligent design and so was
likely not going to cover evolution.
Table 15. Number of syllabi for each listed framework divided by if the syllabus
explained coverage of ultimate and proximate causation (columns) and separated by
which of Tinbergen's questions were/was expected to be covered (rows).
Tinbergen’s
Questions
No
Framework
Described
Integrated
Framework
Evolution
& Survival
Framework
Evolution
Framework
Survival
Value
Framework
Total
U/P n/a U/P n/a U/P n/a U/P n/a U/P n/a
S, E, C, O 4 7 6 7 2 4 1 2 0 1 34
None 7 7 0 0 0 0 0 0 0 0 14
S, E, C 3 3 1 3 0 1 0 0 0 0 11
S, E 1 0 1 0 2 5 0 0 0 0 9
E, C, O 4 3 0 0 0 0 2 0 0 0 9
S, C, O 3 3 0 0 0 0 0 0 1 0 7
E 2 0 0 0 0 0 1 4 0 0 7
S 2 1 0 0 0 0 0 0 0 1 4
E, C 0 2 0 0 0 0 0 0 0 0 2
S, C 0 0 0 1 0 0 0 0 0 0 1
S, O 1 0 0 0 0 0 0 0 0 0 1
Sub Total 27 26 8 11 4 10 4 6 1 2
Total 53 19 14 10 3 99
Key: U/P = ultimate and proximate causation mentioned; n/a = ultimate and proximate
causation not mentioned; S = survival value; E = evolution; C = causation; O = ontogeny;
None = coverage not described
Example to read this table (using top left numerical value): Four syllabi described covering
survival value, evolution, causation, and ontogeny while also mentioning ultimate and
proximate causation, but they did not provide the framework of the course.
In addition to explaining topics covered, almost half of the syllabi explained some
sort of framework for the course. Frameworks included an integrated framework (of
either all of Tinbergen’s questions or ultimate and proximate causation), an evolutionary
and survival value framework, an evolutionary framework, or a survival value
framework. None of the syllabi stated intending to use a framework of ontogeny or
causation without also including survival value and/or evolution.
254
Four of the syllabi explicitly referred to an integrated framework. One of these
syllabi listed disciplines instead of topics: “integrate the disciplines of physiology,
psychology and ethology [causation and ontogeny], ecology [survival value], and
evolution.” Four other syllabi stated ultimate and proximate causation as the framework,
with two of these syllabi explicitly covering all four questions. Seven syllabi used all four
of Tinbergen’s questions as the framework, suggesting an integrated approach.
Interestingly, one syllabus used causation and survival value, and possibly ontogeny as
the framework, excluding evolution: “ethological concepts [possibly ontogeny],
physiological mechanisms [causation], and adaptive significance [survival value] will be
emphasized.” Three other syllabi provided a survival value, evolution, and causation
framework, which one syllabus specifically referred to neurobiology and the other two
syllabi referred to physiology. These last scenarios, although excluding one of
Tinbergen’s questions in their framework, were still using both ultimate and proximate
causation as their framework. Therefore, all of the 19 courses described above are
summarized in Table 15 as “integrated framework.” Six other syllabi did not provide an
integrated framework but did list integration as a covered topic.
Fourteen syllabi intended to use a survival value (often called “ecological”) and
evolutionary framework, with one of these syllabi additionally suggesting ultimate
causation as the framework (“students will explore the science of animal behavior as
understood using current evolutionary and ecological theory … The emphasis will be on
ultimate explanations.”). Six of these syllabi covered all four of Tinbergen’s questions,
and two generalized to proximate and ultimate causation. Another syllabus described
“strategies and mechanisms,” which may refer to survival value and causation. Two
255
syllabi mentioned covering survival value and evolution, and one of these syllabi was
using a behavioural ecology textbook even though the course was titled Animal Behavior.
Three syllabi did not describe conceptual coverage.
Nine syllabi described an evolutionary framework and one syllabus suggested an
ultimate causation framework. Although ultimate causation refers to both evolution and
survival value, it is included in the analysis of an evolutionary framework because it is
likely that when most syllabi referred to “an evolutionary perspective” they were
meaning ultimate causation, not Tinbergen’s question of evolution, as was sometimes
found in the textbooks. Of these syllabi, three covered all four of Tinbergen’s questions.
One stated ultimate and proximate causation was covered, without providing any more
detail. Interestingly, two syllabi covered evolution, causation, and ontogeny, but did not
specifically reference survival value: “class sessions will explore mechanisms of
behavior, development of behavior, and evolution of behavior across a wide range of
animal taxa.” Again, “evolution” may have been referencing ultimate causation and not
Tinbergen’s evolution. If this was the case, then survival value was going to be covered
in the course; however, with the wording used, it was unclear. Four syllabi did not
describe conceptual coverage.
Three syllabi described using a survival value framework. Of these three, one
covered Tinbergen’s four questions and another did not provide a description of
coverage. The last syllabus described integration as a topic and intended to cover
proximate and ultimate causation. This syllabus referenced survival value, causation, and
ontogeny, but discussed intelligent design instead of evolution.
256
As mentioned previously, most instructors had their teaching appointment in a
biology department, but two were in psychology departments and one had a dual-
appointment in biology and psychology departments. One of these psychology instructors
intended to use an evolutionary framework. The other two did not identify a framework,
but one intended to cover all four of Tinbergen’s questions and the other intended to
cover ultimate and proximate causation, explicitly referring to survival value topics.
Therefore, although these instructors had a stronger psychology background, they did not
frame their courses around proximate causation.
Alignment within Education
Because 20 syllabi listed the most current edition of the researched textbooks, the
descriptions provided here are for all syllabi, although Table 16 distinguishes which used
the most current editions. In comparing selected frameworks and coverage with the
chosen textbooks, few trends emerged. Overall, just over half of the 99 syllabi listed
Alcock’s textbook as the primary textbook for the course. For most of the frameworks
and chosen coverage, the percentage of syllabi that listed Alcock’s textbook remained
around 50%. One exception was that 82% (9/11) of those that intended to cover survival
value, evolution, and causation, but not necessarily ontogeny selected Alcock’s textbook.
Again, Alcock (2013) had the lowest ontogeny coverage of all textbooks. Also, all three
syllabi that explained a survival value framework also named Alcock’s textbook, which
Alcock (2013) had the highest survival value coverage. These two patterns in textbook
usage do align with the course descriptions. Otherwise, no other patterns emerged, and
the other textbooks were also spread over the different frameworks and coverage.
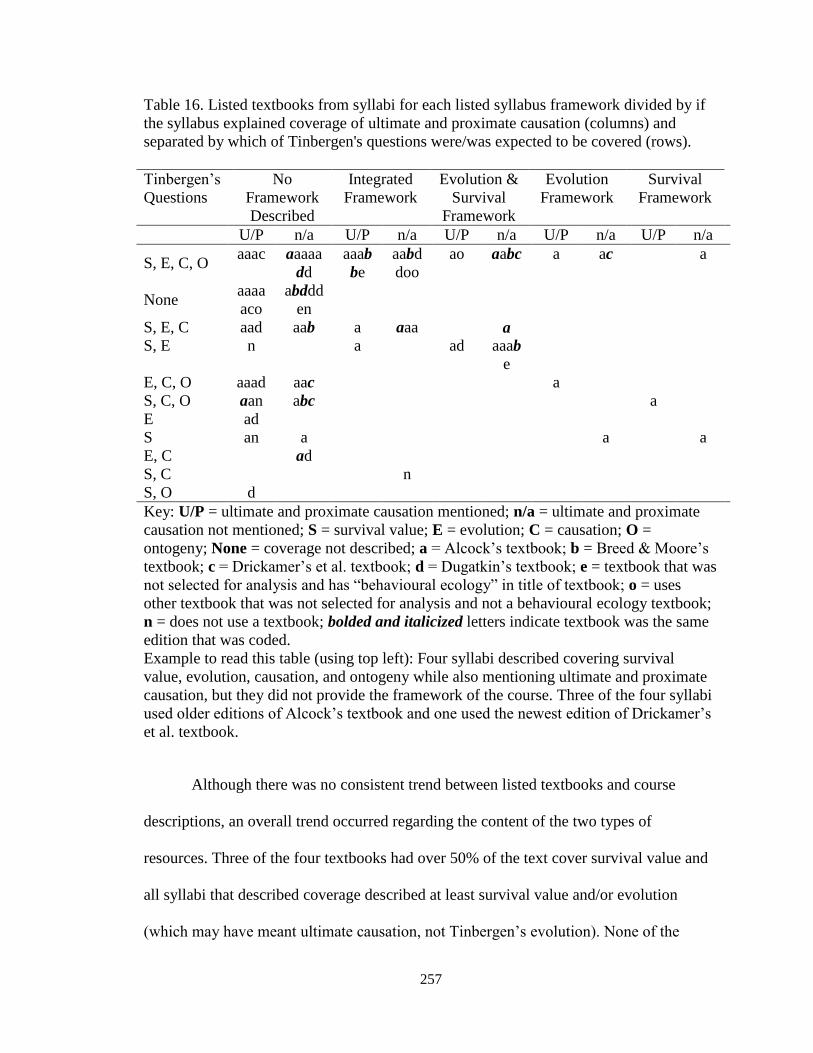
257
Table 16. Listed textbooks from syllabi for each listed syllabus framework divided by if
the syllabus explained coverage of ultimate and proximate causation (columns) and
separated by which of Tinbergen's questions were/was expected to be covered (rows).
Tinbergen’s
Questions
No
Framework
Described
Integrated
Framework
Evolution &
Survival
Framework
Evolution
Framework
Survival
Framework
U/P n/a U/P n/a U/P n/a U/P n/a U/P n/a
S, E, C, O aaac aaaaa
dd
aaab
be
aabd
doo
ao aabc a ac a
None aaaa
aco
abddd
en
S, E, C aad aab a aaa a
S, E n a ad aaab
e
E, C, O aaad aac a
S, C, O aan abc a
E ad
S an a a a
E, C ad
S, C n
S, O d
Key: U/P = ultimate and proximate causation mentioned; n/a = ultimate and proximate
causation not mentioned; S = survival value; E = evolution; C = causation; O =
ontogeny; None = coverage not described; a = Alcock’s textbook; b = Breed & Moore’s
textbook; c = Drickamer’s et al. textbook; d = Dugatkin’s textbook; e = textbook that was
not selected for analysis and has “behavioural ecology” in title of textbook; o = uses
other textbook that was not selected for analysis and not a behavioural ecology textbook;
n = does not use a textbook; bolded and italicized letters indicate textbook was the same
edition that was coded.
Example to read this table (using top left): Four syllabi described covering survival
value, evolution, causation, and ontogeny while also mentioning ultimate and proximate
causation, but they did not provide the framework of the course. Three of the four syllabi
used older editions of Alcock’s textbook and one used the newest edition of Drickamer’s
et al. textbook.
Although there was no consistent trend between listed textbooks and course
descriptions, an overall trend occurred regarding the content of the two types of
resources. Three of the four textbooks had over 50% of the text cover survival value and
all syllabi that described coverage described at least survival value and/or evolution
(which may have meant ultimate causation, not Tinbergen’s evolution). None of the
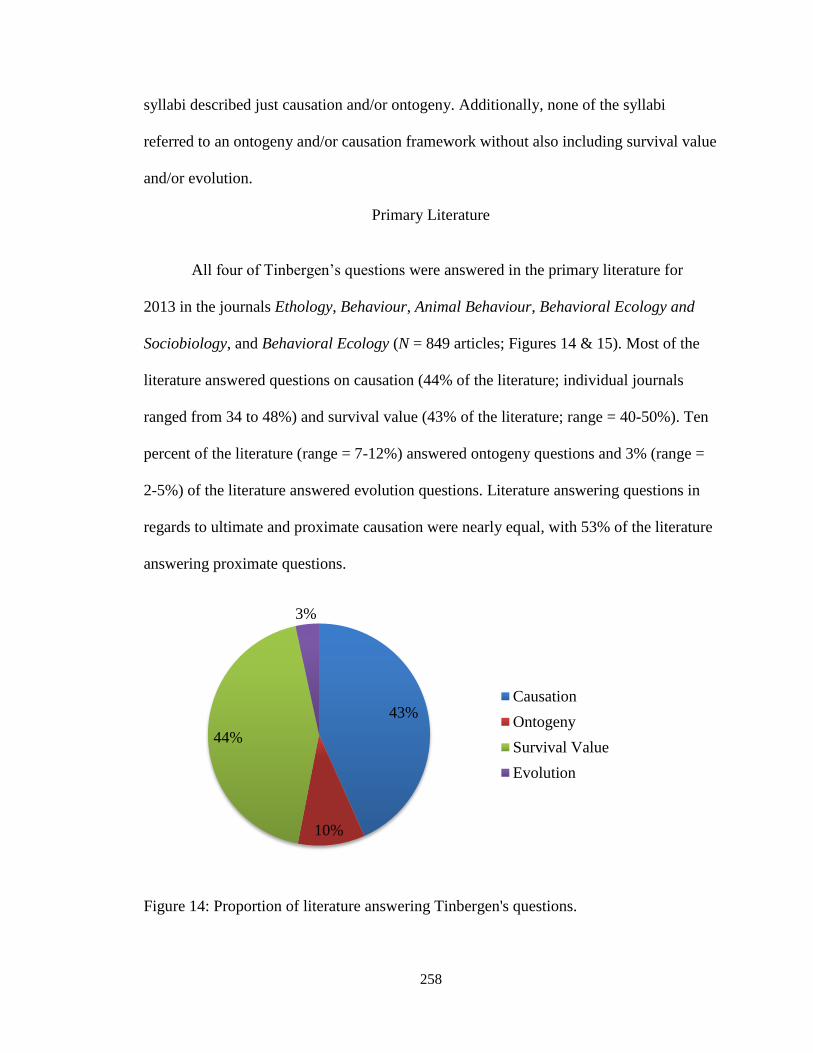
258
syllabi described just causation and/or ontogeny. Additionally, none of the syllabi
referred to an ontogeny and/or causation framework without also including survival value
and/or evolution.
Primary Literature
All four of Tinbergen’s questions were answered in the primary literature for
2013 in the journals Ethology, Behaviour, Animal Behaviour, Behavioral Ecology and
Sociobiology, and Behavioral Ecology (N = 849 articles; Figures 14 & 15). Most of the
literature answered questions on causation (44% of the literature; individual journals
ranged from 34 to 48%) and survival value (43% of the literature; range = 40-50%). Ten
percent of the literature (range = 7-12%) answered ontogeny questions and 3% (range =
2-5%) of the literature answered evolution questions. Literature answering questions in
regards to ultimate and proximate causation were nearly equal, with 53% of the literature
answering proximate questions.
Figure 14: Proportion of literature answering Tinbergen's questions.
43%
10%
44%
3%
Causation
Ontogeny
Survival Value
Evolution
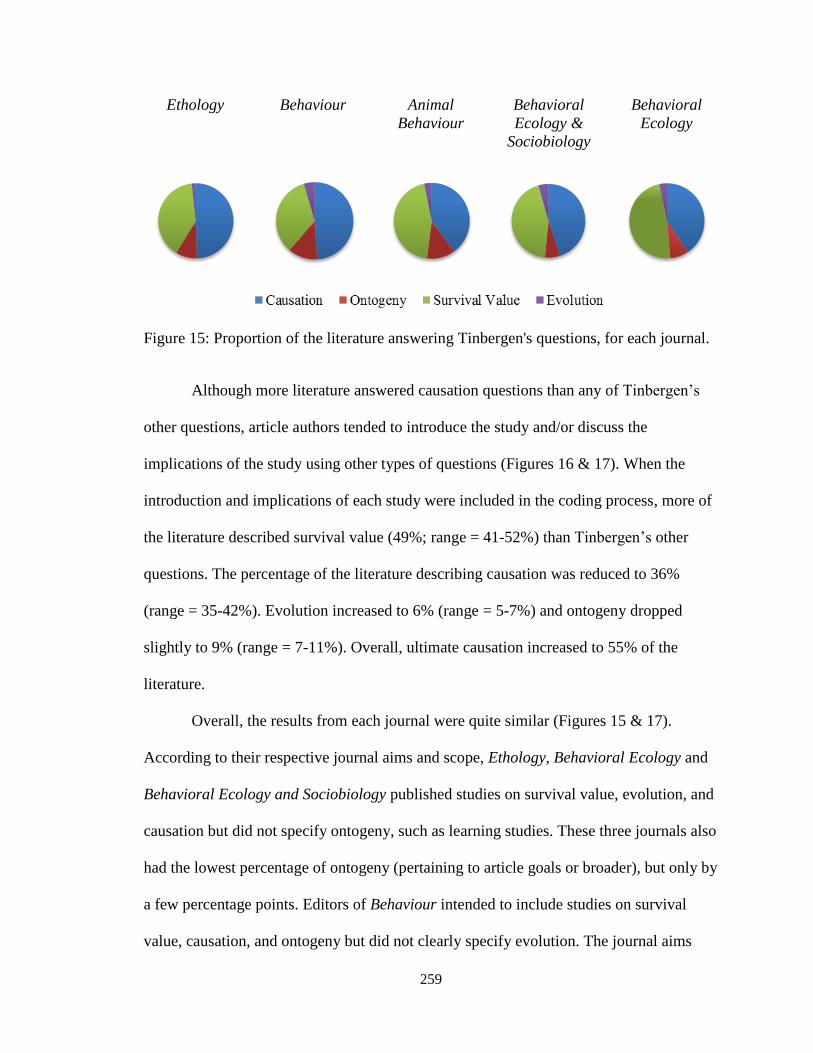
259
Ethology Behaviour Animal
Behaviour
Behavioral
Ecology &
Sociobiology
Behavioral
Ecology
Figure 15: Proportion of the literature answering Tinbergen's questions, for each journal.
Although more literature answered causation questions than any of Tinbergen’s
other questions, article authors tended to introduce the study and/or discuss the
implications of the study using other types of questions (Figures 16 & 17). When the
introduction and implications of each study were included in the coding process, more of
the literature described survival value (49%; range = 41-52%) than Tinbergen’s other
questions. The percentage of the literature describing causation was reduced to 36%
(range = 35-42%). Evolution increased to 6% (range = 5-7%) and ontogeny dropped
slightly to 9% (range = 7-11%). Overall, ultimate causation increased to 55% of the
literature.
Overall, the results from each journal were quite similar (Figures 15 & 17).
According to their respective journal aims and scope, Ethology, Behavioral Ecology and
Behavioral Ecology and Sociobiology published studies on survival value, evolution, and
causation but did not specify ontogeny, such as learning studies. These three journals also
had the lowest percentage of ontogeny (pertaining to article goals or broader), but only by
a few percentage points. Editors of Behaviour intended to include studies on survival
value, causation, and ontogeny but did not clearly specify evolution. The journal aims
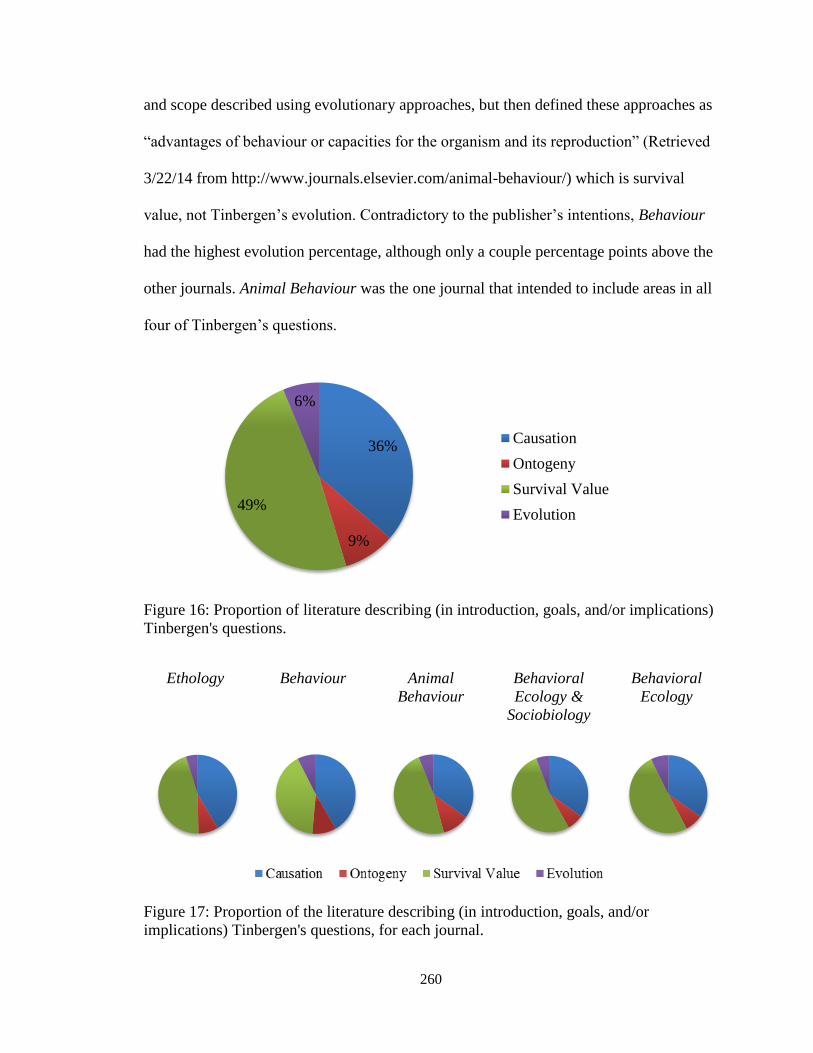
260
and scope described using evolutionary approaches, but then defined these approaches as
“advantages of behaviour or capacities for the organism and its reproduction” (Retrieved
3/22/14 from http://www.journals.elsevier.com/animal-behaviour/) which is survival
value, not Tinbergen’s evolution. Contradictory to the publisher’s intentions, Behaviour
had the highest evolution percentage, although only a couple percentage points above the
other journals. Animal Behaviour was the one journal that intended to include areas in all
four of Tinbergen’s questions.
Figure 16: Proportion of literature describing (in introduction, goals, and/or implications)
Tinbergen's questions.
Ethology Behaviour Animal
Behaviour
Behavioral
Ecology &
Sociobiology
Behavioral
Ecology
Figure 17: Proportion of the literature describing (in introduction, goals, and/or
implications) Tinbergen's questions, for each journal.
36%
9%
49%
6%
Causation
Ontogeny
Survival Value
Evolution
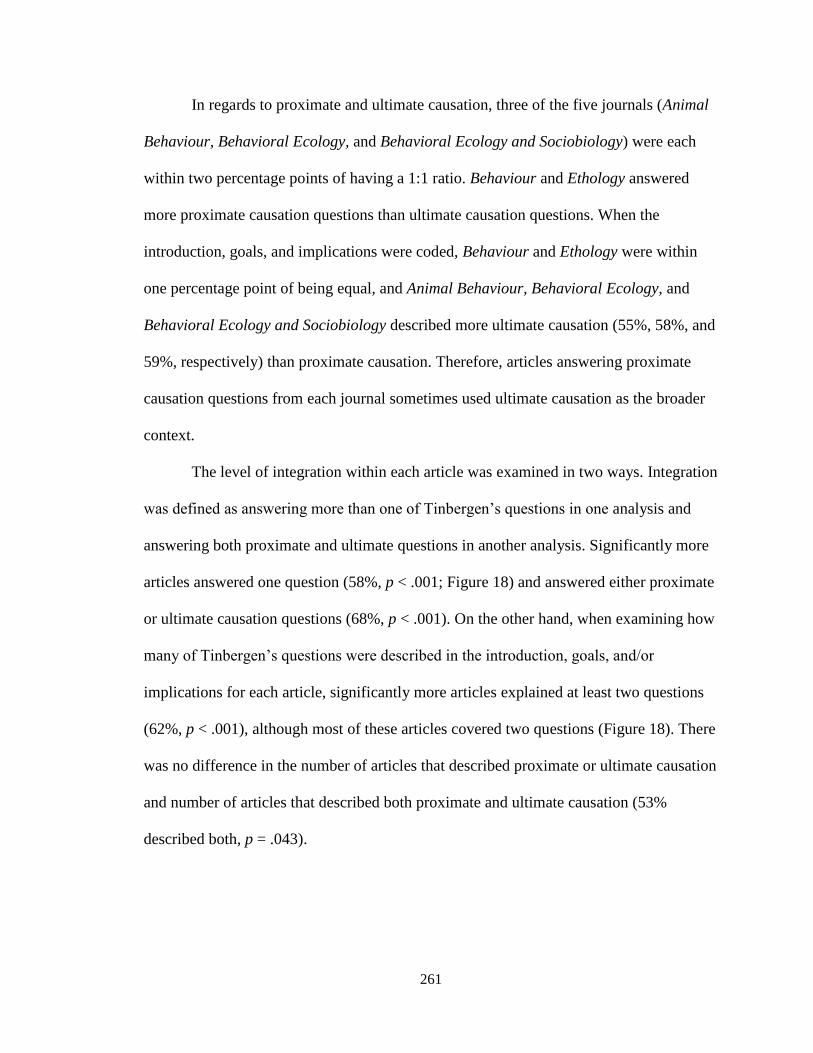
261
In regards to proximate and ultimate causation, three of the five journals (Animal
Behaviour, Behavioral Ecology, and Behavioral Ecology and Sociobiology) were each
within two percentage points of having a 1:1 ratio. Behaviour and Ethology answered
more proximate causation questions than ultimate causation questions. When the
introduction, goals, and implications were coded, Behaviour and Ethology were within
one percentage point of being equal, and Animal Behaviour, Behavioral Ecology, and
Behavioral Ecology and Sociobiology described more ultimate causation (55%, 58%, and
59%, respectively) than proximate causation. Therefore, articles answering proximate
causation questions from each journal sometimes used ultimate causation as the broader
context.
The level of integration within each article was examined in two ways. Integration
was defined as answering more than one of Tinbergen’s questions in one analysis and
answering both proximate and ultimate questions in another analysis. Significantly more
articles answered one question (58%, p < .001; Figure 18) and answered either proximate
or ultimate causation questions (68%, p < .001). On the other hand, when examining how
many of Tinbergen’s questions were described in the introduction, goals, and/or
implications for each article, significantly more articles explained at least two questions
(62%, p < .001), although most of these articles covered two questions (Figure 18). There
was no difference in the number of articles that described proximate or ultimate causation
and number of articles that described both proximate and ultimate causation (53%
described both, p = .043).
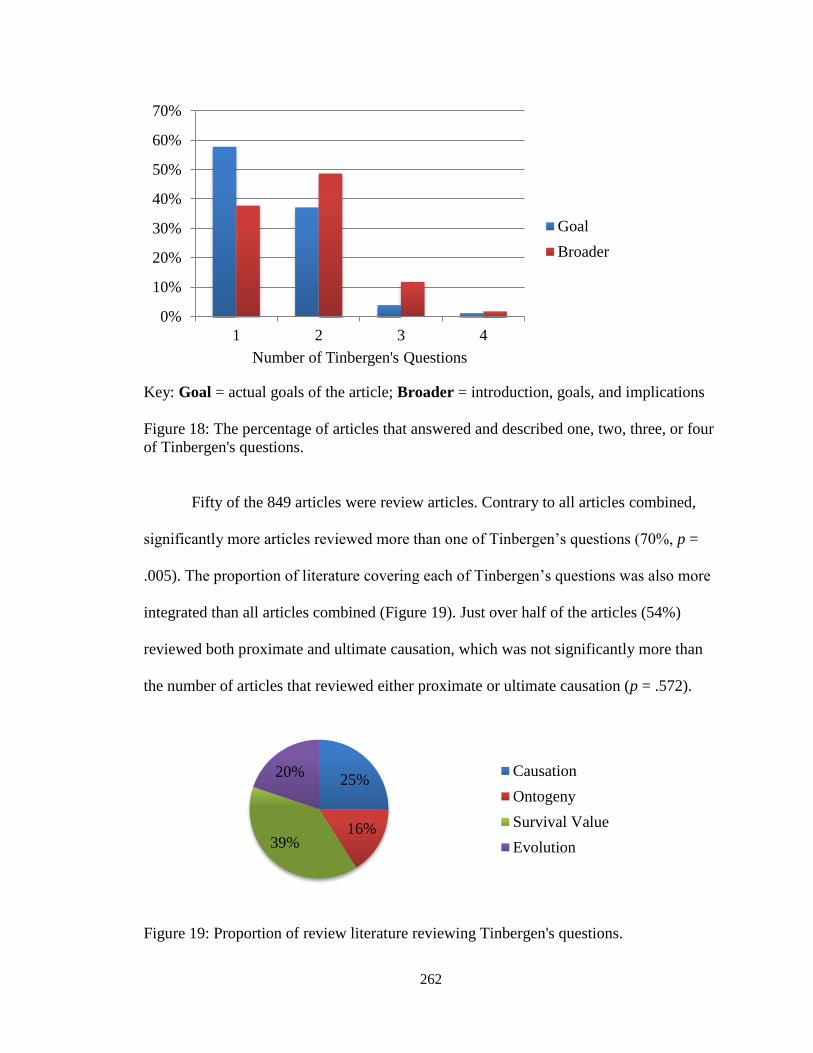
262
Key: Goal = actual goals of the article; Broader = introduction, goals, and implications
Figure 18: The percentage of articles that answered and described one, two, three, or four
of Tinbergen's questions.
Fifty of the 849 articles were review articles. Contrary to all articles combined,
significantly more articles reviewed more than one of Tinbergen’s questions (70%, p =
.005). The proportion of literature covering each of Tinbergen’s questions was also more
integrated than all articles combined (Figure 19). Just over half of the articles (54%)
reviewed both proximate and ultimate causation, which was not significantly more than
the number of articles that reviewed either proximate or ultimate causation (p = .572).
Figure 19: Proportion of review literature reviewing Tinbergen's questions.
0%
10%
20%
30%
40%
50%
60%
70%
1 2 3 4
Number of Tinbergen's Questions
Goal
Broader
25%
16% 39%
20% Causation
Ontogeny
Survival Value
Evolution
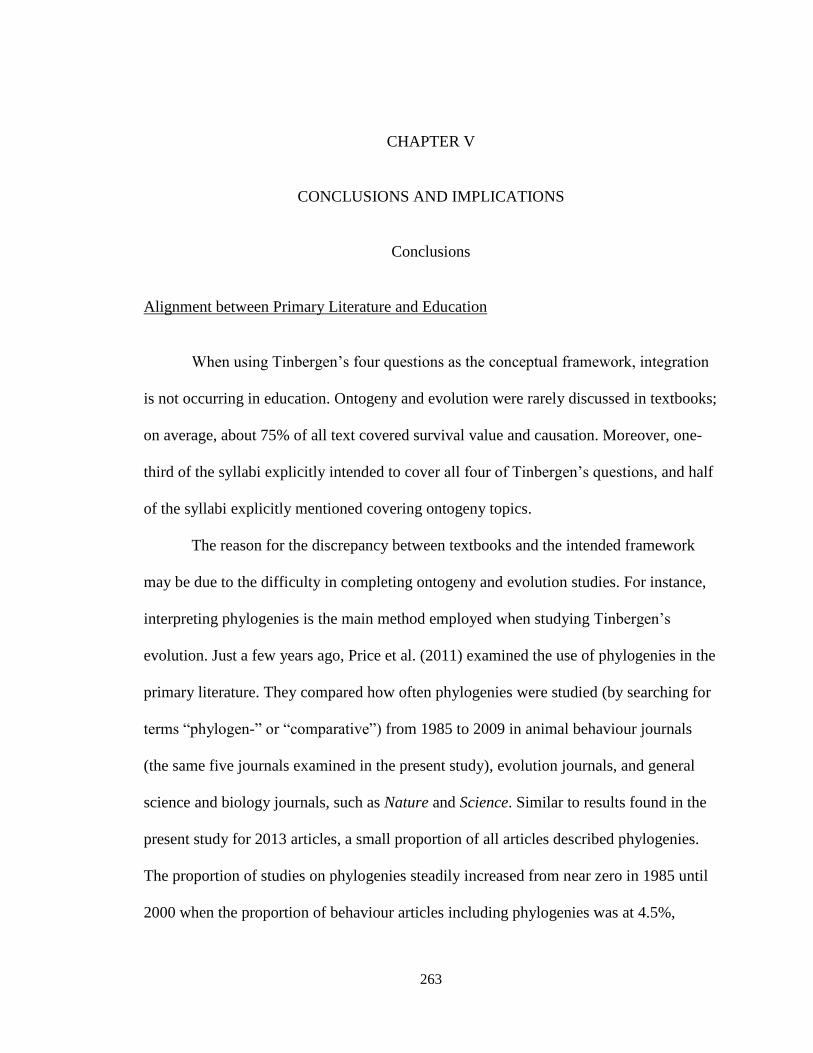
263
CHAPTER V
CONCLUSIONS AND IMPLICATIONS
Conclusions
Alignment between Primary Literature and Education
When using Tinbergen’s four questions as the conceptual framework, integration
is not occurring in education. Ontogeny and evolution were rarely discussed in textbooks;
on average, about 75% of all text covered survival value and causation. Moreover, one-
third of the syllabi explicitly intended to cover all four of Tinbergen’s questions, and half
of the syllabi explicitly mentioned covering ontogeny topics.
The reason for the discrepancy between textbooks and the intended framework
may be due to the difficulty in completing ontogeny and evolution studies. For instance,
interpreting phylogenies is the main method employed when studying Tinbergen’s
evolution. Just a few years ago, Price et al. (2011) examined the use of phylogenies in the
primary literature. They compared how often phylogenies were studied (by searching for
terms “phylogen-” or “comparative”) from 1985 to 2009 in animal behaviour journals
(the same five journals examined in the present study), evolution journals, and general
science and biology journals, such as Nature and Science. Similar to results found in the
present study for 2013 articles, a small proportion of all articles described phylogenies.
The proportion of studies on phylogenies steadily increased from near zero in 1985 until
2000 when the proportion of behaviour articles including phylogenies was at 4.5%,
264
evolution journals were at 15%, and general science and biology journals consisted of
2.5% of phylogeny studies. Since then, the proportion of articles including phylogenies
have remained fairly consistent in general science journals, has continued to rise in
evolution journals (to 20%), but has dropped in animal behaviour journals to less than
3%. In 2013, the percentage of articles covering evolution was similar to Price’s et al.
(2011) findings.
According to Price et al. (2011), the lack of studies on evolution may be due to
the limitations of phylogenetic analysis. Studying the evolution of behaviour via
phylogenies is “only as good as the phylogenies upon which they are based” (Price et al.,
2011, p. 669). Phylogenies are continually altered due to new information. Many of the
studies already completed are no longer reliable. This frustration may have resulted in a
decreased interest in evolution studies, even though the technology is improving and
becoming more reliable. On the other hand, the percentage of phylogeny studies in
evolution journals has increased. Therefore, Price et al. (2011) also suggested that the
decreased proportion of phylogeny articles being published in behaviour journals may be
a result of scientists publishing behavioural phylogeny studies in evolution journals. No
current analysis has tested this prediction. If it is accurate, then the question remains why
scientists who study the evolution of behaviour have determined that behaviour journals
are not as well suited as other journals. Additionally, since these studies are difficult to
accomplish, when they are completed, they may be published in more elite journals, such
as Nature or Science.
There is no study presently that uses Price’s et al. (2011) methods for examining
the publication of ontogeny studies. Ord et al. (2005) examined the most common key
265
terms used by 25 animal behaviour journals. Overall, the second most common term was
learning; memory and cognition were also in the top ten most commonly named key
terms. Learning, memory, and cognition studies typically use ontogeny research.
Although these terms were common, none of these terms appeared in the top 10 key
terms for the top five behaviour journals (same journals used in the present study).
Moreover, three of the five journals examined in the present study did not list learning, or
other ontogeny-related concepts, in their aims and scopes, and 10% of the literature from
2013 answered ontogeny questions. On the other hand, Ord et al. (2005) found that
learning was the most common key term for Animal Learning and Behaviour and
Behavioural Processes, both of which have lower journal impact scores than the top five
behaviour journals. This pattern suggests that studies on ontogeny are being published in
less mainstream behaviour journals. It may also be the case that they are simply not being
done. Ontogeny studies may not be completed as often as studies on causation and
survival value because they often are longitudinal studies, such as examining the effects
of experience over a lifetime, which take much more time to complete, especially on
birds and mammals. Similar to the phylogeny studies, if longitundal studies are difficult
to completed, they may also be published in more elite journals, such as Nature and
Science.
Although textbooks consistently had over three-quarters of their text cover
causation and survival value, textbooks varied on the extent of coverage of causation and
survival value. Three of the four textbooks covered more survival value than causation.
Alcock’s (2013) textbook was the most extreme textbook with over 60% of the text
covering survival value and just over one-quarter covering causation. Dugatkin’s (2013)
266
textbook and Breed’s and Moore’s (2012) textbook had just over half of the text cover
survival value and about one-third cover causation. Nearly the opposite occurred in
Drickamer’s et al. (2002) textbook. Drickamer’s et al. textbook may have had a different
emphasis from the rest either because it was 10 years older or because of Drickamer’s
research experience. According to the trends described in Chapter 1, the difference is
likely because of Drickamer’s research experience.
Similar to textbooks, journals also varied in their percentages of literature
answering causation or survival value questions, although the variation was not as
extreme as seen in the textbooks. Two of the five journals answered more survival value
than causation questions: Animal Behaviour and Behavioral Ecology. Since the discipline
of behavioural ecology traditionally asks survival value questions it is not surprising that
Behavioral Ecology had more survival value articles; however, 41% of the literature still
answered causation questions. Moreover, Behavioral Ecology and Sociobiology was
nearly equal in answering causation (45%) and survival value (44%) questions.
Therefore, the discipline of behavioural ecology may be undergoing a transition and
utilizing more causation questions, as suggested by Dawkins (2013) and Taborsky
(2014). This idea is also supported by Drickamer’s et al. (2002) textbook. The last two
parts of the textbook were both intended to cover behavioural ecology. While one of the
parts primarily covered survival value, the other part was nearly equal between survival
value and causation.
Overall, most published studies in mainstream animal behaviour journals
answered survival value or causation questions, although more often than not, an
integrated approach was done when examining the broader context. This integrated
267
approach typically included applying the study to one additional question. Review
articles, on the other hand were fairly integrated. Each of Tinbergen’s questions was
reviewed in more than 15% of the review literature. Therefore, although most studies
address either survival value or causation, a more integrated approach is being taken
when reviewing behaviour. This pattern suggests that scientists are recognizing the
importance of all four questions.
Mayr’s Proximate and Ultimate Causation Framework
Although Tinbergen’s four questions are not utilized equally in education or the
primary literature, a more integrated approach was found while utilizing Mayr’s
proximate and ultimate causation framework since proximate causation encompasses
causation and ontogeny and ultimate causation includes survival value and evolution.
This pattern is likely why most studies on behavioural trends have used Mayr’s
proximate and ultimate causation framework instead of Tinbergen’s four questions
framework, as Hogan (2009) admitted. Therefore, the present study is compared to
previous studies on overall behavioural trends using the proximate and ultimate causation
framework.
In textbooks, with the exception of Alcock’s textbook, the division between
proximate and ultimate causation was between 40-60%. Alcock’s textbook was one-third
proximate causation and two-thirds ultimate causation. According to an article published
by Alcock (2003), the first animal behaviour textbooks covered primarily proximate
causation with little coverage of ultimate causation. Then in mid-1970 when sexual and
natural selection theories were becoming more popular in the literature, textbooks began
268
to change. Alcock’s first textbook was published in 1975 and, according to his 2003
article, was one of the first to emphasize ultimate causation. Similar trends have been
discovered in the primary literature. In mid-1970, the number of ultimate causation
published studies began to increase (Hogan, 2009; Ord et al., 2005).
Although it has been established that questions regarding ultimate causation were
studied more often beginning in mid-1970, the current condition is unclear. Alcock
(2003) suggested that after a rise in ultimate causation, proximate causation studies still
remained due to an increased interest in neuroethology as well as new technologies
available to study proximate questions. The rise in proximate causation studies may also
be due to an increased interest in conservation. One concern in conservation is how
environmental and anthropogenic effects cause variation in behaviour. Ord et al. (2005)
and Hogan (2009) also agreed that a more integrated framework, at least in regards to
proximate and ultimate causation, is currently being utilized. However, Hogan (2009)
suggested that studies on causation are being published in journals besides Animal
Behaviour since he found that about 20% of articles in this journal for 2003 asked
proximate causation questions. On the other hand, the present study found that in 2013,
52% of the literature published in Animal Behaviour was actually proximate causation
and 48% was ultimate causation, suggesting that proximate causation studies are being
published in mainstream behaviour journals. Contrary to the findings of the present study,
some authors have anecdotally suggested that survival value continues to be the most
commonly researched question (e.g., Bateson & Laland, 2013b).
Although proximate and ultimate causation is commonly used as a framework,
several issues have been described in regards to implementing this framework for the
269
discipline of animal behaviour. For instance, it implies that everything studied is a cause,
but functions of behaviours are actually consequences (Francis 1990). Students can also
be confused by the language since “ultimate” appears to be more important than
“proximate,” when, in reality, both types are equally important (Dewsbury, 1992, 1994).
Additionally, each of the four questions requires different types of evidence and,
therefore, methods, and so should not be included in the same categories (Dawkins,
2013). It has even been suggested that using the proximate and ultimate causation
framework promotes separation of the discipline (Dewsbury, 1994; Laland et al., 2013)
and a lack of connection of animal behaviour to other disciplines (Laland et al., 2011). In
fact, although Tinbergen (1963) did not mention Mayr’s (1961) proximate and ultimate
causation framework in his famous paper, he found the integrated use of the four
questions necessary in order to prevent the discipline from dividing and to bring the
disciplines of psychology and physiology closer together.
There is another issue with the use of the proximate and ultimate causation
framework. In the present study, it was found that the use of the proximate and ultimate
causation framework suggests that an integrated approach is being utilized. Therefore, if
the discipline of animal behaviour continues to use the proximate and ultimate causation
framework, ontogeny and evolution studies will continue to be neglected. By utilizing all
four of Tinbergen’s questions, a richer awareness of any behaviour is gained. Moreover,
these four questions are not isolated; each question, including ontogeny and evolution
questions, can provide a deeper understanding or new hypotheses of the other questions
(Bateson & Laland, 2013; Taborsky, 2014). For instance, in only utilizing survival value,
it is implied that a behaviour exists because of its current function. However, in studying
270
its evolutionary history as well, it might be found that a behaviour exists due to a
previous function and in its current state may even be maladaptive (Bateson & Laland,
2013). Additionally, studying any behaviour, while neglecting ontogeny, may reveal false
patterns. For instance, a behaviour may serve multiple functions during the lifetime of an
organism, or may not exist during certain stages of life. The causes of a behaviour, such
as which environmental cues are important, may also vary during an organism’s lifetime.
Therefore, all four of these questions are necessary in order to have a deeper
understanding of any behaviour. With the continued use of the proximate and ultimate
causation framework, this deeper understanding will continue to be lacking.
Another issue with using the proximate and ultimate causation framework is that
it promotes the confusion on the meaning of evolution. This issue was observed in many
of the course descriptions and textbook titles, prefaces, and first chapters. For instance,
Alcock’s textbook title, Animal Behavior: An Evolutionary Approach is actually referring
to ultimate causation, not Tinbergen’s evolution. Moreover, five syllabi explicitly
described using an evolutionary framework, although it is unlikely that a phylogenetic
framework would be the basis of the course, given the lack of available studies. If the
proximate and ultimate causation framework is continually utilized, the term ‘evolution’
can mean how the behaviour has evolved over generations as well as any potential
adaptive significance of the behaviour. On the other hand, in using Tinbergen’s
conceptual framework, evolution simply refers to how behaviour has changed over time.
All in all, behavioural studies on evolution and ontogeny are not being completed
as often as other studies, are being published in less mainstream animal behaviour
journals, or are being published in journals that are not specific to animal behaviour. If
271
the proximate and ultimate causation framework is continued to be used in the discipline
of animal behaviour, then these studies will continue to be lacking. If, instead,
Tinbergen’s four questions are continually promoted, then a richer understanding of
behaviour can occur. As seen by the more integrated use of Tinbergen’s questions in
review articles as well as the multiple essays published in 2013, in celebration of the 50th
anniversary of Tinbergen’s On Aims and Methods in Ethology, the discipline of animal
behaviour has a bright future.
Implications
Implications for Animal Behaviour Curriculum Developers
Animal behaviour textbooks are aligned with the primary literature. However,
since the animal behaviour primary literature and textbooks have little content on
evolution and ontogeny, the question remains if textbook frameworks should undergo a
change.
As Alcock (2003) described, the first animal behaviour textbooks focused on
proximate causation. The first edition of his textbook, published in 1975, was one of the
first to focus on ultimate causation, and he even titled the book Animal Behavior: An
Evolutionary Approach to emphasize this point. Having a textbook focused on ultimate
causation was essential in order to have more scientists studying ultimate causation in the
next generation. Fortunately, ultimate causation has become well established and
accepted in the behaviour community of today. Now that both survival value and
causation are thriving fields of study, it is time to focus on Tinbergen’s other vision: an
integrated framework of causation, ontogeny, survival value, and evolution. It is possible
272
that a change in textbook frameworks helped to change the direction of the discipline.
Now, it is time for another change. Although some textbooks are attempting, and
succeeding, to use an integrated framework of proximate and ultimate causation, it is
time to develop textbooks that emphasize and represent an integrated framework of all
four of Tinbergen’s questions. The proximate and ultimate causation framework should
be avoided in order to establish the importance of evolution and ontogeny studies.
Dugatkin (2013) attempted to provide an integrated framework in the last set of
chapters of his textbook, still with a survival value emphasis. It was on the right track
with one-quarter of the text in these chapters covering causation, 8% covering ontogeny,
and 5% covering evolution. Now that survival value and causation questions are being
fairly evenly answered in mainstream animal behaviour journals, there should no longer
be an emphasis on survival value with integration as intended. On the other hand, it may
be more difficult to include evolution and ontogeny publications. As suggested by Price
et al. (2011) and discovered in Ord et al’s (2005) results, some of these studies may be
published in less mainstream behaviour journals or in journals that are not specific to
animal behaviour. Therefore, it is essential to review literature outside of the main animal
behaviour journals, in order to find these “missing” studies.
Moreover, there are two definitions of evolution. In order to reduce confusion, it
is important that concepts are clearly defined in textbooks, and the definition remains
consistent throughout the resource (Flodin, 2009). This step can be accomplished by
consistently utilizing Tinbergen’s definition of evolution.
273
Implications for Animal Behaviour Instructors
In the present study, the utilized conceptual framework of textbooks was
compared to the intended conceptual framework. It was found that, overall, the text
aligned with the intended framework of each textbook. Therefore, when instructors are
choosing textbooks, they should be able to accurately infer the conceptual framework by
reading the preface and introductory chapter of the textbook. The chosen textbook, if any
is chosen, should align with which conceptual framework instructors are interested in
teaching.
If animal behaviour instructors are interested in teaching the current state of the
discipline, then textbooks are relevant curricular resources. On the other hand, it is
recommended that an integrated framework of Tinbergen’s four questions be taught in
order to increase the number of future scientists studying evolution and ontogeny of
behaviour and confidently submitting these articles for publication in animal behaviour
mainstream journals. Unfortunately, in this case, textbooks cannot be the only curricular
resource. Even if textbook authors and publishers decide to publish integrated textbooks,
changes cannot happen immediately. In the meantime, instructors are going to have to
pull in outside resources apart from the textbook, such as from the primary literature
apart from mainstream behaviour journals, in order to teach the next generation of
researchers an integrated framework and promote studies that answer evolution and
ontogeny questions.
Similar to textbook authors and publishers, it is also important for teachers to use
the term ‘evolution’ consistently. If Tinbergen’s integrated framework is the basis of the
course, then evolution should refer to Tinbergen’s evolution, not ultimate causation.

274
Another way to prevent confusion is to refer to Tinbergen’s evolution as phylogeny
(Nesse, 2013).
Implications for Science Education Researchers
The American Association for the Advancement of Science (AAAS, 2010) stated
in their Vision and Change in Undergraduate Biology Education report that alignment
between biological undergraduate education and current research should exist. The
National Research Council Committee (U.S.) on Undergraduate Biology Education to
Prepare Research Scientists for the 21st
Century (2003) suggested that biology curricula
are not portraying current biological research frameworks and methods and instead are
teaching future biologists biology geared toward the past. However, there is little
evidence available supporting the claim that the frameworks in biological resources do
not align with the primary literature. Previous studies on college biology textbooks, for
instance, have primarily examined specific topics such as aging (Krupka et al., 1980),
Down syndrome (Bordson & Bennett, 1983), and pneumococcal type transformation
(Baxby, 1989) instead of the discipline’s fundamentals, such as cell theory.
Therefore, the present study examined the conceptual framework of a sub-
discipline of biology, animal behaviour. Moreover, in examining textbooks and even a
wide variety of curricular resources, no consistent methodology was applied. Because of
this dilemma, before the current study could begin, a reliable and valid methodology was
developed. This methodology could potentially be used for future research on content
analysis.
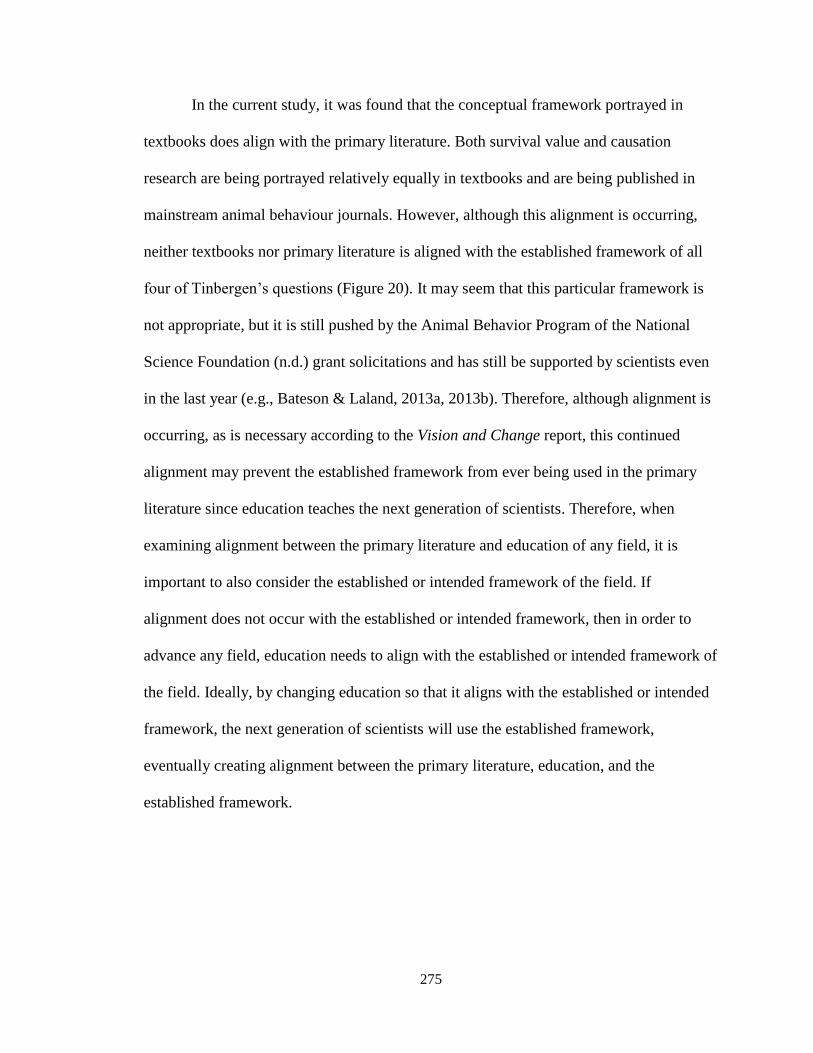
275
In the current study, it was found that the conceptual framework portrayed in
textbooks does align with the primary literature. Both survival value and causation
research are being portrayed relatively equally in textbooks and are being published in
mainstream animal behaviour journals. However, although this alignment is occurring,
neither textbooks nor primary literature is aligned with the established framework of all
four of Tinbergen’s questions (Figure 20). It may seem that this particular framework is
not appropriate, but it is still pushed by the Animal Behavior Program of the National
Science Foundation (n.d.) grant solicitations and has still be supported by scientists even
in the last year (e.g., Bateson & Laland, 2013a, 2013b). Therefore, although alignment is
occurring, as is necessary according to the Vision and Change report, this continued
alignment may prevent the established framework from ever being used in the primary
literature since education teaches the next generation of scientists. Therefore, when
examining alignment between the primary literature and education of any field, it is
important to also consider the established or intended framework of the field. If
alignment does not occur with the established or intended framework, then in order to
advance any field, education needs to align with the established or intended framework of
the field. Ideally, by changing education so that it aligns with the established or intended
framework, the next generation of scientists will use the established framework,
eventually creating alignment between the primary literature, education, and the
established framework.
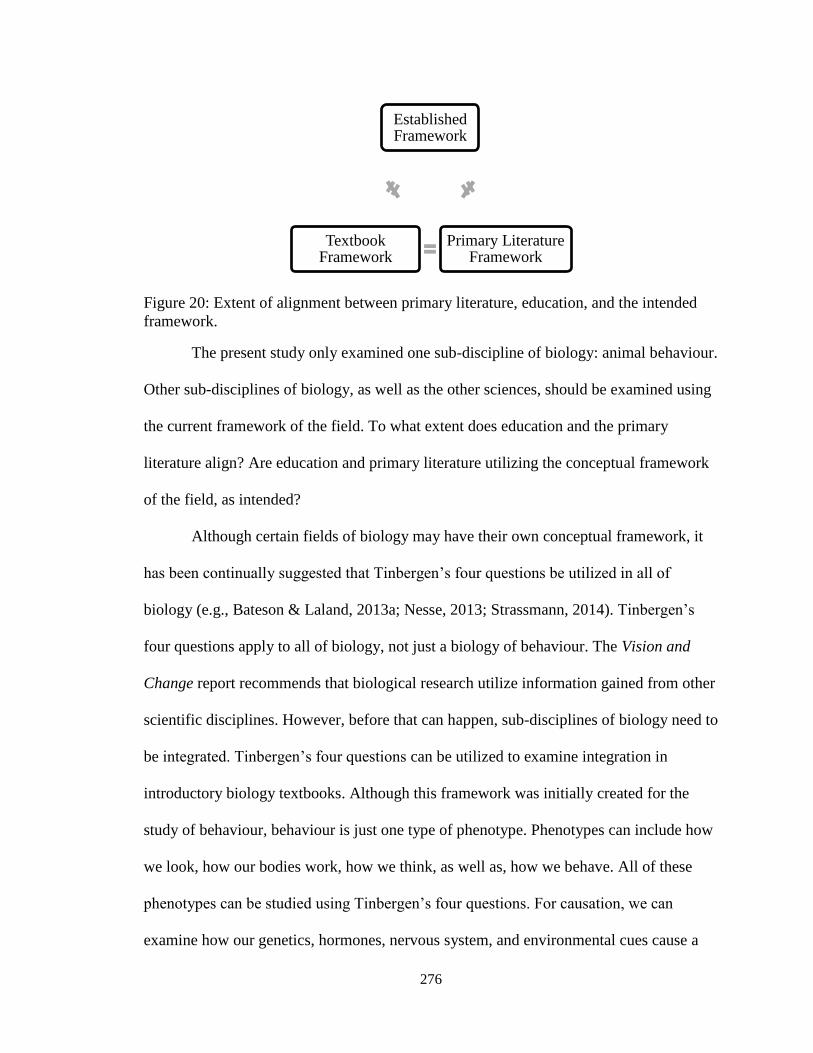
276
Figure 20: Extent of alignment between primary literature, education, and the intended
framework.
The present study only examined one sub-discipline of biology: animal behaviour.
Other sub-disciplines of biology, as well as the other sciences, should be examined using
the current framework of the field. To what extent does education and the primary
literature align? Are education and primary literature utilizing the conceptual framework
of the field, as intended?
Although certain fields of biology may have their own conceptual framework, it
has been continually suggested that Tinbergen’s four questions be utilized in all of
biology (e.g., Bateson & Laland, 2013a; Nesse, 2013; Strassmann, 2014). Tinbergen’s
four questions apply to all of biology, not just a biology of behaviour. The Vision and
Change report recommends that biological research utilize information gained from other
scientific disciplines. However, before that can happen, sub-disciplines of biology need to
be integrated. Tinbergen’s four questions can be utilized to examine integration in
introductory biology textbooks. Although this framework was initially created for the
study of behaviour, behaviour is just one type of phenotype. Phenotypes can include how
we look, how our bodies work, how we think, as well as, how we behave. All of these
phenotypes can be studied using Tinbergen’s four questions. For causation, we can
examine how our genetics, hormones, nervous system, and environmental cues cause a
Established Framework
Primary Literature Framework
Textbook Framework
277
particular phenotype. Moreover, we can examine the ontogeny of phenotypes by
examining how phenotypes vary over a life span. We can examine the evolution of a
phenotype by examining how it has changed or remained consistent through evolutionary
time. Additionally, we can examine the function of particular phenotypes, whether they
enhance our survival, reproductive success, or both.
The results of this study have provided several more research questions, some of
which can use similar methods that the present study tested. These research questions are
described below.
Which topics are being covered with an integrated framework?
Although textbooks, overall, primarily focused on causation and survival value,
were there some topics that were described using all four of Tinbergen’s questions?
Do textbook discussion questions reflect the conceptual framework of the
corresponding sections, and do end-of-chapter summaries and questions reflect the
conceptual framework of their corresponding chapter?
The present study examined the text of four popular animal behaviour textbooks.
Now that the framework of the actual text has been determined, to what extent do
discussion questions and summaries relate to their relevant text?
Which curricular resources are being utilized, and to what extent, in animal
behaviour courses?
In the present study, six courses did not require a textbook and several others only
recommended a textbook. Moreover, if instructors want to use an integrated framework
of Tinbergen’s four questions, they need to use additional resources. Which curricular
resources are instructors using? To what extent is the primary literature used in the
278
classroom and from which journals? Are other resources, such as videos, also being
used?
To what extent are animal behaviour laboratory manuals using an integrated
approach?
Several of the sampled courses contained a laboratory component. Which
exercises/manuals are most commonly used? Are students practicing all four of
Tinbergen’s questions in the lab?
To what extent are animal behaviour videos portraying each of Tinbergen’s
questions?
Although textbooks are primarily covering causation and survival value, is this
pattern also true for videos that are available for animal behaviour? Does each of
Tinbergen’s questions lend itself to being viewed in videos or are only certain questions
more easily explained via videos?
To what extent are animal behaviour phylogeny studies being published in non-
behaviour journals?
Price et al. (2011) found that the proportion of articles in animal behaviour
journals that describe phylogeny studies has decreased. He suggested that some of these
studies are being published in evolution journals instead. Is this pattern correct, or are
evolution studies on behaviour not occurring?
To what extent has the role of conservation impacted the utilized conceptual
framework?
There has been an increased interest in conservation. Breed and Moore (2012)
even dedicated an entire chapter to conservation. What impact has this had on the utilized
279
conceptual framework? This question could be studied by examining which of
Tinbergen’s questions are being answered in articles that use conservation topics to frame
their study.
To what extent are behavioural ecology textbooks using an integrated
approach?
As observed in the present study, and suggested by Dawkins (2013) and Taborsky
(2014), behavioural ecology, which traditionally answers primarily survival value
questions, is beginning to incorporate causation questions as well. Is this trend also
occurring in behavioural ecology textbooks? What is the theoretical difference between
animal behaviour and behavioural ecology textbooks?
To what extent are introductory biology textbooks using an integrated
approach?
Introductory biology textbooks, whether for secondary or college students, should
be providing students an integrated view of biology. There is a strong push to incorporate
other science or math fields into biology courses (AAAS, 2010), but before studying that
level of integration, it should first be examined if an integrated framework of biology is
being applied. Since Tinbergen’s four questions can provide a complete overview of any
phenotype, not just behavioural phenotypes, it is the ideal framework to study the
integration of biology.
280
REFERENCES
Abell, S. K., & Lederman, N. G. (Eds.). (2008). Handbook of research on science
education. New York, NY: Routledge.
Aegerter-Wilmsen, T., Hartog, R., & Bisseling, T. (2003). Web-based learning support
for experimental design in molecular biology: A top-down approach. Journal of
Interactive Learning Research, 14(3), 301-314.
Alcock, J. (2003). A textbook history of animal behaviour. Animal Behaviour, 65, 3-10.
Alcock, J. (2013). Animal behavior: An evolutionary approach (10th
ed.). Sunderland,
MA: Sinauer Associates, Inc.
American Association for the Advancement of Science, AAAS. (2010). Vision and
change: A call to action. Washington, D.C.: AAAS. Retrieved from
http://visionandchange.org/?s=vision+and+change+a+call+to+action
Auerbach, C. F., & Silverstein, L. B. (2003). Qualitative data: An introduction to coding
and analysis. New York, NY: New York University Press.
Barrett, L., Blumstein, D. T., Clutton-Brock, T. H., & Kappeler, P. M. (2013). Taking
note of Tinbergen, or: The promise of a biology of behaviour. Philosophical
Transactions of The Royal Society, 368, 20120352.
Barsoum, M. J., Sellers, P. J., Campbell, A. M., Heyer, L. J., & Paradise, C. J. (2013).
Implementing recommendations for introductory biology by writing a new
textbook. CBE- Life Sciences Education, 12, 106-116.
Basey, J. M., Mendelow, T. N., & Ramos, C. N. (2000). Current trends of community
college lab curricula in biology: An analysis of inquiry, technology, and content.
Journal of Biological Education, 34(2), 80-86.
Bateson, P., & Laland, K. N. (2013a). On current utility and adaptive significance: A
response to Nesse. Trends in Ecology & Evolution, 28(12), 682-683.
Bateson, P., & Laland, K. N. (2013b). Tinbergen’s four questions: An update. Trends in
Ecology and Evolution, 1757, 1-7.
Bauer-Dantoin, A. C., & Hanke, C. J. (2007). Using a classic paper by I. E. Lawton and
N. B. Schwartz to consider the array of factors that control luteinizing hormone
production. Advances in Physiology Education, 31, 318-322.
Baxby, D. (1989). The significance of pneumococcal type transformation in the history of
molecular biology and genetics. Journal of Biological Education, 23(3), 213-217.
281
Beaumont, E. S., Rowe, G., & Mikhaylov, N. S. (2012). Promoting interactive learning:
A classroom exercise to explore foraging strategies. Bioscience Education 19.
DOI: 10.11120/beej.2012.19000008
Berg, B. L. (2009). Qualitative research methods for the social sciences (7th
ed.). Boston,
MA: Allyn & Bacon.
Bergland, M, Lundeberg, M., Klyczer, K., Sweet, J., Emmons, J., Martin, C., Marsh, K.,
Werner, J., & Jarvis-Uetz, M. (2006). Exploring biotechnology using case-based
multimedia. The American Biology Teacher, 68(2), 81-86.
Blackwell, W. H., & Powell, M. J. (1995). Where have all the algae gone, or, how many
kingdoms are there? The American Biology Teacher, 57(3), 160-167.
Blystone, R. V., & Barnard, K. (1988). The future direction of college biology textbooks.
Bioscience, 38(1), 48-52.
Bockholt, S. M., West, J. P., & Bollenbacher, W. E. (2003). Cancer Cell Biology: A
student-centered instructional module exploring the use of multimedia to enrich
interactive, constructivist learning of science. Cell Biology Education, 2, 35-50.
Bolhuis, J. J., & Verhulst, S. (Eds.). (2009). Tinbergen’s legacy: Function and
mechanism in behavioral biology. Cambridge, UK: Cambridge University Press.
Booth, P., Heaney, R., & Henderson-Begg, S. (2011). A comparison between flash and
second life programs as aids in the learning of basic laboratory procedures.
Journal of Interactive Learning Research, 22(3), 445-465.
Booth, P., Kebede-Westhead, K., Heaney, R., & Henderson-Begg, S. K. (2010). A pilot
evaluation of an online tool designed to aid development of basic laboratory
skills. Bioscience Education, 15, Article 3.
Bordson, B. L., & Bennett, J. W. (1983). Down syndrome: Presentation in current
genetics textbooks. Journal of Biological Education, 17(3), 251-256.
Breed, M. D., & Moore, J. (2012). Animal behavior. Amsterdam, Netherlands: Elsevier.
Bromham, L., & Oprandi, P. (2006). Evolution online: Using a virtual learning
environment to develop active learning in undergraduates. Journal of Biological
Education, 41(1), 21-25.
Bunderson, C. V., Baillio, B., Olsen, J. B., Lipson, J. I., & Fisher, K. M. (1984).
Instructional effectiveness of an intelligent videodisc in biology. Machine-
Mediated Learning, 1(2), 175-216.
282
Burrows, G. (2010). Teaching flower structure & floral formulae- A mix of the real &
virtual worlds. The American Biology Teacher, 27(5), 276-280.
Burton, R. S. (2011). Bridges or barriers: Analysis of logodiversity in college biology
textbooks. Bioscene, 37(1), 3-7.
Camill, P. (2000). Using journal articles in an environmental biology course. Journal of
College Science Teaching, 30(1), 38-43.
Campbell, N. A., & Reece, J. B. (2005). Biology (7th
ed.). Redwood City, CA: The
Benjamin/Cummings publishing company Inc.
Cann, A. J. (2007). Podcasting is dead. Long live video! Bioscience Education, 10,
Article 1.
Carter, J. L., & Mayer, W. V. (1988). Reading beyond the textbooks: Great books of
biology. Bioscience, 38(7), 490-492.
Chen, P.Y., & Krauss, A.D. (2004). Intracoder reliability. In M.S. Lewis-beck, A.
Bryman, & T.F. Liao (Eds.), The sage encyclopedia of social science research
methods (pp. 525-527). Thousand Oaks, CA: SAGE Publications, Inc.
Cobb, S., Heaney, R., Corcoran, O., & Henderson-Begg, S. (2009). The learning gains
and student perceptions of a second life virtual lab. Bioscience Education, 13,
Article 5.
Croker, K., Andersson, H., Lush, D., Prince, R., & Gomez, S. (2010). Enhancing the
student experience of laboratory practicals through digital video guides.
Bioscience Education, 16, Article 2.
Cunningham, S. C., McNear, B., Pearlman, R. S., & Kern, S. E. (2006). Beverage-
agarose gel electrophoresis: An inquiry-based laboratory exercise with virtual
adaptation. CBE- Life Sciences Education, 5, 281-286.
Dawkins, M. S. (2013). Tribute to Tinbergen: Questions and how to answer them.
Ethology, 119, 1-3.
Degerman, M. S., Larsson, C., & Anward, J. (2012). When metaphors come to life- at the
interface of external representations, molecular phenomena, and student learning.
International Journal of Environmental & Science Education, 7(4), 563-580.
Dewhurst, D. G., Hardcastle, J., Hardcastle, P. T., & Stuart, E. (1994). Comparison of a
computer simulation program and a traditional laboratory practical class for
teaching the principles of intestinal absorption. Advances in Physiology
Education, 12(1), S95-S104.
283
Dewsbury, D. A. (1994). On the utility of the proximate-ultimate distinction in the study
of animal behavior. Ethology, 96, 63-68.
Downie, R., & Alexander, L. (1986). Films and videotapes on animal development—a
check list. Journal of Biological Education, 20(1), 68-71.
Drickamer, L. C., Vessey, S. H., & Jakob, E. M. (2002). Animal behavior: Mechanisms,
ecology, evolution (5th
ed.). Boston, MA: McGraw Hill Companies, Inc.
Druger, M. (1970). Using media to individualize biology teaching. The Australian
Science Teachers Journal, 16(1), 17-21.
Dugatkin, L. A. (2013). Principles of animal behavior (3rd
ed.). New York, NY: W. W.
Norton & Company.
Duncan, D. B., Lubman, A., & Hoskins, S. G. (2011). Introductory biology textbooks
under-represent scientific process. Journal of Microbiology & Biology Education,
12(2), 143-151. DOI 10.11128/jmbe.v12i2.307.
Dupuis, J., Coutu, J., & Laneuville, O. (2013). Application of linear mixed-effect models
for the analysis of exam scores: Online video associated with higher scores for
undergraduate students with lower grades. Computers & Education, 66, 64-73.
Eisner, T., Aneshansley, D. J., & Eisner, M. (1988). Ultraviolet viewing with a color
television camera. BioScience, 38(7), 496-498.
Elo, S., & Kyngäs, H. (2007). The qualitative content analysis process. Journal of
Advanced Nursing, 62(1), 107-115.
Fabian, C. A. (2004). Evolutionary biology digital dissection project: Web-based
laboratory learning opportunities for students. The American Biology Teacher,
66(2), 128-132.
Feser, J., Vasaly, H., & Herrera, J. (2013). On the edge of mathematics and biology
integration: Improving quantitative skills in undergraduate biology education.
CBE- Life Science Education, 12, p. 124-128.
Fifield, S., & Peifer, R. (1994). Enhancing lecture presentations in introductory biology
with computer-based multimedia. Journal of College Science Teaching, 23(4),
235-239.
Flodin, V. S. (2009). The necessity of making visible concepts with multiple meanings in
science education: The use of the gene concept in a biology textbook. Science &
Education, 18, 73-94.
284
Flowers, S. K., Easter, C., Holmes, A., Cohen, B., Bednarski, A. E., Mardis, E. R.,
Wilson, R. K., & Elgin, S. C. R. (2005). Genome science: A video tour of the
Washington University Genome Sequencing Center for high school and
undergraduate students. Cell Biology Education, 4, 291-297.
Francis, R. C. (1990). Causes, proximate and ultimate. Biology and Philosophy, 5, 401-
415.
Gibbons, N. J., Evans, C., Payne, A., Shah, K., & Griffin, D. K. (2004). Computer
simulations improve university instructional laboratories. Cell Biology Education,
3, 263-269.
Gibbs, A., & Lawson, A. E. (1992). The nature of scientific thinking as reflected by the
work of biologists and by biology textbooks. The American Biology Teacher,
54(3), 137-152.
Goetz, E. T., Alexander, P. A., & Schallert, D. L. (1987). The author’s role in cueing
strategic processing of college textbooks. Reading, Research, and Instruction,
27(1), 1-11.
Guadarrama-Maillot, V., & Waas, J. R. (2008). New Zealand trends in animal behaviour
research. New Zealand Journal of Zoology, 35, 305-321.
Hall, D. W. (1996). Computer-based animations in large enrollment lectures: Visual
reinforcement of biological concepts. Journal of College Science Teaching, 25(6),
421-425.
Hall, W., Thorogood, P., Hutchings, G., & Carr, L. (1989). Using hypercard and
interactive video in education: An application in cell biology. Educational and
Training Technology International, 26(3), 207-214.
Halverson, K. L. (2010). Using pipe cleaners to bring the tree of life to life. The
American Biology Teacher, 72(4), 223-224.
Harder, A. K. (1989). Attitudes toward reading science textbooks. The American Biology
Teacher, 51(4), 208-212.
Harder, A. K., & Carline, J. D. (1988). Selecting anatomy and physiology textbooks for
nursing students. The American Biology Teacher, 50(2), 82-85.
Herman, C. (1999). Reading the literature in the jargon-intensive field of molecular
genetics. Journal of College Science Teaching, 28(4), 252-253.
Herreid, C. F. (1994). Journal articles as case studies—The New England Journal of
Medicine on breast cancers. Journal of College Science Teaching, 23(6), 349-355.
285
Hinchcliffe, E. H. (2005). Using long-term time-lapse imaging of mammalian cell cycle
progression for laboratory instruction and analysis. Cell Biology Education, 4,
284-290.
Hinchliffe, J. R. (1972). Films on animal development. Journal of Biological Education,
6, 119-123.
Hinchliffe, J. R. (1975). Further films on animal development. Journal of Biological
Education, 9(3/4), 123-126.
Hinkle, D. E., Wiersma, W., & Jurs, S. G. (2003). Applied statistics for the behavioral
sciences (5th
ed.). Boston, MA: Houghton Mifflin Company.
Hogan, J. A. (2009). Causation: The study of behavioral mechanisms. In J. J. Bolhuis &
S. Verhulst. (Eds.). Tinbergen’s legacy: Function and mechanism in behavioral
biology (pp. 35-53). Cambridge, UK: Cambridge University Press.
Hughes, S. W. (1982). The fact and the theory of evolution. The American Biology
Teacher, 44(1), 25-32.
Huxley, J. S. (1914). The courtship-habits of the Great Crested Grebe
(Podicepscristatus); with an addition to the theory of sexual selection.
Proceedings of the Zoological Society of London (1941), 491-562.
Huxley, J. S. (1923). Courtship activities in the Red-throated Diver (Colymbus stellatus
Pontopp.); together with a discussion of the evolution of courtship in birds.
Journal of the Linnean Society, 35, 253-291.
Janick-Buckner, D. (1997). Getting undergraduates to critically read and discuss primary
literature. Journal of College Science Teaching, 27(1), 29-32.
Jensen, M., & Moore, R. (2008). Reading trade books in a freshman biology course. The
American Biology Teacher, 70(4), 206-210.
Jesen, W. A., & Knauft, R. L. (1977). Programmed multi-image lectures for college
biology instruction. Journal of College Science Teaching, 6(3), 159-163.
Jittvadhna, K., Ruenwongsa, P., & Panijpan, B. (2010). Beyond textbook illustrations:
Hand-held models of ordered DNA and protein structures as 3D supplements to
enhance student learning of helical biopolymers. Biochemistry and Molecular
Biology Education, 38(6), 359-364.
Jones, D., Turner, M., Singleton, C., & Ramsay, J. (2009). A study analyzing inconsistent
responses from people with multiple sclerosis in a recent national audit. Disability
and Rehabilitation, 31(25), 2064-2072.
286
Jones, T. C., & Laughlin, T. F. (2010). PopGen Fishbowl: A free online simulation model
of microevolutionary processes. The American Biology Teacher, 72(2), 100-103.
Jones, D., Turner, M., Singleton, C., & Ramsay, J. (2009). A study analyzing inconsistent
responses from people with multiple sclerosis in a recent national audit. Disability
and Rehabilitation, 31(25), 2064-2072.
Kesner, M. H., & Linzey, A. V. (2005). Can computer-based visual-spatial aids lead to
increased student performance in anatomy & physiology. The American Biology
Teacher, 67(4), 206-212.
Kinchin, I. M. (2005). Reading scientific papers for understanding: Revisiting Watson
and Crick (1953). Journal of Biological Education, 39(2), 73-75.
Klymokowsky, M. W. (2007). Teaching without a textbook: Strategies to focus learning
on fundamental concepts and scientific process. CBE- Life Sciences Education, 6,
190-193.
Kosinksi, R. J. (1984). Producing computer assisted instruction for biology laboratories.
The American Biology Teacher, 46(3), 162-167.
Krupka, L. R., Vener, A., & Corcos, A. (1980). Biology texts and aging: A neglected
area. Journal of College Science Teaching, 9(5), 272-275.
Labonte, M. L. (2013). A hands-on approach to teaching protein translation &
translocation into the ER. The American Biology Teacher, 75(3), 211-213.
Laland, K. N., Odling-Smee, J., Hoppitt, W., & Uller, T. (2013). More on how and why:
Cause and effect in biology revisited. Biology & Philosophy, 28, 719-745.
Laland, K. N., Sterelny, K., Odling-Smee, J., Hoppitt, W., & Uller, T. (2011). Cause and
effect in biology revisited: Is Mayr’s proximate-ultimate dichotomy still useful?
Science, 334, 1512-1516.
Larios-Sanz, M., Simmons, A. D., Bagnall, R. A., & Rosell, R. C. (2011).
Implementation of a service-learning module in medical microbiology and cell
biology classes at an undergraduate liberal arts university. Journal of
Microbiology & Biology Education, 12(1), 29-37.
Latham, L. G., & Scully, E. P. (2008). Critters! A realistic simulation for teaching
evolutionary biology. The American Biology Teacher, 70(1), 30-33.
Lauriola, M. (2004). Reliability coefficient. In M.S. Lewis-beck, A. Bryman, & T.F. Liao
(Eds.), The sage encyclopedia of social science research methods (pp. 958-959).
Thousand Oaks, CA: SAGE Publications, Inc.
287
Laws, P. M. (1996). Undergraduate science education: A review of research. Studies in
Science Education, 28, 1-85.
Lenton, G. M. (1975). A laboratory exercise for ecology teaching: The use of
photographs in detecting dispersion patterns in animals. Journal of Biological
Education, 9(1), 13-16.
Lents, N. H., & Cifuentes, O. E. (2009). Web-based learning enhancements: Video
lectures through voice-over PowerPoint in a majors-level biology course. Journal
of College Science Teaching, 39(2), 38-46.
Leonard, W. H. (1987). Does the presentation style of questions inserted into text
influence understanding and retention of science concepts? Journal of College
Science Teaching, 24(1), 27-37.
Leonard, W. H. (1989). A comparison of student reactions to biology instruction by
interactive videodisc or conventional laboratory. Journal of Research in Science
Teaching, 26(2), 95-104.
Leonard, W. H., & Lowery, L. F. (1984). The effects of question types in textual reading
upon retention of biology concepts. Journal of Research in Science Teaching,
21(4), 377-384.
Lorenz, K. (1971). Studies in Animal and Human Behaviour (Vol. 2). Cambridge, UK:
Harvard University Press.
MacDougall-Shackleton, S. A. (2011). The levels of analysis revisited. Philosophical
Transactions of The Royal Society B, 366, 2076-2085.
Major, A. G., & Collette, A. T. (1961). The readability of college general biology
textbooks. Science Education, 45(3), 216-224.
Marino, M. P. (2011). High school world history textbooks: An analysis of content focus
and chronological approaches. The History Teacher, 44(3), 421-446.
Mayr, E. (1961). Cause and effect in biology. Science, 134 (3489), 1501-1506.
Mayr, E. (1993). Proximate and ultimate causations. Biology and Philosophy, 8, 93-94.
McClean, P., Johnson, C., Rogers, R., Daniels, L., Reber, J., Slator, B. M., Terpstra, J., &
White, A. (2005). Molecular and cellular biology animations: Development and
impact on student learning. Cell Biology Education, 4, 169-179.
McLaughlin, J. S. (2001). Breaking out of the box: Teaching biology with web-based
active learning modules. The American Biology Teacher, 63(2), 110-115.

288
McMillen, J. D., & Esch, H. E. (1984). Microcomputers for laboratory data collection.
The American Biology Teacher, 46(3), 157-161.
Meir, E., Perry, J., Stal, D., Maruca, S., & Klopfer, E. (2005). How effective are
simulated molecular-level experiments for teaching diffusion and osmosis? Cell
Biology Education, 4, 235-248.
Mertens, T. R., & Polk, N. C. (1980). A comparison of thirteen general genetics
textbooks. The American Biology Teacher, 42(5), 274-279+285.
Muench, S. B. (2000). Choosing primary literature in biology to achieve specific
educational goals. Journal of College Science Teaching, 29(4), 255-260.
Mulnix, A. B. (2003). Investigations of protein structure and function using the scientific
literature: An assignment for an undergraduate cell physiology course. Cell
Biology Education, 2, 248-255.
National Research Council Committee (U.S.) on Undergraduate Biology Education to
Prepare Research Scientists for the 21st Century. (2003). BIO2010:Transforming
undergraduate education for future research biologists. Washington, DC: The
National Academies Press.
National Science Foundation. (n.d.). Behavioral systems. Retrieved February 2, 2014
from
http://www.nsf.gov/funding/pgm_summ.jsp?pims_id=504676&org=IOS&from=h
ome
Nesse, R. M. (2013). Tinbergen’s four questions, organized: A response to Bateson and
Laland. Trends in Ecology & Evolution, 28(12), 681-682.
O’Day, D. H. (2006). Animated cell biology: A quick and easy method for making
effective, high-quality teaching animations. CBE—Life Science Education, 5, 255-
263.
O’Day, D. H. (2007). The value of animations in biology teaching: A study of long-term
memory retention. CBE—Life Sciences Education, 6, 217-223.
Olsen, R. W., & Lukas, T. G. (1977). Multimedia student response software
development. Journal of College Science Teaching, 7(1), 54-55.
Ord, T. J., Martins, E. P., Thakur, S., Mane, K. K., & Börner, K. (2005). Trends in animal
behaviour research (1968-2002): Ethoinformatics and the mining of library
databases. Animal Behaviour, 69, 1399-1413.

289
Parslow, G. R. (2009). Commentary: Downloaded lectures have been shown to produce
better assessment outcomes. Biochemistry and Molecular Biology Education,
37(6), 375-376.
Pearson, J. T., & Hughes, W. J. (1988a). Problems with the use of terminology in
genetics education: 1, A literature review and classification scheme. Journal of
Biological Education, 22(4), 267-274.
Pearson, J. T., & Hughes, W. J. (1988b). Problems with the use of terminology in
genetics education: 2, some examples from published materials and suggestions
for rectifying the problem. Journal of Biological Education, 22(3), 178-182.
Peat, M., Taylor, C., & Fernandez, A. (2002). From informational technology in biology
teaching to inspirational technology. Australian Science Teachers’ Journal, 48(2),
6-11.
Petzold, J., Winterman, B., & Montooth, K. (2010). Science seeker: A new model for
teaching information literacy to entry-level biology undergraduates. Issues in
Science and Technology Librarianship, 63. doi: 10.5062/F4ZW1HVJ.
Pfeiffer, V. D. I., Gemballa, S., Jarodzka, H., Scheiter, K., & Gerjets, P. (2009). Situated
learning in the mobile age: Mobile devices on a field trip to the sea. ALT- Journal
of Research in Learning Technology, 17(3), 187-199.
Prentice, E. D., Metcalf, W. K., Quinn, T. H., Sharp, J. G., Jensen, R. H., & Holyoke, E.
A. (1977). Stereoscopic anatomy: Evaluation of a new teaching system in human
gross anatomy. Journal of Medical Education, 52, 758-763.
Price, J. J., Clapp, M. K., & Omland, K. E. (2011). Where have all the trees gone? The
declining use of phylogenies in animal behaviour journals. Animal Behaviour, 81,
667-670.
Quinn, J. G., King, K., Roberts, D., Carey, L., & Mousley, A. (2009). Computer based
learning packages have a role, but care needs to be given as to when they are
delivered. Bioscience Education, 14, Article 5.
Riskmark, M., Solvberg, A. M., Stomme, A., & Hokstad, L. M. (2007). Using mobile
phones to prepare for university lectures: Students experiences. The Turkish
Online Journal of Educational Technology, 6(4), Article 9.
Ross, P., Tronson, D., & Ritchie, R. J. (2005). Modelling photosynthesis to increase
conceptual understanding. Journal of Biological Education, 40(2), 84-88.
Ruiz-Primo, M. A., Briggs, D., Iverson, H., Talbot, R., & Shepard, L. A. (2011). Impact
of undergraduate science course innovations on learning. Science, 331, 1269-
1270.
290
Rybarczyk, B. (2011). Visual literacy in biology: A comparison of visual representations
in textbooks and journal articles. Journal of College Science Teaching, 41(1),
106-114.
Saldaña, J. (2011). Fundamentals of qualitative research. Oxford, UK: Oxford University
Press.
Sallee, S. E. (1974). Video-tape projects in human ecology. The American Biology
Teacher, 36(3), 176-178.
Sandercock, E. R. (1970). Audio-tutorials in action. Australian Science Teachers Journal,
16(1), 23-26.
Sanger, M. J., Brechelsen, D. M., & Hynek, B. M. (2001). Con computer animations
affect college biology students’ conceptions about diffusion & osmosis? The
American Biology Teacher, 63(2), 104-109.
Scheiter, K., Gerjets, P., Huk, T., Imhof, B., & Kammerer, Y. (2009). The effects of
realism in learning with dynamic visualizations. Learning and Instruction, 19,
481-494.
Schreiber, J. B., & Asner-Self, K. (2011). Educational research: The interrelationship of
questions, sampling, design, and analysis. Hoboken, NJ: John Wiley & Sons, Inc.
Schutt, R. K. (2009). Investigating the social world: The process and practice of research
(6th
ed.). Los Angeles, CA: Pine Forge Press.
Shayler, H. A. (2006). Key to freshwater algae: A web-based tool to enhance
understanding of microscopic biodiversity. Journal of Science Education and
Technology, 15(3), 298-303.
Shields, L, & Twycross, A. (2008).Content analysis. Paediatric Nursing, 20(6), 38.
Simon, E. J. (2001). Technology instead of a textbook: Alternatives for the introductory
biology classroom. The American Biology Teacher, 63(2), 89-94.
Smith, B. L., Holliday, W. G., & Austin, H. W. (2010). Students’ comprehension of
science textbooks using a question-based reading strategy. Journal of Research in
Science Teaching, 47(4), 363-379.
Soderberg, P., & Price, F. (2003). An examination of problem-based teaching and
learning in population genetics and evolution using EVOLVE, a computer
simulation. International Journal of Science Education, 25(1), 35-55.
291
Stafford, R., Goodenough, A. E., & Davies, M. S. (2010). Assessing the effectiveness of
a computer simulation for teaching ecological experimental design. Bioscience
Education, 15.
Stine, M. B., & Butler, D. R. (2011). A content analysis of biogeomorphology within
geomorphology textbooks. Geomorphology, 125, 336-342.
Stith, B. J. (2004). Use of animation in teaching cell biology. Cell Biology Education, 3,
181-188.
Storey, R. D. (1989). Textbook errors & misconceptions in biology: Photosynthesis. The
American Biology Teacher, 51(5), 271-274.
Storey, R. D. (1990). Textbook errors & misconceptions in biology: Cell structure. The
American Biology Teacher, 52(4), 213-218.
Storey, R. D. (1991). Textbook errors & misconceptions in biology: Cell metabolism.
The American Biology Teacher, 53(6), 339-343.
Storey, R. D. (1992a). Textbook errors & misconceptions in biology: Cell energetics. The
American Biology Teacher, 54(3), 161-166.
Storey, R. D. (1992b). Textbook errors & misconceptions in biology: Cell physiology.
The American Biology Teacher, 54(4), 200-203.
Strassmann, J. E. (2014). Tribute to Tinbergen: The place of animal behavior in biology.
Ethology, 120, 123-126.
Swan, A. E., & O’Donnell, A. M. (2009). The contribution of a virtual biology laboratory
to college students’ learning. Innovations in education and teaching international,
46(4), 405-419.
Taborsky, M. (2014). Tribute to Tinbergen: The four problems of biology. A critical
appraisal. Ethology, 120, 224-227.
Thompson, K. V., Nelson, K. C., Marbach-Ad, G., Keller, M., & Fagan, W. F. (2010).
Online interactive teaching modules enhance quantitative proficiency of
introductory biology students. CBE- Life Sciences Education, 9, 277-283.
Tinbergen, N. (1963). On aims and methods of ethology. Zeitschrift Tierpsychologie, 20,
410-433.
Tinbergen, N. (1973). Ethology and stress diseases. In J. Lindsten (Ed.). Nobel Lectures,
Physiology or Medicine 1971-1980 (pp. 113-130). Singapore, World Scientific
Publishing, Co.
292
Todd, P. A. (2009). Testing for camouflage using virtual prey and human ‘predators.’
Journal of Biological Education, 43(2), 81-84.
Toth, E. E. (2009). “Virtual inquiry” in the science classroom: What is the role of
technological pedagogical content knowledge? International Journal of
Information and Communication Technology Education, 5(4), 78-87.
Tritz, G. J. (1986). Computer modeling of microbiological experiments in the teaching
laboratory: Animation Techniques. Journal of Computers in Mathematics and
Science Teaching, 6(2), 44-48.
Tweedy, M. E., & Hoese, W. J. (2005). Diffusion activities in college laboratory
manuals. Journal of Biological Education, 39(4), 150-155.
Vogel, S. (1987). Mythology in introductory biology. BioScience, 37(8), 611-614.
Walker, N. (1980). Readability of college general biology textbooks: Revisited. Science
Education, 64(1), 29-34.
Walker, J. D., Cotner, S., & Beerman, N. (2011). Vodcasts and captures: Using
multimedia to improve student learning in introductory biology. Journal of
Educational Multimedia and Hypermedia, 20(1), 97-111.
Walsh, J. P., Sun, J. C.-Y., & Riconscente, M. (2011). Online teaching tool simplifies
faculty use of multimedia and improves interest and knowledge in science. CBE-
Life Sciences Education, 10, 298-308.
Watters, C. (2004a). Video views and reviews: Creating a thread with respect to the
invasion of animal viruses. Cell Biology Education, 3, 218-222.
Watters, C. (2004b). Video views and reviews: Golgi export, targeting, and plasma
membrane caveolae. Cell Biology Education, 3, 141-145.
Watters, C. (2005). Video views and reviews: Cytokinesis: A phenomenon overlooked
too often. Cell Biology Education, 4, 10-18.
Watters, C. (2006). Video views and reviews: The bacterial cytoskeleton. Cell Biology
Education, 5, 306-310.
Weisman, D. (2010). Incorporating a collaborative web-based virtual laboratory in an
undergraduate bioinformatics course. Biochemistry and Molecular Biology
Education, 38(1), 4-9.
White, B. T. (2009a). Analysis of students’ downloading of online audio lecture
recordings in a large biology lecture course. Journal of College Science Teaching,
38(3), 23-27.
293
White, B. T. (2009b). Exploring the diversity of life with the phylogenetic collection lab.
The American Biology Teacher, 71(3), 157-161.
Wiegnat, F., Scager, K., & Boonstra, J. (2011). An undergraduate course to bridge the
gap between textbooks and scientific research. CBE- Life Sciences Education, 10,
83-94.
Windschid, M. (1996). Instructional animations: The in-house production of biology
software. Journal of Computing in Higher Education, 7(2), 78-94.
Wright, L. K., & Newman, D. L. (2011). An interactive modeling lesson increases
students’ understanding of ploidy during meiosis. Biochemistry and Molecular
Biology Education, 39(5), 344-351.

294
Appendix A
HSIRB Approval Request
295
Dissertation Proposal
In order for textbooks to represent our current views and understanding within
science, they should include similar topics that are commonly found in the primary
literature and use the most commonly-cited studies as their examples of these topics. This
will be assessed within a sub-discipline of biology: animal behavior. The textbooks
selected for this study will be the most commonly used animal behavior, and possibly
behavioral ecology, textbooks in the United States. This will be determined via a random
sample from across the nation. Post-secondary institutions will be randomly selected until
two institutions that offer an animal behavior and/or a behavioral ecology course from
each state have been found. Then either a syllabus for the course will be located on the
internet or the instructor of the course will be contacted (see appendix for request email)
and a most current syllabus will be requested. If the selected instructor has not replied
within one week, they will be contacted again with a request. If they still have not
responded one week after the second request then another institution of the same state
will be randomly selected in its place. The syllabus will be used not only to determine the
textbook used but also if a laboratory manual is required for the course. The general
topics taught will also be of value to determine which chapters of the textbooks are most
commonly used and which journals to use as a comparison to the textbooks.
Appendix: Email Request Letter
Dear [Instructor’s Name],
My name is Andrea Bierema, and I am a graduate student from the Mallinson Institute of
Science Education of Western Michigan University. For my dissertation, I will be
comparing topics and examples that are found in animal behavior [or behavioral ecology]
textbooks to those commonly discussed in the primary literature. In order to determine
which textbooks, and possibly even which laboratory manuals, if used, to assess and
which topics are most commonly taught from these textbooks, I will be collecting syllabi
from randomly-selected institutions across the nation. [Name of institution] was selected
in this process, and, therefore, I am requesting a copy of your most current syllabus from
your animal behavior [or behavioral ecology] course.
Your assistance will be very much appreciated and will help us gain new insight in to the
usefulness of your textbook!
Sincerely,
Andrea M.-K. Bierema

296
Appendix B
HSIRB Letter

297

298
Appendix C
Intended Framework Codes
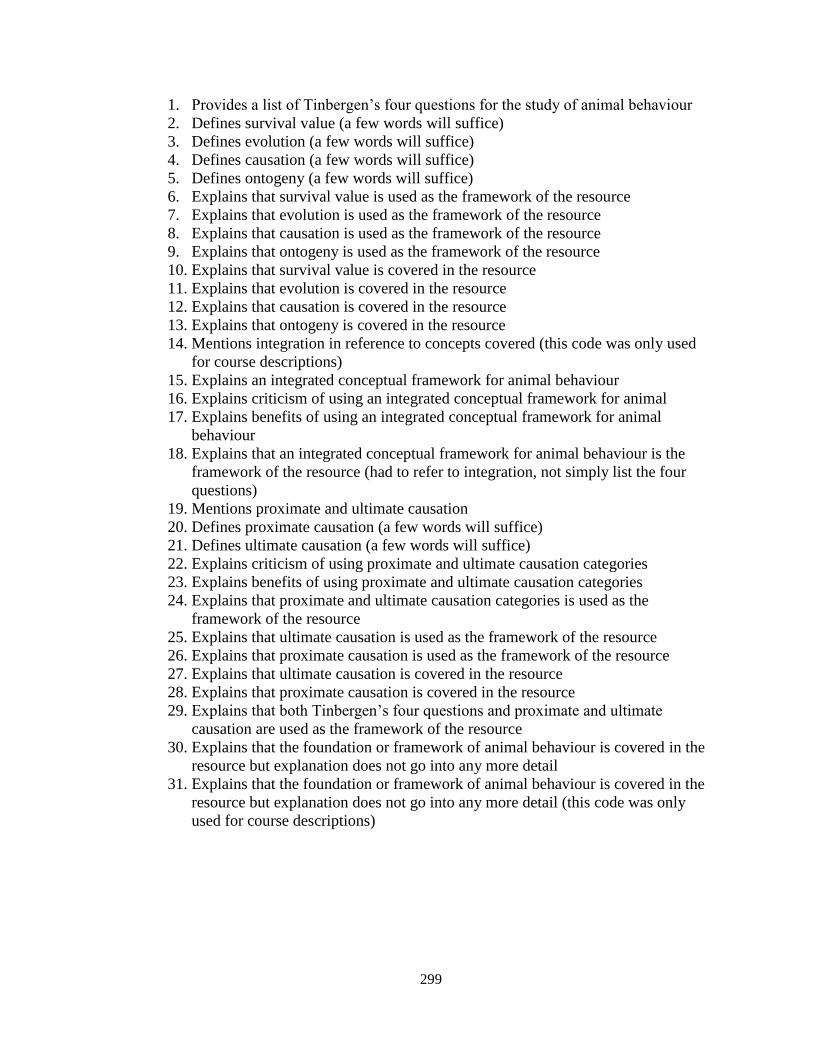
299
1. Provides a list of Tinbergen’s four questions for the study of animal behaviour
2. Defines survival value (a few words will suffice)
3. Defines evolution (a few words will suffice)
4. Defines causation (a few words will suffice)
5. Defines ontogeny (a few words will suffice)
6. Explains that survival value is used as the framework of the resource
7. Explains that evolution is used as the framework of the resource
8. Explains that causation is used as the framework of the resource
9. Explains that ontogeny is used as the framework of the resource
10. Explains that survival value is covered in the resource
11. Explains that evolution is covered in the resource
12. Explains that causation is covered in the resource
13. Explains that ontogeny is covered in the resource
14. Mentions integration in reference to concepts covered (this code was only used
for course descriptions)
15. Explains an integrated conceptual framework for animal behaviour
16. Explains criticism of using an integrated conceptual framework for animal
17. Explains benefits of using an integrated conceptual framework for animal
behaviour
18. Explains that an integrated conceptual framework for animal behaviour is the
framework of the resource (had to refer to integration, not simply list the four
questions)
19. Mentions proximate and ultimate causation
20. Defines proximate causation (a few words will suffice)
21. Defines ultimate causation (a few words will suffice)
22. Explains criticism of using proximate and ultimate causation categories
23. Explains benefits of using proximate and ultimate causation categories
24. Explains that proximate and ultimate causation categories is used as the
framework of the resource
25. Explains that ultimate causation is used as the framework of the resource
26. Explains that proximate causation is used as the framework of the resource
27. Explains that ultimate causation is covered in the resource
28. Explains that proximate causation is covered in the resource
29. Explains that both Tinbergen’s four questions and proximate and ultimate
causation are used as the framework of the resource
30. Explains that the foundation or framework of animal behaviour is covered in the
resource but explanation does not go into any more detail
31. Explains that the foundation or framework of animal behaviour is covered in the
resource but explanation does not go into any more detail (this code was only
used for course descriptions)
Related Documents


