Biyani's Think Tank Concept based notes Research Method in Management MBA - II Sem Swati Shastri Lecturer Deptt. of MBA Biyani Institute of science & Management, Jaipur

Welcome message from author
This document is posted to help you gain knowledge. Please leave a comment to let me know what you think about it! Share it to your friends and learn new things together.
Transcript

Biyani's Think Tank
Concept based notes
Research Method in Management
MBA - II Sem
Swati Shastri Lecturer
Deptt. of MBA
Biyani Institute of science & Management, Jaipur

2
Published by :
Think Tanks Biyani Group of Colleges Concept & Copyright :
Biyani Shikshan Samiti Sector-3, Vidhyadhar Nagar, Jaipur-302 023 (Rajasthan)
Ph : 0141-2338371, 2338591-95 Fax : 0141-2338007 E-mail : [email protected] Website :www.gurukpo.com; www.biyanicolleges.org
First Edition : 2010 Second Edition : 2012 Leaser Type Setted by : Biyani College Printing Department
While every effort is taken to avoid errors or omissions in this Publication, any mistake or
omission that may have crept in is not intentional. It may be taken note of that neither the
publisher nor the author will be responsible for any damage or loss of any kind arising to
anyone in any manner on account of such errors and omissions.
Research methods in management 3
Preface
am glad to present this book, especially designed to serve the needs of the students. The book
has been written keeping in mind the general weakness in understanding the fundamental concept
of the topic. The book is self-explanatory and adopts the “Teach Yourself” style. It is based on
question-answer pattern. The language of book is quite easy and understandable based on scientific
approach.
Any further improvement in the contents of the book by making corrections, omission and
inclusion is keen to be achieved based on suggestions from the reader for which the author shall be
obliged.
I acknowledge special thanks to Mr. Rajeev Biyani, Chiarman & Dr. Sanjay Biyani, Director
(Acad.) Biyani Group of Colleges, who is the backbone and main concept provider and also have
been constant source of motivation throughout this endeavour. We also extend our thanks to Biyani
Shikshan Samiti, Jaipur, who played an active role in co-ordinating the various stages of this
endeavour and spearheaded the publishing work.
I look forward to receiving valuable suggestions from professors of various educational
institutions, other faculty members and the students for improvement of the quality of the book. The
reader may feel free to send in their comments and suggestions to the under mentioned address.
Author
I

4
Chapter 1
Meaning and process of Research
Q1. What do you mean by research?
Ans. Research is a thorough, orderly, organized, efficient and logical investigation of
an area of knowledge or of a problem. In the broadest sense of the word, the
definition of research includes any gathering of data, information and facts for
the advancement of knowledge. Main components of a research are:
1. Curiosity:
Science is knowledge of the physical or material world gained through
observation and experiment. Research begins with a broad question that needs
an answer.
2. Theory (Hypothesis)
Researcher creates an assumption to be proved or disproved with the help of
data.
3. Experiment
Researchers design an experiment with steps to test and evaluate the theory
(hypothesis) and generate analyzable data. Experiments have controls and a
large enough sample group to provide statistically valid results.
4. Observation
Observing and recording the results of the experiment generated raw data to
prove or disprove the theory.
5. Analysis

Research methods in management 5
Statistical analysis on the data and organizing it so that it is understandable
generates answers to the initial question. Data may show trends that allow for
the broadening of the research.
6. Conclusions
Research following the scientific method will either prove or disprove the theory
(hypothesis). What happened and why it needs to be explained by the researcher
is concluded. Even when a theory (hypothesis) is disproved, valuable data
collected in the research may lead to further research. The results are usually
published and shared.
Q2. What are the sources of research problem?
Ans. Sources of research problem are:
l Community
2 Own teaching experiences
3 Classroom lectures
4 Class discussions
5 Seminars/workshops/paper presentations
6 Internet
7 Reading assignments
8 Textbooks
9 Research reports
10 Consultation
Q3. Explain the process of research.
Ans. Research process includes the following steps:
Formulation of research problem

6
Hypothesis Building
Research Design
Data Collection
Data Analysis
Interpretation
Report Writing
Q.4 How a research problem is formulated?
Ans. The first step in research process is exploration of the area of interest. This may
be done by review of literature and taking expert opinion. An analysis of the
situation leads to an understanding of the entire scenario and researcher can
identify the research problem
Q5. What is the importance of literature review for a researcher?
Ans. A literature review is a body of text that aims to review the critical points of
current knowledge including substantive findings as well as theoretical and
methodological contributions to a particular topic. Literature reviews are most
often associated with academic-oriented literature, such as a thesis, a literature
review usually precedes a research proposal and results section. Its ultimate goal
is to bring the reader up to date with current literature on a topic and forms the
basis for another goal, such as future research that may be needed in the area.
Q6. What do you mean by research hypothesis? Why it is important?
Ans. A hypothesis is a logical supposition, a reasonable guess. It provides a tentative
explanation for a phenomenon under investigation." A hypothesis is important
because it guides the researcher. An investigator may refer to the hypothesis to
direct his or her thought process toward the solution of the research problem.
The hypothesis helps an investigator to collect the right kinds of data needed for
the investigation. Hypotheses are also important because they help an
investigator to locate information needed to resolve the research problem .As a
hypothesis is continually supported over time by a growing body of data, it
becomes a theory. A theory is describes as "an organized body of concepts and
principles intended to explain a particular phenomenon. Both are supported or

Research methods in management 7
rejected on the basis of testing by various investigators under different
conditions. An example of a well known theory is Einstein's theory of relativity.
Q7. What are the types of research design?
Ans. The research designs are of the following types:
• Exploratory research
Exploratory research is a type of research conducted for a problem that has not
been clearly defined. Exploratory research often relies on secondary research
such as reviewing available literature and sometimes on qualitative approaches
such as informal discussions with consumers, employees, management or
competitors, and more formal approaches through in-depth interviews, focus
groups, projective methods, case studies or pilot studies. Results of exploratory
research can provide significant insight into a given situation.
• Descriptive research
Descriptive research is used to obtain information concerning the current status
of the phenomena to describe "what exists" with respect to variables or
conditions in a situation. The methods involved range from the survey which
describes the status quo, the correlation study which investigates the relationship
between variables, to developmental studies which seek to determine changes
over time. Involves gathering data that describe events and then organizes,
tabulates, depicts, and describes the data.
• Experimental research design
Experiments are conducted to be able to predict phenomenon. Typically, an
experiment is constructed to be able to explain some kind of causation.
Experimental research designs are used for the controlled testing of causal
processes.
The general procedure is one or more independent variables are manipulated to
determine their effect on a dependent variable
• Qualitative research

8
Qualitative research is a method of inquiry employed in many different
academic disciplines, traditionally in the social sciences, but also in market
research and further contexts. Qualitative researchers aim to gather an in-depth
understanding of human behavior and the reasons that govern such behavior.
The qualitative method investigates the why and how of decision making, not
just what, where, when. Hence, smaller but focused samples are more often
needed, rather than large samples.
Research methods in management 9
Chapter 2
Motivational Research
Q1. What do you mean by Motivational Research?
Ans. Any research that attempts to explore the area of motivation of people can be
called motivational research .Motivational research is a type of marketing
research that attempts to explain why consumers behave as they do. Implicitly,
motivational research assumes the existence of underlying or unconscious
motives that influence consumer behavior. Motivational research attempts to
identify forces and influences that consumers may not be aware of (e.g., cultural
factors, sociological forces). Typically, these unconscious motives (or beyond-
awareness reasons) are intertwined with and complicated by conscious motives,
cultural biases, economic variables, and fashion trends (broadly defined).
Motivational research attempts to sift through all of these influences and factors
to unravel the mystery of consumer behavior as it relates to a specific product or
service, so that the marketer better understands the target audience and how to
influence that audience.
The Major Techniques
The three major motivational research techniques are observation, focus groups,
and depth interviews. Observation can be a fruitful method of deriving
hypotheses about human motives. Anthropologists have pioneered the
development of this technique. All of us are familiar with anthropologists living
with the “natives” to understand their behavior. This same systematic
observation can produce equally insightful results about consumer behavior.
Observation can be accomplished in-person or sometimes through the
convenience of video. Usually, personal observation is simply too expensive, and
most consumers don’t want an anthropologist living in their household for a
month or two.

10
The Focus Group Interviews
These involve interviews of a group of 8-12 individuals lasting about one and
half hours.the discussion is led by a moderator who keeps the focus on the
desired topic.
The Depth Interview
This entails interviews lasting from one to three hours and needing expert
guidance .they usually use a funnel technique discussion at first on a broad level
and then narrowing down the depth of the subject.
Q2 . What do you mean by scaling techniques?
Ans. Scaling is the process of measuring or ordering entities with respect to
quantitative attributes or traits. For example, a scaling technique might involve
estimating individuals' levels of extraversion, or the perceived quality of
products. Certain methods of scaling permit estimation of magnitudes on a
continuum, while other methods provide only for relative ordering of the
entities.
Research methods in management 11
Chapter 3
Data Collection
Q1 . Differentiate between primary and secondary data.
Ans. Primary and Secondary Data:
Primary data are collected by the investigator through field survey. Such data are in raw form and must be refined before use. On the other hand, secondary data
are extracted from the existing published or unpublished sources.
Q2. What do you mean by sampling?
Ans. Sampling is that part of statistical practice concerned with the selection of a
subset of individual observations within a population of individuals intended to
yield some knowledge about the population of concern, especially for the
purposes of making predictions based on statistical inference.
Q3 . What are the sources of secondary data collection?
Ans. Secondary data are the other people's statistics, where other people includes
governments at all levels, international bodies or institutions like IMF, IBRD, etc., or other countries, private and government research organisations, Reserve Bank of India and other banks, research scholars of repute, etc. Broadly speaking we can divide the sources of secondary data into two categories: published sources and unpublished SOW. A) Published Sources
1) Official publications of the government at all levels - Central, State, Union 2) Official publications of foreign countries. 3) Official publications of international bodies like IMF, UNESCO, WHO, etc. 4) Newspapers and Journals of repute, both local and international. 5) Official publications of RBI, and other Banks, LIC, Trade Unions, Stock
Exchange, Chambers of Commerce, etc.

12
6) Reports submitted by reputed economists, research scholars, universities, commissions of inquiry, if made public. Some main sources of published data in India are: Central Statistical Organization (C.S.O.): It publishes data on national income,
savings, capital formation, etc. in a publication called National Accounts Statistics. National Sample Survey Organization (N.S.S.O.): Under Ministry of Statistics and Program me Implementation, this organization provides us data on all
aspects of national economy, such as agriculture, industry, labor and Consumption expenditure. Reserve Bank of India Publications (R.B.L): It publishes financial statistics.
Its publications are Report on Currency and Finance, Reserve Bank of India Bulletin, Statistical Tables Relating to Banks in India, etc.
B) Un-published Sources
1) Unpublished findings of certain inquiry committees. 2) Research workers' findings. 3) Unpublished material found with Trade Associations, Labor Organizations
and Chambers of Commerce.
Q4 . What are the various sampling methods?
Ans. Sampling methods are as follows:
Probability and non probability sampling
A probability sampling scheme is one in which every unit in the population has
a chance (greater than zero) of being selected in the sample, and this probability can be accurately determined. The combination of these traits makes it possible to produce unbiased estimates of population totals, by weighting sampled units according to their probability of selection.
Non probability sampling is any sampling method where some elements of the
population have no definite chance of selection, or where the probability of
selection can't be accurately determined. Probability sampling may be of the
following types:
Simple random sampling
In a simple random sample ('SRS') of a given size, all such subsets of the frame are given an equal probability. Each element of the frame thus has an equal probability of selection: the frame is not subdivided or partitioned. This minimizes bias and simplifies analysis of results.

Research methods in management 13
Systematic sampling
Systematic sampling relies on arranging the target population according to some ordering scheme and then selecting elements at regular intervals through that ordered list. Systematic sampling involves a random start and then proceeds with the selection of every kth element from then onwards. In this case, k=(population size/sample size). It is important that the starting point is not automatically the first in the list, but is instead randomly chosen from within the first to the kth element in the list. A simple example would be to select every 10th name from the telephone directory (an 'every 10th' sample, also referred to as 'sampling with a skip of 10').
Stratified sampling
Where the population embraces a number of distinct categories, the frame can be organized by these categories into separate "strata." Each stratum is then sampled as an independent sub-population, out of which individual elements can be randomly selected. Dividing the population into distinct, independent strata can enable researchers to draw inferences about specific subgroups that may be lost in a more generalized random sample.
Cluster sampling
It is an example of 'two-stage sampling' or 'multistage sampling': in the first stage
a sample of areas is chosen; in the second stage a sample of respondents within those areas is selected.
Multistage sampling Multistage sampling is a complex form of cluster sampling
in which two or more levels of units are embedded one in the other. The first stage consists of constructing the clusters that will be used to sample from. In the second stage, a sample of primary units is randomly selected from each cluster (rather than using all units contained in all selected clusters). In following stages, in each of those selected clusters, additional samples of units are selected, and so on. All ultimate units (individuals, for instance) selected at the last step of this procedure are then surveyed.
This technique, thus, is essentially the process of taking random samples of preceding random samples. It is not as effective as true random sampling, but it probably solves more of the problems inherent to random sampling. Moreover, It is an effective strategy because it banks on multiple randomizations. As such, it is extremely useful.
Multistage sampling is used frequently when a complete list of all members of the population does not exist and is inappropriate. Moreover, by avoiding the use of all sample units in all selected clusters, multistage sampling avoids the large, and perhaps unnecessary, costs associated traditional cluster sampling.

14
Non Probability sampling:
Quota sampling, in quota sampling the population is first segmented into mutually exclusive sub-groups, just as in stratified sampling. Then judgment is used to select the subjects or units from each segment based on a specified proportion. It is this second step which makes the technique one of non-probability sampling. In quota sampling the selection of the sample is non-random. For example interviewers might be tempted to interview those who look most helpful. The problem is that these samples may be biased because not everyone gets a chance of selection. This random element is its greatest weakness and quota versus probability has been a matter of controversy for many years.
Convenience sampling (sometimes known as grab or opportunity sampling) is
a type of non probability sampling which involves the sample being drawn from
that part of the population which is close to hand. That is, a sample population
selected because it is readily available and convenient. It may be through
meeting the person or including a person in the sample when one meets them or
chosen by finding them through technological means such as the internet or
through phone. The researcher using such a sample cannot scientifically make
generalizations about the total population from this sample because it would not
be representative enough. For example, if the interviewer was to conduct such a
survey at a shopping center early in the morning on a given day, the people that
he/she could interview would be limited to those given there at that given time,
which would not represent the views of other members of society in such an
area, if the survey was to be conducted at different times of day and several
times per week. This type of sampling is most useful for pilot testing.
Q5 . What are the methods of primary data collection?
Ans. COLLECTION OF PRIMARY DATA - SURVEY TECHNIOUES After the investigator is convinced that the gain from primary data outweighs
the money cost, effort and time, she/he can go in for this. She/he can use any of the following methods to collect primary data: a) Direct Personal Investigation b) Indirect Oral Investigation c) Use of Local Reports d) Questionnaire method a) Direct Personal Investigation

Research methods in management 15
Here the investigator collects information personally from the respondents. She/ he meets them personally to collect information. This method requires much from the investigator such as: 1) She/he should be polite, unbiased and tactful. 2) She/he should know the local conditions, customs and traditions 3) She/he should be intelligent possessing good observation power.
4) She/he should use simple, easy and meaning lid questions to extract information. This method is suitable only for intensive investigations. It is a costly method in terms of money, effort and time. Further, the personal bias of the investigator cannot be ruled out and it can do a lot of harm to the investigation. b) Indirect Oral Investigation Method
This method is generally used when the respondents are reluctant to part with the information due to various reasons. Here, the information is collected from a witness or from a third party who are directly or indirectly related to the problem and possess sufficient knowledge. The person(s) who is/are selected as informants must possess the following qualities: 1) They should possess full knowledge about the issue. 2) They must be willing to reveal it faithfully and honestly. 3) They should not be biased and prejudiced.
4) They must be capable of expressing themselves to the true spirit of the inquiry. c) Questionnaire Method
It is the most important and systematic method of collecting primary data,
especially when the inquiry is quite extensive. It involves preparation of a list of questions relevant to the inquiry and presenting them in the form of a booklet,
often called a questionnaire. The questionnaire is divided into two parts: 1) General introductory part which contains questions'regarding the identity of the respondent and contains information such as name, address, telephone number, qualification, profession, etc. 2) Main question part containing questions connected with the inquiry. These questions differ from inquiry to inquiry. Preparation of the questionnaire is a highly specialized job and is perfected with experience. Therefore, some experienced persons should be associated with it.

16
Chapter 4
Presentation of Data
Q1 . What is the use of tables and graphs? Ans. When significant amounts of quantitative data are presented in a report or
publication, it is most effective to use tables and/or graphs. Tables permit the actual numbers to be seen most clearly, while graphs are superior for showing trends and changes in the data
Q2. What is Line Diagram?
Line diagram Of all forms of graphic presentation of statistical data line diagram is the simplest one. A line diagram is one in which the frequency distribution is presented in the form of a series of lines in a graph sheet. The heights of these lines are equal to or in proportion to the frequencies of the class. The lines are erected at the midpoints of the class intervals.
Q3. Show various types of Bar Charts.

Research methods in management 17
Ans
Q4. Explain the construction of Pie Chart.
How to Use a Pie Chart
Step 1. Taking the data to be charted, calculate the
percentage contribution for each category. First, total all the values. Next, divide the value of each category by the total. Then, multiply the product by 100 to create a percentage for each value.
Step 2. Draw a circle. Using the percentages,
determine what portion of the circle will be represented by each category. This can be done by eye or by calculating the number of degrees and using a compass. By eye, divide the circle into four quadrants, each representing 25 percent.
Step 3. Draw in the segments by estimating how much larger or smaller each
category is. Calculating the number of degrees can be done by multiplying the percent by 3.6 (a circle has 360 degrees) and then using a compass to draw the portions.
Step 4. Provide a title for the pie chart that indicates the sample and the time period
covered by the data. Label each segment with its percentage or proportion (e.g., 25

18
percent or one quarter) and with what each segment represents (e.g., people who
returned for a follow-up visit; people who did not return).

Research methods in management 19
Chapter 5
Analysis of Data
Q1. What do you mean by Correlation?
Ans. In statistics and probability theory, correlation means how closely related two
sets of data are.
Correlation does not always mean that one causes the other. It is very possible
that there is a third factor involved.
Correlation usually has one of two directions. These are positive or negative. If it
is positive, then the two sets go up together. If it is negative, then one goes up
while the other goes down.
Lots of different measurements of correlation are used for different situations.
For example on a scatter graph, people draw a line of best fit to show the
direction of the correlation
Q2. Write down the formula for calculating the correlation coefficient and explain
its calculation
Ans
The formula for the correlation is:

20
We use the symbol r to stand for the correlation.
Example
Person Height (x) Self Esteem
(y) x*y x*x y*y
1 68 4.1 278.8 4624 16.81
2 71 4.6 326.6 5041 21.16
3 62 3.8 235.6 3844 14.44
4 75 4.4 330 5625 19.36
5 58 3.2 185.6 3364 10.24
6 60 3.1 186 3600 9.61
7 67 3.8 254.6 4489 14.44
8 68 4.1 278.8 4624 16.81
9 71 4.3 305.3 5041 18.49
10 69 3.7 255.3 4761 13.69

Research methods in management 21
11 68 3.5 238 4624 12.25
12 67 3.2 214.4 4489 10.24
13 63 3.7 233.1 3969 13.69
14 62 3.3 204.6 3844 10.89
15 60 3.4 204 3600 11.56
16 63 4 252 3969 16
17 65 4.1 266.5 4225 16.81
18 67 3.8 254.6 4489 14.44
19 63 3.4 214.2 3969 11.56
20 61 3.6 219.6 3721 12.96
Sum = 1308 75.1 4937.6 85912 285.45
Now, when we plug these values into the formula given above, we get the following
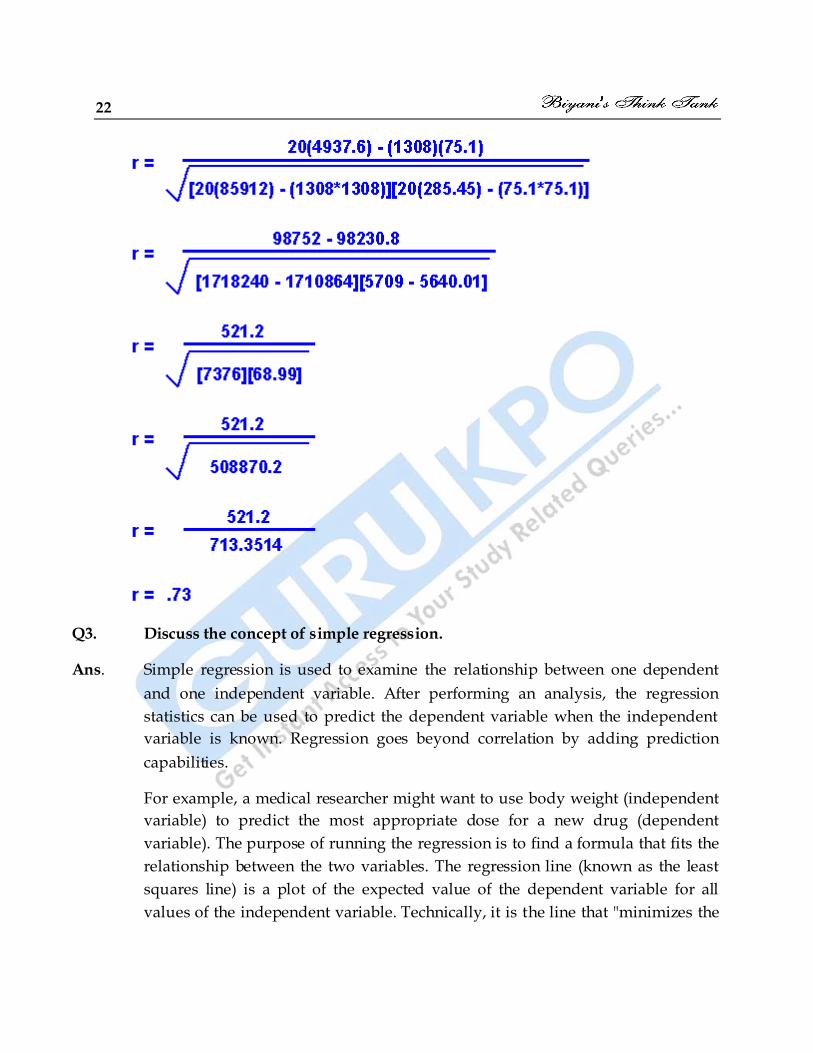
22
Q3. Discuss the concept of simple regression.
Ans. Simple regression is used to examine the relationship between one dependent
and one independent variable. After performing an analysis, the regression
statistics can be used to predict the dependent variable when the independent
variable is known. Regression goes beyond correlation by adding prediction
capabilities.
For example, a medical researcher might want to use body weight (independent
variable) to predict the most appropriate dose for a new drug (dependent
variable). The purpose of running the regression is to find a formula that fits the
relationship between the two variables. The regression line (known as the least
squares line) is a plot of the expected value of the dependent variable for all
values of the independent variable. Technically, it is the line that "minimizes the

Research methods in management 23
squared residuals". The regression line is the one that best fits the data on a
scatter plot.
Using the regression equation, the dependent variable may be predicted from the
independent variable. The slope of the regression line (b) is defined as the rise
divided by the run. The y intercept (a) is the point on the y axis where the
regression line would intercept the y axis. The slope and y intercept are
incorporated into the regression equation. The intercept is usually called the
constant, and the slope is referred to as the coefficient. Since the regression
model is usually not a perfect predictor, there is also an error term in the
equation.
In the regression equation, y is always the dependent variable and x is always
the independent variable. Here are three equivalent ways to mathematically
describe a linear regression model.
y = intercept + (slope x) + error
y = constant + (coefficient x) + error
y = a + bx + e
Q4. Discuss the calculation of regression equation.
Ans
In the table below, the x i column shows scores on the aptitude test. Similarly, the
yi column shows statistics grades. The last two rows show sums and mean scores
that we will use to conduct the regression analysis.
Student xi yi (xi - x) (yi - y) (xi - x)2 (yi - y)2 (xi - x)(yi - y)
1 95 85 17 8 289 64 136
2 85 95 7 18 49 324 126
3 80 70 2 -7 4 49 -14

24
4 70 65 -8 -12 64 144 96
5 60 70 -18 -7 324 49 126
Sum
390 385
730 630 470
Mean
78 77
The regression equation is a linear equation of the form: ŷ = b0 + b1x . To conduct
a regression analysis, we need to solve for b0 and b1. Computations are shown
below.
b1 = Σ [ (xi - x)(yi - y) ] / Σ [ (xi - x)2]
b1 = 470/730 = 0.644
b0 = y - b1 * x
b0 = 77 - (0.644)(78) = 26.768
Therefore, the regression equation is: ŷ = 26.768 + 0.644x .
Q5. What are the measures of Central Tendency?
Ans. Measures of Central Tendency show the tendency of data to cluster around a
central value. They give us a single value that represents the whole series of data.
Following are the measures of central tendency:
Mean
The mean (or average) of a set of data values is the sum of all of the data values
divided by the number of data values. That is:

Research methods in management 25
Example 1
The marks of seven students in a mathematics test with a maximum possible mark of 20 are given below: 15 13 18 16 14 17 12
Find the mean of this set of data values.
Solution:
So, the mean mark is 15.
Symbolically, we can set out the solution as follows:

26
So, the mean mark is 15.
Median
The median of a set of data values is the middle value of the data set when it has been
arranged in ascending order. That is, from the smallest value to the highest value.
Example 2
The marks of nine students in a geography test that had a maximum possible mark of 50 are given below:
47 35 37 32 38 39 36 34 35
Find the median of this set of data values.
Solution:
Arrange the data values in order from the lowest value to the highest value:
32 34 35 35 36 37 38 39 47

Research methods in management 27
The fifth data value, 36, is the middle value in this arrangement.
Note:
In general:
If the number of values in the data set is even, then the median is the average of the two middle values.
Example 3
Find the median of the following data set: 12 18 16 21 10 13 17 19
Solution:
Arrange the data values in order from the lowest value to the highest value: 10 12 13 16 17 18 19 21
The number of values in the data set is 8, which is even. So, the median is the average of the two middle values.

28
Alternative way:
There are 8 values in the data set.
The fourth and fifth scores, 16 and 17, are in the middle. That is, there is no one middle value.
Note:
Half of the values in the data set lie below the median and half lie above the median.
The median is the most commonly quoted figure used to measure property prices. The use of the median avoids the problem of the mean property price which is affected by a few expensive properties that are not representative of

Research methods in management 29
the general property market.
Mode
The mode of a set of data values is the value(s) that occurs most often.
The mode has applications in printing. For example, it is important to print more of the most popular books; because printing different books in equal numbers would cause a shortage of some books and an oversupply of others.
Likewise, the mode has applications in manufacturing. For example, it is important to manufacture more of the most popular shoes; because manufacturing different shoes in equal numbers would cause a shortage of some shoes and an oversupply of others.
Example 1
Find the mode of the following data set:
48 44 48 45 42 49 48
Solution:
The mode is 48 since it occurs most often.
Note:
It is possible for a set of data values to have more than one mode. If there are two data values that occur most frequently, we say that the set of
data values is bimodal.
If there is no data value or data values that occur most frequently, we say that the set of data values has no mode.
Q6 .Calculate Mean Median and Mode in frequency distribution.
X Frequency Mean Freq * Mean

30
--------------------------------------------------- Age 41-43 1 42 42 Group 38-40 3 39 117 35-37 4 36 144 32-34 4 33 132 29-31 5 30 150 26-28 8 27 216 23-25 10 24 240 20-22 18 21 378 17-19 23 18 414 14-16 17 15 255 11-13 10 12 120 S = 103 S = 2,208 _ 2208 Mean = X = ---- = 21.44 103 _ Then the mean X is defined as n (fiXi) X1f1 + X2f2 + X3f3+ .....+ Xnfn i = 1 X = -------------------------------- = -------------- f1f1 + X2f2 + X3f3+ .....+ Xnfn fi i = 1,n
(2) The Median:
If X1, X2, X3, ............ Xn is a set of data arranged in ascending order of magnitude, then the median of the set of data is given by :
Me = X(n+1)/2, if n is odd,
Me = (Xn/2 + X(n/2+1)), if n is even.

Research methods in management 31
This result is true also for an ungrouped frequency distribution. If the data is a grouped frequency distribution, then the median,
Me= l1 + ((N/2-c)/f)*(l2-l1)
where N = (f1 + f2 + f3 + .......... + fn)
l1 - l2 = The median class f = Cumulative Frequency of the median class c = Cumulative Frequency of the class preceding the median class
.
Cumulative X Freq Frequency (Less Than) --------------------------------------------- Age 11-13 10 10 Group 14-16 17 27 17-19 23 50 <--- Modal Class 20-22 18 68 <--- Median Class 23-25 10 78 26-28 8 86 Median = 103/2=51.5 29-31 5 91 32-34 4 95 35-37 4 99 38-40 3 102 41-43 1 103 S=103 Median Class Lower Bound = l1 = 20 Median Class Upper Bound = l2 = 22 N = 103, l2 - l1 = 2, f = 68, c = 50 Median = 20 + ((103/2 - 50)/68)*2 =20.0441
(3) The Mode:
For a grouped frequency distribution, the mode is given by
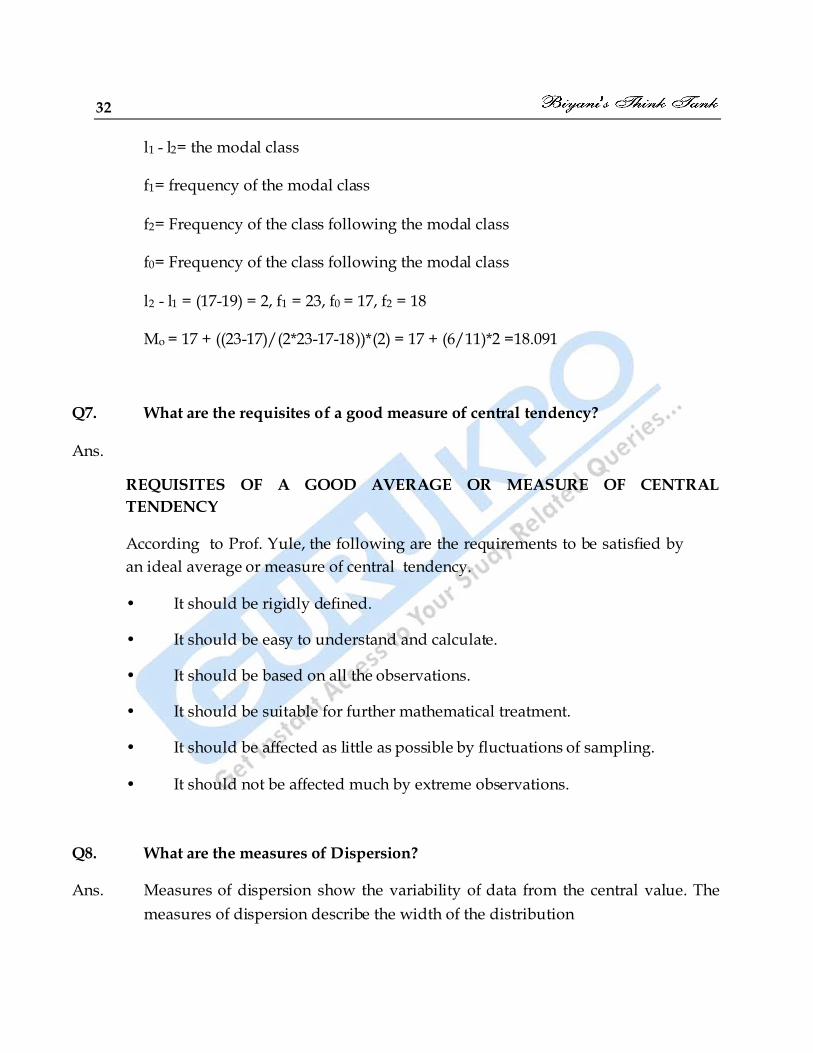
Mo = l1 + ((f1 - f0)/(2f1 - f0 - f2))*(l2 - l1)
where:
32
l1 - l2= the modal class
f1= frequency of the modal class
f2= Frequency of the class following the modal class
f0= Frequency of the class following the modal class
l2 - l1 = (17-19) = 2, f1 = 23, f0 = 17, f2 = 18
Mo = 17 + ((23-17)/(2*23-17-18))*(2) = 17 + (6/11)*2 =18.091
Q7. What are the requisites of a good measure of central tendency?
Ans.
REQUISITES OF A GOOD AVERAGE OR MEASURE OF CENTRAL
TENDENCY
According to Prof. Yule, the following are the requirements to be satisfied by
an ideal average or measure of central tendency.
• It should be rigidly defined.
• It should be easy to understand and calculate.
• It should be based on all the observations.
• It should be suitable for further mathematical treatment.
• It should be affected as little as possible by fluctuations of sampling.
• It should not be affected much by extreme observations.
Q8. What are the measures of Dispersion?
Ans. Measures of dispersion show the variability of data from the central value. The
measures of dispersion describe the width of the distribution

Research methods in management 33
Measures of Dispersion
Range
The range, R, of the data is the difference of the highest and smallest values being
analyzed.
Example {1, 3, 8, 3, 7, 11, 8, 3, 9, 10}
R = 11 - 1 = 10
Deviation
The deviation is the difference of each value from the mean. This is used in the
calculation of the standard deviation and variance. "x" is the point of interest. The
sum of deviations from the mean is always zero.
Standard Deviation
The standard deviation is shown by the following formulas. It also equals the
square root of the variance. "x" is the point of interest.
"n" represent the sample size,
Variance
The variance is the standard deviation squared.
Example

34
An owner of a restaurant is interested in how much people spend at the restaurant. He examines 10 randomly selected receipts for parties of four and writes down the following data.
44, 50, 38, 96, 42, 47, 40, 39, 46, 50
He calculated the mean by adding and dividing by 10 to get
x = 49.2
Below is the table for getting the standard deviation:
x x - 49.2
(x - 49.2 )2
44 -5.2 27.04
50 0.8 0.64
38 11.2 125.44
96 46.8 2190.24
42 -7.2 51.84
47 -2.2 4.84
40 -9.2 84.64
39 -10.2
104.04
46 -3.2 10.24
50 0.8 0.64
Total 2600.4
Now
2600.4 = 288.7 10 - 1

Research methods in management 35
Hence the variance is 289 and the standard deviation is the square root of 289 = 17. One of the flaws involved with the standard deviation, is that it depends on the units that are used. One way of handling this difficulty, is called the coefficient of variation which is the standard deviation divided by the mean times 100%
CV = 100%
In the above example, it is
17 100% = 34.6% 49.2
This tells us that the standard deviation of the restaurant bills is 34.6% of the mean.
Q9. What do you mean by probability distribution?
Ans. In probability theory and statistics, a probability distribution identifies either the
probability of each value of a random variable (when the variable is discrete), or
the probability of the value falling within a particular interval (when the variable
is continuous). The probability distribution describes the range of possible values
that a random variable can attain and the probability that the value of the
random variable is within any (measurable) subset of that range.
Q10. Describe Normal distribution.
Ans. In probability theory, the normal (or Gaussian) distribution, is a continuous
probability distribution that is often used as a first approximation to describe
real-valued random variables that tend to cluster around a single mean value.
The graph of the associated probability density function is “bell”-shaped, and is
known as the Gaussian function or bell curve.

36
where parameter μ is the mean(location of the peak) and σ 2 is the variance (the measure of the width of the distribution). The distribution with μ = 0 and σ 2 = 1 is called the standard normal.
where parameter μ is the mean (location of the peak) and σ 2 is the variance (the
measure of the width of the distribution). The distribution with μ = 0 and σ 2 = 1
is called the standard normal.
The normal distribution is considered the most “basic” continuous probability
distribution due to its role in the central limit theorem, and is one of the first
continuous distributions taught in elementary statistics classes. Specifically, by
the central limit theorem, under certain conditions the sum of a number of
random variables with finite means and variances approaches a normal
distribution as the number of variables increases. For this reason, the normal
distribution is commonly encountered in practice, and is used throughout
statistics, natural sciences, and social sciences as a simple model for complex
phenomena.
Q11 . Difine Binomial Distribution.
Ans. In probability theory and statistics, the binomial distribution is the discrete
probability distribution of the number of successes in a sequence of n
independent yes/no experiments, each of which yields success with probability
p. Such a success/failure experiment is also called a Bernoulli experiment or
Bernoulli trial. In fact, when n = 1, the binomial distribution is a Bernoulli
distribution. The binomial distribution is the basis for the popular binomial test
of statistical significance.
The binomial distribution gives the discrete probability distribution of obtaining
exactly successes out of Bernoulli trials (where the result of each Bernoulli trial
is true with probability and false with probability ). The binomial distribution is
therefore given by the formula:
In general, if the random variable K follows the binomial distribution with parameters n and p, we write K ~ B(n, p). The probability of getting exactly k successes in n trials is given by the
Probability mass function

Research methods in management 37
for k = 0, 1, 2, ..., n, where
Where,
No. of trials=n
No. of success=k
Probability of success=p
Probability of failure=q
Q12. Define Poisson Distribution.
Ans
In probability theory and statistics, the Poisson distribution is a discrete
probability distribution that expresses the probability of a number of events
occurring in a fixed period of time if these events occur with a known average
rate and independently of the time since the last event.
If the expected number of occurrences in this interval is λ, then the probability
that there are exactly k occurrences (k being a non-negative integer, k = 0, 1, 2, ...)
is equal to
where
• e is the base of the natural logarithm (e = 2.71828...)
38
• k is the number of occurrences of an event — the probability of which is
given by the function
• k! is the factorial of k
• λ is a positive real number, equal to the expected number of occurrences
that occur during the given interval. For instance, if the events occur on average
4 times per minute, and one is interested in the probability of an event occurring
k times in a 10 minute interval, one would use a Poisson distribution as the
model with λ = 10×4 = 40.
Q13 . What do you mean by Hypothesis Testing?
Ans
Statistical hypothesis test is a method of making decisions using data, whether
from a controlled experiment or an observational study (not controlled). In
statistics, a result is called statistically significant if it is unlikely to have occurred
by chance alone, according to a pre-determined threshold probability, the
significance level.
Q14 . Discuss the procedure of hypothesis testing.
Ans. Testing Procedure:.
1.The first step is to state the relevant null and alternative hypotheses. whether
the alternative hypothesis can either be accepted or stays undecided as it was
before the test.
2.The second step is to consider the statistical assumptions being made about the
sample in doing the test; for example, assumptions about the statistical
independence or about the form of the distributions of the observations. 4.
Decide which test is appropriate, and stating the relevant test statistic .
3 Derive the distribution of the test statistic under the null hypothesis from the
assumptions. For example the test statistics may follow a Student's t distribution
or a normal distribution.

Research methods in management 39
4. The distribution of the test statistic partitions the possible values of T into
those for which the null-hypothesis is rejected, the so called critical region, and
those for which it is not.
7. Compute from the observations the observed value of the test statistic .
8. Decide to either fail to reject the null hypothesis or reject it in favor of the
alternative. The decision rule is to reject the null hypothesis H0 if the observed
value is in the critical region, and to accept or "fail to reject" the hypothesis
otherwise.
Q15 . Discuss the Z -test.
Ans. The Z-test compares sample and population means to determine if there is a
significant difference.
It requires a simple random sample from a population with a Normal
distribution and where where the mean is known.
The z measure is calculated as:
Suppose that in a particular geographic region, the mean and standard deviation of scores on a reading test are 100 points, and 12 points, respectively. Our interest is in the scores of 55 students in a particular school who received a mean score of 96. We can ask whether this mean score is significantly lower than the regional mean — that is, are the students in this school comparable to a simple random sample of 55 students from the region as a whole, or are their scores surprisingly low?
We begin by calculating the standard error of the mean:
Next we calculate the z-score, which is the distance from the sample mean to the population mean in units of the standard error:

40
In this example, we treat the population mean and variance as known, which would be appropriate either if all students in the region were tested, or if a large random sample were used to estimate the population mean and variance with minimal estimation error.
The classroom mean score is 96, which is −2.47 standard error units from the population mean of 100. Looking up the z-score in a table of the standard normal distribution, we find that the probability of observing a standard normal value below -2.47 is approximately 0.5 - 0.4932 = 0.0068. This is the one-sided p-value for the null hypothesis that the 55 students are comparable to a simple random sample from the population of all test-takers. The two-sided p-value is approximately 0.014 (twice the one-sided p-value).
Another way of stating things is that with probability 1 − 0.014 = 0.986, a simple random sample of 55 students would have a mean test score within 4 units of the population mean. We could also say that with 98% confidence we reject the null hypothesis that the 55 test takers are comparable to a simple random sample from the population of test-takers.
Q16 . Discuss the uses of t-test.
Independent one sample t-test
In testing the null hypothesis that the population means is equal to a specified value μ0, one uses the statistic
where s is the sample standard deviation of the sample and n is the sample size. The degrees of freedom used in this test is n − 1.
Independent two-sample t-test
Equal sample sizes, equal variance
This test is only used when both:
the two sample sizes (that is, the number, n, of participants of each group) are equal; it can be assumed that the two distributions have the same variance.

Research methods in management 41
The t statistic to test whether the means are different can be calculated as follows:
where
Here is the grand standard deviation (or pooled standard deviation), 1 = group one, 2 = group two. The denominator of t is the standard error of the difference between two means.
For significance testing, the degrees of freedom for this test is 2n − 2 where n is the number of participants in each group.
Unequal sample sizes, equal variance
This test is used only when it can be assumed that the two distributions have the same variance. The t statistic to test whether the means are different can be calculated as follows:
Where
Note that the formulae above are generalizations for the case where both samples have equal sizes (substitute n1 and n2 for n and you'll see).
is an estimator of the common standard deviation of the two samples: it is defined in this way so that its square is an unbiased estimator of the common variance whether or not the population means are the same. In these formulae, n = number of participants, 1 = group one, 2 = group two. n − 1 is the number of
42
degrees of freedom for either group, and the total sample size minus two (that is, n1 + n2 − 2) is the total number of degrees of freedom, which is used in significance testing.
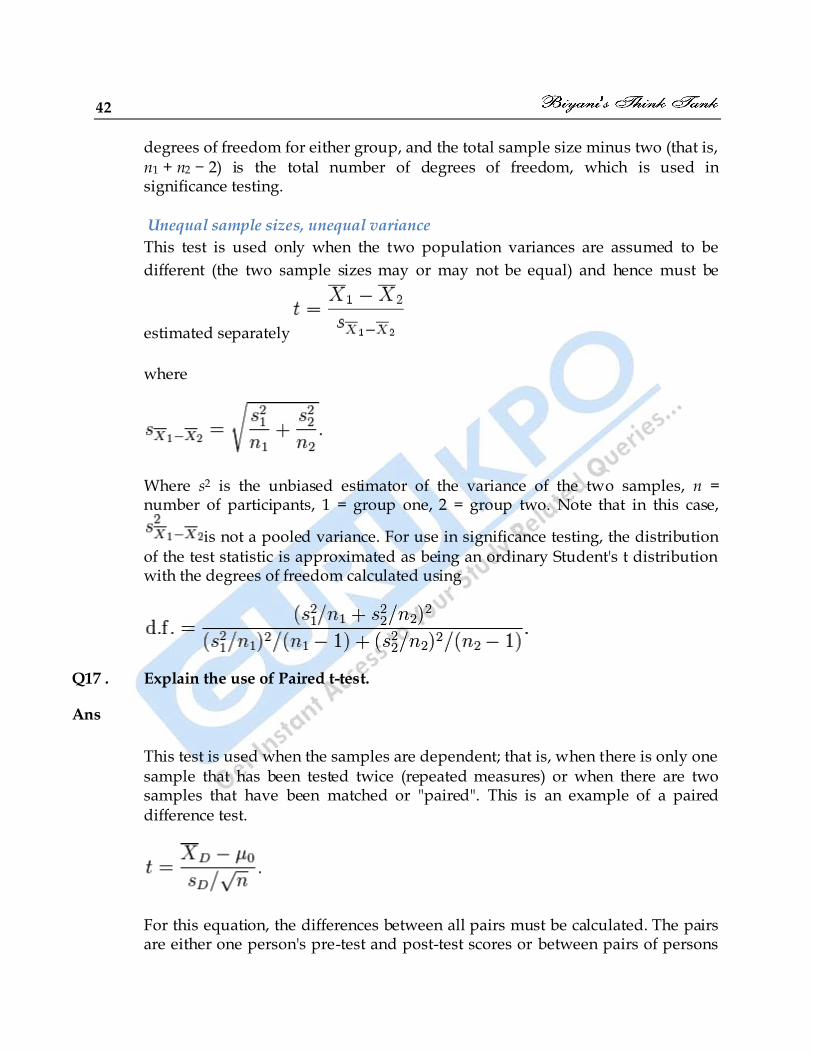
Unequal sample sizes, unequal variance
This test is used only when the two population variances are assumed to be
different (the two sample sizes may or may not be equal) and hence must be
estimated separately
where
Where s2 is the unbiased estimator of the variance of the two samples, n = number of participants, 1 = group one, 2 = group two. Note that in this case,
is not a pooled variance. For use in significance testing, the distribution of the test statistic is approximated as being an ordinary Student's t distribution with the degrees of freedom calculated using
Q17 . Explain the use of Paired t-test.
Ans
This test is used when the samples are dependent; that is, when there is only one sample that has been tested twice (repeated measures) or when there are two samples that have been matched or "paired". This is an example of a paired difference test.
For this equation, the differences between all pairs must be calculated. The pairs are either one person's pre-test and post-test scores or between pairs of persons

Research methods in management 43
matched into meaningful groups (for instance drawn from the same family or age group: see table). The average (XD) and standard deviation (sD) of those differences are used in the equation. The constant μ0 is non-zero if you want to test whether the average of the difference is significantly different from μ0. The degree of freedom used is n − 1.
Q18 . Discuss the application of Chi –square test.
Ans. Chi-square is a statistical test commonly used to compare observed data with
data we would expect to obtain according to a specific hypothesis. For example,
if, according to Mendel's laws, you expected 10 of 20 offspring from a cross to be
male and the actual observed number was 8 males, then you might want to know
about the "goodness to fit" between the observed and expected. Were the
deviations (differences between observed and expected) the result of chance, or
were they due to other factors. How much deviation can occur before you, the
investigator, must conclude that something other than chance is at work, causing
the observed to differ from the expected. The chi-square test is always testing
what scientists call the null hypothesis, which states that there is no significant
difference between the expected and observed result.
The formula for calculating chi-square is:
The chi-square test is defined for the hypothesis:
H0: The data follow a specified distribution.
Ha: The data do not follow the specified distribution.
Test For the chi-square goodness-of-fit computation, the test statistic is defined as
where is the observed frequency and is the expected frequency.
Q19 . What do you mean by Analysis of Varience?
Ans. An important technique for analyzing the effect of categorical factors on a
response is to perform an Analysis of Variance. An ANOVA decomposes the
variability in the response variable amongst the different factors. Depending
upon the type of analysis, it may be important to determine: (a) which factors

44
have a significant effect on the response, and/or (b) how much of the variability
in the response variable is attributable to each factor.
1. One-Way ANOVA - used when there is only a single categorical factor. This is
equivalent to comparing multiple groups of data.
2. Multifactor ANOVA - used when there is more than one categorical factor,
arranged in a crossed pattern. When factors are crossed, the levels of one factor
appear at more than one level of the other factors.
Q20. What do you mean by Non Parametric Tests?
Ans. Non-parametric tests cover techniques that do not rely on data belonging to any particular distribution. These include distribution free methods, which do not rely on assumptions that the data are drawn from a given probability distribution. As such it is the opposite of parametric statistics. It includes non-parametric statistical models, inference and statistical tests. Following are the nonparametric tests
The Sign test
The sign test is one of the simplest nonparametric tests. It is for use with 2 repeated (or correlated) measures and measurement is assumed to be at least ordinal. For each subject, subtract the 2nd score from the 1st, and write down the sign of the difference. (That is write “-” if the difference score is negative, and “+” if it is positive.) The usual null hypothesis for this test is that there is no difference between the two treatments. If this is so, then the number of + signs (or - signs, for that matter) should have a binomial distribution1 with p = .5, and N = the number of subjects. In other words, the
sign test is just a binomial test with + and - in place of Head and Tail (or Success and Failure). Mann-Whitney U Test
The null hypothesis assumes that the two sets of scores are samples from the same population; and therefore, because sampling was random, the two sets of scores do not differ systematically from each other.

Research methods in management 45
The alternative hypothesis, on the other hand, states that the two sets of scores do differ systematically. Runs test
The runs test (also called Wald–Wolfowitz test after Abraham Wald and Jacob
Wolfowitz) is a non-parametric statistical test that checks a randomness hypothesis for a two-valued data sequence. More precisely, it can be used to test the hypothesis that the elements of the sequence are mutually independent.
Rank sum test
The t-test is the standard test for testing that the difference between
population means for two non-paired samples are equal. If the populations
are non-normal, particularly for small samples, then the t-test may not be
valid. The rank sum test is an alternative that can be applied when
distributional assumptions are suspect.
Q21. Discuss the use of Rank Correlation.
Ans
When the distribution of variables is not Normal, the degree of relationship
between the variables can be determined using Rank correlation. Instead of using
the precise values of the variables, the data are ranked in order of size, and
calculations are based on the differences between the ranks of corresponding
values X and Y.
Q22. Explain the calculation of Rank Correlation.
Ans
In this example, we will use the raw data in the table below to calculate the correlation between the IQ of a person with the number of hours spent in front of TV per week.
IQ, Xi Hours of TV per week, Yi
106 7

46
86 0
100 27
101 50
99 28
103 29
97 20
113 12
112 6
110 17
First, we must find the value of the term . To do so we use the following steps, reflected in the table below.
1. Sort the data by the first column (Xi). Create a new column xi and assign it the ranked values 1,2,3,...n.
2. Next, sort the data by the second column (Yi). Create a fourth column yi and similarly assign it the ranked values 1,2,3,...n.
3. Create a fifth column di to hold the differences between the two rank columns (xi and yi).
4. Create one final column to hold the value of column di squared.
IQ, Xi Hours of TV per week, Yi rank xi rank yi di
86 0 1 1 0 0
97 20 2 6 −4 16

Research methods in management 47
99 28 3 8 −5 25
100 27 4 7 −3 9
101 50 5 10 −5 25
103 29 6 9 −3 9
106 7 7 3 4 16
110 17 8 5 3 9
112 6 9 2 7 49
113 12 10 4 6 36
The value of n is 10. So these values can now be substituted back into the equation,
Which evaluates to ρ = −0.175757575... This low value shows that the correlation between IQ and hours spent watching TV is very low.

48
Chapter 6
Bibliography and Report writing
Q 1. What do you mean by Bibliography?
Ans. A bibliography is a list of writings that share a common factor: this may be a
topic, a language, a period, or some other theme. The list may be comprehensive
or selective. One particular instance of this is the list of sources used or
considered in preparing a work, sometimes called a reference list.
Citation formats vary, but an entry for a book in a bibliography usually contains
the following information:
• author(s)
• title
• publisher
• date of publication
An entry for a journal or periodical article usually contains:
• author(s)
• article title
• journal title
• volume
• pages
• date of publication

Research methods in management 49
Q2. Discuss the process of Report Writing.
Ans GUIDELINES FOR REPORT WRITING 1. Title Page. First page of report. Try to find a title that clearly describes the
work you have done and be as precise as possible. Mention your name, role number, guide’s (and co-guide’s) name, name of the department (i.e. Energy Systems Engineering), name of the institute, place and month and year of the report. 2. Abstract. On a separate page, immediately following the title page, summarize
the main points of the report. Persons getting interested in the report after reading the title, should be able to judge from the abstract whether the report is really interesting for them. 3. Table of Contents (TOC). Should list only those items that follow it appearing
in the following order. - List of tables (1.1, 1.2, 1.3.., 2.1, 2.2, .. etc.) - List of figures (1.1, 1.2, 1.3.., 2.1, 2.2, .. etc.) - The chapters (1, 2, … N, followed by the name of the chapter), - Sections within chapters (e.g. 1.1, 2.4, etc. + name) - Appendices (I, II, III, IV, .. etc. + name), if any - References - Acknowledgements 4. The Chapters. The number of chapters you need and their contents strongly depend on the topic selected and the subject matter to be presented. Roughly the following chapters may be included. However, it is your own report and you have to structure it according to the flow of overall logic and Organization. Introduction
Literature Survey.
Theory-Oriented Chapters Practice-Oriented Chapters.
Conclusions. 5. References.
. 6. The Appendices. Appendices are useful for those things that you consider important, but that do not fit in the main presentation of your work

50
Master of Business Administration
(Part-I) Examination
Research Methods in Management, 6002
April-2007 Time : 3 Hours Total Marks : 70
Attempt overall 5 questions including question of section D, which is compulsory. Select at
least 1 question from each section A, B and C.
Section-A 1. (a) Differentiate between descriptive and experimental research designs. What is the
difference between active factor and blocking factor?
(b) A marketing manager of a local chocolate manufacturing company likes to
determine the price for each chocolate in comparison with national brands. He
thinks that the price lower than national brands will be a right decision to increase
sales. He also believes that the chocolate purchase also depends on customers
income level. He wishes to test his assumption through the appropriate research
which will help him to arrive at appropriate price decision. You are required to
develop an appropriate research design.
2. (a) Recommend an appropriate data collection method in the following situations.
Provide justification for your choice :
(i) When topic is highly technical and specialized and complex.
(ii) When population is illiterate.
(iii) When topic is related to understanding attitude of college going students.
(iv) When understanding buying behavior of shopper in a mall.
(b) What care must be taken to develop a questionnaire? Differentiate between
snowballing, stratified and quota sampling methods.
Section-B
3. (a) Identify situations in which cluster analysis, factor analysis and conjoint analysis
may be used.

Research methods in management 51
(b) An existing restaurant in Jaipur intends to open a Dinning Club. A survey of
Rajasthan University students was conducted by the research agency hired by the
restaurant owner. It interviewed 200 students and learned of their intentions to
join such a club. The researcher would like to analyse the results by living
arrangement. The 200 responses are classified into the four categories as sho wn in
the table below. Do these variations indicate there is a significant difference
among these students, or are these sampling variations only?
Living
arrangement
Intend to
join
Number
Interviewed
Percent
Interviewed
/200
Expected
Frequencies
(Percent 60)
Dormetory 16 90 45 27
Rooms, Nearby 13 40 20 12
Rooms, distant 16 40 20 12
Live at home 15 30 15 9
Total 60 200 100 60
4. Atlanta photocopier in Mansarovar, Jaipur has been doing 500 photocopies per day on
average. A New Management Institute viz. Centurion Institute of professional studies
started its operations in Mansarovar, due to which Atlanta photocopier expects to
increase its business. During the first 15 days after the start of the Institute, the
photocopies done are – 550, 570, 490, 615, 505, 580, 570, 460, 600, 580, 530, 525, 530,
545, and 540. On the basis of this information can Atlanta conclude that its sales have
increased? A significance level of 5% may be used.
Section-C
5. What is difference between technical report and Management report? List out important
components of a technical report. Arrange the following information in appropriate way
so as to reflect in a bibliography. “An excellent book in advertising was published by
PHI, New Delhi in 2006. It was referred by an important scholar for learning more about

52
creativity in advertising on page from 270 to 298. The book is titled “Advertising :
Planning and implementation” and authored by Dr. R. S. Dhayal and Dr. S. Sharma.
6. Differentiate between Rating and Ranking Scales. What factors influence the choice of a
scale in a given situation? Identify from among various scales, at least two, that generate
ordinal, nominal and interval data. Develop “Fixed Sum Scale” and “Semantic
differential scale”. Make suitable assumptions for the same, if required.
Section-C
7. Case Study :
Solve the questions that follow the case study.
The administrators of Soni Hospital, Jaipur one of the city’s largest, are interested to
know the attitudes of the patients towards various aspects of the hospital after a stay of
approximately one week or longer. The hospital administrators are specifically interested
in the attitudes of those patients who have been treated in the hospital from 01, April
2006 onwards till today and on average 2500 patients are treated in the hospital. Out of
this almost 35 percent patients stay beyond one week in the hospital for treatment.
They have authorized the undertaking of a marketing research study to gather this, and
have directed that it covers the following areas : All administrative functions with which
patients come into contact (such as admitting, bulling and so on); the treatment and
attitudes of interns and doctors; the food service and general housekeeping; the attention
of nurses and nurse’s aides; the courtesy and care of personnel in such departments as
physical therapy and x-ray; the availability of religious services; and a generally quiet
and clean environment.
(a) What research design (exploratory, descriptive, experimental would you
recommend for this study? And why?
(b) What would be the best sample method and why? What sample size you would
recommend?
(c) Design a questionnaire that can be used for this study.

Research methods in management 53
Related Documents


![MBA Marketing Seminar [Dr. Carter; MKTG.600] COMBINED SET OF 1 st PHASE “MARKETING PLANNING” TEXT CONCEPT SLIDES.](https://static.cupdf.com/doc/110x72/56649eda5503460f94be8ac7/mba-marketing-seminar-dr-carter-mktg600-combined-set-of-1-st-phase-marketing.jpg)