186 VOLUME 112 | NUMBER 2 | February 2004 • Environmental Health Perspectives Research | Article Organophosphorus (OP) pesticides are among the most widely used pesticides in the United States and are used in both agricultural and residential settings. Approximately 40 OP pesticides are registered with the U.S. Environmental Protection Agency (U.S. EPA) for use in the United States (U.S. EPA 2003). Examples of commonly used OP pesticides are chlorpyrifos (Dursban), diazinon (Dianon), azinphos methyl (Guthion), and oxydemeton- methyl (Metasystox-R). OP pesticides are popular because of their broad spectrum of applications and potent toxicity to insects, their relative inexpensive costs, and their decreased likelihood for pest resistance (Karalliedde et al. 2001). According to U.S. EPA sales data, OP pesticides account for about half of all insecti- cides used in the United States. About 80 mil- lion pounds of OP pesticides are used annually in the United States, with 75% of their use in agriculture (U.S. EPA 1991). Crops on approximately 38 million acres of farmland are treated annually with OP insecticides (U.S. EPA 1991). A smaller percentage of the total OP use has been in residential settings. Whitmore et al. (2003) found that nearly half of U.S. households with a child younger than 5 years of age had a pesticide stored within a child’s reach. In outdoor settings in contact with light and water, OP pesticides degrade relatively rapidly. However, when used indoors or as a part of structural treatments, these com- pounds can remain stable for much longer periods (Fenske et al. 2000) and can remain potentially available for repeated exposure for both adults and children. Most OP pesticides have the same general structure (Figure 1), a common mode of action as an insecticide, and a common mode of acute toxicity in humans and other animals (Mileson et al. 1998). In vivo, these pesticides are potent inhibitors of the enzyme acetyl cholinesterase (AChE), which breaks down the neurotransmitter acetylcholine. More specifically, the hydroxyl group of a serine residue in the active site of AChE chemically reacts with the OP pesticide or its metaboli- cally activated form to chemically bind the enzyme and prevent it from performing its natural function. In most instances, the origi- nal enzyme may be regenerated via a simple hydrolysis, similar to its regeneration after breaking down acetylcholine. Most OP pesticides are composed of a phosphate (or phosphorothioate or phosphoro- dithioate) moiety that, in most cases, is O,O-dialkyl substituted, where the alkyl groups are usually dimethyl or diethyl, and an organic group (Figure 1). For example, diazinon is composed of an O, O-diethyl phosphoro- thioate to which a 2-isopropyl-4-methyl-6- hydroxypyrimidinyl group is attached. Once entering the body, OPs can be enzymatically converted to their oxon form, which then reacts with available cholinesterase. The oxon also can be enzymatically or spontaneously hydrolyzed to form a dialkyl phosphate (DAP) metabolite and the organic group moiety. In the case of diazinon, diethylphosphate (DEP) and 2-isopropyl-4-methyl-6-hydroxypyrimidine (IMPY) may be formed. If the pesticide is not converted to its oxon form, it can undergo hydrolysis to its organic group metabolite and dialkylthionate metabolites (i.e., dialkylthio- phosphate and/or dialkyldithiophosphate). For diazinon, these metabolites are diethyl- thiophosphate (DETP) and IMPY. These metabolites and/or their glucuronide or sulfate conjugates are excreted in urine. After the National Research Council’s 1993 report, which focused on dietary pesti- cide exposure among infants and children, the advantages of using OP pesticides were scruti- nized because of the potential consequences of childhood exposures. Consequently, the passage of the Food Quality Protection Act (FQPA) of 1996 required the U.S. EPA to reassess all pesticide residue tolerances on food and, in this reassessment, to give special con- sideration to potential cumulative and aggre- gate exposures to children. OP pesticides were the first class of pesticides for which tolerances were reassessed because of their common mode Address correspondence to D.B. Barr, Centers for Disease Control and Prevention, 4770 Buford Highway NE, Mailstop F-17, Atlanta, GA 30341 USA. Telephone: (770) 488-7886. Fax: (770) 488- 0142. E-mail: [email protected] We thank the people at the National Center for Health Statistics (NCHS) and Westat who were responsible for planning and conducting the National Health and Nutrition Examination Study (NHANES), especially B. Lewis, C. Johnson, B. Lindstrom, A. Jeffries, and C. Humbertson. We thank E. Gunter and C. Pfeiffer for managing the National Center for Environmental Health’s involve- ment in NHANES and for serving as liaisons with NCHS, and C. Fernandez for technical assistance. We also thank the Fairview University Medical Center for providing creatinine measurements. The authors declare they have no competing financial interests. Received 6 June 2003; accepted 4 November 2003. Concentrations of Dialkyl Phosphate Metabolites of Organophosphorus Pesticides in the U.S. Population Dana B. Barr, 1 Roberto Bravo, 1 Gayanga Weerasekera, 1 Lisa M. Caltabiano, 1 Ralph D. Whitehead, Jr., 1 Anders O. Olsson, 1 Samuel P. Caudill, 1 Susan E. Schober, 2 James L. Pirkle, 1 Eric J. Sampson, 1 Richard J. Jackson, 1 and Larry L. Needham 1 1 National Center for Environmental Health, Centers for Disease Control and Prevention, Atlanta, Georgia, USA; 2 National Center for Health Statistics, Centers for Disease Control and Prevention, Hyattsville, Maryland, USA We report population-based concentrations, stratified by age, sex, and racial/ethnic groups, of dialkyl phosphate (DAP) metabolites of multiple organophosphorus pesticides. We measured dimethylphosphate (DMP), dimethylthiophosphate (DMTP), dimethyldithiophosphate (DMDTP), diethylphosphate (DEP), diethylthiophosphate (DETP), and diethyldithiophosphate (DEDTP) concentrations in 1,949 urine samples collected in U.S. residents 6–59 years of age dur- ing 1999 and 2000 as a part of the ongoing National Health and Nutrition Examination Survey (NHANES). We detected each DAP metabolite in more than 50% of the samples, with DEP being detected most frequently (71%) at a limit of detection of 0.2 μg/L. The geometric means for the metabolites detected in more than 60% of the samples were 1.85 μg/L for DMTP and 1.04 μg/L for DEP. The 95th percentiles for each metabolite were DMP, 13 μg/L; DMTP, 46 μg/L; DMDTP, 19 μg/L; DEP, 13 μg/L; DETP, 2.2 μg/L; and DEDTP, 0.87 μg/L. We deter- mined the molar sums of the dimethyl-containing and diethyl-containing metabolites; their geo- metric mean concentrations were 49.4 and 10.5 nmol/L, respectively, and their 95th percentiles were 583 and 108 nmol/L, respectively. These data are also presented as creatinine-adjusted con- centrations. Multivariate analyses showed concentrations of DAPs in children 6–11 years of age that were consistently significantly higher than in adults and often higher than in adolescents. Although the concentrations between sexes and among racial/ethnic groups varied, no significant differences were observed. These data will be important in evaluating the impact of organophos- phorus pesticide exposure in the U.S. population and the effectiveness of regulatory actions. Key words: biologic monitoring, dialkyl phosphate, general population, organophosphate, organophosphorus, reference range, urine. Environ Health Perspect 112:186–200 (2004). doi:10.1289/ehp.6503 available via http://dx.doi.org/ [Online 4 November 2003]

Welcome message from author
This document is posted to help you gain knowledge. Please leave a comment to let me know what you think about it! Share it to your friends and learn new things together.
Transcript
186 VOLUME 112 | NUMBER 2 | February 2004 • Environmental Health Perspectives
Research | Article
Organophosphorus (OP) pesticides are amongthe most widely used pesticides in theUnited States and are used in both agriculturaland residential settings. Approximately40 OP pesticides are registered with the U.S.Environmental Protection Agency (U.S. EPA)for use in the United States (U.S. EPA 2003).Examples of commonly used OP pesticides arechlorpyrifos (Dursban), diazinon (Dianon),azinphos methyl (Guthion), and oxydemeton-methyl (Metasystox-R). OP pesticides arepopular because of their broad spectrum ofapplications and potent toxicity to insects, theirrelative inexpensive costs, and their decreasedlikelihood for pest resistance (Karalliedde et al.2001). According to U.S. EPA sales data, OPpesticides account for about half of all insecti-cides used in the United States. About 80 mil-lion pounds of OP pesticides are used annuallyin the United States, with 75% of their use inagriculture (U.S. EPA 1991). Crops onapproximately 38 million acres of farmland aretreated annually with OP insecticides (U.S.EPA 1991). A smaller percentage of the totalOP use has been in residential settings.Whitmore et al. (2003) found that nearly halfof U.S. households with a child younger than5 years of age had a pesticide stored within achild’s reach. In outdoor settings in contact
with light and water, OP pesticides degraderelatively rapidly. However, when used indoorsor as a part of structural treatments, these com-pounds can remain stable for much longerperiods (Fenske et al. 2000) and can remainpotentially available for repeated exposure forboth adults and children.
Most OP pesticides have the same generalstructure (Figure 1), a common mode ofaction as an insecticide, and a common modeof acute toxicity in humans and other animals(Mileson et al. 1998). In vivo, these pesticidesare potent inhibitors of the enzyme acetylcholinesterase (AChE), which breaks downthe neurotransmitter acetylcholine. Morespecifically, the hydroxyl group of a serineresidue in the active site of AChE chemicallyreacts with the OP pesticide or its metaboli-cally activated form to chemically bind theenzyme and prevent it from performing itsnatural function. In most instances, the origi-nal enzyme may be regenerated via a simplehydrolysis, similar to its regeneration afterbreaking down acetylcholine.
Most OP pesticides are composed of aphosphate (or phosphorothioate or phosphoro-dithioate) moiety that, in most cases, isO,O-dialkyl substituted, where the alkyl groupsare usually dimethyl or diethyl, and an organic
group (Figure 1). For example, diazinon iscomposed of an O,O-diethyl phosphoro-thioate to which a 2-isopropyl-4-methyl-6-hydroxypyrimidinyl group is attached. Onceentering the body, OPs can be enzymaticallyconverted to their oxon form, which thenreacts with available cholinesterase. The oxonalso can be enzymatically or spontaneouslyhydrolyzed to form a dialkyl phosphate (DAP)metabolite and the organic group moiety. In thecase of diazinon, diethylphosphate (DEP) and2-isopropyl-4-methyl-6-hydroxypyrimidine(IMPY) may be formed. If the pesticide is notconverted to its oxon form, it can undergohydrolysis to its organic group metabolite anddialkylthionate metabolites (i.e., dialkylthio-phosphate and/or dialkyldithiophosphate).For diazinon, these metabolites are diethyl-thiophosphate (DETP) and IMPY. Thesemetabolites and/or their glucuronide or sulfateconjugates are excreted in urine.
After the National Research Council’s1993 report, which focused on dietary pesti-cide exposure among infants and children, theadvantages of using OP pesticides were scruti-nized because of the potential consequencesof childhood exposures. Consequently, thepassage of the Food Quality Protection Act(FQPA) of 1996 required the U.S. EPA toreassess all pesticide residue tolerances on foodand, in this reassessment, to give special con-sideration to potential cumulative and aggre-gate exposures to children. OP pesticides werethe first class of pesticides for which toleranceswere reassessed because of their common mode
Address correspondence to D.B. Barr, Centers forDisease Control and Prevention, 4770 BufordHighway NE, Mailstop F-17, Atlanta, GA 30341USA. Telephone: (770) 488-7886. Fax: (770) 488-0142. E-mail: [email protected]
We thank the people at the National Center forHealth Statistics (NCHS) and Westat who wereresponsible for planning and conducting theNational Health and Nutrition Examination Study(NHANES), especially B. Lewis, C. Johnson, B.Lindstrom, A. Jeffries, and C. Humbertson. Wethank E. Gunter and C. Pfeiffer for managing theNational Center for Environmental Health’s involve-ment in NHANES and for serving as liaisons withNCHS, and C. Fernandez for technical assistance.We also thank the Fairview University MedicalCenter for providing creatinine measurements.
The authors declare they have no competingfinancial interests.
Received 6 June 2003; accepted 4 November 2003.
Concentrations of Dialkyl Phosphate Metabolites of OrganophosphorusPesticides in the U.S. Population
Dana B. Barr,1 Roberto Bravo,1 Gayanga Weerasekera,1 Lisa M. Caltabiano,1 Ralph D. Whitehead, Jr.,1
Anders O. Olsson,1 Samuel P. Caudill,1 Susan E. Schober,2 James L. Pirkle,1 Eric J. Sampson,1 Richard J. Jackson,1
and Larry L. Needham1
1National Center for Environmental Health, Centers for Disease Control and Prevention, Atlanta, Georgia, USA; 2National Center forHealth Statistics, Centers for Disease Control and Prevention, Hyattsville, Maryland, USA
We report population-based concentrations, stratified by age, sex, and racial/ethnic groups, ofdialkyl phosphate (DAP) metabolites of multiple organophosphorus pesticides. We measureddimethylphosphate (DMP), dimethylthiophosphate (DMTP), dimethyldithiophosphate(DMDTP), diethylphosphate (DEP), diethylthiophosphate (DETP), and diethyldithiophosphate(DEDTP) concentrations in 1,949 urine samples collected in U.S. residents 6–59 years of age dur-ing 1999 and 2000 as a part of the ongoing National Health and Nutrition Examination Survey(NHANES). We detected each DAP metabolite in more than 50% of the samples, with DEPbeing detected most frequently (71%) at a limit of detection of 0.2 µg/L. The geometric means forthe metabolites detected in more than 60% of the samples were 1.85 µg/L for DMTP and1.04 µg/L for DEP. The 95th percentiles for each metabolite were DMP, 13 µg/L; DMTP,46 µg/L; DMDTP, 19 µg/L; DEP, 13 µg/L; DETP, 2.2 µg/L; and DEDTP, 0.87 µg/L. We deter-mined the molar sums of the dimethyl-containing and diethyl-containing metabolites; their geo-metric mean concentrations were 49.4 and 10.5 nmol/L, respectively, and their 95th percentileswere 583 and 108 nmol/L, respectively. These data are also presented as creatinine-adjusted con-centrations. Multivariate analyses showed concentrations of DAPs in children 6–11 years of agethat were consistently significantly higher than in adults and often higher than in adolescents.Although the concentrations between sexes and among racial/ethnic groups varied, no significantdifferences were observed. These data will be important in evaluating the impact of organophos-phorus pesticide exposure in the U.S. population and the effectiveness of regulatory actions.Key words: biologic monitoring, dialkyl phosphate, general population, organophosphate,organophosphorus, reference range, urine. Environ Health Perspect 112:186–200 (2004).doi:10.1289/ehp.6503 available via http://dx.doi.org/ [Online 4 November 2003]

of toxicity, widespread use, and unknownlong-term health effects (U.S. EPA 2003).Because of increasing concern about the safetyof these pesticides to children, many OP pesti-cide uses, such as residential use of chlorpyrifosand diazinon, are being eliminated.
Because exposure to OP pesticides occurstypically by multiple routes and the dominantroutes of exposure for individuals vary, quan-tification of OP exposure is not a trivialprocess. Therefore, in many epidemiologicstudies, markers of exposure in biologic sam-ples have been measured to estimate theabsorbed dose (Aprea et al. 1996; Curl et al.2002; Loewenherz et al. 1997; Lu et al. 2001;Mills and Zahm 2001; Whyatt and Barr2001). One of the most common ways toassess OP pesticide dose is quantifying six com-mon urinary DAP metabolites. These measure-ments may provide information on classexposure to OP pesticides or exposure to theDAP itself that may be present in the environ-ment as a breakdown product of OP pesticides(environmental DAP). Although no publishedstudies have documented the environmentalpresence or biologic absorption of environ-mental DAPs or their contribution to urinaryDAP concentrations in humans, researcherswidely recognize their potential contributionsto urinary levels largely based on data demon-strating similar environmental exposures,absorption, and excretion for more selectiveOP metabolites (Barr et al. 2002; Curl et al.2003a; Krieger et al. 2003; Wilson et al. 2003).
In addition, the potential health effects result-ing from exposure to environmental DAPshave not been evaluated. Although the DAPmeasurements provide no specific informationabout the pesticide to which one was exposedand they may potentially represent exposure tothe pesticide itself and/or its environmentaldegradate, urinary DAP metabolites still pro-vide useful information about cumulativeexposure to OP pesticides as a class becauseabout 75% of the U.S. EPA–registered OPpesticides form one to three of these six DAPmetabolites. However, these concentrations areoften difficult to interpret because referenceconcentrations are not available.
We report DAP metabolite concentrationsin urine samples collected in 1999 and 2000from approximately 2,000 persons 6–59 yearsof age from the U.S. general population.Specifically, we report urinary concentrations ofdimethylphosphate (DMP), DEP, dimethyl-thiophosphate (DMTP), DETP, dimethyl-dithiophosphate (DMDTP), and diethyl-dithiophosphate (DEDTP). The data we reportare representative of the civilian, noninstitu-tionalized U.S. population and are stratified byage, sex, and race/ethnicity.
Materials and Methods
Study design. The National Health andNutrition Examination Survey (NHANES),conducted by the National Center for HealthStatistics (NCHS) of the Centers for DiseaseControl and Prevention (CDC), is designed to
measure the health and nutrition status of thecivilian noninstitutionalized U.S. population(CDC 2003a). In 1999, NHANES became acontinuous survey, fielded on an ongoing basis.Each year of data collection is based on a repre-sentative sample covering all ages of the civiliannoninstitutionalized population. Data files arereleased for public use in 2-year groupings(cycles). National population estimates forDAPs as well as estimates for the three largestracial/ethnic subgroups in the U.S. population(non-Hispanic white, non-Hispanic black, andMexican American) are derived from thefirst 2-year cycle of the survey, NHANES1999–2000.
The sampling scheme for NHANES isbased on a complex multistage area probabilitydesign, which includes selection of primarysampling units (counties), household segmentswithin the counties, and finally sample personsfrom selected households. In 1999 and 2000,persons 12–19 years of age and ≥ 60 years ofage, non-Hispanic blacks, and MexicanAmericans were oversampled. Low-incomewhite Americans were oversampled in 2000. Inaddition, in 1999 and 2000, most women whoindicated that they were pregnant in thescreening interview were selected into the sam-ple to increase the sample size for pregnantwomen. Data were collected through a house-hold interview and a standardized physicalexamination, which was conducted in a mobileexamination center. Urine specimens were col-lected from each participant ≥ 6 years of ageduring one of three daily scheduled examina-tion periods (i.e., morning, afternoon, andearly evening). Sociodemographic informationand medical histories of the survey participantand the family were collected during thehousehold interview.
NHANES 1999–2000 was conducted in26 locations throughout the United States andincluded examinations of 9,282 persons. Forthe DAP metabolites, measurements wereconducted on a subset of participants thatwere selected based on a random one-halfsample of children 6–11 years of age in 1999and 2000, a random one-quarter sample ofpeople 12–59 years of age in 1999, and a ran-dom one-third sample of people 12–59 yearsof age in 2000. Because the subset was a ran-dom selection from the entire set, the repre-sentativeness of the survey was maintained.
Laboratory methods. During the physicalexaminations, “spot” or “grab” urine speci-mens were collected from participants,aliquoted, and stored cold (2–4°C) or frozenuntil shipment. Urinary creatinine concentra-tions were determined using an automatedcolorimetric method based on a modifiedJaffe reaction (Jaffe 1886) on a BeckmanSynchron AS/ASTRA clinical analyzer(Beckman Instruments, Inc., Brea, CA) atthe Fairview University Medical Center,
Article | OP metabolites in the U.S. population
Environmental Health Perspectives • VOLUME 112 | NUMBER 2 | February 2004 187
Figure 1. The general metabolism of O,O-diethyl OP pesticides using diazinon as a model. The metabolitesenclosed in boxes are excreted in urine.
N
N
SOP
OCH2CH3
OCH2CH3
Diazinon
OCH2CH3
OCH2CH3OP
N
N
O
Diazinon oxon
NADPH, O2 Dearylationor hydrolysis
OCH2CH3
OCH2CH3
S
HO P
Diethylthiophosphate
N
N OH
Hydrolysis
Cholinesteraseinhibition
HO
O
POCH2CH3
OCH2CH3
Diethylphosphate
N
N OH
2-isopropyl-4-methyl-6-hydroxypyrimidine
2-isopropyl-4-methyl-6-hydroxypyrimidine
N
N O
O
HO OH
OH
COOH N
N O
O-
O-
O-S
IMPY glucuronide IMPY sulfate
+

Article | Barr et al.
188 VOLUME 112 | NUMBER 2 | February 2004 • Environmental Health Perspectives
Minneapolis, Minnesota. Samples collectedfor OP pesticide measurements were shippedon dry ice to the CDC’s National Centerfor Environmental Health. Urine sampleswere analyzed for DAP metabolites of OPpesticides using the method of Bravo et al.(2002). Briefly, 4 mL of urine was spikedwith an isotopically labeled internal standardmixture and concentrated to dryness using anazeotropic codistillation with acetonitrile.
The residue was dissolved in acetonitrile,and the DAPs were derivatized to their res-pective chloropropyl esters using 1-chloro-3-iodopropane and potassium carbonate.The solution containing the chloropropylesters was concentrated and then analyzedusing gas chromatography–positive chemicalionization–tandem mass spectrometry.The DAP metabolites were quantified usingisotope-dilution calibration. Metabolite
concentrations were adjusted using creatinineconcentrations to correct for variable urinedilutions in the “spot” urine samples. Qualitycontrol materials were analyzed in parallelwith unknown samples. Data were notreported for sample runs in which the qualitycontrol materials failed to meet the specifica-tions outlined in the Westgard multirules(Westgard 2002). Both laboratories and meth-ods were certified according to guidelines set
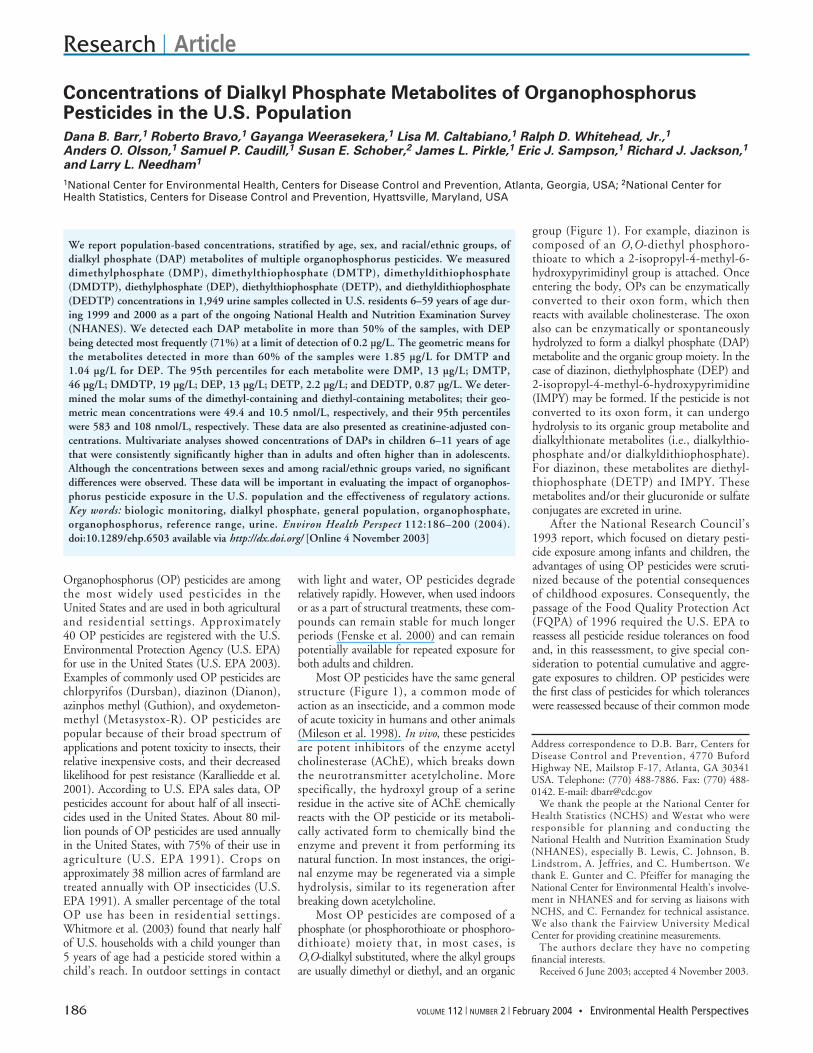
Table 1. Weighted quantiles of urinary DAP concentrations (µg/L) in the NHANES 1999–2000 study population.
Analyte/ Detection Percentile of distributiondemographic category No. frequency (%) GM 25th 50th 75th 90th 95th
DMPAlla 1,949 53 NC < LOD 0.74 2.80 7.90 13.0
(< LOD–1.30) (2.10–3.90) (5.90–9.50) (9.50–21.0)6–11 years of age 471 63 NC < LOD 1.00 4.40 10.0 21.0
(0.59–2.00) (2.90–6.80) (6.60–18.0) (10.0–41.0)12–19 years of age 664 50 NC < LOD 0.65 3.80 9.90 22.0
(< LOD–1.50) (2.40–5.50) (6.10–18.0) (12.0–29.0)20–59 years of age 814 52 NC < LOD 0.68 2.60 6.50 9.70
(< LOD–1.20) (1.80–3.60) (5.2–8.8) (8.50–16.0)Males 952 53 NC < LOD 0.65 2.80 7.90 18.0
(< LOD–1.20) (2.10–4.10) (5.90–10.0) (9.00–25.0)Females 997 54 NC < LOD 0.78 2.80 7.60 10.0
(< LOD–1.40) (2.00–4.00) (5.40–9.50) (8.50–15.0)Non-Hispanic whites 594 49 NC < LOD < LOD 2.90 7.90 10.0
(1.80–4.20) (5.50–9.60) (8.90–21.0)Non-Hispanic blacks 509 62 NC < LOD 0.98 3.60 8.90 21.0
(0.65–1.30) (2.40–5.50) (6.50–15.0) (12.0–24.0)Mexican Americans 672 59 NC < LOD 1.00 3.80 9.50 15.0
(< LOD–1.60) (2.70–4.70) (6.80–13.0) (10.0–23.0)DMTP
Alla 1,949 64 1.82 < LOD 2.70 10.0 38.0 46.0(1.43–2.32) (1.50–3.80) (8.00–16.0) (21.0–38.0) (38.0–60.0)
6–11 years of age 471 69 2.72 < LOD 4.10 20.0 40.0 62.0(1.85–4.01) (2.30–7.60) (13.0–30.0) (38.0–54.0) (38.0–110)
12–19 years of age 664 67 2.53 < LOD 3.60 16.0 37.0 69.0(1.72–3.63) (1.70–6.00) (8.80–24.0) (21.0–38.0) (39.0–190)
20–59 years of age 814 63 1.59 < LOD 2.20 9.10 38.0 38.0(1.25–2.03) (1.10–3.40) (7.10–13.0) (18.0–38.0) (38.0–48.0)
Males 952 66 2.10 < LOD 3.40 13.0 38.0 41.0(1.58–2.78) (2.40–4.50) (8.50–20.0) (17.0–38.0) (38.0–62.0)
Females 997 62 1.59 < LOD 2.00 9.70 38.0 52.0(1.2–2.11) (0.72–3.30) (6.70–16.0) (19.0–38.0) (38.0–120)
Non-Hispanic whites 594 64 1.77 < LOD 2.60 10.0 37.0 45.0(1.30–2.39) (1.10–4.00) (7.00–17.0) (15.0–38.0) (38.0–62.0)
Non-Hispanic blacks 509 68 2.13 < LOD 3.60 11.0 37.0 39.0(1.38–3.28) (1.60–5.60) (8.30–18.0) (25.0–38.0) (38.0–88.0)
Mexican Americans 672 63 1.79 < LOD 2.00 10.0 38.0 130(1.11–2.90) (0.60–4.30) (6.60–16.0) (26.0–79.0) (41.0–230)
DMDTPAlla 1,949 53 NC < LOD < LOD 2.30 12.0 19.0
(1.40–3.60) (5.40–17.0) (17.0–37.0)6–11 years of age 471 63 NC < LOD < LOD 4.30 16.0 32.0
(2.50–6.90) (5.90–18.0) (18.0–38.0)12–19 years of age 664 51 NC < LOD < LOD 2.20 12.0 19.0
(1.30–4.50) (6.20–17.0) (12.0–52.0)20–59 years of age 814 48 NC < LOD < LOD 2.10 10.0 16.0
(1.10–3.10) (4.20–17.0) (6.30–19.0)Males 952 53 NC < LOD < LOD 2.30 16.0 18.0
(1.30–4.30) (5.80–17.0) (17.0–32.0)Females 997 53 NC < LOD < LOD 2.10 10.0 20.0
(1.30–3.20) (4.50–17.0) (13.0–40.0)Non-Hispanic whites 594 50 NC < LOD < LOD 2.00 13.0 18.0
(0.850–3.70) (4.20–17.0) (16.0–40.0)Non-Hispanic blacks 509 56 NC < LOD < LOD 3.20 14.0 18.0
(1.70–6.50) (7.0–18.0) (17.0–39.0)Mexican Americans 672 53 NC < LOD < LOD 1.80 5.70 12.0
(1.20–2.30) (4.00–9.70) (6.80–17.0)Continued, next page
forth in the Clinical Laboratory ImprovementAmendment (1988).
Covariates. Age was reported at the timeof the household interview as the age in yearsat the last birthday. Age categories used inour statistical analyses were 6–11 years,12–19 years, and 20–59 years. A composite
racial/ethnic variable based on self-reportedrace and ethnicity was created to define threemajor racial/ethnic groups: non-Hispanicblack, non-Hispanic white, and MexicanAmerican. Individuals from other racial/eth-nic groups were included in the total esti-mates reported in this publication; however,
no separate demographic breakdown wasprovided.
Traditionally, creatinine concentrationshave been used to adjust spot urine samplesfor variable dilution caused by the differenthydration states of the sample donor. Becauseage group, sex, and race/ethnicity all affect the
Article | OP metabolites in the U.S. population
Environmental Health Perspectives • VOLUME 112 | NUMBER 2 | February 2004 189
Table 1. Continued
Analyte/ Detection Percentile of distributiondemographic category No. frequency (%) GM 25th 50th 75th 90th 95th
DEPAlla 1,949 71 1.03 < LOD 1.20 3.10 7.50 13.0
(0.76–1.40) (0.80–1.50) (2.40–4.60) (5.20–11.0) (8.00–21.0)6–11 years of age 471 74 1.32 < LOD 1.40 4.50 10.0 15.0
(0.85–2.05) (0.99–2.10) (2.30–6.50) (4.80–16.0) (11.0–27.0)12–19 years of age 664 73 1.21 < LOD 1.30 3.70 7.90 20.0
(0.85–1.72) (1.00–1.90) (2.40–5.40) (4.20–23.0) (8.00–27.0)20–59 years of age 814 69 0.955 < LOD 1.00 3.00 7.20 10.0
(0.70–1.30) (0.73–1.40) (2.10–4.40) (4.90–10.0) (6.90–19.0)Males 952 72 1.11 < LOD 1.10 3.80 8.00 18.0
(0.81–1.54) (0.85–1.40) (2.50–4.90) (5.00–19.00) (7.40–27.0)Females 997 69 0.954 < LOD 1.10 2.90 7.50 11.0
(0.69–1.32) (0.73–1.50) (2.10–4.40) (4.90–10.0) (7.70–14.0)Non-Hispanic whites 594 68 0.98 < LOD 1.10 3.30 7.60 14.0
(0.67–1.44) (0.58–1.50) (2.30–4.90) (4.80–14.0) (7.90–23.0)Non-Hispanic blacks 509 82 1.56 < LOD 1.60 4.20 10.0 18.0
(1.23–1.98) (1.30–1.80) (2.90–5.80) (6.20–16.0) (10.0–26.0)Mexican Americans 672 74 1.22 < LOD 1.10 4.10 11.00 17.0
(0.87–1.71) (0.84–1.50) (2.60–6.40) (6.90–13.0) (12.0–23.0)DETP
Alla 1,949 53 NC < LOD 0.49 0.76 1.30 2.20(< LOD–0.62) (0.66–0.91) (1.20–1.60) (1.70–2.80)
6–11 years of age 471 59 NC < LOD 0.59 0.90 1.70 3.13(< LOD–0.72) (0.73–1.20) (1.30–2.40) (1.70–5.00)
12–19 years of age 664 46 NC < LOD 0.21 0.78 1.40 2.20(< LOD–0.64) (0.63–1.20) (1.20–1.90) (1.60–3.10)
20–59 years of age 814 54 NC < LOD 0.480 0.74 1.30 2.00(< LOD–0.59) (0.63–0.91) (0.99–1.50) (1.50–2.80)
Males 952 57 NC < LOD 0.50 0.79 1.40 2.70(< LOD–0.630) (0.70–1.00) (1.20–1.90) (1.90–4.10)
Females 997 50 NC < LOD < LOD 0.72 1.24 1.70(0.600–0.910) (0.950–1.50) (1.30–2.70)
Non-Hispanic whites 594 51 NC < LOD 0.16 0.73 1.30 1.80(< LOD–0.63) (0.60–1.00) (0.980–1.50) (1.50–2.80)
Non-Hispanic blacks 509 64 NC < LOD 0.56 0.81 1.80 3.50(< LOD–0.670) (0.69–1.20) (1.24–3.30) (1.80–4.80)
Mexican Americans 672 58 NC < LOD 0.56 0.84 1.40 2.20(< LOD–0.70) (0.74–0.98) (1.10–1.90) (1.90–2.90)
DEDTPAlla 1,949 56 NC < LOD 0.08 0.20 0.47 0.87
(< LOD–0.11) (0.15–0.29) (0.39–0.63) (0.65–1.00)6–11 years of age 471 60 NC < LOD 0.08 0.19 0.43 0.85
(< LOD–0.11) (0.15–0.24) (0.30–0.55) (0.49–1.00)12–19 years of age 664 50 NC < LOD 0.08 0.26 0.64 0.90
(< LOD–0.11) (0.12–0.35) (0.36–0.86) (0.68–1.30)20–59 years of age 814 56 NC < LOD 0.08 0.21 0.45 0.90
(< LOD–0.11) (0.13–0.29) (0.36–0.62) (0.61–1.10)Males 952 57 NC < LOD 0.09 0.22 0.47 0.87
(< LOD–0.10) (0.16–0.29) (0.36–0.66) (0.65–1.10)Females 997 54 NC < LOD 0.08 0.19 0.45 0.85
(< LOD–0.10) (0.11–0.30) (0.35–0.69) (0.46–1.40)Non-Hispanic whites 594 53 NC < LOD 0.08 0.19 0.42 0.87
(< LOD–0.12) (0.12–0.28) (0.32–0.68) (0.51–1.10)Non-Hispanic blacks 509 61 NC < LOD 0.09 0.27 0.56 0.85
(< LOD–0.11) (0.18–0.33) (0.42–0.82) (0.65–1.20)Mexican Americans 672 66 NC < LOD 0.10 0.31 0.65 1.10
(0.07–0.15) (0.23–0.39) (0.49–1.00) (0.63–1.70)
Abbreviations: GM. geometric mean; LOD, limit of detection; NC, not calculated because proportion of results below the LOD was too high to provide reliable result; NE, could not be reliablyestimated. Upper and lower 95th confidence intervals of each quantile are shown in parentheses; these data are shown as total population data and divided into demographic subgroupsbased on race/ethnicity, sex, and age.aAll population data, including those individuals not grouped into one of the three composite race/ethnicity categories, are presented.
creatinine concentrations in the urine, creati-nine adjustment in diverse populations wouldnot be valid for comparisons of DAP concen-trations among the demographic groups. Toovercome this limitation and thereby allowfor an appropriate comparison of DAP con-centrations among the demographic groups,creatinine was also used as a covariate in sta-tistical models. By using this model for DAPconcentration comparisons, we appropriately
corrected for covariate effects on the creati-nine concentrations while eliminating thevariability caused by urine dilution of spotsamples.
Statistical analysis. Survey-specific sampleweights tailored to suit the random subsetwere used in statistical analyses. Parametricstatistics were performed only on analytes forwhich the frequency of detection was greaterthan or equal to 60%. Geometric means
(GMs), least-squares geometric means(LSGMs), and percentiles of urinary DAPconcentrations were calculated using SAS soft-ware release 8 (SAS Institute, Cary, NC) andSUDAAN software release 7.5.6 (ResearchTriangle Institute, Research Triangle Park,NC). LSGMs are GMs that have been calcu-lated using an analysis of covariance. The ana-lytic limits of detection (LODs; defined asthree times the standard deviation at zero
Article | Barr et al.
190 VOLUME 112 | NUMBER 2 | February 2004 • Environmental Health Perspectives
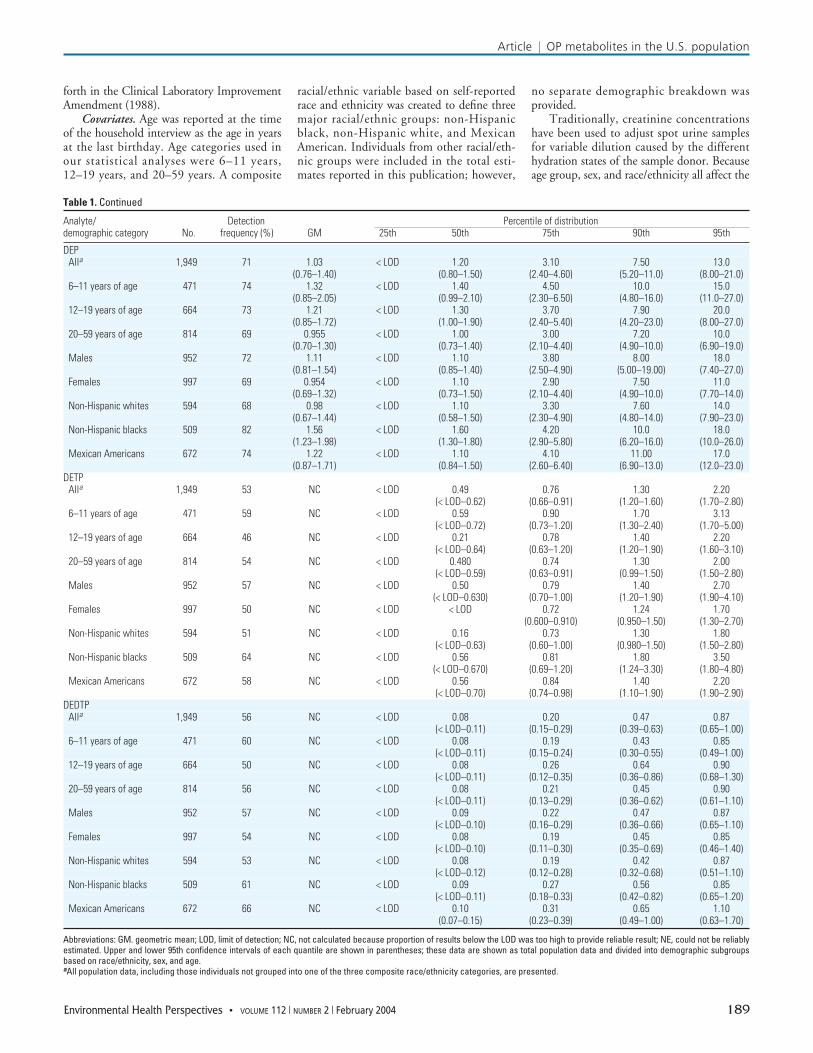
Table 2. Weighted quantiles of creatinine-adjusted urinary DAP concentrations (µg/g creatinine) in the NHANES 1999–2000 study population.
Analyte/ Detection Percentile of distributiondemographic category No. frequency (%) GM 25th 50th 75th 90th 95th
DMPAlla 1,949 53 NC < LOD 0.81 2.93 8.46 16.1
(0.59–1.11) (2.12–3.86) (6.74–11.2) (12.1–19.5)6–11 years of age 471 63 NC < LOD 1.38 4.48 15.9 21.7
(0.89–2.38) (2.63–8.20) (7.65–21.7) (16.7–45.1)12–19 years of age 664 50 NC < LOD 0.59 2.27 7.70 14.5
(0.45–0.95) (1.67–2.91) (4.16–13.8) (7.78–35.3)20–59 years of age 814 52 NC < LOD 0.76 2.87 8.11 14.6
(0.56–1.11) (1.91–3.92) (5.45–10.6) (10.1–17.6)Males 952 53 NC < LOD 0.62 2.38 7.58 15.2
(0.45–0.89) (1.78–3.23) (4.64–11.6) (9.74–19.5)Females 997 54 NC < LOD 1.00 3.53 9.12 16.4
(0.68–1.50) (2.35–5.00) (7.59–12.2) (10.4–21.4)Non-Hispanic whites 594 49 NC < LOD < LOD 3.15 8.73 15.8
(2.03–4.26) (6.12–12.8) (10.2–19.7)Non-Hispanic blacks 509 62 NC < LOD 0.69 2.67 7.07 13.9
(0.53–1.06) (1.78–3.87) (4.77–11.5) (9.61–19.5)Mexican Americans 672 59 NC < LOD 1.06 3.68 9.41 15.9
(0.72–1.47) (2.77–4.67) (7.24–12.2) (12.7–23.2)DMTP
Alla 1,949 64 1.64 < LOD 2.12 9.57 32.0 51.0(1.27–2.10) (1.38–3.11) (6.67–15.1) (23.9–40.4) (39.0–71.1)
6–11 years of age 471 69 2.95 < LOD 5.25 18.7 45.2 65.9(2.00–4.34) (2.50–7.03) (11.6–31.5) (32.1–60.3) (50.7–100)
12–19 years of age 664 67 1.71 < LOD 2.14 13.4 36.0 61.5(1.13–2.59) (1.22–4.13) (7.01–21.0) (25.1–51.4) (37.1–179)
20–59 years of age 814 63 1.47 < LOD 1.90 8.09 27.0 47.4(1.14–1.90) (1.00–2.83) (5.58–12.4) (20.6–37.1) (34.2–70.1)
Males 952 66 1.61 < LOD 2.28 9.27 28.9 41.1(1.19–2.18) (1.42–3.35) (6.43–15.4) (20.5–37.6) (32.0–57.1)
Females 997 62 1.66 < LOD 2.01 10.0 34.5 69.5(1.24–2.21) (0.92–3.11) (6.20–17.5) (25.4–47.4) (41.7–118)
Non-Hispanic whites 594 64 1.68 < LOD 2.20 9.27 32.5 54.4(1.21–2.32) (1.17–3.42) (5.96–16.9) (21.3–49.4) (39.2–74.7)
Non-Hispanic blacks 509 68 1.45 < LOD 1.75 8.21 25.5 52.1(0.95–2.23) (1.01–3.38) (4.65–12.4) (17.9–38.8) (25.5–97.6)
Mexican Americans 672 63 1.60 < LOD 1.83 10.4 37.0 112(0.962–2.67) (0.74–3.75) (5.93–17.1) (22.8–63.1) (39.2–207)
DMDTPAlla 1,949 53 NC < LOD < LOD 1.86 10.1 21.7
(1.04–3.25) (5.63–16.6) (13.8–30.8)6–11 years of age 471 63 NC < LOD < LOD 4.07 16.2 30.8
(2.34–7.00) (9.25–27.0) (20.2–38.9)12–19 years of age 664 51 NC < LOD < LOD 1.52 9.42 18.5
(0.64–3.37) (4.02–16.8) (8.76–44.8)20–59 years of age 814 48 NC < LOD < LOD 1.71 8.46 19.2
(0.92–2.82) (4.96–16.6) (9.82–35.2)Males 952 53 NC < LOD < LOD 1.64 11.0 17.8
(0.87–3.45) (5.32–16.6) (10.1–34.2)Females 997 53 NC < LOD < LOD 1.99 9.30 27.0
(1.00–3.67) (5.41–21.5) (9.82–47.5)Non-Hispanic whites 594 50 NC < LOD < LOD 1.75 11.3 21.5
(0.85–4.00) (4.79–20.2) (12.8–30.8)Non-Hispanic blacks 509 56 NC < LOD < LOD 2.39 9.41 17.8
(1.18–4.53) (5.11–16.6) (11.6–36.0)Mexican Americans 672 53 NC < LOD < LOD 1.35 6.55 16.7
(0.97–1.99) (4.10–11.6) (6.94–34.2)Continued, next page
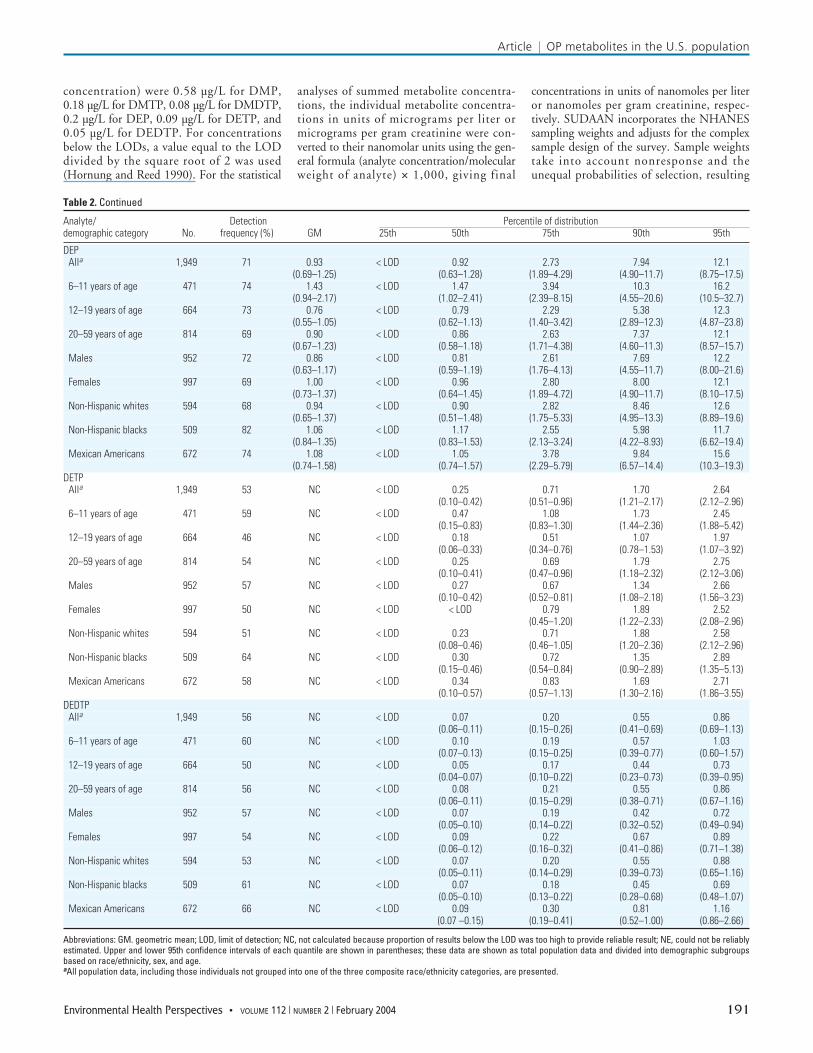
concentration) were 0.58 µg/L for DMP,0.18 µg/L for DMTP, 0.08 µg/L for DMDTP,0.2 µg/L for DEP, 0.09 µg/L for DETP, and0.05 µg/L for DEDTP. For concentrationsbelow the LODs, a value equal to the LODdivided by the square root of 2 was used(Hornung and Reed 1990). For the statistical
analyses of summed metabolite concentra-tions, the individual metabolite concentra-tions in units of micrograms per liter ormicrograms per gram creatinine were con-verted to their nanomolar units using the gen-eral formula (analyte concentration/molecularweight of analyte) × 1,000, giving final
concentrations in units of nanomoles per literor nanomoles per gram creatinine, respec-tively. SUDAAN incorporates the NHANESsampling weights and adjusts for the complexsample design of the survey. Sample weightstake into account nonresponse and theunequal probabilities of selection, resulting
Article | OP metabolites in the U.S. population
Environmental Health Perspectives • VOLUME 112 | NUMBER 2 | February 2004 191
Table 2. Continued
Analyte/ Detection Percentile of distributiondemographic category No. frequency (%) GM 25th 50th 75th 90th 95th
DEPAlla 1,949 71 0.93 < LOD 0.92 2.73 7.94 12.1
(0.69–1.25) (0.63–1.28) (1.89–4.29) (4.90–11.7) (8.75–17.5)6–11 years of age 471 74 1.43 < LOD 1.47 3.94 10.3 16.2
(0.94–2.17) (1.02–2.41) (2.39–8.15) (4.55–20.6) (10.5–32.7)12–19 years of age 664 73 0.76 < LOD 0.79 2.29 5.38 12.3
(0.55–1.05) (0.62–1.13) (1.40–3.42) (2.89–12.3) (4.87–23.8)20–59 years of age 814 69 0.90 < LOD 0.86 2.63 7.37 12.1
(0.67–1.23) (0.58–1.18) (1.71–4.38) (4.60–11.3) (8.57–15.7)Males 952 72 0.86 < LOD 0.81 2.61 7.69 12.2
(0.63–1.17) (0.59–1.19) (1.76–4.13) (4.55–11.7) (8.00–21.6)Females 997 69 1.00 < LOD 0.96 2.80 8.00 12.1
(0.73–1.37) (0.64–1.45) (1.89–4.72) (4.90–11.7) (8.10–17.5)Non-Hispanic whites 594 68 0.94 < LOD 0.90 2.82 8.46 12.6
(0.65–1.37) (0.51–1.48) (1.75–5.33) (4.95–13.3) (8.89–19.6)Non-Hispanic blacks 509 82 1.06 < LOD 1.17 2.55 5.98 11.7
(0.84–1.35) (0.83–1.53) (2.13–3.24) (4.22–8.93) (6.62–19.4)Mexican Americans 672 74 1.08 < LOD 1.05 3.78 9.84 15.6
(0.74–1.58) (0.74–1.57) (2.29–5.79) (6.57–14.4) (10.3–19.3)DETP
Alla 1,949 53 NC < LOD 0.25 0.71 1.70 2.64(0.10–0.42) (0.51–0.96) (1.21–2.17) (2.12–2.96)
6–11 years of age 471 59 NC < LOD 0.47 1.08 1.73 2.45(0.15–0.83) (0.83–1.30) (1.44–2.36) (1.88–5.42)
12–19 years of age 664 46 NC < LOD 0.18 0.51 1.07 1.97(0.06–0.33) (0.34–0.76) (0.78–1.53) (1.07–3.92)
20–59 years of age 814 54 NC < LOD 0.25 0.69 1.79 2.75(0.10–0.41) (0.47–0.96) (1.18–2.32) (2.12–3.06)
Males 952 57 NC < LOD 0.27 0.67 1.34 2.66(0.10–0.42) (0.52–0.81) (1.08–2.18) (1.56–3.23)
Females 997 50 NC < LOD < LOD 0.79 1.89 2.52(0.45–1.20) (1.22–2.33) (2.08–2.96)
Non-Hispanic whites 594 51 NC < LOD 0.23 0.71 1.88 2.58(0.08–0.46) (0.46–1.05) (1.20–2.36) (2.12–2.96)
Non-Hispanic blacks 509 64 NC < LOD 0.30 0.72 1.35 2.89(0.15–0.46) (0.54–0.84) (0.90–2.89) (1.35–5.13)
Mexican Americans 672 58 NC < LOD 0.34 0.83 1.69 2.71(0.10–0.57) (0.57–1.13) (1.30–2.16) (1.86–3.55)
DEDTPAlla 1,949 56 NC < LOD 0.07 0.20 0.55 0.86
(0.06–0.11) (0.15–0.26) (0.41–0.69) (0.69–1.13)6–11 years of age 471 60 NC < LOD 0.10 0.19 0.57 1.03
(0.07–0.13) (0.15–0.25) (0.39–0.77) (0.60–1.57)12–19 years of age 664 50 NC < LOD 0.05 0.17 0.44 0.73
(0.04–0.07) (0.10–0.22) (0.23–0.73) (0.39–0.95)20–59 years of age 814 56 NC < LOD 0.08 0.21 0.55 0.86
(0.06–0.11) (0.15–0.29) (0.38–0.71) (0.67–1.16)Males 952 57 NC < LOD 0.07 0.19 0.42 0.72
(0.05–0.10) (0.14–0.22) (0.32–0.52) (0.49–0.94)Females 997 54 NC < LOD 0.09 0.22 0.67 0.89
(0.06–0.12) (0.16–0.32) (0.41–0.86) (0.71–1.38)Non-Hispanic whites 594 53 NC < LOD 0.07 0.20 0.55 0.88
(0.05–0.11) (0.14–0.29) (0.39–0.73) (0.65–1.16)Non-Hispanic blacks 509 61 NC < LOD 0.07 0.18 0.45 0.69
(0.05–0.10) (0.13–0.22) (0.28–0.68) (0.48–1.07)Mexican Americans 672 66 NC < LOD 0.09 0.30 0.81 1.16
(0.07 –0.15) (0.19–0.41) (0.52–1.00) (0.86–2.66)
Abbreviations: GM. geometric mean; LOD, limit of detection; NC, not calculated because proportion of results below the LOD was too high to provide reliable result; NE, could not be reliablyestimated. Upper and lower 95th confidence intervals of each quantile are shown in parentheses; these data are shown as total population data and divided into demographic subgroupsbased on race/ethnicity, sex, and age.aAll population data, including those individuals not grouped into one of the three composite race/ethnicity categories, are presented.
from the cluster design and the planned over-sampling of certain subgroups.
The LSGMs for each demographic groupwere corrected for effects of all covariates,including creatinine. Differences in LSGMsamong demographic groups were consideredsignificant when p < 0.05 and nominally ormarginally significant when p > 0.05 but < 0.1.
Results
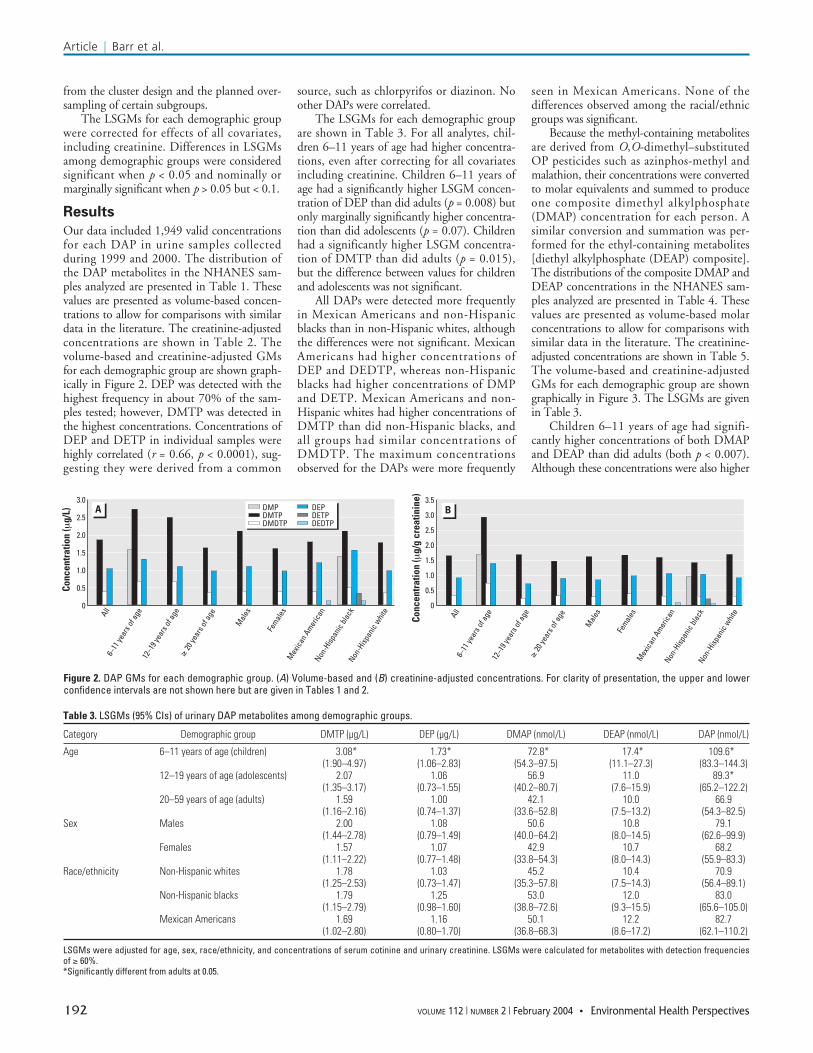
Our data included 1,949 valid concentrationsfor each DAP in urine samples collectedduring 1999 and 2000. The distribution ofthe DAP metabolites in the NHANES sam-ples analyzed are presented in Table 1. Thesevalues are presented as volume-based concen-trations to allow for comparisons with similardata in the literature. The creatinine-adjustedconcentrations are shown in Table 2. Thevolume-based and creatinine-adjusted GMsfor each demographic group are shown graph-ically in Figure 2. DEP was detected with thehighest frequency in about 70% of the sam-ples tested; however, DMTP was detected inthe highest concentrations. Concentrations ofDEP and DETP in individual samples werehighly correlated (r = 0.66, p < 0.0001), sug-gesting they were derived from a common
source, such as chlorpyrifos or diazinon. Noother DAPs were correlated.
The LSGMs for each demographic groupare shown in Table 3. For all analytes, chil-dren 6–11 years of age had higher concentra-tions, even after correcting for all covariatesincluding creatinine. Children 6–11 years ofage had a significantly higher LSGM concen-tration of DEP than did adults (p = 0.008) butonly marginally significantly higher concentra-tion than did adolescents (p = 0.07). Childrenhad a significantly higher LSGM concentra-tion of DMTP than did adults (p = 0.015),but the difference between values for childrenand adolescents was not significant.
All DAPs were detected more frequentlyin Mexican Americans and non-Hispanicblacks than in non-Hispanic whites, althoughthe differences were not significant. MexicanAmericans had higher concentrations ofDEP and DEDTP, whereas non-Hispanicblacks had higher concentrations of DMPand DETP. Mexican Americans and non-Hispanic whites had higher concentrations ofDMTP than did non-Hispanic blacks, andall groups had similar concentrations ofDMDTP. The maximum concentrationsobserved for the DAPs were more frequently
seen in Mexican Americans. None of thedifferences observed among the racial/ethnicgroups was significant.
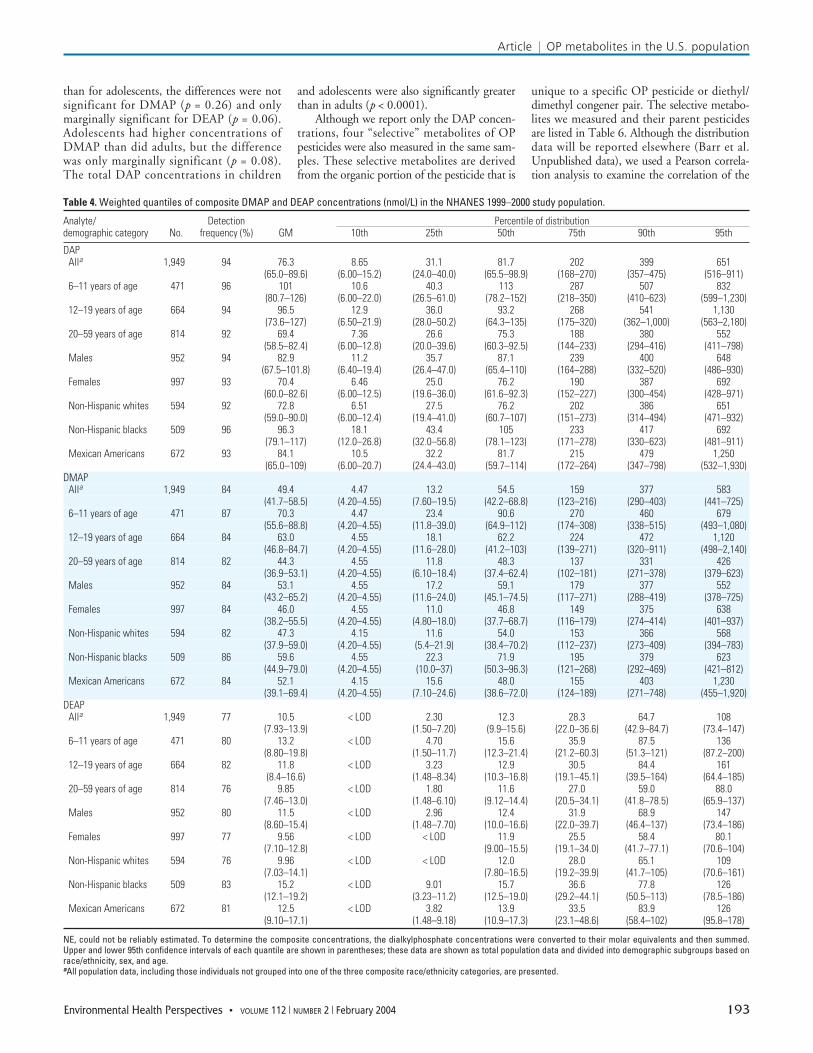
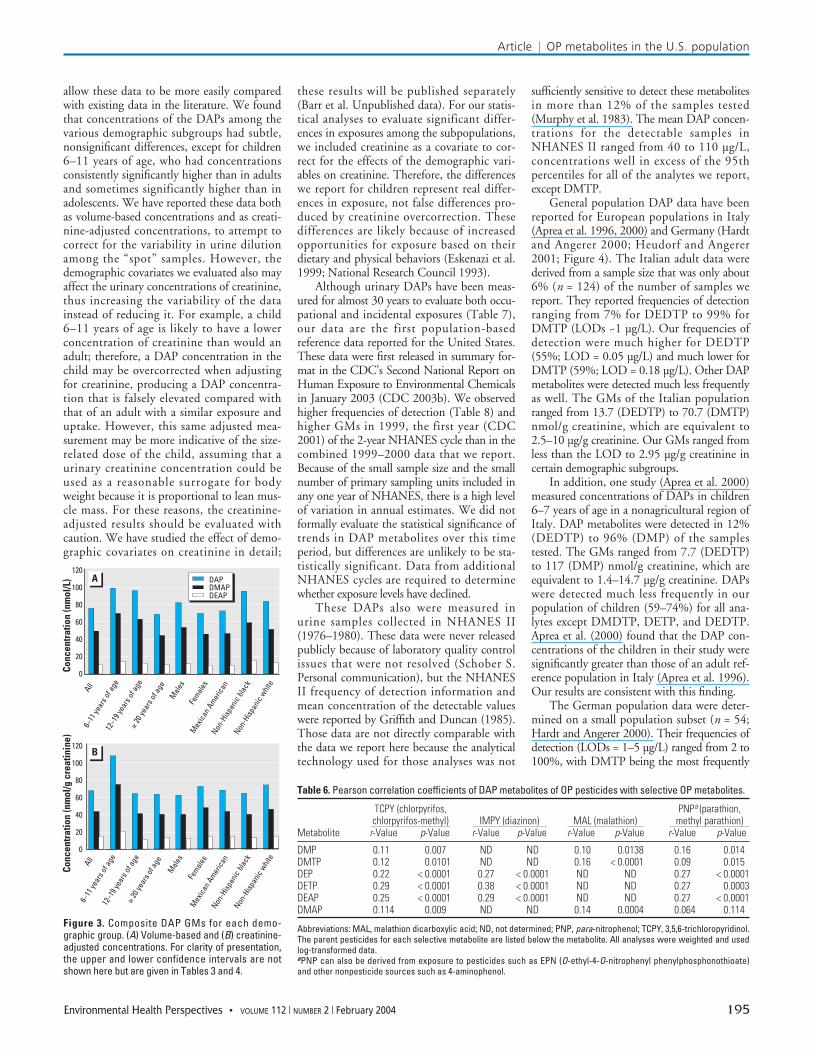
Because the methyl-containing metabolitesare derived from O,O-dimethyl–substitutedOP pesticides such as azinphos-methyl andmalathion, their concentrations were convertedto molar equivalents and summed to produceone composite dimethyl alkylphosphate(DMAP) concentration for each person. Asimilar conversion and summation was per-formed for the ethyl-containing metabolites[diethyl alkylphosphate (DEAP) composite].The distributions of the composite DMAP andDEAP concentrations in the NHANES sam-ples analyzed are presented in Table 4. Thesevalues are presented as volume-based molarconcentrations to allow for comparisons withsimilar data in the literature. The creatinine-adjusted concentrations are shown in Table 5.The volume-based and creatinine-adjustedGMs for each demographic group are showngraphically in Figure 3. The LSGMs are givenin Table 3.
Children 6–11 years of age had signifi-cantly higher concentrations of both DMAPand DEAP than did adults (both p < 0.007).Although these concentrations were also higher
Article | Barr et al.
192 VOLUME 112 | NUMBER 2 | February 2004 • Environmental Health Perspectives
Figure 2. DAP GMs for each demographic group. (A) Volume-based and (B) creatinine-adjusted concentrations. For clarity of presentation, the upper and lowerconfidence intervals are not shown here but are given in Tables 1 and 2.
3.0
2.5
2.0
1.5
1.0
0.5
0
Conc
entr
atio
n (µ
g/L)
All6–
11 ye
ars o
f age
12–1
9 yea
rs of
age
≥ 20
year
s of a
ge
Male
s
Female
sM
exica
n Amer
ican
Non-H
ispan
ic bla
ckNon
-Hisp
anic
white
3.5
3.0
2.5
2.0
1.5
1.0
0.5
0
Conc
entr
atio
n (µ
g/g
crea
tinin
e)
All
Male
s
Female
sM
exica
n Amer
ican
Non-H
ispan
ic bla
ckNon
-Hisp
anic
white
A B
6–11
year
s of a
ge12
–19 y
ears
of ag
e≥
20 ye
ars o
f age
DMPDMTPDMDTP
DEPDETPDEDTP
Table 3. LSGMs (95% CIs) of urinary DAP metabolites among demographic groups.
Category Demographic group DMTP (µg/L) DEP (µg/L) DMAP (nmol/L) DEAP (nmol/L) DAP (nmol/L)
Age 6–11 years of age (children) 3.08* 1.73* 72.8* 17.4* 109.6*(1.90–4.97) (1.06–2.83) (54.3–97.5) (11.1–27.3) (83.3–144.3)
12–19 years of age (adolescents) 2.07 1.06 56.9 11.0 89.3*(1.35–3.17) (0.73–1.55) (40.2–80.7) (7.6–15.9) (65.2–122.2)
20–59 years of age (adults) 1.59 1.00 42.1 10.0 66.9(1.16–2.16) (0.74–1.37) (33.6–52.8) (7.5–13.2) (54.3–82.5)
Sex Males 2.00 1.08 50.6 10.8 79.1(1.44–2.78) (0.79–1.49) (40.0–64.2) (8.0–14.5) (62.6–99.9)
Females 1.57 1.07 42.9 10.7 68.2(1.11–2.22) (0.77–1.48) (33.8–54.3) (8.0–14.3) (55.9–83.3)
Race/ethnicity Non-Hispanic whites 1.78 1.03 45.2 10.4 70.9(1.25–2.53) (0.73–1.47) (35.3–57.8) (7.5–14.3) (56.4–89.1)
Non-Hispanic blacks 1.79 1.25 53.0 12.0 83.0(1.15–2.79) (0.98–1.60) (38.8–72.6) (9.3–15.5) (65.6–105.0)
Mexican Americans 1.69 1.16 50.1 12.2 82.7(1.02–2.80) (0.80–1.70) (36.8–68.3) (8.6–17.2) (62.1–110.2)
LSGMs were adjusted for age, sex, race/ethnicity, and concentrations of serum cotinine and urinary creatinine. LSGMs were calculated for metabolites with detection frequenciesof ≥ 60%.*Significantly different from adults at 0.05.
Article | OP metabolites in the U.S. population
Environmental Health Perspectives • VOLUME 112 | NUMBER 2 | February 2004 193
than for adolescents, the differences were notsignificant for DMAP (p = 0.26) and onlymarginally significant for DEAP (p = 0.06).Adolescents had higher concentrations ofDMAP than did adults, but the differencewas only marginally significant (p = 0.08).The total DAP concentrations in children
and adolescents were also significantly greaterthan in adults (p < 0.0001).
Although we report only the DAP concen-trations, four “selective” metabolites of OPpesticides were also measured in the same sam-ples. These selective metabolites are derivedfrom the organic portion of the pesticide that is
unique to a specific OP pesticide or diethyl/dimethyl congener pair. The selective metabo-lites we measured and their parent pesticidesare listed in Table 6. Although the distributiondata will be reported elsewhere (Barr et al.Unpublished data), we used a Pearson correla-tion analysis to examine the correlation of the
Table 4. Weighted quantiles of composite DMAP and DEAP concentrations (nmol/L) in the NHANES 1999–2000 study population.
Analyte/ Detection Percentile of distributiondemographic category No. frequency (%) GM 10th 25th 50th 75th 90th 95th
DAPAlla 1,949 94 76.3 8.65 31.1 81.7 202 399 651
(65.0–89.6) (6.00–15.2) (24.0–40.0) (65.5–98.9) (168–270) (357–475) (516–911)6–11 years of age 471 96 101 10.6 40.3 113 287 507 832
(80.7–126) (6.00–22.0) (26.5–61.0) (78.2–152) (218–350) (410–623) (599–1,230)12–19 years of age 664 94 96.5 12.9 36.0 93.2 268 541 1,130
(73.6–127) (6.50–21.9) (28.0–50.2) (64.3–135) (175–320) (362–1,000) (563–2,180)20–59 years of age 814 92 69.4 7.36 26.6 75.3 188 380 552
(58.5–82.4) (6.00–12.8) (20.0–39.6) (60.3–92.5) (144–233) (294–416) (411–798)Males 952 94 82.9 11.2 35.7 87.1 239 400 648
(67.5–101.8) (6.40–19.4) (26.4–47.0) (65.4–110) (164–288) (332–520) (486–930)Females 997 93 70.4 6.46 25.0 76.2 190 387 692
(60.0–82.6) (6.00–12.5) (19.6–36.0) (61.6–92.3) (152–227) (300–454) (428–971)Non-Hispanic whites 594 92 72.8 6.51 27.5 76.2 202 386 651
(59.0–90.0) (6.00–12.4) (19.4–41.0) (60.7–107) (151–273) (314–494) (471–932)Non-Hispanic blacks 509 96 96.3 18.1 43.4 105 233 417 692
(79.1–117) (12.0–26.8) (32.0–56.8) (78.1–123) (171–278) (330–623) (481–911)Mexican Americans 672 93 84.1 10.5 32.2 81.7 215 479 1,250
(65.0–109) (6.00–20.7) (24.4–43.0) (59.7–114) (172–264) (347–798) (532–1,930)DMAP
Alla 1,949 84 49.4 4.47 13.2 54.5 159 377 583(41.7–58.5) (4.20–4.55) (7.60–19.5) (42.2–68.8) (123–216) (290–403) (441–725)
6–11 years of age 471 87 70.3 4.47 23.4 90.6 270 460 679(55.6–88.8) (4.20–4.55) (11.8–39.0) (64.9–112) (174–308) (338–515) (493–1,080)
12–19 years of age 664 84 63.0 4.55 18.1 62.2 224 472 1,120(46.8–84.7) (4.20–4.55) (11.6–28.0) (41.2–103) (139–271) (320–911) (498–2,140)
20–59 years of age 814 82 44.3 4.55 11.8 48.3 137 331 426(36.9–53.1) (4.20–4.55) (6.10–18.4) (37.4–62.4) (102–181) (271–378) (379–623)
Males 952 84 53.1 4.55 17.2 59.1 179 377 552(43.2–65.2) (4.20–4.55) (11.6–24.0) (45.1–74.5) (117–271) (288–419) (378–725)
Females 997 84 46.0 4.55 11.0 46.8 149 375 638(38.2–55.5) (4.20–4.55) (4.80–18.0) (37.7–68.7) (116–179) (274–414) (401–937)
Non-Hispanic whites 594 82 47.3 4.15 11.6 54.0 153 366 568(37.9–59.0) (4.20–4.55) (5.4–21.9) (38.4–70.2) (112–237) (273–409) (394–783)
Non-Hispanic blacks 509 86 59.6 4.55 22.3 71.9 195 379 623(44.9–79.0) (4.20–4.55) (10.0–37) (50.3–96.3) (121–268) (292–469) (421–812)
Mexican Americans 672 84 52.1 4.15 15.6 48.0 155 403 1,230(39.1–69.4) (4.20–4.55) (7.10–24.6) (38.6–72.0) (124–189) (271–748) (455–1,920)
DEAPAlla 1,949 77 10.5 < LOD 2.30 12.3 28.3 64.7 108
(7.93–13.9) (1.50–7.20) (9.9–15.6) (22.0–36.6) (42.9–84.7) (73.4–147)6–11 years of age 471 80 13.2 < LOD 4.70 15.6 35.9 87.5 136
(8.80–19.8) (1.50–11.7) (12.3–21.4) (21.2–60.3) (51.3–121) (87.2–200)12–19 years of age 664 82 11.8 < LOD 3.23 12.9 30.5 84.4 161
(8.4–16.6) (1.48–8.34) (10.3–16.8) (19.1–45.1) (39.5–164) (64.4–185)20–59 years of age 814 76 9.85 < LOD 1.80 11.6 27.0 59.0 88.0
(7.46–13.0) (1.48–6.10) (9.12–14.4) (20.5–34.1) (41.8–78.5) (65.9–137)Males 952 80 11.5 < LOD 2.96 12.4 31.9 68.9 147
(8.60–15.4) (1.48–7.70) (10.0–16.6) (22.0–39.7) (46.4–137) (73.4–186)Females 997 77 9.56 < LOD < LOD 11.9 25.5 58.4 80.1
(7.10–12.8) (9.00–15.5) (19.1–34.0) (41.7–77.1) (70.6–104)Non-Hispanic whites 594 76 9.96 < LOD < LOD 12.0 28.0 65.1 109
(7.03–14.1) (7.80–16.5) (19.2–39.9) (41.7–105) (70.6–161)Non-Hispanic blacks 509 83 15.2 < LOD 9.01 15.7 36.6 77.8 126
(12.1–19.2) (3.23–11.2) (12.5–19.0) (29.2–44.1) (50.5–113) (78.5–186)Mexican Americans 672 81 12.5 < LOD 3.82 13.9 33.5 83.9 126
(9.10–17.1) (1.48–9.18) (10.9–17.3) (23.1–48.6) (58.4–102) (95.8–178)
NE, could not be reliably estimated. To determine the composite concentrations, the dialkylphosphate concentrations were converted to their molar equivalents and then summed.Upper and lower 95th confidence intervals of each quantile are shown in parentheses; these data are shown as total population data and divided into demographic subgroups based onrace/ethnicity, sex, and age.aAll population data, including those individuals not grouped into one of the three composite race/ethnicity categories, are presented.
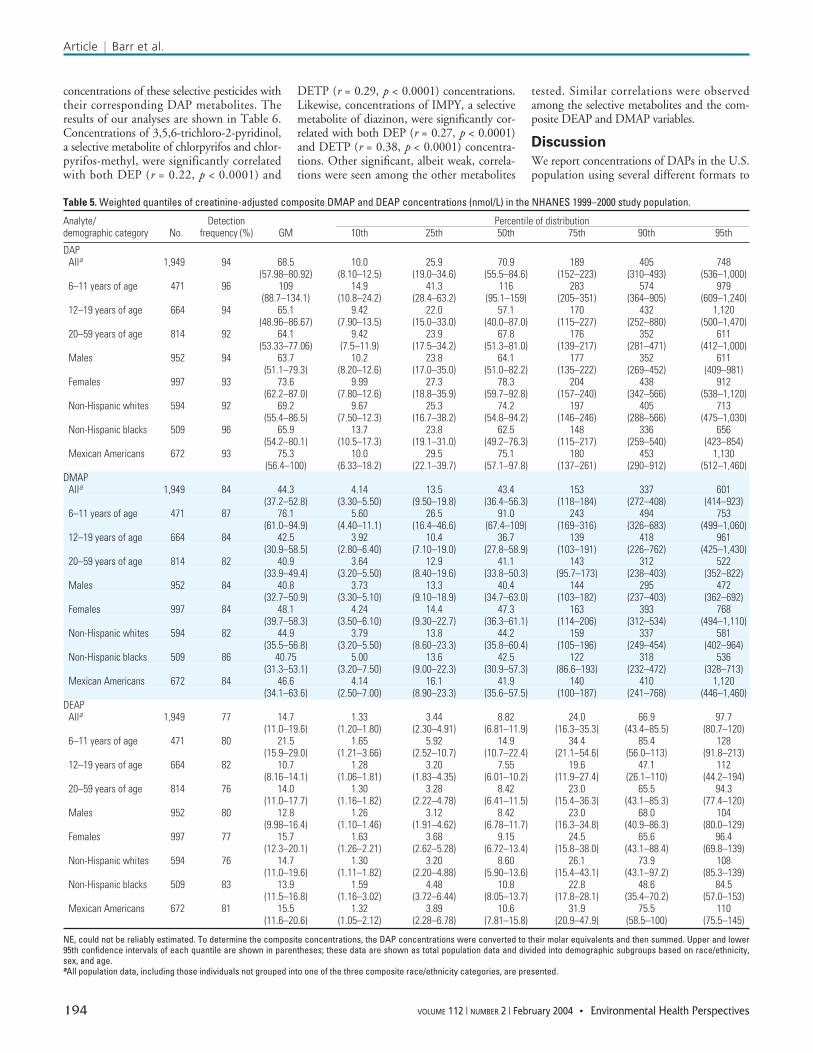
concentrations of these selective pesticides withtheir corresponding DAP metabolites. Theresults of our analyses are shown in Table 6.Concentrations of 3,5,6-trichloro-2-pyridinol,a selective metabolite of chlorpyrifos and chlor-pyrifos-methyl, were significantly correlatedwith both DEP (r = 0.22, p < 0.0001) and
DETP (r = 0.29, p < 0.0001) concentrations.Likewise, concentrations of IMPY, a selectivemetabolite of diazinon, were significantly cor-related with both DEP (r = 0.27, p < 0.0001)and DETP (r = 0.38, p < 0.0001) concentra-tions. Other significant, albeit weak, correla-tions were seen among the other metabolites
tested. Similar correlations were observedamong the selective metabolites and the com-posite DEAP and DMAP variables.
Discussion
We report concentrations of DAPs in the U.S.population using several different formats to
Article | Barr et al.
194 VOLUME 112 | NUMBER 2 | February 2004 • Environmental Health Perspectives
Table 5. Weighted quantiles of creatinine-adjusted composite DMAP and DEAP concentrations (nmol/L) in the NHANES 1999–2000 study population.
Analyte/ Detection Percentile of distributiondemographic category No. frequency (%) GM 10th 25th 50th 75th 90th 95th
DAPAlla 1,949 94 68.5 10.0 25.9 70.9 189 405 748
(57.98–80.92) (8.10–12.5) (19.0–34.6) (55.5–84.6) (152–223) (310–493) (536–1,000)6–11 years of age 471 96 109 14.9 41.3 116 283 574 979
(88.7–134.1) (10.8–24.2) (28.4–63.2) (95.1–159) (205–351) (364–905) (609–1,240)12–19 years of age 664 94 65.1 9.42 22.0 57.1 170 432 1,120
(48.96–86.67) (7.90–13.5) (15.0–33.0) (40.0–87.0) (115–227) (252–880) (500–1,470)20–59 years of age 814 92 64.1 9.42 23.9 67.8 176 352 611
(53.33–77.06) (7.5–11.9) (17.5–34.2) (51.3–81.0) (139–217) (281–471) (412–1,000)Males 952 94 63.7 10.2 23.8 64.1 177 352 611
(51.1–79.3) (8.20–12.6) (17.0–35.0) (51.0–82.2) (135–222) (269–452) (409–981)Females 997 93 73.6 9.99 27.3 78.3 204 438 912
(62.2–87.0) (7.80–12.6) (18.8–35.9) (59.7–92.8) (157–240) (342–566) (538–1,120)Non-Hispanic whites 594 92 69.2 9.67 25.3 74.2 197 405 713
(55.4–86.5) (7.50–12.3) (16.7–38.2) (54.8–94.2) (146–246) (288–566) (475–1,030)Non-Hispanic blacks 509 96 65.9 13.7 23.8 62.5 148 336 656
(54.2–80.1) (10.5–17.3) (19.1–31.0) (49.2–76.3) (115–217) (259–540) (423–854)Mexican Americans 672 93 75.3 10.0 29.5 75.1 180 453 1,130
(56.4–100) (6.33–18.2) (22.1–39.7) (57.1–97.8) (137–261) (290–912) (512–1,460)DMAP
Alla 1,949 84 44.3 4.14 13.5 43.4 153 337 601(37.2–52.8) (3.30–5.50) (9.50–19.8) (36.4–56.3) (118–184) (272–408) (414–923)
6–11 years of age 471 87 76.1 5.60 26.5 91.0 243 494 753(61.0–94.9) (4.40–11.1) (16.4–46.6) (67.4–109) (169–316) (326–683) (499–1,060)
12–19 years of age 664 84 42.5 3.92 10.4 36.7 139 418 961(30.9–58.5) (2.80–6.40) (7.10–19.0) (27.8–58.9) (103–191) (226–762) (425–1,430)
20–59 years of age 814 82 40.9 3.64 12.9 41.1 143 312 522(33.9–49.4) (3.20–5.50) (8.40–19.6) (33.8–50.3) (95.7–173) (238–403) (352–822)
Males 952 84 40.8 3.73 13.3 40.4 144 295 472(32.7–50.9) (3.30–5.10) (9.10–18.9) (34.7–63.0) (103–182) (237–403) (362–692)
Females 997 84 48.1 4.24 14.4 47.3 163 393 768(39.7–58.3) (3.50–6.10) (9.30–22.7) (36.3–61.1) (114–206) (312–534) (494–1,110)
Non-Hispanic whites 594 82 44.9 3.79 13.8 44.2 159 337 581(35.5–56.8) (3.20–5.50) (8.60–23.3) (35.8–60.4) (105–196) (249–454) (402–964)
Non-Hispanic blacks 509 86 40.75 5.00 13.6 42.5 122 318 536(31.3–53.1) (3.20–7.50) (9.00–22.3) (30.9–57.3) (86.6–193) (232–472) (328–713)
Mexican Americans 672 84 46.6 4.14 16.1 41.9 140 410 1,120(34.1–63.6) (2.50–7.00) (8.90–23.3) (35.6–57.5) (100–187) (241–768) (446–1,460)
DEAPAlla 1,949 77 14.7 1.33 3.44 8.82 24.0 66.9 97.7
(11.0–19.6) (1.20–1.80) (2.30–4.91) (6.81–11.9) (16.3–35.3) (43.4–85.5) (80.7–120)6–11 years of age 471 80 21.5 1.65 5.92 14.9 34.4 85.4 128
(15.9–29.0) (1.21–3.66) (2.52–10.7) (10.7–22.4) (21.1–54.6) (56.0–113) (91.8–213)12–19 years of age 664 82 10.7 1.28 3.20 7.55 19.6 47.1 112
(8.16–14.1) (1.06–1.81) (1.83–4.35) (6.01–10.2) (11.9–27.4) (26.1–110) (44.2–194)20–59 years of age 814 76 14.0 1.30 3.28 8.42 23.0 65.5 94.3
(11.0–17.7) (1.16–1.82) (2.22–4.78) (6.41–11.5) (15.4–36.3) (43.1–85.3) (77.4–120)Males 952 80 12.8 1.26 3.12 8.42 23.0 68.0 104
(9.98–16.4) (1.10–1.46) (1.91–4.62) (6.78–11.7) (16.3–34.8) (40.9–86.3) (80.0–129)Females 997 77 15.7 1.63 3.68 9.15 24.5 65.6 96.4
(12.3–20.1) (1.26–2.21) (2.62–5.28) (6.72–13.4) (15.8–38.0) (43.1–88.4) (69.8–139)Non-Hispanic whites 594 76 14.7 1.30 3.20 8.60 26.1 73.9 108
(11.0–19.6) (1.11–1.82) (2.20–4.88) (5.90–13.6) (15.4–43.1) (43.1–97.2) (85.3–139)Non-Hispanic blacks 509 83 13.9 1.59 4.48 10.8 22.8 48.6 84.5
(11.5–16.8) (1.16–3.02) (3.72–6.44) (8.05–13.7) (17.8–28.1) (35.4–70.2) (57.0–153)Mexican Americans 672 81 15.5 1.32 3.89 10.6 31.9 75.5 110
(11.6–20.6) (1.05–2.12) (2.28–6.78) (7.81–15.8) (20.9–47.9) (58.5–100) (75.5–145)
NE, could not be reliably estimated. To determine the composite concentrations, the DAP concentrations were converted to their molar equivalents and then summed. Upper and lower95th confidence intervals of each quantile are shown in parentheses; these data are shown as total population data and divided into demographic subgroups based on race/ethnicity,sex, and age.aAll population data, including those individuals not grouped into one of the three composite race/ethnicity categories, are presented.
allow these data to be more easily comparedwith existing data in the literature. We foundthat concentrations of the DAPs among thevarious demographic subgroups had subtle,nonsignificant differences, except for children6–11 years of age, who had concentrationsconsistently significantly higher than in adultsand sometimes significantly higher than inadolescents. We have reported these data bothas volume-based concentrations and as creati-nine-adjusted concentrations, to attempt tocorrect for the variability in urine dilutionamong the “spot” samples. However, thedemographic covariates we evaluated also mayaffect the urinary concentrations of creatinine,thus increasing the variability of the datainstead of reducing it. For example, a child6–11 years of age is likely to have a lowerconcentration of creatinine than would anadult; therefore, a DAP concentration in thechild may be overcorrected when adjustingfor creatinine, producing a DAP concentra-tion that is falsely elevated compared withthat of an adult with a similar exposure anduptake. However, this same adjusted mea-surement may be more indicative of the size-related dose of the child, assuming that aurinary creatinine concentration could beused as a reasonable surrogate for bodyweight because it is proportional to lean mus-cle mass. For these reasons, the creatinine-adjusted results should be evaluated withcaution. We have studied the effect of demo-graphic covariates on creatinine in detail;
these results will be published separately(Barr et al. Unpublished data). For our statis-tical analyses to evaluate significant differ-ences in exposures among the subpopulations,we included creatinine as a covariate to cor-rect for the effects of the demographic vari-ables on creatinine. Therefore, the differenceswe report for children represent real differ-ences in exposure, not false differences pro-duced by creatinine overcorrection. Thesedifferences are likely because of increasedopportunities for exposure based on theirdietary and physical behaviors (Eskenazi et al.1999; National Research Council 1993).
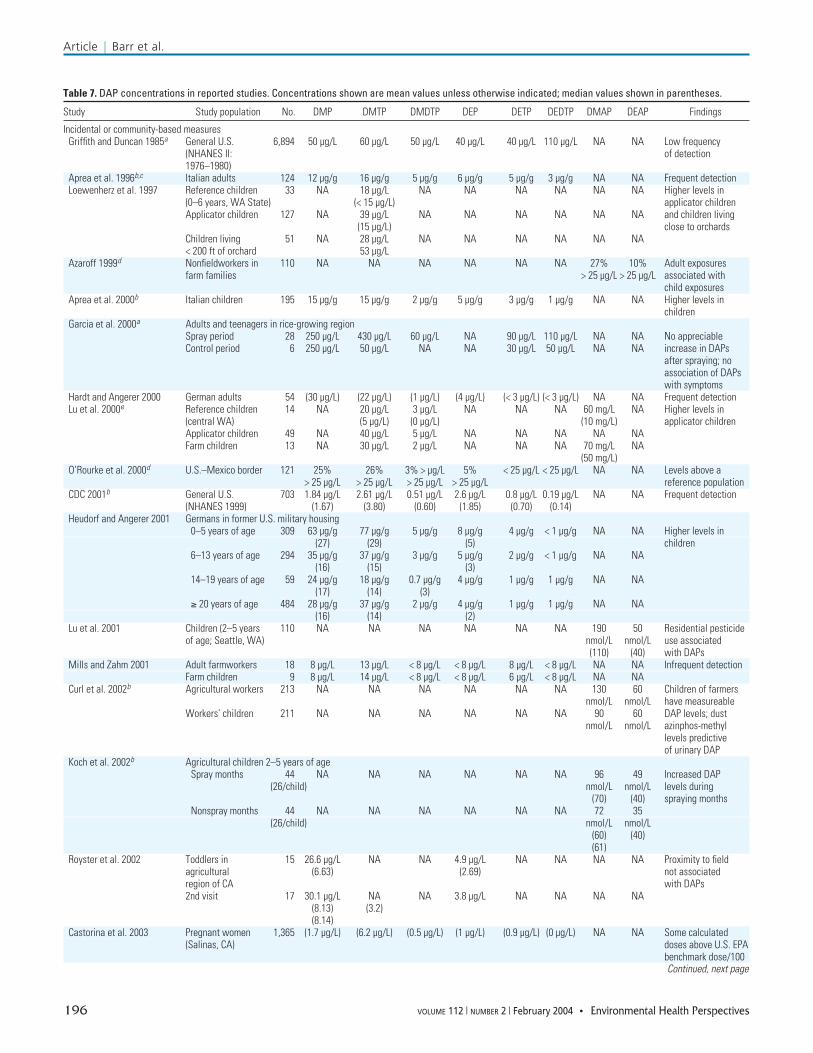
Although urinary DAPs have been meas-ured for almost 30 years to evaluate both occu-pational and incidental exposures (Table 7),our data are the first population-based reference data reported for the United States.These data were first released in summary for-mat in the CDC’s Second National Report onHuman Exposure to Environmental Chemicalsin January 2003 (CDC 2003b). We observedhigher frequencies of detection (Table 8) andhigher GMs in 1999, the first year (CDC2001) of the 2-year NHANES cycle than in thecombined 1999–2000 data that we report.Because of the small sample size and the smallnumber of primary sampling units included inany one year of NHANES, there is a high levelof variation in annual estimates. We did notformally evaluate the statistical significance oftrends in DAP metabolites over this timeperiod, but differences are unlikely to be sta-tistically significant. Data from additionalNHANES cycles are required to determinewhether exposure levels have declined.
These DAPs also were measured inurine samples collected in NHANES II(1976–1980). These data were never releasedpublicly because of laboratory quality controlissues that were not resolved (Schober S.Personal communication), but the NHANESII frequency of detection information andmean concentration of the detectable valueswere reported by Griffith and Duncan (1985).Those data are not directly comparable withthe data we report here because the analyticaltechnology used for those analyses was not
sufficiently sensitive to detect these metabolitesin more than 12% of the samples tested(Murphy et al. 1983). The mean DAP concen-trations for the detectable samples inNHANES II ranged from 40 to 110 µg/L,concentrations well in excess of the 95thpercentiles for all of the analytes we report,except DMTP.
General population DAP data have beenreported for European populations in Italy(Aprea et al. 1996, 2000) and Germany (Hardtand Angerer 2000; Heudorf and Angerer2001; Figure 4). The Italian adult data werederived from a sample size that was only about6% (n = 124) of the number of samples wereport. They reported frequencies of detectionranging from 7% for DEDTP to 99% forDMTP (LODs ~1 µg/L). Our frequencies ofdetection were much higher for DEDTP(55%; LOD = 0.05 µg/L) and much lower forDMTP (59%; LOD = 0.18 µg/L). Other DAPmetabolites were detected much less frequentlyas well. The GMs of the Italian populationranged from 13.7 (DEDTP) to 70.7 (DMTP)nmol/g creatinine, which are equivalent to2.5–10 µg/g creatinine. Our GMs ranged fromless than the LOD to 2.95 µg/g creatinine incertain demographic subgroups.
In addition, one study (Aprea et al. 2000)measured concentrations of DAPs in children6–7 years of age in a nonagricultural region ofItaly. DAP metabolites were detected in 12%(DEDTP) to 96% (DMP) of the samplestested. The GMs ranged from 7.7 (DEDTP)to 117 (DMP) nmol/g creatinine, which areequivalent to 1.4–14.7 µg/g creatinine. DAPswere detected much less frequently in ourpopulation of children (59–74%) for all ana-lytes except DMDTP, DETP, and DEDTP.Aprea et al. (2000) found that the DAP con-centrations of the children in their study weresignificantly greater than those of an adult ref-erence population in Italy (Aprea et al. 1996).Our results are consistent with this finding.
The German population data were deter-mined on a small population subset (n = 54;Hardt and Angerer 2000). Their frequencies ofdetection (LODs = 1–5 µg/L) ranged from 2 to100%, with DMTP being the most frequently
Article | OP metabolites in the U.S. population
Environmental Health Perspectives • VOLUME 112 | NUMBER 2 | February 2004 195
120
100
80
60
40
20
0Conc
entr
atio
n (n
mol
/L)
All6–
11 ye
ars o
f age
12–1
9 yea
rs of
age
≥ 20
year
s of a
geM
ales
Female
sM
exica
n Amer
ican
Non-H
ispan
ic bla
ckNon
-Hisp
anic
white
Conc
entr
atio
n (n
mol
/g c
reat
inin
e)
All
Male
sFe
males
Mex
ican A
merica
nNon
-Hisp
anic
black
Non-H
ispan
ic whit
e
A
B
DAPDMAPDEAP
120
100
80
60
40
20
0
6–11
year
s of a
ge12
–19 y
ears
of ag
e≥
20 ye
ars o
f age
Figure 3. Composite DAP GMs for each demo-graphic group. (A) Volume-based and (B) creatinine-adjusted concentrations. For clarity of presentation,the upper and lower confidence intervals are notshown here but are given in Tables 3 and 4.
Table 6. Pearson correlation coefficients of DAP metabolites of OP pesticides with selective OP metabolites.
TCPY (chlorpyrifos, PNPa (parathion,chlorpyrifos-methyl) IMPY (diazinon) MAL (malathion) methyl parathion)
Metabolite r-Value p-Value r-Value p-Value r-Value p-Value r-Value p-Value
DMP 0.11 0.007 ND ND 0.10 0.0138 0.16 0.014DMTP 0.12 0.0101 ND ND 0.16 < 0.0001 0.09 0.015DEP 0.22 < 0.0001 0.27 < 0.0001 ND ND 0.27 < 0.0001DETP 0.29 < 0.0001 0.38 < 0.0001 ND ND 0.27 0.0003DEAP 0.25 < 0.0001 0.29 < 0.0001 ND ND 0.27 < 0.0001DMAP 0.114 0.009 ND ND 0.14 0.0004 0.064 0.114
Abbreviations: MAL, malathion dicarboxylic acid; ND, not determined; PNP, para-nitrophenol; TCPY, 3,5,6-trichloropyridinol.The parent pesticides for each selective metabolite are listed below the metabolite. All analyses were weighted and usedlog-transformed data.aPNP can also be derived from exposure to pesticides such as EPN (O-ethyl-4-O-nitrophenyl phenylphosphonothioate)and other nonpesticide sources such as 4-aminophenol.
Article | Barr et al.
196 VOLUME 112 | NUMBER 2 | February 2004 • Environmental Health Perspectives
Table 7. DAP concentrations in reported studies. Concentrations shown are mean values unless otherwise indicated; median values shown in parentheses.
Study Study population No. DMP DMTP DMDTP DEP DETP DEDTP DMAP DEAP Findings
Incidental or community-based measuresGriffith and Duncan 1985a General U.S. 6,894 50 µg/L 60 µg/L 50 µg/L 40 µg/L 40 µg/L 110 µg/L NA NA Low frequency
(NHANES II: of detection1976–1980)
Aprea et al. 1996b,c Italian adults 124 12 µg/g 16 µg/g 5 µg/g 6 µg/g 5 µg/g 3 µg/g NA NA Frequent detectionLoewenherz et al. 1997 Reference children 33 NA 18 µg/L NA NA NA NA NA NA Higher levels in
(0–6 years, WA State) (< 15 µg/L) applicator childrenApplicator children 127 NA 39 µg/L NA NA NA NA NA NA and children living
(15 µg/L) close to orchardsChildren living 51 NA 28 µg/L NA NA NA NA NA NA< 200 ft of orchard 53 µg/L
Azaroff 1999d Nonfieldworkers in 110 NA NA NA NA NA NA 27% 10% Adult exposuresfarm families > 25 µg/L > 25 µg/L associated with
child exposuresAprea et al. 2000b Italian children 195 15 µg/g 15 µg/g 2 µg/g 5 µg/g 3 µg/g 1 µg/g NA NA Higher levels in
childrenGarcia et al. 2000a Adults and teenagers in rice-growing region
Spray period 28 250 µg/L 430 µg/L 60 µg/L NA 90 µg/L 110 µg/L NA NA No appreciableControl period 6 250 µg/L 50 µg/L NA NA 30 µg/L 50 µg/L NA NA increase in DAPs
after spraying; noassociation of DAPswith symptoms
Hardt and Angerer 2000 German adults 54 (30 µg/L) (22 µg/L) (1 µg/L) (4 µg/L) (< 3 µg/L) (< 3 µg/L) NA NA Frequent detectionLu et al. 2000e Reference children 14 NA 20 µg/L 3 µg/L NA NA NA 60 mg/L NA Higher levels in
(central WA) (5 µg/L) (0 µg/L) (10 mg/L) applicator childrenApplicator children 49 NA 40 µg/L 5 µg/L NA NA NA NA NAFarm children 13 NA 30 µg/L 2 µg/L NA NA NA 70 mg/L NA
(50 mg/L)O’Rourke et al. 2000d U.S.–Mexico border 121 25% 26% 3% > µg/L 5% < 25 µg/L < 25 µg/L NA NA Levels above a
> 25 µg/L > 25 µg/L > 25 µg/L > 25 µg/L reference populationCDC 2001b General U.S. 703 1.84 µg/L 2.61 µg/L 0.51 µg/L 2.6 µg/L 0.8 µg/L 0.19 µg/L NA NA Frequent detection
(NHANES 1999) (1.67) (3.80) (0.60) (1.85) (0.70) (0.14)Heudorf and Angerer 2001 Germans in former U.S. military housing
0–5 years of age 309 63 µg/g 77 µg/g 5 µg/g 8 µg/g 4 µg/g < 1 µg/g NA NA Higher levels in(27) (29) (5) children
6–13 years of age 294 35 µg/g 37 µg/g 3 µg/g 5 µg/g 2 µg/g < 1 µg/g NA NA(16) (15) (3)
14–19 years of age 59 24 µg/g 18 µg/g 0.7 µg/g 4 µg/g 1 µg/g 1 µg/g NA NA(17) (14) (3)
≥ 20 years of age 484 28 µg/g 37 µg/g 2 µg/g 4 µg/g 1 µg/g 1 µg/g NA NA(16) (14) (2)
Lu et al. 2001 Children (2–5 years 110 NA NA NA NA NA NA 190 50 Residential pesticideof age; Seattle, WA) nmol/L nmol/L use associated
(110) (40) with DAPsMills and Zahm 2001 Adult farmworkers 18 8 µg/L 13 µg/L < 8 µg/L < 8 µg/L 8 µg/L < 8 µg/L NA NA Infrequent detection
Farm children 9 8 µg/L 14 µg/L < 8 µg/L < 8 µg/L 6 µg/L < 8 µg/L NA NACurl et al. 2002b Agricultural workers 213 NA NA NA NA NA NA 130 60 Children of farmers
nmol/L nmol/L have measureableWorkers’ children 211 NA NA NA NA NA NA 90 60 DAP levels; dust
nmol/L nmol/L azinphos-methyllevels predictiveof urinary DAP
Koch et al. 2002b Agricultural children 2–5 years of ageSpray months 44 NA NA NA NA NA NA 96 49 Increased DAP
(26/child) nmol/L nmol/L levels during(70) (40) spraying months
Nonspray months 44 NA NA NA NA NA NA 72 35(26/child) nmol/L nmol/L
(60) (40)(61)
Royster et al. 2002 Toddlers in 15 26.6 µg/L NA NA 4.9 µg/L NA NA NA NA Proximity to fieldagricultural (6.63) (2.69) not associatedregion of CA with DAPs2nd visit 17 30.1 µg/L NA NA 3.8 µg/L NA NA NA NA
(8.13) (3.2)(8.14)
Castorina et al. 2003 Pregnant women 1,365 (1.7 µg/L) (6.2 µg/L) (0.5 µg/L) (1 µg/L) (0.9 µg/L) (0 µg/L) NA NA Some calculated(Salinas, CA) doses above U.S. EPA
benchmark dose/100Continued, next page
Article | OP metabolites in the U.S. population
Environmental Health Perspectives • VOLUME 112 | NUMBER 2 | February 2004 197
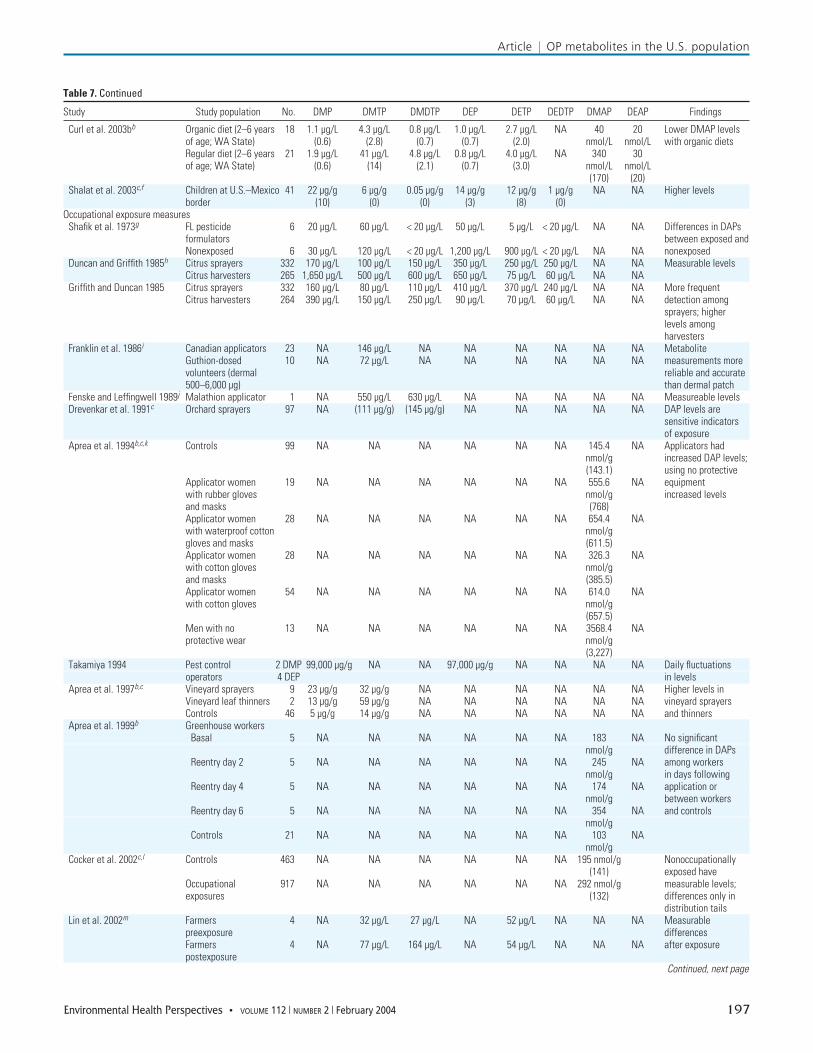
Table 7. Continued
Study Study population No. DMP DMTP DMDTP DEP DETP DEDTP DMAP DEAP Findings
Curl et al. 2003bb Organic diet (2–6 years 18 1.1 µg/L 4.3 µg/L 0.8 µg/L 1.0 µg/L 2.7 µg/L NA 40 20 Lower DMAP levelsof age; WA State) (0.6) (2.8) (0.7) (0.7) (2.0) nmol/L nmol/L with organic dietsRegular diet (2–6 years 21 1.9 µg/L 41 µg/L 4.8 µg/L 0.8 µg/L 4.0 µg/L NA 340 30of age; WA State) (0.6) (14) (2.1) (0.7) (3.0) nmol/L nmol/L
(170) (20)Shalat et al. 2003c,f Children at U.S.–Mexico 41 22 µg/g 6 µg/g 0.05 µg/g 14 µg/g 12 µg/g 1 µg/g NA NA Higher levels
border (10) (0) (0) (3) (8) (0)Occupational exposure measures
Shafik et al. 1973g FL pesticide 6 20 µg/L 60 µg/L < 20 µg/L 50 µg/L 5 µg/L < 20 µg/L NA NA Differences in DAPsformulators between exposed andNonexposed 6 30 µg/L 120 µg/L < 20 µg/L 1,200 µg/L 900 µg/L < 20 µg/L NA NA nonexposed
Duncan and Griffith 1985h Citrus sprayers 332 170 µg/L 100 µg/L 150 µg/L 350 µg/L 250 µg/L 250 µg/L NA NA Measurable levelsCitrus harvesters 265 1,650 µg/L 500 µg/L 600 µg/L 650 µg/L 75 µg/L 60 µg/L NA NA
Griffith and Duncan 1985 Citrus sprayers 332 160 µg/L 80 µg/L 110 µg/L 410 µg/L 370 µg/L 240 µg/L NA NA More frequentCitrus harvesters 264 390 µg/L 150 µg/L 250 µg/L 90 µg/L 70 µg/L 60 µg/L NA NA detection among
sprayers; higherlevels amongharvesters
Franklin et al. 1986i Canadian applicators 23 NA 146 µg/L NA NA NA NA NA NA MetaboliteGuthion-dosed 10 NA 72 µg/L NA NA NA NA NA NA measurements morevolunteers (dermal reliable and accurate500–6,000 µg) than dermal patch
Fenske and Leffingwell 1989j Malathion applicator 1 NA 550 µg/L 630 µg/L NA NA NA NA NA Measureable levelsDrevenkar et al. 1991c Orchard sprayers 97 NA (111 µg/g) (145 µg/g) NA NA NA NA NA DAP levels are
sensitive indicatorsof exposure
Aprea et al. 1994b,c,k Controls 99 NA NA NA NA NA NA 145.4 NA Applicators hadnmol/g increased DAP levels;(143.1) using no protective
Applicator women 19 NA NA NA NA NA NA 555.6 NA equipmentwith rubber gloves nmol/g increased levelsand masks (768)Applicator women 28 NA NA NA NA NA NA 654.4 NAwith waterproof cotton nmol/ggloves and masks (611.5)Applicator women 28 NA NA NA NA NA NA 326.3 NAwith cotton gloves nmol/gand masks (385.5)Applicator women 54 NA NA NA NA NA NA 614.0 NAwith cotton gloves nmol/g
(657.5)Men with no 13 NA NA NA NA NA NA 3568.4 NAprotective wear nmol/g
(3,227)Takamiya 1994 Pest control 2 DMP 99,000 µg/g NA NA 97,000 µg/g NA NA NA NA Daily fluctuations
operators 4 DEP in levelsAprea et al. 1997b,c Vineyard sprayers 9 23 µg/g 32 µg/g NA NA NA NA NA NA Higher levels in
Vineyard leaf thinners 2 13 µg/g 59 µg/g NA NA NA NA NA NA vineyard sprayersControls 46 5 µg/g 14 µg/g NA NA NA NA NA NA and thinners
Aprea et al. 1999b Greenhouse workersBasal 5 NA NA NA NA NA NA 183 NA No significant
nmol/g difference in DAPsReentry day 2 5 NA NA NA NA NA NA 245 NA among workers
nmol/g in days followingReentry day 4 5 NA NA NA NA NA NA 174 NA application or
nmol/g between workersReentry day 6 5 NA NA NA NA NA NA 354 NA and controls
nmol/gControls 21 NA NA NA NA NA NA 103 NA
nmol/gCocker et al. 2002c,l Controls 463 NA NA NA NA NA NA 195 nmol/g Nonoccupationally
(141) exposed haveOccupational 917 NA NA NA NA NA NA 292 nmol/g measurable levels;exposures (132) differences only in
distribution tailsLin et al. 2002m Farmers 4 NA 32 µg/L 27 µg/L NA 52 µg/L NA NA NA Measurable
preexposure differencesFarmers 4 NA 77 µg/L 164 µg/L NA 54 µg/L NA NA NA after exposurepostexposure
Continued, next page
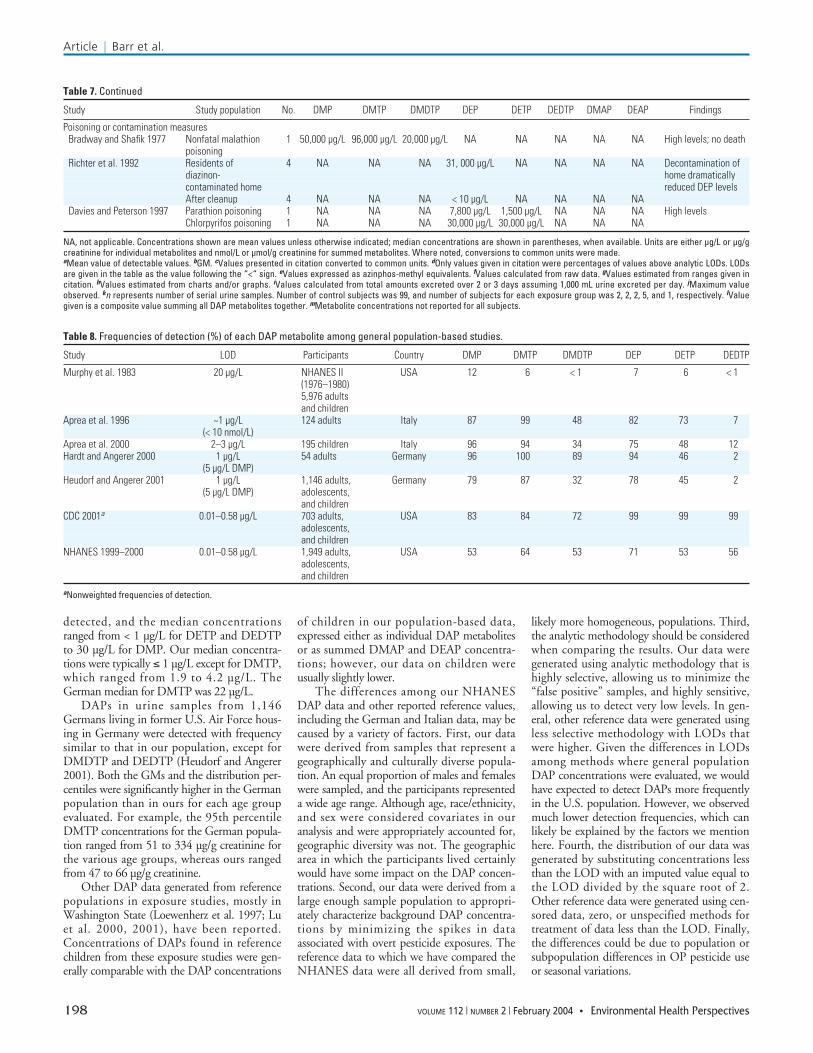
detected, and the median concentrationsranged from < 1 µg/L for DETP and DEDTPto 30 µg/L for DMP. Our median concentra-tions were typically ≤ 1 µg/L except for DMTP,which ranged from 1.9 to 4.2 µg/L. TheGerman median for DMTP was 22 µg/L.
DAPs in urine samples from 1,146Germans living in former U.S. Air Force hous-ing in Germany were detected with frequencysimilar to that in our population, except forDMDTP and DEDTP (Heudorf and Angerer2001). Both the GMs and the distribution per-centiles were significantly higher in the Germanpopulation than in ours for each age groupevaluated. For example, the 95th percentileDMTP concentrations for the German popula-tion ranged from 51 to 334 µg/g creatinine forthe various age groups, whereas ours rangedfrom 47 to 66 µg/g creatinine.
Other DAP data generated from referencepopulations in exposure studies, mostly inWashington State (Loewenherz et al. 1997; Luet al. 2000, 2001), have been reported.Concentrations of DAPs found in referencechildren from these exposure studies were gen-erally comparable with the DAP concentrations
of children in our population-based data,expressed either as individual DAP metabolitesor as summed DMAP and DEAP concentra-tions; however, our data on children wereusually slightly lower.
The differences among our NHANESDAP data and other reported reference values,including the German and Italian data, may becaused by a variety of factors. First, our datawere derived from samples that represent ageographically and culturally diverse popula-tion. An equal proportion of males and femaleswere sampled, and the participants representeda wide age range. Although age, race/ethnicity,and sex were considered covariates in ouranalysis and were appropriately accounted for,geographic diversity was not. The geographicarea in which the participants lived certainlywould have some impact on the DAP concen-trations. Second, our data were derived from alarge enough sample population to appropri-ately characterize background DAP concentra-tions by minimizing the spikes in dataassociated with overt pesticide exposures. Thereference data to which we have compared theNHANES data were all derived from small,
likely more homogeneous, populations. Third,the analytic methodology should be consideredwhen comparing the results. Our data weregenerated using analytic methodology that ishighly selective, allowing us to minimize the“false positive” samples, and highly sensitive,allowing us to detect very low levels. In gen-eral, other reference data were generated usingless selective methodology with LODs thatwere higher. Given the differences in LODsamong methods where general populationDAP concentrations were evaluated, we wouldhave expected to detect DAPs more frequentlyin the U.S. population. However, we observedmuch lower detection frequencies, which canlikely be explained by the factors we mentionhere. Fourth, the distribution of our data wasgenerated by substituting concentrations lessthan the LOD with an imputed value equal tothe LOD divided by the square root of 2.Other reference data were generated using cen-sored data, zero, or unspecified methods fortreatment of data less than the LOD. Finally,the differences could be due to population orsubpopulation differences in OP pesticide useor seasonal variations.
Article | Barr et al.
198 VOLUME 112 | NUMBER 2 | February 2004 • Environmental Health Perspectives
Table 8. Frequencies of detection (%) of each DAP metabolite among general population-based studies.
Study LOD Participants Country DMP DMTP DMDTP DEP DETP DEDTP
Murphy et al. 1983 20 µg/L NHANES II USA 12 6 < 1 7 6 < 1(1976–1980)5,976 adultsand children
Aprea et al. 1996 ~1 µg/L 124 adults Italy 87 99 48 82 73 7(< 10 nmol/L)
Aprea et al. 2000 2–3 µg/L 195 children Italy 96 94 34 75 48 12Hardt and Angerer 2000 1 µg/L 54 adults Germany 96 100 89 94 46 2
(5 µg/L DMP)Heudorf and Angerer 2001 1 µg/L 1,146 adults, Germany 79 87 32 78 45 2
(5 µg/L DMP) adolescents,and children
CDC 2001a 0.01–0.58 µg/L 703 adults, USA 83 84 72 99 99 99adolescents,and children
NHANES 1999–2000 0.01–0.58 µg/L 1,949 adults, USA 53 64 53 71 53 56adolescents,and children
aNonweighted frequencies of detection.
Table 7. Continued
Study Study population No. DMP DMTP DMDTP DEP DETP DEDTP DMAP DEAP Findings
Poisoning or contamination measuresBradway and Shafik 1977 Nonfatal malathion 1 50,000 µg/L 96,000 µg/L 20,000 µg/L NA NA NA NA NA High levels; no death
poisoningRichter et al. 1992 Residents of 4 NA NA NA 31, 000 µg/L NA NA NA NA Decontamination of
diazinon- home dramaticallycontaminated home reduced DEP levelsAfter cleanup 4 NA NA NA < 10 µg/L NA NA NA NA
Davies and Peterson 1997 Parathion poisoning 1 NA NA NA 7,800 µg/L 1,500 µg/L NA NA NA High levelsChlorpyrifos poisoning 1 NA NA NA 30,000 µg/L 30,000 µg/L NA NA NA
NA, not applicable. Concentrations shown are mean values unless otherwise indicated; median concentrations are shown in parentheses, when available. Units are either µg/L or µg/gcreatinine for individual metabolites and nmol/L or µmol/g creatinine for summed metabolites. Where noted, conversions to common units were made. aMean value of detectable values. bGM. cValues presented in citation converted to common units. dOnly values given in citation were percentages of values above analytic LODs. LODsare given in the table as the value following the “<“ sign. eValues expressed as azinphos-methyl equivalents. fValues calculated from raw data. gValues estimated from ranges given incitation. hValues estimated from charts and/or graphs. iValues calculated from total amounts excreted over 2 or 3 days assuming 1,000 mL urine excreted per day. jMaximum valueobserved. kn represents number of serial urine samples. Number of control subjects was 99, and number of subjects for each exposure group was 2, 2, 2, 5, and 1, respectively. lValuegiven is a composite value summing all DAP metabolites together. mMetabolite concentrations not reported for all subjects.
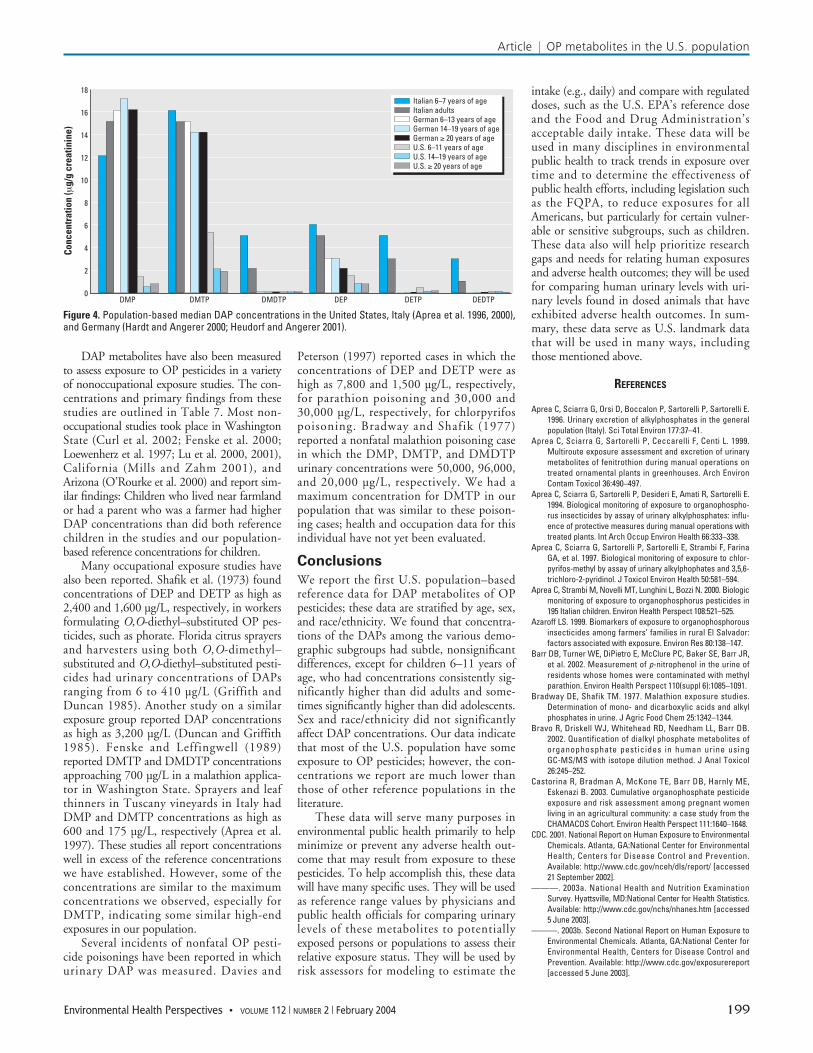
DAP metabolites have also been measuredto assess exposure to OP pesticides in a varietyof nonoccupational exposure studies. The con-centrations and primary findings from thesestudies are outlined in Table 7. Most non-occupational studies took place in WashingtonState (Curl et al. 2002; Fenske et al. 2000;Loewenherz et al. 1997; Lu et al. 2000, 2001),California (Mills and Zahm 2001), andArizona (O’Rourke et al. 2000) and report sim-ilar findings: Children who lived near farmlandor had a parent who was a farmer had higherDAP concentrations than did both referencechildren in the studies and our population-based reference concentrations for children.
Many occupational exposure studies havealso been reported. Shafik et al. (1973) foundconcentrations of DEP and DETP as high as2,400 and 1,600 µg/L, respectively, in workersformulating O,O-diethyl–substituted OP pes-ticides, such as phorate. Florida citrus sprayersand harvesters using both O,O-dimethyl–substituted and O,O-diethyl–substituted pesti-cides had urinary concentrations of DAPsranging from 6 to 410 µg/L (Griffith andDuncan 1985). Another study on a similarexposure group reported DAP concentrationsas high as 3,200 µg/L (Duncan and Griffith1985). Fenske and Leffingwell (1989)reported DMTP and DMDTP concentrationsapproaching 700 µg/L in a malathion applica-tor in Washington State. Sprayers and leafthinners in Tuscany vineyards in Italy hadDMP and DMTP concentrations as high as600 and 175 µg/L, respectively (Aprea et al.1997). These studies all report concentrationswell in excess of the reference concentrationswe have established. However, some of theconcentrations are similar to the maximumconcentrations we observed, especially forDMTP, indicating some similar high-endexposures in our population.
Several incidents of nonfatal OP pesti-cide poisonings have been reported in whichurinary DAP was measured. Davies and
Peterson (1997) reported cases in which theconcentrations of DEP and DETP were ashigh as 7,800 and 1,500 µg/L, respectively,for parathion poisoning and 30,000 and30,000 µg/L, respectively, for chlorpyrifospoisoning. Bradway and Shafik (1977)reported a nonfatal malathion poisoning casein which the DMP, DMTP, and DMDTPurinary concentrations were 50,000, 96,000,and 20,000 µg/L, respectively. We had amaximum concentration for DMTP in ourpopulation that was similar to these poison-ing cases; health and occupation data for thisindividual have not yet been evaluated.
Conclusions
We report the first U.S. population–basedreference data for DAP metabolites of OPpesticides; these data are stratified by age, sex,and race/ethnicity. We found that concentra-tions of the DAPs among the various demo-graphic subgroups had subtle, nonsignificantdifferences, except for children 6–11 years ofage, who had concentrations consistently sig-nificantly higher than did adults and some-times significantly higher than did adolescents.Sex and race/ethnicity did not significantlyaffect DAP concentrations. Our data indicatethat most of the U.S. population have someexposure to OP pesticides; however, the con-centrations we report are much lower thanthose of other reference populations in theliterature.
These data will serve many purposes inenvironmental public health primarily to helpminimize or prevent any adverse health out-come that may result from exposure to thesepesticides. To help accomplish this, these datawill have many specific uses. They will be usedas reference range values by physicians andpublic health officials for comparing urinarylevels of these metabolites to potentiallyexposed persons or populations to assess theirrelative exposure status. They will be used byrisk assessors for modeling to estimate the
intake (e.g., daily) and compare with regulateddoses, such as the U.S. EPA’s reference doseand the Food and Drug Administration’sacceptable daily intake. These data will beused in many disciplines in environmentalpublic health to track trends in exposure overtime and to determine the effectiveness ofpublic health efforts, including legislation suchas the FQPA, to reduce exposures for allAmericans, but particularly for certain vulner-able or sensitive subgroups, such as children.These data also will help prioritize researchgaps and needs for relating human exposuresand adverse health outcomes; they will be usedfor comparing human urinary levels with uri-nary levels found in dosed animals that haveexhibited adverse health outcomes. In sum-mary, these data serve as U.S. landmark datathat will be used in many ways, includingthose mentioned above.
REFERENCES
Aprea C, Sciarra G, Orsi D, Boccalon P, Sartorelli P, Sartorelli E.1996. Urinary excretion of alkylphosphates in the generalpopulation (Italy). Sci Total Environ 177:37–41.
Aprea C, Sciarra G, Sartorelli P, Ceccarelli F, Centi L. 1999.Multiroute exposure assessment and excretion of urinarymetabolites of fenitrothion during manual operations ontreated ornamental plants in greenhouses. Arch EnvironContam Toxicol 36:490–497.
Aprea C, Sciarra G, Sartorelli P, Desideri E, Amati R, Sartorelli E.1994. Biological monitoring of exposure to organophospho-rus insecticides by assay of urinary alkylphosphates: influ-ence of protective measures during manual operations withtreated plants. Int Arch Occup Environ Health 66:333–338.
Aprea C, Sciarra G, Sartorelli P, Sartorelli E, Strambi F, FarinaGA, et al. 1997. Biological monitoring of exposure to chlor-pyrifos-methyl by assay of urinary alkylphophates and 3,5,6-trichloro-2-pyridinol. J Toxicol Environ Health 50:581–594.
Aprea C, Strambi M, Novelli MT, Lunghini L, Bozzi N. 2000. Biologicmonitoring of exposure to organophosphorus pesticides in195 Italian children. Environ Health Perspect 108:521–525.
Azaroff LS. 1999. Biomarkers of exposure to organophosphorousinsecticides among farmers’ families in rural El Salvador:factors associated with exposure. Environ Res 80:138–147.
Barr DB, Turner WE, DiPietro E, McClure PC, Baker SE, Barr JR,et al. 2002. Measurement of p-nitrophenol in the urine ofresidents whose homes were contaminated with methylparathion. Environ Health Perspect 110(suppl 6):1085–1091.
Bradway DE, Shafik TM. 1977. Malathion exposure studies.Determination of mono- and dicarboxylic acids and alkylphosphates in urine. J Agric Food Chem 25:1342–1344.
Bravo R, Driskell WJ, Whitehead RD, Needham LL, Barr DB.2002. Quantification of dialkyl phosphate metabolites oforganophosphate pesticides in human urine usingGC-MS/MS with isotope dilution method. J Anal Toxicol26:245–252.
Castorina R, Bradman A, McKone TE, Barr DB, Harnly ME,Eskenazi B. 2003. Cumulative organophosphate pesticideexposure and risk assessment among pregnant womenliving in an agricultural community: a case study from theCHAMACOS Cohort. Environ Health Perspect 111:1640–1648.
CDC. 2001. National Report on Human Exposure to EnvironmentalChemicals. Atlanta, GA:National Center for EnvironmentalHealth, Centers for Disease Control and Prevention.Available: http://www.cdc.gov/nceh/dls/report/ [accessed21 September 2002].
———. 2003a. National Health and Nutrition ExaminationSurvey. Hyattsville, MD:National Center for Health Statistics.Available: http://www.cdc.gov/nchs/nhanes.htm [accessed5 June 2003].
———. 2003b. Second National Report on Human Exposure toEnvironmental Chemicals. Atlanta, GA:National Center forEnvironmental Health, Centers for Disease Control andPrevention. Available: http://www.cdc.gov/exposurereport[accessed 5 June 2003].
Article | OP metabolites in the U.S. population
Environmental Health Perspectives • VOLUME 112 | NUMBER 2 | February 2004 199
18
16
14
12
10
8
6
4
2
0
Conc
entr
atio
n (µ
g/g
crea
tinin
e)
DMP DMTP DMDTP DEP DETP DEDTP
Italian 6–7 years of ageItalian adultsGerman 6–13 years of ageGerman 14–19 years of ageGerman ≥ 20 years of ageU.S. 6–11 years of ageU.S. 14–19 years of ageU.S. ≥ 20 years of age
Figure 4. Population-based median DAP concentrations in the United States, Italy (Aprea et al. 1996, 2000),and Germany (Hardt and Angerer 2000; Heudorf and Angerer 2001).
Article | Barr et al.
200 VOLUME 112 | NUMBER 2 | February 2004 • Environmental Health Perspectives
Clinical Laboratory Improvement Amendment of 1988. 1988.Public Law 100-578.
Cocker J, Mason HJ, Garfitt SJ, Jones K. 2002. Biological moni-toring of exposure to organophosphate pesticides. ToxicolLett 134:97–103.
Curl CL, Fenske RA, Elgethun K. 2003a. Organophosphate expo-sure: response to Krieger et al. and Charnley [Letter].Environ Health Perspect 111:A689–A691.
———. 2003b. Organophosphorus pesticide exposure of urbanand suburban preschool children with organic and con-ventional diets. Environ Health Perspect 111:377–382.
Curl CL, Fenske RA, Kissel JC, Shirai JH, Moate TF, Griffith W,et al. 2002. Evaluation of take-home organophosphoruspesticide exposure among agricultural workers and theirchildren. Environ Health Perspect 110:A787–A792.
Davies JE, Peterson JC. 1997. Surveillance of occupational,accidental, and incidental exposure to organophosphatepesticides using urine alkyl phosphate and phenolicmetabolite measurements. Ann NY Acad Sci 837:257–268.
Drevenkar V, Radic Z, Vasilic Z, Reiner E. 1991. Dialkylphosphorusmetabolites in the urine and activities of esterases in theserum as biochemical indices for human absorption oforganophosphorus pesticides. Arch Environ Contam Toxicol20:417–422.
Duncan RC, Griffith J. 1985. Monitoring study of urinary metabo-lites and selected symptomatology among Florida citrusworkers. J Toxicol Environ Health 16:509–521.
Eskenazi B, Bradman A, Castorina R. 1999. Exposures of childrento organophosphate pesticides and their potential adversehealth effects. Environ Health Perspect 107(suppl 3):409–419.
Fenske R, Leffingwell JT. 1989. Method for the determination ofdialkyl phosphate metabolites in urine for studies of humanexposure to malathion. J Agric Food Chem 37:995–998.
Fenske RA, Lu C, Simcox NJ, Loewenherz C, Touchstone J,Moate TF, et al. 2000. Strategies for assessing children’sorganophosphorus pesticide exposures in agriculturalcommunities. J Expo Anal Environ Epidemiol 10:662–671.
Food Quality Protection Act. 1996. Public Law 104-170.Franklin CA, Muir NI, Moody RP. 1986. The use of biological mon-
itoring in the estimation of exposure during the applicationof pesticides. Toxicol Lett 33:127–136.
Garcia AM, Sabater MC, Mendoza MT, Ballester F, Carrasco JM.2000. Exposure to organophosphate pesticides in a generalpopulation living in a rice growing area: an exploratorystudy. Bull Environ Contam Toxicol 65:764–771.
Griffith JG, Duncan RC. 1985. Alkyl phosphate residue values inthe urine of Florida citrus fieldworkers compared to theNational Health and Nutrition Examination Survey (NHANES)sample. Bull Environ Contam Toxicol 34:210–215.
Hardt J, Angerer J. 2000. Determination of dialkyl phosphates inhuman urine using gas chromatography-mass spectrometry.J Anal Toxicol 24:678–684.
Heudorf U, Angerer J. 2001. Metabolites of organophosphorousinsecticides in urine specimens from inhabitants of a resi-dential area. Environ Res 86:80–87.
Hornung RW, Reed DL. 1990. Estimation of average concentra-tion in the presence of nondetectable values. Appl OccupEnviron Hyg 5:46–51.
Jaffe M. 1886. Ueber den niederschlag welchen pikrinsaure innormalen harn erzeugt und uber eine neue reaction deskreatinins. Z Physio Chem 10:391–400.
Karalliedde L, Feldman RJ, Henderson LO, Marrs T. 2001.Organophosphates and Health. London:Imperial CollegePress.
Koch D, Lu C, Fisker-Andersen J, Jolley L, Fenske RA. 2002.Temporal association of children’s pesticide exposure andagricultural spraying: report of a longitudinal biologicalmonitoring study. Environ Health Perspect 110:829–833.
Krieger RI, Dinoff TM, Williams RL, Zhang X, Ross JH, Aston LS,et al. 2003. Preformed biomarkers in produce inflatehuman organophosphate exposure assessments. EnvironHealth Perspect 111:A688–A689.
Lin WC, Kuei CH, Wu HC, Yang CC, Chang HY. 2002. Method forthe determination of dialkyl phosphates in urine by stronganion exchange disk extraction and in-vial derivatization.J Anal Toxicol 26:176–180.
Loewenherz C, Fenske RA, Simcox NJ, Bellamy G, Kalman D.1997. Biological monitoring of organophosphorus pesticideexposure among children of agricultural workers in centralWashington State. Environ Health Perspect 105:1344–1353.
Lu C, Fenske RA, Simcox NJ, Kalman D. 2000. Pesticide expo-sure of children in an agricultural community: evidence ofhousehold proximity to farmland and take home exposurepathways. Environ Res 84:290–302.
Lu C, Knutson DE, Fisker-Andersen J, Fenske RA. 2001.Biological monitoring survey of organophosphorus pesti-cide exposure among pre-school children in the Seattlemetropolitan area. Environ Health Perspect 109:299–303.
Mileson BE, Chambers JE, Chen WL, Dettbarn W, Ehrich M,Eldefrawi AT, et al. 1998. Common mechanism of toxicity: acase study of organophosphorus pesticides. Toxicol Sci41:8–20.
Mills PK, Zahm SH. 2001. Organophosphate pesticide residuesin urine of farmworkers and their children in FresnoCounty, California. Am J Ind Med 40:571–577.
Murphy RS, Kutz FW, Strassman SC. 1983. Selected pesticideresidues or metabolites in blood and urine specimens from ageneral population survey. Environ Health Perspect 48:81–86.
National Research Council. Committee on Pesticides in the Dietsof Infants and Children. 1993. Pesticides in the Diets ofInfants and Children. Washington, DC:National AcademyPress.
O’Rourke MK, Lizardi PS, Rogan SP, Freeman NC, Aguirre A, SaintCG. 2000. Pesticide exposure and creatinine variation amongyoung children. J Expo Anal Environ Epidemiol 10:672–681.
Richter ED, Kowalski M, Leventhal A, Grauer F, Marzouk J,Brenner S, et al. 1992. Illness and excretion of organophos-phate metabolites four months after household pest exter-mination. Arch Environ Health 47:135–138.
Royster MO, Hilborn ED, Barr D, Carty CL, Rhoney S, Walsh D.2002. A pilot study of global positioning system/geographicalinformation system measurement of residential proximity toagricultural fields and urinary organophosphate metaboliteconcentrations in toddlers. J Expo Anal Environ Epidemiol12:433–440.
Shafik T, Bradway DE, Enos HF, Yobs AR. 1973. Gas-liquid chro-matographic analysis of alkyl phosphate metabolites inurine. J Agric Food Chem 21:625–629.
Shalat SL, Donnelly KC, Freeman NC, Calvin JA, Ramesh S,Jimenez M, et al. 2003. Nondietary ingestion of pesticidesby children in an agricultural community on the US/Mexicoborder: preliminary results. J Expo Anal Environ Epidemiol13:42–50.
Takamiya K. 1994. Monitoring of urinary alkyl phosphates in pestcontrol operators exposed to various organophosphorusinsecticides. Bull Environ Contam Toxicol 52:190–195.
U.S. EPA. 1991. EPA’s Pesticide Programs. Washington, DC:U.S.Environmental Protection Agency.
———. 2003. Organophosphate Pesticides. Available:http://www.epa.gov/pesticides/op/ [accessed 5 June 2003].
Westgard JO. 2002. Basic QC Practices: Training in StatisticalQuality Control for Health Care Laboratories. Madison,WI:Westgard QC, Inc.
Whitmore RW, Kelly JE, Reading PL. 2003. National Home andGarden Pesticide Survey: Final Report, Vol 1. RTI/5100. 17001F.Research Triangle Park, NC:Research Triangle Institute.
Whyatt RM, Barr DB. 2001. Measurement of organophosphatemetabolites in postpartum meconium as a potential bio-marker of prenatal exposure: a validation study. EnvironHealth Perspect 109:417–420.
Wilson NK, Chuang JC, Lyu C, Menton R, Morgan MK. 2003.Aggregate exposures of nine preschool children to persis-tent organic pollutants at day care and at home. J ExpoAnal Environ Epidemiol 13:187–202.
Related Documents