Author's personal copy Concentrating solar thermal power as a viable alternative in China’s electricity supply John Chung-Ling Chien a , Noam Lior b,n a The Joseph H. Lauder Institute of Management & International Studies, The Wharton School of Business, University of Pennsylvania, Philadelphia, PA 19104-6330, USA b Department of Mechanical Engineering and Applied Mechanics, University of Pennsylvania, Philadelphia, PA 19104-6315, USA article info Article history: Received 10 January 2011 Accepted 16 August 2011 Available online 11 October 2011 Keywords: Concentrating solar thermal power Solar power China energy abstract Study of low-carbon and pollution renewable alternatives for China revealed that concentrating solar thermal (CST) electric power generation was underemphasized in China’s renewable energy plan. The analysis shows the competitive viability of CST: (1) China has the key prerequisites to make CST power generation economical including high-quality insolation and appropriate land, (2) CST’s proven history, scale, and dispatchability makes it a good utility-scale power option, especially in the economically underdeveloped Western regions, (3) while CST power is currently more expensive than coal-fired electricity on a nominal basis, when costs of externalities are accounted for, CST, at 11.4 US cents/kWh, can become 57% cheaper than scrubbed coal and 29% cheaper than nuclear power, (4) CST power continues dropping in cost due to economies of scale and technological improvements and can potentially realize a levelized electricity cost of around 4 cents/kWh within ten years, (5) it would significantly rise in competitiveness if and when China completes the extensive smart grid for connecting its solar-abundant western regions with the high-demand eastern regions, (6) CST has the potential to positively impact Western China’s economy, but proper policy and deal structure must be in place to ensure that the local community shares the benefit. & 2011 Elsevier Ltd. All rights reserved. 1. Introduction 1.1. China’s 2020 goal—‘‘quadrupling GDP while only doubling energy consumption’’ China’s stated plan for the next 11 years is to continue its economic growth with the stated goal of quadrupling its GDP by 2020 versus the year 2000 while only doubling energy consump- tion (CCCIN, 2005). Though this GDP target may be reduced in view of the current financial crisis, this economic policy target signifies the importance of economic growth in China’s vision of realizing the building of a ‘‘well-off society in an all-round way’’ as set forth in the 17th CCP National Congress (Xinhua, 2007a). Having experienced traditional development issues and faced with increasing international pressure on environmental pollu- tion, Chinese leaders appear to recognize the need for sustainable development – balancing economic, social, and environmental factors – in reaching the country’s objective. A comprehensive review of sustainable energy development in China can be found in a recent special issue of Energy—The International Journal edited and prefaced by Jin et al. (2010a). The seriousness of the global environmental consequence from China’s continued pursuit of economic growth has not been lost on the global stage. At the World Economic Forum of 2007 at Davos, climate change and China’s CO 2 emission trends were key issues of the international leaders. At COP 15 (2009), where 120 heads of states and government attended the conference to negotiate a new binding agreement on emissions control to replace the soon to expire Kyoto Protocol, the contentious issue of emissions control as a debilitating factor on economic growth for emerging economies such as China was partly responsible for the summit’s failure in reaching a binding agreement. President Obama and Secretary Clinton have made climate change a key item on the foreign policy agenda for China. On Hillary Clinton’s inaugural visit to China as Secretary of State in 2009, she cited that the key areas of collaboration with China are clean energy and climate change, and to accelerate the transformation to low- carbon economies while acknowledging China’s right to grow and attain a good standard of living (DOS, 2009a). Importantly, Clinton preempted the oft used argument that developed countries polluted their way to affluence by saying ‘‘when we [USA] were industrializing and growing, we did not know any better; neither did Europe. Now we are smart enough to figure out how to have the right kind of growthywe hope you would not make the same Contents lists available at SciVerse ScienceDirect journal homepage: www.elsevier.com/locate/enpol Energy Policy 0301-4215/$ - see front matter & 2011 Elsevier Ltd. All rights reserved. doi:10.1016/j.enpol.2011.08.034 n Corresponding author. Tel.: þ1 2158984803; fax: þ1 2155736334. E-mail addresses: [email protected] (J. Chien), [email protected] (N. Lior). Energy Policy 39 (2011) 7622–7636

Welcome message from author
This document is posted to help you gain knowledge. Please leave a comment to let me know what you think about it! Share it to your friends and learn new things together.
Transcript
Author's personal copy
Concentrating solar thermal power as a viable alternative in China’selectricity supply
John Chung-Ling Chien a, Noam Lior b,n
a The Joseph H. Lauder Institute of Management & International Studies, The Wharton School of Business, University of Pennsylvania, Philadelphia, PA 19104-6330, USAb Department of Mechanical Engineering and Applied Mechanics, University of Pennsylvania, Philadelphia, PA 19104-6315, USA
a r t i c l e i n f o
Article history:Received 10 January 2011Accepted 16 August 2011Available online 11 October 2011
Keywords:Concentrating solar thermal powerSolar powerChina energy
a b s t r a c t
Study of low-carbon and pollution renewable alternatives for China revealed that concentrating solarthermal (CST) electric power generation was underemphasized in China’s renewable energy plan. Theanalysis shows the competitive viability of CST: (1) China has the key prerequisites to make CST powergeneration economical including high-quality insolation and appropriate land, (2) CST’s proven history,scale, and dispatchability makes it a good utility-scale power option, especially in the economicallyunderdeveloped Western regions, (3) while CST power is currently more expensive than coal-firedelectricity on a nominal basis, when costs of externalities are accounted for, CST, at 11.4 US cents/kWh,can become 57% cheaper than scrubbed coal and 29% cheaper than nuclear power, (4) CST powercontinues dropping in cost due to economies of scale and technological improvements and canpotentially realize a levelized electricity cost of around 4 cents/kWh within ten years, (5) it wouldsignificantly rise in competitiveness if and when China completes the extensive smart grid forconnecting its solar-abundant western regions with the high-demand eastern regions, (6) CST hasthe potential to positively impact Western China’s economy, but proper policy and deal structure mustbe in place to ensure that the local community shares the benefit.
& 2011 Elsevier Ltd. All rights reserved.
1. Introduction
1.1. China’s 2020 goal—‘‘quadrupling GDP while only doublingenergy consumption’’
China’s stated plan for the next 11 years is to continue itseconomic growth with the stated goal of quadrupling its GDP by2020 versus the year 2000 while only doubling energy consump-tion (CCCIN, 2005). Though this GDP target may be reduced inview of the current financial crisis, this economic policy targetsignifies the importance of economic growth in China’s vision ofrealizing the building of a ‘‘well-off society in an all-round way’’as set forth in the 17th CCP National Congress (Xinhua, 2007a).Having experienced traditional development issues and facedwith increasing international pressure on environmental pollu-tion, Chinese leaders appear to recognize the need for sustainabledevelopment – balancing economic, social, and environmentalfactors – in reaching the country’s objective. A comprehensivereview of sustainable energy development in China can be found
in a recent special issue of Energy—The International Journaledited and prefaced by Jin et al. (2010a).
The seriousness of the global environmental consequence fromChina’s continued pursuit of economic growth has not been loston the global stage. At the World Economic Forum of 2007 atDavos, climate change and China’s CO2 emission trends were keyissues of the international leaders. At COP 15 (2009), where 120heads of states and government attended the conference tonegotiate a new binding agreement on emissions control toreplace the soon to expire Kyoto Protocol, the contentious issueof emissions control as a debilitating factor on economic growthfor emerging economies such as China was partly responsible forthe summit’s failure in reaching a binding agreement. PresidentObama and Secretary Clinton have made climate change a keyitem on the foreign policy agenda for China. On Hillary Clinton’sinaugural visit to China as Secretary of State in 2009, she citedthat the key areas of collaboration with China are clean energyand climate change, and to accelerate the transformation to low-carbon economies while acknowledging China’s right to grow andattain a good standard of living (DOS, 2009a). Importantly, Clintonpreempted the oft used argument that developed countriespolluted their way to affluence by saying ‘‘when we [USA] wereindustrializing and growing, we did not know any better; neitherdid Europe. Now we are smart enough to figure out how to havethe right kind of growthywe hope you would not make the same
Contents lists available at SciVerse ScienceDirect
journal homepage: www.elsevier.com/locate/enpol
Energy Policy
0301-4215/$ - see front matter & 2011 Elsevier Ltd. All rights reserved.doi:10.1016/j.enpol.2011.08.034
n Corresponding author. Tel.: !1 2158984803; fax: !1 2155736334.E-mail addresses: [email protected] (J. Chien),
[email protected] (N. Lior).
Energy Policy 39 (2011) 7622–7636
John Chien
Author's personal copy
mistake we made’’ (DOS, 2009b). The recognition of the impor-tance of restraining the CO2 emissions in China’s development isrecognized by China’s government and other experts (see Jianget al., 2010; He et al., 2010). Since 70% of China’s energy comesfrom coal, of even more immediate importance than the CO2
emissions are the health and life threatening consequences of coalmining, transportation, and combustion emissions, describedthoroughly by Wang (2010a), Yao et al. (2009), and You and Xu(2010), which also have an important detrimental effect onChina’s net GDP.
China’s initiatives and actions thus far suggest that it is tryinghard not to make those same mistakes that US and Europe did. Itstarted promoting the development of renewable energy with the8th Five Year Plan. Other notable legislations and regulations includethe Energy Conservation Law of PRC (1997), the Air PollutionPrevention Law of PRC (2000), the 1996–2010 New Energy andRenewable Energy Development Principles, the 2000–2015 NewEnergy and Renewable Energy Development Principles, the Com-prehensive Working Programs on Energy Saving and EmissionReduction, and many others. All of these policy actions are aimedat encouraging the use and development of energy conservation andefficiency, renewable energy use, the build-up of a renewable energyindustry, and promoting greater renewable energy applications foremissions reduction. China has also passed the PRC Law of Renew-able Energy in 2005 representing the Chinese government’s priorityon the issue of sustainable development, and setting the frameworkto enact supporting laws and policies to further renewable energydevelopment (Zhang et al., 2009).
Against this backdrop, Hu Jintao, China’s President and Chair-man of the CCP, stressed the need for ‘‘energy resource conserva-tion and environmental protection’’ and called for theimplementation of a ‘‘system for the work of conserving energyand reducing emissions, develop and promote advanced practicaltechnology that can save, replace, and recycle energy resources,and develop clean energy and renewable energy.’’ (Xinhua, 2007a,2007b) In short, China plans to achieve a sustainable policy in theenergy sector by saving energy resources, increasing energyefficiency, and adding an increase of renewable energy resourcesinto China’s energy mix.
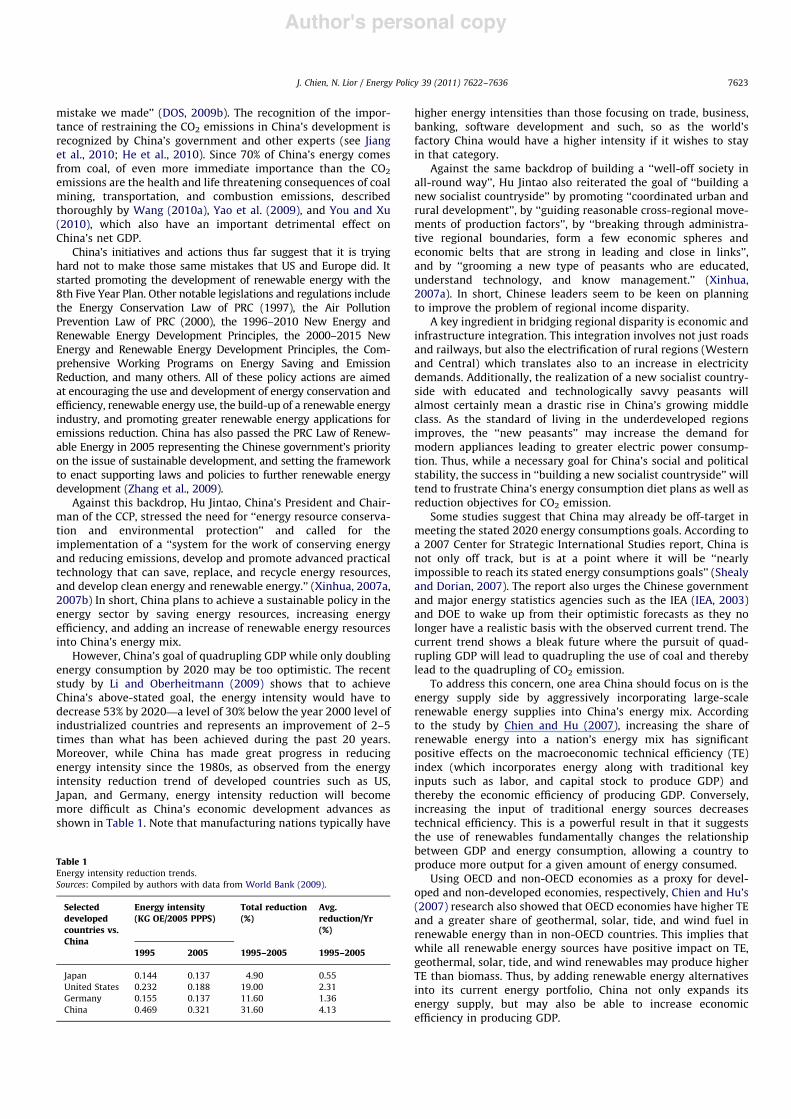
However, China’s goal of quadrupling GDP while only doublingenergy consumption by 2020 may be too optimistic. The recentstudy by Li and Oberheitmann (2009) shows that to achieveChina’s above-stated goal, the energy intensity would have todecrease 53% by 2020—a level of 30% below the year 2000 level ofindustrialized countries and represents an improvement of 2–5times than what has been achieved during the past 20 years.Moreover, while China has made great progress in reducingenergy intensity since the 1980s, as observed from the energyintensity reduction trend of developed countries such as US,Japan, and Germany, energy intensity reduction will becomemore difficult as China’s economic development advances asshown in Table 1. Note that manufacturing nations typically have
higher energy intensities than those focusing on trade, business,banking, software development and such, so as the world’sfactory China would have a higher intensity if it wishes to stayin that category.
Against the same backdrop of building a ‘‘well-off society inall-round way’’, Hu Jintao also reiterated the goal of ‘‘building anew socialist countryside’’ by promoting ‘‘coordinated urban andrural development’’, by ‘‘guiding reasonable cross-regional move-ments of production factors’’, by ‘‘breaking through administra-tive regional boundaries, form a few economic spheres andeconomic belts that are strong in leading and close in links’’,and by ‘‘grooming a new type of peasants who are educated,understand technology, and know management.’’ (Xinhua,2007a). In short, Chinese leaders seem to be keen on planningto improve the problem of regional income disparity.
A key ingredient in bridging regional disparity is economic andinfrastructure integration. This integration involves not just roadsand railways, but also the electrification of rural regions (Westernand Central) which translates also to an increase in electricitydemands. Additionally, the realization of a new socialist country-side with educated and technologically savvy peasants willalmost certainly mean a drastic rise in China’s growing middleclass. As the standard of living in the underdeveloped regionsimproves, the ‘‘new peasants’’ may increase the demand formodern appliances leading to greater electric power consump-tion. Thus, while a necessary goal for China’s social and politicalstability, the success in ‘‘building a new socialist countryside’’ willtend to frustrate China’s energy consumption diet plans as well asreduction objectives for CO2 emission.
Some studies suggest that China may already be off-target inmeeting the stated 2020 energy consumptions goals. According toa 2007 Center for Strategic International Studies report, China isnot only off track, but is at a point where it will be ‘‘nearlyimpossible to reach its stated energy consumptions goals’’ (Shealyand Dorian, 2007). The report also urges the Chinese governmentand major energy statistics agencies such as the IEA (IEA, 2003)and DOE to wake up from their optimistic forecasts as they nolonger have a realistic basis with the observed current trend. Thecurrent trend shows a bleak future where the pursuit of quad-rupling GDP will lead to quadrupling the use of coal and therebylead to the quadrupling of CO2 emission.
To address this concern, one area China should focus on is theenergy supply side by aggressively incorporating large-scalerenewable energy supplies into China’s energy mix. Accordingto the study by Chien and Hu (2007), increasing the share ofrenewable energy into a nation’s energy mix has significantpositive effects on the macroeconomic technical efficiency (TE)index (which incorporates energy along with traditional keyinputs such as labor, and capital stock to produce GDP) andthereby the economic efficiency of producing GDP. Conversely,increasing the input of traditional energy sources decreasestechnical efficiency. This is a powerful result in that it suggeststhe use of renewables fundamentally changes the relationshipbetween GDP and energy consumption, allowing a country toproduce more output for a given amount of energy consumed.
Using OECD and non-OECD economies as a proxy for devel-oped and non-developed economies, respectively, Chien and Hu’s(2007) research also showed that OECD economies have higher TEand a greater share of geothermal, solar, tide, and wind fuel inrenewable energy than in non-OECD countries. This implies thatwhile all renewable energy sources have positive impact on TE,geothermal, solar, tide, and wind renewables may produce higherTE than biomass. Thus, by adding renewable energy alternativesinto its current energy portfolio, China not only expands itsenergy supply, but may also be able to increase economicefficiency in producing GDP.
Table 1Energy intensity reduction trends.Sources: Compiled by authors with data from World Bank (2009).
Selecteddevelopedcountries vs.China
Energy intensity(KG OE/2005 PPP$)
Total reduction(%)
Avg.reduction/Yr(%)
1995 2005 1995–2005 1995–2005
Japan 0.144 0.137 4.90 0.55United States 0.232 0.188 19.00 2.31Germany 0.155 0.137 11.60 1.36China 0.469 0.321 31.60 4.13
J. Chien, N. Lior / Energy Policy 39 (2011) 7622–7636 7623
Author's personal copy
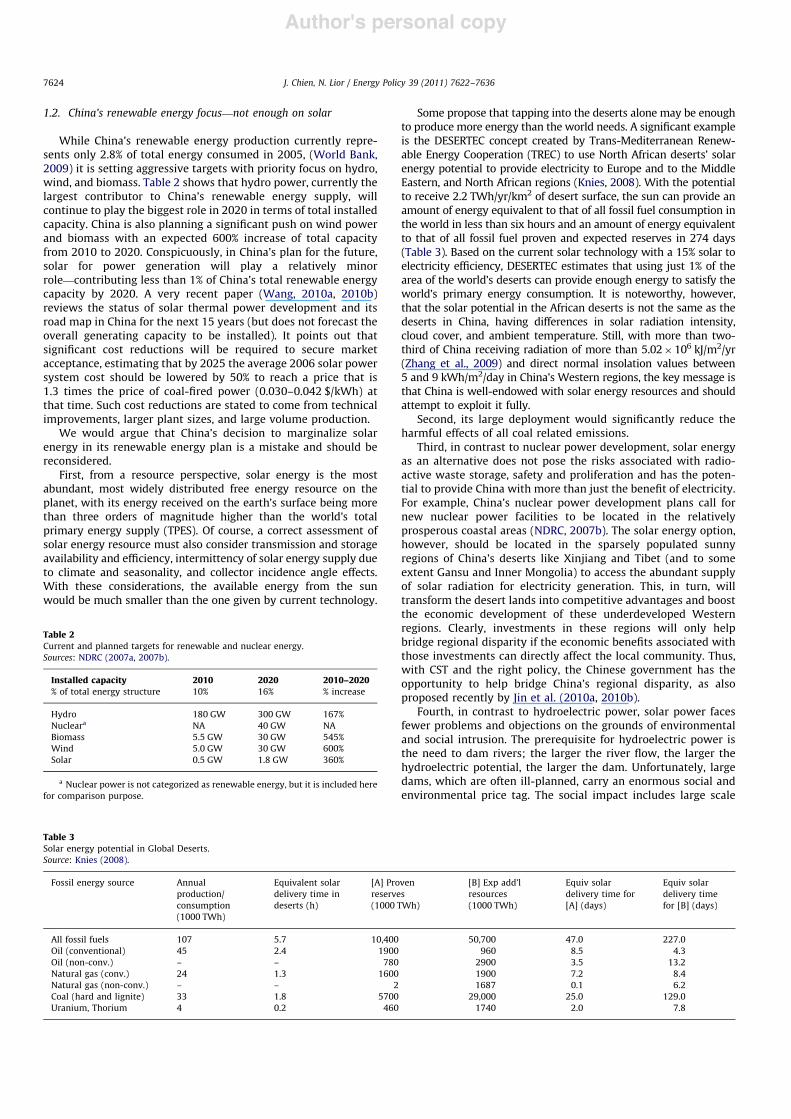
1.2. China’s renewable energy focus—not enough on solar
While China’s renewable energy production currently repre-sents only 2.8% of total energy consumed in 2005, (World Bank,2009) it is setting aggressive targets with priority focus on hydro,wind, and biomass. Table 2 shows that hydro power, currently thelargest contributor to China’s renewable energy supply, willcontinue to play the biggest role in 2020 in terms of total installedcapacity. China is also planning a significant push on wind powerand biomass with an expected 600% increase of total capacityfrom 2010 to 2020. Conspicuously, in China’s plan for the future,solar for power generation will play a relatively minorrole—contributing less than 1% of China’s total renewable energycapacity by 2020. A very recent paper (Wang, 2010a, 2010b)reviews the status of solar thermal power development and itsroad map in China for the next 15 years (but does not forecast theoverall generating capacity to be installed). It points out thatsignificant cost reductions will be required to secure marketacceptance, estimating that by 2025 the average 2006 solar powersystem cost should be lowered by 50% to reach a price that is1.3 times the price of coal-fired power (0.030–0.042 $/kWh) atthat time. Such cost reductions are stated to come from technicalimprovements, larger plant sizes, and large volume production.
We would argue that China’s decision to marginalize solarenergy in its renewable energy plan is a mistake and should bereconsidered.
First, from a resource perspective, solar energy is the mostabundant, most widely distributed free energy resource on theplanet, with its energy received on the earth’s surface being morethan three orders of magnitude higher than the world’s totalprimary energy supply (TPES). Of course, a correct assessment ofsolar energy resource must also consider transmission and storageavailability and efficiency, intermittency of solar energy supply dueto climate and seasonality, and collector incidence angle effects.With these considerations, the available energy from the sunwould be much smaller than the one given by current technology.
Some propose that tapping into the deserts alone may be enoughto produce more energy than the world needs. A significant exampleis the DESERTEC concept created by Trans-Mediterranean Renew-able Energy Cooperation (TREC) to use North African deserts’ solarenergy potential to provide electricity to Europe and to the MiddleEastern, and North African regions (Knies, 2008). With the potentialto receive 2.2 TWh/yr/km2 of desert surface, the sun can provide anamount of energy equivalent to that of all fossil fuel consumption inthe world in less than six hours and an amount of energy equivalentto that of all fossil fuel proven and expected reserves in 274 days(Table 3). Based on the current solar technology with a 15% solar toelectricity efficiency, DESERTEC estimates that using just 1% of thearea of the world’s deserts can provide enough energy to satisfy theworld’s primary energy consumption. It is noteworthy, however,that the solar potential in the African deserts is not the same as thedeserts in China, having differences in solar radiation intensity,cloud cover, and ambient temperature. Still, with more than two-third of China receiving radiation of more than 5.02"106 kJ/m2/yr(Zhang et al., 2009) and direct normal insolation values between5 and 9 kWh/m2/day in China’s Western regions, the key message isthat China is well-endowed with solar energy resources and shouldattempt to exploit it fully.
Second, its large deployment would significantly reduce theharmful effects of all coal related emissions.
Third, in contrast to nuclear power development, solar energyas an alternative does not pose the risks associated with radio-active waste storage, safety and proliferation and has the poten-tial to provide China with more than just the benefit of electricity.For example, China’s nuclear power development plans call fornew nuclear power facilities to be located in the relativelyprosperous coastal areas (NDRC, 2007b). The solar energy option,however, should be located in the sparsely populated sunnyregions of China’s deserts like Xinjiang and Tibet (and to someextent Gansu and Inner Mongolia) to access the abundant supplyof solar radiation for electricity generation. This, in turn, willtransform the desert lands into competitive advantages and boostthe economic development of these underdeveloped Westernregions. Clearly, investments in these regions will only helpbridge regional disparity if the economic benefits associated withthose investments can directly affect the local community. Thus,with CST and the right policy, the Chinese government has theopportunity to help bridge China’s regional disparity, as alsoproposed recently by Jin et al. (2010a, 2010b).
Fourth, in contrast to hydroelectric power, solar power facesfewer problems and objections on the grounds of environmentaland social intrusion. The prerequisite for hydroelectric power isthe need to dam rivers; the larger the river flow, the larger thehydroelectric potential, the larger the dam. Unfortunately, largedams, which are often ill-planned, carry an enormous social andenvironmental price tag. The social impact includes large scale
Table 2Current and planned targets for renewable and nuclear energy.Sources: NDRC (2007a, 2007b).
Installed capacity 2010 2020 2010–2020% of total energy structure 10% 16% % increase
Hydro 180 GW 300 GW 167%Nucleara NA 40 GW NABiomass 5.5 GW 30 GW 545%Wind 5.0 GW 30 GW 600%Solar 0.5 GW 1.8 GW 360%
a Nuclear power is not categorized as renewable energy, but it is included herefor comparison purpose.
Table 3Solar energy potential in Global Deserts.Source: Knies (2008).
Fossil energy source Annualproduction/consumption(1000 TWh)
Equivalent solardelivery time indeserts (h)
[A] Provenreserves(1000 TWh)
[B] Exp add’lresources(1000 TWh)
Equiv solardelivery time for[A] (days)
Equiv solardelivery timefor [B] (days)
All fossil fuels 107 5.7 10,400 50,700 47.0 227.0Oil (conventional) 45 2.4 1900 960 8.5 4.3Oil (non-conv.) – – 780 2900 3.5 13.2Natural gas (conv.) 24 1.3 1600 1900 7.2 8.4Natural gas (non-conv.) – – 2 1687 0.1 6.2Coal (hard and lignite) 33 1.8 5700 29,000 25.0 129.0Uranium, Thorium 4 0.2 460 1740 2.0 7.8
J. Chien, N. Lior / Energy Policy 39 (2011) 7622–76367624
Author's personal copy
resettlement of surrounding communities that are usually poorand need to subsist on the fertile lands near the river. Theenvironmental impact includes reduced biodiversity, degradationof water quality, arguably, the release of GHG emissions(methane), a fragmented ecosystem, land erosion, and couldpossibly trigger earthquakes.
With more than 25,800 large dams (Rhinelander, 2008) andthe Three Gorges Dam (the world’s largest) partially operational,China is now feeling the social and environmental pains fromhydroelectric projects. So far, the construction of the Three Gorgesproject has necessitated the inundation of 2 cities, 11 counties,140 towns, 326 townships, and 1351 villages covering 23,800 haand involved resettling over 1.2 million people (Tillou and Honda,1997; Hvistendahl, 2008). Chinese government officials who havelong dismissed warnings of environmental damage have nowadmitted that the Three Gorges Dam has caused an ecologicalcatastrophe including frequent landslides and pollution (Xinhua,2007b). Worst still, there are new reports produced by bothChinese and US scientists examining the possibility that theworld’s largest dam may have helped trigger the 7.9 scale Sichuanearthquakes that killed 80,000 people (Naik and Oster, 2009).While no one is claiming direct proof that the Three Gorges damcaused the Sichuan earthquake, the US experience with theHoover dam, for example, dam reservoirs do increase seismicactivity.
To be sure, hydroelectric power is currently cheaper than solarand has a higher availability factor. But, in light of the hugeenvironmental and social costs (as illustrated by the Three Gorgesproject), the infrastructure required for solar electricity genera-tion, with a simple and proven design, a proven record of reducingGHG emissions without environmental risk (Aringhoff et al.,2005), and an optimal location at desert areas, creates lessenvironmental and social intrusion compared to hydroelectricpower.
At the same time, a major shortcoming of solar energy use,even in deserts where the insolation is intense and the real estateinexpensive, is the relatively high cost. This is brought about byits low energy density, transience, relatively low conversionefficiency to electricity, and relatively high electricity transmis-sion costs and energy losses since deserts are usually ratherdistant from major electricity use centers.
2. CST technology overview and assessment
2.1. Solar thermal electric systems—concentrating solar thermal
The main methods for using solar energy to generate electri-city are photovoltaics (PV, ‘‘solar cells’’) where solid state devices(at present mostly based on silicon) convert solar radiationdirectly to electricity, and solar thermal collectors of differenttypes that convert the solar radiation to heat, the heat is used togenerate hot vapor or gas, which in turn is used to produce shaftpower that is used to drive electricity generators. Currently, oneof the most economical and robust solar power generationtechnologies is concentrating solar thermal (CST), in whichtypically parabolic line-focus single-axis sun-following concen-trators are deployed to heat and evaporate a working fluid, whichthen uses a Rankine-type power generation cycle (other concen-trating systems use point-focusing concentrators, either as indi-vidual ‘‘dishes’’ or a ‘‘solar tower’’ where many flat mirrors trackthe sun with all of them focusing their solar reflections onto areceiver positioned at a top of a tower in their midst).
With a thermal storage system and/or through hybridizationwith a secondary heat source using conventional fossil fuel, CST canbe used effectively as a source of dispatchable power, as proven by
20 years of operating experience in successfully providing electricpower on a commercial scale (Tester, 2005). The proven success ofCST may be one of the reasons why some of the largest wind powercompanies are adding CST technology into their wind powerportfolio to prepare for their next stage of growth and many utilitiesare also motivated to include CST into their electric power genera-tion portfolio (Wolff, 2008; DOE, 2009).
Other benefits of the CST systems include: (1) ability to useconventional technologies and materials allowing for CST systemsto scale with existing infrastructure; (2) flexibility and modularityto suit the needs of large utility-scale central power facilities inthe 100 s of MW scale (e.g. SEGS in California) or to smaller,distributed power generation systems in 10 s of kW scale (Prabhu,2006; Lior, 1977; Lior and Koai, 1982, 1984a, 1984b; Sherburneand Lior, 1986), and (3) relative simplicity in construction,operation, and maintenance because they are comparable ingeneral with conventional thermal power generation systems.Like other solar energy technologies, they have significant poten-tial for continued cost savings from both economies of scale andtechnological improvements.
To better match the inherently transient availability andquantity of solar radiation, and consequently transient generationof electricity, with the much more steady electricity demand byusers, one of several methods can be used: (1) energy storage,where the solar system is made to have a higher generationcapacity than the average demand, storing the excess generatedenergy and then using it when the generation rate falls below thedemand (to be elaborated further in next paragraph), or (2) creat-ing an auxiliary electricity generation back-up system using, say,fossil fuel, (3) as a minimum, typically not as the optimal solution,just using the solar-generated electricity in the quantitiesinstantly available if the demand exists, and, probably the best,(4) providing ‘‘grid storage’’ by installing an adequate smart grid(cf, Jin et al., 2010a). Such a grid would transmit electricity in thereal-time generated quantity to further regions of China if andwhen needed. The quality and extent of the electricity transmis-sion grid is obviously of general major importance in providingand distributing electricity to this rapidly developing country, butis also of critical importance for increasing the role of solar andwind power that are intermittent by nature and where the gridcan thus provide an effective and economical substitute toelectricity storage. In that context, it can connect the solar- andwind-energy rich Western provinces, that have a relatively lowpower demand, to the southern and eastern regions of Chinawhere the demand is great. Such interconnection, mostly to makeeasier use of northwestern fossil fuel resources, is slowly underway anyway, via the ‘‘Power Transmission from the West to theEast’’ plan that includes the development of new 1000 kV UHVACand 800 kV UHVDC transmission systems (Zhou et al., 2010).
To elaborate on physical energy storage, this could be done bystoring it (1) as the collector-generated heat, using sensible, latent orchemical reaction heat, or (2) as mechanical energy generated by thethermo-mechanical solar power plant, stored in potential energy ofwater pumped up to a dam and then released when needed byallowing it to flow back down through water turbines (pumpedstorage), or as compressed air in large caverns/tanks, retrieved whenenergy is needed by passing the compressed air through air turbines,or (3) as electricity in batteries. At this time, battery storage is toobulky and expensive, and the prevalently used storage method is (1),thermal storage, for which CST is also very synergetic.
While using the CST with a fuel back-up system, hybridsystems such as those described in Palgrave (2008) are moreefficient and economical than parallel ones and has been sug-gested by the World Bank as being less risky for investors. Twoexamples of current hybrid plants: (1) the 150 MW Hassi R’melplant (South of Algiers) with 25 MW of solar CSP parabolic trough
J. Chien, N. Lior / Energy Policy 39 (2011) 7622–7636 7625
Author's personal copy
due to go into operation in 2009; (2) California Central Valley’s100 MW CSP hybrid with a co-fire using agricultural waste andmanure.
In terms of comparative costs, Dersch et al. (2004) show that inmost cases the levelized electricity cost for hybrid systems arelower than solar only systems at the same site and under thesame operating scheme1 constrained by the same economicassumptions.2 The investment on a thermal storage for hybridplants also lowers the LEC by about 10–15%.
With the above described advantages and the high likelihoodof maintaining its economic advantage among solar power gen-eration systems for at least the next couple of decades, we believethat CST is a good utility-scale clean energy power plant optionfor China.
2.2. Comparison of CST systems
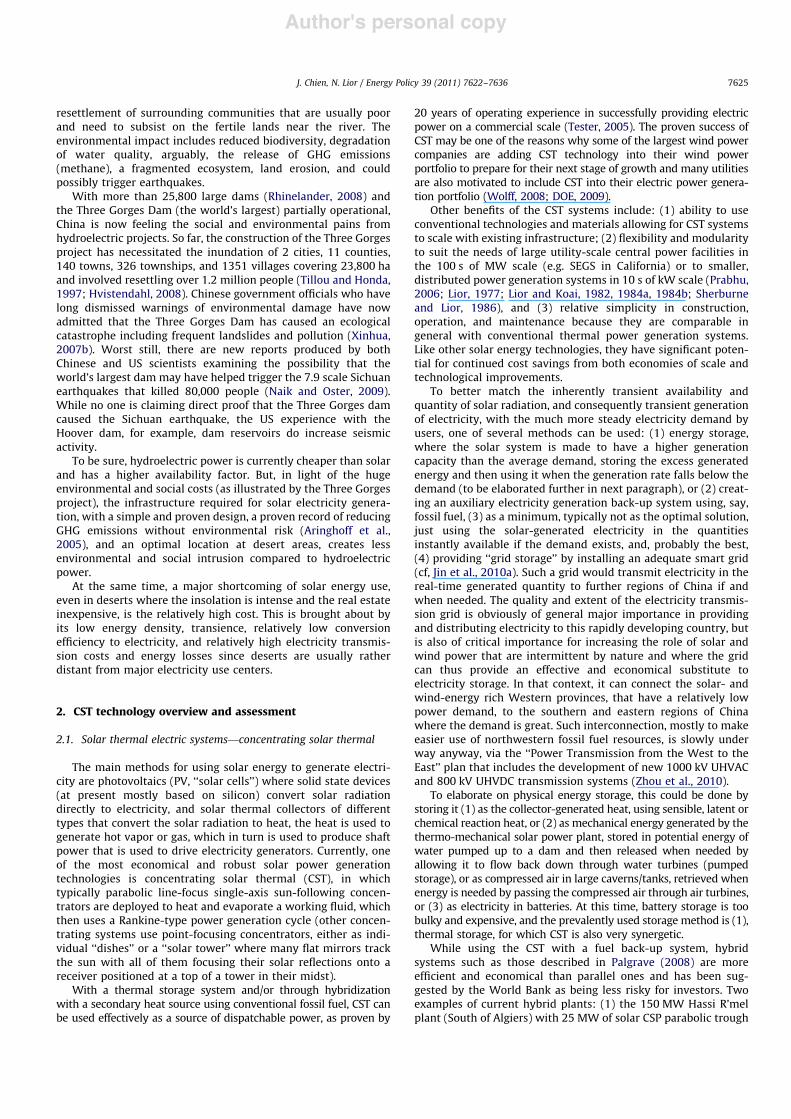
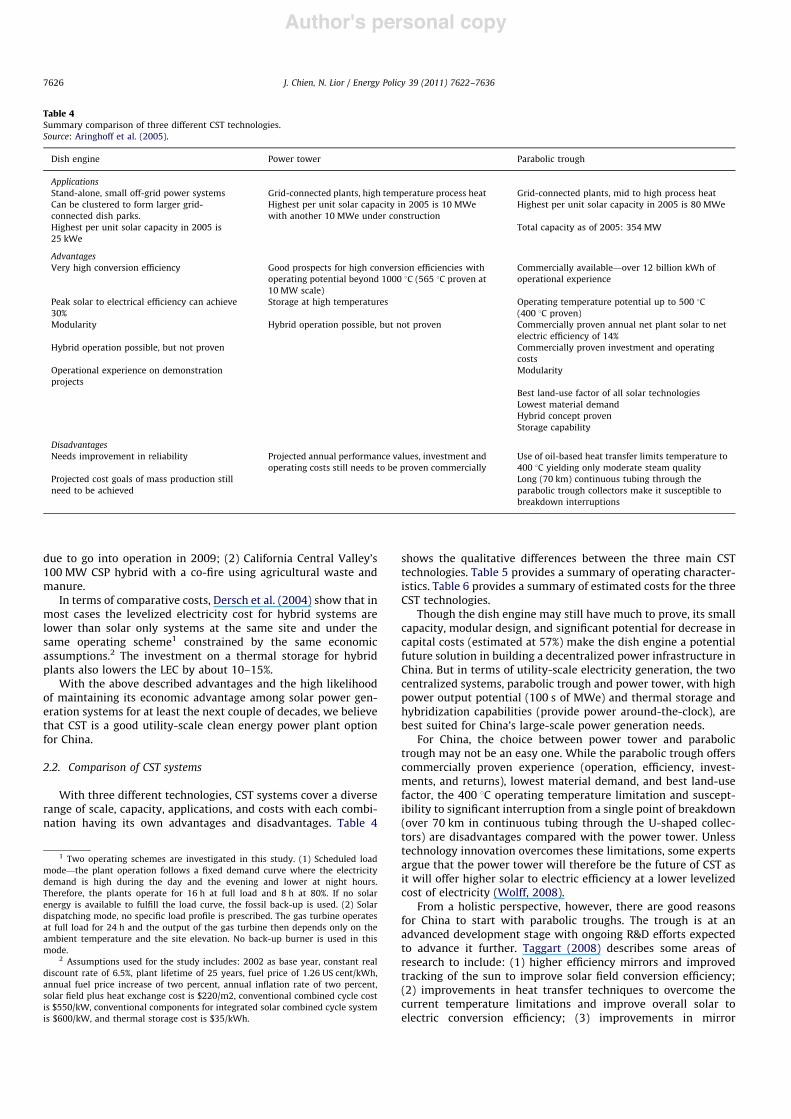
With three different technologies, CST systems cover a diverserange of scale, capacity, applications, and costs with each combi-nation having its own advantages and disadvantages. Table 4
shows the qualitative differences between the three main CSTtechnologies. Table 5 provides a summary of operating character-istics. Table 6 provides a summary of estimated costs for the threeCST technologies.
Though the dish engine may still have much to prove, its smallcapacity, modular design, and significant potential for decrease incapital costs (estimated at 57%) make the dish engine a potentialfuture solution in building a decentralized power infrastructure inChina. But in terms of utility-scale electricity generation, the twocentralized systems, parabolic trough and power tower, with highpower output potential (100 s of MWe) and thermal storage andhybridization capabilities (provide power around-the-clock), arebest suited for China’s large-scale power generation needs.
For China, the choice between power tower and parabolictrough may not be an easy one. While the parabolic trough offerscommercially proven experience (operation, efficiency, invest-ments, and returns), lowest material demand, and best land-usefactor, the 400 1C operating temperature limitation and suscept-ibility to significant interruption from a single point of breakdown(over 70 km in continuous tubing through the U-shaped collec-tors) are disadvantages compared with the power tower. Unlesstechnology innovation overcomes these limitations, some expertsargue that the power tower will therefore be the future of CST asit will offer higher solar to electric efficiency at a lower levelizedcost of electricity (Wolff, 2008).
From a holistic perspective, however, there are good reasonsfor China to start with parabolic troughs. The trough is at anadvanced development stage with ongoing R&D efforts expectedto advance it further. Taggart (2008) describes some areas ofresearch to include: (1) higher efficiency mirrors and improvedtracking of the sun to improve solar field conversion efficiency;(2) improvements in heat transfer techniques to overcome thecurrent temperature limitations and improve overall solar toelectric conversion efficiency; (3) improvements in mirror
Table 4Summary comparison of three different CST technologies.Source: Aringhoff et al. (2005).
Dish engine Power tower Parabolic trough
ApplicationsStand-alone, small off-grid power systems Grid-connected plants, high temperature process heat Grid-connected plants, mid to high process heatCan be clustered to form larger grid-connected dish parks.
Highest per unit solar capacity in 2005 is 10 MWewith another 10 MWe under construction
Highest per unit solar capacity in 2005 is 80 MWe
Highest per unit solar capacity in 2005 is25 kWe
Total capacity as of 2005: 354 MW
AdvantagesVery high conversion efficiency Good prospects for high conversion efficiencies with
operating potential beyond 1000 1C (565 1C proven at10 MW scale)
Commercially available—over 12 billion kWh ofoperational experience
Peak solar to electrical efficiency can achieve30%
Storage at high temperatures Operating temperature potential up to 500 1C(400 1C proven)
Modularity Hybrid operation possible, but not proven Commercially proven annual net plant solar to netelectric efficiency of 14%
Hybrid operation possible, but not proven Commercially proven investment and operatingcosts
Operational experience on demonstrationprojects
Modularity
Best land-use factor of all solar technologiesLowest material demandHybrid concept provenStorage capability
DisadvantagesNeeds improvement in reliability Projected annual performance values, investment and
operating costs still needs to be proven commerciallyUse of oil-based heat transfer limits temperature to400 1C yielding only moderate steam quality
Projected cost goals of mass production stillneed to be achieved
Long (70 km) continuous tubing through theparabolic trough collectors make it susceptible tobreakdown interruptions
1 Two operating schemes are investigated in this study. (1) Scheduled loadmode—the plant operation follows a fixed demand curve where the electricitydemand is high during the day and the evening and lower at night hours.Therefore, the plants operate for 16 h at full load and 8 h at 80%. If no solarenergy is available to fulfill the load curve, the fossil back-up is used. (2) Solardispatching mode, no specific load profile is prescribed. The gas turbine operatesat full load for 24 h and the output of the gas turbine then depends only on theambient temperature and the site elevation. No back-up burner is used in thismode.
2 Assumptions used for the study includes: 2002 as base year, constant realdiscount rate of 6.5%, plant lifetime of 25 years, fuel price of 1.26 US cent/kWh,annual fuel price increase of two percent, annual inflation rate of two percent,solar field plus heat exchange cost is $220/m2, conventional combined cycle costis $550/kW, conventional components for integrated solar combined cycle systemis $600/kW, and thermal storage cost is $35/kWh.
J. Chien, N. Lior / Energy Policy 39 (2011) 7622–76367626
Author's personal copy
cleaning techniques to lower O&M costs; (4) improvements inmanufacturing efficiencies and economies of scale for ramp upproduction to lower overall capital costs; all of which help tomake parabolic troughs even more economically feasible thanthey are today. Furthermore, the parabolic trough has become thepreferred technology for developers and investors in large-scaleCST projects in Europe, United States and Combined Cycle CSTprojects in Algeria, Egypt, India, Iran, Mexico, and Morocco(Aringhoff et al., 2005).
Thus, in line with President Hu Jintao’s scientific concept ofdevelopment, China may wish to start the CST development withthe commercially mature parabolic trough technology to leveragethe knowledge and experience of previous parabolic troughlearning while keeping a close eye on power tower advancesand developments for future CST expansion. It appears that thisapproach would also offer Chinese industry a more viable oppor-tunity to master and advance the state of the art for establishing astrong export capability.
3. Assessment of potential of CST use in China
The potential for CST implementation in China depends onidentifying and analyzing the fit between parameters required of
CST systems and China’s respective characteristics. These para-meters cover the inter-related geographic, grid infrastructure andpower transmission, demand, and economic variables.
3.1. Geographic assessment
The 20 years of commercial operating experience at SEGSpower plants in California pinpoints the key geographic CSTparameters with the most significant impacts on cost. Specifically,the key parameters identified are (1) solar resource; (2) landtopography; (3) land space; (4) land use, and (5) water (Table 7).
3.1.1. Solar resource assessmentDue to the nature of CST technology, only direct normal
insolation (DNI) can be used which limits high-quality CST sitesto areas with low levels of atmospheric moisture and particulates,little or no cloud cover, and high levels of year around DNI,deserts thus being the most typical for these conditions. Further,the required solar field size for CST is directly proportional to thelevel of DI. With the solar field representing about 50% of totalproject cost, the DI level will have the greatest impact on overallCST system cost (Cohen et al., 2005).
Table 5Summary of current CST operating characteristics.Source: Kreith and Goswami (2007).
Operating characteristics of CST technologies
CST technology Concentrationratio (times)
Operatingtemperature
Unit capacityrange
Peakefficiency (%)
Average solar toelectric efficiency (%)
Annual capacityfactor
Status
Dish engine 500–1000 600–1500 1C 5–50 kWe 29 15–30 25% (p) Demonstration and testingat 10 MWe scale
Power tower 10–100 400–600 1C 30–200 MWe 23 12–18 25–70% (p) Prototypes tested at 25 kWeParabolic trough 600–3000 100–400 1C 30–100 Mwe 21 8–12 24% (d) 20 years of operating
experience in Calif
(d)#demonstrated, (p)#projected based on demonstration testing.
Table 6Summary of current cost estimates for different CST technologies.Source: Aabakken (2006) and IEA (2008).
Cost estimates
CST technology Dish engine Power tower Parabolic trough
2005 2010 2020 2005 2010 2020 2005 2010 2020
Levelized electricity costs (USD/kWh) 0.15 0.10 0.06 0.06–0.11 0.06–0.07 0.40 0.10 0.05–0.08 0.07Capital cost (USD/W) 5.0 3.2 1.2 2.8–4.1 2.1–3.5 1.1–2.5 2.6–3.6 2.2–0.9 1.4O&M costs (USD cents/kWh) 4.0 1.5 0.9 1.0–1.2 0.4–1.0 0.30 1.0 0.5–0.7 0.4Surface costs (USD/m2) 3000 1500 320 475 265 200 630 315 275Uncertainty Moderate Moderate Low
Table 7Summary of key siting factors.Source: Cohen et al. (2005).
Siting factors Requirements
Solar resource 41800 kWh/m2/yr or 5 kWh/m2/day for economical operationLand topography 0–3% grade as potential. Less than 1% grade most economicalLand space 5 acres or 20 km2/MWeLand use Low biodiversity. Limited productive use.Grid availability and capacity Close by. Transmission lines costs $50 K–$180 K per mile for 100 MW capacityWater availability Water required for steam turbine. Dry cooling is an option with 10% increase in costFossil fuel availability Needed for hybridization, but not considered criticalTransportation infrastructure Proximity to roads and railways necessary for access and construction
J. Chien, N. Lior / Energy Policy 39 (2011) 7622–7636 7627
Author's personal copy
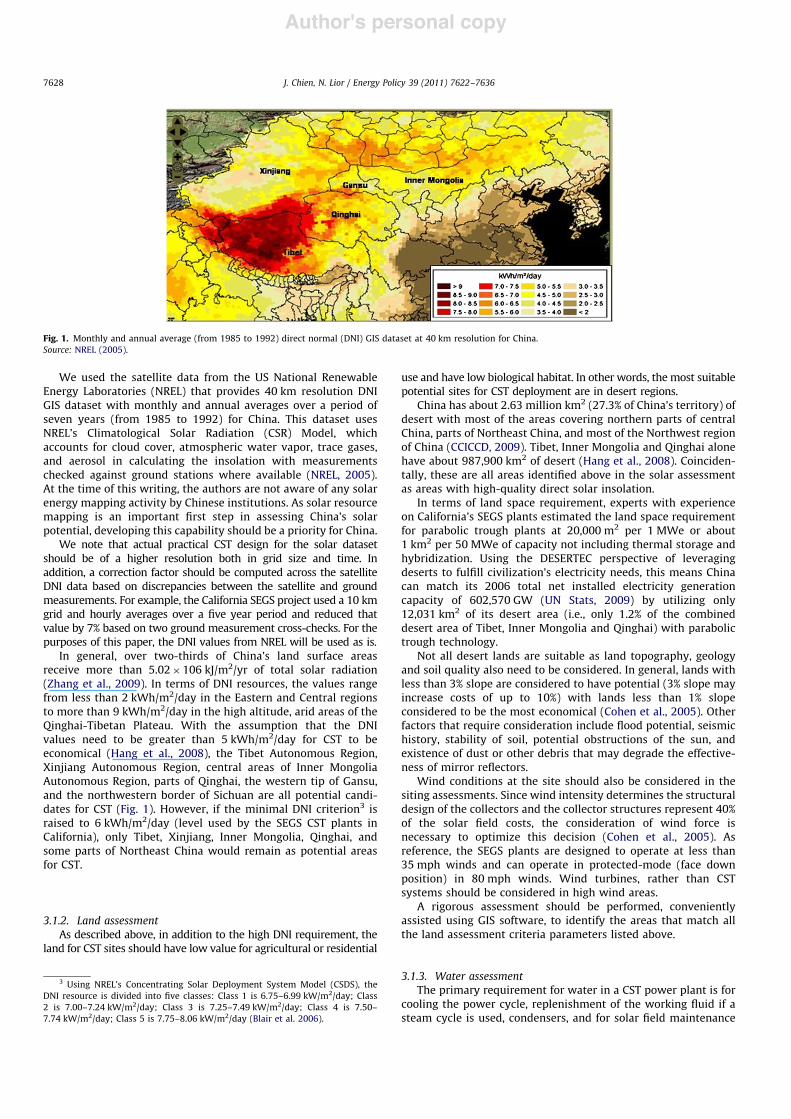
We used the satellite data from the US National RenewableEnergy Laboratories (NREL) that provides 40 km resolution DNIGIS dataset with monthly and annual averages over a period ofseven years (from 1985 to 1992) for China. This dataset usesNREL’s Climatological Solar Radiation (CSR) Model, whichaccounts for cloud cover, atmospheric water vapor, trace gases,and aerosol in calculating the insolation with measurementschecked against ground stations where available (NREL, 2005).At the time of this writing, the authors are not aware of any solarenergy mapping activity by Chinese institutions. As solar resourcemapping is an important first step in assessing China’s solarpotential, developing this capability should be a priority for China.
We note that actual practical CST design for the solar datasetshould be of a higher resolution both in grid size and time. Inaddition, a correction factor should be computed across the satelliteDNI data based on discrepancies between the satellite and groundmeasurements. For example, the California SEGS project used a 10 kmgrid and hourly averages over a five year period and reduced thatvalue by 7% based on two ground measurement cross-checks. For thepurposes of this paper, the DNI values from NREL will be used as is.
In general, over two-thirds of China’s land surface areasreceive more than 5.02"106 kJ/m2/yr of total solar radiation(Zhang et al., 2009). In terms of DNI resources, the values rangefrom less than 2 kWh/m2/day in the Eastern and Central regionsto more than 9 kWh/m2/day in the high altitude, arid areas of theQinghai-Tibetan Plateau. With the assumption that the DNIvalues need to be greater than 5 kWh/m2/day for CST to beeconomical (Hang et al., 2008), the Tibet Autonomous Region,Xinjiang Autonomous Region, central areas of Inner MongoliaAutonomous Region, parts of Qinghai, the western tip of Gansu,and the northwestern border of Sichuan are all potential candi-dates for CST (Fig. 1). However, if the minimal DNI criterion3 israised to 6 kWh/m2/day (level used by the SEGS CST plants inCalifornia), only Tibet, Xinjiang, Inner Mongolia, Qinghai, andsome parts of Northeast China would remain as potential areasfor CST.
3.1.2. Land assessmentAs described above, in addition to the high DNI requirement, the
land for CST sites should have low value for agricultural or residential
use and have low biological habitat. In other words, the most suitablepotential sites for CST deployment are in desert regions.
China has about 2.63 million km2 (27.3% of China’s territory) ofdesert with most of the areas covering northern parts of centralChina, parts of Northeast China, and most of the Northwest regionof China (CCICCD, 2009). Tibet, Inner Mongolia and Qinghai alonehave about 987,900 km2 of desert (Hang et al., 2008). Coinciden-tally, these are all areas identified above in the solar assessmentas areas with high-quality direct solar insolation.
In terms of land space requirement, experts with experienceon California’s SEGS plants estimated the land space requirementfor parabolic trough plants at 20,000 m2 per 1 MWe or about1 km2 per 50 MWe of capacity not including thermal storage andhybridization. Using the DESERTEC perspective of leveragingdeserts to fulfill civilization’s electricity needs, this means Chinacan match its 2006 total net installed electricity generationcapacity of 602,570 GW (UN Stats, 2009) by utilizing only12,031 km2 of its desert area (i.e., only 1.2% of the combineddesert area of Tibet, Inner Mongolia and Qinghai) with parabolictrough technology.
Not all desert lands are suitable as land topography, geologyand soil quality also need to be considered. In general, lands withless than 3% slope are considered to have potential (3% slope mayincrease costs of up to 10%) with lands less than 1% slopeconsidered to be the most economical (Cohen et al., 2005). Otherfactors that require consideration include flood potential, seismichistory, stability of soil, potential obstructions of the sun, andexistence of dust or other debris that may degrade the effective-ness of mirror reflectors.
Wind conditions at the site should also be considered in thesiting assessments. Since wind intensity determines the structuraldesign of the collectors and the collector structures represent 40%of the solar field costs, the consideration of wind force isnecessary to optimize this decision (Cohen et al., 2005). Asreference, the SEGS plants are designed to operate at less than35 mph winds and can operate in protected-mode (face downposition) in 80 mph winds. Wind turbines, rather than CSTsystems should be considered in high wind areas.
A rigorous assessment should be performed, convenientlyassisted using GIS software, to identify the areas that match allthe land assessment criteria parameters listed above.
3.1.3. Water assessmentThe primary requirement for water in a CST power plant is for
cooling the power cycle, replenishment of the working fluid if asteam cycle is used, condensers, and for solar field maintenance
Fig. 1. Monthly and annual average (from 1985 to 1992) direct normal (DNI) GIS dataset at 40 km resolution for China.Source: NREL (2005).
3 Using NREL’s Concentrating Solar Deployment System Model (CSDS), theDNI resource is divided into five classes: Class 1 is 6.75–6.99 kW/m2/day; Class2 is 7.00–7.24 kW/m2/day; Class 3 is 7.25–7.49 kW/m2/day; Class 4 is 7.50–7.74 kW/m2/day; Class 5 is 7.75–8.06 kW/m2/day (Blair et al. 2006).
J. Chien, N. Lior / Energy Policy 39 (2011) 7622–76367628
Author's personal copy
(primarily for washing the mirrors). For current-use CST systems,the water requirement ranges between 3 and 3.5 m3/kWh (Jones,2008) with 95% of the water usage attributed to the cooling towerand the remaining 5% of water consumption committed to mirrorcleaning and to steam cycle working fluid. High quality CST siteswith high levels of DNI are, however, usually limited to arid andsemi-arid deserts where water does not come easily or cheaply.As water-based cooling (cooling via evaporation) is technicallyconsidered the most efficient cooling technology available (Al-Soud and Hrayshat, 2009), the cost effectiveness of a CST systemwith water cooling becomes dependent on the cost of bringingwater to the site and more importantly the cost of wasting aprecious resource.
The best scenario, then, is for the CST site to be located close toan available and inexpensive water source. For example, two ofthe SEGS Mojave Desert parabolic trough sites use undergroundwater, and one uses aqueduct water. If no water resources areavailable or economically feasible, dry cooling can also be
considered with a cost and efficiency penalty. Table 8 shows thatdry cooling technology equipment currently costs about 3.3 timesmore than water cooling equipment and also increases parasiticpower consumption (from fans) and lowers the overall efficiencyof the steam cycle, resulting in an overall increase in electricitycost by 10% or more. This gives strong motivation to theimprovement and cost reduction of dry cooling technology, whichis indeed expected.
If the desert region considered has saline or otherwise un-potable water (as some deserts have, underground or in lakes)there is a good synergy in building a hybrid dual-purpose plantthat uses solar energy to produce both electric power and freshwater by a water desalination process. Here, the desalting portionof the plant can use the low temperature reject heat of the electricpower plant and thus increase the system’s overall economicviability significantly and also provide some of the water neededfor the plant’s operation.
Thus a careful assessment of water and fossil fuel (for hybridsolar power generation systems) availability and cost assessmentsare important parts of the site section and system design process.
3.2. Transmission and power grid assessment
Access to appropriate electric power transmission lines isanother crucial factor for site selection. As transmission line coststo connect into the grid are high, the proximity of CST systems toa transmission power grid is an important factor in the overallcalculation. Experts estimate that transmission line costs in theUnited States can range from $50,000 to $180,000 per mile for a
Table 8Comparison of dry and wet cooling in terms of costs and efficiency.Source: Al-Soud and Hrayshat (2009).
Cooling Wet Dry
Steam cycle efficiency 37% 35%Parasitic electricity consumption 5 MW 7 MWEnergy yield 117 GWh 109 GWhEvaporated water 180 M3/MW –Investment (cooling component only) 4.09 M USD 13.54M USD
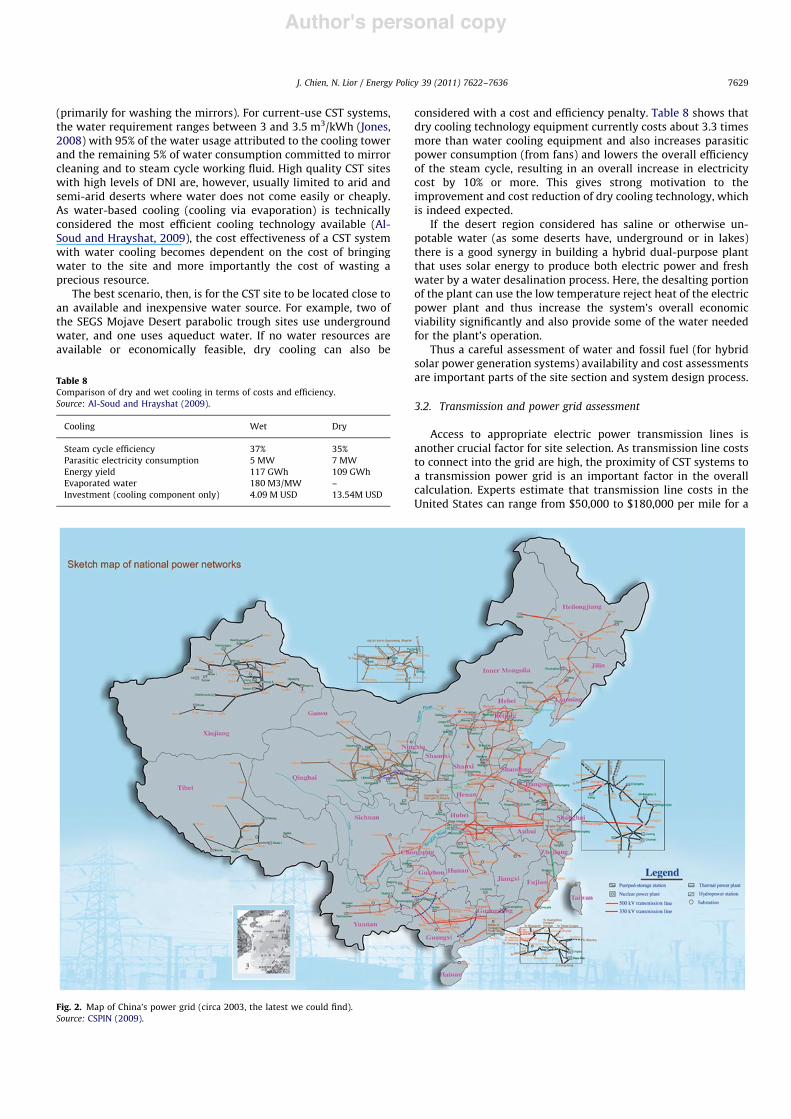
Fig. 2. Map of China’s power grid (circa 2003, the latest we could find).Source: CSPIN (2009).
J. Chien, N. Lior / Energy Policy 39 (2011) 7622–7636 7629
Author's personal copy
100 MW capacity line depending on voltage level and length ofrequired transmission line (Cohen et al., 2005). In China, a surveyof recently approved grid construction projects suggests a 500 kV,250,000 kVA transmission line costs about $350,000 per mile anda similar line with 750,000 kVA costs around $800,000 per mile(State Grid, 2009). Of course, in addition to line voltage, capacity,and length, line costs will vary depending on the need forsubstations, transformers, and the difficulty of the terrain. Thus,close proximity to a power grid is critically important to theviability of the CST system.
China’s interconnected power grid network consists of differ-ent types of power generation stations (hydro, nuclear, thermal),power substations, and transmission lines mainly of the 330 kVand 500 kV variety. Currently, there are seven inter-provincialpower grids (East China, Northeast, Central China, North China,Northwest, Sichuan-Chongqing, and South China) and four inde-pendent provincial power networks (Shandong, Fujian, Xinjiang,and Tibet) operating in mainland China. As of 2003, the Shandongpower grid has joined the North China power grid, but has not yetinterconnected; the Xinjiang power grid has joined the Northwestpower grid, but has not yet interconnected; Tibet remainsunconnected to the rest of China’s power grid (CSPIN, 2009).Overall, China’s power grid now extends to all cities and mostvillages throughout China but interconnection between grids arenot complete, especially in the Western regions (Fig. 2).
Without interconnection to the rest of China, Xinjiang andTibet are their own isolated ‘‘islands’’. Unfortunately, these two‘‘island’’ regions are also the regions with the most potential (interms of DNI and land slope and use) for CST system implementa-tion. Since even CST electricity generation for local consumptionin the sunny regions lacks an adequate grid, if the vision for CSTsystems to generate electricity in the West and export excesselectricity to the East is to be realized, the interconnectionbetween Xinjiang, Tibet and the rest of the country is a mandatoryprerequisite.
Driven by China’s current five year plan, China’s grid isconstantly updated with newer technology, higher capacity, andincreases in new interconnections. As an example of new tech-nology and higher capacity, China, in 2007, awarded Siemens a300 million euro contract to construct the world’s first high-voltage DC transmission (HVDC) system of an 800 kV and5000 MW capacity between Yunnan and Guangdong – a distancethat traverses 1400 km (870 miles) of challenging terrain – to beoperational by mid-2010 (T&D, 2007). The purpose of this line isto bring the abundant hydroelectric power from Yunnan to thepower hungry mega cities of Guangzhou and Shenzhen. Chinaalso connected its Hainan Island to the national power grid inMarch 2009 with a 32 km long seabed power transmission cable(500 kV, 600 MW of initial capacity to be doubled when theproject is complete) at a cost of 2.5 billion RMB (368 millionUSD). A recent description of China’s grid and of plans for itsdevelopment was made by Zhou et al. (2010), pointing that itsstructure is relatively weak as a whole, with many potentialsecurity issues, and that it has a low transmission capability of thesingle circuit.
China’s ongoing drive to modernize its power grid will clearlywork in CST’s favor. Based on the current five year plan, Xinjiangis expected to complete its 500 kV interconnection into theNorthwest power grid by 2011 effectively connecting Xinjiangto the rest of China (Xinjiang, 2006). Tibet, another top rankedregion in terms of DNI resources, is expected to be connected tothe national grid by 2011. The Qinghai-Tibet power line willtraverse 1100 km of diverse terrain from Goldmud, Qinghaiheading westward to Lhasa, Tibet, mostly following the routealready established by the Qinghai-Tibet railway line and will bethe world’s first transmission line at plateau altitude of 5000 m
above sea level (China Power Web, 2008). This project, whichstarted in 2009 and is expected to be complete in 2011, willconsist of 500 kV of direct current transmission lines with aninitial capacity of 750 MW (1500 MW when fully complete) at acost of over 6 billion RMB ($857M USD) (CPNN, 2009). Notably,the purpose of this interconnection is to allow the Northwesternprovinces to provide electricity to Tibet during winter and springseason shortages, to meet the demand for the development oflocal economies, and to allow for surplus electricity to be soldback into the national grid.
In sum, while the most optimal regions for CST may notcurrently be connected to the national grid, the drive to moder-nize China’s electricity grid through their five year plan (whichincludes opening up the power transmission sector to foreigninvestments (WSJ, 2007)) will result in a modern, high capacity,nationally integrated power grid network connecting the powerhungry mega cities in the East to the renewable energy richregions of the West by 2011. As seen from China’s manytransmission line projects, the main reason for the interconnec-tions is to optimize electricity allocation—selling surplus electri-city from one region to other regions of high power demand. Thistrend is in line with the vision of this paper and gives addedevidence that the time for CST in China is now.
4. Economic assessment
4.1. Comparison of generated electricity costs with other generationmethods, considering both nominal and true (including externalitiescost)
Costs of power generation include only the costs incurred bythe utility, which typically do not (yet) include the costs of all theexternalities, such as those of environmental, health, and socialeffects. We term these costs as the ‘‘nominal costs’’. The mostcommonly used nominal cost is the Levelized Electricity Costs(LEC) and to get an idea of how CST compares ‘‘nominally’’ withother electricity generating technologies (both conventional andrenewable), Sovacool (2008) presents the average nominal LEC foreach technology (Table 9). Sovacool referenced Karmis (2005) forbiomass, nuclear, onshore wind, IGCC, scrubbed goal, advanced
Table 9Nominal 2007 levelized electricity costs.Source: Sovacool (2008) and Badr et al. (2003).
Rank Electricity generationtechnology
Nominal LEC,$2007 (b/kWh)
!more/-lessexpensive CST isto the othertechnologies (%)
1 Biomass (landfill gas) 4.1 2302 Advanced nuclear 4.9 1763 Onshore wind 5.6 1414 Hydroelectric 6.0 1245 Geothermal 6.4 1116 Integrated gasification
combined-cycle (CC)6.7 102
7 Biomass (combustion) 6.9 968 Scrubbed coal 7.2 889 Advanced gas and oil
combined-cycle8.2 65
10 Gas oil combined-cycle 8.5 5911 Adv gas and oil cc with
carbon capture12.8 6
12 Solar CST (parabolic trough) 13.5 013 Advanced combustion
turbine32.5 $58
14 Combustion turbine 35.6 $6215 Solar photovoltaic (panel) 39.0 –65
J. Chien, N. Lior / Energy Policy 39 (2011) 7622–76367630
Author's personal copy
gas and oil combined-cycle, gas and oil combined-cycle, IGCCwith carbon capture, advanced gas and oil combined-cycle withcarbon capture, advanced combustion turbine, combustion tur-bine, and solar PV data.
These estimates assume a 25-year system life; All federal taxincentives and credits as of 2007; accelerated depreciation withhalf-year convention (MACRS); a discount rate of 7.0%; currentcosts and capacity factors (no cost and performance improvementsover time); inflation rate of 2.5% per year; fixed and variableoperations and maintenance costs escalated at the inflation rate;capital costs associated with the connection of centralized systemsto the electricity grid are not included; fixed and variable costsassociated with electricity distribution and transmission are notincluded. Detailed assumptions can be found in Karmis (2005).
For geothermal energy, hydro power, and solar thermal tech-nology Sovacool’s reference ultimately points to California EnergyCommission’s Final Staff Report on the comparative costs ofCalifornia’s electricity generation technologies. The main assump-tions used by this report include 30 year system life, loan term of12 years, inflation of 2%, Federal depreciation using MACRS5 years, State depreciation using full system life, with investmenttax credit, debt-equity ratio of 2.02, and a discount rate (weightedaverage cost of capital) of 10.8%. Capital costs associated with theconnection of centralized systems to the electricity grid and fixedand variable costs associated with electricity distribution andtransmission are not included. Detailed assumptions can be foundat Badr et al. (2003).
While the paper uses the data of Sovacool (2008) and of Badret al. (2003) LEC as reference, we note that LEC will varydepending on the assumptions used for each electricity genera-tion technology. Thus, to be truly comparable, the different typesof electricity generation technology should have a common basisof assumptions. In the absence of better information, their datawas used nevertheless.
Based on this ranking, CST (parabolic trough) is ranked at 12thplace at 13.5 cents/kWh electricity. Compared to renewablessources with major focus in China’s plan, CST-generated electri-city is thus estimated here to be 124% more expensive thanhydroelectric, 141% more expensive than onshore wind, and 230%more expensive than biomass. Compared to non-renewablesources with a significant potential influence in China, CST is176% more expensive than nuclear. Compared to China’s domi-nant technology of electricity generation, CST is about 194% moreexpensive than coal-fired power plants located in Xinjiang (notlisted in table) which have a cost of electricity of 4.6 cents/kWh(Fan et al., 2005).4 Thus, based on the LEC ranking alone, theeconomics of CST would seem to have stiff competition in China,as they typically do in most of the world.
Nominal LEC does not, however, represent the true cost ofproducing electricity. All externalities should be included forsustainable development, and it has been proven time after timethat avoiding to include them from the start typically ends up inmuch higher prices and negative consequences later. Such con-sequences often stymie further development and certainly thwartthe governments’ and people’s goals for sustainable development.The environmental externalities can include various gaseous,including greenhouse gas, emissions, liquid, and solid waste someof which are toxic, and water and soil impairment. The socialexternalities include displacement of people (e.g. Three Gorgesdam), and effects on health, employment, education, and neteconomic income. Because the pricing of externalities can resultin a wide range of values depending on the assumptions used, it isuseful to look at Sundqvist (2004) on the disparity of externalityestimates to (1) understand some causes of these disparities and(2) get a better feel for the range of the data. Applying statisticalanalysis to 38 studies and 132 estimates of electricity external-ities, Sundqvist’s results indicate that the methodology used (e.g.abatement cost approach, damage cost approach top-down,damage cost approach bottom-up) and the fuel stages used (i.e.whether the individual studies have addressed the full fuel cycleor not) have statistical significance (at the 1% level) with thedisparity of externality estimates. Specifically, the results showthat the bottom-up approach produces the lowest external costestimates compared to abatement and top-down and studiesusing the full fuel cycle produce higher estimates than studiesusing just generation (Table 10). While Sundqvist is the first toadmit that his analysis is not sufficient to explain all thevariability in externality estimates, his study provides goodinsight into some of the explanatory variables in the disparity.
With the large standard deviations, it is hard to pinpoint withcertainty the best externality estimate to use. However, takingSundqvist data at the aggregated level and using the Min and Maxto define the range, it may be reasonable to assume that thecorrect externality estimate lies somewhere in between. For thepurpose of comparison, Sovacool (2008) study used the meanvalue (averaged across studies) of the externality cost for eachtechnology and added them to the nominal LEC to obtain what hecalled the true LEC (Table 11).
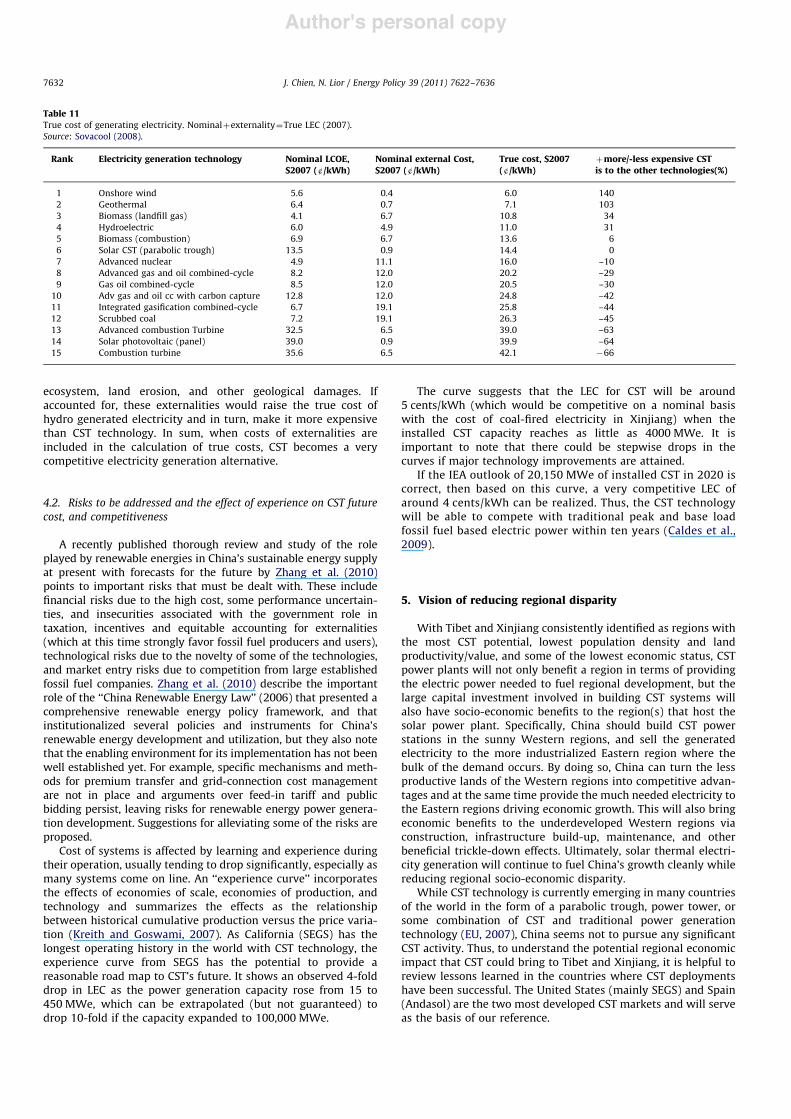
Based on this calculation and ranked by true LEC, CST movesup six places to number 6 with LEC of 14.4 cents/kWh. Comparedto renewable sources with major focus in China’s plan, CST is nowonly 31% more expensive than hydroelectric, 140% more expen-sive than onshore wind (about the same as nominal), and now34% more expensive than biomass. Compared to the non-renew-able sources with a significant influence in China, CST is now 10%cheaper than nuclear. Compared to scrubbed coal, a cleanerversion of China’s dominant coal-fired electricity, CST is 45%cheaper. Notably, hydro electricity externalities in the above tablemost likely did not include the social disturbance of large scaleresettlement and environmental damages such as reduced biodi-versity, degradation of water quality, fragmentation of the
Table 10Descriptive statistics of electricity externality studies in 1998 US$.Source: Sundqvist (2004).
US cents/kWh Coal Oil Gas Nuclear Hydro Wind Solar Biomass
Min 0.0600 0.0300 0.0030 0.0003 0.0200 0.0000 0.0000 0.0000Max 72.42 39.93 13.22 64.45 26.26 0.80 1.69 22.09
Mean 14.87 13.57 5.02 8.63 3.84 0.29 0.69 5.20SD 16.89 12.51 4.73 18.62 8.40 0.20 0.57 6.11
N 29 15 24 16 11 14 7 16
SD#standard deviation; N#sample size.
4 Cost of grid-connected coal-fired electricity for Xinjiang, Inner Mongolia,Liaoning, and Guangdong are 4.6, 5.0, 6.4, 8.6 cents USD/kWh, respectively, basedon 1USD–7RMB.
J. Chien, N. Lior / Energy Policy 39 (2011) 7622–7636 7631
Author's personal copy
ecosystem, land erosion, and other geological damages. Ifaccounted for, these externalities would raise the true cost ofhydro generated electricity and in turn, make it more expensivethan CST technology. In sum, when costs of externalities areincluded in the calculation of true costs, CST becomes a verycompetitive electricity generation alternative.
4.2. Risks to be addressed and the effect of experience on CST futurecost, and competitiveness
A recently published thorough review and study of the roleplayed by renewable energies in China’s sustainable energy supplyat present with forecasts for the future by Zhang et al. (2010)points to important risks that must be dealt with. These includefinancial risks due to the high cost, some performance uncertain-ties, and insecurities associated with the government role intaxation, incentives and equitable accounting for externalities(which at this time strongly favor fossil fuel producers and users),technological risks due to the novelty of some of the technologies,and market entry risks due to competition from large establishedfossil fuel companies. Zhang et al. (2010) describe the importantrole of the ‘‘China Renewable Energy Law’’ (2006) that presented acomprehensive renewable energy policy framework, and thatinstitutionalized several policies and instruments for China’srenewable energy development and utilization, but they also notethat the enabling environment for its implementation has not beenwell established yet. For example, specific mechanisms and meth-ods for premium transfer and grid-connection cost managementare not in place and arguments over feed-in tariff and publicbidding persist, leaving risks for renewable energy power genera-tion development. Suggestions for alleviating some of the risks areproposed.
Cost of systems is affected by learning and experience duringtheir operation, usually tending to drop significantly, especially asmany systems come on line. An ‘‘experience curve’’ incorporatesthe effects of economies of scale, economies of production, andtechnology and summarizes the effects as the relationshipbetween historical cumulative production versus the price varia-tion (Kreith and Goswami, 2007). As California (SEGS) has thelongest operating history in the world with CST technology, theexperience curve from SEGS has the potential to provide areasonable road map to CST’s future. It shows an observed 4-folddrop in LEC as the power generation capacity rose from 15 to450 MWe, which can be extrapolated (but not guaranteed) todrop 10-fold if the capacity expanded to 100,000 MWe.
The curve suggests that the LEC for CST will be around5 cents/kWh (which would be competitive on a nominal basiswith the cost of coal-fired electricity in Xinjiang) when theinstalled CST capacity reaches as little as 4000 MWe. It isimportant to note that there could be stepwise drops in thecurves if major technology improvements are attained.
If the IEA outlook of 20,150 MWe of installed CST in 2020 iscorrect, then based on this curve, a very competitive LEC ofaround 4 cents/kWh can be realized. Thus, the CST technologywill be able to compete with traditional peak and base loadfossil fuel based electric power within ten years (Caldes et al.,2009).
5. Vision of reducing regional disparity
With Tibet and Xinjiang consistently identified as regions withthe most CST potential, lowest population density and landproductivity/value, and some of the lowest economic status, CSTpower plants will not only benefit a region in terms of providingthe electric power needed to fuel regional development, but thelarge capital investment involved in building CST systems willalso have socio-economic benefits to the region(s) that host thesolar power plant. Specifically, China should build CST powerstations in the sunny Western regions, and sell the generatedelectricity to the more industrialized Eastern region where thebulk of the demand occurs. By doing so, China can turn the lessproductive lands of the Western regions into competitive advan-tages and at the same time provide the much needed electricity tothe Eastern regions driving economic growth. This will also bringeconomic benefits to the underdeveloped Western regions viaconstruction, infrastructure build-up, maintenance, and otherbeneficial trickle-down effects. Ultimately, solar thermal electri-city generation will continue to fuel China’s growth cleanly whilereducing regional socio-economic disparity.
While CST technology is currently emerging in many countriesof the world in the form of a parabolic trough, power tower, orsome combination of CST and traditional power generationtechnology (EU, 2007), China seems not to pursue any significantCST activity. Thus, to understand the potential regional economicimpact that CST could bring to Tibet and Xinjiang, it is helpful toreview lessons learned in the countries where CST deploymentshave been successful. The United States (mainly SEGS) and Spain(Andasol) are the two most developed CST markets and will serveas the basis of our reference.
Table 11True cost of generating electricity. Nominal!externality#True LEC (2007).Source: Sovacool (2008).
Rank Electricity generation technology Nominal LCOE,$2007 (b/kWh)
Nominal external Cost,$2007 (b/kWh)
True cost, $2007(b/kWh)
!more/-less expensive CSTis to the other technologies(%)
1 Onshore wind 5.6 0.4 6.0 1402 Geothermal 6.4 0.7 7.1 1033 Biomass (landfill gas) 4.1 6.7 10.8 344 Hydroelectric 6.0 4.9 11.0 315 Biomass (combustion) 6.9 6.7 13.6 66 Solar CST (parabolic trough) 13.5 0.9 14.4 07 Advanced nuclear 4.9 11.1 16.0 –108 Advanced gas and oil combined-cycle 8.2 12.0 20.2 –299 Gas oil combined-cycle 8.5 12.0 20.5 –30
10 Adv gas and oil cc with carbon capture 12.8 12.0 24.8 –4211 Integrated gasification combined-cycle 6.7 19.1 25.8 –4412 Scrubbed coal 7.2 19.1 26.3 –4513 Advanced combustion Turbine 32.5 6.5 39.0 –6314 Solar photovoltaic (panel) 39.0 0.9 39.9 –6415 Combustion turbine 35.6 6.5 42.1 $66
J. Chien, N. Lior / Energy Policy 39 (2011) 7622–76367632
Author's personal copy
In general, the overall economic impact can be categorizedinto direct effects, indirect effects, and induced effects. Directeffects are money directly spent by the project in the host regionon labor, materials, and equipments (i.e. the total project price).Indirect effects are impact of money spent by the project thatstimulates secondary economic activities within the host regionand creates new flows of purchase and sale from other sectors ofthe economy. In other words, one dollar spent by the project inthe region is re-spent in the region in other sectors of theeconomy—also called the multiplier effect of each dollar; andinduced effects are related to the expansion of private expendi-ture the consequent change in consumption pattern of goods andservices (e.g. food, transportation, health, services, etc.) fromworkers in the project.
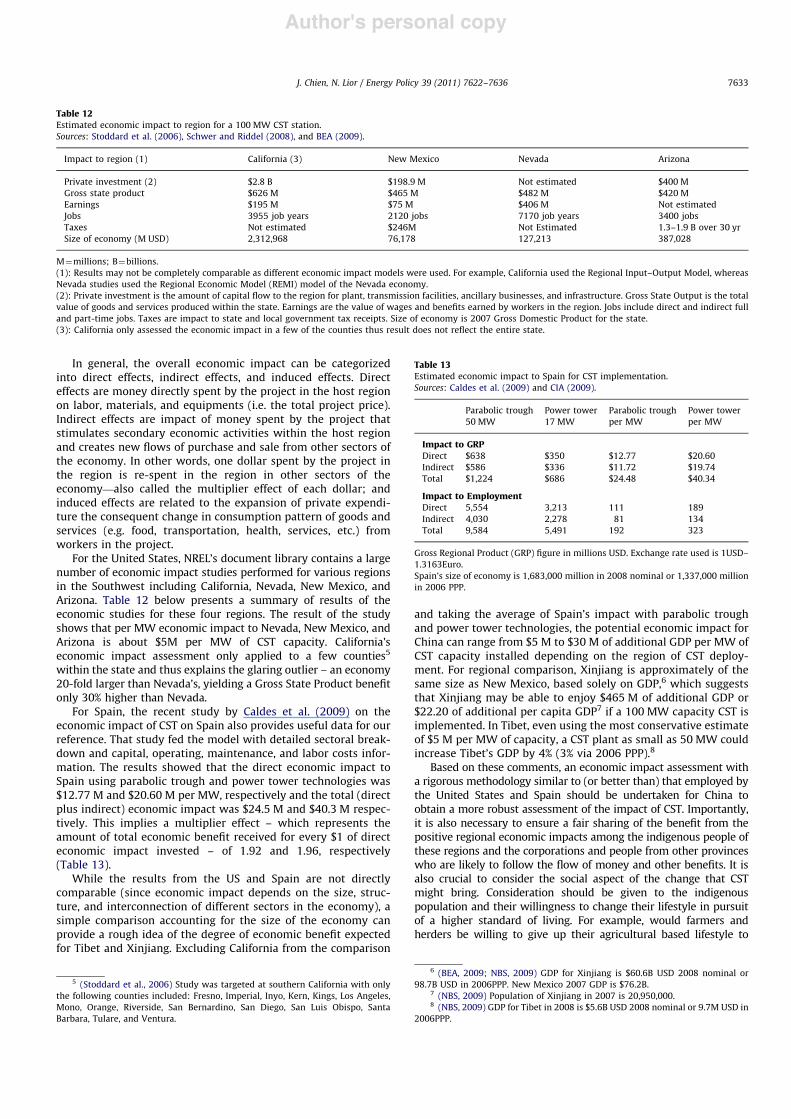
For the United States, NREL’s document library contains a largenumber of economic impact studies performed for various regionsin the Southwest including California, Nevada, New Mexico, andArizona. Table 12 below presents a summary of results of theeconomic studies for these four regions. The result of the studyshows that per MW economic impact to Nevada, New Mexico, andArizona is about $5M per MW of CST capacity. California’seconomic impact assessment only applied to a few counties5
within the state and thus explains the glaring outlier – an economy20-fold larger than Nevada’s, yielding a Gross State Product benefitonly 30% higher than Nevada.
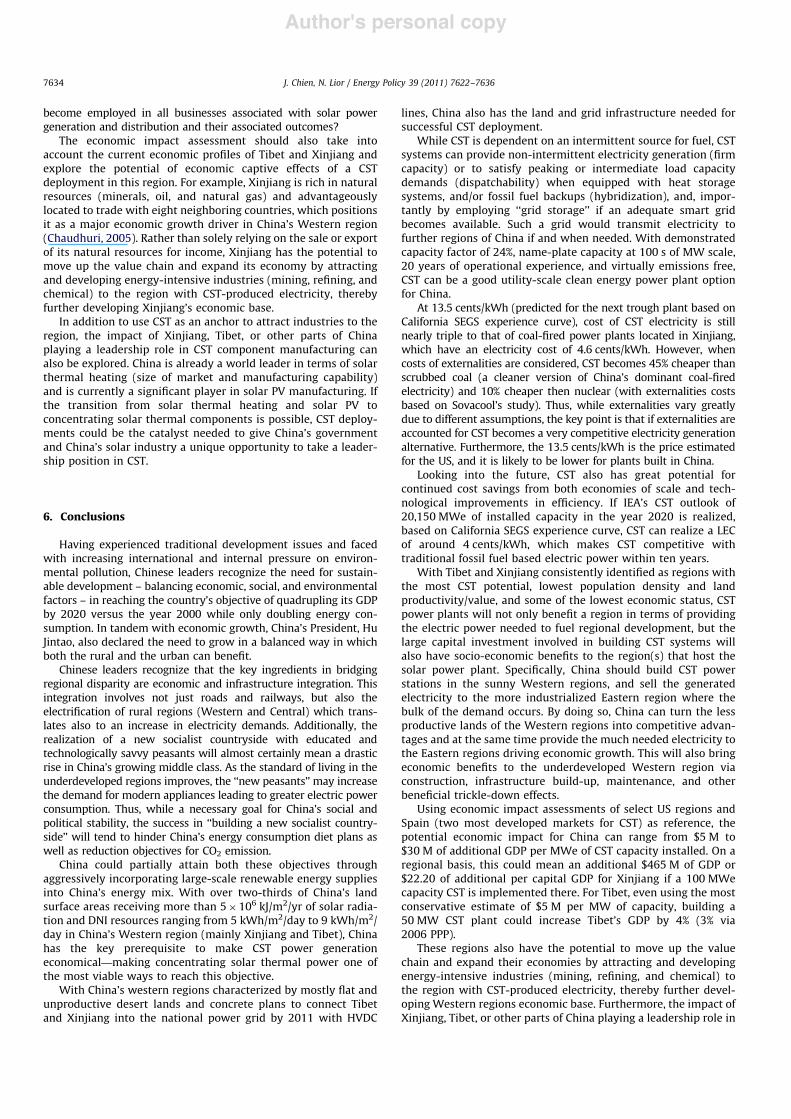
For Spain, the recent study by Caldes et al. (2009) on theeconomic impact of CST on Spain also provides useful data for ourreference. That study fed the model with detailed sectoral break-down and capital, operating, maintenance, and labor costs infor-mation. The results showed that the direct economic impact toSpain using parabolic trough and power tower technologies was$12.77 M and $20.60 M per MW, respectively and the total (directplus indirect) economic impact was $24.5 M and $40.3 M respec-tively. This implies a multiplier effect – which represents theamount of total economic benefit received for every $1 of directeconomic impact invested – of 1.92 and 1.96, respectively(Table 13).
While the results from the US and Spain are not directlycomparable (since economic impact depends on the size, struc-ture, and interconnection of different sectors in the economy), asimple comparison accounting for the size of the economy canprovide a rough idea of the degree of economic benefit expectedfor Tibet and Xinjiang. Excluding California from the comparison
and taking the average of Spain’s impact with parabolic troughand power tower technologies, the potential economic impact forChina can range from $5 M to $30 M of additional GDP per MW ofCST capacity installed depending on the region of CST deploy-ment. For regional comparison, Xinjiang is approximately of thesame size as New Mexico, based solely on GDP,6 which suggeststhat Xinjiang may be able to enjoy $465 M of additional GDP or$22.20 of additional per capita GDP7 if a 100 MW capacity CST isimplemented. In Tibet, even using the most conservative estimateof $5 M per MW of capacity, a CST plant as small as 50 MW couldincrease Tibet’s GDP by 4% (3% via 2006 PPP).8
Based on these comments, an economic impact assessment witha rigorous methodology similar to (or better than) that employed bythe United States and Spain should be undertaken for China toobtain a more robust assessment of the impact of CST. Importantly,it is also necessary to ensure a fair sharing of the benefit from thepositive regional economic impacts among the indigenous people ofthese regions and the corporations and people from other provinceswho are likely to follow the flow of money and other benefits. It isalso crucial to consider the social aspect of the change that CSTmight bring. Consideration should be given to the indigenouspopulation and their willingness to change their lifestyle in pursuitof a higher standard of living. For example, would farmers andherders be willing to give up their agricultural based lifestyle to
Table 12Estimated economic impact to region for a 100 MW CST station.Sources: Stoddard et al. (2006), Schwer and Riddel (2008), and BEA (2009).
Impact to region (1) California (3) New Mexico Nevada Arizona
Private investment (2) $2.8 B $198.9 M Not estimated $400 MGross state product $626 M $465 M $482 M $420 MEarnings $195 M $75 M $406 M Not estimatedJobs 3955 job years 2120 jobs 7170 job years 3400 jobsTaxes Not estimated $246M Not Estimated 1.3–1.9 B over 30 yrSize of economy (M USD) 2,312,968 76,178 127,213 387,028
M#millions; B#billions.(1): Results may not be completely comparable as different economic impact models were used. For example, California used the Regional Input–Output Model, whereasNevada studies used the Regional Economic Model (REMI) model of the Nevada economy.(2): Private investment is the amount of capital flow to the region for plant, transmission facilities, ancillary businesses, and infrastructure. Gross State Output is the totalvalue of goods and services produced within the state. Earnings are the value of wages and benefits earned by workers in the region. Jobs include direct and indirect fulland part-time jobs. Taxes are impact to state and local government tax receipts. Size of economy is 2007 Gross Domestic Product for the state.(3): California only assessed the economic impact in a few of the counties thus result does not reflect the entire state.
Table 13Estimated economic impact to Spain for CST implementation.Sources: Caldes et al. (2009) and CIA (2009).
Parabolic trough Power tower Parabolic trough Power tower50 MW 17 MW per MW per MW
Impact to GRPDirect $638 $350 $12.77 $20.60Indirect $586 $336 $11.72 $19.74Total $1,224 $686 $24.48 $40.34
Impact to EmploymentDirect 5,554 3,213 111 189Indirect 4,030 2,278 81 134Total 9,584 5,491 192 323
Gross Regional Product (GRP) figure in millions USD. Exchange rate used is 1USD–1.3163Euro.Spain’s size of economy is 1,683,000 million in 2008 nominal or 1,337,000 millionin 2006 PPP.
5 (Stoddard et al., 2006) Study was targeted at southern California with onlythe following counties included: Fresno, Imperial, Inyo, Kern, Kings, Los Angeles,Mono, Orange, Riverside, San Bernardino, San Diego, San Luis Obispo, SantaBarbara, Tulare, and Ventura.
6 (BEA, 2009; NBS, 2009) GDP for Xinjiang is $60.6B USD 2008 nominal or98.7B USD in 2006PPP. New Mexico 2007 GDP is $76.2B.
7 (NBS, 2009) Population of Xinjiang in 2007 is 20,950,000.8 (NBS, 2009) GDP for Tibet in 2008 is $5.6B USD 2008 nominal or 9.7M USD in
2006PPP.
J. Chien, N. Lior / Energy Policy 39 (2011) 7622–7636 7633
Author's personal copy
become employed in all businesses associated with solar powergeneration and distribution and their associated outcomes?
The economic impact assessment should also take intoaccount the current economic profiles of Tibet and Xinjiang andexplore the potential of economic captive effects of a CSTdeployment in this region. For example, Xinjiang is rich in naturalresources (minerals, oil, and natural gas) and advantageouslylocated to trade with eight neighboring countries, which positionsit as a major economic growth driver in China’s Western region(Chaudhuri, 2005). Rather than solely relying on the sale or exportof its natural resources for income, Xinjiang has the potential tomove up the value chain and expand its economy by attractingand developing energy-intensive industries (mining, refining, andchemical) to the region with CST-produced electricity, therebyfurther developing Xinjiang’s economic base.
In addition to use CST as an anchor to attract industries to theregion, the impact of Xinjiang, Tibet, or other parts of Chinaplaying a leadership role in CST component manufacturing canalso be explored. China is already a world leader in terms of solarthermal heating (size of market and manufacturing capability)and is currently a significant player in solar PV manufacturing. Ifthe transition from solar thermal heating and solar PV toconcentrating solar thermal components is possible, CST deploy-ments could be the catalyst needed to give China’s governmentand China’s solar industry a unique opportunity to take a leader-ship position in CST.
6. Conclusions
Having experienced traditional development issues and facedwith increasing international and internal pressure on environ-mental pollution, Chinese leaders recognize the need for sustain-able development – balancing economic, social, and environmentalfactors – in reaching the country’s objective of quadrupling its GDPby 2020 versus the year 2000 while only doubling energy con-sumption. In tandem with economic growth, China’s President, HuJintao, also declared the need to grow in a balanced way in whichboth the rural and the urban can benefit.
Chinese leaders recognize that the key ingredients in bridgingregional disparity are economic and infrastructure integration. Thisintegration involves not just roads and railways, but also theelectrification of rural regions (Western and Central) which trans-lates also to an increase in electricity demands. Additionally, therealization of a new socialist countryside with educated andtechnologically savvy peasants will almost certainly mean a drasticrise in China’s growing middle class. As the standard of living in theunderdeveloped regions improves, the ‘‘new peasants’’ may increasethe demand for modern appliances leading to greater electric powerconsumption. Thus, while a necessary goal for China’s social andpolitical stability, the success in ‘‘building a new socialist country-side’’ will tend to hinder China’s energy consumption diet plans aswell as reduction objectives for CO2 emission.
China could partially attain both these objectives throughaggressively incorporating large-scale renewable energy suppliesinto China’s energy mix. With over two-thirds of China’s landsurface areas receiving more than 5"106 kJ/m2/yr of solar radia-tion and DNI resources ranging from 5 kWh/m2/day to 9 kWh/m2/day in China’s Western region (mainly Xinjiang and Tibet), Chinahas the key prerequisite to make CST power generationeconomical—making concentrating solar thermal power one ofthe most viable ways to reach this objective.
With China’s western regions characterized by mostly flat andunproductive desert lands and concrete plans to connect Tibetand Xinjiang into the national power grid by 2011 with HVDC
lines, China also has the land and grid infrastructure needed forsuccessful CST deployment.
While CST is dependent on an intermittent source for fuel, CSTsystems can provide non-intermittent electricity generation (firmcapacity) or to satisfy peaking or intermediate load capacitydemands (dispatchability) when equipped with heat storagesystems, and/or fossil fuel backups (hybridization), and, impor-tantly by employing ‘‘grid storage’’ if an adequate smart gridbecomes available. Such a grid would transmit electricity tofurther regions of China if and when needed. With demonstratedcapacity factor of 24%, name-plate capacity at 100 s of MW scale,20 years of operational experience, and virtually emissions free,CST can be a good utility-scale clean energy power plant optionfor China.
At 13.5 cents/kWh (predicted for the next trough plant based onCalifornia SEGS experience curve), cost of CST electricity is stillnearly triple to that of coal-fired power plants located in Xinjiang,which have an electricity cost of 4.6 cents/kWh. However, whencosts of externalities are considered, CST becomes 45% cheaper thanscrubbed coal (a cleaner version of China’s dominant coal-firedelectricity) and 10% cheaper then nuclear (with externalities costsbased on Sovacool’s study). Thus, while externalities vary greatlydue to different assumptions, the key point is that if externalities areaccounted for CST becomes a very competitive electricity generationalternative. Furthermore, the 13.5 cents/kWh is the price estimatedfor the US, and it is likely to be lower for plants built in China.
Looking into the future, CST also has great potential forcontinued cost savings from both economies of scale and tech-nological improvements in efficiency. If IEA’s CST outlook of20,150 MWe of installed capacity in the year 2020 is realized,based on California SEGS experience curve, CST can realize a LECof around 4 cents/kWh, which makes CST competitive withtraditional fossil fuel based electric power within ten years.
With Tibet and Xinjiang consistently identified as regions withthe most CST potential, lowest population density and landproductivity/value, and some of the lowest economic status, CSTpower plants will not only benefit a region in terms of providingthe electric power needed to fuel regional development, but thelarge capital investment involved in building CST systems willalso have socio-economic benefits to the region(s) that host thesolar power plant. Specifically, China should build CST powerstations in the sunny Western regions, and sell the generatedelectricity to the more industrialized Eastern region where thebulk of the demand occurs. By doing so, China can turn the lessproductive lands of the Western regions into competitive advan-tages and at the same time provide the much needed electricity tothe Eastern regions driving economic growth. This will also bringeconomic benefits to the underdeveloped Western region viaconstruction, infrastructure build-up, maintenance, and otherbeneficial trickle-down effects.
Using economic impact assessments of select US regions andSpain (two most developed markets for CST) as reference, thepotential economic impact for China can range from $5 M to$30 M of additional GDP per MWe of CST capacity installed. On aregional basis, this could mean an additional $465 M of GDP or$22.20 of additional per capital GDP for Xinjiang if a 100 MWecapacity CST is implemented there. For Tibet, even using the mostconservative estimate of $5 M per MW of capacity, building a50 MW CST plant could increase Tibet’s GDP by 4% (3% via2006 PPP).
These regions also have the potential to move up the valuechain and expand their economies by attracting and developingenergy-intensive industries (mining, refining, and chemical) tothe region with CST-produced electricity, thereby further devel-oping Western regions economic base. Furthermore, the impact ofXinjiang, Tibet, or other parts of China playing a leadership role in
J. Chien, N. Lior / Energy Policy 39 (2011) 7622–76367634
Author's personal copy
CST component manufacturing can also be explored. China isalready a world leader in terms of solar thermal heating (size ofmarket and manufacturing capability) and is currently a signifi-cant player in solar PV manufacturing. If the transition from solarthermal heating and solar PV to concentrating solar thermalcomponents is possible, CST deployments could be the catalystneeded to give China’s government and China’s solar industry aunique opportunity to take a leadership position in CST.
Ultimately, our paper combines and applies different data andanalyses on China’s economic development challenges, CST tech-nology and feasibility, and economic impact of CST implementa-tions in a new and useful way to show that solar thermalelectricity generation can continue to fuel China’s growth cleanlywhile reducing regional socio-economic disparity.
In sum, based on this study, the recommendations we proposefor consideration by China’s policy makers are
% In comparing coal-fueled power generation, include the asso-ciated environmental and social impacts/externalities in arealistic manner,% Adopt large-scale concentrating solar power as an alternate,
renewable, and viable energy supply to achieve the country’senergy security needs and social stability objectives.% Vigorously continue expanding and enhancing existing electric
power grid to facilitate the supply of electricity from WesternChina, where solar resources are abundant, to Eastern China,where electricity consumption is greatest.% Form public–private initiatives that will attract domestic and
foreign investors necessary to build the power generationfacilities in the West as well as the necessary supportinginfrastructures.% Legislate policies that will ensure that the benefits of solar
power generation will go not just to the investors, but also tolocal communities—to have a real impact on the local econ-omy and thus bridge economic disparity.% Finally, to reduce the dependency of the local economy on the
sale of solar power generated electricity alone, policy makersshould employ synergy to attract energy-intensive industriesto the region to further develop the region’s economic base.
References
Aabakken, J., 2006. Power Technologies Energy Data Book. National RenewableEnergy Laboratory (p. 18 accessed on October 2, 2010)/http://www.nrel.gov/docs/fy06osti/39728.pdfS.
Al-Soud, M., Hrayshat, E., 2009. A 50 MW concentrating solar power plant forJordan. Journal of Cleaner Production. 17 (6), 625–635.
Aringhoff, R., Brakmann, G., Geyer, M., Teske, S., 2005. Concentrated Solar ThermalPower—Now! IEA SolarPACES Implementing Agreement, 2005. /http://www.solarpaces.org/Library/CSP_Documents/Concentrated-Solar-Thermal-Power-Plants-2005.pdfS (accessed on October 2, 2010).
Bureau of Economic Analysis (BEA), 2009. Regional Economic Accounts—GrossDomestic Product by State. /http://www.bea.gov/regional/gsp/S (accessed onOctober 2, 2010).
Badr, R., Benjamin, R., Alvarado, A., Ashuckian, D., O’Brien, T., Therkelsen, B., 2003.Final Staff Report—Comparative Cost of California Central Station ElectricityGeneration Technologies. California Energy Commission. /http://www.energy.ca.gov/reports/2003-06-06_100-03-001F.PDFS (accessed on October2, 2010).
Blair, N., Mehos, M., Short, W., Heimiller, D., 2006. Concentrating Solar Deploy-ment Systems (CSDS) a New Model for Estimating US Concentrating SolarPower (CSP) Market Potential: Preprint. National Renewable Energy Labora-tory (accessed on October 2, 2010)/http://www.nrel.gov/docs/fy06osti/39682.pdfS.
China Climate Change Info Net (CCCIN), 2005. China Strives to Quadruple GDPwith Low Energy Consumption by 2020, May 17, 2005. /http://www.ccchina.gov.cn/en/NewsInfo.asp?NewsId=4498S (accessed on October 2, 2010).
China National Committee for the Implementation of the UN Convention toCombat Desertification (CCICCD), 2009. China National Action Program toCombat Desertification. CCICCD. /http://www.desertification.gov.cn/xinxi/xdfa/1.htmS (accessed on 29.03.2009).
Central Intelligence Agency (CIA), 2009. The World Factbook. /https://www.cia.gov/library/publications/the-world-factbook/index.htmlS (accessed on Octo-ber 2, 2010).
China Electrical Power News Network (CPNN), 2009. 2011Tibet Looks Towards 2011 for Resolving Electricity Short-
age. State Electricity Regulatory Commission (SERC), February 12, 2009./http://www.serc.gov.cn/xyxx/dljs/200902/t20090212_10985.htmS(accessed on October 2, 2010).
China State Power Information Network (CSPIN), 2009. Power Networks—GeneralSituations. China State Power Information Network. /http://www.sp-china.com/powerNetwork/gs.htmlS (accessed on October 2, 2010).
Caldes, N., Varela, M., Santamaria, M., Saez, R., 2009. Economic impact of solarthermal electricity deployment in Spain. Energy Policy 37 (5), 1628–1636.
Chaudhuri, D., 2005. A Survey of the Economic Situation in Xinjiang and its Role inthe Twenty-First Century. China Report February 2005, vol. 41, no. 1, pp. 1–28.doi: 10.1177/000944550504100101.
Chien, T., Hu, J., 2007. Renewable energy and macroeconomic efficiency of OECDand Non-OECD economies. Energy Policy 35 (7), 3606–3615.
China Power Web, 2008. Tibet-QinghaiDirect Current Connection Pre-Development Discussion Approved.
/www.chinapower.com.cnS, /http://www.chinapower.com.cn/article/1127/art1127198.aspS (accessed on October 2, 2010).
Cohen, G., Skowronski, M., Cable, R., Morse, F., Jaehne, C.H., Kearney, D., Kearney,S., 2005. Solar Thermal Parabolic Trough Electric Power Plants for ElectricUtilities in California PIER Final Project Report. California Energy Commission./http://www.energy.ca.gov/2005publications/CEC-500-2005-175/CEC-500-2005-175.PDFS (accessed on October 2, 2010).
Dersch, J., Geyer, M., Herrmann, U., Jones, S.A., Kelly, B., Kistner, R., Ortmanns, W.,Price, H., 2004. Trough integration into power plants-a study on the perfor-mance and economy of integrated solar combined cycle systems. Energy 29(5–6), 947–959.
Fan, J., Sun, W., Ren, M., 2005. Renewables portfolio standard and regional energystructure optimisation in China. Energy Policy 33 (3), 279–287.
Hang, Q., Jun, Z., Xiao, Y., Junkui, C., 2008. Prospect of concentrating solar power inchina—the sustainable future. Renewable and Sustainable Energy Reviews 12(9), 2505–2514.
He, J., Deng, J., Su, M., 2010. CO2 emission from China’s energy sector and strategyfor its control. Energy 35 (11), 4495–4499.
Hvistendahl, M., 2008. China’s 3 Gorges Dam: An Environmental Catastrophe?Scientific American, March 25, 2008. /http://www.scientificamerican.com/article.cfm?id=chinas-three-gorges-dam-disaster&print=trueS (accessed onOctober 9, 2010).
International Energy Agency (IEA), 2003. Renewables for Power Generation: Status& Prospects, 2003 ed. OECD Publishing. doi:10.1787/9789264019195-en.
Jiang, B., Sun, Z., Liu, M., 2010. China’s energy development strategy under thelow-carbon economy. Energy 35, 4257–4264.
Jin, H., Lior, N., Zhang, X., 2010a. Energy and its sustainable development forChina: editorial introduction and commentary for the special issue of Energy.Energy 35 (2010), 4246–4256.
Jin, H., Xu, G., Han, W., Gao, L., Li, Z., 2010b. Sustainable development of energysystems for western China. Energy 35 (11), 4313–4318.
Jones, W., 2008. How Much Water Does It Take to Make Electricity? IEEE SpectrumOnline. /http://spectrum.ieee.org/energy/environment/how-much-water-does-it-take-to-make-electricityS (accessed on October 9, 2010).
Karmis, M., 2005. A Study of Increased use of Renewable Energy Resources inVirginia. The Virginia Center for Coal and Energy Research, Virginia Poly-technic Institute and State University (accessed on October 2, 2010)/http://www.energy.vt.edu/Publications/Incr_Use_Renew_Energy_VA_rev1.pdfS.
Knies, G., 2008. Clean power from deserts: the DESERTEC concept for energy,water and climate security. White Book, 4th ed. /http://www.gbv.de/dms/zbw/560021739.pdfS (accessed on October 2, 2010).
Kreith, F., Goswami, Y., 2007. Handbook of Energy Efficiency and RenewableEnergy. CRC Press.
Li, Y., Oberheitmann, A., 2009. Challenges of rapid economic growth in China:reconciling sustainable energy use, environmental stewardship and socialdevelopment. Energy Policy 37 (4), 1412–1422.
Lior, N., 1977. Solar energy and the steam rankine cycle for driving and assistingheat pumps in heating and cooling modes. Energy Conversion 16 (3), 111–123.
Lior, N., Koai, K., 1982. Solar-powered/fuel-assisted rankine cycle power andcooling system: simulation method and seasonal performance. Journal ofSolar Energy Engineering 106 (2), 142–152.
Lior, N., Koai, K., 1984a. Comparative Economic Analysis of a Solar-Powered/FuelAssisted Hybrid Rankine System. American Solar Energy Society, IncludingInvited Papers from the 1983 Annual Meeting.
Lior, N., Koai, K., 1984b. Solar-powered/fuel-assisted rankine cycle power andcooling system: sensitivity analysis. Transactions of the ASME Journal of SolarEnergy Engineering 106 (4), 447–456.
National Bureau of Statistics of China (NBS), 2009. Statistical Communique of thePeople’s Republic of China. /http://www.stats.gov.cn/english/S (accessed onOctober 2, 2010).
National Development and Reform Commission (NDRC), 2007a.(Renewable Energy Medium and Long Term
Development Plan). NDRC. /http://www.sdpc.gov.cn/zcfb/zcfbtz/2007tongzhi/t20070904_157352.htmS (accessed on October 2, 2010).
National Development and Reform Commission (NDRC), 2007b.2005-2020 (Nuclear Power Medium and Long Term
J. Chien, N. Lior / Energy Policy 39 (2011) 7622–7636 7635
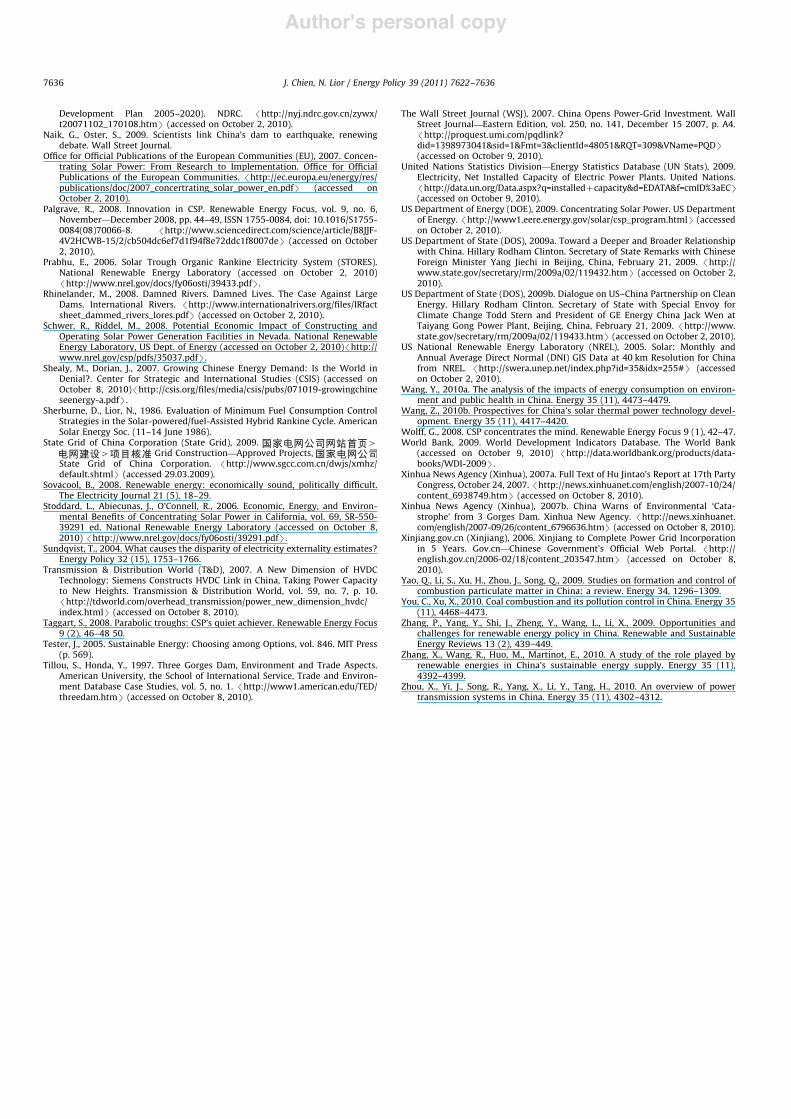
Author's personal copy
Development Plan 2005–2020). NDRC. /http://nyj.ndrc.gov.cn/zywx/t20071102_170108.htmS (accessed on October 2, 2010).
Naik, G., Oster, S., 2009. Scientists link China’s dam to earthquake, renewingdebate. Wall Street Journal.
Office for Official Publications of the European Communities (EU), 2007. Concen-trating Solar Power: From Research to Implementation. Office for OfficialPublications of the European Communities. /http://ec.europa.eu/energy/res/publications/doc/2007_concertrating_solar_power_en.pdfS (accessed onOctober 2, 2010).
Palgrave, R., 2008. Innovation in CSP. Renewable Energy Focus, vol. 9, no. 6,November—December 2008, pp. 44–49, ISSN 1755-0084, doi: 10.1016/S1755-0084(08)70066-8. /http://www.sciencedirect.com/science/article/B8JJF-4V2HCWB-15/2/cb504dc6ef7d1f94f8e72ddc1f8007deS (accessed on October2, 2010).
Prabhu, E., 2006. Solar Trough Organic Rankine Electricity System (STORES).National Renewable Energy Laboratory (accessed on October 2, 2010)/http://www.nrel.gov/docs/fy06osti/39433.pdfS.
Rhinelander, M., 2008. Damned Rivers. Damned Lives. The Case Against LargeDams. International Rivers. /http://www.internationalrivers.org/files/IRfactsheet_dammed_rivers_lores.pdfS (accessed on October 2, 2010).
Schwer, R., Riddel, M., 2008. Potential Economic Impact of Constructing andOperating Solar Power Generation Facilities in Nevada. National RenewableEnergy Laboratory, US Dept. of Energy (accessed on October 2, 2010)/http://www.nrel.gov/csp/pdfs/35037.pdfS.
Shealy, M., Dorian, J., 2007. Growing Chinese Energy Demand: Is the World inDenial?. Center for Strategic and International Studies (CSIS) (accessed onOctober 8, 2010)/http://csis.org/files/media/csis/pubs/071019-growingchineseenergy-a.pdfS.
Sherburne, D., Lior, N., 1986. Evaluation of Minimum Fuel Consumption ControlStrategies in the Solar-powered/fuel-Assisted Hybrid Rankine Cycle. AmericanSolar Energy Soc. (11–14 June 1986).
State Grid of China Corporation (State Grid), 2009. 44 Grid Construction—Approved Projects,
State Grid of China Corporation. /http://www.sgcc.com.cn/dwjs/xmhz/default.shtmlS (accessed 29.03.2009).
Sovacool, B., 2008. Renewable energy: economically sound, politically difficult.The Electricity Journal 21 (5), 18–29.
Stoddard, L., Abiecunas, J., O’Connell, R., 2006. Economic, Energy, and Environ-mental Benefits of Concentrating Solar Power in California, vol. 69, SR-550-39291 ed. National Renewable Energy Laboratory (accessed on October 8,2010) /http://www.nrel.gov/docs/fy06osti/39291.pdfS.
Sundqvist, T., 2004. What causes the disparity of electricity externality estimates?Energy Policy 32 (15), 1753–1766.
Transmission & Distribution World (T&D), 2007. A New Dimension of HVDCTechnology: Siemens Constructs HVDC Link in China, Taking Power Capacityto New Heights. Transmission & Distribution World, vol. 59, no. 7, p. 10./http://tdworld.com/overhead_transmission/power_new_dimension_hvdc/index.htmlS (accessed on October 8, 2010).
Taggart, S., 2008. Parabolic troughs: CSP’s quiet achiever. Renewable Energy Focus9 (2), 46–48 50.
Tester, J., 2005. Sustainable Energy: Choosing among Options, vol. 846. MIT Press(p. 569).
Tillou, S., Honda, Y., 1997. Three Gorges Dam, Environment and Trade Aspects.American University, the School of International Service, Trade and Environ-ment Database Case Studies, vol. 5, no. 1. /http://www1.american.edu/TED/threedam.htmS (accessed on October 8, 2010).
The Wall Street Journal (WSJ), 2007. China Opens Power-Grid Investment. WallStreet Journal—Eastern Edition, vol. 250, no. 141, December 15 2007, p. A4./http://proquest.umi.com/pqdlink?did=1398973041&sid=1&Fmt=3&clientId=48051&RQT=309&VName=PQDS(accessed on October 9, 2010).
United Nations Statistics Division—Energy Statistics Database (UN Stats), 2009.Electricity, Net Installed Capacity of Electric Power Plants. United Nations./http://data.un.org/Data.aspx?q=installed!capacity&d=EDATA&f=cmID%3aECS(accessed on October 9, 2010).
US Department of Energy (DOE), 2009. Concentrating Solar Power. US Departmentof Energy. /http://www1.eere.energy.gov/solar/csp_program.htmlS (accessedon October 2, 2010).
US Department of State (DOS), 2009a. Toward a Deeper and Broader Relationshipwith China. Hillary Rodham Clinton. Secretary of State Remarks with ChineseForeign Minister Yang Jiechi in Beijing, China, February 21, 2009. /http://www.state.gov/secretary/rm/2009a/02/119432.htmS (accessed on October 2,2010).
US Department of State (DOS), 2009b. Dialogue on US–China Partnership on CleanEnergy. Hillary Rodham Clinton. Secretary of State with Special Envoy forClimate Change Todd Stern and President of GE Energy China Jack Wen atTaiyang Gong Power Plant, Beijing, China, February 21, 2009. /http://www.state.gov/secretary/rm/2009a/02/119433.htmS (accessed on October 2, 2010).
US National Renewable Energy Laboratory (NREL), 2005. Solar: Monthly andAnnual Average Direct Normal (DNI) GIS Data at 40 km Resolution for Chinafrom NREL. /http://swera.unep.net/index.php?id=35&idx=255#S (accessedon October 2, 2010).
Wang, Y., 2010a. The analysis of the impacts of energy consumption on environ-ment and public health in China. Energy 35 (11), 4473–4479.
Wang, Z., 2010b. Prospectives for China’s solar thermal power technology devel-opment. Energy 35 (11), 4417–4420.
Wolff, G., 2008. CSP concentrates the mind. Renewable Energy Focus 9 (1), 42–47.World Bank, 2009. World Development Indicators Database. The World Bank
(accessed on October 9, 2010) /http://data.worldbank.org/products/data-books/WDI-2009S.
Xinhua News Agency (Xinhua), 2007a. Full Text of Hu Jintao’s Report at 17th PartyCongress, October 24, 2007. /http://news.xinhuanet.com/english/2007-10/24/content_6938749.htmS (accessed on October 8, 2010).
Xinhua News Agency (Xinhua), 2007b. China Warns of Environmental ‘Cata-strophe’ from 3 Gorges Dam. Xinhua New Agency. /http://news.xinhuanet.com/english/2007-09/26/content_6796636.htmS (accessed on October 8, 2010).
Xinjiang.gov.cn (Xinjiang), 2006. Xinjiang to Complete Power Grid Incorporationin 5 Years. Gov.cn—Chinese Government’s Official Web Portal. /http://english.gov.cn/2006-02/18/content_203547.htmS (accessed on October 8,2010).
Yao, Q., Li, S., Xu, H., Zhou, J., Song, Q., 2009. Studies on formation and control ofcombustion particulate matter in China: a review. Energy 34, 1296–1309.
You, C., Xu, X., 2010. Coal combustion and its pollution control in China. Energy 35(11), 4468–4473.
Zhang, P., Yang, Y., Shi, J., Zheng, Y., Wang, L., Li, X., 2009. Opportunities andchallenges for renewable energy policy in China. Renewable and SustainableEnergy Reviews 13 (2), 439–449.
Zhang, X., Wang, R., Huo, M., Martinot, E., 2010. A study of the role played byrenewable energies in China’s sustainable energy supply. Energy 35 (11),4392–4399.
Zhou, X., Yi, J., Song, R., Yang, X., Li, Y., Tang, H., 2010. An overview of powertransmission systems in China. Energy 35 (11), 4302–4312.
J. Chien, N. Lior / Energy Policy 39 (2011) 7622–76367636
Related Documents