FPGA-based wireless smart sensor for real-time photosynthesis monitoring Jesus Roberto Millan-Almaraz a,⇑ , Irineo Torres-Pacheco b , Carlos Duarte-Galvan b , Ramon Gerardo Guevara-Gonzalez b , Luis Miguel Contreras-Medina b , Rene de Jesus Romero-Troncoso c , Jesus Rooney Rivera-Guillen d a Facultad de Ciencias Fisico-Matematicas, Universidad Autonoma de Sinaloa, Av. de las Américas y Blvd. Universitarios, Cd. Universitaria, 80000 Culiacan, Sinaloa, Mexico b CA Ingenieria de Biosistemas, Division de Investigacion y Posgrado, Facultad de Ingenieria, Universidad Autonoma de Queretaro, Cerro de las Campanas s/n, 76010 Queretaro, Qro., Mexico c HSPdigital – CA Telematica, DICIS, Universidad de Guanajuato, Carr. Salamanca-Valle km 3.5+1.8, Palo Blanco, 36885 Salamanca, Gto., Mexico d Department of Aerospace Engineering, Ryerson University, 350 Victoria Street, Toronto, Ontario, Canada M5B 2K3 article info Article history: Received 24 November 2011 Received in revised form 7 February 2013 Accepted 5 April 2013 Keywords: Smart sensor Photosynthesis Precision agriculture Phytomonitoring FPGA Wireless monitoring abstract Photosynthesis is considered the most important physiological function because it constitutes the main biomass entrance for the planet and consequently it permits the continuance of life on earth. Therefore, accurate photosynthesis measurement methods are required to understand many photosynthesis-related phenomena and to characterize new plant varieties. This project has been carried out to cover those necessities by developing a novel FPGA-based photosynthesis smart sensor. The smart sensor is capable of acquiring and fusing the primary sensor signals to measure temperature, relative humidity, solar radi- ation, CO 2 , air pressure and air flow. The measurements are used to calculate net photosynthesis in real time and transmit the data via wireless communication to a sink node. Also it is capable of estimating other response variables such as: carbon content, accumulated photosynthesis and photosynthesis first derivative. This permits the estimation of carbon balance and integrative and derivative variables from net photosynthesis in real time due to the FPGA processing capabilities. In addition, the proposed smart sensor is capable of performing signal processing, such as average decimation and Kalman filters, to the primary sensor readings so as to decrease the amount of noise, especially in the CO 2 sensor while improv- ing its accuracy. In order to prove the effectiveness of the proposed system, an experiment was carried out to monitor the photosynthetic response of chili pepper (Capsicum annuum L.) as case of study in which photosynthetic activity can successfully be observed during the excitation light periods. Results revealed useful information which can be utilized as new tool for precision agriculture by estimating the aforementioned variables and also the derivative and integrative new indexes. These indexes can be utilized to estimate carbon accumulation over the crop cycle and fast derivative photosynthesis changes in relation to the net photosynthesis measurement which can be utilized to detect different stress conditions in the crops, permitting growers to apply a correction strategy with opportunity. Ó 2013 Elsevier B.V. All rights reserved. 1. Introduction The photosynthesis process is the biochemical reaction in which plants transform sunlight energy into chemical energy. In this pro- cess, plants fix carbon dioxide (CO 2 ) and release oxygen (O 2 ). This process is considered the most important biochemical reaction in the world because it produces 90% of the planet biomass (Taiz and Zeiger, 2002). On the other hand, photoinhibition is a term uti- lized to describe all the environmental conditions that can nega- tively affect the photosynthetic activity. The most common stress factor is light. Consequently, accurate photosynthesis measure- ments are necessary to establish comparisons and understand plant productivity or biomass accumulation at the leaf, plant, canopy, or community levels as well as their interaction and response to envi- ronmental (Bakker et al., 2001), chemical (Marschner, 1995), or bio- logical (Stout et al., 1999) factors that generate stress conditions. Due to the great importance of photosynthesis, accurate mea- surement methods are required to gather more information about this process. These methods are commonly classified as destructive and non-destructive. Destructive methods are those that cause partial or total destruction of the plant, leaf or tissue during the measurement process. These methods include techniques like dry matter accumulation that consists of drying the plant sample in 0168-1699/$ - see front matter Ó 2013 Elsevier B.V. All rights reserved. http://dx.doi.org/10.1016/j.compag.2013.04.009 ⇑ Corresponding author. Tel.: +52 6677161154x117. E-mail address: [email protected] (J.R. Millan-Almaraz). Computers and Electronics in Agriculture 95 (2013) 58–69 Contents lists available at SciVerse ScienceDirect Computers and Electronics in Agriculture journal homepage: www.elsevier.com/locate/compag

Welcome message from author
This document is posted to help you gain knowledge. Please leave a comment to let me know what you think about it! Share it to your friends and learn new things together.
Transcript

Computers and Electronics in Agriculture 95 (2013) 58–69
Contents lists available at SciVerse ScienceDirect
Computers and Electronics in Agriculture
journal homepage: www.elsevier .com/locate /compag
FPGA-based wireless smart sensor for real-time photosynthesismonitoring
0168-1699/$ - see front matter � 2013 Elsevier B.V. All rights reserved.http://dx.doi.org/10.1016/j.compag.2013.04.009
⇑ Corresponding author. Tel.: +52 6677161154x117.E-mail address: [email protected] (J.R. Millan-Almaraz).
Jesus Roberto Millan-Almaraz a,⇑, Irineo Torres-Pacheco b, Carlos Duarte-Galvan b,Ramon Gerardo Guevara-Gonzalez b, Luis Miguel Contreras-Medina b, Rene de Jesus Romero-Troncoso c,Jesus Rooney Rivera-Guillen d
a Facultad de Ciencias Fisico-Matematicas, Universidad Autonoma de Sinaloa, Av. de las Américas y Blvd. Universitarios, Cd. Universitaria, 80000 Culiacan, Sinaloa, Mexicob CA Ingenieria de Biosistemas, Division de Investigacion y Posgrado, Facultad de Ingenieria, Universidad Autonoma de Queretaro, Cerro de las Campanas s/n, 76010 Queretaro, Qro.,Mexicoc HSPdigital – CA Telematica, DICIS, Universidad de Guanajuato, Carr. Salamanca-Valle km 3.5+1.8, Palo Blanco, 36885 Salamanca, Gto., Mexicod Department of Aerospace Engineering, Ryerson University, 350 Victoria Street, Toronto, Ontario, Canada M5B 2K3
a r t i c l e i n f o
Article history:Received 24 November 2011Received in revised form 7 February 2013Accepted 5 April 2013
Keywords:Smart sensorPhotosynthesisPrecision agriculturePhytomonitoringFPGAWireless monitoring
a b s t r a c t
Photosynthesis is considered the most important physiological function because it constitutes the mainbiomass entrance for the planet and consequently it permits the continuance of life on earth. Therefore,accurate photosynthesis measurement methods are required to understand many photosynthesis-relatedphenomena and to characterize new plant varieties. This project has been carried out to cover thosenecessities by developing a novel FPGA-based photosynthesis smart sensor. The smart sensor is capableof acquiring and fusing the primary sensor signals to measure temperature, relative humidity, solar radi-ation, CO2, air pressure and air flow. The measurements are used to calculate net photosynthesis in realtime and transmit the data via wireless communication to a sink node. Also it is capable of estimatingother response variables such as: carbon content, accumulated photosynthesis and photosynthesis firstderivative. This permits the estimation of carbon balance and integrative and derivative variables fromnet photosynthesis in real time due to the FPGA processing capabilities. In addition, the proposed smartsensor is capable of performing signal processing, such as average decimation and Kalman filters, to theprimary sensor readings so as to decrease the amount of noise, especially in the CO2 sensor while improv-ing its accuracy. In order to prove the effectiveness of the proposed system, an experiment was carriedout to monitor the photosynthetic response of chili pepper (Capsicum annuum L.) as case of study inwhich photosynthetic activity can successfully be observed during the excitation light periods. Resultsrevealed useful information which can be utilized as new tool for precision agriculture by estimatingthe aforementioned variables and also the derivative and integrative new indexes. These indexes canbe utilized to estimate carbon accumulation over the crop cycle and fast derivative photosynthesischanges in relation to the net photosynthesis measurement which can be utilized to detect differentstress conditions in the crops, permitting growers to apply a correction strategy with opportunity.
� 2013 Elsevier B.V. All rights reserved.
1. Introduction
The photosynthesis process is the biochemical reaction in whichplants transform sunlight energy into chemical energy. In this pro-cess, plants fix carbon dioxide (CO2) and release oxygen (O2). Thisprocess is considered the most important biochemical reaction inthe world because it produces 90% of the planet biomass (Taizand Zeiger, 2002). On the other hand, photoinhibition is a term uti-lized to describe all the environmental conditions that can nega-tively affect the photosynthetic activity. The most common stress
factor is light. Consequently, accurate photosynthesis measure-ments are necessary to establish comparisons and understand plantproductivity or biomass accumulation at the leaf, plant, canopy, orcommunity levels as well as their interaction and response to envi-ronmental (Bakker et al., 2001), chemical (Marschner, 1995), or bio-logical (Stout et al., 1999) factors that generate stress conditions.
Due to the great importance of photosynthesis, accurate mea-surement methods are required to gather more information aboutthis process. These methods are commonly classified as destructiveand non-destructive. Destructive methods are those that causepartial or total destruction of the plant, leaf or tissue during themeasurement process. These methods include techniques like drymatter accumulation that consists of drying the plant sample in
CADUGA
Resaltado
CADUGA
Resaltado

J.R. Millan-Almaraz et al. / Computers and Electronics in Agriculture 95 (2013) 58–69 59
an oven and measuring dry weight to determine accumulated pho-tosynthesis (Hodson et al., 2005), and the isotope method based onthe use of carbon isotopes like 11C, 12C and 14C to obtain markedCO2 that is traceable through the plant body, but contaminatesthe analyzed plant with radioactive CO2 as was mentioned by Kaw-achi et al. (2006) and Millan-Almaraz et al. (2009). Non-destructivephotosynthesis measurement methods in contrast, are those thatseek to avoid plant damage. These methods include electrochemi-cal methods that consist of red-ox reaction based sensors used tomeasure oxygen liberation in aqueous algae solutions (Hunt,2003). Acoustic methods are based on an uncommon techniquethat measure sea photosynthesis by a quantification of the under-sea sound interruption occurring as a result of the liberation ofsmall O2 bubbles through algae photosynthesis (Hermand, 2004).Chlorophyll fluorescence is one of the most utilized photosynthesismeasurement techniques. It consists of determining the amount ofchlorophyll present in the analyzed sample; this is performed byenclosing the plant sample in a dark chamber, applying light exci-tation and quantifying the red fluorescence emitted by the plantafter the excitation light interruption as was reported by Fedacket al. (2005) and Sayed (2003). This method presents the advantageof being less sensitive to environment factors compared with theCO2 exchange method which is the most widely utilized for photo-synthesis measurement (Wang et al., 2004).
Gas exchange (CO2 and H2O) within leaves constitutes the basisof most photosynthesis measurement methods. Since CO2 intakeand H2O release share the same biochemical pathway, photosyn-thesis measurements commonly include the estimation of photo-synthesis itself also known as the assimilation or CO2 uptake orthe stomatal conductance and transpiration (Field et al., 1991). Itconsists of partially isolating the plant sample in a transparentchamber, using Infrared Gas Analyzer (IRGA) CO2 sensors to mea-sure the difference between intake ambient CO2 concentrationand the final concentration after a period of time to permit plantphotosynthesis inside the leaf chamber as reported by Takahashiet al. (2001) and Millan-Almaraz et al. (2009).
Consequently, it can be inferred that the CO2 exchange methodis more sensitive to environmental factors than chlorophyll-fluo-rescence based techniques. However, CO2 exchange has severaladvantages over other methods. First, a higher amount of informa-tion regarding variables as product of the photosynthesis measure-ment process can be gathered. These include net photosynthesisitself, carbon content, transpiration, stomatal conductance, dewpoint, to name but a few. Another advantage is to be less proneto errors due to spatial heterogeneity of stomatal conductanceand photosynthetic capacity given by the variability across leafsurfaces. Further, this method permits investigators to determinethe exact leaf-area of measurement in the majority of cases, withthe exception of small or narrow leaves which do not fill the smallchambers (Long and Bernachi, 2003). Due to these aforementionedadvantages, the CO2 exchange method has been chosen in thisinvestigation.
In previous investigations, the CO2 exchange method has beenused to measure net photosynthesis (Pn) in many photosynthesismeasurement systems (Phytech Inc., 2005; CID Inc., 2008). Netphotosynthesis is an indirect indicator of the plant’s whole bio-mass production and consequently can be used to estimate cropyield. In biotechnology research, Pn can be used to characterizethe photosynthetic response of new genetically-improved plantvarieties. Due to the demands to constantly develop new plantvarieties, it is very important to maintain pest and disease resis-tances in a changing world in which pathogens are continuouslymutating to counteract natural and artificially induced plant resis-tance mechanisms (Torres-Pacheco et al., 2007). Consequently, it isnecessary to perform genetic, biochemical and physiological char-acterizations in order to better understand information regarding
the variety being developed to determine if it is affordable to beutilized for agricultural processes or not. Moreover, it is necessaryto characterize the behavior of improved plants in order to add thisinformation in patent documents. In biology research Pn is studiedto understand many processes in wild plants. Forestry and ecolog-ical research has also used photosynthesis monitoring as an eco-logical indicator of pollution as well as to investigate certainproperties of trees (Schulze, 1972).
Due to the increasing demand for food, extra efforts and specialtechniques to increase the food production and information tech-nology is now heavily relied upon in agriculture. Because of theadvancements of technologies and reduced size of sensors, theuse of sensors and wireless technology are supporting agriculturalpractices very positively. According to Aqeel-ur-Rehman et al. (inpress), the agricultural domain possesses various requirements,some of them requires the collection of weather, crop and soil infor-mation. In order to accomplish this, it is necessary to employ paral-lel and distributed applications. Consequently, these technologicaladvances permit to collect important information and to react todifferent situations. The commercial equipment used for photosyn-thesis monitoring in the aforementioned applications performoffline measurements, yet lack the capability of multipoint instru-mentation systems for measurement of large crop extensionswhere using wired communication is expensive and impractical.Consequently, any abnormal or stress conditions cannot be de-tected in situ with opportunity; therefore, it is necessary to have atechnician to take the measurements manually in the field or green-house. The data collected then has to be manually downloaded tobe analyzed offline and make decisions regarding proactive mea-sures with at least a 1 day delay (Ton et al., 2004). In precision agri-culture, a 1 day delay can easily represent the loss of the total crop(Millan-Almaraz et al., 2010). Due to the aforementioned shortfallsof multipoint monitoring of photosynthesis response to character-ize and monitor diverse physiological responses on plants of com-mercial interest, a new multipoint monitoring system withwireless communication capabilities to monitor photosynthesis re-sponse in a real time way is proposed herein.
A smart sensor is defined as a sensor that provides functions be-yond those necessary for generating a correct interpretation of asensed or controlled quantity (Frank, 2000), based on this; smartsensors must incorporate processing, communication and integra-tion (Rivera et al., 2008). In this investigation the use of oversam-pling and Kalman filters in order to decrease the amount of noisereceived in the data collected is proposed, with special emphasison data that is coming from the CO2 sensor. Further, the capabilityof fusing the information of nodes inside of the sensor networkmust be taken into consideration. To accomplish this, high perfor-mance computational capabilities are required. These days, FieldProgrammable Gate Arrays (FPGAs) are devices that are beingemployed in applications where high demand computational re-sources are necessary (Contreras-Medina et al., 2012). Conse-quently, these devices have been gaining popularity primarilybecause of their parallelism, high-speed processing and highreconfigurability (Contreras-Medina et al., 2010). Due to the de-mands for high computation required in this research the use ofFPGA-based smart sensor with capabilities of acquiring the pri-mary sensor readings, memory management, signal processing,photosynthesis calculation, wireless communication managementand in situ real time photosynthesis signal visualization in a colorLCD screen is proposed.
The contribution of this research project is to develop a novelphotosynthesis smart sensor capable of acquiring and fusing theprimary sensor signals to measure temperature, relative humidity,solar radiation, CO2, air pressure and air flow in order to calculatein real time net photosynthesis and transmit this data via wirelesscommunication to a data server. The wireless communication is

60 J.R. Millan-Almaraz et al. / Computers and Electronics in Agriculture 95 (2013) 58–69
based on Zigbee technology which is preferred over other technol-ogies, such as: Bluetooth, Wibree, and WiFi, mainly because of itslong range, low power consumption, and cost (Aqeel-ur-Rehmanet al., in press). The photosynthesis calculation is carried out in aspecific processing unit embedded in a FPGA. In addition, it is capa-ble of estimating other response variables such as: carbon content,accumulated photosynthesis and transpiration related informationas was previously proposed (Millan-Almaraz et al., 2010). It is de-signed using a combination of several hardware architectures andtechniques in order to function in real time. The communication ofthe proposed smart sensor is composed of a data server for storageand control purposes and a single photosynthesis monitoringsmart sensor end point, but it can be upgraded in a future to manyend points within the neighborhood of the system.
In order to prove the effectiveness of the proposed smart sensor,an experimental setup was carried out to monitor the photosyn-thetic response of chili pepper (Capsicum annuum) as a case ofstudy.
This paper is organized into four sections: the first presents anintroduction to this project; the second presents the materials andmethods section to describe devices, methods and all the elementswhich were utilized in this research for the experiment; the thirdsection illustrates an analysis of the obtained results with a respec-tive discussion; and finally, the fourth section presentsconclusions.
2. Materials and methods
2.1. Photosynthesis measurement
CO2 gas exchange is the most widely utilized method used forphotosynthesis measurement. It is often used to build commercialand experimental photosynthesis monitoring systems by equip-ment manufacturers. In the technique described herein, closed sys-tems are used with IRGA CO2 sensors to measure the initialconcentration in an isolation chamber where the sample is testedto measure the final concentration after a period of time to permitthe photosynthesis of the plant (Phytech Inc., 2005). Open-flowsystems have great advantages in comparison to closed systemsbecause photosynthesis occurring delay is not required to recordthe final concentration of CO2. Instead, photosynthesis samplingat higher frequencies than closed systems is permitted. Therefore,it becomes more useful for fast monitoring of photosynthetic phe-nomena. This also enables the chamber to be interchanged withother chambers possessing differing leaf sizes or shapes, dependingon the specie of plant that needs to be monitored.
In order to calculate the net photosynthesis in an open flow sys-tem, it is necessary to convert the volumetric air flow into a massflow by calculating the W factor by using Eq. (1) as was previouslyreported by (Millan-Almaraz et al., 2010), in which V correspondsto the volumetric air flow in the pneumatic line expressed in litersper minute (lpm), P corresponds to pressure in Bar, TaK to air tem-perature in Kelvin, A is the leaf chamber area in cm2, and the2005.39 is a constant factor to convert minutes to seconds and cen-timeters to meters.
W ¼ 2005:39� V � PTaK � A
� �ð1Þ
Once the W factor has been calculated, Pn calculation can be per-formed using Eq. (2) in which Ci corresponds to the leaf chamber in-take CO2 concentration in ppm and Co is the exhaust CO2
concentration also in ppm to express net photosynthesis in lmol/m2/s.
Pn ¼W � ðCi � CoÞ ð2Þ
2.2. Smart sensor methodology
The design and development of a photosynthesis smart sensornetwork requires integrating many subsystems. It involves a dataacquisition unit (DAS), a whole pneumatic gas exchange system,a signal processing unit and a wireless communication subsystem.The combination of different primary sensors permits integrationof many measurement points. The FPGA-based photosynthesisprocessor is described in the following subsections.
2.2.1. Pneumatic processThe procedure for photosynthesis measurement is illustrated in
Fig. 1. Here, the primary sensors are orange and the two pneumaticlines shown as black arrows can be seen. In the upper part of thefigure, there is a reference air channel, which is analyzed to deter-mine the environment properties of the plant neighborhood airsuch as: air temperature (Ta), input relative humidity (RHi), refer-ence air flow (Vi), reference pressure (Pi) and input CO2 (Ci). Thelower pneumatic line corresponds to the air channel that is con-nected to the leaf gas exchange chamber called a sample air chan-nel. Therefore, it is necessary to analyze the same environmentalvariables such as the reference channel to establish a comparisonbetween these properties because this is the basis of the gas ex-change method. Here, the measured variables are: leaf tempera-ture (Tleaf), output relative humidity (RHo), reference air flow (Vo),sample pressure (Po) and output CO2 (Co). Furthermore, the dataacquisition system can be observed in the middle of Fig. 1 in whichall the primary sensors from both reference and sample air chan-nels are connected plus an additional solar radiation sensor to havereference of the start and end of day information which is much re-lated to the photosynthetic activity. Both pneumatic lines weremonitored as was aforementioned in order to determine the spe-cific properties of both air channels and later in order to be ableto establish a difference between both.
2.2.2. Wireless communication subsystemThe development of the wireless communication subsystem, in-
volves the evaluation of different communication technologies. Asan example of this, there are factors such as: bandwidth, transmis-sion rate, total range, scalability and power consumption that needto be taken into consideration. As was previously established byMoreno-Tapia et al. (2010), the IEEE 802.15.4 ZigBee standardwhich has a theoretical transmission rate of 250 kbps and a maxi-mum range of 1000 m which results in this being the most suitablefor this application. This standard works in three different fre-quency bands and could theoretically contain up to 65,536 nodesmanaged by a single coordinator on a network and has low energyconsumption (IEEE, 2006). Due to these aforementioned benefits,the ZigBee standard is considered as the optimum for thisapplication.
The end point is the smart sensor node equipped with the nec-essary instrumentation systems to calculate net photosynthesisfrom the measurement of certain primary sensors. The coordinatornode is implemented on a similar platform as the rest of the nodes,but it is responsible for the management of the starting measure-ment commands up to the smart sensor and to gather its respec-tive photosynthesis results in its personal area network (PAN).The proposed wireless system is capable of communicating di-rectly to a PC through a USB interface in the coordinator deviceto enable mass storage and better display purposes.
The wireless subsystem is constituted by a star topology net-work architecture in which a single coordinator node is deployedto manage the smart sensor node which is dedicated to performphotosynthesis analysis. For this application, only one smart sensoris connected for the experiment tests, but additional smart sensordevices can be added in future upgrades.
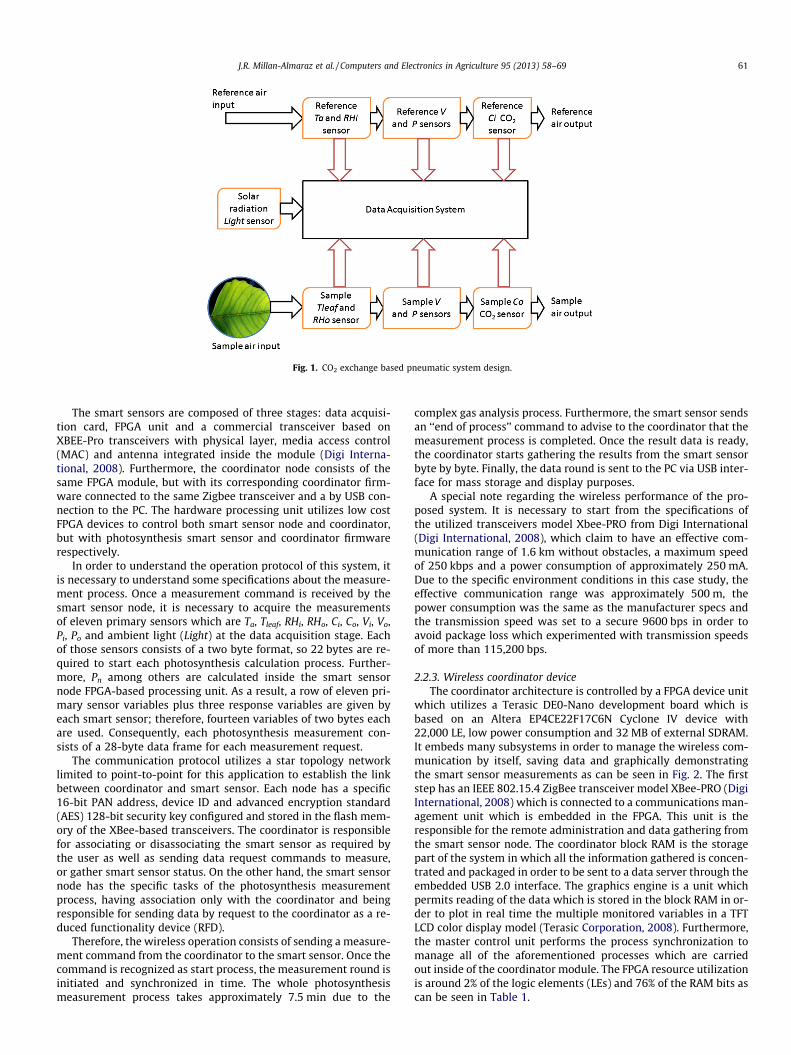
Fig. 1. CO2 exchange based pneumatic system design.
J.R. Millan-Almaraz et al. / Computers and Electronics in Agriculture 95 (2013) 58–69 61
The smart sensors are composed of three stages: data acquisi-tion card, FPGA unit and a commercial transceiver based onXBEE-Pro transceivers with physical layer, media access control(MAC) and antenna integrated inside the module (Digi Interna-tional, 2008). Furthermore, the coordinator node consists of thesame FPGA module, but with its corresponding coordinator firm-ware connected to the same Zigbee transceiver and a by USB con-nection to the PC. The hardware processing unit utilizes low costFPGA devices to control both smart sensor node and coordinator,but with photosynthesis smart sensor and coordinator firmwarerespectively.
In order to understand the operation protocol of this system, itis necessary to understand some specifications about the measure-ment process. Once a measurement command is received by thesmart sensor node, it is necessary to acquire the measurementsof eleven primary sensors which are Ta, Tleaf, RHi, RHo, Ci, Co, Vi, Vo,Pi, Po and ambient light (Light) at the data acquisition stage. Eachof those sensors consists of a two byte format, so 22 bytes are re-quired to start each photosynthesis calculation process. Further-more, Pn among others are calculated inside the smart sensornode FPGA-based processing unit. As a result, a row of eleven pri-mary sensor variables plus three response variables are given byeach smart sensor; therefore, fourteen variables of two bytes eachare used. Consequently, each photosynthesis measurement con-sists of a 28-byte data frame for each measurement request.
The communication protocol utilizes a star topology networklimited to point-to-point for this application to establish the linkbetween coordinator and smart sensor. Each node has a specific16-bit PAN address, device ID and advanced encryption standard(AES) 128-bit security key configured and stored in the flash mem-ory of the XBee-based transceivers. The coordinator is responsiblefor associating or disassociating the smart sensor as required bythe user as well as sending data request commands to measure,or gather smart sensor status. On the other hand, the smart sensornode has the specific tasks of the photosynthesis measurementprocess, having association only with the coordinator and beingresponsible for sending data by request to the coordinator as a re-duced functionality device (RFD).
Therefore, the wireless operation consists of sending a measure-ment command from the coordinator to the smart sensor. Once thecommand is recognized as start process, the measurement round isinitiated and synchronized in time. The whole photosynthesismeasurement process takes approximately 7.5 min due to the
complex gas analysis process. Furthermore, the smart sensor sendsan ‘‘end of process’’ command to advise to the coordinator that themeasurement process is completed. Once the result data is ready,the coordinator starts gathering the results from the smart sensorbyte by byte. Finally, the data round is sent to the PC via USB inter-face for mass storage and display purposes.
A special note regarding the wireless performance of the pro-posed system. It is necessary to start from the specifications ofthe utilized transceivers model Xbee-PRO from Digi International(Digi International, 2008), which claim to have an effective com-munication range of 1.6 km without obstacles, a maximum speedof 250 kbps and a power consumption of approximately 250 mA.Due to the specific environment conditions in this case study, theeffective communication range was approximately 500 m, thepower consumption was the same as the manufacturer specs andthe transmission speed was set to a secure 9600 bps in order toavoid package loss which experimented with transmission speedsof more than 115,200 bps.
2.2.3. Wireless coordinator deviceThe coordinator architecture is controlled by a FPGA device unit
which utilizes a Terasic DE0-Nano development board which isbased on an Altera EP4CE22F17C6N Cyclone IV device with22,000 LE, low power consumption and 32 MB of external SDRAM.It embeds many subsystems in order to manage the wireless com-munication by itself, saving data and graphically demonstratingthe smart sensor measurements as can be seen in Fig. 2. The firststep has an IEEE 802.15.4 ZigBee transceiver model XBee-PRO (DigiInternational, 2008) which is connected to a communications man-agement unit which is embedded in the FPGA. This unit is theresponsible for the remote administration and data gathering fromthe smart sensor node. The coordinator block RAM is the storagepart of the system in which all the information gathered is concen-trated and packaged in order to be sent to a data server through theembedded USB 2.0 interface. The graphics engine is a unit whichpermits reading of the data which is stored in the block RAM in or-der to plot in real time the multiple monitored variables in a TFTLCD color display model (Terasic Corporation, 2008). Furthermore,the master control unit performs the process synchronization tomanage all of the aforementioned processes which are carriedout inside of the coordinator module. The FPGA resource utilizationis around 2% of the logic elements (LEs) and 76% of the RAM bits ascan be seen in Table 1.
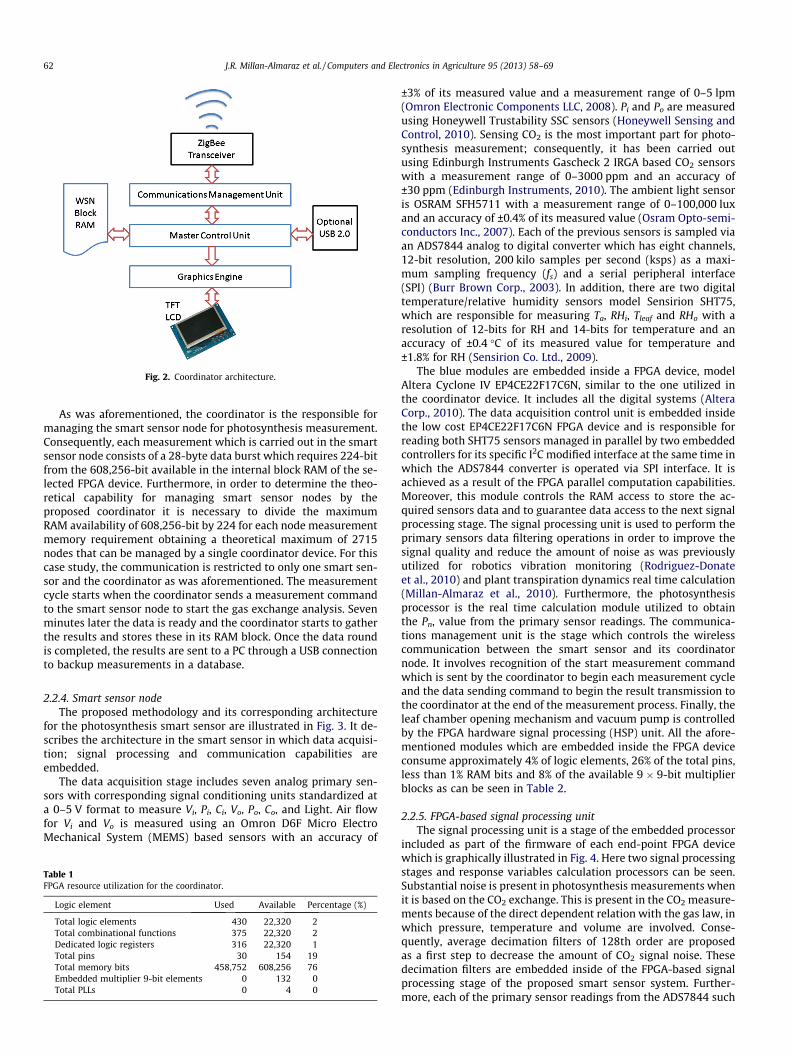
Fig. 2. Coordinator architecture.
62 J.R. Millan-Almaraz et al. / Computers and Electronics in Agriculture 95 (2013) 58–69
As was aforementioned, the coordinator is the responsible formanaging the smart sensor node for photosynthesis measurement.Consequently, each measurement which is carried out in the smartsensor node consists of a 28-byte data burst which requires 224-bitfrom the 608,256-bit available in the internal block RAM of the se-lected FPGA device. Furthermore, in order to determine the theo-retical capability for managing smart sensor nodes by theproposed coordinator it is necessary to divide the maximumRAM availability of 608,256-bit by 224 for each node measurementmemory requirement obtaining a theoretical maximum of 2715nodes that can be managed by a single coordinator device. For thiscase study, the communication is restricted to only one smart sen-sor and the coordinator as was aforementioned. The measurementcycle starts when the coordinator sends a measurement commandto the smart sensor node to start the gas exchange analysis. Sevenminutes later the data is ready and the coordinator starts to gatherthe results and stores these in its RAM block. Once the data roundis completed, the results are sent to a PC through a USB connectionto backup measurements in a database.
2.2.4. Smart sensor nodeThe proposed methodology and its corresponding architecture
for the photosynthesis smart sensor are illustrated in Fig. 3. It de-scribes the architecture in the smart sensor in which data acquisi-tion; signal processing and communication capabilities areembedded.
The data acquisition stage includes seven analog primary sen-sors with corresponding signal conditioning units standardized ata 0–5 V format to measure Vi, Pi, Ci, Vo, Po, Co, and Light. Air flowfor Vi and Vo is measured using an Omron D6F Micro ElectroMechanical System (MEMS) based sensors with an accuracy of
Table 1FPGA resource utilization for the coordinator.
Logic element Used Available Percentage (%)
Total logic elements 430 22,320 2Total combinational functions 375 22,320 2Dedicated logic registers 316 22,320 1Total pins 30 154 19Total memory bits 458,752 608,256 76Embedded multiplier 9-bit elements 0 132 0Total PLLs 0 4 0
±3% of its measured value and a measurement range of 0–5 lpm(Omron Electronic Components LLC, 2008). Pi and Po are measuredusing Honeywell Trustability SSC sensors (Honeywell Sensing andControl, 2010). Sensing CO2 is the most important part for photo-synthesis measurement; consequently, it has been carried outusing Edinburgh Instruments Gascheck 2 IRGA based CO2 sensorswith a measurement range of 0–3000 ppm and an accuracy of±30 ppm (Edinburgh Instruments, 2010). The ambient light sensoris OSRAM SFH5711 with a measurement range of 0–100,000 luxand an accuracy of ±0.4% of its measured value (Osram Opto-semi-conductors Inc., 2007). Each of the previous sensors is sampled viaan ADS7844 analog to digital converter which has eight channels,12-bit resolution, 200 kilo samples per second (ksps) as a maxi-mum sampling frequency (fs) and a serial peripheral interface(SPI) (Burr Brown Corp., 2003). In addition, there are two digitaltemperature/relative humidity sensors model Sensirion SHT75,which are responsible for measuring Ta, RHi, Tleaf and RHo with aresolution of 12-bits for RH and 14-bits for temperature and anaccuracy of ±0.4 �C of its measured value for temperature and±1.8% for RH (Sensirion Co. Ltd., 2009).
The blue modules are embedded inside a FPGA device, modelAltera Cyclone IV EP4CE22F17C6N, similar to the one utilized inthe coordinator device. It includes all the digital systems (AlteraCorp., 2010). The data acquisition control unit is embedded insidethe low cost EP4CE22F17C6N FPGA device and is responsible forreading both SHT75 sensors managed in parallel by two embeddedcontrollers for its specific I2C modified interface at the same time inwhich the ADS7844 converter is operated via SPI interface. It isachieved as a result of the FPGA parallel computation capabilities.Moreover, this module controls the RAM access to store the ac-quired sensors data and to guarantee data access to the next signalprocessing stage. The signal processing unit is used to perform theprimary sensors data filtering operations in order to improve thesignal quality and reduce the amount of noise as was previouslyutilized for robotics vibration monitoring (Rodriguez-Donateet al., 2010) and plant transpiration dynamics real time calculation(Millan-Almaraz et al., 2010). Furthermore, the photosynthesisprocessor is the real time calculation module utilized to obtainthe Pn, value from the primary sensor readings. The communica-tions management unit is the stage which controls the wirelesscommunication between the smart sensor and its coordinatornode. It involves recognition of the start measurement commandwhich is sent by the coordinator to begin each measurement cycleand the data sending command to begin the result transmission tothe coordinator at the end of the measurement process. Finally, theleaf chamber opening mechanism and vacuum pump is controlledby the FPGA hardware signal processing (HSP) unit. All the afore-mentioned modules which are embedded inside the FPGA deviceconsume approximately 4% of logic elements, 26% of the total pins,less than 1% RAM bits and 8% of the available 9 � 9-bit multiplierblocks as can be seen in Table 2.
2.2.5. FPGA-based signal processing unitThe signal processing unit is a stage of the embedded processor
included as part of the firmware of each end-point FPGA devicewhich is graphically illustrated in Fig. 4. Here two signal processingstages and response variables calculation processors can be seen.Substantial noise is present in photosynthesis measurements whenit is based on the CO2 exchange. This is present in the CO2 measure-ments because of the direct dependent relation with the gas law, inwhich pressure, temperature and volume are involved. Conse-quently, average decimation filters of 128th order are proposedas a first step to decrease the amount of CO2 signal noise. Thesedecimation filters are embedded inside of the FPGA-based signalprocessing stage of the proposed smart sensor system. Further-more, each of the primary sensor readings from the ADS7844 such

Fig. 3. Photosynthesis smart sensor architecture.
Table 2FPGA resource utilization for the smart sensor node.
Logic element Used Available Percentage (%)
Total logic elements 920 22,320 4Total combinational functions 846 22,320 4Dedicated logic registers 462 22,320 2Total pins 40 154 26Total memory bits 224 608,256 <1Embedded multiplier 9-bit elements 10 132 8Total PLLs 0 4 0
Fig. 4. FPGA signal processing and smart processor unit.
J.R. Millan-Almaraz et al. / Computers and Electronics in Agriculture 95 (2013) 58–69 63
as: Vi, Pi, Ci, Vo, Po, Co, and Light are introduced to the parallel dec-imation filters, oversampled and averaged 128 times in order to re-duce the quantization and undesired noise based on Eq. (3). Usingthis method, new signal versions of the primary sensor reading areobtained and distinguished from previous versions by utilizing the
suffix os, as occurs in (3) where X(k) can be any primary sensorreading introduced to the decimation filters and Xos(k) is the aver-age decimation filtered version of X(k).
XOSk
128
� �¼ 1
128
X128�1
i¼0
Xðk� iÞ ð3Þ
The Kalman filters are also embedded in the FPGA unit and its algo-rithm is based on Rodriguez-Donate et al. (2011) description whichis based on previously described equations (Marsland, 2009). TheKalman filter is based on statistical processing in which the filterobtains the next state of the signal called prediction and calculatesthe feedback that is used to apply the correction to the predictedstate which is presented in Eqs. (4) and (5). S is the matrix that re-lates the previous state and the estimated actual state, Q is thecovariance of the interest signal and P�(k) is the a priori estimatederror covariance.
X�ðkÞ ¼ S Xðk� 1Þ þ B uðk� 1Þ ð4Þ
P�ðkÞ ¼ S Pðk� 1ÞST þ Q ð5Þ
The correction stage is based on Eqs. (6)–(8) where R is the noisecovariance when the interest phenomenon is in steady state, H re-lates the sensor measurements (Z(k)) with the current state X(k),K(k), is the Kalman gain factor which is utilized to minimize the aposteriori error covariance (P(k)).
K ðkÞ ¼ P�ðkÞHT H P�ðkÞHT þ R� ��1
ð6Þ
X ðkÞ ¼ X�ðkÞ þ K ðkÞ ZðkÞ � H X�ðkÞð Þ ð7Þ
PðkÞ ¼ ðI � KðkÞ HÞ P�ðkÞ ð8Þ
Furthermore, Xos(k) oversampled signals are introduced in the Kal-man filters stage to obtain new filtered signals Xosk(k). To accom-plish this, S is considered to be an identity matrix, previous valuesX ¼ ½V�i osk; P
�i osk;C
�i osk;V
�o osk; P
�o osk;C
�o osk; and Light�osk�
T and sensormeasurement values Z = [Vi osk, Pi osk, Ci osk, Vo osk, Po osk, Co osk, andLightosk]T where Q is a diagonal matrix which contains the covari-ance of each Xos(k) signal. Therefore, R is also a diagonal matrix thatincludes the noise covariance of each variable. Finally, H is an iden-tity matrix.

64 J.R. Millan-Almaraz et al. / Computers and Electronics in Agriculture 95 (2013) 58–69
Once Xosk(k) signals are calculated, the net photosynthesis pro-cessor performs the Pn computation based on the primary sensorreadings. To accomplish this, W is calculated as a first step to con-vert from volumetric gas flow into mass gas flow. Consequently, Wis multiplied by the difference between carbon intake and carbonout in order to obtain Pn according to Eq. (2) as written above.
2.2.5.1. Net photosynthesis integration. It is frequently important toobtain quantitative assessment of plant growth, primary produc-tivity and the impact of climate change on vegetation. One wayto achieve this is by having knowledge of the crop carbon balancewhich is based in part on photosynthesis measurements (Albrizioand Steduto, 2003) based on responses of CO2 gains. Sakai et al.(2000) calculated carbon daily gain and carbon total gain duringan experiment by integrating the net photosynthesis and grossphotosynthesis measurements to study the impact of different lev-els of CO2 in rice. Choudhury, 2000 obtained gross photosynthesisby integrating instantaneous measurements to study the impact ofbiophysical parameters related to radiation use efficiency of wheatduring its vegetative period; similarly, Albrizio and Steduto (2003)correlated the generated biomass with cumulative photosynthesismeasurements to study carbon use and growth efficiency; conse-quently, in several studies it is important to associate the cropyield with the photosynthetic activity or obtain gross photosynthe-sis measurements by integrating instantaneous measurements inorder to have an indicator of the quantity of the production basedon the photosynthesis data or evaluate the impact of differenttreatments or management practices. Consequently, the realtime-carbon balance (rtcb) is a novel term that is proposed in thisresearch project as a new index which was obtained experimen-tally and can serve to indicate the accumulation of carbon due tothe photosynthetic activity. It can be calculated by obtaining theintegral of pn function as can be described in Eq. (9), where rtcbis the continuous time version. It can be utilized in future applica-tions to estimate, in real time, carbon fixing via accumulated pho-tosynthetic activity and carbon loses due to night respiration. Itpermits investigators to determine the carbohydrate accumulationin a way that can be utilized to determine the crop yield early;therefore, constituting a new tool for precision agriculture. In orderto have a digitally implementable equation of (9), it can be trans-lated to its discrete time version of real time carbon balance (RTCB)to obtain Eq. (10), where the integral is changed into an accumu-lated addition and obtaining the discrete time versions of the vari-ables such as: RTCB and Pn
rtcbðtÞ ¼Z b
apnðtÞ dt ð9Þ
RTCBðkÞ ¼XN
k¼0
PnðkÞ ð10Þ
2.2.5.2. Net photosynthesis first derivative. The study of growth effi-ciency of the plants and the impact of different treatments in bio-mass production results are of great importance in agriculturalinvestigations (Sakai et al., 2000; Albrizio and Steduto, 2003). Al-brizio and Steduto (2003) obtained the slope of regressions be-tween photosynthesis and respiration measurements to evaluatethe carbon use and growth efficiency of certain C3 and C4 plants.Consequently, the first derivative factor of net photosynthesis incontinuous time (p0n) and its discrete time version (P0n) as anothernovel indicator obtained through experimentation to analyze di-verse phenomena involved in the changes of photosynthetic activ-ity such as the carbon use and growth efficiency is proposedherein. This index can also be used in future investigations toanalyze and quantify the effect of different treatments and
management practices on the rate of photosynthetic activity inplants. p0n is calculated by performing the first derivative of pn asis established in Eq. (11). As occurred with RTCB, in order to be ableto implement p0n in a digital system it is necessary to obtain its dis-crete time version P0n which result from Eq. (12).
p0n ¼pn
dtð11Þ
P0nðkÞ ¼ PnðkÞ � Pnðk� 1Þ ð12Þ
2.3. Photosynthesis smart sensor and commercial equipment
Once the proposed photosynthesis smart sensor was explainedin the previous sections, it is necessary to clarify the advantagesand disadvantages of the proposed project in comparison withcommercial equipment alternatives. In Table 3, it can be observeda detailed comparison of the main characteristics between com-mercial photosynthesis monitoring systems and the proposedsmart sensor. Here can be observed a similar tendency in thecommercial equipment by having only one leaf chamber, micro-processor based system and non-automated leaf chamber mecha-nism in the Li-6400XT (LI-COR Inc., 2010), CIRAS-2 (PP Systems,2012), CI-340 (CID Inc., 2008) and GFS-3000 (Heinz Walz GmbH,2012). Also, they have similar communication interfaces such asRS232, RS485 and USB connection and lack of wireless capability.The PTM-48M is a little bit different by having four leaf chamberwhich are automated by a pneumatic mechanism but have lessmemory capacity to store data and delivers less response vari-ables (Phytech Inc., 2005). In contrast, the proposed wirelesssmart sensor for photosynthesis monitoring have wireless capa-bility to communicate between the data storage computer andthe smart sensor, allowing to be deployed in the field as a stand-alone device due to its automated leaf chamber mechanismwhich is based in a miniature servomotor. Another significantadvantage of the proposed system is the use on a FPGA deviceas digital controller which allows performing digital signal pro-cessing in situ to add complex digital filtering stages such as128 order oversampling and Kalman filters to improve signalquality which is difficult to be implemented in a microprocessorbased system. Furthermore, two novel indexes can be calculatedby the proposed system which are RTCB and P0n to describe addi-tional photosynthesis related information.
2.4. Experiment setup
In this section, the experiment setup which is utilized to testthe proposed photosynthesis smart sensor is presented. This in-cludes the primary sensor reading results and its correspondingsignal processing treatments to improve these signals plus a gra-phic comparison in the primary sensor signals X(k), Xos(k) andXosk(k). Further, a subsection to include the photosynthesis realtime analysis and its results is also presented. Finally, the lastsubsection presents results to detect on line and in real time pho-tosynthesis stress conditions which can hinder achieving a goodPn rate.
The experiment setup can be seen in Fig. 5 and it is based oncoordinator linked to smart sensor architecture. The smart sensordevice was based on the aforementioned DAS where both refer-ence and leaf sample air was analyzed by the temperature, RH,pressure, flow and CO2 sensors. The DAS is controlled via SPI inthe FPGA unit. As biological material, a C. annuum L. plant is uti-lized as case study. In order to induce photosynthesis related activ-ity on the plant sample, a high pressure sodium lamp (HPSL)capable of supplying a 10,000 lux artificial light source is utilizedto excite the plant sample. The lamp was controlled by the FPGA,
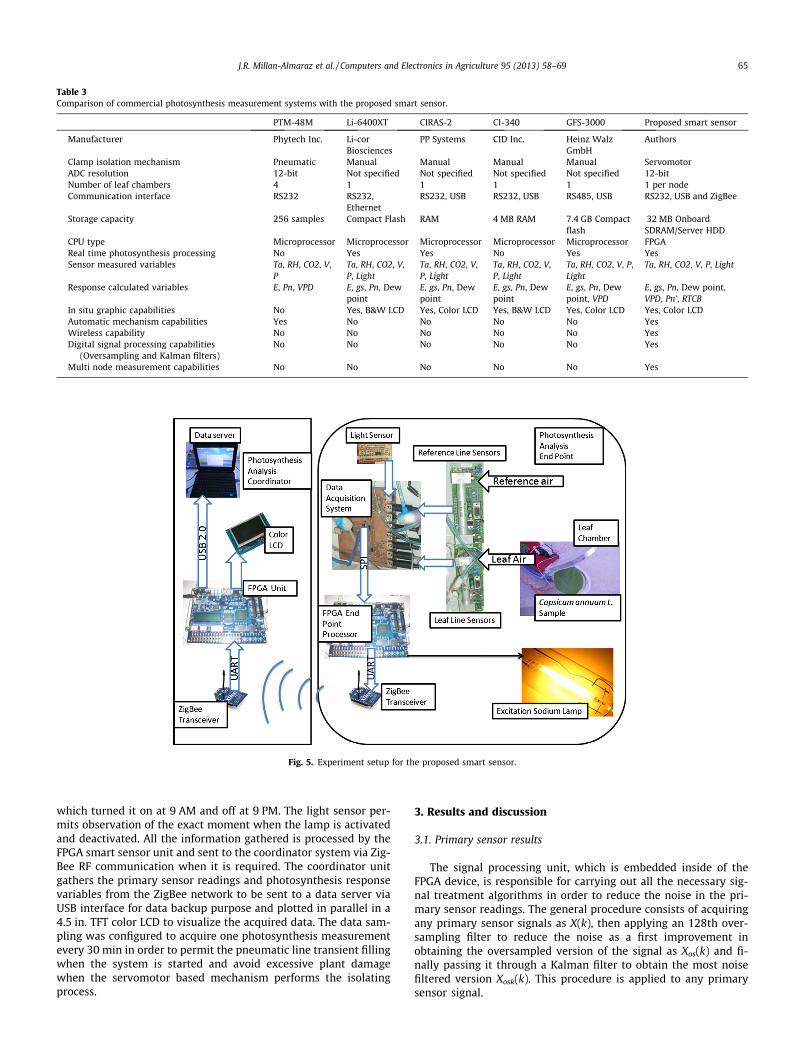
Table 3Comparison of commercial photosynthesis measurement systems with the proposed smart sensor.
PTM-48M Li-6400XT CIRAS-2 CI-340 GFS-3000 Proposed smart sensor
Manufacturer Phytech Inc. Li-corBiosciences
PP Systems CID Inc. Heinz WalzGmbH
Authors
Clamp isolation mechanism Pneumatic Manual Manual Manual Manual ServomotorADC resolution 12-bit Not specified Not specified Not specified Not specified 12-bitNumber of leaf chambers 4 1 1 1 1 1 per nodeCommunication interface RS232 RS232,
EthernetRS232, USB RS232, USB RS485, USB RS232, USB and ZigBee
Storage capacity 256 samples Compact Flash RAM 4 MB RAM 7.4 GB Compactflash
32 MB OnboardSDRAM/Server HDD
CPU type Microprocessor Microprocessor Microprocessor Microprocessor Microprocessor FPGAReal time photosynthesis processing No Yes Yes No Yes YesSensor measured variables Ta, RH, CO2, V,
PTa, RH, CO2, V,P, Light
Ta, RH, CO2, V,P, Light
Ta, RH, CO2, V,P, Light
Ta, RH, CO2, V, P,Light
Ta, RH, CO2, V, P, Light
Response calculated variables E, Pn, VPD E, gs, Pn, Dewpoint
E, gs, Pn, Dewpoint
E, gs, Pn, Dewpoint
E, gs, Pn, Dewpoint, VPD
E, gs, Pn, Dew point,VPD, Pn’, RTCB
In situ graphic capabilities No Yes, B&W LCD Yes, Color LCD Yes, B&W LCD Yes, Color LCD Yes, Color LCDAutomatic mechanism capabilities Yes No No No No YesWireless capability No No No No No YesDigital signal processing capabilities
(Oversampling and Kalman filters)No No No No No Yes
Multi node measurement capabilities No No No No No Yes
Fig. 5. Experiment setup for the proposed smart sensor.
J.R. Millan-Almaraz et al. / Computers and Electronics in Agriculture 95 (2013) 58–69 65
which turned it on at 9 AM and off at 9 PM. The light sensor per-mits observation of the exact moment when the lamp is activatedand deactivated. All the information gathered is processed by theFPGA smart sensor unit and sent to the coordinator system via Zig-Bee RF communication when it is required. The coordinator unitgathers the primary sensor readings and photosynthesis responsevariables from the ZigBee network to be sent to a data server viaUSB interface for data backup purpose and plotted in parallel in a4.5 in. TFT color LCD to visualize the acquired data. The data sam-pling was configured to acquire one photosynthesis measurementevery 30 min in order to permit the pneumatic line transient fillingwhen the system is started and avoid excessive plant damagewhen the servomotor based mechanism performs the isolatingprocess.
3. Results and discussion
3.1. Primary sensor results
The signal processing unit, which is embedded inside of theFPGA device, is responsible for carrying out all the necessary sig-nal treatment algorithms in order to reduce the noise in the pri-mary sensor readings. The general procedure consists of acquiringany primary sensor signals as X(k), then applying an 128th over-sampling filter to reduce the noise as a first improvement inobtaining the oversampled version of the signal as Xos(k) and fi-nally passing it through a Kalman filter to obtain the most noisefiltered version Xosk(k). This procedure is applied to any primarysensor signal.

Fig. 6. Difference between CO2 signals. (a) CO2 signal acquired directly from the CO2 gas analyzer. (b) Intermediate CO2 signal obtained by filtering previous signal throughthe oversampling filter. (c) Final CO2 signal obtained by filtering the previous CO2 oversampled signal through Kalman filter.
66 J.R. Millan-Almaraz et al. / Computers and Electronics in Agriculture 95 (2013) 58–69
In photosynthesis measurement, it is very difficult to obtain agood Pn estimation results due to the CO2 sensors low stability.An example of this is the fact that, commercial CO2 sensors haveaccuracies of ±100 ppm to as low as ±20 ppm with a pricing in-crease when the accuracy is better. The main problem is that pho-tosynthesis is a phenomenon in which the carbon fixing rates areapproximately less than 1–50 ppm with typical fixing of 5 ppm.Consequently, it can be inferred that it is impossible to measure re-sults of a phenomenon in which the interest measurement is a dif-ference of 5 ppm using a sensor with ±100 ppm of noise.Consequently, advanced signal processing techniques are appliedto the CO2 readings as example of the rest of the primary sensorsbecause this sensor is the noisiest. In Fig. 6, three signals can beseen. The black one represents the original CO2 sampling signalsampled at 1 sample per second (SPS). Here, a large amount ofglitches at the star of the measurements can be noticed due tothe CO2 sensor accuracy, gas law noise which can be derived frompressure, flow, and temperature. It is noteworthy that moistureinterferes with the IRGA sensor infrared absorption principle be-cause hetero-atomic molecules such as CO2 or also H2O can absorbthe infrared radiation. All of this results in a very noisy black signalwhich must be digitally filtered. As a result, the aforementioned128th average decimation filter is applied to the black signal andthe red signal is obtained as a first stage filtered signal where theinitial glitches are reduced as a consequence of the oversamplingprocess in which 128 samples were taken averaged and finally onlyone result is delivered at its output. Furthermore, the red signal isintroduced to a Kalman filter stage which is fine tuned to track andfilter the CO2 signal resulting in a very clear CO2 measurement inwhich the accuracy noise and other perturbations are eliminated.This result in a new blue signal that has the necessary stabilityto be used for photosynthesis measurement purposes in which5 ppm differences between Ci and Co are common differences andnoisy sensors are not suitable to measure this.
3.2. Acquisition of primary sensor signals
As a result of the requirement to have a new smart sensor thatfuses many primary sensor signals, a novel photosynthesis smartsensor is proposed in order to be able to measure photosynthesisin real time that possesses graphic visualization, instant valuemeasurement and longtime data logging capabilities in a multi-point instrumentation scheme. The results of the acquired signalsat the output of the Kalman filters can be seen in Fig. 7. These sig-nals from the primary sensors of temperature, moisture to namebut a few which are required to calculate the photosynthesis re-lated variables such as Pn, RTCB and P0n. This acquisition processwas carried out in a 1 week monitoring cycle to be able to demon-strate day and night changes in the data. It includes air and leaftemperature measurement, moisture, air flow, carbon dioxideand ambient light. Furthermore, these signals are introduced tothe processing unit in the FPGAs of the smart sensor unit to con-tinue with the processing stage to calculate the photosynthesis re-lated information.
3.3. Fused real time photosynthesis analysis
Due to the parallel and reconfigurable capabilities of the FPGAbased smart sensor, a new methodology for real time photosynthe-sis analysis which involves many factors such as Pn, RTCB and P0n tobetter explain all the photosynthesis related phenomena that oc-curs in plants is proposed. A light measurement is included in thisfused analysis to track the photosynthesis process and its excita-tion light source activity. In Fig. 8 a graphical description of thefused photosynthesis analysis is presented.
3.3.1. Photosynthesis resultsFirst, the light primary reading can be seen in order to track the
excitation light source. It is noteworthy that this process was
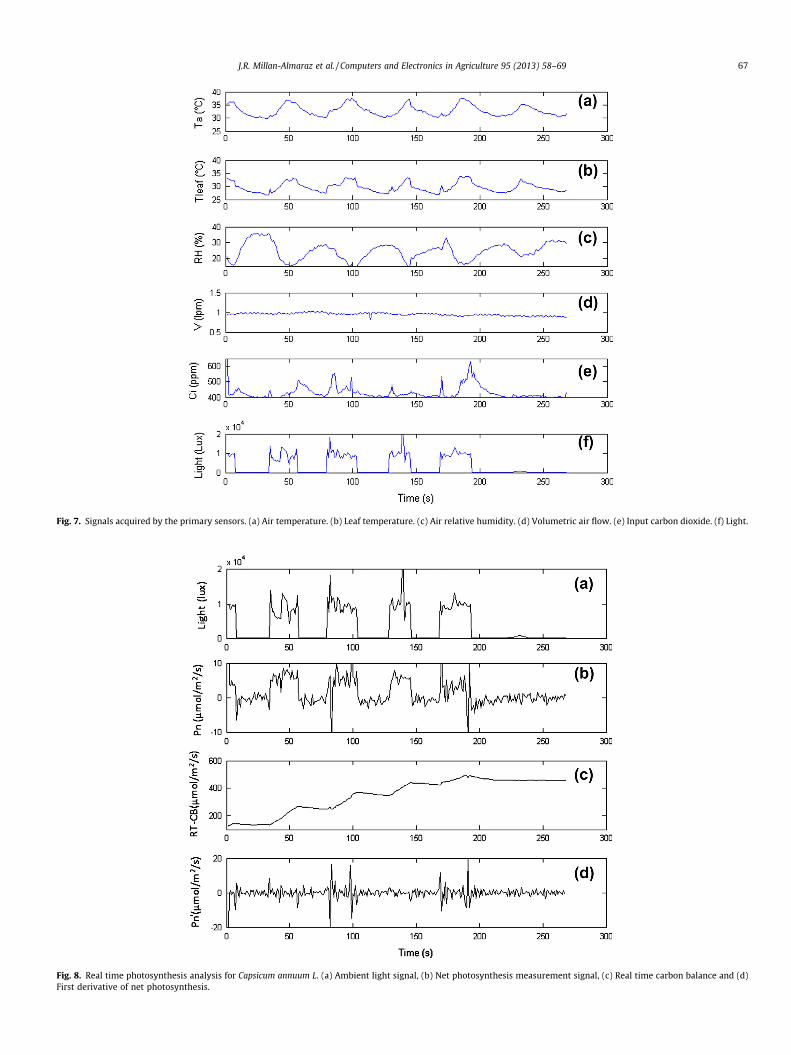
Fig. 7. Signals acquired by the primary sensors. (a) Air temperature. (b) Leaf temperature. (c) Air relative humidity. (d) Volumetric air flow. (e) Input carbon dioxide. (f) Light.
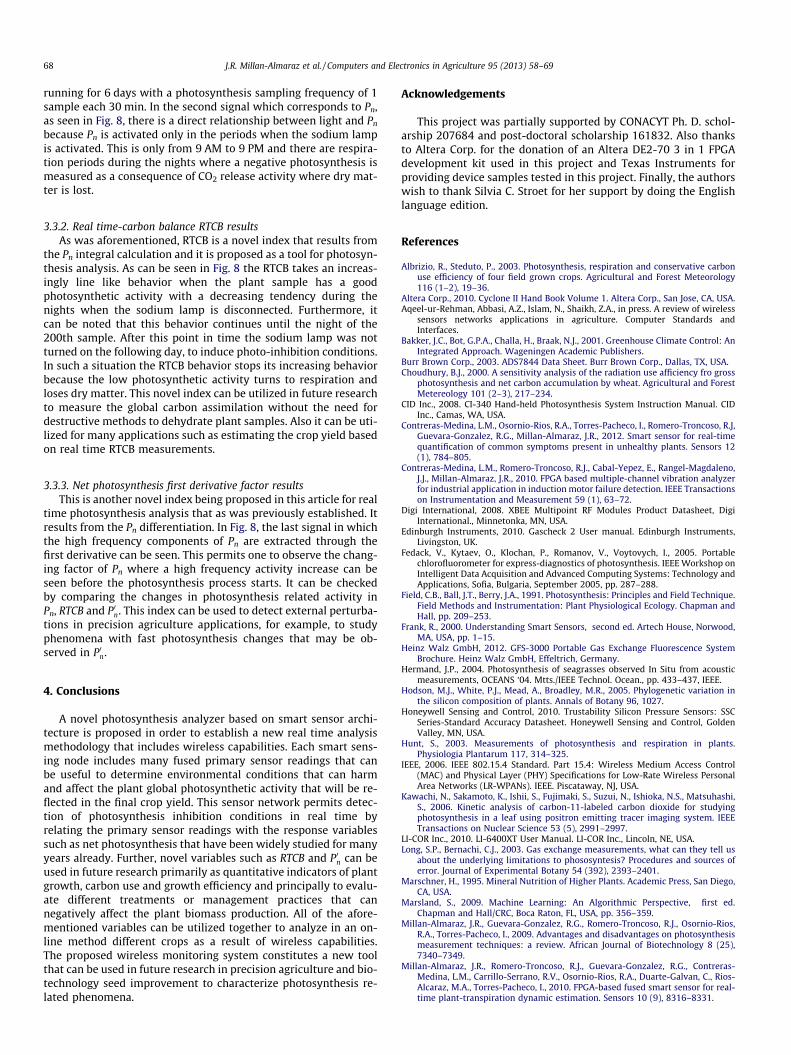
Fig. 8. Real time photosynthesis analysis for Capsicum annuum L. (a) Ambient light signal, (b) Net photosynthesis measurement signal, (c) Real time carbon balance and (d)First derivative of net photosynthesis.
J.R. Millan-Almaraz et al. / Computers and Electronics in Agriculture 95 (2013) 58–69 67
68 J.R. Millan-Almaraz et al. / Computers and Electronics in Agriculture 95 (2013) 58–69
running for 6 days with a photosynthesis sampling frequency of 1sample each 30 min. In the second signal which corresponds to Pn,as seen in Fig. 8, there is a direct relationship between light and Pn
because Pn is activated only in the periods when the sodium lampis activated. This is only from 9 AM to 9 PM and there are respira-tion periods during the nights where a negative photosynthesis ismeasured as a consequence of CO2 release activity where dry mat-ter is lost.
3.3.2. Real time-carbon balance RTCB resultsAs was aforementioned, RTCB is a novel index that results from
the Pn integral calculation and it is proposed as a tool for photosyn-thesis analysis. As can be seen in Fig. 8 the RTCB takes an increas-ingly line like behavior when the plant sample has a goodphotosynthetic activity with a decreasing tendency during thenights when the sodium lamp is disconnected. Furthermore, itcan be noted that this behavior continues until the night of the200th sample. After this point in time the sodium lamp was notturned on the following day, to induce photo-inhibition conditions.In such a situation the RTCB behavior stops its increasing behaviorbecause the low photosynthetic activity turns to respiration andloses dry matter. This novel index can be utilized in future researchto measure the global carbon assimilation without the need fordestructive methods to dehydrate plant samples. Also it can be uti-lized for many applications such as estimating the crop yield basedon real time RTCB measurements.
3.3.3. Net photosynthesis first derivative factor resultsThis is another novel index being proposed in this article for real
time photosynthesis analysis that as was previously established. Itresults from the Pn differentiation. In Fig. 8, the last signal in whichthe high frequency components of Pn are extracted through thefirst derivative can be seen. This permits one to observe the chang-ing factor of Pn where a high frequency activity increase can beseen before the photosynthesis process starts. It can be checkedby comparing the changes in photosynthesis related activity inPn, RTCB and P0n. This index can be used to detect external perturba-tions in precision agriculture applications, for example, to studyphenomena with fast photosynthesis changes that may be ob-served in P0n.
4. Conclusions
A novel photosynthesis analyzer based on smart sensor archi-tecture is proposed in order to establish a new real time analysismethodology that includes wireless capabilities. Each smart sens-ing node includes many fused primary sensor readings that canbe useful to determine environmental conditions that can harmand affect the plant global photosynthetic activity that will be re-flected in the final crop yield. This sensor network permits detec-tion of photosynthesis inhibition conditions in real time byrelating the primary sensor readings with the response variablessuch as net photosynthesis that have been widely studied for manyyears already. Further, novel variables such as RTCB and P0n can beused in future research primarily as quantitative indicators of plantgrowth, carbon use and growth efficiency and principally to evalu-ate different treatments or management practices that cannegatively affect the plant biomass production. All of the afore-mentioned variables can be utilized together to analyze in an on-line method different crops as a result of wireless capabilities.The proposed wireless monitoring system constitutes a new toolthat can be used in future research in precision agriculture and bio-technology seed improvement to characterize photosynthesis re-lated phenomena.
Acknowledgements
This project was partially supported by CONACYT Ph. D. schol-arship 207684 and post-doctoral scholarship 161832. Also thanksto Altera Corp. for the donation of an Altera DE2-70 3 in 1 FPGAdevelopment kit used in this project and Texas Instruments forproviding device samples tested in this project. Finally, the authorswish to thank Silvia C. Stroet for her support by doing the Englishlanguage edition.
References
Albrizio, R., Steduto, P., 2003. Photosynthesis, respiration and conservative carbonuse efficiency of four field grown crops. Agricultural and Forest Meteorology116 (1–2), 19–36.
Altera Corp., 2010. Cyclone II Hand Book Volume 1. Altera Corp., San Jose, CA, USA.Aqeel-ur-Rehman, Abbasi, A.Z., Islam, N., Shaikh, Z.A., in press. A review of wireless
sensors networks applications in agriculture. Computer Standards andInterfaces.
Bakker, J.C., Bot, G.P.A., Challa, H., Braak, N.J., 2001. Greenhouse Climate Control: AnIntegrated Approach. Wageningen Academic Publishers.
Burr Brown Corp., 2003. ADS7844 Data Sheet. Burr Brown Corp., Dallas, TX, USA.Choudhury, B.J., 2000. A sensitivity analysis of the radiation use afficiency fro gross
photosynthesis and net carbon accumulation by wheat. Agricultural and ForestMetereology 101 (2–3), 217–234.
CID Inc., 2008. CI-340 Hand-held Photosynthesis System Instruction Manual. CIDInc., Camas, WA, USA.
Contreras-Medina, L.M., Osornio-Rios, R.A., Torres-Pacheco, I., Romero-Troncoso, R.J,Guevara-Gonzalez, R.G., Millan-Almaraz, J.R., 2012. Smart sensor for real-timequantification of common symptoms present in unhealthy plants. Sensors 12(1), 784–805.
Contreras-Medina, L.M., Romero-Troncoso, R.J., Cabal-Yepez, E., Rangel-Magdaleno,J.J., Millan-Almaraz, J.R., 2010. FPGA based multiple-channel vibration analyzerfor industrial application in induction motor failure detection. IEEE Transactionson Instrumentation and Measurement 59 (1), 63–72.
Digi International, 2008. XBEE Multipoint RF Modules Product Datasheet, DigiInternational., Minnetonka, MN, USA.
Edinburgh Instruments, 2010. Gascheck 2 User manual. Edinburgh Instruments,Livingston, UK.
Fedack, V., Kytaev, O., Klochan, P., Romanov, V., Voytovych, I., 2005. Portablechlorofluorometer for express-diagnostics of photosynthesis. IEEE Workshop onIntelligent Data Acquisition and Advanced Computing Systems: Technology andApplications, Sofia, Bulgaria, September 2005, pp. 287–288.
Field, C.B., Ball, J.T., Berry, J.A., 1991. Photosynthesis: Principles and Field Technique.Field Methods and Instrumentation: Plant Physiological Ecology. Chapman andHall, pp. 209–253.
Frank, R., 2000. Understanding Smart Sensors, second ed. Artech House, Norwood,MA, USA, pp. 1–15.
Heinz Walz GmbH, 2012. GFS-3000 Portable Gas Exchange Fluorescence SystemBrochure. Heinz Walz GmbH, Effeltrich, Germany.
Hermand, J.P., 2004. Photosynthesis of seagrasses observed In Situ from acousticmeasurements, OCEANS ‘04. Mtts./IEEE Technol. Ocean., pp. 433–437, IEEE.
Hodson, M.J., White, P.J., Mead, A., Broadley, M.R., 2005. Phylogenetic variation inthe silicon composition of plants. Annals of Botany 96, 1027.
Honeywell Sensing and Control, 2010. Trustability Silicon Pressure Sensors: SSCSeries-Standard Accuracy Datasheet. Honeywell Sensing and Control, GoldenValley, MN, USA.
Hunt, S., 2003. Measurements of photosynthesis and respiration in plants.Physiologia Plantarum 117, 314–325.
IEEE, 2006. IEEE 802.15.4 Standard. Part 15.4: Wireless Medium Access Control(MAC) and Physical Layer (PHY) Specifications for Low-Rate Wireless PersonalArea Networks (LR-WPANs). IEEE. Piscataway, NJ, USA.
Kawachi, N., Sakamoto, K., Ishii, S., Fujimaki, S., Suzui, N., Ishioka, N.S., Matsuhashi,S., 2006. Kinetic analysis of carbon-11-labeled carbon dioxide for studyingphotosynthesis in a leaf using positron emitting tracer imaging system. IEEETransactions on Nuclear Science 53 (5), 2991–2997.
LI-COR Inc., 2010. LI-6400XT User Manual. LI-COR Inc., Lincoln, NE, USA.Long, S.P., Bernachi, C.J., 2003. Gas exchange measurements, what can they tell us
about the underlying limitations to phososyntesis? Procedures and sources oferror. Journal of Experimental Botany 54 (392), 2393–2401.
Marschner, H., 1995. Mineral Nutrition of Higher Plants. Academic Press, San Diego,CA, USA.
Marsland, S., 2009. Machine Learning: An Algorithmic Perspective, first ed.Chapman and Hall/CRC, Boca Raton, FL, USA, pp. 356–359.
Millan-Almaraz, J.R., Guevara-Gonzalez, R.G., Romero-Troncoso, R.J., Osornio-Rios,R.A., Torres-Pacheco, I., 2009. Advantages and disadvantages on photosynthesismeasurement techniques: a review. African Journal of Biotechnology 8 (25),7340–7349.
Millan-Almaraz, J.R., Romero-Troncoso, R.J., Guevara-Gonzalez, R.G., Contreras-Medina, L.M., Carrillo-Serrano, R.V., Osornio-Rios, R.A., Duarte-Galvan, C., Rios-Alcaraz, M.A., Torres-Pacheco, I., 2010. FPGA-based fused smart sensor for real-time plant-transpiration dynamic estimation. Sensors 10 (9), 8316–8331.
J.R. Millan-Almaraz et al. / Computers and Electronics in Agriculture 95 (2013) 58–69 69
Moreno-Tapia, S.V., Vera-Salas, L.A., Osornio-Rios, R.A., Dominguez-Gonzalez, A.,Stiharu, I., Romero-Troncoso, R.J., 2010. A field programmable gate array-basedreconfigurable smart-sensor network for wireless monitoring of newgeneration computer numerically controlled machines. Sensors 10 (8), 7263–7286.
Omron Electronic Components LLC, 2008. MEMS Flow Sensor D6F-01/02/05Datasheet. OMRON Electronic Components LLC, Schaumburg, IL, USA.
Osram Opto Semiconductors Inc., 2007. SFH-5711 Data sheet. OSRAM OptoSemiconductors Inc., Munich, Germany.
Phytech Inc, 2005. PTM-48M User Manual. Phytech Inc., Yad Mordechai, Israel.Systems, P.P., 2012. CIRAS-2 User Manual. PP Systems, Amesbury, MA, USA.Rivera, J., Herrera, G., Chacon, M., Acosta, P., Carillo, M., 2008. Improved progressive
pilynomial algorithm for self-adjustment and optimal response in intelligentsensors. Sensors 8 (11), 7410–7427.
Rodriguez-Donate, C., Morales-Velazquez, L., Osornio-Rios, R.A., Herrera-Ruiz, G.,Romero-Troncoso, R.J., 2010. FPGA-based fused smart sensor for dynamic andvibration parameter extraction in industrial robot links. Sensors 10 (4), 4114–4129.
Rodriguez-Donate, C., Osornio-Rios, R.A., Rivera-Guillen, J.R., Romero-Troncoso, R.J.,2011. Fused smart sensor network for multi-axis forward kinematics estimationin industrial robots. Sensors 11 (4), 4335–4357.
Sakai, H., Yagi, K., Kobayashi, K., Kawashima, S., 2000. Rice carbon balance underelevated CO2. New Phytologist 150 (2), 241–249.
Sayed, O.H., 2003. Chlorophyll fluorescence as a tool in cereal crop research.Photosynthetica 41 (3), 321–330.
Schulze, E.D., 1972. A new type of climatized gas exchange chamber for netphotosynthesis and transpiration measurements in the field. Oecologia 10, 243–251.
Sensirion Co. Ltd., 2009. Datasheet SHT7x (SHT71, SHT75) Humidity andTemperature Sensor. Sensirion Co. Ltd., Staefa, ZH, Switzerland.
Stout, M.J., Fidantsef, A.L., Duffey, S.S., Bostock, R.M., 1999. Signal interactions inpathogen and insect attack: systemic plant-mediated interactions betweenpathogens and hervibores of the tomato, Lycopersicon esculentum. Physiologicaland Molecular Plant Pathology 54 (3–4), 115–130.
Taiz, L., Zeiger, E., 2002. Plant Physiology, fifth ed. Sinauer Associates, SunderlandMass, pp. 111–192.
Takahashi, M., Ishiji, T., Kawashima, N., 2001. Handmade oxygen and carbon dioxidesensors for monitoring the photosynthesis process as instruction material forscience education. Sensors Actuators B 77, 237–243.
Corporation, Terasic., 2008. LTM User Manual. Terasic Corporation, Hsinchu, TW.Ton, Y., Kopyt, M., Nilov, N., 2004. Phytomonitoring technique for tuning irrigation
of vineyards. Acta Horticulturae 646, 133–139.Torres-Pacheco, I., Gonzalez-Chavira, M.M., Villaseñor-Mir, H.E., Huerta-Espino, J.,
Villordo-Pineda, E., Espitia-Rangel, E., Guevara-Gonzalez, R., 2007. Geneticmarkers of resistance to rust stem (Puccinia graminis Persoon f. sp. avenae) inoat (Avena sativa L.). Agricultura Técnica en México 33 (3), 221–230.
Wang, C., Xing, D., Chen, Q., 2004. A novel method for measuring photosynthesisusing delayed fluorescence of chloroplast. Biosensors and Bioelectronics 20 (3),pp. 454–259.
Related Documents