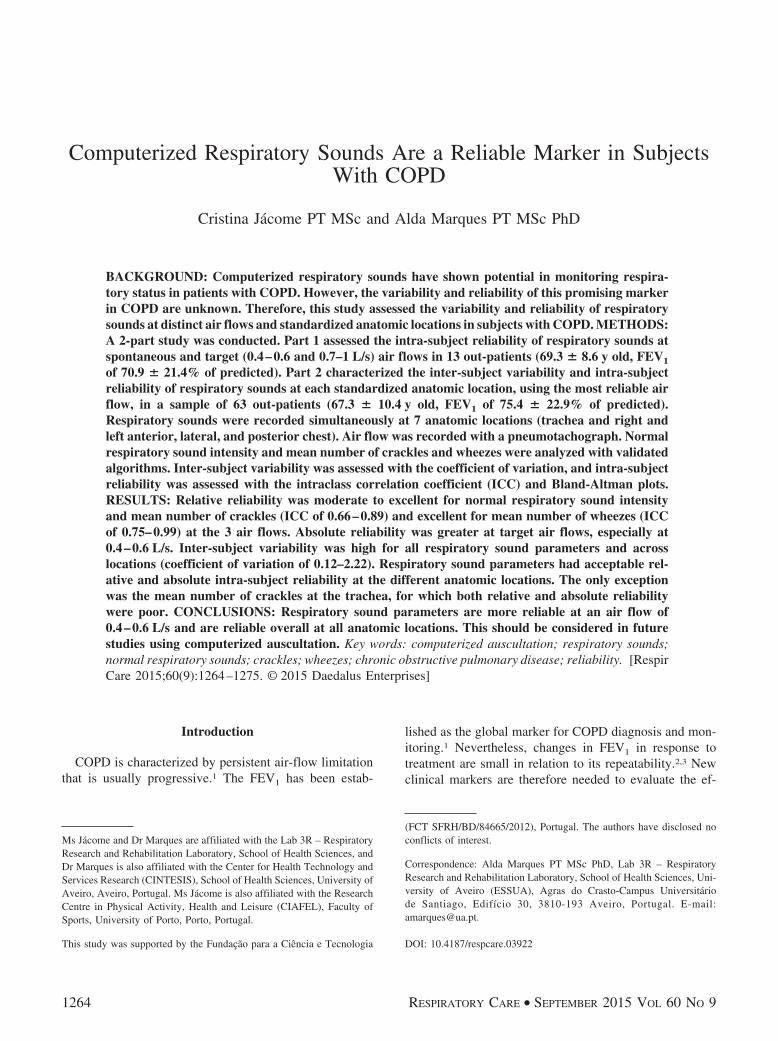
Computerized Respiratory Sounds Are a Reliable Marker in Subjects With COPD Cristina Ja ´come PT MSc and Alda Marques PT MSc PhD BACKGROUND: Computerized respiratory sounds have shown potential in monitoring respira- tory status in patients with COPD. However, the variability and reliability of this promising marker in COPD are unknown. Therefore, this study assessed the variability and reliability of respiratory sounds at distinct air flows and standardized anatomic locations in subjects with COPD. METHODS: A 2-part study was conducted. Part 1 assessed the intra-subject reliability of respiratory sounds at spontaneous and target (0.4 – 0.6 and 0.7–1 L/s) air flows in 13 out-patients (69.3 8.6 y old, FEV 1 of 70.9 21.4% of predicted). Part 2 characterized the inter-subject variability and intra-subject reliability of respiratory sounds at each standardized anatomic location, using the most reliable air flow, in a sample of 63 out-patients (67.3 10.4 y old, FEV 1 of 75.4 22.9% of predicted). Respiratory sounds were recorded simultaneously at 7 anatomic locations (trachea and right and left anterior, lateral, and posterior chest). Air flow was recorded with a pneumotachograph. Normal respiratory sound intensity and mean number of crackles and wheezes were analyzed with validated algorithms. Inter-subject variability was assessed with the coefficient of variation, and intra-subject reliability was assessed with the intraclass correlation coefficient (ICC) and Bland-Altman plots. RESULTS: Relative reliability was moderate to excellent for normal respiratory sound intensity and mean number of crackles (ICC of 0.66 – 0.89) and excellent for mean number of wheezes (ICC of 0.75– 0.99) at the 3 air flows. Absolute reliability was greater at target air flows, especially at 0.4 – 0.6 L/s. Inter-subject variability was high for all respiratory sound parameters and across locations (coefficient of variation of 0.12–2.22). Respiratory sound parameters had acceptable rel- ative and absolute intra-subject reliability at the different anatomic locations. The only exception was the mean number of crackles at the trachea, for which both relative and absolute reliability were poor. CONCLUSIONS: Respiratory sound parameters are more reliable at an air flow of 0.4 – 0.6 L/s and are reliable overall at all anatomic locations. This should be considered in future studies using computerized auscultation. Key words: computerized auscultation; respiratory sounds; normal respiratory sounds; crackles; wheezes; chronic obstructive pulmonary disease; reliability. [Respir Care 2015;60(9):1264 –1275. © 2015 Daedalus Enterprises] Introduction COPD is characterized by persistent air-flow limitation that is usually progressive. 1 The FEV 1 has been estab- lished as the global marker for COPD diagnosis and mon- itoring. 1 Nevertheless, changes in FEV 1 in response to treatment are small in relation to its repeatability. 2,3 New clinical markers are therefore needed to evaluate the ef- Ms Ja ´come and Dr Marques are affiliated with the Lab 3R – Respiratory Research and Rehabilitation Laboratory, School of Health Sciences, and Dr Marques is also affiliated with the Center for Health Technology and Services Research (CINTESIS), School of Health Sciences, University of Aveiro, Aveiro, Portugal. Ms Ja ´come is also affiliated with the Research Centre in Physical Activity, Health and Leisure (CIAFEL), Faculty of Sports, University of Porto, Porto, Portugal. This study was supported by the Fundac ¸a ˜o para a Cie ˆncia e Tecnologia (FCT SFRH/BD/84665/2012), Portugal. The authors have disclosed no conflicts of interest. Correspondence: Alda Marques PT MSc PhD, Lab 3R – Respiratory Research and Rehabilitation Laboratory, School of Health Sciences, Uni- versity of Aveiro (ESSUA), Agras do Crasto-Campus Universita ´rio de Santiago, Edifício 30, 3810-193 Aveiro, Portugal. E-mail: [email protected]. DOI: 10.4187/respcare.03922 1264 RESPIRATORY CARE • SEPTEMBER 2015 VOL 60 NO 9

Welcome message from author
This document is posted to help you gain knowledge. Please leave a comment to let me know what you think about it! Share it to your friends and learn new things together.
Transcript
Computerized Respiratory Sounds Are a Reliable Marker in SubjectsWith COPD
Cristina Jacome PT MSc and Alda Marques PT MSc PhD
BACKGROUND: Computerized respiratory sounds have shown potential in monitoring respira-tory status in patients with COPD. However, the variability and reliability of this promising markerin COPD are unknown. Therefore, this study assessed the variability and reliability of respiratorysounds at distinct air flows and standardized anatomic locations in subjects with COPD. METHODS:A 2-part study was conducted. Part 1 assessed the intra-subject reliability of respiratory sounds atspontaneous and target (0.4–0.6 and 0.7–1 L/s) air flows in 13 out-patients (69.3 � 8.6 y old, FEV1
of 70.9 � 21.4% of predicted). Part 2 characterized the inter-subject variability and intra-subjectreliability of respiratory sounds at each standardized anatomic location, using the most reliable airflow, in a sample of 63 out-patients (67.3 � 10.4 y old, FEV1 of 75.4 � 22.9% of predicted).Respiratory sounds were recorded simultaneously at 7 anatomic locations (trachea and right andleft anterior, lateral, and posterior chest). Air flow was recorded with a pneumotachograph. Normalrespiratory sound intensity and mean number of crackles and wheezes were analyzed with validatedalgorithms. Inter-subject variability was assessed with the coefficient of variation, and intra-subjectreliability was assessed with the intraclass correlation coefficient (ICC) and Bland-Altman plots.RESULTS: Relative reliability was moderate to excellent for normal respiratory sound intensityand mean number of crackles (ICC of 0.66–0.89) and excellent for mean number of wheezes (ICCof 0.75–0.99) at the 3 air flows. Absolute reliability was greater at target air flows, especially at0.4–0.6 L/s. Inter-subject variability was high for all respiratory sound parameters and acrosslocations (coefficient of variation of 0.12–2.22). Respiratory sound parameters had acceptable rel-ative and absolute intra-subject reliability at the different anatomic locations. The only exceptionwas the mean number of crackles at the trachea, for which both relative and absolute reliabilitywere poor. CONCLUSIONS: Respiratory sound parameters are more reliable at an air flow of0.4–0.6 L/s and are reliable overall at all anatomic locations. This should be considered in futurestudies using computerized auscultation. Key words: computerized auscultation; respiratory sounds;normal respiratory sounds; crackles; wheezes; chronic obstructive pulmonary disease; reliability. [RespirCare 2015;60(9):1264–1275. © 2015 Daedalus Enterprises]
Introduction
COPD is characterized by persistent air-flow limitationthat is usually progressive.1 The FEV1 has been estab-
lished as the global marker for COPD diagnosis and mon-itoring.1 Nevertheless, changes in FEV1 in response totreatment are small in relation to its repeatability.2,3 Newclinical markers are therefore needed to evaluate the ef-
Ms Jacome and Dr Marques are affiliated with the Lab 3R – RespiratoryResearch and Rehabilitation Laboratory, School of Health Sciences, andDr Marques is also affiliated with the Center for Health Technology andServices Research (CINTESIS), School of Health Sciences, University ofAveiro, Aveiro, Portugal. Ms Jacome is also affiliated with the ResearchCentre in Physical Activity, Health and Leisure (CIAFEL), Faculty ofSports, University of Porto, Porto, Portugal.
This study was supported by the Fundacao para a Ciencia e Tecnologia
(FCT SFRH/BD/84665/2012), Portugal. The authors have disclosed noconflicts of interest.
Correspondence: Alda Marques PT MSc PhD, Lab 3R – RespiratoryResearch and Rehabilitation Laboratory, School of Health Sciences, Uni-versity of Aveiro (ESSUA), Agras do Crasto-Campus Universitariode Santiago, Edifício 30, 3810-193 Aveiro, Portugal. E-mail:[email protected].
DOI: 10.4187/respcare.03922
1264 RESPIRATORY CARE • SEPTEMBER 2015 VOL 60 NO 9
fectiveness of treatments for COPD.4 These markers shouldbe simple in terms of measurement, interpretation, andresources used and should have acceptable reliability toensure that the error involved in measurement is smallenough to detect actual changes.4
Respiratory sounds are a simple, objective, and nonin-vasive marker to assess the function of the respiratorysystem5 and do not require special resources beyond thosetypical of a patient-health professional encounter. How-ever, the variation and reliability of this promising markerin patients with COPD are still unknown.
Using computerized auscultation, it has been shown thatadventitious respiratory sounds are characterized mainlyby inspiratory crackles and expiratory wheezes in stablesubjects with COPD.6-9 Respiratory sounds have been sug-gested as useful in diagnosing community-acquired pneu-monia in this population.10 These studies showed that re-spiratory sounds may have potential to monitor therespiratory status of subjects with COPD. However, inter-subject variability and intra-subject reliability was not ex-plored, hindering the interpretation of actual changes. Inaddition, respiratory sounds have been recorded withoutcontrol of subjects’ air flows, despite the well-known in-fluence of air flow on respiratory acoustic and breathingpatterns.11-13
Computerized respiratory sound analysis guidelines rec-ommend recordings with inspiratory and expiratory peakair flows of 1–1.5 L/s or 10–15% of the predicted maxi-mum peak expiratory air flow.14 However, it is unknownif the air flow recommended suits the breathing patternspecificities of patients with COPD. It has been shown thatbreathing patterns of subjects with COPD have reducedcomplexity compared with healthy subjects,15 which mayaffect respiratory sound reliability at different air flows.Computerized respiratory sound analysis guidelines alsostandardized 7 anatomic locations (trachea and right andleft anterior, lateral, and posterior chest) to record respi-ratory sounds.14 Nevertheless, inter-subject variability andintra-subject reliability of respiratory sounds at each ana-tomic location in patients with COPD have not been in-vestigated. To address these relevant research needs, thisstudy assessed the (1) intra-subject reliability of breathingpatterns and respiratory sounds at distinct air flows and (2)inter-subject variability and intra-subject reliability of re-spiratory sounds at each standardized anatomic location insubjects with COPD.
Methods
Study Design
A 2-part study was conducted. Part 1 assessed the intra-subject reliability of breathing patterns and respiratory
sounds at 3 distinct air flows using a small sample ofout-patients with COPD. Part 2 characterized the inter-subject variability and intra-subject reliability of respira-tory sounds at each anatomic location using the most reliableair flow from part 1 and a larger sample of out-patientswith COPD.
Participants
Out-patients with COPD were recruited from 2 primarycare centers. Inclusion criteria were diagnosis of COPDaccording to the Global Initiative for Chronic ObstructiveLung Disease (GOLD) criteria (presence of a post-bron-chodilator FEV1/FVC � 0.70)1 and clinical stability for1 month before the study (no hospital admissions, exac-erbations as defined by GOLD, or changes in respiratorysystem medication). Subjects were excluded if they hadcoexisting respiratory diseases or severe neurological, mus-culoskeletal, or psychiatric impairments. Approval for thisstudy was obtained from the ethics committee of the Cen-ter Health Regional Administration (2013-05-02) and fromthe National Data Protection Committee (3292/2013). El-igible subjects were identified by clinicians and then con-tacted by the researchers, who explained the purpose of thestudy and asked about their willingness to participate. Whensubjects agreed to participate, an appointment with theresearchers was scheduled. Written informed consent wasobtained before data collection.
QUICK LOOK
Current knowledge
Auscultation of respiratory sounds is a simple, objec-tive, and noninvasive method to evaluate the respira-tory system with an inexpensive tool. Using a stetho-scope, evaluation of respiratory sounds is subject tooperator skill, experience, and inter-observer reliability.Computerized auscultation may offer advantages to con-ventional auscultation.
What this paper contributes to our knowledge
Computerized assessment of respiratory sounds wasmore reliable at an air flow of 0.4–0.6 L/s and werehighly variable in subjects with COPD. The reliabilityof respiratory sounds over a set of standardized ana-tomic locations was very good. The use of these ana-tomic locations at the target flow range may improvethe usefulness of computerized respiratory sound as-sessments in evaluating disease severity and responseto treatment.
RESPIRATORY SOUNDS ARE RELIABLE IN SUBJECTS WITH COPD
RESPIRATORY CARE • SEPTEMBER 2015 VOL 60 NO 9 1265

Data Collection
Sociodemographic, anthropometric (height and weight),and clinical (smoking habits, dyspnea, exacerbations in thepast 3 months and in the previous year, medication) datawere first recorded in the 2 study parts. Air flows andrespiratory sounds were recorded. Lung function was as-sessed by spirometry (MicroLab 3500, CareFusion, Kent,United Kingdom) according to standardized guidelines.16
Subjects were classified into 4 groups (A–D) using theGOLD combined assessment (Modified Medical ResearchCouncil scale, spirometry, and exacerbation risk).1 All as-sessments were performed by 2 physiotherapists, and theorder was standardized.
Part 1. Air flows and respiratory sounds were acquiredsimultaneously. Recordings were performed at spontane-ous air flow, at a peak of 0.4–0.6 L/s (typical tidal air-flow range), and at a peak of 0.7–1 L/s (modestly increasedair flow). Similar target air flows have been used in pre-vious research.17 After 5 min of quiet sitting, the 3 distinctair flows were acquired following the standardized order:spontaneous, 0.4 – 0.6 L/s, and 0.7–1 L/s. Spontaneousbreathing was tested first so that it would not be influencedby the target air flows, and the order of the 2 target airflows was selected based on increased air-flow demand.Subjects were seated upright, wearing a nose clip, andbreathing through a mouthpiece connected to a heated pneu-motachograph (3830, Hans Rudolph, Shawnee, Kansas).For each air flow, subjects performed 3 trials of 20 seach,18 followed by a 2-min recovery period. During spon-taneous air flow, subjects were instructed to breathe nor-mally, and biofeedback of the flow signal was not pre-sented. During target flows, subjects had visual biofeedbackof the flow signal (RSS 100R research pneumotach instru-mentation system, Hans Rudolph) and were instructed tomaintain the flow between 2 horizontal lines. The record-ing of each target flow was preceded by a training phase ofat least 3 breathing cycles.
Respiratory sound recordings followed computerized re-spiratory sound analysis guidelines for short-term acqui-sitions14 and were performed simultaneously at 7 anatomiclocations (trachea and right and left anterior, lateral, andposterior chest) using the LungSounds@UA interface.19
Seven stethoscopes (Littmann Classic II S.E., 3M, St Paul,Minnesota) with a microphone (frequency response be-tween 20 and 19 kHz; TOM-1545P-R, Projects Unlimited,Dayton, Ohio) and a preamplifier circuit (Intelligent Sens-ing Anywhere, Coimbra, Portugal) in the main tube wereattached to the subject’s skin with soft cloth surgical tape(3M). The analog sound signals were further amplified andconverted to digital by an audio interface (ProFire 2626,M-Audio, Cumberland, Rhode Island). The signal was con-
verted with a 24-bit resolution at a sampling rate of 44.1 kHzand recorded in WAV format.
Part 2. Air flows and respiratory sounds were acquiredsimultaneously at the most reliable air flow identified inpart 1. The same procedures from part 1 were followed.
Signal Processing
All files were processed using algorithms written inMATLAB R2009a (MathWorks, Natick, Massachusetts).Breathing phases were automatically detected using thepositive and negative air-flow signals. Mean inspiratoryand expiratory times were then calculated. The mean airflows and tidal volumes (VT) were calculated per breath-ing phase using flow and volume raw signals. To combinethe detected breathing phases with sound signals, the flowsignals were time-synchronized with tracheal sound sig-nals. Due to the simultaneous acquisition of respiratorysounds at the 7 locations, the breathing phases detectedwith tracheal sounds were applied to the other 6 locations.
Crackles were detected using a multi-algorithm tech-nique based on established algorithms.20-22 This multi-al-gorithm technique showed a 7% performance improve-ment over the best individual algorithm.23 Wheezes weredetected using an algorithm based on time-frequency anal-ysis.24 The mean number of crackles and wheezes perbreathing phase was extracted. After excluding these ad-ventitious sounds, normal respiratory sounds were ana-lyzed based on the methodology proposed by Pasterkampet al,25 and the mean intensity was determined within afrequency band of 100–2,000 Hz.25,26
Statistical Analysis
All statistical analyses were performed using SPSS 20.0(IBM, Armonk, New York). The level of significance wasset at .05.
Part 1. Descriptive statistics were used to characterizethe sample. Mean inspiratory and expiratory air flows, VT,and time were determined by computing the mean of the 3recordings at each air flow. The mean normal respiratorysound intensity and mean number of crackles and wheezesper breathing phase were determined by computing themean of the 3 recordings at all anatomic locations. One-way repeated-measures analysis of variance was used toanalyze differences in breathing patterns and respiratorysounds across air flows. When a statistically significantdifference was found, Bonferroni post hoc tests were per-formed. Statistical analysis was completed with the esti-mation of effect sizes. The effect size was computed viapartial eta-square, as it is the index more commonly re-ported for analysis of variance.27 Partial eta-square was
RESPIRATORY SOUNDS ARE RELIABLE IN SUBJECTS WITH COPD
1266 RESPIRATORY CARE • SEPTEMBER 2015 VOL 60 NO 9

interpreted as a small (� 0.01), medium (� 0.06), or large(� 0.14) effect.28
As recommended for intra-subject reliability,29 both rel-ative reliability (intraclass correlation coefficient [ICC])and absolute reliability (Bland-Altman method) were used.The ICC equation (1, k) was used, where k � 3 because 3recordings were performed for each air flow. ICC wasinterpreted as excellent (� 0.75), moderate to good (0.4–0.75), or poor (� 0.4).30 The Bland-Altman method as-sesses the agreement between 2 sets of measures.31 Thus,random numbers were generated in MATLAB to deleteone recording. Bland-Altman plots were created to analyzethe distribution of results (Prism 5.01, GraphPad Software,La Jolla, California).31
Sample size was determined as described by Bonett.32 Asample size of 13 subjects was required to estimate an ICCof 0.9 with a 95% CI width of 0.2 (� � .05 and k � 3).32
Part 2. Descriptive statistics were used to characterizethe sample. The mean normal respiratory sound intensityand mean number of crackles and wheezes per breathingphase were determined by computing the mean of the 3recordings for each anatomic location (trachea and rightand left anterior, lateral, and posterior chest). The inter-subject variability in respiratory sound parameters was mea-sured with the coefficient of variation, as it is useful foranalyzing the variability of measures independently of themagnitude of the data.33 It is defined as the SD divided bythe mean.34 The relative and absolute intra-subject reli-ability of respiratory sound parameters were computed, asdescribed above, per anatomic location.
Sample size for the coefficient of variation was esti-mated using the approach of Kelley.35 Using data frompart 1, we found that the coefficient of variation for normalrespiratory sound intensity was between 0.17 and 0.25. Wedetermined that a minimum of 59 individuals were neededfor a coefficient of variation of 0.25 with a 95% CI widthof 0.1 (� � .05).35
Results
Part 1
Thirteen subjects (10 males) were enrolled. Four sub-jects had mild air-flow limitation, 6 had moderate, and 3had severe-to-very-severe air-flow limitation. All subjectsused long-acting bronchodilators. Table 1 lists subjects’characteristics.
Respiratory Sounds. The intensity of normal respiratorysounds during inspiration and expiration was higher at anair flow of 0.7–1 L/s (post hoc P � .001) (Table 2). Nosignificant differences were seen in the mean number ofcrackles (inspiratory, P � .45; expiratory, P � .066) and
wheezes (inspiratory, P � .30; expiratory, P � .12). Therelative reliability of normal respiratory sound intensitywas moderate to excellent at the 3 air flows (see Table 2).Bland-Altman plots indicated greater agreement for nor-mal respiratory sound intensity at an air flow of 0.4–0.6 L/s (Figs. 1B and 2B). The relative reliability of themean number of inspiratory and expiratory crackles wasfound to be moderate to excellent at the 3 air flows (seeTable 2). However, a higher level of agreement existed atan air flow of 0.4–0.6 L/s, with narrower limits of agree-ment (Figs. 1E and 2E). The relative reliability of themean number of inspiratory and expiratory wheezes wasexcellent at all air flows (see Table 2), although greateragreement was found at target air flows (Figs. 1H and 1Iand 2H and 2I).
Breathing Pattern. At an air flow of 0.7–1 L/s, signifi-cantly higher flows (post hoc P � .001) and VT (post hocP � .05) were found (see Table 2). Inspiratory and expi-ratory times were similar across air flows (P � .6 and .21,respectively). Intra-subject relative reliability of air flow,VT, and time were higher at a target air flow of 0.4–0.6 L/s (ICC of 0.73–0.95) compared with spontaneous airflow (ICC of 0.60–0.88) or a target air flow of 0.7–1 L/s
Table 1. Sociodemographic, Anthropometric, and ClinicalCharacteristics of Subjects
Characteristic Values
Age, mean � SD y 69.3 � 8.6Males/females, n 10/3Current smokers, n 0mMRC scale, median (IQR) 1 (1–2)BMI, mean � SD kg/m2 29.5 � 3.4Exacerbations in past 3 m, n
0 51 6� 2 2
FEV1, mean � SD L 1.8 � 0.6FEV1, mean � SD % predicted 70.9 � 21.4FEV1/FVC, mean � SD 0.66 � 0.09GOLD air-flow limitation, n
Mild 4Moderate 6Severe to very severe 3
GOLD combined assessment, nA: low risk, fewer symptoms 3B: low risk, more symptoms 7C: high risk, fewer symptoms 1D: high risk, more symptoms 2
N � 13.mMRC � modified Medical Research CouncilIQR � interquartile rangeBMI � body mass indexGOLD � Global Initiative for Chronic Obstructive Lung Disease
RESPIRATORY SOUNDS ARE RELIABLE IN SUBJECTS WITH COPD
RESPIRATORY CARE • SEPTEMBER 2015 VOL 60 NO 9 1267

Fig. 1. Bland-Altman plots of inspiratory normal respiratory sound (NRS) intensity and mean number of crackles and wheezes between 2recordings at 3 distinct air flows: spontaneous, 0.4–0.6 L/s, and 0.7–1.0 L/s. The solid lines represent the mean difference, and the dashedlines show the 95% limits of agreement.
Table 2. Descriptive Characteristics and Intra-Subject Relative Reliability of Respiratory Sounds and Breathing Pattern Parameters at 3 Air Flows
Characteristic
Spontaneous Air Flow Air Flow of 0.4–0.6 L/s Air Flow of 0.7–1 L/s
(mean � SD) ICC (95% CI) (mean � SD) ICC (95% CI) (mean � SD) ICC (95% CI) PPartial
Eta-Square
Inspiratory normalrespiratory soundintensity, dB
11.8 � 2.16 0.74 (0.35–0.91) 11.32 � 1.88 0.88 (0.7–0.96) 12.98 � 2.33 0.89 (0.73–0.96) � .001 0.634
Expiratory normalrespiratory soundintensity, dB
10.49 � 2.05 0.66 (0.14–0.89) 10.30 � 1.82 0.65 (0.13–0.88) 12.06 � 2.96 0.74 (0.36–0.91) � .001 0.757
Crackles oninspiration
1.57 � 0.78 0.75 (0.38–0.92) 1.30 � 0.60 0.71 (0.27–0.90) 1.38 � 0.50 0.81 (0.52–0.94) .45 0.064
Crackles on expiration 2.49 � 1.35 0.78 (0.44–0.93) 1.47 � 1.05 0.89 (0.74–0.97) 1.34 � 0.64 0.75 (0.39–0.92) .066 0.203Wheezes on
inspiration0.35 � 0.49 0.79 (0.46–0.93) 0.31 � 0.55 0.78 (0.46–0.93) 0.25 � 0.31 0.75 (0.37–0.92) .30 0.096
Wheezes on expiration 0.59 � 0.91 0.89 (0.72–0.96) 0.72 � 1.72 0.99 (0.96–0.99) 0.30 � 0.39 0.78 (0.46–0.93) .12 0.161Inspiratory flow, L/s 0.38 � 0.18 0.73 (0.32–0.91) 0.44 � 0.14 0.95 (0.88–0.98) 0.7 � 0.11 0.74 (0.34–0.91) � .001 0.648Expiratory flow, L/s 0.30 � 0.17 0.88 (0.70–0.96) 0.33 � 0.09 0.92 (0.81–0.97) 0.60 � 0.09 0.77 (0.42–0.92) � .001 0.751Inspiratory VT, L 0.54 � 0.18 0.76 (0.37–0.93) 0.57 � 0.1 0.85 (0.63–0.95) 0.96 � 0.22 0.84 (0.61–0.95) .001 0.431Expiratory VT, L 0.56 � 0.25 0.60 (0.01–0.87) 0.56 � 0.11 0.73 (0.31–0.91) 0.95 � 0.24 0.70 (0.25–0.90) .001 0.525TI, s 1.36 � 0.41 0.64 (0.02–0.89) 1.15 � 0.28 0.85 (0.60–0.96) 1.24 � 0.34 0.84 (0.59–0.95) .60 0.097TE, s 1.81 � 0.53 0.72 (0.29–0.91) 1.71 � 0.85 0.80 (0.50–0.93) 1.50 � 0.40 0.77 (0.42–0.92) .21 0.123
N � 13.ICC � intraclass correlation coefficientVT � tidal volumeTI � inspiratory timeTE � expiratory time
RESPIRATORY SOUNDS ARE RELIABLE IN SUBJECTS WITH COPD
1268 RESPIRATORY CARE • SEPTEMBER 2015 VOL 60 NO 9

(ICC of 0.70–0.84) (see Table 2). Figures 3 and 4 showthat intra-subject absolute reliability was higher at 0.4–0.6 L/s. From analysis of respiratory sound and breathingpattern parameters, it was verified that intra-subject reli-ability was higher at an air flow of 0.4–0.6 L/s.
Part 2
A total of 63 subjects (48 males) were enrolled. Mostparticipants had low risk of exacerbations (A, 34.9%; B,36.5%), and all used long-acting bronchodilators. Table 3provides subjects’ detailed characteristics.
Respiratory Sounds. Descriptive characteristics of nor-mal respiratory sound intensity (from 9.41 to 14.71 dB),mean number of crackles (from 1.43 to 3.46), and meannumber of wheezes (from 0.06 to 0.40) across locationsare presented in Table 4. Inter-subject variability was highfor all respiratory sound parameters; however, the meannumber of crackles (coefficient of variation of 0.55–0.92)and wheezes (coefficient of variation of 1.15–2.22) pre-sented the highest variation. Inter-subject variability wasgenerally higher during expiration than inspiration for allrespiratory sound parameters (normal respiratory soundintensity of 0.12–0.23 vs 0.15–0.21, mean number of crack-
les of 0.56–0.92 vs 0.55–0.78, mean number of wheezesof 1.36–2.22 vs 1.2–2.17) at most locations, with the ex-ception of the trachea.
Normal respiratory sound intensity had an excellent rel-ative and absolute reliability at all anatomic locations (seeTable 4). The relative and absolute reliability of the meannumber of crackles and wheezes were moderate to excel-lent at all anatomic locations. The only exceptions werethe mean number of inspiratory and expiratory crackles atthe trachea, which showed poor relative and absolutereliability.
Discussion
To the best of our knowledge, this is the first studyinvestigating inter-subject variability and intra-subject re-liability of respiratory sounds at distinct air flows andanatomic locations in subjects with stable COPD. The mainfindings indicated that respiratory sound parameters are(1) more reliable at an air flow of 0.4–0.6 L/s, (2) highlyvariable across subjects, and (3) reliable overall at all stan-dardized anatomic locations.
The normal respiratory sound intensity increased athigher air flows. The link between sound intensity and airflow has long been recognized.36 From spontaneous to
Fig. 2. Bland-Altman plots of expiratory normal respiratory sound intensity and mean number of crackles and wheezes between 2recordings at 3 distinct air flows: spontaneous, 0.4–0.6 L/s, and 0.7–1.0 L/s. The solid lines represent the mean difference, and the dashedlines show the 95% limits of agreement.
RESPIRATORY SOUNDS ARE RELIABLE IN SUBJECTS WITH COPD
RESPIRATORY CARE • SEPTEMBER 2015 VOL 60 NO 9 1269

Fig. 4. Bland-Altman plots of expiratory air flow, volume, and time between 2 recordings at 3 distinct air flows: spontaneous, 0.4–0.6 L/s,and 0.7–1.0 L/s. The solid lines represent the mean difference, and the dashed lines show the 95% limits of agreement. VT � tidal volume;TE � expiratory time.
Fig. 3. Bland-Altman plots of inspiratory air flow, volume, and time between 2 recordings at 3 distinct air flows: spontaneous, 0.4–0.6 L/s,and 0.7–1.0 L/s. The solid lines represent the mean difference, and the dashed lines show the 95% limits of agreement. VT � tidal volume;TI � inspiratory time.
RESPIRATORY SOUNDS ARE RELIABLE IN SUBJECTS WITH COPD
1270 RESPIRATORY CARE • SEPTEMBER 2015 VOL 60 NO 9
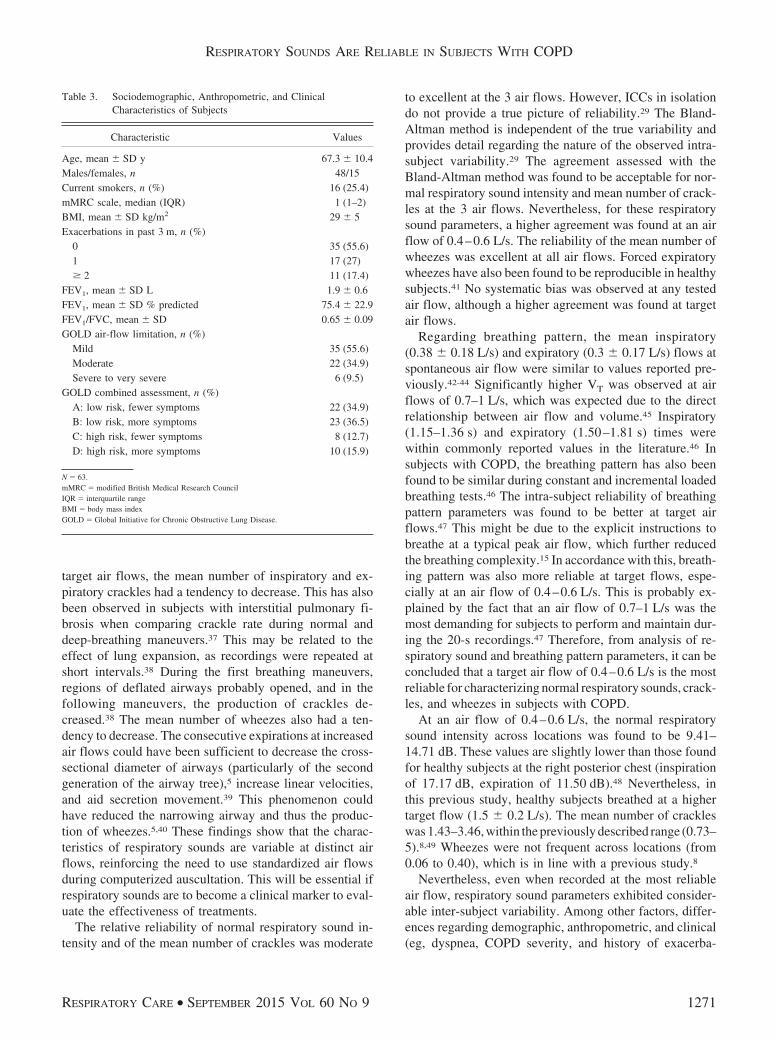
target air flows, the mean number of inspiratory and ex-piratory crackles had a tendency to decrease. This has alsobeen observed in subjects with interstitial pulmonary fi-brosis when comparing crackle rate during normal anddeep-breathing maneuvers.37 This may be related to theeffect of lung expansion, as recordings were repeated atshort intervals.38 During the first breathing maneuvers,regions of deflated airways probably opened, and in thefollowing maneuvers, the production of crackles de-creased.38 The mean number of wheezes also had a ten-dency to decrease. The consecutive expirations at increasedair flows could have been sufficient to decrease the cross-sectional diameter of airways (particularly of the secondgeneration of the airway tree),5 increase linear velocities,and aid secretion movement.39 This phenomenon couldhave reduced the narrowing airway and thus the produc-tion of wheezes.5,40 These findings show that the charac-teristics of respiratory sounds are variable at distinct airflows, reinforcing the need to use standardized air flowsduring computerized auscultation. This will be essential ifrespiratory sounds are to become a clinical marker to eval-uate the effectiveness of treatments.
The relative reliability of normal respiratory sound in-tensity and of the mean number of crackles was moderate
to excellent at the 3 air flows. However, ICCs in isolationdo not provide a true picture of reliability.29 The Bland-Altman method is independent of the true variability andprovides detail regarding the nature of the observed intra-subject variability.29 The agreement assessed with theBland-Altman method was found to be acceptable for nor-mal respiratory sound intensity and mean number of crack-les at the 3 air flows. Nevertheless, for these respiratorysound parameters, a higher agreement was found at an airflow of 0.4–0.6 L/s. The reliability of the mean number ofwheezes was excellent at all air flows. Forced expiratorywheezes have also been found to be reproducible in healthysubjects.41 No systematic bias was observed at any testedair flow, although a higher agreement was found at targetair flows.
Regarding breathing pattern, the mean inspiratory(0.38 � 0.18 L/s) and expiratory (0.3 � 0.17 L/s) flows atspontaneous air flow were similar to values reported pre-viously.42-44 Significantly higher VT was observed at airflows of 0.7–1 L/s, which was expected due to the directrelationship between air flow and volume.45 Inspiratory(1.15–1.36 s) and expiratory (1.50 –1.81 s) times werewithin commonly reported values in the literature.46 Insubjects with COPD, the breathing pattern has also beenfound to be similar during constant and incremental loadedbreathing tests.46 The intra-subject reliability of breathingpattern parameters was found to be better at target airflows.47 This might be due to the explicit instructions tobreathe at a typical peak air flow, which further reducedthe breathing complexity.15 In accordance with this, breath-ing pattern was also more reliable at target flows, espe-cially at an air flow of 0.4–0.6 L/s. This is probably ex-plained by the fact that an air flow of 0.7–1 L/s was themost demanding for subjects to perform and maintain dur-ing the 20-s recordings.47 Therefore, from analysis of re-spiratory sound and breathing pattern parameters, it can beconcluded that a target air flow of 0.4–0.6 L/s is the mostreliable for characterizing normal respiratory sounds, crack-les, and wheezes in subjects with COPD.
At an air flow of 0.4–0.6 L/s, the normal respiratorysound intensity across locations was found to be 9.41–14.71 dB. These values are slightly lower than those foundfor healthy subjects at the right posterior chest (inspirationof 17.17 dB, expiration of 11.50 dB).48 Nevertheless, inthis previous study, healthy subjects breathed at a highertarget flow (1.5 � 0.2 L/s). The mean number of crackleswas 1.43–3.46, within the previously described range (0.73–5).8,49 Wheezes were not frequent across locations (from0.06 to 0.40), which is in line with a previous study.8
Nevertheless, even when recorded at the most reliableair flow, respiratory sound parameters exhibited consider-able inter-subject variability. Among other factors, differ-ences regarding demographic, anthropometric, and clinical(eg, dyspnea, COPD severity, and history of exacerba-
Table 3. Sociodemographic, Anthropometric, and ClinicalCharacteristics of Subjects
Characteristic Values
Age, mean � SD y 67.3 � 10.4Males/females, n 48/15Current smokers, n (%) 16 (25.4)mMRC scale, median (IQR) 1 (1–2)BMI, mean � SD kg/m2 29 � 5Exacerbations in past 3 m, n (%)
0 35 (55.6)1 17 (27)� 2 11 (17.4)
FEV1, mean � SD L 1.9 � 0.6FEV1, mean � SD % predicted 75.4 � 22.9FEV1/FVC, mean � SD 0.65 � 0.09GOLD air-flow limitation, n (%)
Mild 35 (55.6)Moderate 22 (34.9)Severe to very severe 6 (9.5)
GOLD combined assessment, n (%)A: low risk, fewer symptoms 22 (34.9)B: low risk, more symptoms 23 (36.5)C: high risk, fewer symptoms 8 (12.7)D: high risk, more symptoms 10 (15.9)
N � 63.mMRC � modified British Medical Research CouncilIQR � interquartile rangeBMI � body mass indexGOLD � Global Initiative for Chronic Obstructive Lung Disease.
RESPIRATORY SOUNDS ARE RELIABLE IN SUBJECTS WITH COPD
RESPIRATORY CARE • SEPTEMBER 2015 VOL 60 NO 9 1271
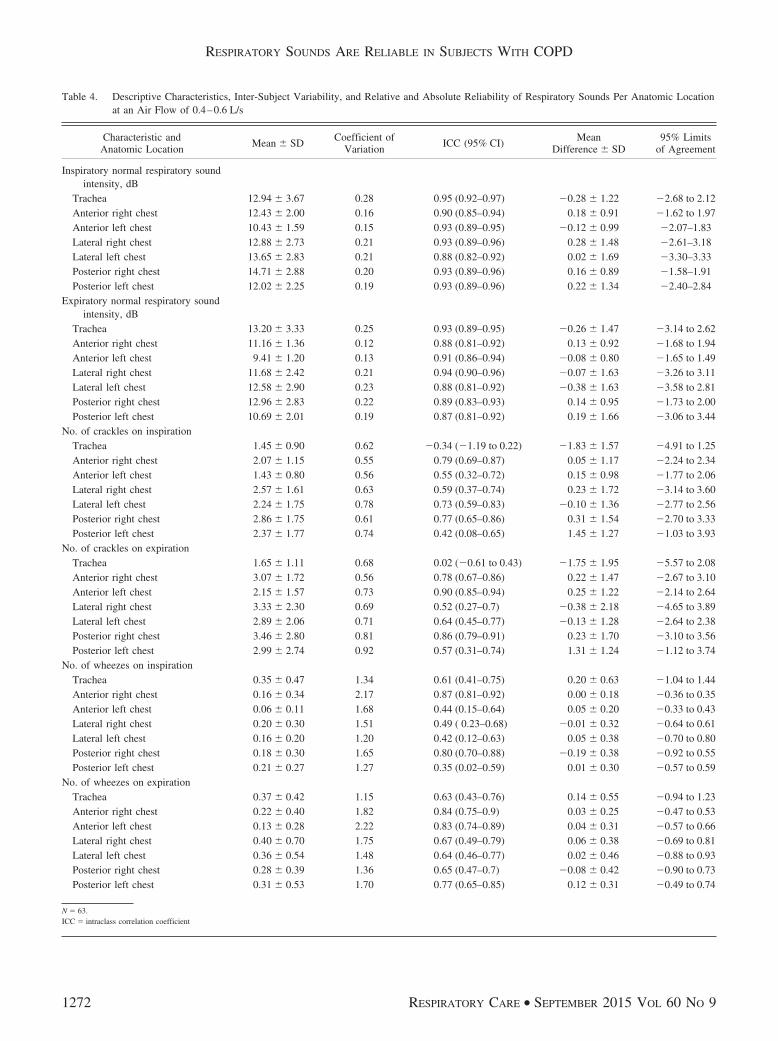
Table 4. Descriptive Characteristics, Inter-Subject Variability, and Relative and Absolute Reliability of Respiratory Sounds Per Anatomic Locationat an Air Flow of 0.4–0.6 L/s
Characteristic andAnatomic Location
Mean � SDCoefficient of
VariationICC (95% CI)
MeanDifference � SD
95% Limitsof Agreement
Inspiratory normal respiratory soundintensity, dB
Trachea 12.94 � 3.67 0.28 0.95 (0.92–0.97) �0.28 � 1.22 �2.68 to 2.12Anterior right chest 12.43 � 2.00 0.16 0.90 (0.85–0.94) 0.18 � 0.91 �1.62 to 1.97Anterior left chest 10.43 � 1.59 0.15 0.93 (0.89–0.95) �0.12 � 0.99 �2.07–1.83Lateral right chest 12.88 � 2.73 0.21 0.93 (0.89–0.96) 0.28 � 1.48 �2.61–3.18Lateral left chest 13.65 � 2.83 0.21 0.88 (0.82–0.92) 0.02 � 1.69 �3.30–3.33Posterior right chest 14.71 � 2.88 0.20 0.93 (0.89–0.96) 0.16 � 0.89 �1.58–1.91Posterior left chest 12.02 � 2.25 0.19 0.93 (0.89–0.96) 0.22 � 1.34 �2.40–2.84
Expiratory normal respiratory soundintensity, dB
Trachea 13.20 � 3.33 0.25 0.93 (0.89–0.95) �0.26 � 1.47 �3.14 to 2.62Anterior right chest 11.16 � 1.36 0.12 0.88 (0.81–0.92) 0.13 � 0.92 �1.68 to 1.94Anterior left chest 9.41 � 1.20 0.13 0.91 (0.86–0.94) �0.08 � 0.80 �1.65 to 1.49Lateral right chest 11.68 � 2.42 0.21 0.94 (0.90–0.96) �0.07 � 1.63 �3.26 to 3.11Lateral left chest 12.58 � 2.90 0.23 0.88 (0.81–0.92) �0.38 � 1.63 �3.58 to 2.81Posterior right chest 12.96 � 2.83 0.22 0.89 (0.83–0.93) 0.14 � 0.95 �1.73 to 2.00Posterior left chest 10.69 � 2.01 0.19 0.87 (0.81–0.92) 0.19 � 1.66 �3.06 to 3.44
No. of crackles on inspirationTrachea 1.45 � 0.90 0.62 �0.34 (�1.19 to 0.22) �1.83 � 1.57 �4.91 to 1.25Anterior right chest 2.07 � 1.15 0.55 0.79 (0.69–0.87) 0.05 � 1.17 �2.24 to 2.34Anterior left chest 1.43 � 0.80 0.56 0.55 (0.32–0.72) 0.15 � 0.98 �1.77 to 2.06Lateral right chest 2.57 � 1.61 0.63 0.59 (0.37–0.74) 0.23 � 1.72 �3.14 to 3.60Lateral left chest 2.24 � 1.75 0.78 0.73 (0.59–0.83) �0.10 � 1.36 �2.77 to 2.56Posterior right chest 2.86 � 1.75 0.61 0.77 (0.65–0.86) 0.31 � 1.54 �2.70 to 3.33Posterior left chest 2.37 � 1.77 0.74 0.42 (0.08–0.65) 1.45 � 1.27 �1.03 to 3.93
No. of crackles on expirationTrachea 1.65 � 1.11 0.68 0.02 (�0.61 to 0.43) �1.75 � 1.95 �5.57 to 2.08Anterior right chest 3.07 � 1.72 0.56 0.78 (0.67–0.86) 0.22 � 1.47 �2.67 to 3.10Anterior left chest 2.15 � 1.57 0.73 0.90 (0.85–0.94) 0.25 � 1.22 �2.14 to 2.64Lateral right chest 3.33 � 2.30 0.69 0.52 (0.27–0.7) �0.38 � 2.18 �4.65 to 3.89Lateral left chest 2.89 � 2.06 0.71 0.64 (0.45–0.77) �0.13 � 1.28 �2.64 to 2.38Posterior right chest 3.46 � 2.80 0.81 0.86 (0.79–0.91) 0.23 � 1.70 �3.10 to 3.56Posterior left chest 2.99 � 2.74 0.92 0.57 (0.31–0.74) 1.31 � 1.24 �1.12 to 3.74
No. of wheezes on inspirationTrachea 0.35 � 0.47 1.34 0.61 (0.41–0.75) 0.20 � 0.63 �1.04 to 1.44Anterior right chest 0.16 � 0.34 2.17 0.87 (0.81–0.92) 0.00 � 0.18 �0.36 to 0.35Anterior left chest 0.06 � 0.11 1.68 0.44 (0.15–0.64) 0.05 � 0.20 �0.33 to 0.43Lateral right chest 0.20 � 0.30 1.51 0.49 ( 0.23–0.68) �0.01 � 0.32 �0.64 to 0.61Lateral left chest 0.16 � 0.20 1.20 0.42 (0.12–0.63) 0.05 � 0.38 �0.70 to 0.80Posterior right chest 0.18 � 0.30 1.65 0.80 (0.70–0.88) �0.19 � 0.38 �0.92 to 0.55Posterior left chest 0.21 � 0.27 1.27 0.35 (0.02–0.59) 0.01 � 0.30 �0.57 to 0.59
No. of wheezes on expirationTrachea 0.37 � 0.42 1.15 0.63 (0.43–0.76) 0.14 � 0.55 �0.94 to 1.23Anterior right chest 0.22 � 0.40 1.82 0.84 (0.75–0.9) 0.03 � 0.25 �0.47 to 0.53Anterior left chest 0.13 � 0.28 2.22 0.83 (0.74–0.89) 0.04 � 0.31 �0.57 to 0.66Lateral right chest 0.40 � 0.70 1.75 0.67 (0.49–0.79) 0.06 � 0.38 �0.69 to 0.81Lateral left chest 0.36 � 0.54 1.48 0.64 (0.46–0.77) 0.02 � 0.46 �0.88 to 0.93Posterior right chest 0.28 � 0.39 1.36 0.65 (0.47–0.7) �0.08 � 0.42 �0.90 to 0.73Posterior left chest 0.31 � 0.53 1.70 0.77 (0.65–0.85) 0.12 � 0.31 �0.49 to 0.74
N � 63.ICC � intraclass correlation coefficient
RESPIRATORY SOUNDS ARE RELIABLE IN SUBJECTS WITH COPD
1272 RESPIRATORY CARE • SEPTEMBER 2015 VOL 60 NO 9
tions) characteristics might have contributed to this vari-ability across subjects. High inter-subject variability ofrespiratory sounds has also been reported previously insubjects with cystic fibrosis and bronchiectasis.50 How-ever, this inter-subject variability is similar to other bio-signals that support clinical decisions (eg, heart rate vari-ability, electromyography).51,52 From a clinical perspective,this inter-subject variability limits inferences at the grouplevel, as respiratory sound patterns may fail to representpatterns seen in individuals. For example, increased wheez-ing has been recognized as one of the signs of a COPDexacerbation.53 Nevertheless, due to the high variability ofthis respiratory sound parameter, a small increase in themean number of wheezes may indicate a change in theclinical status for one patient, but not another. This high-lights the importance of supporting health-care profession-als in clinical decisions in the interpretation of respiratorysound changes at an individual level and in combinationwith other clinical data.
Normal respiratory sound intensity and mean number ofcrackles and wheezes were found to be reliable across allanatomic locations. At the trachea, however, the meannumber of crackles had poor reliability. This result maybe due to low generation of this adventitious sound in thisregion of the respiratory tract. It has been generally ac-cepted that crackles are generated when an airway opensduring inspiration or closes during expiration.38,54 Becausethe trachea is characterized by a large diameter and rigidwall, it is unlikely to open or collapse during tidalbreathing.
In addition, normal respiratory sound intensity had lowervariability and higher reliability than mean number of crack-les and wheezes at all anatomic locations. Normal respi-ratory sounds are produced when breathing and can beheard during both inspiration and expiration (nearly si-lent).55 Crackles and wheezes are superimposed events onnormal respiratory sounds,55 and timing may not be per-fectly repeatable from breath to breath. Health profession-als may thus more confidently rely on changes in normalrespiratory sound intensity than mean number of adventi-tious respiratory sounds.
Study Limitations
The recording of distinct air flows in the same sessionand at relatively short intervals may have influenced theresults. However, to minimize bias, the order of tests wasstandardized, and subjects were instructed to rest as needed.Future studies assessing intra-subject reliability could per-form the recordings in different sessions within the sameday. It would be also interesting in future studies to ex-plore the intra-subject test-retest reliability of respiratory
sounds to understand their stability and reliability overtime. The present study focused on only one parameter perrespiratory sound. Future studies could investigate the re-liability of respiratory sounds using other parameters thatalso have clinical relevance.56 Additionally, the unbalancedsample in terms of COPD severity is another limitation ofthe present study. The samples were composed mainly ofsubjects with mild and moderate air-flow limitation, andthus, it was not possible to explore how the disease sever-ity related to the variability/reliability of respiratory soundparameters. However, as the breathing pattern at an airflow of 0.4–0.6 L/s is similar to that in subjects withadvanced COPD46 and air-flow variability is not related toCOPD severity,15 the disease severity might not play asignificant role. Future studies should investigate this,however.
Conclusions
The main findings suggest that respiratory sound pa-rameters are more reliable at an air flow of 0.4–0.6 L/s,highly variable across subjects with COPD, and reliableoverall at all standardized anatomic locations. In the fu-ture, respiratory sounds should be assessed in subjectswith COPD using this target air flow and these anatomiclocations. More studies are needed to draw definite con-clusions on air-flow standards for recording respiratorysounds in subjects with COPD and other respiratorydiseases.
ACKNOWLEDGMENTS
We thank all subjects for participation in this research. We are also verygrateful to Ana Oliveira for contributions to data collection and to CatiaPinho for assistance in data analysis.
REFERENCES
1. Vestbo J, Hurd SS, Agustí AG, Jones PW, Vogelmeier C, AnzuetoA, et al. Global strategy for the diagnosis, management, and preven-tion of chronic obstructive pulmonary disease: GOLD executive sum-mary. Am J Respir Crit Care Med 2013;187(4):347-365.
2. Zwick RH, Burghuber OC, Dovjak N, Hartl S, Kossler W, Lichten-schopf A, et al. [The effect of one year outpatient pulmonary reha-bilitation on patients with COPD]. Wien Klin Wochenschr 2009;121(5-6):189-195. Article in German.
3. Calverley PM, Boonsawat W, Cseke Z, Zhong N, Peterson S, OlssonH. Maintenance therapy with budesonide and formoterol in chronicobstructive pulmonary disease. Eur Respir J 2003;22(6):912-919.
4. Jones PW, Agusti AG. Outcomes and markers in the assessment ofchronic obstructive pulmonary disease. Eur Respir J 2006;27(4):822-832.
5. Bohadana A, Izbicki G, Kraman SS. Fundamentals of lung auscul-tation. N Engl J Med 2014;370(8):744-751.
6. Munakata M, Ukita H, Doi I, Ohtsuka Y, Masaki Y, Homma Y,Kawakami Y. Spectral and wave-form characteristics of fine andcoarse crackles. Thorax 1991;46(9):651-657.
7. Bettencourt PE, Del Bono EA, Spiegelman D, Hertzmark E, Murphy
RESPIRATORY SOUNDS ARE RELIABLE IN SUBJECTS WITH COPD
RESPIRATORY CARE • SEPTEMBER 2015 VOL 60 NO 9 1273

RL Jr. Clinical utility of chest auscultation in common pulmonary-diseases. Am J Respir Crit Care Med 1994;150(5):1291-1297.
8. Murphy RL Jr. Special articles: in defense of the stethoscope. RespirCare 2008;53(3):355-369.
9. Jacome C, Marques A. Computerized respiratory sounds in patientswith COPD: a systematic review. COPD 2015;12(1):104-112.
10. Morillo DS, Leon Jimenez A, Moreno SA. Computer-aided diagno-sis of pneumonia in patients with chronic obstructive pulmonarydisease. J Am Med Inform Assoc 2013;20(e1):e111–e117.
11. Kraman SS. The relationship between airflow and lung sound am-plitude in normal subjects. Chest 1984;86(2):225-229.
12. Gavriely N, Cugell DW. Airflow effects on amplitude and spectralcontent of normal breath sounds. J Appl Physiol 1996;80(1):5-13.
13. Benchetrit G. Breathing pattern in humans: diversity and individu-ality. Respir Physiol 2000;122(2-3):123-129.
14. Rossi M, Sovijarvi AR, Piirila P, Vannuccini L, Dalmasso F, Vander-schoot J. Environmental and subject conditions and breathing ma-noeuvres for respiratory sound recordings. Eur Respir Rev 2000;10(77):611-615.
15. Dames KK, Lopes AJ, de Melo PL. Airflow pattern complexityduring resting breathing in patients with COPD: effect of airwayobstruction. Respir Physiol Neurobiol 2014;192:39-47.
16. Miller MR, Hankinson J, Brusasco V, Burgos F, Casaburi R, CoatesA, et al. Standardisation of spirometry. Eur Respir J 2005;26(2):319-338.
17. Fiz JA, Gnitecki J, Kraman SS, Wodicka GR, Pasterkamp H. Effectof body position on lung sounds in healthy young men. Chest 2008;133(3):729-736.
18. Vyshedskiy A, Murphy R. Crackle pitch rises progressively duringinspiration in pneumonia, CHF, and IPF patients. Pulm Med 2012;2012:240160.
19. Pinho C, Oliveira A, Oliveira D, Dinis J, Marques A.LungSounds@UA interface and multimedia database. IJEHMC 2014;5(1):81-95.
20. Vannuccini L, Rossi M, Pasquali G. A new method to detect cracklesin respiratory sounds. Technol Health Care 1998;6(1):75-79.
21. Hadjileontiadis LJ, Rekanos IT. Detection of explosive lung andbowel sounds by means of fractal dimension. IEEE Signal ProcessLett 2003;10(10):311-314.
22. Lu X, Bahoura M. An integrated automated system for cracklesextraction and classification. Biomed Signal Process Control 2008;3(3):244-254.
23. Quintas J, Campos G, Marques A. Proceedings of the InternationalCongress on Health Informatics: HEALTHINF 2013 (February 11-14, 2013, Barcelona, Spain). Multi-algorithm respiratory crackle de-tection. SCITEPRESS Digital Library; 239-244.
24. Taplidou SA, Hadjileontiadis LJ. Wheeze detection based on time-frequency analysis of breath sounds. Comput Biol Med 2007;37(8):1073-1083.
25. Pasterkamp H, Powell RE, Sanchez I. Lung sound spectra at stan-dardized air flow in normal infants, children, and adults. Am J RespirCrit Care Med 1996;154(2 Pt 1):424-430.
26. Sanchez I, Vizcaya C. Tracheal and lung sounds repeatability innormal adults. Respir Med 2003;97(12):1257-1260.
27. Levine TR, Hullett CR. Eta squared, partial eta squared, and misre-porting of effect size in communication research. Hum Commun Res2002;28(4):612-625.
28. Cohen J. Statistical power analysis for the behavioural sciences. NewYork: Academic Press; 1969.
29. Rankin G, Stokes M. Reliability of assessment tools in rehabilitation:an illustration of appropriate statistical analyses. Clin Rehabil 1998;12(3):187-199.
30. Fleiss J. Reliability of measurement. In: Fleiss J, editor. Design andanalysis of clinical experiments. New York: John Wiley & Sons,1986; 1-32.
31. Bland JM, Altman DG. Statistical methods for assessing agreementbetween two methods of clinical measurement. Lancet 1986;1(8476):307-310.
32. Bonett DG. Sample size requirements for estimating intraclass cor-relations with desired precision. Stat Med 2002;21(9):1331-1335.
33. Lovie P. Coefficient of variation. In: Everitt BS, Howell DC, editors.Encyclopedia of statistics in behavioral science. New York: JohnWiley & Sons; 2005; 317-318.
34. Abdi H. Coefficient of variation. In: Salkind NJ, editor. Encyclope-dia of research design. Thousand Oaks, CA: SAGE Publications;2010; 170-172.
35. Kelley K. Sample size planning for the coefficient of variation fromthe accuracy in parameter estimation approach. Behav Res Methods2007;39(4):755-766.
36. Ploysongsang Y, Pare JA, Macklem PT. Correlation of regionalbreath sounds with regional ventilation in emphysema. Am RevRespir Dis 1982;126(3):526-529.
37. Vyshedskiy A, Ishikawa S, Murphy RL Jr. Crackle pitch and rate donot vary significantly during a single automated-auscultation sessionin patients with pneumonia, congestive heart failure, or interstitialpulmonary fibrosis. Respir Care 2011;56(6):806-817.
38. Piirila P, Sovijarvi A. Crackles: recording, analysis and clinical sig-nificance. Eur Respir J 1995;8(12):2139-2148.
39. Pavia D, Agnew JE, Lopez-Vidriero MT, Clarke SW. General re-view of tracheobronchial clearance. Eur J Respir Dis Suppl 1987;153:123-129.
40. Meslier N, Charbonneau G, Racineux JL. Wheezes. Eur Respir J1995;8(11):1942-1948.
41. Beck R, Gavriely N. The reproducibility of forced expiratory wheezes.Am Rev Respir Dis 1990;141(6):1418-1422.
42. Dal Negro RW, Turati C, Micheletto C, Menegoni F. Effects oftiotropium and formoterol on quiet breathing pattern assessed byoptoelectronic plethysmography in COPD patients: a pilot study.Ther Adv Respir Dis 2012;6(2):97-105.
43. Díaz O, Villafranca C, Ghezzo H, Borzone G, Leiva A, Milic-EmilJ, Lisboa C. Role of inspiratory capacity on exercise tolerance inCOPD patients with and without tidal expiratory flow limitation atrest. Eur Respir J 2000;16(2):269-275.
44. Díaz O, Villafranca C, Ghezzo H, Borzone G, Leiva A, Milic-EmiliJ, Lisboa C. Breathing pattern and gas exchange at peak exercise inCOPD patients with and without tidal flow limitation at rest. EurRespir J 2001;17(6):1120-1127.
45. Schlegelmilch R, Kramme R. Pulmonary function testing. In: KrammeR, Hoffmann KP, Pozos R, editors. Springer handbook of medicaltechnology. Berlin: Springer; 2011; 95-117.
46. Hill K, Jenkins SC, Philippe DL, Shepherd KL, Hillman DR, East-wood PR. Comparison of incremental and constant load tests ofinspiratory muscle endurance in COPD. Eur Respir J 2007;30(3):479-486.
47. Vlemincx E, Van Diest I, Van den Bergh O. Imposing respiratoryvariability patterns. Appl Psychophysiol Biofeedback 2012;37(3):153-160.
48. Pasterkamp H, Sanchez I. Effect of gas density on respiratory sounds.Am J Respir Crit Care Med 1996;153(3):1087-1092.
49. Piirila P, Sovijarvi AR, Kaisla T, Rajala HM, Katila T. Crackles inpatients with fibrosing alveolitis, bronchiectasis, COPD, and heartfailure. Chest 1991;99(5):1076-1083.
50. Marques A, Bruton A, Barney A. Reliability of lung crackle char-acteristics in cystic fibrosis and bronchiectasis patients in a clinicalsetting. Physiol Meas 2009;30(9):903-912.
RESPIRATORY SOUNDS ARE RELIABLE IN SUBJECTS WITH COPD
1274 RESPIRATORY CARE • SEPTEMBER 2015 VOL 60 NO 9

51. Stockhorst U, Huenig A, Ziegler D, Scherbaum WA. Uncondi-tioned and conditioned effects of intravenous insulin and glucoseon heart rate variability in healthy men. Physiol Behav 2011;103(1):31-38.
52. Lapatki BG, Stegeman DF, Jonas IE. A surface EMG electrode forthe simultaneous observation of multiple facial muscles. J NeurosciMethods 2003;123(2):117-128.
53. Sapey E, Stockley RA. COPD exacerbations. 2: aetiology. Thorax2006;61(3):250-258.
54. Vyshedskiy A, Alhashem RM, Paciej R, Ebril M, Rudman I, Fred-berg JJ, Murphy R. Mechanism of inspiratory and expiratory crack-les. Chest 2009;135(1):156-164.
55. Sovijarvi AR, Dalmasso F, Vanderschoot J, Malmberg LP, RighiniG, Stoneman SA. Definition of terms for applications of respiratorysounds. Eur Respir Rev 2000;77(10):597-610.
56. Marques A, Oliveira A, Jacome C. Computerized adventitious re-spiratory sounds as outcome measures for respiratory therapy: asystematic review. Respir Care 2014;59(5):765-776.
RESPIRATORY SOUNDS ARE RELIABLE IN SUBJECTS WITH COPD
RESPIRATORY CARE • SEPTEMBER 2015 VOL 60 NO 9 1275
Related Documents