Design and Assessment of the Toronto Area Computerized Household Activity Scheduling Survey Sean T. Doherty*, Erika Nemeth*, Matthew Roorda † , Eric J. Miller † * Department of Geography & Environmental Studies Wilfrid Laurier University Waterloo, Ontario Canada N2L 3C5 Tel : 519-884-1970 Fax: 519-725-1342 Email: [email protected] † Joint Program in Transportation/Department of Civil Engineering University of Toronto Toronto, Ontario Canada M5S 1A4 Tel: (416) 978-4076 Fax: (416) 978-5054 Email: [email protected] November 2003 To be presented at the 83rd Annual Meeting of the Transportation Research Board , January 11- 15, 2004, Washington D.C.

Welcome message from author
This document is posted to help you gain knowledge. Please leave a comment to let me know what you think about it! Share it to your friends and learn new things together.
Transcript

Design and Assessment of the Toronto Area Computerized Household Activity Scheduling Survey
Sean T. Doherty*, Erika Nemeth*, Matthew Roorda†, Eric J. Miller† * Department of Geography & Environmental Studies Wilfrid Laurier University Waterloo, Ontario Canada N2L 3C5 Tel : 519-884-1970 Fax: 519-725-1342 Email: [email protected] † Joint Program in Transportation/Department of Civil Engineering University of Toronto Toronto, Ontario Canada M5S 1A4 Tel: (416) 978-4076 Fax: (416) 978-5054 Email: [email protected] November 2003 To be presented at the 83rd Annual Meeting of the Transportation Research Board , January 11-15, 2004, Washington D.C.

Doherty et al. 2
Abstract Traditional activity-travel diary surveys have for some time served as the primary source of data for understanding and modelling travel behavior. Recent changes in policy and forecasting needs have led to the development of an emerging class of activity scheduling process surveys that focus on the underlying behavioral mechanisms that give rise to travel and condition future change. Many of these surveys involve the use of computers for data entry over multi-day periods. These changes pose new challenges and opportunities for quality assessment. At this early stage it is more important than ever to closely document the quantity and quality of data provided by such surveys as well as the associated burden and experience of respondents. This paper reviews existing quality standards and seeks to develop several new data quality measures suitable to this emerging class of surveys. Data from a recent household activity scheduling survey in Toronto is utilized (271 households). A detailed description of the survey instrument is provided, along with an in-depth examination of key results that shed light of data quality. Included are results from a separate survey of 30 respondents concerning their experiences and perceptions of the survey. Overall, whilst the survey was generally successful in tracking both observed patterns and underlying decisions process over a multi-day period within a household, it did come at a price in terms of respondent burden. Based on these results several new data quality guidelines are suggested incorporating use of activity-trip rates, scheduling step rates, planning time horizons, and login durations. Further specific suggestions for reducing respondent burden are suggested.

Doherty et al. 3
INTRODUCTION
Traditional activity/travel diary surveys have for some time served as the primary source of data for understanding and modelling travel behavior. Originally, the main goal was to forecast travel demands in order to adequately provide supply, especially during “peak” periods. Modern needs have evolved to include a desire to forecast travel demands in response to emerging demand management policies. Behavioral responses to such policies have proved challenging to forecast using existing data collection and modelling techniques, in part because of the array of responses that could occur over time, space and across individuals. This has prompted a call for more in-depth research into underlying behavioral mechanisms that govern observed responses, especially activity scheduling decision processes (1-4).
As a result of these growing needs, advances in survey designs are emerging. These include use of qualitative survey techniques (5), stated preference/adaptation (6, 7), gaming and simulation (8), and a variety of psychological/cognition experiments such as “think aloud” protocols (9). Increasingly, computers, the internet, and passive tracing technologies (e.g. GPS) are being used to support these efforts (10, 11). Such technologies are supporting development of an emerging class of activity scheduling decision process surveys. What makes these surveys unique is their ability to trace the scheduling decisions of respondents as they occur in reality – i.e. the process of adding, modifying, updating, and canceling activities over time and space leading to final observed activities and travel patterns. As such, they typically cover a multi-day period over which time respondents are asked to keep an ongoing record of their scheduling decisions (self-reported in most cases). Many of these surveys involve the use of computers for data entry over a period of 3 to 7 days. This includes recent activity scheduling surveys in Canada (12, 13), the U.S. (14), and Europe (15, 16 ) that present users with a scheduling interface that resembles a typical scheduler or calendar.
The use of computers and the resulting desire to capture decision processes and observed travel patterns, presents new challenges and opportunities for quality assessment. At this early stage it is more important than ever to closely document the quantity and quality of data provided by such surveys, and the associated burden and experience of subjects who provided it. The new technologies are also providing opportunity to develop several new measures of survey quality by automatically tracing how much time a respondent devoted to the survey and the timing of when data is entered.
Survey Quality Standards
Although the development of standards for transport survey quality has received increasing attention there are no generally accepted standards for transport surveys (17, 18). There are, however, generally accepted survey data quality guidelines that are of assistance. Statistics Canada (19) has published a third edition of “Quality Guidelines” that is particular thorough. The document stresses the importance of data validation - the process of reviewing the data to ensure that grossly erroneous data are not released, to identify data of marginal quality, or to identify potential sources of error. The following specific “checks” of survey data are suggested:
• consistency with external sources of data;

Doherty et al. 4
• internal consistency checks, e.g., calculation of ratios that are known to lie within certain bounds;
• unit-by-unit reviews of the largest contributors to aggregate estimates; • calculation of data quality indicators such as non-response rates and imputation rates; • debriefings with staff involved in the collection and processing of the data; • “reasonableness” checks by knowledgeable subject matter experts;
Further suggestions to assess potential sources of error include detection of non-response, coverage, measurement, processing and sampling errors.
Assessing the Quality of Travel Surveys
Travel surveys in practice most often take the form of a “diary” of observed activities, travel and/or time-use (see (20-22) for a more through review). Assessing the quality of the actual data obtained from such surveys normally starts with assessing the (unit) non-response rates (23). Non-response is a problem for social surveys because it raises the question of systematic bias. That is, non-respondents, had they completed the survey, may have given systematically different responses compared to those who did respond.
After unit non-response rates, the most common quality measures focus on examination of activity and trip rates per person per day. Rates that are significantly lower than an established or standard rate raise questions as to the success of the survey in capturing an adequate quantity of information from respondents. In the specific case of multi-day surveys, which are growing in popularity (24), it is common to extend the analysis of activity/trip rates change by day of the survey (1s t day, 2nd day, etc.) or day of the week (Monday, Tuesday, etc.). Any unexplainable declines in rates on subsequent days are taken as a potential sign of respondent fatigue effects – i.e. a decreasing desire or ability to complete the survey questions accurately and completely on subsequent days of the survey. Such tendencies are common in multi-day travel surveys (12, 25, 26), and could be used to flag poor quality data.
Additional, but less commonly reported efforts to assess the quality of travel survey include analyzing:
• the number of missing values (item non-response), including missing attributes and periods of time
• the number of values that needed to be “cleaned” or “imputed” in some fashion • inconsistent values, such as unrealistic travel times and unavailable modes.
At a recent international workshop on transport survey quality (27) a general consensus was reached on the need for further standards and guidance in the application of the quality measures identified above. However, few recommendations for specific standards emerged from the workshop, nor are they widely available in the literature. Part of the problem is that “true” comparative measures of good quality data are rarely available. In terms of activity/trip rates, it was only generally recommended (but not examined empirically) that the average number of in-home and out-of-home activity and travel episodes per adult per day should be expected to be in the range 16-20, where in-home activities are recorded to a specific level of coarseness (27). Departures from this value were to be “examined carefully for potential problems”. To what
Doherty et al. 5
extent such departures are of concern, and how to conduct further careful assessment, are clearly areas for further research, especially for emerging survey methods.
OBJECTIVES
This paper has several main objectives:
1. to describe in detail an example of an emerging activity scheduling process survey capable of providing detailed information on travel patterns and activity scheduling decisions making;
2. to assesses the overall quality of the resulting data using traditional measures (activity, trip rates)
3. to propose and utilize several new quality measures that focus on scheduling decisions rates, and examination of multi-day patterns in data acquisition.
4. to assesses respondent burden levels and experiences with this emerging survey technique.
The longer-term hope is that the focus on data quality indicators early in the development of scheduling process survey techniques will help improve their design and speed their application so as to more quickly meet emerging data needs.
DATA COLLECTION
Survey Design
The travel survey method used as a basis for this paper involved the use of the CHASE (Computerized Household Activity Scheduling Elicitor) survey methodology (12, 28). CHASE focuses on capturing multi-day information on observed activity-travel patterns while tracing the underlying activity scheduling process. It does so by providing a scheduling program to respondents on a computer that provides a forum for them to self-report their on-going scheduling decisions over the course of a 7-day period. The scheduling program tracks when and why the various scheduling decisions are made, and displays back to users the results of their scheduling efforts in the form of observed activity-travel patterns. To the user, the program appears not unlike a typical scheduler or dayplanner, and users are asked to add, modify and delete activities anywhere on their schedule as their plans evolve over a multi-day period. The final state of their activities on screen is taken as observed patterns, replicating what is typically captured by traditional activity diaries.
CHASE was originally developed and applied to a small sample by Doherty and Miller (12) in 1997. Since then, it has spawned several related studies (13-16, 28). This paper utilizes data collected recently in Toronto that represents the largest CHASE sample collected to date. The CHASE survey starts with an upfront interview and is followed by the week-long scheduling survey on a laptop computer provided to respondents. The main purpose of the upfront interview is to record background information on:
• socio -demographic information of all household members • the names and relationship of potential involved persons • a listing of typical travel modes used (auto, bicycle, etc.) • most likely activities to occur in the coming week

Doherty et al. 6
A wide range of activity types were systematically probed for, organized into nine main groups and 66 specific activity types. All information is entered directly into a database so that it can be accessed by the CHASE program – in particular, to be able to generate pull-down list boxes to speed choice of activity attributes such as mode, activity type, and involved persons.
After this up-front interview, participants kept an on-going record of their scheduling behavior via CHASE, starting on a chosen day of the week (which varied). The main scheduling interface, as shown in Figure 1 depicts the days across the top, and time along the left, in a typically calendar-type format. The main commands or operations that the user can initiate are displayed as menu options at the top of the screen, including basic commands to “Add”, ‘Modify”, and “Delete” activities on screen. Users are asked to login to the program preferably every day, and are given the following basic instructions:
• On the first night, add activities anywhere in your schedule that you have already planned or thought about doing before logging on to the computer – meaning those activities for which you have at least tentatively planned the day, time, location, and involved persons.
• On subsequent days, continue to: - Add new activities to future scheduling days - Review future planned activities and update/modify/delete them according to
further changes or refinements in your plans - Review past time periods and modifying/delete them to reflect what actually
occurred. • Remember that each preplanned activity, modification, or deletion entered by them is
recorded by the computer, and is of extreme value to the research team – i.e. we are interested in how you put your life together and how it changes, as well what you actually do.
• Include all activities that last longer than 10 minutes. The exception is for activities involving travel – include all of these, regardless of how long they take (e.g. dry cleaning stop; dropping off kids).
In total, a nine-day data “entry” period was implemented. This included a seven-day observation period, with a preliminary entry day before-hand (to start entering any planned activities) and a last entry day to finish off the week.
Scheduling activities using CHASE involved selecting a box on screen and choosing the “Add” command, which was followed by the presentation of the dialog box shown in Figure 2, which queried for 11 attributes of observed activities. Clicking on an existing activity on screen and selecting the “Modify” command would bring up the same dialog as in Figure 2, allowing the user to modify any of the attributes shown.
Additional questions immediately followed the addition, modification or deletion of an activity, and depended on the type of action taken, when it was entered, and how it compared to surrounding activities. Most importantly, users were often asked “When did you originally plan this activity?”, as shown in Figure 3. This is the case for activities added on the “preliminary entry day” of the survey as well as the following day, since many of these would have been planned much earlier. It also applies to all activities added/modified/deleted “after-the-fact” - meaning they entered the decision into the CHASE program after the activity actually occurred,

Doherty et al. 7
and for which the planning time horizon would otherwise be unclear. Only in the case where an activity was add/modified/deleted one or more days in advance of the actual event (but after the first two days) was the timing of the decision not explicitly prompted for. In these cases, we can at least assume that the timing of the decision corresponds to how many days in advance it was entered. This assumption was deemed reasonable as it was felt that after two days the respondents should be largely left entering only day-to-day decisions rather than those planned much in advance.
All options in Figure 3 had at least one follow-up question to capture for more detail on the nature of the decision (they appear once the user clicks “next” in the dialog). For instance, after the selection “Prior to the activity on the same day”, the user was asked “Approximately when on the same day did you make this decision?”, with options “within an hour”, “1-2 hours before”, etc. The option “I didn’t really give it much thought – it happened as part of a regular routine” was followed by “Can you recall when you last thought about the planning of this activity?”. The option “Just before the activity” (as well as “prior to the activity on the same day, 1-2 hours before) was followed by a prompt asking “Did you need to coordinate or communicate with other people concerning this decision?”, with options to specify coordination by regular phone, cell phone, email, in persons, no coordination, or cannot recall.
Additional prompts included those that asked the user why certain decisions were made, as well as messages in response to possible errors or omissions, complete with options to correct them.
Following completion of a person’s schedule (meaning the user had specified all their activities and travel over the seven-day period without blanks, and it is the last entry day) an “end of week review” was conducted to systemically query sub jects concerning the general attributes of the types of activities that the person performed during the week, including the spatial, temporal and interpersonal flexibility of activities, as well as normal durations and frequencies.
Conduct of the Survey
The survey was conducted over a period of 14 months, from April 2002 to May 2003. An incentive consisting of a $20 gift certificate was offered to respondents. Start-up interviews lasting an average of 32 minutes were conducted in the respondent’s home with as many household members present as possible. A training session with CHASE followed lasting about 10 – 15 minutes. Households were then left with the computer for the seven day scheduling exercise. An effort was made to contact the household at least once over the course of the week. In the wrap-up interview at the end of the seven day period, the interviewer confirmed completion of the survey and collected the laptop computer.
Survey Sample, Recruitment and Unit Non-Response Rates
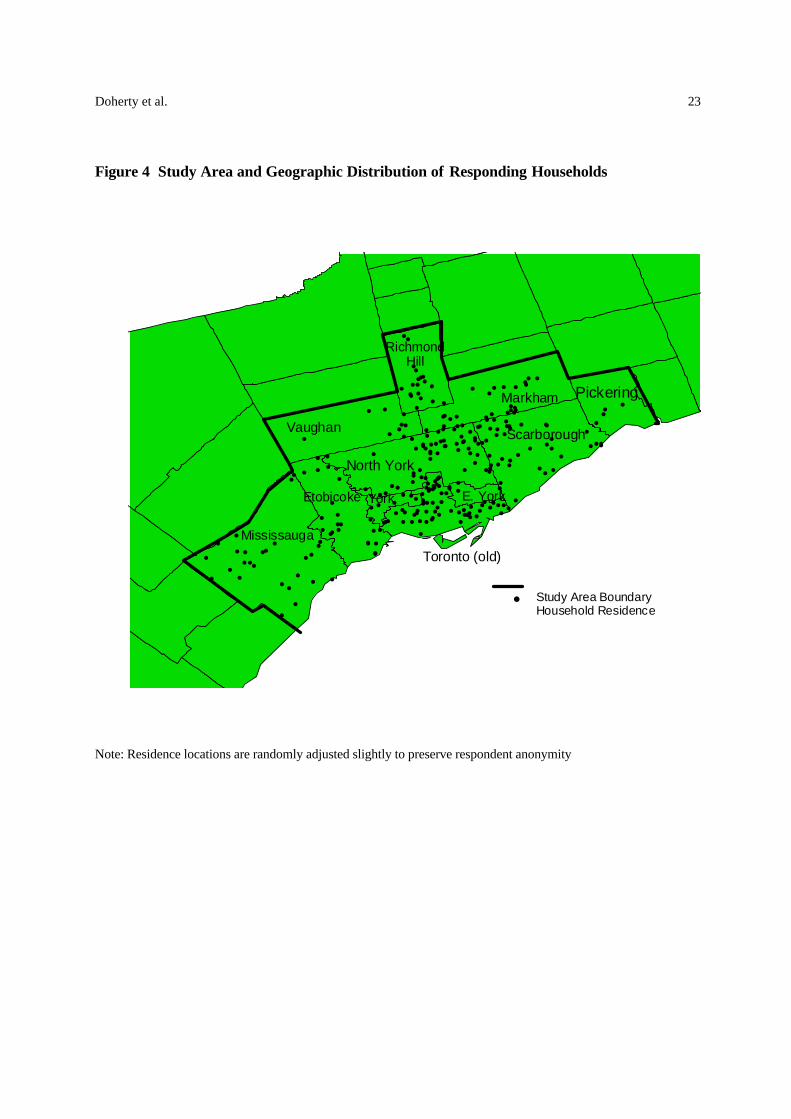
A sample of household telephone numbers and addresses was selected randomly from the telephone directory for the study area shown in Figure 4. The study area includes the entire City of Toronto including the central part of the city and suburban areas. In total, the study area

Doherty et al. 8
covers about 74% of all households in the Toronto Census Metropolitan Area and represents an excellent diversity of urban forms, population densities, and levels of transportation accessibility.
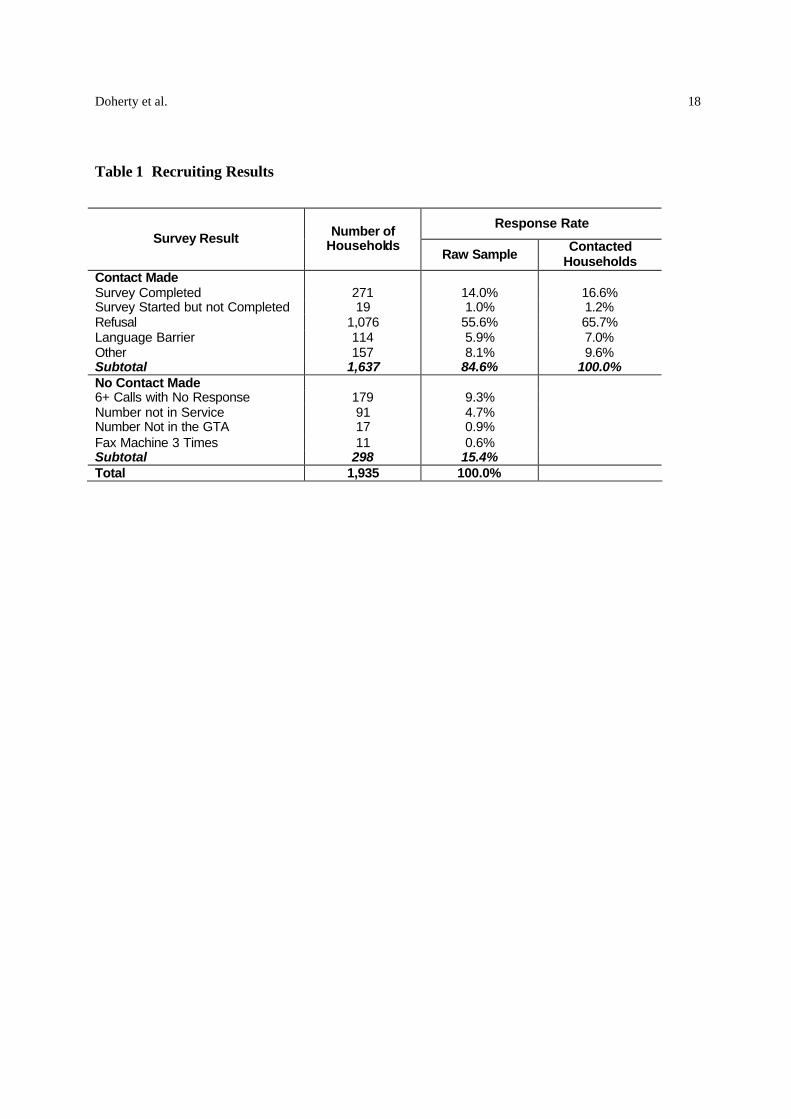
Four interviewers were assigned to recruit households by telephone in different parts of the study area. Recruiting results are shown in Table 1. Out of a total of 1935 numbers in the sample, 1637 households were contacted successfully. Out of these successfully contacted households, 271 agreed to participate representing an effective response rate of 16.6%. Considering the level of commitment expected of the respondent, this is considered to be an acceptable response rate. Approximately 300 households could not be reached for a variety of reasons, such as phones not in service. Other telephone numbers were called more than six times at different times of day and on different days of the week without an answer. It is notable that 7% of contacted households cited language as the reason for not partaking in the survey. Thus, it is likely that there is an under-representation of recent immigrants who form a large proportion of the Toronto population.
For households that agreed to participate, a significant effort was made to convince as many adult household members to participate in the survey as possible. In 75% of households, all adult members completed the CHASE survey, with an average of 1.6 adults participating per household.
Characteristics of the Sample
Respondents recruited for the survey were found to be reasonably representative of the total population. As shown in Figure 4, participating households are located at diverse locations throughout the study area. The proportion of responding households in each main area of the city (central city, mature suburbs, and newer suburbs) also closely matched the proportion of actual households in these areas as derived from the 2001 Census.
Other significant household variables, including household size, number of vehicles and dwelling type distribution were also compared against 2001 data from the Transportation Tomorrow Survey (TTS), a travel survey conducted on 5% of the households in the Greater Toronto Area and weighted to reflect census household counts (29). While the survey distribution of household size and number of vehicles is very close to those of the full population, the sample was slightly over-representative of households in single family homes and townhouses and under-represents apartment dwellers.
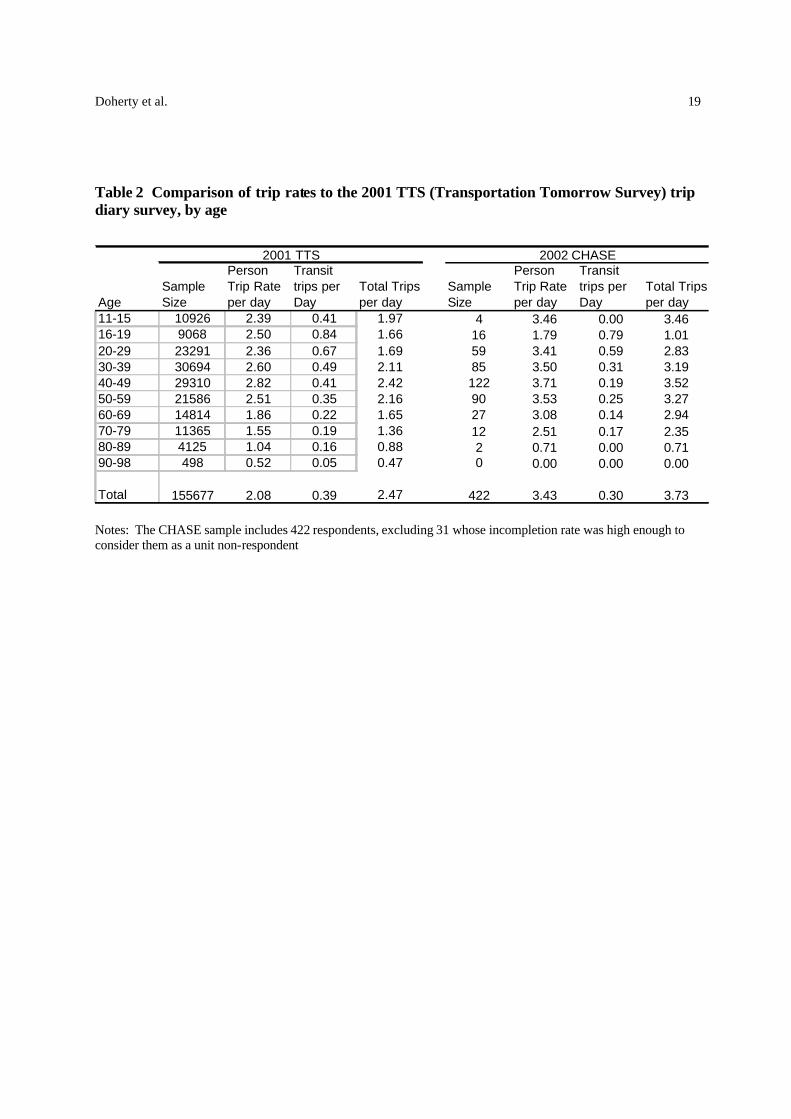
From the 271 households, a total of 452 individuals participated in the CHASE survey (an additional 31 individual respondents were later filtered out owing to high incompletion rates). The distribution by age is shown in Table 2, with comparative statistics from the TTS survey. Ages ranged from 14 to 82, with an average age of 42.5. Some over-representation of the age groups 40-49 and 50-59 was evident as compared to the TTS sample. Males represented 53% of the sample, females 47%. Average income was $46,000 (CAD). The proportion of individuals who were involved in partnership in the household was 65.3%, single adults 21.2%, other adult living in a household 8.4%, teens 3.3%, and unknown 1.8%.

Doherty et al. 9
Assessment Survey (i.e. “Surveying the surveyed”)
Given the still experimental nature of computerized scheduling surveys, a follow-up “assessment” survey was conducted with a sub-sample of respondents via telephone. The purpose of this survey was to examine the views of respondents and any potential problems they may have experienced. Telephone interviews were conducted from May to October 2002. Eleven questions were designed to assess a wide variety of quality indicators, including enjoyment of the survey, computer literacy, length, design and the effect of the incentive.
The households were telephoned within 48 hours of completing the initial survey. After this time period no further contact was attempted in order to limit recall problems. Attempts were made to reach 70 households, of which 41 were successfully contacted, and 31 were willing and able to participate.
RESULTS
Schedule completion rates and login durations
The vast majority of the 453 individual respondents provided complete seven-day schedules accounting for every hour of every day. In only 31 cases, did respondents not provide sufficient data – including 18 with over 50% missing time. These respondents were removed from all subsequent analysis, leaving 422 respondents.
The amount of time spent completing the survey, or “login duration”, is both an indication of data quality and respondent burden. Login durations were calculated based on examination of the time-stamp of every entry in the program, wherein the start and end time-stamps of continuous series of entries define login periods. The duration of these periods includes short pauses in entry less than 90 seconds, during which time subjects are typically entering data, viewing information on screen, or responding to additional prompts. The average login duration was 139 minutes per week, with a standard deviation of 70.0. The distribution across respondents was very close to normal, with a slightly elongated tail to the right of respondents with login durations as high as 380 minutes. The variation in login durations reflects the natural variation in scheduling complexity in different people’s lives, as well as differences in the speed and aptitude in program usage.
Activity, trip and scheduling step rates
As discussed in the literature review, activity and trip rates are most often reported as a means to assess data quality. For scheduling process surveys, the rate of additions, modifications and deletions are similarly important. In addition, because the survey covered a multi-day period, these rates can be compared on a per day basis to provide further insights in to possible fatigue effects.
Overall, respondents entered an average of 12.0 additions (s.d. 4.57), 1.47 modifications (s.d. 1.97) and 0.25 deletion (s.d. 0.80) scheduling decisions per day, resulting in an average of 11.8 observed activities (s.d. 4.4) and 3.74 one-way trips (s.d. 2.5) per day. As indicated by the standard deviations, these rates varied considerably across respondents. The number of

Doherty et al. 10
activities, trips and addition decisions varied in a relatively normal fashion, whereas modifications and deletions were skewed to the left.
By way of comparison, the trip rates were further compared to those captured by the 2001 TTS trip diary survey, as shown in Table 2. In terms of total trips, the CHASE survey captured an average of at least one more trip per day. However, transit trip rates from CHASE were actually slightly lower. The increased trip capture rate is likely due to a combination of factors, including the tendency of activity-based approaches to encourage reporting of more trips (especially short trips), and under-reporting of trips in TTS as a result of relying on one household member to report on other household member trips.
These rates suggest that overall the survey design was successful in capturing a satisfactory amount of information from respondents. Extending this analysis on a “per day” basis provides some further insights into the overall quality of the data. Figure 5 shows the activity and trips rates by day in two distinct fashions - by “entry day” (wherein a “1” represents the first entry day, 2 the second, etc.) and by day of the week (Monday, Tuesday, etc.). The two are not equivalent since people started the survey on varying days of the week. Whereas a decline in activity and trip rates is evidence by entry day, the same decline is not evident when examined by days of the week (except the decline in rates on weekends is as expected). Thus, a fatigue effect is evident in the data. However, given that the survey starts on varying days, the resulting decline in rates is at least spread throughout the week as seen in the second graph.
The differences in scheduling step entries by day are more pronounced, as shown in Figure 6. As expected on the first day, people tended to add higher number of activities to their schedules, including many routine and multi-day activities. Additions, modifications and deletion report rates run fairly stable for the next six days of the survey, and then climb gradually on the 7th and last day. This is likely a reflection of people “catching” up on missing time periods and scheduling – which is undesirable from a design perspective (we’d rather see more consistent scheduling entry on every day of the survey), but mostly unavoidable and expected from a behavioral stand -point.
Planning Time Horizons
The planning horizons for activity decisions are of considerable interest on their own. By way of data quality, it is valuable to examine the timing of when people entered their decisions into the program (before the event occurred, on the same day as the event, or afterward) versus when they reported the decision was actually planned (pre-planned a week in advance, a day in advance, impulsively planned, etc.). What is desirable is that a high proportion of pre-planned decisions be entered into the survey before the event occurred, rather than after-the-fact. In a sense, the survey instrument is then “tracing” when the decision gets made, rather than asking subjects to report post-hoc when it was made (via Figure 3).
Figure 7 displays the proportion of activity addition decisions entered into the CHASE program the “same day” as the activity, before-the-fact, and after-the-fact, by when they reported to have been planned. Overall, 31.2 % of the 35,137 addition decisions were entered before the activity occurred, 24.6% on the same day, and 44.2% after the activity took place. What is of most concern is the proportion of activities entered after-the-fact (the black bars in the figure)

Doherty et al. 11
that were reported to have been planned ahead by a day or more. Impulsive and same day decisions are most likely to be entered after the fact (and thus have the highest proportion at 66 and 51% respectively). However, this drops steadily for decisions the longer in advance the decision was planned to between 10 and 20% for additions placed 1 or more days in advance.
Respondent Reactions
The first question asked in the assessment survey pertained to the respondents overall enjoyment of the survey and the computer. Overall, 58% reported enjoying completing the survey, while 19% did not, whereas 23% expressed indifference towards the survey. It should be noted however that those households that were not reached in time or refused to do the survey may have had higher overall dissatisfaction with the study.
The majority of people77% (24 out of 31), reported enjoying working with the laptop computer, while 10% reported having problems with the survey in terms of it taking too long and not being comfortable with the technology. Three respondents had no likes or dislikes about the computer usage.
Respondents were asked whether or not they were willing to participate in another study such as this one in the near future. The majority of participants (81%) stated that in fact they would. Only one said that they would not participate, claiming they had difficulty with the program. The remaining 16% stated that they were not sure, or did not know, and mentioned time as being a major factor. Again, it should be noted that these results are slightly biased due to the fact that not all households that completed the study were successfully contacted.
Respondents were also asked whether they had any forms of difficulty during the survey period. A total of 64.5% of the people surveyed had some form of difficulty throughout the week, including the following issues (values in brackets indicate frequency of response):
• Too intrusive [3] • Too repetitive [6] • Too tedious [6] • Computer crashed or exhibited unusual behavior [7] • Was taking a long time [9] • Other [11]
Regarding the length of the survey, in a separate question, 48% of the respondents felt that the survey took too lo ng.
In terms of “shortcuts”, respondents were asked if they took any measures to quicken the survey or lessen the amount of information being inputted. The majority of people (74.2%) reported that they did indeed find themselves taking some shortcuts, such as skipping activities and avoiding preplanning. Despite these shortcuts, 71% still felt the program was well designed and able to capture how they plan and change their daily activities accurately. Only three believed that it was not designed well enough to fully capture their behavior.
Doherty et al. 12
The final question concerned whether or not the respondents would have done the study without the $20 gift certificate incentive. 94% of the households reported they would have done this survey without the incentive.
Several anecdotal findings were also discovered as a result of the assessment interviews. In some cases, people reported that other household members inputted their schedules for them. In one household, a woman entered the schedules for three other family members including herself. One household felt that one week was not enough to capture their daily activities. This was confirmed by some of the households who mentioned that they did not have a typical week. A longer survey period also allows people to become more familiar with the program itself. An alternative would be to allow practice days, as suggested by a household.
DISCUSSION AND CONCLUSIONS
This paper set out to describe and assess an emerging class of travel surveys that focus on the activity scheduling process that underlies observed activity travel patterns. It has contributed both a detailed description of the survey instrument, and in-depth assessment of the results, including separate survey assessment from a sub-sample of respondent.
One of the overriding objectives of this paper was to attempt to propose and quantitatively analyze potential data quality measures that could be used as a basis to assess an emerging class of activity scheduling process surveys. This is in part due to the lack of such guidelines for such advanced survey methods in literature, and the strong consensus among travel behavior researchers that they are direly needed. Whilst the particular survey presented in this paper was generally successful in tracking both observed patterns and underlying decisions process over a multi-day period within a household, it did come at a price in terms of respondent burden, and is clearly not perfect from a data quality perspective. However, at this early stage in our understanding of scheduling decision processes, it is important to experiment as liberally as we can, admit where improvements can be made, and identify the most amendable data quality guidelines that can support future design efforts.
Thus, results presented in this papers support the following data quality guidelines and suggestions for activity scheduling decision process surveys:
Activity/trip rates: the overall combined activity/trip rate elicited by the CHASE survey (15.5) fell at the minimum end of the 16-20 range suggested at a recent international conference on survey quality(27). However, the trips rates were well within reason, and even higher than those captured by a large scale trip diary in the same study area (3.73 vs. 2.47). Note however, that the goal of the survey was not only observed activities and travel, but underlying decision steps, which were an added burden. It can be argued that, at least for activity rates, they can be artificially inflated simply by asking for more detailed activities to be reported. Thus, using activity/trip rates to assess activity scheduling surveys is not encouraged , at least not in isolation.
Scheduling steps: Given the focus of scheduling surveys on decisions, it would appear more appropriate to place more weight on the rates of decisions captured in assessing data quality. The overall number of scheduling entries was comparable to previous surveys, but it was hoped that the reported number of modifications and deletions would be higher. As

Doherty et al. 13
compared to a previous CHASE survey (12), the current survey resulted in a similar level of additions on average per person per day, but less modifications and deletions. In reality, people are constantly changing their plans, and at best, the CHASE survey captures a sampling of the main modifications that occurred – the true level of which may never be known with any degree of accuracy. Further exploration of the nature of modifications and deletions reported is needed before a definitive quality guideline can be set – our suggestions at present would be that a good quality scheduling survey be able to capture a minimum of 2-3 modifications/deletions per day.
Planning time horizons: A good quality scheduling survey should provide ample opportunity and encourage entry of scheduling decisions as they occur – in operational terms, this can be measured by examining the proportion of pre-planned decisions that were actually entered into the survey before the event occurred, rather than after-the-fact. In a sense, the survey instrument is then “tracing” when the decision gets made, rather than asking subjects to report post-hoc when the decision was made (via Figure 3). Results of this survey suggest that over 80% of preplanned decisions should indeed be entered before the associated event occurs.
Login Durations: The length of time to complete the survey appears to be a very dominant and recurring factor in the quality of the resulting data. On average, people spent about 20 minutes per scheduling day completing the survey – however, these times were shown vary substantially with un upper tail end of people spending a great deal more than this. This high and multi-day level of respondent burden (including an upfront interview, week long scheduling survey, and follow-up) would help to explain many of the results presented in this paper, including the low response rate (16.6%), decline activity/trip rates by day (or “fatigue effects”), and the high proportions of pre-planned activities that were instead entered after-the-fact. The follow-up assessment survey also largely confirmed this conclusions - that time was indeed a major concern to respondents, and led them to take shortcuts that invariably effected data quality. Obviously, a delicate balance exists between the desire to obtain a high quantity of information, and the loss of quality that results for the associated increase in burden.
Our suggested guideline concerning login durations is simple – reduce it as much as possible. In more technical terms, the goal should be to tighten the distribution of login durations, and shift them to the left of 20 minutes per day. Several suggestions for doing so, and reducing burden generally, include:
• choose “target” days well enough in the future for which people schedule, leaving intervening days blank
• provide a means for subjects to login to the survey more frequently, thereby spreading the burden out over the course of a day (e.g. using hand-held computers rather than laptops).
• make the survey questions less repetitive and time consuming by choosing only certain days to ask them, or implementing more random or periodic prompting
• utilize other technologies to passively trace certain aspects of people schedules, especially the more repetitive ones (e.g. through using Global Position Systems to trace activity locations, travel routes, and activity start/end times).
• higher incentives would not appear to improve matters
Doherty et al. 14
One important survey quality issue not addressed in this paper is the effect of the survey instrument itself on scheduling process – i.e. that that respondents may be conditioned into planning and/or changing their behavior as a result displaying it to them on screen. At this early stage in our understanding of scheduling processes it is difficult to quantitatively assess the potential instrument bias, as known or standard levels of specific scheduling behaviors simply do not exist. One of the only recourses in the short-term is to ask subjects to self-report on whether they felt the instrument accurately reflected their actual behavior. Although not conclusive, evidence presented in this paper suggests that a high proportion (71%) of subjects felt the program was designed well enough to accurately capture how they plan and change their daily activities. At the same time, this suggests room for improvement and more rigorous attempts to asses such bias in the future. To end on a positive note, despite the shortcomings and biases found in the survey, those that did start the survey, tended to provide complete seven-days worth of scheduling information, involving a substantial time commitment. It is no small success that the survey was able to capture over 35,000 scheduling decisions from a fairly representative sample of 422 individuals – information that has been repeatedly called for in the literature, but has simply not been available from any other source in such a quantitative fashion. Additional information not presented in this paper was also captured, including the reasons for modifications/deletions decisions, the role of telecommunications in impulsive decisions, social networks, re-scheduling, etc. On the plus side, the authors of this paper have not sought to ask the “easy” questions, but instead, tackled one of the most challenging in the field of travel behavior, which has invariably driven us to develop a highly experimental yet exciting new survey tool. The information garnished at this early stage is deemed critical to at least beginning the search for better understand of a complex decis ion process, and will serve to support several new exploratory analysis and model developments in the near future.
ACKNOWLEDGEMENTS
The authors would like to express thanks to the Social Sciences and Humanities Research Council of Canada for their financial support. A special thank you also goes to the diligent field workers who collected the data, and all those who generously supplied their time in completing the survey.
REFERENCES
1. Axhausen, K. W. Can We Ever Obtain the Data We Would Like to Have?, in Theoretical Foundations of Travel Choice Modeling, T. Gärling, T. Laitila, and K. Westin, Editors. 1998, Elsevier Science Ltd.: Oxford. pp. 305-323.
2. Ettema, D. and H. Timmermans. Theories and Models of Activity Patterns, in Activity-Based Approaches to Travel Analysis, D. Ettema and H. Timmermans, Editors. 1997, Pergamon: Oxford. pp. 1-36.
3. Lee-Gosselin, M. Scope and Potential of Interactive Stated Response Data Collection Methods, in Household Travel Surveys: New concepts and Research Needs. 1996, Irvine,

Doherty et al. 15
California: National Academy Press, Transportation Research Board Conference Proceedings 10.
4. Bhat, C. R. and K. T. Lawton. Passenger Travel Demand Forecasting. 2000, Transportation Research Board, National Research Council (USA).
5. Clifton, K. J. and S. L. Handy. Qualitative Methods in Travel Behaviour Research, in Transport Survey Quality and Innovation, P. Stopher and P. Jones, Editors. 2003, Pergamon: New York. pp. 283-302.
6. Bates, J. Reflections on Stated Preference: Theory and Practice, in Travel Behaviour Research: Updating the State of Play, J. Ortuzar, D. Hensher, and S. Jara-Diaz, Editors. 1998, Elsevier. pp. 89-103.
7. Hensher, D. A. Stated Preference Analysis of Travel Choices: The State of Practice. Transportation , 1994, 21: 107-33.
8. Lee-Gosselin, M. The Dynamics of Car Use Patterns under Different Scenerios: A Gaming Approach, in Developments in Dynamic and Activity-Based Approaches to Travel Analysis, P. Jones, Editor. 1990, Avebury: Aldershot. pp. 250-271.
9. Ericsson, K. A. and H. A. Simon. Protocol Analysis: Verbal Reports as Data. 1993, Cambridge: MIT Press.
10. Murakami, E. and D. P. Wagner. Can Using Global Positioning System (GPS) Improve Trip Reporting? Transportation Research, 1999, 7C(2/3): 149-165.
11. Wolf, J., M. Loechl, M. Thompson, and C. Arce. Trip Rate Analysis in GPS-Enhanced Personal Travel Surveys, in Transport Survey Quality and Innovation , P. R. Stopher and P. M. Jones, Editors. 2003, Pergamon: New York. pp. 483-498.
12. Doherty, S. T. and E. J. Miller. A Computerized Household Activity Scheduling Survey. Transportation , 2000, 27(1): 75-97.
13. Doherty, S. T., M. Lee-Gosselin, K. Burns, and J. Andrey. Household Activity Rescheduling in Response to Automobile Reduction Scenarios. Transportation Research Record: Journal of the Transportation Research Board, 2002, 1807: 174-182.
14. Lee, M. S. and M. G. McNally. Experimenting with a Computerised Self-Administrative Activity Survey: Evaluating a Pilot Study, paper presented at the 80th Annual Meeting the Transportation Research Board. 2001, Washington, DC.
15. Kreitz, M., Doherty, S. T. Spatial Behavioral Data: Collection and Use in Activity Scheduling Models . Transportation Research Record: Journal of the Transportation Research Board, 2002, 1804(3545): 126-133.
16. Rindsfüser, G., H. Mühlhans, S. T. Doherty, and K. J. Beckmann. Tracing the Planning and Execution of Activities and Their Attributes - Design and Application of a Hand-Held Scheduling Process Survey, paper presented at the 10th International Conference on Travel Behaviour Research. 2003, Lucerne.
17. Stopher, P. and P. Jones. Developing Standards of Transport Survey Quality, in Transport Survey Quality and Innovation, P. J. Stopher, P., Editor. 2003, Pergamon: New York. pp. 1-38.
18. National Cooperative Highway Research Program. The Case for Standardizing Household Travel Surveys. 2002, Transportation Research Board, Research Results Digest Number 261.
19. Statistics Canada. Statistics Canada Quality Guidelines Third Edition. 1998, Statistics Canada: Ottawa. pp. 101.
20. Richardson, A., E. Ampt, and A. Meyburg. Survey Methods for Transport Planning. 1996, Melbourne: Eucalyptus Press.

Doherty et al. 16
21. Griffiths, R., A. J. Richardson, and M. E. H. Lee-Gosselin. Travel Surveys in the New Millennium, in Transportation Research at the Millennium. 2000, National Academy Press: Washington, D.C.
22. Stecher, C. C., S. Bricka, and L. Goldenberg. Travel Behavior Survey Data Collection Instruments, in Household Travel Surveys: New concepts and Research Needs. 1996, Irvine, California: National Academy Press, Transportation Research Board Conference Proceedings 10.
23. Richardson, A. J. and A. H. Meyburg. Definitions of Unit Nonresponse in Travel Surveys, in Transport Survey Quality and Innovation, P. Stopher and P. Jones, Editors. 2003, Pergamon: New York. pp. 587-604.
24. Purvis, C. L. and T. Ruiz. Standards and Practice for Multi-Day and Multi-Period Surveys, in Transport Survey Quality and Innovation, P. Stopher and P. Jones, Editors. 2003, Pergamon: New York. pp. 271-282.
25. Golob, T. F. and H. Meurs. Biases in Response over Time in a Seven-Day Travel Diary. Transportation , 1986, 13(2): 163-181.
26. Lawton, K. T. and E. I. Pas. Resource Paper for Survey Methodologies Workshop, in Household Travel Surveys: New Concepts and Research. 1995, Irvine, California: National Academic Press, Conference Proceedings 10.
27. Stopher, P. R. and P. M. Jones. Summary of Future Directions, in Transport Survey Quality and Innovation, P. R. Stopher and P. M. Jones, Editors. 2003, Pergamon: New York. pp. 635-646.
28. Doherty, S. T. Interactive Methods for Activity Scheduling Processes, in Transportation Systems Planning: Methods and Applications, K. Goulias, Editor. 2002, CRC Press: New York.
29. Data Management Group. Transportation Tomorrow Survey 2001: Design and Conduct of the Survey. 2003, Joint Program in Transportation, University of Toronto: Toronto.

Doherty et al. 17
List of Tables and Figures Table 1 Recruiting Results............................................................................................................18 Table 2 Comparison of trip rates to the 2001 TTS (Transportation Tomorrow Survey) trip diary
survey, by age..........................................................................................................................19 Figure 1 CHASE main screen, showing example in-progress schedule as it would appear on
Thursday..................................................................................................................................20 Figure 2 CHASE add/modify dialog box with example entry......................................................21 Figure 3 CHASE Planning Time Horizon dialog box ..................................................................22 Figure 4 Study Area and Geographic Distribution of Responding Households ...........................23 Figure 5 Activity and Trip rates per person per Entry Day (1st day of the observed 7-day period,
2nd day, etc.) and per Weekday (Monday, Tuesday, etc.) .......................................................24 Figure 6 Scheduling decisions rates (additions, modifications and deletions) per person per entry
day ...........................................................................................................................................25 Figure 7 Proportion of activity addition decisions entered into the CHASE program the “same
day” as the activity, before-the-fact, and after-the-fact, by when they reported to have been planned. (n=35,137) ................................................................................................................26
Doherty et al. 18
Table 1 Recruiting Results
Response Rate Survey Result Number of
Households Raw Sample Contacted
Households Contact Made Survey Completed 271 14.0% 16.6% Survey Started but not Completed 19 1.0% 1.2% Refusal 1,076 55.6% 65.7% Language Barrier 114 5.9% 7.0% Other 157 8.1% 9.6% Subtotal 1,637 84.6% 100.0% No Contact Made 6+ Calls with No Response 179 9.3% Number not in Service 91 4.7% Number Not in the GTA 17 0.9% Fax Machine 3 Times 11 0.6% Subtotal 298 15.4% Total 1,935 100.0%
Doherty et al. 19
Table 2 Comparison of trip rates to the 2001 TTS (Transportation Tomorrow Survey) trip diary survey, by age
AgeSample Size
Person Trip Rate per day
Transit trips per Day
Total Trips per day
Sample Size
Person Trip Rate per day
Transit trips per Day
Total Trips per day
11-15 10926 2.39 0.41 1.97 4 3.46 0.00 3.4616-19 9068 2.50 0.84 1.66 16 1.79 0.79 1.0120-29 23291 2.36 0.67 1.69 59 3.41 0.59 2.8330-39 30694 2.60 0.49 2.11 85 3.50 0.31 3.1940-49 29310 2.82 0.41 2.42 122 3.71 0.19 3.5250-59 21586 2.51 0.35 2.16 90 3.53 0.25 3.2760-69 14814 1.86 0.22 1.65 27 3.08 0.14 2.9470-79 11365 1.55 0.19 1.36 12 2.51 0.17 2.3580-89 4125 1.04 0.16 0.88 2 0.71 0.00 0.7190-98 498 0.52 0.05 0.47 0 0.00 0.00 0.00
Total 155677 2.08 0.39 2.47 422 3.43 0.30 3.73
2001 TTS 2002 CHASE
Notes: The CHASE sample includes 422 respondents, excluding 31 whose incompletion rate was high enough to consider them as a unit non-respondent

Doherty et al. 20
Figure 1 CHASE main screen, showing example in-progress schedule as it would appear on Thursday
Notes:
1. Only five of seven days shown on screen. User can scroll to other days and times of day. 2. Double-clicking an activity, as shown with the “At work” activity on Friday, reveals a longer summary of
the activity. Choosing the “Modify” command brings up Figure 2 to reveal full detail of the activity. 3. Original is in color.

Doherty et al. 21
Figure 2 CHASE add/modify dialog box with example entry.

Doherty et al. 22
Figure 3 CHASE Planning Time Horizon dialog box
Notes: For modifications, the option “During the activity” is added to the top of the list. See text for explanation of subsequent questions that follow the “next” button.
Doherty et al. 23
Figure 4 Study Area and Geographic Distribution of Responding Households
Note: Residence locations are randomly adjusted slightly to preserve respondent anonymity
Study Area BoundaryHousehold Residence
ll
ll
l l
l
l
l
l
l
l
l
l
l
lll
l
ll
l
l
l
l
ll
l
l
l
l
l
l
l
l
l
l
l
l
l
ll
l
l
ll
l
l
l
l
l
l l
l
l
l
llll
l
l
l
l
l
l
l
l
l
l
ll
l
l
l
llll
l
l
ll
l
lll
l
l
l
l
l
l
l
l
ll
l
l
l
ll
l
l
l
ll l l
l
l
l
l
l
l
ll
l
ll
l
l
l
l
l
l
l
l
l
l
l
ll
ll
l
l
ll
l
l
l
l
l
l
l
l
l
ll
l
ll
l
l
l
l
ll
l
l
l
l
l
l
ll
lll
ll
l
lll l
ll
ll
l
l
l
l
l
l
ll
l
l
l
lll
ll
l
l
l
ll
l
l
ll
l
l
l
ll
l
lll l l
l
l
l
l
l
l
ll
ll
l
ll
l
l
ll
l
l
l
l
l
l
l
l l
l
l
l
llll l
l
l
l
l
l
l
l
l
l
l
l
ll
l
l
ll
Vaughan
Markham
RichmondHill
Mississauga
Pickering
Scarborough
North York
Etobicoke
Toronto (old)
E. YorkYork
l

Doherty et al. 24
Figure 5 Activity and Trip rates per person per Entry Day (1st day of the observed 7-day period, 2nd day, etc.) and per Weekday (Monday, Tuesday, etc.)
0
2
4
6
8
10
12
14
1 2 3 4 5 6 7Entry Day
Ave
rag
e ra
te p
er p
erso
n p
er d
ay
Trips Activities
0
2
4
6
8
10
12
14
Monda
y
Tues
day
Wedne
sday
Thurs
day
Frida
y
Satur
day
Sund
ay
Weekday
Ave
rag
e ra
te p
er p
erso
n p
er d
ay
Trips Activities

Doherty et al. 25
Figure 6 Scheduling decisions rates (additions, modifications and deletions) per person per entry day
0
5
10
15
20
25
Daybefore
1 2 3 4 5 6 7 Dayafter
Entry Day
Freq
uenc
y
AddModifyDelete
-------------------- Observed 7-day period --------------------

Doherty et al. 26
Figure 7 Proportion of activity addition decisions entered into the CHASE program the “same day” as the activity, before-the-fact, and after-the-fact, by when they reported to have been planned. (n=35,137)
6469
2826
406118 83 62
29 26 899
1536 1932
3352
2731
292
70 2512
13 6
480
789
684
1225
607 416 344 249 2285912
670
1315
0%
10%
20%
30%
40%
50%
60%
70%
80%
90%
100%
Impu
lsive
Same d
ay
1 day
befor
e
2 day
s befo
re
3 day
s befo
re
4 day
s befo
re
5 day
s befo
re
6 day
s befo
re
Weeks/
Months
/Yrs a
go Routine
Canno
t reca
ll
When Planned
Per
cent
age
of D
ecis
ions
Entered Before-the-factEntered the Same dayEntered After-the-fact
Related Documents