IEEE TRANSACTIONS ON BIOMEDICAL ENGINEERING, VOL. BME-33, NO. 9, SEPTEMBER 1986 Computer Simulation of the Wolff-Parkinson-White Preexcitation Syndrome with a Modified Miller- Geselowitz Heart Model MICHEL LORANGE AND RAMESH M. GULRAJANI, SENIOR MEMBER, IEEE Abstract-The implementation of element-to-element propagation into the Miller-Geselowitz heart model, so as to automatically generate activation isochrones, is described. This implementation was achieved from initiation sites on the endocardial surface of the model via a Huygens' construction, utilizing ellipsoidal propagation wavelets to re- flect anisotropic propagation in the myocardium. Isochrones similar to those specified for normal activation of the original Miller-Geselowitz model were obtained, using propagation velocities derived from pub- lished propagation velocities measured in isolated tissue. Futther val- idation of the new model was sought by simulating the Wolff-Parkin- son-White syndrome, in which preexcitation of the ventricles of the heart occurs due to an accessory pathway connecting atria and ventri- cles, resulting in an initial delta wave in the QRS complex of the elec- trocardiogram. The approximate site of the accessory pathway may be deduced from the subject's body surface potential map pattern during the delta wave, or from the polarities of the delta wave in the 12-lead electrocardiogram, or again from the orientation of the spatial vector- cardiogram during the delta wave. By specifying eight separate acces- sory pathway initiation sites, followed 40 ms later by normal activa- tion, the isochrones corresponding to preexcitation were simulated. The body surface potential maps, electrocardiograms, and vectorcar- diograms were calculated using an inhomogeneous torso model. While agreement between simulated and experimentally reported map pat- terns was very good for all eight sites, that between delta wave polar- ities in simulated and clinically expected electrocardiograms was not as good, owing to the sensitivity of these polarities to variations in heart orientation and position within the torso. This was also the case for delta vector orientations in simulated and clinically recorded vector- cardiograms. INTRODUCTION TN recent years, the concept of regarding the ventricular lmyocardium as a bidomain, comprising intracellular and extracellular (interstitial) "interpenetrating" do- mains, occupying the same space, has gained consider- able acceptance. Miller and Geselowitz [1] used this ap- proach to show that for purposes of torso potential cal- culations, the effective dipole moment per unit volume p, assumed to act in extracellular space, could be ex- pressed as Manuscript received December 2, 1985. This work was supported in part by grants from the Medical Research Council of Canada (PG-12) and the-Quebec Heart Foundation, and also in part by the Fonds de la recherche en sante du Quebec through a Senior Research Scholarship to R.M. Gul- rajani. M. Lorange is with the Institut de GEnie Biomedical, Ecole Polytech- nique et Universit6 de Montrdal, Montr6al, P.Q., Canada. R. M. Gulrajani is with the Centre de Recherche, H6pital du Sacre- Coeur, Montreal, Quebec, P.Q., Canada H4J 1C5. IEEE Log Number 8609546. P = -giV4i (la) In (la), Vbi is the spatial gradient of the intracellular po- tential distribution 4i, and gi is an effective, assumed isotropic, intracellular conductivity that results because of the premise that both intracellular and extracellular mi- lieus occupy the same total tissue space. Equation (la) can also be written in terms of the spatial gradient of the transmembrane potential distribution Vm, - gige gi + ge (lb) where g, is the effective, isotropic, extracellular conduc- tivity [2]. Thus, the effective dipole moment density p, acting in extracellular space of conductivity ge, is propor- tional to the negative spatial gradient of the transmem- brane potential distribution. Using approximately 4000 points in a three-dimensional rectangular array to repre- sent the geometry of the ventricular myocardium, in con- junction with an assumed normal activation sequence and a piecewise-linear transmembrane action potential wave- form for each model point, Miller and Geselowitz calcu- lated the elemental dipoles throughout activation and re- covery at each model point from the spatial gradient of the transmembrane potential distribution. These dipoles were then summed vectorially according to heart region, to eventually arrive at a 23-dipole heart model, whose time-varying dipoles represented cardiac electrical activ- ity. When placed within a numerical torso model, this heart model gave rise to surface potentials that corre- sponded well to those observed in normals. Miller and Geselowitz [3] also used their model for a simulation study of surface electrocardiograms (ECG's) during ischemia and infarction, by appropriately altering the action poten- tial waveforms of "ischemic" regions and suppressing those of "infarcted" ones. The Miller-Geselowitz (M- G) model has also been used at our institution for a the- oretical'investigation of vectorcardiographic lead system accuracy [4], and for a simulation study of the effects of torso conductivity inhomogeneities on ECG potentials [5]. One of the drawbacks of the M-G heart model is the manual selection of the activation or onset times of all 4000 or so intracellular action potentials, in other words, the manual specification of the activation isochrones. This 0018-9294/86/0900-0862$01 .00 © 1986 IEEE 862

Welcome message from author
This document is posted to help you gain knowledge. Please leave a comment to let me know what you think about it! Share it to your friends and learn new things together.
Transcript
IEEE TRANSACTIONS ON BIOMEDICAL ENGINEERING, VOL. BME-33, NO. 9, SEPTEMBER 1986
Computer Simulation of the Wolff-Parkinson-White
Preexcitation Syndrome with a Modified
Miller-Geselowitz Heart ModelMICHEL LORANGE AND RAMESH M. GULRAJANI, SENIOR MEMBER, IEEE
Abstract-The implementation of element-to-element propagationinto the Miller-Geselowitz heart model, so as to automatically generateactivation isochrones, is described. This implementation was achievedfrom initiation sites on the endocardial surface of the model via aHuygens' construction, utilizing ellipsoidal propagation wavelets to re-flect anisotropic propagation in the myocardium. Isochrones similar tothose specified for normal activation of the original Miller-Geselowitzmodel were obtained, using propagation velocities derived from pub-lished propagation velocities measured in isolated tissue. Futther val-idation of the new model was sought by simulating the Wolff-Parkin-son-White syndrome, in which preexcitation of the ventricles of theheart occurs due to an accessory pathway connecting atria and ventri-cles, resulting in an initial delta wave in the QRS complex of the elec-trocardiogram. The approximate site of the accessory pathway may bededuced from the subject's body surface potential map pattern duringthe delta wave, or from the polarities of the delta wave in the 12-leadelectrocardiogram, or again from the orientation of the spatial vector-cardiogram during the delta wave. By specifying eight separate acces-sory pathway initiation sites, followed 40 ms later by normal activa-tion, the isochrones corresponding to preexcitation were simulated. Thebody surface potential maps, electrocardiograms, and vectorcar-diograms were calculated using an inhomogeneous torso model. Whileagreement between simulated and experimentally reported map pat-terns was very good for all eight sites, that between delta wave polar-ities in simulated and clinically expected electrocardiograms was notas good, owing to the sensitivity of these polarities to variations in heartorientation and position within the torso. This was also the case fordelta vector orientations in simulated and clinically recorded vector-cardiograms.
INTRODUCTION
TN recent years, the concept of regarding the ventricularlmyocardium as a bidomain, comprising intracellularand extracellular (interstitial) "interpenetrating" do-mains, occupying the same space, has gained consider-able acceptance. Miller and Geselowitz [1] used this ap-proach to show that for purposes of torso potential cal-culations, the effective dipole moment per unit volumep, assumed to act in extracellular space, could be ex-pressed as
Manuscript received December 2, 1985. This work was supported inpart by grants from the Medical Research Council of Canada (PG-12) andthe-Quebec Heart Foundation, and also in part by the Fonds de la rechercheen sante du Quebec through a Senior Research Scholarship to R.M. Gul-rajani.
M. Lorange is with the Institut de GEnie Biomedical, Ecole Polytech-nique et Universit6 de Montrdal, Montr6al, P.Q., Canada.
R. M. Gulrajani is with the Centre de Recherche, H6pital du Sacre-Coeur, Montreal, Quebec, P.Q., Canada H4J 1C5.
IEEE Log Number 8609546.
P = -giV4i (la)
In (la), Vbi is the spatial gradient of the intracellular po-tential distribution 4i, and gi is an effective, assumedisotropic, intracellular conductivity that results because ofthe premise that both intracellular and extracellular mi-lieus occupy the same total tissue space. Equation (la)can also be written in terms of the spatial gradient of thetransmembrane potential distribution Vm,
- gige
gi + ge(lb)
where g, is the effective, isotropic, extracellular conduc-tivity [2]. Thus, the effective dipole moment density p,acting in extracellular space of conductivity ge, is propor-tional to the negative spatial gradient of the transmem-brane potential distribution. Using approximately 4000points in a three-dimensional rectangular array to repre-sent the geometry of the ventricular myocardium, in con-junction with an assumed normal activation sequence anda piecewise-linear transmembrane action potential wave-form for each model point, Miller and Geselowitz calcu-lated the elemental dipoles throughout activation and re-covery at each model point from the spatial gradient ofthe transmembrane potential distribution. These dipoleswere then summed vectorially according to heart region,to eventually arrive at a 23-dipole heart model, whosetime-varying dipoles represented cardiac electrical activ-ity. When placed within a numerical torso model, thisheart model gave rise to surface potentials that corre-sponded well to those observed in normals. Miller andGeselowitz [3] also used their model for a simulation studyof surface electrocardiograms (ECG's) during ischemiaand infarction, by appropriately altering the action poten-tial waveforms of "ischemic" regions and suppressingthose of "infarcted" ones. The Miller-Geselowitz (M-G) model has also been used at our institution for a the-oretical'investigation of vectorcardiographic lead systemaccuracy [4], and for a simulation study of the effects oftorso conductivity inhomogeneities on ECG potentials [5].One of the drawbacks of the M-G heart model is the
manual selection of the activation or onset times of all4000 or so intracellular action potentials, in other words,the manual specification of the activation isochrones. This
0018-9294/86/0900-0862$01 .00 © 1986 IEEE
862
LORANGE AND GULRAJANI: COMPUTER SIMULATION OF WOLFF-PARKINSON-WHITE SYNDROME
renders simulation of conduction abnormalities of theheart, where onset times are altered, somewhat laborious.This paper describes a modified version of the M-G heartmodel that incorporates element-to-element action poten-tial propagation between its points and hence, automati-cally generates, from selected initiation sites on the en-
docardium, the activation isochrones specifying the onsettimes of each model point. The propagation algorithm also
takes into account, albeit in approximate fashion, the ef-fects of the anisotropic nature of the myocardial bido-main. The resultant isochrones were checked against thoseof the original M-G model. Further validation of themodified M-G model was achieved by simulating a com-
mon conduction abnormality, namely the Wolff-Parkin-son-White (WPW) syndrome.
In the WPW syndrome a region of the basal ventricleis preexcited ahead of the normal initiation sites on theendocardium. This occurs due to the presence of a "Kentbundle," a congenital defect which takes the form of oneor more muscle bundles directly linking a portion of theatria to its adjacent ventricular region. Ventricular exci-tation is consequently initiated in this region via the ac-
cessory muscle pathway, since conduction via the path-way is not subject to the AV nodal delay present in thenormal His-Purkinje conduction system. One electrocar-diographic manifestation of this ventricular preexcitationis an initial delta wave in the QRS complex of the electro-cardiogram, with the remainder of QRS reflecting the fu-sion of preexcited and normal excitation wavefronts. TheWPW syndrome is usually benign, though in some cases
circus tachycardias can result due to the presence of thetwo parallel tracts connecting atria and ventricles. Thesecircus tachycardias usually employ the normal His-Pur-kinje pathway in the forward direction and the accessory
pathway in retrograde fashion, although the reverse situ-ation can also occur. When the tachycardias are life-threatening, surgical excision of the accessory pathway isindicated. Since the accessory pathway can occur any-where around the atrioventricular ring separating atriafrom ventricles, open-heart epicardial mapping protocolshave to be used during surgery in order to determine itsprecise location prior to excision. Preliminary (presur-gery) indications of even the approximate site of the ac-
cessory pathway are therefore a great help to the surgeon,since they can reduce the epicardial area to be mapped.These presurgical site indications are currently obtainedvia invasive intracardiac catheter stimulation protocols,although less precise noninvasive indications via the ECGand the vectorcardiogram (VCG) have long been pro-posed. While early methods of site classification based on
the observed ECG utilized mainly the polarity of the en-
tire QRS complex in the precordial leads [6], more re-
cently Gallagher et al. [7] and Frank et al. [8] have de-scribed classification schemes based on the polarities ofthe delta waves in all 12 standard ECG leads. The'se are
likely to be more accurate, since it is mainly the delta
wave that reflects the preexcitation. In classificationsbased on the VCG, the spatial orientation of the heart vec-
tor during the delta wave has been suggested as an indexof the preexcitation site [8]-[10]. With the recording ofwhole body surface potential maps (BSPM's), severalgroups have proposed noninvasive preexcitation site clas-sifications based on the subject's BSPM patterns duringthe delta wave [11]-[13]. More recently, Benson et al.[14] found that both BSPM patterns during the delta waveand at approximately 40 ms into the ST segment, whenpresumably repolarization of the preexcited area occurs,could distinguish between eight preexcitation locationsaround the atrioventricular ring. Benson et al. verifiedtheir approach by comparison to the results of epicardialmapping, and it would appear that their method is the mostreliable among all the noninvasive approaches 'cited. Asecond objective of ours, besides the introduction of prop-agation into the M-G model, was to simulate the WPWsyndrome, and see how well the simulated BSPM's agreedwith Benson et al.'s measured BSPM's, for each of theeight preexcitation sites described by them. The simulatedECG's and VCG's could also be compared to those de-scribed in the literature for similar preexcitation sites. Fa-vorable comparisons would serve to qualitatively validatethe isochrones generated by the modified M-G model.
METHODSThe basic principle used to incorporate propagation into
the M-G model was a variant of the Huygens' wavefrontconstruction, first employed to automatically generate ac-tivation isochrones for a heart model by Solomon andSelvester [15], [16]. In the simplest form of this construc-tion, spherical wavelets of radius r = vT are describedaround every initially aptivated point. Here v is the as-sumed-isotropic action potential propagation velocity, andT is the isochrone interval. Those unactivated modelpoints that fall within these spheres are deemed to be ac-tivated at time T. These newly activated points then serveas the centers for the spherical wavelets determining thepoints activated at time 2T, and so on, until the entire modelheart is activated. To achieve smooth isochrones, it is im-perative that the heart model be sufficiently fine-grained,e.g., the Solomon and Selvester heart model comprised750 000 points with a coordinate spacing of 1 mm [17].Since the M-G model with 4000 points at x, y, and z in-tervals of 3.75, 3.75, and 4.64 mm, respectively hardlyseemed adequate for our purposes, the density of modelpoints was doubled in each direction, thereby increasingthe number of points to approximately 25 000. The dou-bling in the z or longitudinal direction effectively intro-duced an additional transverse heart cross section betweeneach of the 16 original M-G model cross sections, for afinal total of 31 stacked and aligned transverse heart crosssections. Once this increase in spatial resolution wasachieved, the next question was how best to take myo-cardial anisotropy into account.
Effect ofMyocardial Anisotropy on PropagationIt is well known that myocardial fibers are arranged in
thin layers roughly parallel to the endocardial/epicardial
863
IEEE TRANSACTIONS ON BIOMEDICAL ENGINEERING, VOL. BME-33, NO. 9, SEPTEMBER 1986
surface. While fiber directions vary gradually from layerto layer, fibers within a layer are approximately parallelto one another [18]. Because the effective conductivitiesalong and across fibers are markedly different, this leadsto an electrically anisotropic myocardium. The major ef-fect of this anisotropy, it was reasoned, would be on thepropagation process. A secondary effect would be to alter(lb) for the dipole moment density p. This latter effectmay conceivably be ignored, especially if far-field poten-tial distributions on the body surface are of interest, andis not considered in this paper. In other words, dipole mo-ments were calculated assuming the myocardium to be anisotropic bidomain, and (lb) to hold.The effect of myocardial anisotropy on the propagation
process was however taken into account in approximatefashion. The basis of this approximate approach was toassume that the anisotropic effects of the parallel layersof differing fiber orientations from endocardium to epi-cardium could be represented, in a macroscopic sense, bya thick block of anisotropic tissue, with one axis of lowelectrical conductivity oriented from endocardium toepicardium and with the other two perpendicular axes ofequal but higher conductivity. The low conductivity valuewas simply the effective electrical conductivity acrosscardiac fibers, whereas the higher conductivity in all di-rections parallel to the endocardial/epicardial surface wasan average value of the effective conductivities across andalong cardiac fibers. This macroscopic equivalent of themyocardium parallels a similar equivalent for the aniso-tropic-conductivity skeletal-muscle layer just beneath thethorax described by Rush [19]. An important assumptionmade is that the fiber directions in the individual myocar-dial sheets forming the ventricular wall are uniformly dis-tributed over the angles -90° to 90°, where -90° and900 represent alignment of the fibers along the longitu-dinal axis of the heart, and 00 represents circumferentialalignment.With this thick block model of anisotropic tissue, the
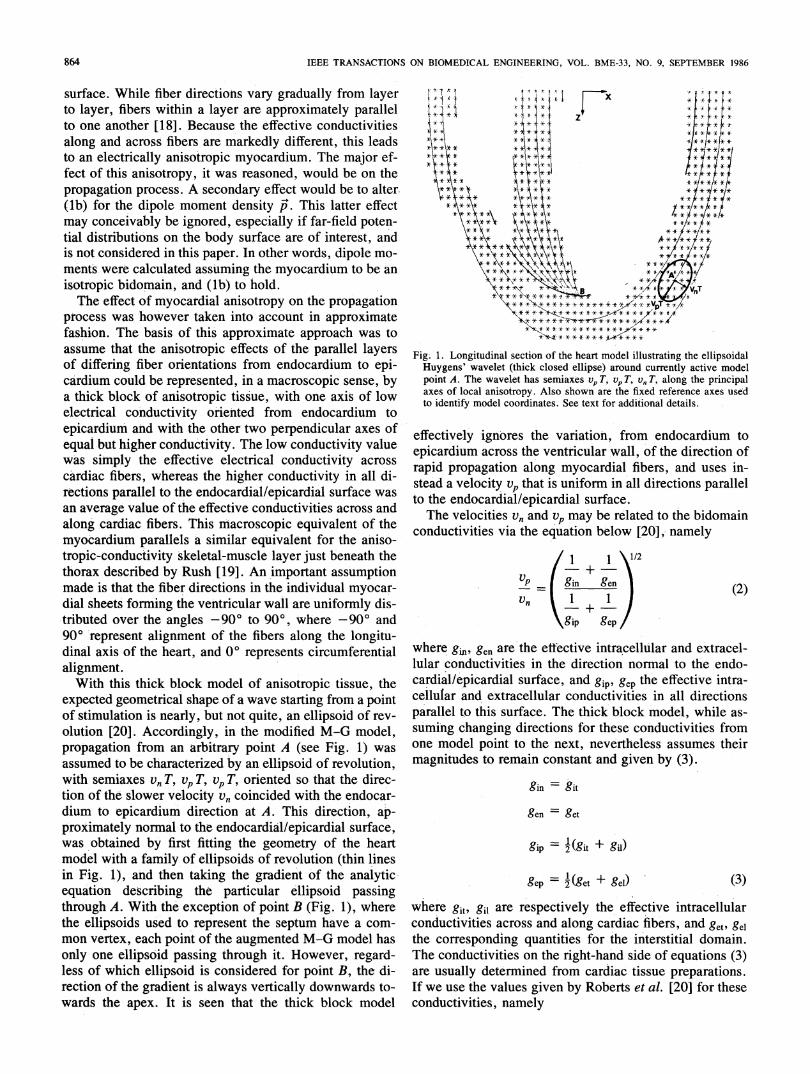
expected geometrical shape of a wave starting from a pointof stimulation is nearly, but not quite, an ellipsoid of rev-olution [20]. Accordingly, in the modified M-G model,propagation from an arbitrary point A (see Fig. 1) wasassumed to be characterized by an ellipsoid of revolution,with semiaxes vn T, vp T, vp T, oriented so that the direc-tion of the slower velocity v, coincided with the endocar-dium to epicardium direction at A. This direction, ap-proximately normal to the endocardial/epicardial surface,was obtained by first fitting the geometry of the heartmodel with a family of ellipsoids of revolution (thin linesin Fig. 1), and then taking the gradient of the analyticequation describing the particular ellipsoid passingthrough A. With the exception of point B (Fig. 1), wherethe ellipsoids used to represent the septum have a com-mon vertex, each point of the augmented M-G model hasonly one ellipsoid passing through it. However, regard-less of which ellipsoid is considered for point B, the di-rection of the gradient is always vertically downwards to-wards the apex. It is seen that the thick block model
K * i } i x- | M;xz
*>I *X** *Z*k>
f\* -\>* *#*i ,* w *1fi**}**-*F*i* ** *\- ie*X* *
*<* **X*x.* **,**S*
\**F*!~~ *\* *F *i**,*,*W+++n* *Fe* *~~~~~*~. **AX
*e **\* *+* \*\**/* **1**
Huyens waele (*Xthikcoed elipeaondcffnlyatiemoe
\** ~s* -\ ** * V* ,Te** *xe*WA*-\***/*X**-~~~~~~*s --*
ponA. Th Waee hassemiaxes vp T* vp T ev *T Xaln th*/*ciae of l *easo.*A-sown at** ref X
effectivel *ivnXrEs the variatiol fro endocardiu to
t * * -+-* *su' *' * * * * ** tkf,
Fpig.c1.rLongitudaa se*oftheheaectrtml iutr te el poi
raxes poflocalganisotropyalo shonoarde t fixed rnce aes usedeffectively***ignor sthe variation frmenoadimt
epicardonituminacrosscinothevetrcuart wadlll,strofnthediectipondof
stead a velocity vp that is uniform in all directions parallelto the endocardial/epicardial surface.The velocities vn and vp may be related to the bidomain
conductivities via the equation below [20],- namely
1 1
Vp = gin geVn 1+ I
\gip gep/
where g,n,, gen are the effective intracellular and extracel-lular conductivities in the direction normal to the endo-cardial/epicardial surface, and gip, gep the effective intra-cellular and extracellular conductivities in all directionsparallel to this surface. The thick block model, while as-
suming changing directions for these conductivities fromone model point to the next, nevertheless assumes theirmagnitudes to remain constant and given by (3).
gin= git
gen =get
gip = (git + gil)
gep = 2(get + gel) (3)
where git, gil are respectively the effective intracellularconductivities across and along cardiac fibers, and get, gelthe corresponding quantities for the interstitial domain.The conductivities on the right-hand side of equations (3)are usually determined from cardiac tissue preparations.If we use the values given by Roberts et al. [20] for theseconductivities, namely
(2)
864
LORANGE AND GULRAJANI: COMPUTER SIMULATION OF WOLFF-PARKINSON-WHITE SYNDROME
git = 0.00026 S/cm, get = 0.00133 S/cm,
gi = 0.00278 S/cm, gel = 0.00222 S/cm,we get
gi= 0.00026 S/cm,
gip = 0.00152 S/cm,
gen = 0.00133 S/cm,
gep = 0.00178 S/cm.
Substituting these values in (2) yields
Vp/V0 = 1.94
as the ratio of velocities parallel and normal to the endo-cardial/epicardial surface.
Simulation of Isochrones for Normal ExcitationThe simulation of isochrones for, normal cardiac exci-
tation was a trial and error procedure involving slight it-erative alterations of the sites of initial activity on the en-docardium and the absolute values of v, and vp, so as toresult in isochrones that were qualitatively similar to thosespecified for the original M-G model. The sites of initialactivity were those 3000 or so modified M-G model pointscorresponding to endocardial points in the original M-Gmodel that were activated 10, 20, and 30 ms into the ven-tricular excitation cycle. These initiation points, in asense, represent the endocardial Purkinje network, with30 ms being the maximum time interval into QRS forpropagated activity in the distal Purkinje network to reachthe myocardium. Their relatively small number precludedutilizing a Huygens' construction to simulate propagationwithin these initiation sites themselves. For simulatingpropagation in the rest of the ventricular myocardium, thestarting values for v0 and vp were 28 and 54.3 cm/s, re-spectively. The former was on the basis of measured val-ues of the transverse velocity v, in experimental prepara-tions of cardiac tissue or in the in situ canine epicardium,as summarized in the papers by Roberts et al. [20] andColli-Franzone et al. [211. Equating V0 in the whole-heartmodel to vt in the experimental preparation is reasonable,since the associated conductivities gin, gen, and git, get inboth situations are the same. The starting value of 54.3cm/s for vp was then determined from the Vp/v, ratio of1.94. The ellipsoidal, instead of spherical, Huygens' con-struction was used (Fig. 1), with the principal axes of theellipsoids always along the analytically determined direc-tions of gin and gip at the model point corresponding to theellipsoid center. The interval T between isochrones was10 ms. As with the spherical Huygens' construction, asyet unactivated model points that fell within the ellip-soidal wavelets were deemed activated within the next 10ms, and formed the centers for the succeeding wavelets.Note that the nearly ellipsoidal isochrones described byRoberts et al. [201 are only valid for an infinite, homo-geneous, anisotropic medium. The ellipsoidal Huygens'construction used by us therefore assumes that the prop-agating excitation wave always sees an infinite, homo-geneous, anisotropic medium, with the changes in an-isotropy axes being taken into account on a discrete basis
4 5 6
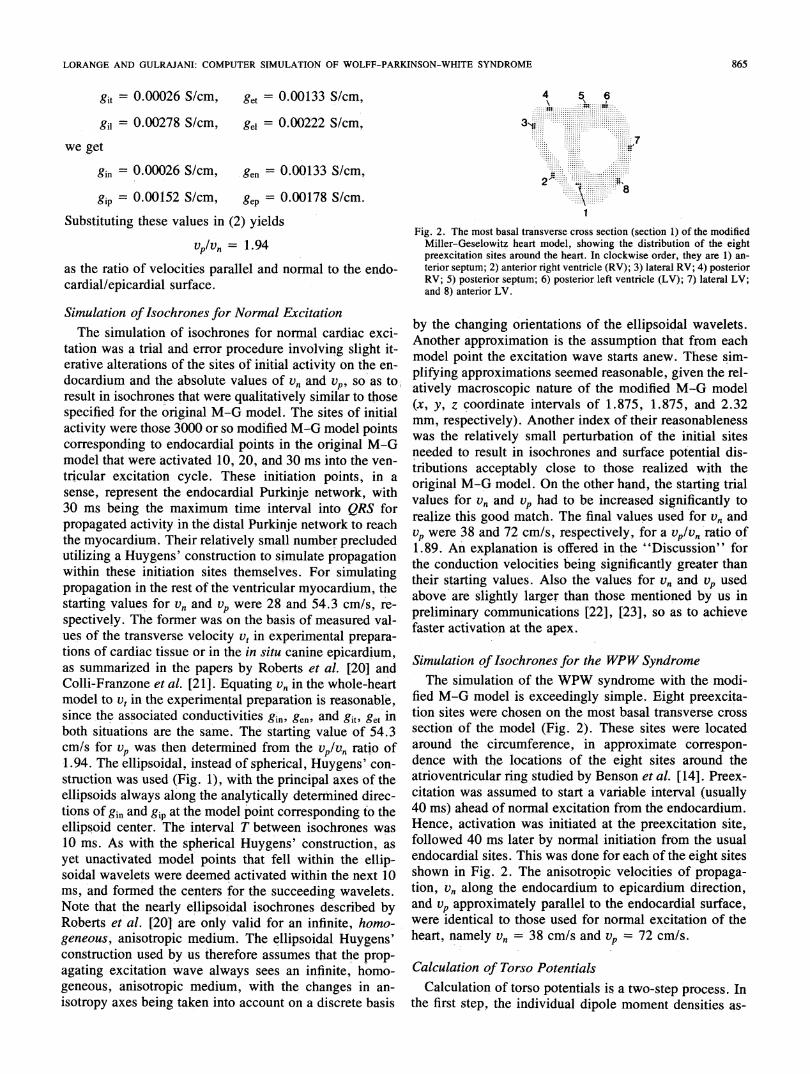
Fig. 2. The most basal transverse cross section (section 1) of the modifiedMiller-Geselowitz heart model, showing the distribution of the eightpreexcitation sites around the heart. In clockwise order, they are 1) an-terior septum; 2) anterior right ventricle (RV); 3) lateral RV; 4) posteriorRV; 5) posterior septum; 6) posterior left ventricle (LV); 7) lateral LV;and 8) anterior LV.
by the changing orientations of the ellipsoidal wavelets.Another approximation is the assumption that from eachmodel point the excitation wave starts anew. These sim-plifying approximations seemed reasonable, given the rel-atively macroscopic nature of the modified M-G model(x, y, z coordinate intervals of 1.875, 1.875, and 2.32mm, respectively). Another index of their reasonablenesswas the relatively small perturbation of the initial sitesneeded to result in isochrones and surface potential dis-tributions acceptably close to those realized with theoriginal M-G model. On the other hand, the starting trialvalues for V0 and vp had to be increased significantly torealize this good match. The final values used for v0 andvp were 38 and 72 cm/s, respectively, for a vp/v, ratio of1.89. An explanation is offered in the "Discussion" forthe conduction velocities being significantly greater thantheir starting values. Also the values for v,, and vp usedabove are slightly larger than those mentioned by us inpreliminary communications [22], [23], so as to achievefaster activation at the apex.
Simulation of Isochrones for the WPW SyndromeThe simulation of the WPW syndrome with the modi-
fied M-G model is exceedingly simple. Eight preexcita-tion sites were chosen on the most basal transverse crosssection' of the model (Fig. 2). These sites were locatedaround the circumference, in approximate correspon-dence with the locations of the eight sites around theatrioventricular ring studied by Benson et al. [14]. Preex-citation was assumed to start a variable interval (usually40 ms) ahead of normal excitation from the endocardium.Hence, activation was initiated at the preexcitation site,followed 40 ms later by normal initiation from the usualendocardial sites. This was done for each of the eight sitesshown in Fig. 2. The anisotropic velocities of propaga-tion, v, along the endocardium to epicardium direction,and vp approximately parallel to the endocardial surface,were identical to those used for normal excitation of theheart, namely v,, 38 cm/s and vp = 72 cm/s.
Calculation of Torso PotentialsCalculation of torso potentials is a two-step process. In
the first step, the individual dipole moment densities as-
865
IEEE TRANSACTIONS ON BIOMEDICAL ENGINEERING, VOL. BME-33, NO. 9, SEPTEMBER 1986
HORIZONTAL
FRONTAL
.4
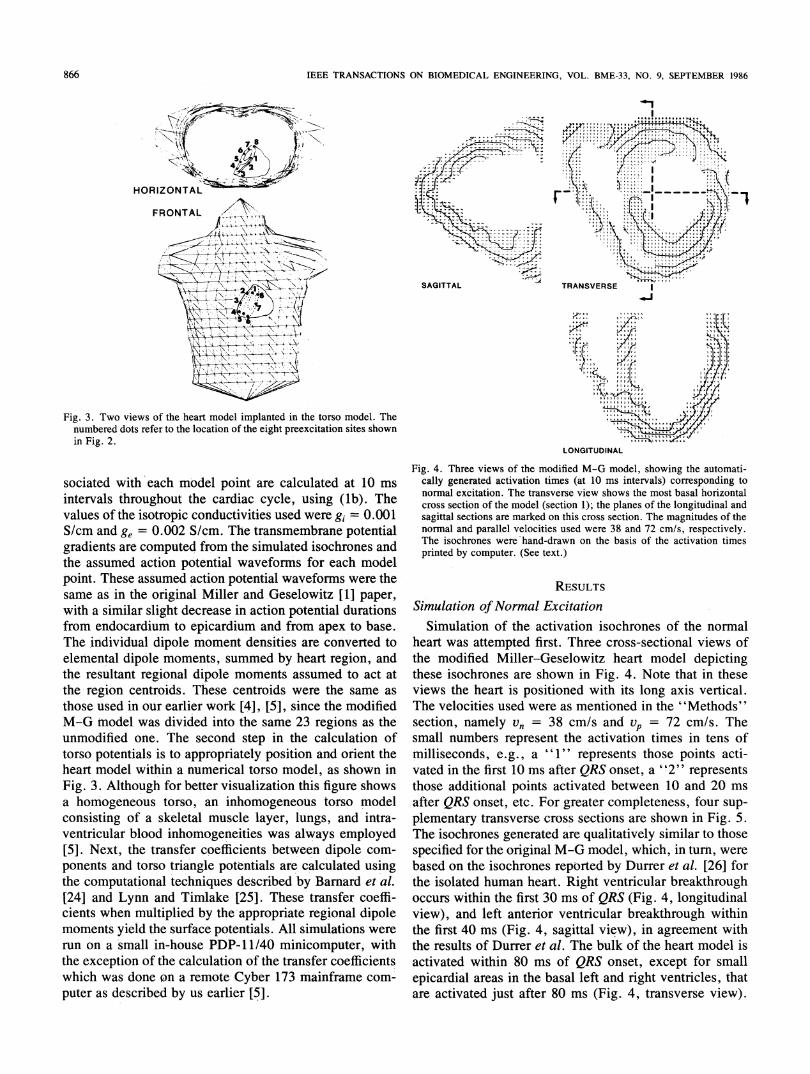
Fig. 3. Two views of the heart model implanted in the torso model. Thenumbered dots refer to the location of the eight preexcitation sites shownin Fig. 2.
sociated with each model point are calculated at 10 ms
intervals throughout the cardiac cycle, using (lb). Thevalues of the isotropic conductivities used were gi = 0.001S/cm and g, = 0.002 S/cm. The transmembrane potentialgradients are computed from the simulated isochrones andthe assumed action potential waveforms for each modelpoint. These assumed action potential waveforms were thesame as in the original Miller and Geselowitz [1] paper,
with a similar slight decrease in action potential durationsfrom endocardium to epicardium and from apex to base.The individual dipole moment densities are converted toelemental dipole moments, summed by heart region, andthe resultant regional dipole moments assumed to act atthe region centroids. These centroids were the same as
those used in our earlier work [4], [5], since the modifiedM-G model was divided into the same 23 regions as theunmodified one. The second step in the calculation oftorso potentials is to appropriately position and orient theheart model within a numerical torso model, as shown inFig. 3. Although for better visualization this figure showsa homogeneous torso, an inhomogeneous torso modelconsisting of a skeletal muscle layer, lungs, and intra-ventricular blood inhomogeneities was always employed[5]. Next, the transfer coefficients between dipole com-
ponents and torso triangle potentials are calculated usingthe computational techniques described by Barnard et al.(24] and Lynn and Timlake [25]. These transfer coeffi-cients when multiplied by the appropriate regional dipolemoments yield the surface potentials. All simulations were
run on a small in-house PDP-1 1/40 minicomputer, withthe exception of the calculation of the transfer coefficientswhich was done on a remote Cyber 173 mainframe com-
puter as described by us earlier [5].
SAGITTAL
LONGITUDINAL
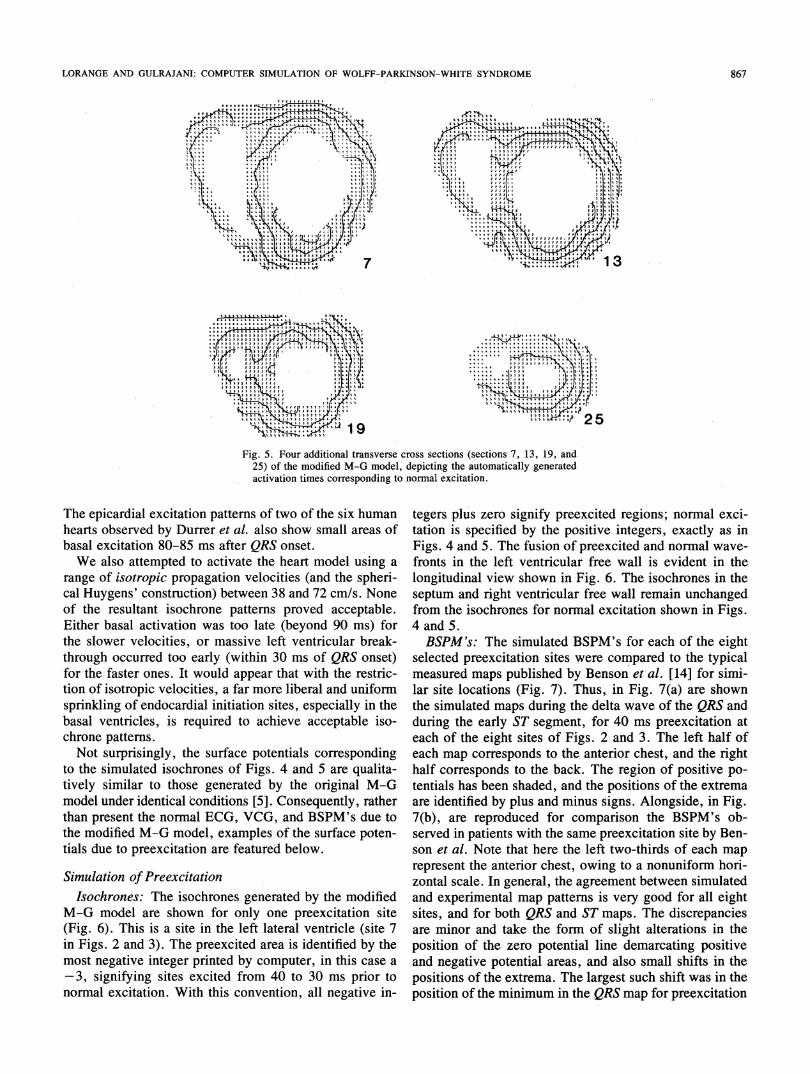
Fig. 4. Three views of the modified M-G model, showing the automati-cally generated activation times (at 10 ms intervals) corresponding tonormal excitation. The transverse view shows the most basal horizontalcross section of the model (section 1); the planes of the longitudinal andsagittal sections are marked on this cross section. The magnitudes of thenormal and parallel velocities used were 38 and 72 cmls, respectively.The isochrones were hand-drawn on the basis of the activation timesprinted by computer. (See text.)
RESULTS
Simulation ofNormal ExcitationSimulation of the activation isochrones of the normal
heart was attempted first. Three cross-sectional views ofthe modified Miller-Geselowitz heart model depictingthese isochrones are shown in Fig. 4. Note that in theseviews the heart is positioned with its long axis vertical.The velocities used were as mentioned in the "Methods"section, namely Vn = 38 cm/s and vp = 72 cm/s. Thesmall numbers represent the activation times in tens ofmilliseconds, e.g., a represents those points acti-vated in the first 10 ms after QRS onset, a o2" representsthose additional points activated between 10 and 20 msafter QRS onset, etc. For greater completeness, four sup-plementary transverse cross sections are shown in Fig. 5.The isochrones generated are qualitatively similar to thosespecified for the original M-G model, which, in tur, werebased on the isochrones reported by Durfer et al. [26] forthe isolated human heart. Right ventricular breakthroughoccurs within the first 30 ms of QRS (Fig. 4, longitudinalview), and left anterior ventricular breakthrough withinthe first 40 Ms (Fig. 4, sagittal view), in agreement withthe results of Durrer et al. The bulk of the heart model isactivated within 80 ms of QRS onset, except for smallepicardial areas in the basal left and right ventricles, thatare activated just after 80 ms (Fig. 4, transverse view).
866
LORANGE AND GULRAJANI: COMPUTER SIMULATION OF WOLFF-PARKINSON-WHITE SYNDROME86
1T.~~
Fig. 5. Four additional transverse cross sections (sections 7, 13, 19, and25) of the modified M-G model, depicting the automatically -generatedactivation times corresponding to normal excitation.
The epicardial excitation patterns of two of the six human
hearts observed by Durrer et al. also show small areas of
basal excitation 80-85 ms after QRS onset.
We also attempted to activate the heart model using a
range of isotropic propagation velocities (and the spheri-
cal Huygens' construction) between 38 and 72 cm/s. None
of the resultant isochrone patterns proved acceptable.
Either basal activation was too late (beyond 90 ins) for
the slower velocities, or massive left ventricular break-
through occurred too early (within 30 ms of QRS onset)
for the faster ones. It would appear that with the restric-
tion of isotropic velocities, a far more liberal and uniformn
sprinkling of endocardial initiation sites, especially in the
basal ventricles, is required to achieve acceptable iso-
chrone patterns.
Not surprisingly, the surface potentials corresponding
to the simulated isochrones of Figs. 4 and 5 are qualita-
tively similar to those generated by the original M-G.
model under identical conditions [5]. Consequently, rather
than present the normal ECG, VCG, and BSPM's due to
the modified M-G model, examples of the surface poten-
tials due to preexcitation are featured below.
Simulation of Preexcitation
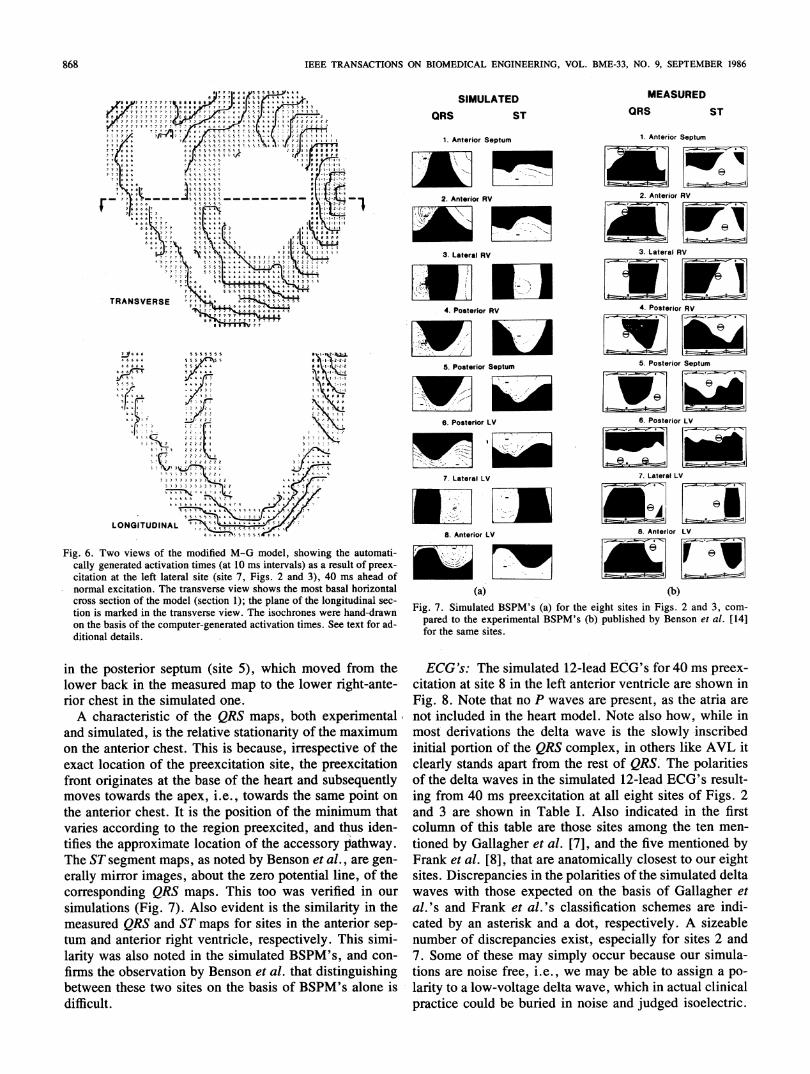
Isochrones: The isochrones generated by the modified
M-G model are shown for only one preexcitation site
(Fig. 6). This is a site 'in the Jeft lateral ventricle (site 7
in Figs. 2 and 3). The preexcited area is identified by the
most negative integer printed by computer, in this case a
3, signifying sites excited from 40 to 30 ms prior to
normal excitation. With this convention, all negative in-
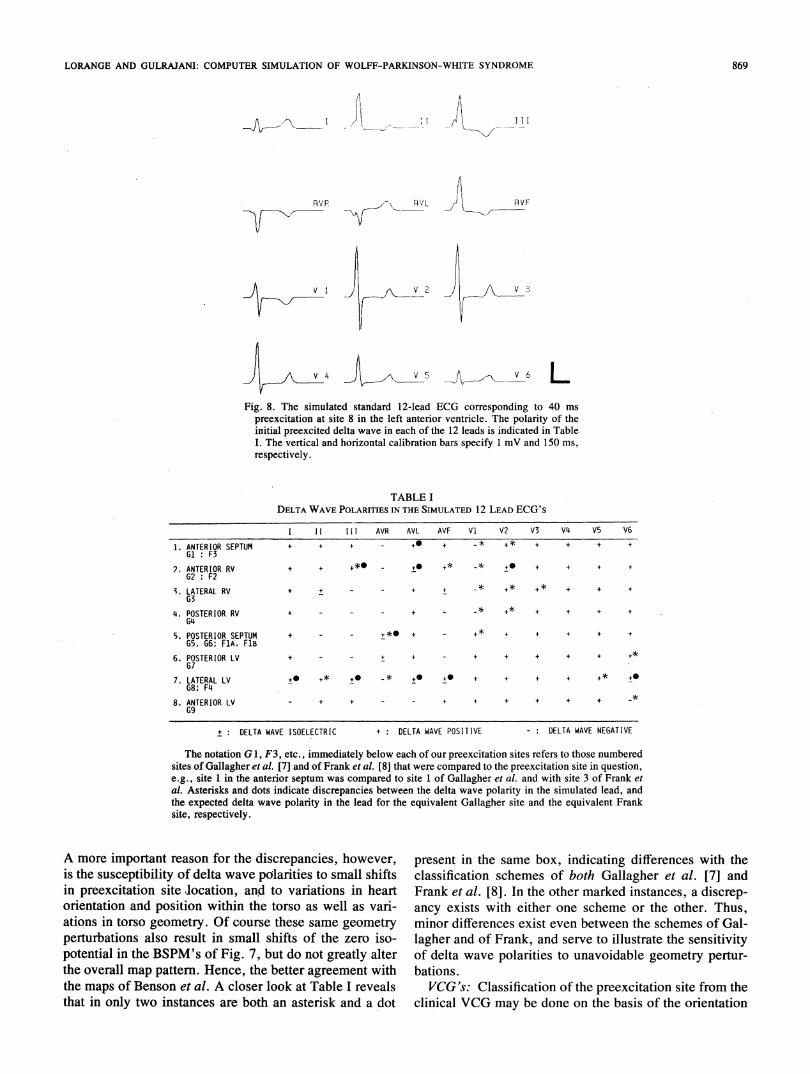
tegers plus zero signify preexcited regions; normal exci-tation is specified by the positive integers, exactly as inFigs. 4 and 5. The fusion of preexcited and normal wave-fronts in the left ventricular free wall is evident in thelongitudinal view shown in Fig. 6. The isochrones in theseptum and right'ventricular free wall remain unchangedfrom the isochrones for normal excitation shown in Figs.4 and 5.BSPM's: The simulated BSPM's for each of the eight
selected preexcitation sites were compared to the typicalmeasured maps published by Benson et-al. [14] for simi-lar site locations (Fig. 7). Thus, in Fig. 7(a) are shownthe simulated maps during the delta wave of the QRS andduring the early ST segment, for 40 ms preexcitation ateach of the eight sites of Figs. 2 and 3. The left half ofeach map corresponds to the anterior chest, and the righthalf coffesponds to the back. The region of positive po-tentials has been shaded, and the positions of the extremaare identified by plus and minus signs. Alongside, in Fig.7(b), are reproduced for comparison the BSPM's ob-served in patients with the same preexcitation site by Ben-son et al. Note that here the left two-thirds of each maprepresent the anterio'r chest, owing to a nonuniform hori-zontal scale. In general, the agreement between simulatedand experimental map patterns is very good for all eightSites, and for both QRS and ST maps. The discrepanciesare minor and take the formn of slight alterations in theposition of the zero potential line demarcating positiveand negative potential areas, and also small shifts in thepositions of the extrema. The largest such shift was in theposition of the minimum in the QRS map for preexcitation
867
IEEE TRANSACTIONS ON BIOMEDICAL ENGINEERING, VOL. BME-33, NO. 9, SEPTEMBER 1986
SIMULATEDORS ST
MEASUREDQRS ST
a 7 ? 76 6 6 SE 5 5 5 5 5 A*^87 7 76 6 6jE ;X*
It 7 7 7 6 le8i16155Se0 7 7 7 77< 7 o oeS'54 9 333.e 7 7 w'> I 3''. ' 6 ,55S' r--31'3e3
BPD77 7 7 7 7 7,T7 j '> ,eeot .<§ve 1 7 7 7 7 7 77777* 77 7 se c55 E4i>3i
5^77 7 777777777' C6 .tsc5z |* 222i21 7r; 7 7 J.7 oer SS4s|; jl
7 T7 7 7 7 ;.e1 r .sse555'5S44h-3J [7 7 7 7,ao70Oo4 55 :9 .17 7 7 f c .55SS6* t'2:l1z7Fg 76Two e e mod M m s the aot
c 7 gr actiati ti (a 1 m i a ares o preex7 at
e f le st (t , g 2 n ) 0 s a
77 o,6^^4k5.5c|2P1.-
normal1exiaon Th 9trasves vie shw the mos -|-tbsl horizonta
co 7sSe o t model 55 S p e logtudnlsc
diioa details. S'fl1 t -
inthepoterior Setu (st 5) whc moe fro the0|I -
7 66Z55' 50 I_
r c i e s l one.
A caatrstic of th QR mas bot experimental l
6 7 7
and~~siuatd is th reSX*latie sttonrt of th maxmu
6t the a i. t t s pi onthe a cs7 I i t p ofllt mnu th
The~~~~~~~ST sg ent mas as noe by Beso et al* ar gen-112
el m image7, about te zer potni n
c QRS mapS.T 3w vf in ourSN1,6 ,3 3C 73<
simulations~~~~~~(Fig 7) Als evien iS th similart in th 3F3B9oet
measured SQ a .S7 fo s i t a r sep-
larity was also noted i the s B a con-firms theobservationby.6 Benso e al. tha distinguishin
6~~~ ~ 6 i 6 6 6
1 T ; L Oe
e t3 -F t3LI eI
>55 ,* * Er 1 rQ- -4
calgeeae aciato tie (a 1 ms inevas as a resl ofprexciato at theX lef laea sit(se7Fg. 2 an 33 40 ms ahea oft
crosssecio of th moe (secio*;th pln oftelnitdnlsctioismake in the trnves -vew Th iscroe wer handdrawonthbss of the copue-gnrae aciato time.'Se text fo!d
lower ~bac in th mesue ma to th loe,r.g::- nterior~~chs in _th siuae one.33 .; >
A~~~chaactriti tof th QR mas bot expeimetalandsimulated,-- '.sterelatie stationarity ofths maximum
f~~~Ro':;oiinae at th bas of th hat an 7subsequen'lymoves~~toad th apex i.. toad the sam pon on stheanteriorchest. It iS thep3o3i3ion7 f*the'- nimum thavaries~~~~~~~~~~acodn to th reg4sion prectd an thu iden->}w
coffesondin SRS maps.This too wa verified in ourv
siuainFig.7.Toiwso AlsomdfevdenM-G model shoimingtyitheauoticamygeeasued dR aciandion tmaps(ato1 msintervals)tas antesultor spre-
tunrand anteraion. rihttrnvenrsvice, reospetively.tbaaThoiszontallrtyo wasmalsonoedin thetrnves simulaThedisochrone wrand coan-finm the obssevto bvthBopue-enerate actival.o thatmes.etextforhad-
between these two sites on the basis of BSPM's alone isdifficult.
1. Anterior Septum
2. Anterior RV
3. Lateral RV
4. Posterior RV
5. Posterior Septum
6. Posterior LV
7. Lateral LV
8. Anterior LV
1. Anterior Septum
2. Anterior RV
3. Lateral RV
4. Posterior RV
5. Posterior Septum
6. Posterior LV
7. Lateral LV
8. Anterior LV
(a) (b)Fig. 7. Simulated BSPM's (a) for the eight sites in Figs. 2 and 3, com-
pared to the experimental BSPM's (b) published by Benson et al. [14]for the same sites.
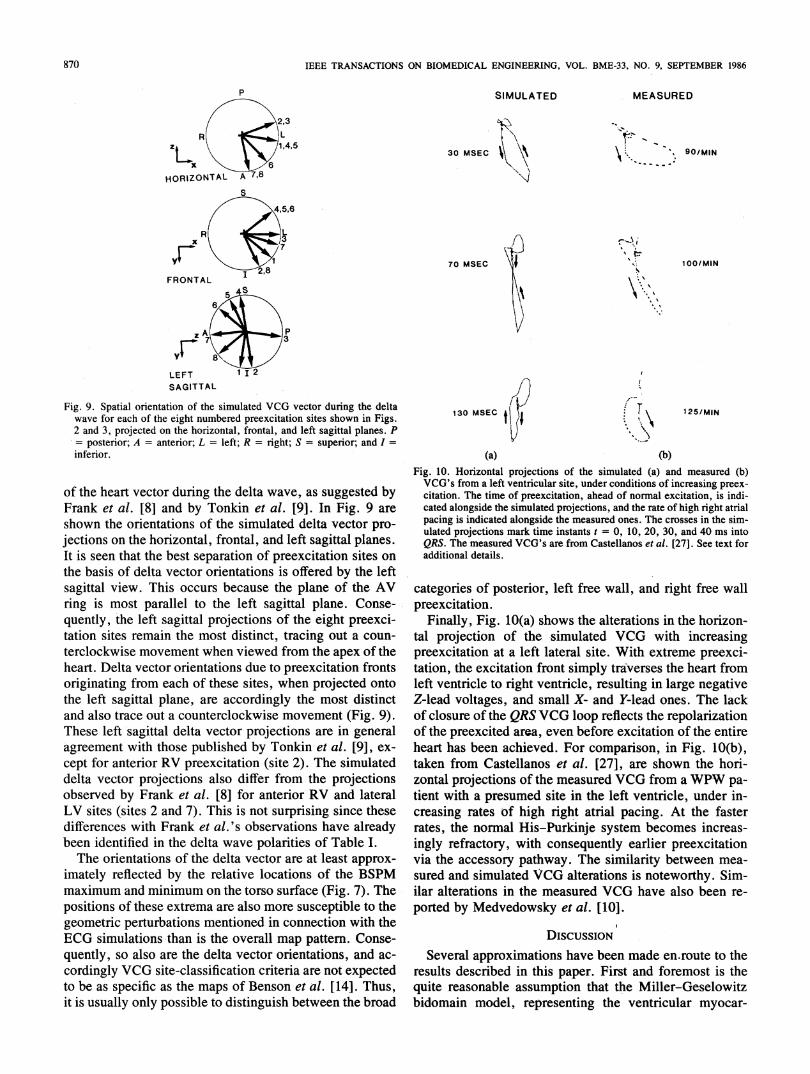
ECG's: The simulated 12-lead ECG's for 40 ms preex-citation at site 8 in the left anterior ventricle are shown inFig. 8. Note that no P waves are present, as the atria arenot included in the heart model. Note also how, while inmost derivations the delta wave is the slowly inscribedinitial portion of the QRS complex, in others like AVL itclearly stands apart from the rest of QRS. The polaritiesof the delta waves in the simulated 12-lead ECG's result-ing from 40 ms preexcitation at all eight sites of Figs. 2and 3 are shown in Table I. Also indicated in the firstcolumn of this table are those sites among the ten men-tioned by Gallagher et al. [7], and the five mentioned byFrank et al. [8], that are anatomically closest to our eightsites. Discrepancies in the polarities of the simulated deltawaves with those expected on the basis of Gallagher etal.'s and Frank et al.'s classification schemes are indi-cated by an asterisk and a dot, respectively. A sizeablenumber of discrepancies exist, especially for sites 2 and7. Some of these may simply occur because our simula-tions are noise free, i.e., we may be able to assign a po-larity to a low-voltage delta wave, which in actual clinicalpractice could be buried in noise and judged isoelectric.
868
LORANGE AND GULRAJANI: COMPUTER SIMULATION OF WOLFF-PARKINSON-WHITE SYNDROME
__o I
vi IIiV\4 V'
-1V -
, 1~~~~_,P. -\ AV L
t V~~~4t4 '5
I' I III
\'V
P)IVF_< _ _4.Vt
I V 6
Fig. 8. The simulated standard 12-lead ECG corresponding to 40 ms
preexcitation at site 8 in the left anterior ventricle. The polarity of theinitial preexcited delta wave in each of the 12 leads is indicated in TableI. The vertical and horizontal calibration bars specify 1 mV and 150 ms,respectively.
TABLE IDELTA WAVE POLARITIES IN THE SIMULATED 12 LEAD ECG's
I if [i1 AVR AVL AVF V1 V2 V3 V4 V5 V6
1. ANTERIOR SEPTUM + + + - +0 + - +* + + + +G1: F3
2. ANTERIOR RV + + +6 - +0 +* * +0 + + + +G2 F2
3. LATERAL RV + + - - + * -* +* + + + +G3
4 POSTERIOR RV + - - - + - -* +* + + + +G4
5. POSTERIOR SEPTUM + - - + - +' + + + +G5, G6;6FA. FlB
6. POSTERIOR LV + - - + - + + + + + +*G7
7. LATERAL LV +0 +* +-0 -* t- +0 + + + + +* +068; F4
8. ANTERIOR LV - + + - - + + + + + +G9
+ DELTA WAVE ISOELECTRIC + DELTA WAVE POSITIVE -: DELTA WAVE NEGATIVE
The notation G 1, F3, etc., immediately below each of our preexcitation sites refers to those numberedsites of Gallagher et al. [7] and of Frank et al. [8] that were compared to the preexcitation site in question,e.g., site 1 in the anterior septum was compared to site 1 of Gallagher et al. and with site 3 of Frank etal. Asterisks and dots indicate discrepancies between the delta wave polarity in the simulated lead, andthe expected delta wave polarity in the lead for the equivalent Gallagher site and the equivalent Franksite, respectively.
A more important reason for the discrepancies, however,is the susceptibility of delta wave polarities to small shiftsin preexcitation site location, and to variations in heartorientation and position within the torso as well as vari-ations in torso geometry. Of course these same geometryperturbations also result in small shifts of the zero iso-potential in the BSPM's of Fig. 7, but do not greatly alterthe overall map pattern. Hence, the better agreement withthe maps of Benson et al. A closer look at Table I revealsthat in only two instances are both an asterisk and a dot
present in the same box, indicating differences with theclassification schemes of both Gallagher et al. [7] andFrank et al. [8]. In the other marked instances, a discrep-ancy exists with either one scheme or the other. Thus,minor differences exist even between the schemes of Gal-lagher and of Frank, and serve to illustrate the sensitivityof delta wave polarities to unavoidable geometry pertur-bations.
VCG's: Classification of the preexcitation site from theclinical VCG may be done on the basis of the orientation
L
869
IEEE TRANSACTIONS ON BIOMEDICAL ENGINEERING, VOL. BME-33, NO. 9, SEPTEMBER 1986
SIMULATED
30MSECM
MEASURED
I..19IMgr- -
I.' 90/MIN
70 MSEC
Y ;
LEFT 1I2SAGITTAL
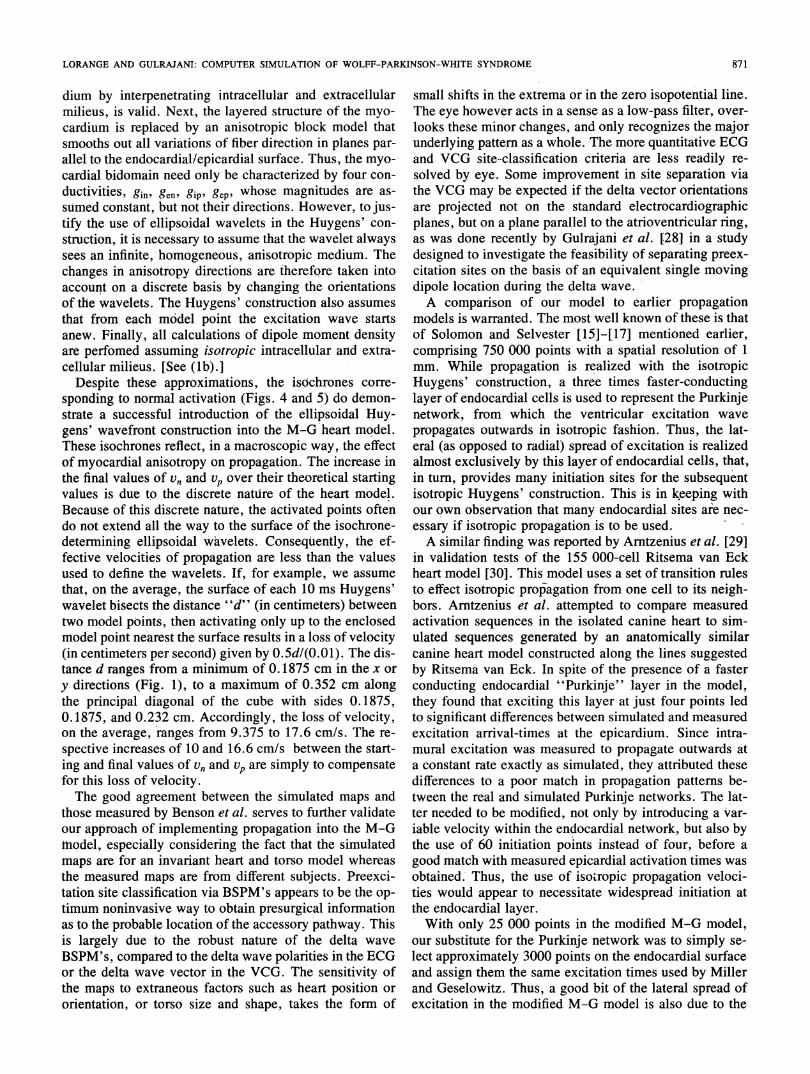
Fig. 9. Spatial orientation of the simulated VCG vector during the deltawave for each of the eight numbered preexcitation sites shown in Figs.2 and 3, projected on the horizontal, frontal, and left sagittal planes. P= posterior; A = anterior; L = left; R = right; S = superior; and I =inferior.
of the heart vector during the delta wave, as suggested byFrank et al. [8] and by Tonkin et al. [9]. In Fig. 9 areshown the orientations of the simulated delta vector pro-jections on the horizontal, frontal, and left sagittal planes.It is seen that the best separation of preexcitation sites onthe basis of delta vector orientations is offered by the leftsagittal view. This occurs because the plane of the AVring is most parallel to the left sagittal plane. Conse-quently, the left sagittal projections of the eight preexci-tation sites remain the most distinct, tracing out a coun-terclockwise movement when viewed from the apex of theheart. Delta vector orientations due to preexcitation frontsoriginating from each of these sites, when projected ontothe left sagittal plane, are accordingly the most distinctand also trace out a counterclockwise movement (Fig. 9).These left sagittal delta vector projections are in generalagreement with those published by Tonkin et al. [9], ex-cept for anterior RV preexcitation (site 2). The simulateddelta vector projections also differ from the projectionsobserved by Frank et al. [8] for anterior RV and lateralLV sites (sites 2 and 7). This is not surprising since thesedifferences with Frank et al.'s observations have alreadybeen identified in the delta wave polarities of Table I.The orientations of the delta vector are at least approx-
imately reflected by the relative locations of the BSPMmaximum and minimum on the torso surface (Fig. 7). Thepositions of these extrema are also more susceptible to thegeometric perturbations mentioned in connection with theECG simulations than is the overall map pattern. Conse-quently, so also are the delta vector orientations, and ac-cordingly VCG site-classification criteria are not expectedto be as specific as the maps of Benson et al. [14]. Thus,it is usually only possible to distinguish between the broad
100/MIN
125/MIN130 MSEC t I
(a) (b)Fig. 10. Horizontal projections of the simulated (a) and measured (b)VCG's from a left ventricular site, under conditions of increasing preex-citation. The time of preexcitation, ahead of normal excitation, is indi-cated alongside the simulated projections, and the rate of high right atrialpacing is indicated alongside the measured ones. The crosses in the sim-ulated projections mark time instants t = 0, 10, 20, 30, and 40 ms intoQRS. The measured VCG's are from Castellanos et al. [271. See text foradditional details.
categories of posterior, left free wall, and right free wallpreexcitation.
Finally, Fig. 10(a) shows the alterations in the horizon-tal projection of the -simulated VCG with increasingpreexcitation at a left lateral site. With extreme preexci-tation, the excitation front simply traverses the heart fromleft ventricle to right ventricle, resulting in large negativeZ-lead voltages, and small X- and Y-lead ones. The lackof closure of the QRSVCG loop reflects the repolarizationof the preexcited area, even before excitation of the entireheart has been achieved. For comparison, in Fig. 10(b),taken from Castellanos et al. [27], are shown the hori-zontal projections of the measured VCG from aWPW pa-tient with a presumed site in the left ventricle, under in-creasing rates of high right atrial pacing. At the fasterrates, the normal His-Purkinje system becomes increas-ingly refractory, with consequently earlier preexcitationvia the accessory pathway. The similarity between mea-sured and simulated VCG alterations is noteworthy. Sim-ilar alterations in the measured VCG have also been re-ported by Medvedowsky et al. [10].
DIscussIoNSeveral approximations have been made en.route to the
results described in this paper. First and foremost is thequite reasonable assumption that the Miller-Geselowitzbidomain model, representing the ventricular myocar-
870
p
r--. 1,
N
LORANGE AND GULRAJANI: COMPUTER SIMULATION OF WOLFF-PARKINSON-WHITE SYNDROME
dium by interpenetrating intracellular and extracellularmilieus, is valid. Next, the layered structure of the myo-
cardium is replaced by an anisotropic block model thatsmooths out all variations of fiber direction in planes par-allel to the endocardial/epicardial surface. Thus, the myo-cardial bidomain need only be characterized by four con-
ductivities, gin, genf gip, gepS whose magnitudes are as-
sumed constant, but not their directions. However, to jus-tify the use of ellipsoidal wavelets in the Huygens' con-
struction, it is necessary to assume that the wavelet alwayssees an infinite, homogeneous, anisotropic medium. Thechanges in anisotropy directions are therefore' taken intoaccount on a discrete basis by changing the orientationsof the wavelets. The Huygens' construction also assumes
that from each model point the excitation wave startsanew. Finally, all calculations of dipole moment densityare perfomed assuming isotropic intracellular and extra-cellular milieus. [See (lb).]
Despite these approximations, the isochrones corre-
sponding to normal activation (Figs. 4 and 5) do demon-strate a successful introduction of the ellipsoidal Huy-gens' wavefront construction into the M-G heart model.These isochrones reflect, in a macroscopic way, the effectof myocardial anisotropy on propagation. The increase inthe final values of vn and vp over their theoretical startingvalues is due to the discrete nature of the heart model.Because of this discrete nature, the activated points oftendo not extend all the way to the surface of the isochrone-determining ellipsoidal wavelets. Consequently, the ef-fective velocities of propagation are less than the valuesused to define the wavelets. If, for example, we assumethat, on the average, the surface of each 10 ms Huygens'wavelet bisects the distance "d" (in centimeters) betweentwo model points, then activating only up to the enclosedmodel point nearest the surface results in a loss of velocity(in centimeters per secorid) given by 0.5d/(0.01). The dis-tance d ranges from a minimum of 0. 1875 cm in the x or
y directions (Fig. 1), to a maximum of 0.352 cm alongthe principal diagonal of the cube with sides 0.1875,0.1875, and 0.232 cm. Accordingly, the loss of velocity,on the average, ranges from 9.375 to 17.6 cm/s. The re-
spective increases of 10 and 16.6 cm/s between the start-ing and final values of v, and vp are simply to compensatefor this loss of velocity.The good agreement between the simulated maps and
those measured by Benson et al. serves to further validateour approach of implementing propagation into the M-Gtnodel, especially c'onsidering the 'fact that the simulatedmaps are for an invariant heart and torso model whereasthe measured maps are from different subjects. Preexci-tation site classification via BSPM's appears to be the op-
timum noninvasive way to obtain presurgical informationas to the probable location of the accessory pathway. Thisis largely due to the robust nature of the delta wave
BSPM's, compared to the delta wave polarities in the ECGor the delta wave vector in the VCG. The sensitivity ofthe maps to extraneous factors such as heart position or
orientation, or torso size and shape, takes the form of
small shifts in the extrema or in the zero isopotential line.The eye however acts in a sense as a low-pass filter, over-looks these minor changes, and only recognizes the majorunderlying pattern as a whole. The more quantitative ECGand VCG site-classification criteria are less readily re-solved by eye. Some improvement in site separation viathe VCG may be expected if the delta vector orientationsare projected not on the standard electrocardiographicplanes, but on a plane parallel to the atrioventricular ring,as was done recently by Gulrajani et al. [28] in a studydesigned to investigate the feasibility of separating preex-citation sites on the basis of an equivalent single movingdipole location during the delta wave.A comparison of our model to earlier propagation
models is warranted. The most well known of these is thatof Solomon and Selvester [15]-[17] mentioned earlier,comprising 750 000 points with a spatial resolution of 1mm. While propagation is realized with the isotropicHuygens' construction, a three times faster-conductinglayer of endocardial cells is used to represent the Purkinjenetwork, from' which the ventricular excitation wavepropagates outwards in isotropic fashion. Thus, the lat-eral (as opposed to radial) spread of excitation is realizedalmost exclusively by this layer of endocardial cells, that,in turn, provides many initiation sites for'the subsequentisotropic Huygens' construction. This'is in keeping withour own observation that many endocardial sites are nec-essary if isotropic propagation is to be used.A similar finding was reported by Arntzenius et al. [29]
in validation tests of the 155 000-cell Ritsema van Eckheart model [30]. This model uses a set of transition rulesto effect isotropic propagation from one cell to its neigh-bors. Arntzenius et al. attempted to compare measuredactivation sequences in the isolated canine heart to sim-ulated sequences generated by an anatomically similarcanine heart model constructed along the lines suggestedby Ritsema van Eck. In spite of the presence'of a fasterconducting endocardial "Purkinje" layer in the model,'they found that exciting this layer at just four points ledto significant differences between simulated and measuredexcitation arrival-times at the epicardium. Since intra-mural excitation was measured to propagate outwards ata constant rate exactly as simulated, they attributed thesedifferences to a poor match in propagation patterns be-tween the real and simulated Purkinje networks. The lat-ter needed to be modified, not only by introducing a var-iable velocity within the endocardial network, but also bythe use of 60 initiation points instead of four, before agood match with measured epicardial activation times wasobtained.' Thus, the use of iso.ropic propagation veloci-ties would appear to necessitate widespread initiation atthe endocardial layer.With only 25 000 points in the modified M-G model,
our substitute for the Purkinje network was to simply se-lect approximately 3000 points on the endocardial surfaceand assign them the same excitation times used by Millerand Geselowitz. Thus, a good bit of the lateral' spread ofexcitation in the modified M-G model is also due to the
871
IEEE TRANSACTIONS ON BIOMEDICAL ENGINEERING, VOL. BME-33, NO. 9, SEPTEMBER 1986
endocardial layer. However, further lateral spread is ob-tained through the ellipsoidal Huygens' construction. Be-sides being closer to reality, this yields an added measureof suppleness, in the sense that two velocity parametersinstead of one can be varied, thereby permitting an easiermatch of isochrones. The ellipsoidal construction is alsoindispensable for the WPW simulations, in that it ensuresthe observed rapid epicardial spread of the preexcitationfront.An even more realistic simulation would have resulted
if the layered structure of the myocardial wall had beenretained, with the gradually changing fiber orientationsspecified for use in the ellipsoidal Huygen's construction.Such an approach has recently been used by Adam et al.[31] in an 80 000-point heart model, whose propagationrules are similar to those of the Ritsema van Eck [30]model, but with preferential directions determined ac-cording to a general notion of fiber orientation in the myo-cardium. No ECG simulations with this model have as yetbeen described. A much more ambitious computer heartmodel that uses microscopically-determined fiber orien-tations at each 1 mm three-dimensional lattice point, aswell as the effects of past activity on action potential du-ration, has been described in preliminary form by Saxberget al. [32]. When completed, such a model would be al-most the ultimate as to anatomical and physiological de-tail. Such fine-structured models are almost mandatory foraccurate simulation studies of arrhythmogenic reentry cir-cuits in the heart, as both Adam et al. and Saxberg et al.intend to do. In our case, the relative paucity of points inthe modified M-G model precluded more detailed consid-eration of fiber orientations. It was reasoned that the globalisochrone pattern obtained via the anisotropic block con-cept and the ellipsoidal Huygens' construction would besufficiently accurate so as to yield useful simulations ofthe far-field body surface potential. Our results would ap-.pear to support this point of view.
ACKNOWLEDGMENT
It is a pleasure to thank Mr. A. Beauchemin for ensur-ing trouble-free operation of our computer installation.
REFERENCES
[1] W. T. Miller, III and D. B. Geselowitz, "Simulation studies of theelectrocardiogram. I. The normal heart," Circ. Res., vol. 43, pp.301-315, 1978.
[2] R. Plonsey, "Quantitative formulations of electrophysiologicalsources of potential fields in volume conductors," in IEEE FrontiersEng. Comput. Health Care, J. L. Semmlow and W. Welkowitz, Eds.New York: IEEE, 1984, pp. 367-374.
[3] W. T. Miller, III and D. B. Geselowitz, "Simulation studies of theelectrocardiogram. II. Ischemia and infarction," Circ. Res., vol. 43,pp. 315-323, 1978.
[4] G. E. Mailloux and R. M. Gulrajani, "Theoretical evaluation of theMcFee and Frank vectorcardiographic lead systems using a numericalinhomogeneous torso model," IEEE Trans. Biomed. Eng., vol. BME-29, pp. 322-332, 1982.
[5] R. M. Gulrajani and G. E. Mailloux, "A simulation study of theeffects of torso inhomogeneities on electocardiographic potentials,using realistic heart and torso models," Circ. Res., vol. 52, pp. 45-56, 1983.
[6] F. F. Rosenbaum, H. H. Hecht, F. N. Wilson, and F. D. Johnston,"The potential variations of the thorax and the esophagus in anoma-lous atrioventricular excitation (Wolff-Parkinson-White syn-drome)," Amer. Heart J., vol. 29, pp. 281-326, 1945.
[7] J. J. Gallagher, E. L. C. Pritchett, W. C. Sealy, J. Kasell, and A. G.Wallace, "The preexcitation syndromes," Progr. Cardiovasc. Dis-eases, vol. 20, pp. 285-327, 1978.
[8] R. Frank, G. Fontaine, G. Guiraudon, C. Cabrol, Y. Grosgogeat, andJ. Facquet, "Correlation entre l'orientation de l'onde delta et la to-pographie de la pr6-excitation dans le syndrome de Wolff-Parkinson-White," Arch. Mal. Coeur, vol. 70,pp. 441-450, 1977.
[9] A. M. Tonkin, G. S. Wagner, J. J. Gallagher, G. D. Cope, J. Kasell,andA-. G. Wallace, "Initial forces of ventricular depolarization in theWolff-Parkinson-White syndrome. Analysis based upon localizationof the accessory pathway by epicardial mapping," Circulation, vol.52, pp. 1030-1036, 1975.
[10] J. L. Medvedowsky, P. Nicolai, C. Barnay, M. Delaage, and J. C.Agelou, "Correlations dlectrocardiographiques, 6lectrophysiolo-giques et vectocardiographiques dans le syndrome de Wolff-Parkin-son-White," Arch. Mal. Coeur, vol. 71, pp. 1000-1013,1978.
[11] K. Yamada, J. Toyama, M. Wada, S. Sugiyama, J.$ugenoya, H.Toyoshima, Y. Mizuno, I. Sotohata, T. Kobayashi, and M. Okajima,"Body surface isopotential mapping in Wolff-Parkinson-White syn-drome: Non-invasive method to determine the localization of the ac-cessory atrioventricular pathway," Amer. Heart J., vol. 90, pp. 721-734, 1975.
[12] L. De Ambroggi, B. Taccardi, and E. Macchi, "Body-surface mapsof heart potentials. Tentative localization of preexcited areas in forty-two Wolff-Parkinson-White patients," Circulation, vol. 54, pp. 251-263, 1976.
[13] T.Iwa and T. Magara, "Correlation between localization of acces-sory conduction pathway and body surface maps in the Wolff-Parkin-son-White syndrome," Japan. Circ. J., vol. 45, pp. 1192-1198,1981.
[14] D. W. Benson, R. Sterba, J. J. Gallagher, A. Walston, II, and M. S.Spach, "Localization of the site of ventricular preexcitation with bodysurface maps in patients with Wolff-Parkinson-White syndrome,"Circulation, vol. 65, pp. 1259-1268, 1982.
[15] J. C. Solomon and R. H. Selvester, "Myocardial activation sequencesimulation," in Vectorcardiography 2,I. Hoffman, Ed. Amster-dam, The Netherlands: North-Holland, 1971, pp. 175-182.
[16] J. C. Solomon and R. H. Selvester, "Simulation of measured acti-vation sequence in the human heart," Amer. Heart J., vol. 85, pp.518-523, 1973.
[17] R. H. Selvester, J. Solomon, and D. Sapoznikov, "Computer simu-lation of the electrocardiogram," in Computer Techniques in Car-diology, Vol. 9, L. H. Cady, Ed. New York: Marcel Dekker, 1979,pp. 417-453.
[18] D. D.Streeter, Jr., M. M. Spotnick, D. P. Patel, J. Ross, Jr., andE. H. Sonnenblick, "Fiber orientation in the canine left ventricle dur-ing diastole and systole," Circ. Res., vol. 24, pp. 339-347, 1969.
[19] S. Rush, "A principle for solving a class of anisotropic current flowproblems and applications to electorcardiography," IEEE Trans.Biomed. Eng., vol. BME-14, pp. 18-22, 1967.
[20] D. E. Roberts, L. T. Hersh, and A. M. Scher, "Influence of cardiacfiber orientation on wavefront voltage, conduction velocity and tissueresistivity in the dog," Circ. Res., vol. 44, pp. 701-712, 1979.
[21] P. Colli-Franzone, L. Guerri, C.Viganotti, E. Macchi, S. Baruffi, S.Spaggiari, and B. Taccardi, "Potential fields generated by obliquedipole layers modeling excitation wavefronts in the anisotropic myo-cardium. Comparison with potential fields elicited by paced dog heartsin a volume conductor," Circ. Res., vol. 51, pp. 330-346, 1982.
[22] M. Lorange, "Simulation du syndrome de Wolff-Parkinson-White aI'aide d'un modele cardiaque," M. Ing. thesis, Institut de g£niebiomedical, Universite de Montreal, Montr6al, P. Q., Canada, 1984.
[23] M. Lorange and R. M. Gulrajani, "Computer simulation of the Wolff-Parkinson-White syndrome," in IEEE Frontiers Eng. Comput. HealthCare, J. L. Semmlow and W. Welkowitz, Eds. New York: IEEE,1984, pp. 461-464.
[24] A. C. L. Barnard, I. M. Duck, and W. P. Timlake, "The applicationof electromagnetic theory to electrocardiology. II. Numerical solutionof the integral equations," Biophys. J., vol. 7, pp. 463-491, 1967.
[25] M. S. Lynn and W. P. Timlake, "The use of multiple deflations inthe numerical solution of singular systems of equations, with appli-
872
LORANGE AND GULRAJANI: COMPUTER SIMULATION OF WOLFF-PARKINSON-WHITE SYNDROME
cations to potential theory," SIAM J. Numer. Anal., vol. 5, pp. 303-322, 1968.
[26] D. Durrer, R. T. van Dam, G. E. Freud, M. J. Janse, F. L. Meijler,and R. C. Arzbaecher, "Total excitation of the isolated human heart,"Circulation, vol. 41, pp. 899-912, 1972.
127] A. Castellanos, Jr., A. S. Agha, B. Portillo, and R. J. Myerburg,"Usefulness of vectorcardiography combined with His bundle rec-
ordings and cardiac pacing in evaluation of the preexcitation (Wolff-Parkinson-White) syndrome," Amer. J. Cardiol., vol. 30, pp. 623-628, 1972.
128] R. M. Gulrajani, H. Pham-Huy, R. A. Nadeau, P. Savard, J. deGuise, R. E. Primeau, and F. A. Roberge, "Application of the singlemoving dipole inverse solution to the study of the Wolff-Parkinson-White syndrome in man," J. Electrocardiol., vol. 17, pp. 271-288,1984.
[29] A. C. Arntzenius, J. J. Schipperheyn, P. H. Huisman, H. E. Kul-bertus, H. J. Ritsema van Eck, M. L. Simoons, and R. V. H. Vinke,"Model studies on activation of the heart," Euro. J. Cardiol., vol.8, pp. 261-270, 1978.
[30] H. J. Ritsema van Eck, "Digital computer simulation of cardiac ex-
citation and repolarization in man," Ph.D. dissertation, DalhousieUniv., Halifax, Canada, 1972.
131] D. Adam, D. Hekstra, and S. Sideman, "Simulation of myocardialisopotential maps using a randomly distributed parameters conductionmodel," in Computers in Cardiology. New York: IEEE, 1984, pp.
155-158.[32] B. E. H. Saxberg, M. P. Grumbach, and R. J. Cohen, "A time de-
pendent anatomically detailed model of cardiac conduction," in Com-puters in Cardiology. New York: IEEE, 1985.
Michel Lorange received the B.Ing. degree in en-gineering physics in 1981 and the M.Ing. degreein biomedical engineering in 1984, both from theEcole Polytechnique, Universit6 de Montr6al,Montreal, P.Q., Canada.
From 1983 to 1985, he worked as a ClinicalEngineer at the Institut de Cardiologie de Mon-treal. He is currently pursuing the Ph.D. degreein biomedical engineering at the Ecole Polytech-nique, Universite de Montreal, where he is in-volved in cardiac modeling studies. His major re-
search interests are in electrocardiography.
Ramesh M. Guirajani (S'68-M'72-SM'85) re-ceived the B.E. degree in electrical engineeringfrom the University of Bombay, Bombay, India,in 1964, the M.S. degree in physics, and the Ph.Ddegree in electrical engineering from SyracuseUniversity, Syracuse, NY, in 1972 and 1973, re-spectively.
He has been at the Universitede Montrdal,Montreal, P.Q., Canada since 1973, initially as aMedical Research Council of Canada PostdoctoralFellow, and currently as a Senior Research As-
sociate. He is also a Senior Research Scholar of the Fonds de la Rechercheen Sante du Quebec, involved in cardiac modeling studies at H6pital duSacre-Coeur, Montreal, P.Q. Canada. His major research interests are inelectrophysiological modeling.
873
Related Documents