Computer Sciences Corporation 1999 Annual Report BALANCE and BUSINESS DIVERSITY These two simple concepts will continue to be the foundation of CSC’s global leadership role in information technology services as we approach and enter the new millennium.

Welcome message from author
This document is posted to help you gain knowledge. Please leave a comment to let me know what you think about it! Share it to your friends and learn new things together.
Transcript

Computer Sciences Corporation 1999 Annual Report
BALANCEand BUSINESSDIVERSITYThese two simpleconcepts willcontinue to be thefoundation of CSC’sglobal leadershiprole in informationtechnology servicesas we approachand enter the newmillennium.

CSC is agile andflexible in providingtechnology answers to our customers’ current and futurebusiness challenges.
Thriving geographic operations in North America, Europe and Asia-Pacific.
Laser-like focus on markets.
A broad range of I/T services including e-business, outsourcing, consulting and systems integration.
Abundant skills from more than 50,000 of the world’s best employees teaming to deliver world class services.
Computer Sciences Corporation (CSC) provides information technology (I/T) solutions thathelp companies succeed. Drawing from our wide array of technologies, lines of serviceand solution sets, we work hand in hand with customers in industry and governmentthroughout the world to achieve their strategic and operational objectives. With morethan 50,000 employees, CSC tailors business solutions using management consulting andprofessional services; e-business strategies and technologies; complex information systemsintegration; and outsourcing, covering the full range of I/Tand business processing activities.Through our integrated operating model, we provide our customers with solutions derivedfrom best practices across our global commercial and U.S. federal operations.
T a b l e o f C o n t e n t s
2 Financial Highlights
3 Letter to Shareholders
7 Worldwide I/T Revenues
9 Global CSC Revenues
11 Operations Review
37 Financial Section
81 Directors and Officers
82 Shareholder Information
For easy reference, a Glossary of Termsis available on pages 35-36.

3
CSC has never been better positioned for growth and profitability.
T o O u r S h a r e h o l d e r s :
On April 16th, CSC marked its 40th anniversary. Over the last four decades,
we have produced a stellar record of service to clients and, during that same
period, have delivered an impressive record of growth and profitability.
Our demonstrated ability to see what lies ahead and our proven agility in
meeting emerging challenges and taking advantage of new opportunities will
serve us well as we approach the new millennium. And the opportunities
clearly are there. At some point during the year 2002, the information
technology marketplace is expected to cross the trillion-dollar threshold.
A market that size provides robust prospects for industry-leading companies
like CSC. The breadth of our skills and service offerings, the depth of our
technology, and our global reach and market expertise combine to give us a
balance and business diversity that few in our industry can match. And this
balance and business diversity has been and will continue to be the key to
success for CSC.
We are excited by the enormous range of opportunities we see going forward,
and if the year just ended is any measure, the future is indeed bright.
CSC posted higher profits, recorded more revenues and won more new
business in fiscal 1999 than any year in our history.
Net income of $341 million increased 31 percent over last year, or 25.2
percent excluding last year’s special items. Revenues totaled $7.7 billion, an
increase of 16 percent over the $6.6 billion earned in fiscal 1998. Our revenue
growth was driven by strong demand for CSC's services around the world,
particularly for consulting and systems integration services in the areas of
e-business applications, enterprise-wide solutions and outsourcing.
2
F i n a n c i a l H i g h l i g h t s
* Fiscal 1998 and 1997 operating results above include specialitems. A discussion of “Income Before Taxes” and “Net Incomeand Earnings per Share” before and after special items is includedon pages 41-42 of this annual report.
Computer Sciences Corporation’s fiscal year ends the Fridayclosest to March 31.
F i s c a l Y e a r E n d e d
in cash and cash equivalents April 2, 1999 April 3, 1998 March 28, 1997In thousands, increase (decrease)
RevenuesIncome before taxes* Net income*Diluted earnings per share*
Working capitalStockholders’ equityTotal assets
Number of employees
$6,600,838190,869260,369
1.64
767,8202,001,2754,046,795
45,000
$5,616,048303,313192,413
1.23
533,9151,669,5603,493,087
40,980
$7,659,965511,357341,157
2.11
587,5732,399,8545,007,709
50,000

54
and Informatica Group SpA and four companies of the Progres Group that
greatly expanded our capabilities in Italy. And in the United States, we
acquired Onward Technologies, a web-focused consulting and systems
integration firm, and T-Wack Software Group, a developer of software for use
in client-server and Internet applications.
Today's global knowledge economy is causing corporations and governments
to rethink their operations. Competition, rapid advances in technology and
corresponding shifts in client expectations are forcing significant change.
This requires that CSC not only understand the resulting implications, but
also be adept at leveraging its own knowledge base. We capture everything
we learn – tools, best practices, ingenious solutions to client problems – and
share them across the company through CSC Sources, our own global
environment for knowledge sharing. When a solution is being sought, the
combined knowledge and experience of our professional staff across our
global commercial and U.S. federal operations can be brought to bear on the
problem. This is a formidable capability and a distinguishing competitive
advantage for CSC.
As we look at fiscal year 2000, opportunities abound. In the first two months
of the year, we announced the award of a $1.2 billion outsourcing contract
with Pratt & Whitney and a $1.1 billion agreement with Enron. We continue
to be the leading information technology services supplier to the U.S. federal
government, and our growth prospects in the global commercial marketplace
are strong.
As always, my sincere thanks for another year of extraordinary performance
by CSC's 50,000 employees who again have demonstrated that they are the
best in the business.
Sincerely yours,
Van B. HoneycuttChairman, President and Chief Executive OfficerJune 18, 1999
As companies around the world increasingly turn to the Internet to market
their goods and services, e-business becomes central to their mission-critical
business planning. Worldwide information technology spending for hardware,
software and services associated with e-business implementation is expected
to exceed $50 billion by 2002, including emerging e-business initiatives
in electronic billing systems and supply chain management. A majority of
CSC's engagements include Internet components, which are proliferat-
ing as companies build their e-business infrastructure and implement
their strategies in this explosively growing area.
In May of this year, we announced a key development in our e-business
strategy. CSC will participate in the Sun-Netscape Alliance Preferred
Integrators initiative and will train and certify thousands of CSC consultants
on the Sun-Netscape product line. As a result, we will offer our clients
stronger and more flexible business services and solutions to capitalize on
the opportunities that e-business technologies afford them.
Our new business performance in fiscal 1999 was outstanding. We
announced more than $5 billion in new awards, excluding a landmark
contract with the U.S. Internal Revenue Service which has not been publicly
valued, but is estimated to be worth as much as $8 billion by various industry
and financial analysts. Other significant awards include a $300 million
outsourcing contract with AT&T; a $198 million systems integration award
from the U.S. Postal Service; a $200 million outsourcing contract with Budget
Group, the parent company of Budget Rent a Car; and a $320 million
outsourcing agreement with Republic National Bank. These and a number of
other important awards will deliver significant revenues and strengthen
CSC’s market position in fiscal 2000 and beyond.
Outsourcing contracts bring more than revenues to CSC. They add highly
skilled information technology professionals to our workforce. In fact, of our
50,000 employees, over 12,000 joined the company as the result of outsourcing
agreements. Another source of talent is our acquisition program. Nearly
20,000 of our employees came to CSC as their companies joined ours.
In fiscal 1999, we announced eight acquisitions that will increase our staff by
more than 3,000 employees. In the Asia-Pacific region, we acquired CSA
Holdings, one of the largest information technology services companies in
the region. In Europe, we added KMPG Peat Marwick SA, a leading French
consulting firm; SYS-AID, a Netherlands-based services company that
increased our management consulting and ERP capabilities; Pergamon
GmbH, a German-based I/T company serving European mortgage lenders;

7
These charts portray the increase in spending on information technology around the world.They show expenditures by market for 1995 and 1998 and the projections for 2002.*
US CommercialUS FederalRest of World
Total
$ 484 Billion34 Billion
620 Billion
$ 1.138 Trillion
US CommercialUS FederalRest of World
Total
$ 327 Billion26 Billion
459 Billion
$ 812 Billion
US CommercialUS FederalRest of World
Total
$ 264 Billion20 Billion
328 Billion
$ 612 Billion
The Huge Information Technology Marketplace
B y M a r k e t
*Source: International Data Corporation
$ 1.1 Trillion
$ 612 Billion
$ 812 Billion
1 9 9 8
2 0 0 2
1 9 9 5
The robust forecast for global I/T spendingacross industry and government is a keybarometer of CSC’s potential future success.By 2002, the worldwidespending for systems and services is projected to be a staggering $1.1 trillion.
9
$ 7.7 Billion
$ 7.7 Billion
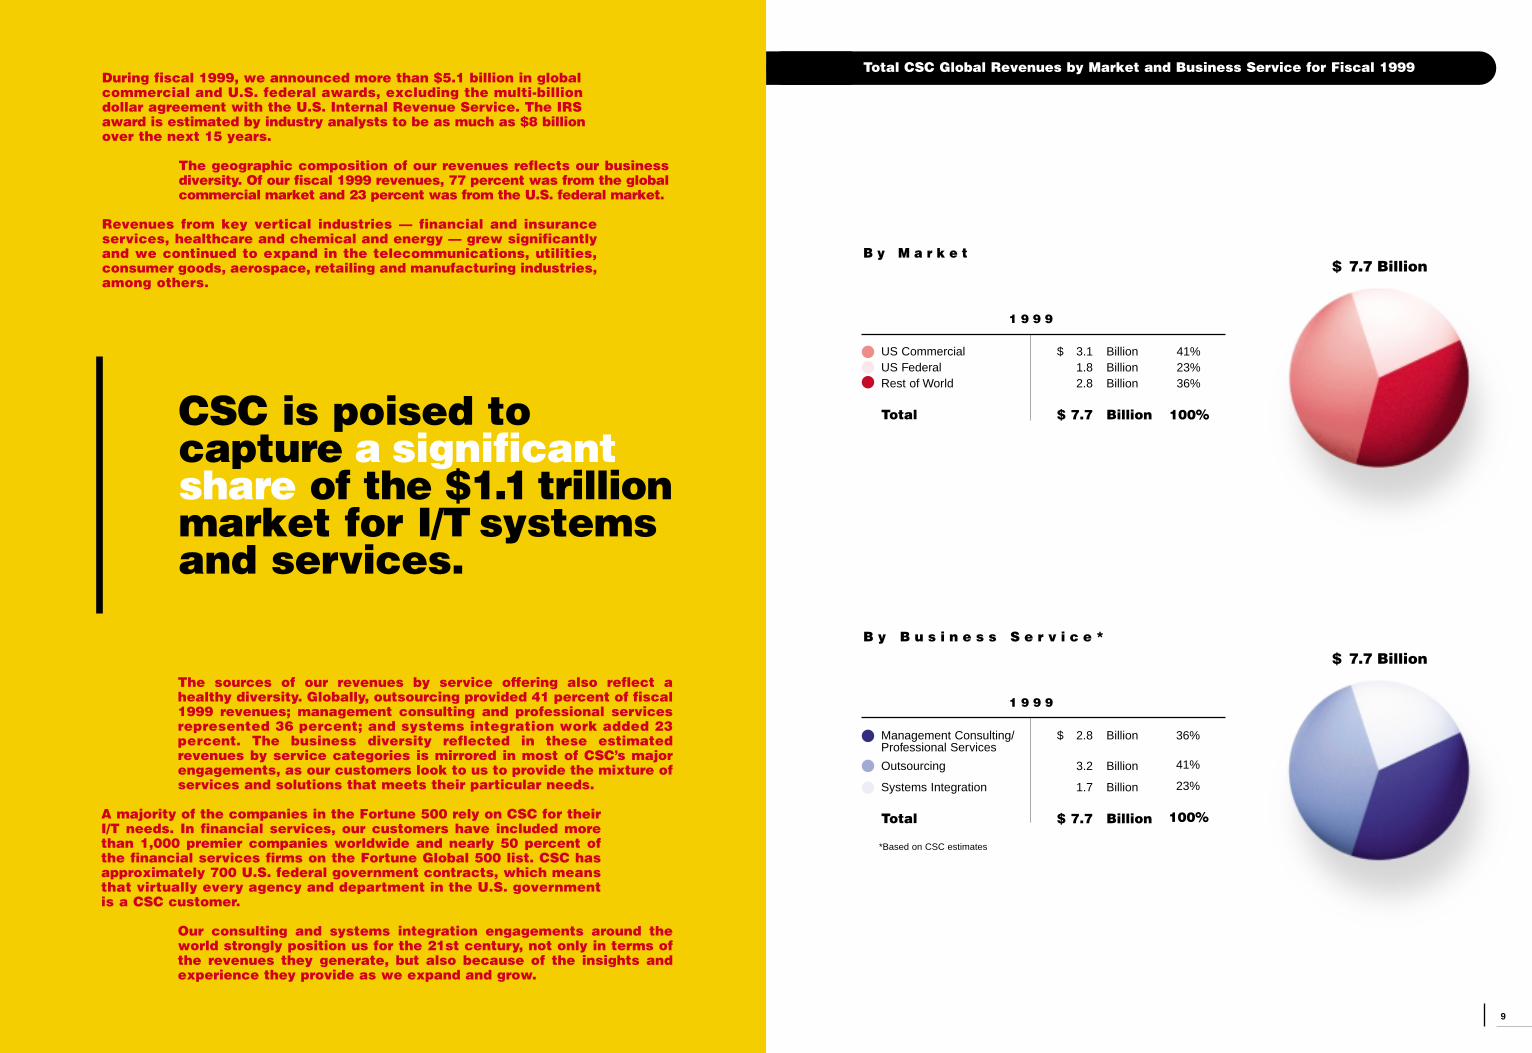
Total CSC Global Revenues by Market and Business Service for Fiscal 1999
Management Consulting/Professional Services
Outsourcing
Systems Integration
Total
B y B u s i n e s s S e r v i c e *
B y M a r k e t
*Based on CSC estimates
US CommercialUS FederalRest of World
Total
$ 3.1 Billion1.8 Billion2.8 Billion
$ 7.7 Billion
41%23%36%
100%
$ 2.8 Billion
3.2 Billion
1.7 Billion
$ 7.7 Billion
36%
41%
23%
100%
1 9 9 9
1 9 9 9
During fiscal 1999, we announced more than $5.1 billion in globalcommercial and U.S. federal awards, excluding the multi-billiondollar agreement with the U.S. Internal Revenue Service. The IRSaward is estimated by industry analysts to be as much as $8 billionover the next 15 years.
The geographic composition of our revenues reflects our businessdiversity. Of our fiscal 1999 revenues, 77 percent was from the globalcommercial market and 23 percent was from the U.S. federal market.
Revenues from key vertical industries — financial and insuranceservices, healthcare and chemical and energy — grew significantlyand we continued to expand in the telecommunications, utilities,consumer goods, aerospace, retailing and manufacturing industries,among others.
The sources of our revenues by service offering also reflect ahealthy diversity. Globally, outsourcing provided 41 percent of fiscal1999 revenues; management consulting and professional servicesrepresented 36 percent; and systems integration work added 23percent. The business diversity reflected in these estimatedrevenues by service categories is mirrored in most of CSC’s majorengagements, as our customers look to us to provide the mixture ofservices and solutions that meets their particular needs.
A majority of the companies in the Fortune 500 rely on CSC for theirI/T needs. In financial services, our customers have included morethan 1,000 premier companies worldwide and nearly 50 percent ofthe financial services firms on the Fortune Global 500 list. CSC hasapproximately 700 U.S. federal government contracts, which meansthat virtually every agency and department in the U.S. governmentis a CSC customer.
Our consulting and systems integration engagements around theworld strongly position us for the 21st century, not only in terms ofthe revenues they generate, but also because of the insights andexperience they provide as we expand and grow.
CSC is poised to capture a significantshare of the $1.1 trillionmarket for I/T systemsand services.

11
New client engagements secured last year included what potentially is the largestcontract CSC has ever won. Highly publicized and fiercely pursued, the U.S. InternalRevenue Service award was without question our largest during fiscal 1999. Onceagain demonstrating our flexibility and creativity, CSC assembled a team of worldclass service providers under the banner of the CSC PRIME Alliance to lead anundertaking that will touch almost every American: the modernization of the IRS’technology infrastructure. This strategic relationship with the IRS combines all ofCSC’s global I/T capabilities with the specialized business, technical and consultingresources of six of the world’s most respected companies. The ultimate goal of the15-year effort is to enable the IRS to better understand and solve taxpayers’ problemswhile helping them meet their legal obligations.
In selecting the CSC PRIME Alliance, the IRS underscored the numerous attributesthat only a company as diverse as CSC can bring to client engagements. Simplystated, it was our holistic business transformation approach, not only our I/T skills,that appealed to the IRS. Our abilities to provide strategic input to determine businessobjectives, align these goals with I/T solutions, and finally implement and manage thenew systems in partnership with the IRS proved to be the winning combination inthis modernization effort.
The IRS award also exemplifies the changing nature and requirements of governmentagencies. To better serve their constituents, our government customers throughoutthe world are looking increasingly for best commercial practices and the tools andmethodologies to address their I/T needs. Clearly, the diversified and comprehensiveapproach we presented to the IRS proved successful.
In another landmark event, CSC won BREAKTHROUGH, the U.S. federal govern-ment’s first outsourcing contract, which was awarded by the National SecurityAgency of the Department of Defense. As the first federal outsourcing contract,BREAKTHROUGH involves government employees voluntarily joining the privatesector. In this engagement, we maintain the NSA’s I/T systems and provide devel-opment support for software enhancements.
The NSA BREAKTHROUGH program also holds implications for future outsourcingopportunities within the U.S. federal government. The U.S. Congress and federalagencies contemplating outsourcing as an effective way to reduce costs andimprove efficiencies are closely watching the success of BREAKTHROUGH.
These two new engagements represent the vitality of our U.S. Federal Sector thatposted its best year ever in terms of the number and dollar value of contracts won.
The keys to our future are found in our current performance.
The breadth of CSC’sskills, our suite of end-to-end serviceofferings and technologies, our geographic reachand our marketexpertise make CSCstronger than we have ever been inour 40-year history.

13
The exchange, www.e-steel.com, allows the buying and selling of steel throughprivately negotiated and auction-based transactions. As a neutral marketplaceserving the worldwide steel industry, it provides value for buyers and sellers andserves the entire transaction chain, including steel mills, service centers, processors,distributors and OEMs. According to steel industry estimates, the world market forcrude steel is $300 billion, while the total market for steel products is far greater.
Another highlight of our new business achievements this past year is the $198 millioncontract from the U.S. Postal Service to support the development and implementationof enterprise-wide I/T solutions for its global human resources and payroll system.
12
Government clients are lookingfor best commercial practices to help align their strategic andoperational objectives, as isdemonstrated in our partnershipwith the IRS.
In recent years, e-business has become the most dynamic phenomenon in I/T.
The Internet has given rise to new ways of doing business for traditional corporationsand for a new genre of entrepreneurial firms.
In one of CSC’s key awards in the U.S. commercial marketplace, we partnered withe-STEEL LLC to pioneer a new way of doing business in the steel industry with thecreation of the first neutral online trading exchange for steel products.
15
Naviga Group, a Brussels-based insurance group, has been a client of CSC’s formore than 20 years. Last year, following a number of acquisitions, Naviga founditself with a myriad of I/T systems. CSC was tapped to undertake a completesystem re-engineering, as well as a fundamental technology strategy overhaul. Thisproject is now scheduled for completion by January 2001.
Change brings opportunities, and this is particularly true in the global financial services market.Sweeping legislative changes around the globe continue to open new horizons forCSC in the financial services arena. Deregulation is spurring competition amongfinancial industry niches and is bringing global players into new markets. Successfulfirms in this arena are expanding their products and services beyond their traditionalofferings in order to increase their share of consumer spending. This has led to theblurring of lines between insurers and banks around the world.
As in past years, CSC was again on the forefront helping European customers tapopportunities created by government pension privatization. In Japan, which holds theworld’s largest retirement savings per capita, mutual funds and investment-styleretirement products are attracting consumers away from traditional insurance products.CSC last year implemented solutions for several customers in Japan that enhancedcall center operations and back-office systems, making them more efficient andcompetitive in light of this new environment.
Equipped with this global expertise, CSC is well qualified to assist institutionsfacing the proposed financial services reform in the U.S.
CSC is on the leading edge of helping organizations adjust to volatile market conditions in the healthcare industry.In the healthcare industry, consolidation is radically changing the delivery ofmedical care. It is also sparking intensified competition and pressure to reducecosts among providers.
Last year, an alliance of 1,800 hospitals throughout the country turned to CSC todevelop an unprecedented web-enabled knowledge management environment.This system has changed the way clinical methodologies and tools needed to supportefforts to improve outcomes for patients are captured and disseminated. Throughthe development and implementation of better approaches to care, the allianceseeks to strengthen the ability of participants not only to innovate and learn, but torapidly improve clinical practice in a responsible manner. It intends to make thissystem — the first of its type in provider healthcare — an industry standard.
14
(No small task, given that the Postal Service has almost one million employees.) The teamwork demonstrated in winning the award is a stellar exampleof how CSC’s integrated approach to delivering I/T services works. CSC utilized itsconsulting and systems integration capabilities to develop the best solutions for thechallenges facing the Postal Service.
The $200 million, five-year global technology partnership with Budget Group Inc.,parent of Budget Rent a Car, was another important commercial marketplace win.CSC is combining its outsourcing and business transformation skills to helpstreamline and consolidate Budget’s worldwide I/T operations to improve financialperformance.
For AT&T Consumer Services, we are managing a portfolio of 50 systemsapplications for functions such as consumer telemarketing, customer support, salesand marketing. Approximately 250 AT&T employees and contractors have joinedCSC as part of this 10-year, $300 million contract.
In the consumer packaged goods area, Dr Pepper/Seven Up, the largest non-colasoft drink enterprise in North America, is relying on CSC to provide SAP applicationssupport and enhancement services as part of a five-year outsourcing agreement.
Two new large outsourcing deals in financial services included agreements withFidelity and Guaranty Life Insurance Co. and Republic National Bank of New York.F&G Life, a leader in equity indexed annuities, extended its 1995 agreement through2013, raising the total value to $540 million. CSC’s responsibilities range from newpolicy processing and customer service to support of information technologyinfrastructures. For Republic National Bank, a full-service commercial bank, CSC ismanaging the data center, help-desk and network and communications operationsunder a 10-year, $320 million contract.
These and other awards will fuel CSC’s growth in the global commercial market going forward.
Our performance in Europe is highlighted by our continued growth there.
With more than $2.2 billion in revenues this fiscal year, a compound annual growthrate of over 35 percent since 1995, our success in Europe has been based on largeoutsourcing awards, strong growth in our consulting business and an expansion ofexisting client relationships.
Take British Aerospace, for instance. Our original $1.5 billion contract announced fiveyears ago was a 10-year outsourcing agreement for the maintenance of all of its application systems. Helping British Aerospace reduce I/ T costs opened newpossibilities for CSC. Today, due to the expanded scope of the work, including the integration of SAP and BAAN enterprise resource planning (ERP) systems and manage-ment consulting services, revenues from British Aerospace have more than doubled.

17
It became even more so with the award in April 1999 of an 11-year contract fromEnron Energy Services, a subsidiary of Enron Corporation. The contract has anexpected value of $1.1 billion.
Enron Energy Services retained CSC to provide a strategic array of businessprocess outsourcing (BPO) services for its back-office administrative functions,including traditional meter reading, billing and collection and related customerresponse (MBCR) for the company’s retail gas and electricity customers.Approximately 320 Enron Energy Services employees and contractors joined CSC.
16
In the managed care arena, CSC also forged agreements with several large healthinsurance organizations. For one, CSC has embarked on a systems integrationprogram to enhance the provider’s medical management and call tracking systems.
The chemical and energy marketplace has been an important one for CSC
since DuPont awarded us a $4 billion outsourcing contract in 1997.
As globalization continues to present new challenges to commercial corporations such asBudget Rent a Car, informationtechnologies will remain a criticalingredient for success.
19
During fiscal 1999, CSC announced 20 outsourcing awards that provided us withapproximately 1,000 employees and $2.4 billion of anticipated revenues. The financialimpact of these contracts will be increasingly felt as we move through fiscal 2000and beyond.
We announced eight acquisitions that areadding more than 3,000 employees globally.By several measures — revenues, professional staff, complementary capabilitiesand extended geographic reach — our acquisition program was instrumental infurther strengthening CSC’s global presence.
A strategically important acquisition was the majority position we assumed in CSAHoldings Ltd, one of the premier I/T service providers in the Asia-Pacific region.CSA’s capabilities complement ours: I/T systems consulting and integration services.The company also distributes hardware, software and networking products. But theimportance of CSA goes beyond what it brings to CSC today.The real benefit is whatCSA will provide us in the future.
The Asian economy is beginning to emergefrom recession. As it does, companies inthe region will consider streamlining theiroperations to compete more effectively on a global basis. I/T services, particularly outsourcing, which has not been widely used in the region,will likely play an integral role in this transformation.
CSC is unlike other I/T service providers who entered the Asian market because ofexisting hardware clients or by virtue of being acquired themselves. Rather, CSC isthe first major I/T services company to enter the market through the acquisition of awell established partner.
In addition, our operations in the Australian and New Zealand markets continue toexpand. Last year, we were awarded three significant contracts from customers inthe government and financial services sectors. Our growing presence in theAustralian/New Zealand areas, combined with CSA as our market-facing partner inAsia, will position CSC as a major force in Asia-Pacific.
18
This relationship presents tremendous opportunities for growth in the deregulatedenergy market, which has more than 200 million meters and $20 billion in annual U.S.service revenues. CSC will incorporate e-business and other I/T solutions to help EnronEnergy Services achieve important gains in productivity. CSC’s solutions, combined with Enron Energy Services’ MBCR capabilities, will create an unprecedentedfoundation to offer this new service to other energy and utility companies worldwide.
Today, outsourcing is a growing market, estimated to have exceeded
$120 billion in 1998. It continues to be a vibrant area for CSC.
The outsourcing of I/T operations among large corporations is something that CSChelped pioneer eight years ago with our groundbreaking contract with GeneralDynamics Corporation.
The General Dynamics account has expanded further this year with an additional$802 million in new outsourcing agreements from four different General Dynamicsbusiness units. And, as perhaps the best testimony to the effectiveness of ourrelationship, General Dynamics not only extended our original outsourcing contractfor an additional seven years through the year 2004, but also named us the exclusiveI/T services supplier for all of its business units and future acquisitions.
Several other important outsourcing contracts also highlighted our fiscal 1999 performance.
Forward-looking companies in the evolving healthcare industry continue to look to I/Tand business process outsourcing to improve efficiency. Cole Managed Vision, thelargest optical chain provider of managed vision care services and a CSC client foreight years, extended our outsourcing relationship for an additional five years.We areproviding Cole with a wide variety of services including applications developmentand claims processing.
For Premier, Inc., an alliance of 215 independent not-for-profit healthcare systemsthat operate or are affiliated with 1700 hospitals throughout the United States, weare now responsible for application development, hardware, networks and desktopmanagement at the client’s major offices in San Diego, Chicago, Washington, D.C.and Charlotte, N.C.
In the worldwide financial services marketplace, outsourcing continues to be apopular way for insurers and banks to maximize their resources while maintaining ahighly effective and responsive I/T operation. In addition to Republic National Bankand Fidelity & Guaranty Life, we signed outsourcing agreements with half a dozenfinancial services customers around the world.
21
We continued to actively expand our European presence. Last October, we acquiredthe Paris-based management consulting business of KPMG Peat Marwick SA. Thecombination of KPMG’s organization with CSC’s existing presence in France haspropelled us into a leading market position with approximately 1,100 professionals.
We also enhanced our presence in the Netherlands and Germany. Our acquisitionof SYS-AID bolstered our current management consulting and ERP capabilities inthe Netherlands, a market for us since 1966. In Germany, we acquired Pergamon GmbH, an I/T firm based in Wurzburg specializing in Java-based technologysolutions for mortgage lenders.
20
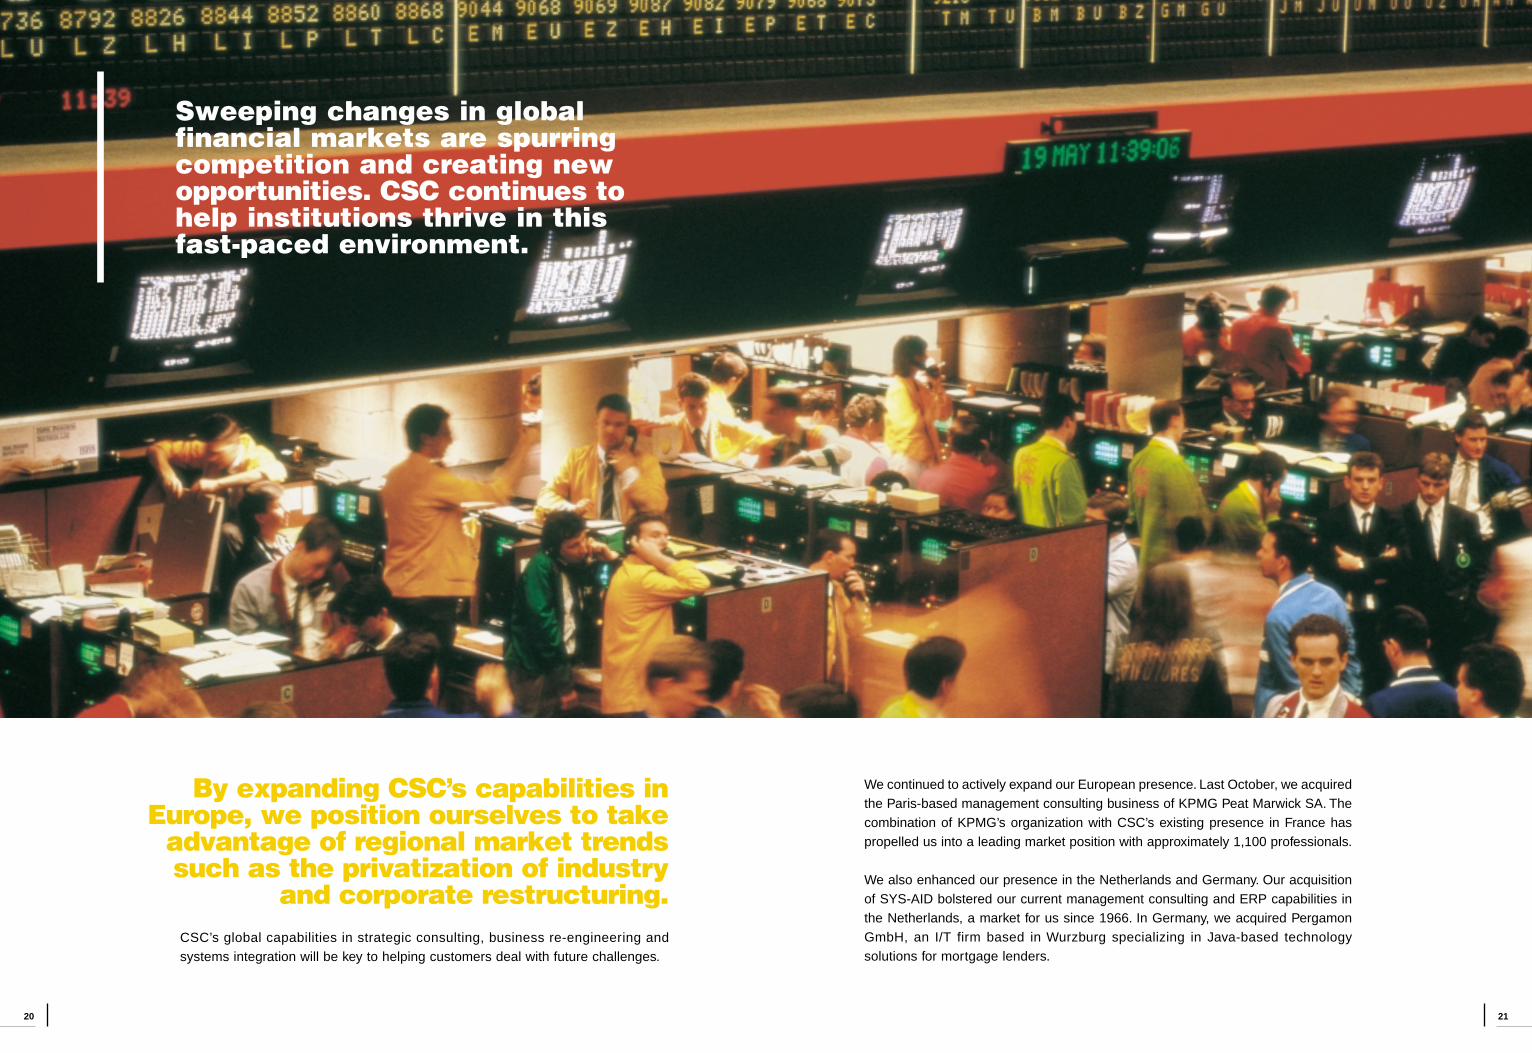
By expanding CSC’s capabilities in Europe, we position ourselves to take
advantage of regional market trendssuch as the privatization of industry
and corporate restructuring. CSC’s global capabilities in strategic consulting, business re-engineering andsystems integration will be key to helping customers deal with future challenges.
Sweeping changes in global financial markets are spurringcompetition and creating newopportunities. CSC continues tohelp institutions thrive in this fast-paced environment.

2322
And finally, our vendor neutrality, balanced with a wide range of strategic alliances,continued to help drive our success. Customers’ business needs demand newsolutions such as e-business, customer relationship management and ERP. Toserve these customers, we go to market armed with our own solutions as well as thecapabilities of companies such as Sun Microsystems, Microsoft, Compaq, SiebelSystems, SAP, PeopleSoft, Baan, Oracle and others. These combined resourcesenable our customers to use technology as a competitive advantage as they confrontever-changing market demands.
T r e n d s
We expect three overarching trends to permeate our business efforts.
Customers’ business strategy increasinglywill intertwine with I/T solutions, accordingto industry analysts. As technology races ahead at a furious pace, customers must constantly review I/Tgoals and align them with changing business objectives. This is a critical concern forsenior management, particularly for chief executive officers.
CSC remains ideally positioned to support this need. With a broad suite of integratedservice offerings, from management consulting through systems design andintegration to outsourcing and e-business solutions, deliverable on a worldwidebasis, we look holistically at a customer’s challenges and develop the most appropriateand effective solutions. We employ flexible approaches and deliver what wepromise, earning a reputation of integrity and trust among our customers.
Implementing new I/T solutions reliably and efficiently on a global basis will be a critical customer consideration.Corporations and organizations around the world will show a pronounced shift inhow they approach I/T solutions. Instead of simply focusing on the invention of newbusiness models, the emphasis will be on the performance-driven implementation oftechnology. CSC’s inherent understanding of and ability to deliver mission-criticalperformance will be important to our success.
In the Italian market, the I/T services opportunities frequently require a large “on theground” presence. Until recently, we did not have the required scope and scale. Butwith two separate acquisitions, announced at the close of the fiscal 1999, CSC hasquickly established itself in Italy. Our acquisition of Informatica Group SpA enhancesour systems integration and consulting capabilities and adds offices in Turin, Milanand Rome. And the four business units we acquired from the Progres Group will add700 I/T specialists in Milan, Padua, Rome, Bologna, Ravenna and Trento.
In the United States, our strategic acquisi-tions further position us as a one-stop
resource for companies and organizationsentering the e-business arena.
By acquiring Onward Technologies Inc., a web-focused consulting, development andsystems integration firm in Massachusetts, we expanded our expertise in Internetmarketing, e-business and customer intranets and extranets. Another acquisition, T-Wack Software Group, Inc., gives us software design and development expertisein environments such as Visual Basic, C++, Java, SQL Server, Oracle and Accessfor use in client-server and Internet applications.
Since we initiated our acquisition program in 1986, CSC has acquired more than 60companies, which, taken together, strategically expand our global reach and servicecapabilities, while increasing our professional staff worldwide.
Successful companies anticipate change and capitalize on it.
In our marketplace, these changes include globalization, the rapid enterprise-wideimplementation of technology and the ever-growing demand for cost-effectivedelivery of solutions.
Our operating structure correlates directly to the needs and demands of the globalI/T marketplace. It also leverages CSC’s balance and diversity of offerings, expertiseand geographic reach.
Our service offerings, including e-business, management and I/T consulting andprofessional services, systems integration and outsourcing, support the client needsidentified by our vertical industry groups and geographic organizations. Our verticalindustry expertise in financial services, healthcare, chemical, energy, utilities,telecommunications, retail, manufacturing and other areas enables us to serve globalindustries. And as these industries expand their I/T spending in the coming years, CSC will be there.
Additionally, our presence in North America, Europe and Asia-Pacific provides anunderstanding of and insights into the cultures in each of these markets that enablelong-term client relationships.

25
As noted earlier, spending on information technologies by the year 2002 is expectedto reach $1.1 trillion. Within this enormous market, there are several areas that areparticularly promising for CSC’s growth.
To say that the e-business area is thriving and enjoys tremendous prospectsgoing forward does not do it justice.Organizations are increasingly embracing e-business as part of their mission-criticalstrategic plans. Consequently, worldwide e-business spending on related
24
Finally, the convergence of different technologies will force organizations to
reconsider how they do business.These technologies include e-business, wireless global telecommunications, ERP,customer relationship and supply chain management programs and complexdistributed computer systems. Regardless of whether their customers are business-to-business buyers or consumers, organizations will find that technology will alterhow they interact with their constituents. And CSC will again be there to guide themthrough this technological maze.
The Internet has created newopportunities for entrepreneurialfirms such as e-STEEL and has dramatically altered how traditional companies conductbusiness.

2726
Nowhere is this more prevalent than in the financial services market. The omni-present Internet has armed consumers with a growing understanding of what thetechnology can do for them. Managing their finances or looking for comparativeinformation on financial products and services anywhere and anytime is becomingthe preference for consumers. Institutions are finding that their traditional means todeliver services to consumers are not sufficient.They must provide access through avariety of channels tailored to customer needs.
Because of the Internet’s almost unlimited reach, small firms located anywhere inthe world can now compete with long-standing industry giants in financial services.This places new demands on all institutions to leverage enterprise-wide information,attract new customers and deliver services reliably throughout the world.
The area of ERP has experienced meteoric growth over recent years and, from allindications, we see this trend continuing. Global spending on professional servicesfor ERP applications is expected to be almost $69 billion in 2001, an annual growthrate of more than 36 percent since 1996.
This newest phase of growth will come as customers seek to leverage their ERPinvestments with systems designed to automate their interaction with externalpartners, suppliers and customers. In all industries, customer relationship and supply chain management softwareapplications will be integrated with existing ERP systems in order to tie together backoffice and front office functions. According to industry projections, investments incustomer relationship and supply chain management implementations are expectedto increase at a compound annual growth rate of 24 percent between 1998 and 2003.
In the U.S. healthcare industry, for example, it is estimated that providers spendmore than $11 billion on avoidable supply chain process costs. Managing thesupply chain more effectively using I/T services and products can reduce thisexpense and increase a healthcare provider’s bottom line significantly.
In the chemical industry, where in many cases the only differences betweencommodity products are availability and service, customer relationship managementissues are expected to increase. The Internet, in tandem with ERP and customerrelationship management solutions, will change the way products are bought andsold. Buyers, no longer captive to any one supplier, can examine the quality, priceand availability of goods through the Internet and related technologies.
professional services alone will approach $100 billion by 2003, according to forecasts.In the past year, we incorporated e-business components into the majority of ourclient engagements and, as the Internet continues to take hold as a more efficientmeans of operating, we see e-business opportunities growing dramatically.
In our 11th Annual Survey of Critical Issues of Information Systems Management,88 percent of the I/T executives questioned indicated that the present intention oftheir web site was to inform. The 12 percent currently conducting business on theirsites are the early adopters, risk takers who seek the benefits and competitiveadvantage that an e-business initiative affords.
With dramatic growth in worldwide revenues from e-business activities anticipatednext year, we have worked with traditional companies looking to improve theirbusiness operations as well as entrepreneurial firms whose entire businessstrategy is firmly planted in Internet technology.
Our e-business prospects for next year are bright as an increasing number of corpo-rations and organizations begin to look to the Internet to transform their businesses.Unlike today’s risk-taking innovators, this next wave of “early majority” organizationsis highly pragmatic.They will seek proven solutions from a market leader to help themgrow profitably, reduce costs and better serve their customers.
Growth in worldwide e-business spendingwill be driven by dramatic increases in the business-to-business arena, while
the business-to-consumer segment will continue its prominent growth.
In each segment, organizations will need counsel on how to use the Internet tore-engineer their businesses. They will require experience in the development andimplementation of mission-critical, high-performance e-business solutions and willneed new approaches that provide an almost immediate return on investment.
This challenge is in perfect symmetry with a major objective of CSC’s offerings:speed-to-business results. Our worldwide management consulting capabilities helpcustomers determine the best approach to utilizing the Internet to enhance or establishtheir business. Additionally, we work with them to determine how this and othertechnologies must be integrated to meet their business objectives. Once a strategicapproach is determined, our creative resources design a site that delivers an easyto use, interactive and effective experience. Next, our systems integration expertiseis brought in to orchestrate the actual hardware and software implementation.
And finally, we help customers measure the effectiveness of the solutions andensure that their objectives are met.

29
Companies seeking to re-engineer their entire business operations around the webwill need our consulting and systems integration expertise. We will work with ourcustomers to help them understand how to leverage the Internet from strategydevelopment through implementation.
It has been approximately 10 years since the outsourcing of I/T functions first emergedin the commercial marketplace. In 1998, I/T outsourcing as a market topped the $100billion mark. By the year 2003, according to some industry projections, I/T outsourcingwill grow to more than $315 billion, a compound annual growth rate of almost 26 percent since 1998.
28
As companies leverage their investments in ERP solutions, CSC is positioned to help them from strategy development
through actual implementation.
Customers will first look to our management consulting expertise to determine howdifferent solutions can address their needs to interact more effectively with partnersand customers. And with our traditional systems integration capabilities, we will seekto tie these new applications to customers’ legacy ERP solutions.
I/T services will play an integralrole in the revitalization of theAsian economy as companiesthere seek ways to compete more effectively on a global basis.
3130
Today, outsourcing in the U.S. federal and global commercial markets continues to bea robust part of CSC’s business mix and represents approximately 41 percent of revenues.
Outsourcing will continue to become morewidespread, according to industry analysts,
particularly in markets outside of the U.S. But the reasons organizations will turn to outsourcing are changing.
In the early 1990s, the rationale to outsource the I/T function was often mainly abalance sheet decision: companies would transfer assets to a service provider forcash, and I/T employees would become employees of the vendor. Today, outsourcingis a strategic decision. Customers look at I/T outsourcing as a way to align businessobjectives and I/T strategies. Indeed, the hundreds of senior executives we questionedlast year in our 11th Annual Survey of Critical Issues of Information SystemsManagement support this. For the fourth consecutive year, they suggested thataligning the information systems goals with business goals is their greatest priority.Outsourcing has and will continue to play a vital role in making this alignment happen.
But what will fuel outsourcing’s growth?
For one thing, I / T outsourcing is no longer specific to the commercial sector.I/T operations at U.S. federal, state and county governments are looking to serviceproviders such as CSC to assume responsibilities for their I/ T functions. Severalemerging niches will also support the continued growth of outsourcing. For example,the application management services area, which gives a provider such as CSCresponsibility for the development, maintenance and enhancement of both custom andpackaged software programs, will grow annually at a 19 percent rate and become a$30 billion market by 2003, according to industry analysts.
The outsourcing of business processes, expected to grow from $147 billion in 1998 to$402 billion in 2003, a compound annual growth rate of 22 percent, is an expandingfrontier. Our agreement with Enron Energy Services described earlier is a good exampleof business process outsourcing.
From a geographic perspective, the U.S. and Europe are the world’s largestoutsourcing markets with 45 percent and 40 percent, respectively, of the 1998 worldoutsourcing revenues. Looking forward, the U.S. market is expected to grow at a 29 percent annual rate while Europe will increase at a 24 percent rate by 2003.
An added benefit from outsourcing is the positive impact it has on CSC’s staffing and recruitment needs. Of our 50,000 employees worldwide, more than 12,000 have joined CSC as a resultof outsourcing agreements since we entered the field in 1991 with our first out-sourcing client, General Dynamics. In coming to CSC, these people have found newpaths for growth and professional development by virtue of our retraining pro-grams and the opportunities to work on our global projects.
Five years ago, few people would have expected the Internet to be as pervasive asit is in business and consumer circles. Yet, not only has it become critical for theefficient operation of businesses, new markets have been created because of it.
There is a new technology under development that is going to lift Internet access to the next level: the Internet phone. Earlier this year, Nokia, a strategic partner of CSC in providing telecommunicationssolutions to our customers, introduced a handheld wireless phone based on a newtechnology known as Wireless Application Protocol (WAP). With these phones andtheir improved bandwidth, people will be able to access an entire new array ofInternet services, both data and video. How will this impact the cellular market? Lastyear the market for cellular devices was 160 million mobile units. This year it will top200 million units and analysts expect that next year there will be as many as 300 mil-lion mobile phones sold.
If 20 percent of those devices allow for Internet access, we will face a market in whichthe way we do business, communicate and lead our lives will be changed significantly.And CSC will be there to help companies capitalize on this phenomenon.

3332
T h e F u t u r e
CSC continually invests in products that let us work smarter.
In the I/ T services business, change is constant and pervasive. This fast-paced,dynamic and highly competitive environment dictates that CSC must continue toinvest in initiatives, methodologies and tools that fundamentally improve the ways inwhich we develop and bring to market innovative solutions for our customers.
At CSC, these initiatives emphasize innovative uses of technology and are focused onfinding practical ways to leverage the best practices, expertise and experience of ourtechnologists and consultants to deliver large, complex information systems quickly.
For several years now, CSC customersaround the world have relied on a
proprietary CSC methodology - a roadmap -for accomplishing business change.
This methodology, incorporated into our product called CSC CatalystSM, is designedto focus on real business change rather than process automation.
Accomplishing real change requires a lot more than just new processes or software.That’s why CSC Catalyst looks at an enterprise from numerous perspectives, ordomains of change.This holistic approach sets CSC Catalyst apart as a true businesschange methodology that addresses all aspects of the operation as an integratedwhole, and not as separate parts.
CSC Catalyst is our primary approach to initiating, designing, implementing andmanaging change in large organizations. It’s also the mechanism by which we gather,validate and integrate best practices reflecting the thinking and experience of CSCworldwide.
Combining proven methods with standardized work products, CSC Catalyst measuresquality and makes it possible to deliver tangible results quickly. Using CSC Catalyst,project teams are better able to determine the most effective systems engineeringapproach; plan, estimate and schedule projects accurately; define immediate work objectives and measure progress; ensure consistency and completeness;and communicate throughout the organization to executives and users alike.
As a result, CSC Catalyst enables us to apply technology aggressively, drivedevelopment with business vision and reengineer business processes rather thanmerely re-automating them.
Building upon years of accumulated business and technical experience, CSCCatalyst represents one of the most innovative approaches to systems developmentand rapid business process change in the industry.
One of the newest tools in CSC’s arsenal is a component-based framework calledCSC LynxSM, which is used to develop large,mission-critical business applications. This framework, which can be thought of as an extension of CSC Catalyst, is rapidlyemerging as an important competitive differentiator for CSC.
Component-based software is the latest evolutionary step in accelerating applicationdevelopment, emphasizing the assembly and customization of existing componentsrather than creating software from scratch. With CSC Lynx, we deliver systemsquickly and provide customers with highly agile applications that can evolve rapidlyto meet changing business conditions.
Although several I/T firms use techniques for fast application development, CSC isthe first to package a framework containing methodology, architecture and softwareinfrastructure for transfer to customers. Because it is focused on large, mission-critical systems and optimized for distributed applications, CSC Lynx is utilized byour developers around the world to assemble applications for uses ranging frominsurance underwriting to toll collection to manufacturing process control tocustomer service.
The CSC Lynx framework is quickly gaining popularity because it improves theflexibility of applications while reducing risk and time-to-implementation. Thisframework is tightly coupled with customers’ business requirements through theCSC Lynx methodology, a customized blend of object modeling techniques andproven CSC approaches to business process modeling.
Another key initiative, CSC SourcesSM, pools all of the knowledge, strength, power and innovation of more than 50,000 employees into a single global environment for sharing knowledge.

35
G l o s s a r y o f T e r m s
The technology industry has a language all its own. Throughout this report, manyterms — specific to CSC as well as to the information technology (I/T) industry asa whole — are used that may be unfamiliar. Here is a list of definitions to helpunderstand them.
Back Office Traditional administrative functions such as billing and accounting, payroll, orderentry and management and shipping and receiving. Technologies are frequentlyused to reduce costs associated with these functions.
Business Process Outsourcing (BPO) Operating all or a portion of a customer’s back office or administrative functions toallow the organization to focus on its core operations and reduce costs.
Consulting Providing advice and counsel to customers. CSC consults with customers in twoareas. I/T consulting encompasses advising customers on the acquisition andstrategic use of information technology systems. In management consulting, anadvisor provides input and guidance on business strategy, operations, changemanagement and business process re-engineering. In many cases, CSC servescustomers with both types of consulting when business and technology issuesconverge.
CSC CatalystSM
Our primary product and methodology for initiating, designing, implementing andmanaging change in large organizations. Designed to focus on real businesschange rather than on process automation, CSC Catalyst looks at an enterprisefrom numerous perspectives and at all aspects of the business as an integratedwhole, and not as separate parts.
CSC LynxSM
A framework that enables us to rapidly develop component-based systems for ourcustomers. Distributed I/T systems allow people to access information more quicklyand process business transactions via the Internet. With CSC Lynx, we havedeveloped a framework that not only includes components, but also an architecture,a process and the tools needed to create these systems quickly.
CSC SourcesSM
A global system that captures the knowledge, solutions and best practices of themore than 50,000 employees of CSC and allows them to be shared across theentire corporation. By having direct access to this information, our professionalslearn faster and work smarter and more efficiently in addressing customers’ challenges.
Customer Relationship ManagementA business strategy aimed at acquiring, developing and retaining an organization’scustomers. CRM also refers to understanding the needs of a company’s current andpotential customers. Both strategies can be enabled by technologies that capturecustomer data at the point of contact. By analyzing this information, a company candevelop and enhance relationships that drive profitable revenue growth.
34
Such sharing is crucial because today’s emerging “global knowledge economy”causes businesses and governments to constantly rethink their operations.International competition, lightning fast changes in technologies and shifting clientpriorities force organizations to adapt at an unprecedented pace.
CSC Sources helps us stay ahead of the curve with our own global knowledgecommunity — a giant collaborative work environment, in effect — that enables CSCto capture knowledge, solutions and best practices and share them across our globalworkforce. With employee communities linked through a single worldwide system,access to methodologies, resources and proven work products is made easier.And by leveraging our knowledge, we learn faster and work smarter and more efficiently. It is why we’re an industry leader and why we create greater value for our customers.
At most companies, professionals spend an inordinate amount of time resolving thesame problems repeatedly, and not enough time on innovative thinking. Not at CSC.Our ability to leverage global knowledge drives how we collectively think and work,allowing our professionals to build upon what has already been accomplished andcontinually seek new, innovative ways to solve challenges. Through CSC Sources,we deliver more effective solutions to our customers, helping them sharpen theircompetitive edge.

Computer Sciences Corporation
3736
Management’s Discussion and Analysis ofFinancial Condition and Results of Operations
R e s u l t s o f O p e r a t i o n s
R e v e n u e s
The Company derived its revenues for fiscal years 1999, 1998 and 1997 from the following market sectors:
F i s c a l Ye a r
1 9 9 9 1 9 9 8 1 9 9 7
Percent PercentDollars in millions Amount Change Amount Change Amount
U. S. Commercial $3,128.3 13% $2,775.5 29% $2,159.7Europe 2,250.1 27% 1,771.0 20% 1,474.9Other International 516.1 22% 423.6 22% 345.8
Global Commercial 5,894.5 19% 4,970.1 25% 3,980.4U. S. Federal Government 1,765.5 8% 1,630.7 0% 1,635.6
Total $7,660.0 16% $6,600.8 18% $5,616.0
The Company’s 16% overall revenue growth for fiscal 1999 over 1998 resulted principallyfrom continued strong global demand for information technology (“I/T”) services. Globalcommercial revenue grew 19%, or $924 million, during fiscal 1999. Over 60% of theglobal commercial growth was provided from international operations.
For fiscal 1999, U.S. commercial revenue grew 13%, or 17% excluding fiscal 1998revenue from activities in the Company’s collections and telecommunicationsoperations, which were subsequently sold or phased out. More than two thirds of theU.S. commercial growth was generated by information technology outsourcingcontracts. The remainder of the growth was fueled by demand for consulting andsystems integration activities, and by further expansion in the Company’s financialservices and healthcare vertical markets. For fiscal 1998, U.S. commercial revenuesgrew 29%, or $616 million. More than half of the growth was provided by increases inoutsourcing activities. Major new outsourcing contracts, including E.I. du Pont deNemours and Company (“DuPont”) and increases in revenues from vertical markets,such as financial services and healthcare, contributed to U.S. commercial revenuegrowth. Consulting and systems integration services contributed about a quarter ofthe Company’s other U.S. commercial revenue growth during fiscal 1998 as a resultof strong demand for enterprise resource planning (“ERP”) services, electroniccommerce and Year 2000 assessment and renovation activities.
FY99
7.7
FY98
6.6
FY97
5.6
0
Total RevenuesIn Billions of Dollars
36
G l o s s a r y o f Te r m s ( c o n t i n u e d )
E-business A global initiative for developing strategies and delivering solutions for customersthat leverage the Internet and related technologies to transform or enhance theirbusiness operations. In some cases, CSC even helps entrepreneurial companiesestablish their entire business operations based on the Internet.
Enterprise Resource Planning (ERP) ERP software products are enterprise-wide applications that can integrate disparatebusiness functions, such as accounting/finance, distribution, manufacturing andhuman resources, into one coherent system. ERP products make data easier tofind, update, and analyze. CSC has global alliances with four leading ERP softwarecompanies, Baan, SAP, Peoplesoft and Oracle.
Front Office A term that refers to people, processes and technologies that interact with customers.Activities such as sales, marketing and customer service are typical front officefunctions.
Outsourcing Operating all or a portion of a customer’s technology infrastructure, including systemsanalysis, applications development, network operations, desktop computing and datacenter management.
Professional Services Services provided to a customer that are usually in the form of advice or intellectualassets and result in the improvement of that organization’s operations or financialperformance.
Supply Chain Management The means by which companies engaged in creating, distributing and sellingproducts can more efficiently integrate functions such as sourcing, planning,manufacturing, distribution and service within their own organizations and acrossthose of their suppliers and customers.
Systems Integration Designing, developing, implementing and integrating complete information systems.
F i n a n c i a l C o n t e n t s
37 Management’s Discussion and Analysis
49 Consolidated Statements of Income
50 Consolidated Balance Sheets
52 Consolidated Statements of Cash Flows
53 Consolidated Statements of Stockholders’ Equity
54 Notes to Consolidated Financial Statements
76 Report of Management
77 Independent Auditors’ Report
78 Quarterly Financial Information (Unaudited)
79 Five-Year-Review

3938
IRS to modernize the U.S. tax system. This award, the value of which is not quantified,has the potential to become the Company’s largest contract.
C o s t s a n d E x p e n s e s
The Company’s costs and expenses before special charges were as follows:
Dollar Amount Percentage of Revenue
Dollars in millions 1 9 9 9 1 9 9 8 1 9 9 7 1 9 9 9 1 9 9 8 1 9 9 7
Costs of services $5,973.9 $5,149.2 $4,413.2 78.0% 78.0% 78.6%Selling, general and
administrative 695.8 602.7 485.1 9.1% 9.1% 8.6%Depreciation and
amortization 445.0 386.9 333.2 5.8% 5.9% 5.9%Interest expense,
net 33.9 42.1 32.3 .4% .6% .6%
Total $7,148.6 $6,180.9 $5,263.8 93.3% 93.6% 93.7%
C o s t s o f S e r v i c e s
For fiscal 1999, the Company’s costs of services as a percentage of revenue wasunchanged. The decrease in costs of services as a percent of revenue for fiscal 1998was principally related to commercial growth in the healthcare and financial servicesvertical markets, as well as outsourcing, consulting and European operations,combined with performance improvements generated in Europe.
S e l l i n g , G e n e r a l a n d A d m i n i s t r a t i v e
Selling, general and administrative (“SG&A”) expenses as a percentage of revenuewas unchanged for fiscal 1999 versus 1998.
During fiscal 1998, SG&A as a percent of revenue increased to 9.1% from 8.6%. Theincrease was primarily attributable to growth in the Company’s healthcare and financialservices groups.
S p e c i a l I t e m s
There were no special items during fiscal 1999.
The fiscal 1998 special items represent costs, expenses and benefits associated withdevelopments at CSC Enterprises and the Company’s response to a failed take-overattempt. The Company recorded a first quarter net special credit of $1.7 million, or 1 cent per share, at CSC Enterprises, a general partnership which then operatedcertain of the Company’s credit services operations and carried out other businessstrategies through acquisition and investment. The net credit resulted from a tax benefit
The Company’s European operations accounted for revenue growth of 27%, or $479million, for fiscal 1999 compared to 1998. The growth was primarily due to (a) out-sourcing services provided to British Aerospace plc (“BAe”), DuPont, Hartmann &Braun, (b) the acquisition of KPMG Peat Marwick SA, a Paris based managementconsulting and I/T services firm, and (c) continued strong demand throughout Europefor consulting and systems integration activities and ERP services. CSC’s Europeanoperations accounted for revenue growth of 20%, or $296 million, for fiscal 1998 versus1997. The growth was principally due to increases in outsourcing services provided toBAe, DuPont and J.P. Morgan & Co. Incorporated and increased demand for consultingand systems integration activities.
Other international operations provided revenue growth of 22%, or $93 million, duringfiscal 1999. The growth was primarily attributable to the acquisition of CSA Holdings,Ltd., a leading Asian information technology services provider headquartered inSingapore, expansion of the financial services sector and additional outsourcingactivities in Australia. During fiscal 1998, other international revenues increased 22%,or $78 million. The growth was primarily attributable to increased outsourcing businessin Australia as well as increases in the financial services sector.
The Company’s U.S. federal government revenues were derived from the followingsources:
F i s c a l Ye a r
1 9 9 9 1 9 9 8 1 9 9 7
Percent PercentDollars in millions Amount Change Amount Change Amount
Department of Defense $1,112.7 4% $1,071.9 (1)% $1,082.8Civil agencies 652.8 17% 558.8 1)% 552.8
Total U.S. Federal $1,765.5 8% $1,630.7 0%) $1,635.6
Revenue from the U.S. federal government increased 8% during fiscal 1999 versus1998. The increase includes additional task order contracts with the GeneralServices Administration, increased ordering of a management information system forthe U.S. Department of Defense (“DOD”) and the acquisition of the DOD BallisticMissile Defense Organization support contract. Revenue gains during fiscal 1999were partially offset by reductions in work performed for NASA and the winding downof several contracts. Federal revenues for fiscal 1998 were essentially unchanged compared to 1997. Gains were generated on certain task order contracts with theGeneral Services Administration and the Defense Integration Systems Agency andby the acquisition of Information Technology Solutions, Inc. These gains were offsetprimarily by the conclusion of two large contracts in late fiscal 1997.
During fiscal 1999, CSC announced federal contract awards with a total value of $2.9billion, compared with the $1.0 billion and $2.1 billion announced during fiscal 1998and 1997, respectively. In addition, during December 1998, the Internal RevenueService selected the CSC PRIME Alliance to enter into a strategic partnership with the
FY99
78.0
FY98
78.0
FY97
78.6
70
Cost of ServicesPercentage of Revenues
Selling, General andAdministrativePercentage of Revenues
FY97
8.6
FY98
9.1 9.1
FY99
0
Depreciation andAmortizationPercentage of Revenues
FY97
5.9
FY98
5.9 5.8
FY99
0
4140
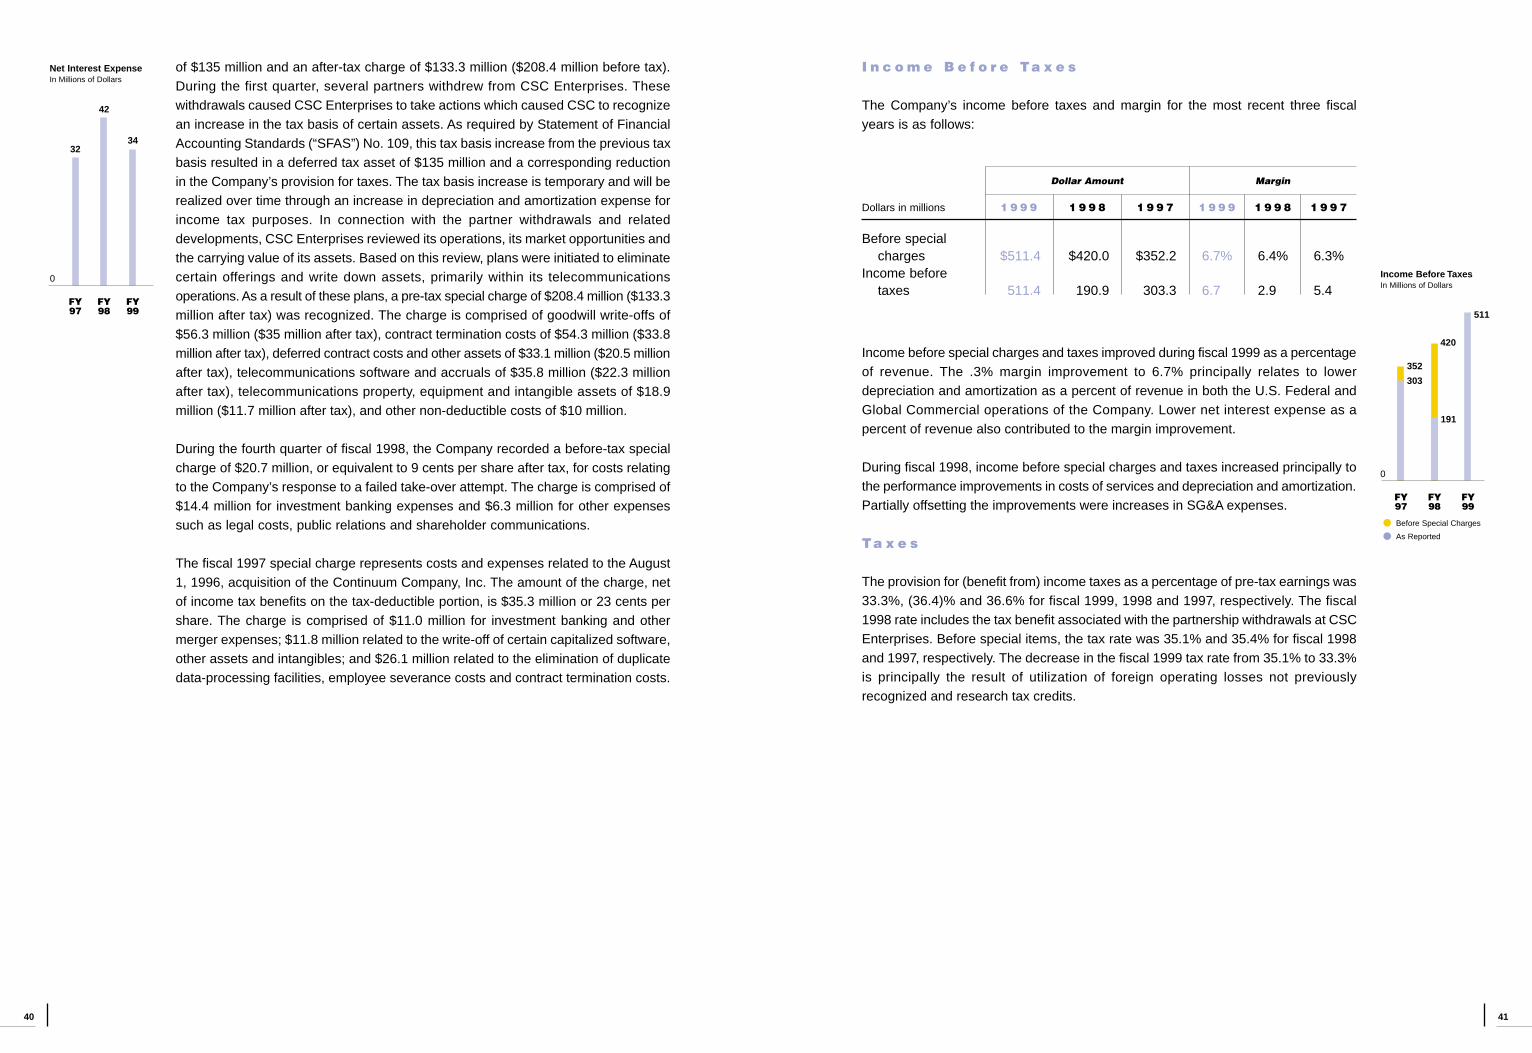
I n c o m e B e f o r e Ta x e s
The Company’s income before taxes and margin for the most recent three fiscalyears is as follows:
Dollar Amount Margin
Dollars in millions 1 9 9 9 1 9 9 8 1 9 9 7 1 9 9 9 1 9 9 8 1 9 9 7
Before special charges $511.4 $420.0 $352.2 6.7% 6.4% 6.3%
Income before taxes 511.4 190.9 303.3 6.7% 2.9% 5.4%
Income before special charges and taxes improved during fiscal 1999 as a percentageof revenue. The .3% margin improvement to 6.7% principally relates to lowerdepreciation and amortization as a percent of revenue in both the U.S. Federal andGlobal Commercial operations of the Company. Lower net interest expense as apercent of revenue also contributed to the margin improvement.
During fiscal 1998, income before special charges and taxes increased principally tothe performance improvements in costs of services and depreciation and amortization.Partially offsetting the improvements were increases in SG&A expenses.
Ta x e s
The provision for (benefit from) income taxes as a percentage of pre-tax earnings was33.3%, (36.4)% and 36.6% for fiscal 1999, 1998 and 1997, respectively. The fiscal1998 rate includes the tax benefit associated with the partnership withdrawals at CSCEnterprises. Before special items, the tax rate was 35.1% and 35.4% for fiscal 1998and 1997, respectively. The decrease in the fiscal 1999 tax rate from 35.1% to 33.3%is principally the result of utilization of foreign operating losses not previouslyrecognized and research tax credits.
of $135 million and an after-tax charge of $133.3 million ($208.4 million before tax).During the first quarter, several partners withdrew from CSC Enterprises. Thesewithdrawals caused CSC Enterprises to take actions which caused CSC to recognizean increase in the tax basis of certain assets. As required by Statement of FinancialAccounting Standards (“SFAS”) No. 109, this tax basis increase from the previous taxbasis resulted in a deferred tax asset of $135 million and a corresponding reductionin the Company’s provision for taxes. The tax basis increase is temporary and will berealized over time through an increase in depreciation and amortization expense forincome tax purposes. In connection with the partner withdrawals and relateddevelopments, CSC Enterprises reviewed its operations, its market opportunities andthe carrying value of its assets. Based on this review, plans were initiated to eliminatecertain offerings and write down assets, primarily within its telecommunicationsoperations. As a result of these plans, a pre-tax special charge of $208.4 million ($133.3million after tax) was recognized. The charge is comprised of goodwill write-offs of$56.3 million ($35 million after tax), contract termination costs of $54.3 million ($33.8million after tax), deferred contract costs and other assets of $33.1 million ($20.5 millionafter tax), telecommunications software and accruals of $35.8 million ($22.3 millionafter tax), telecommunications property, equipment and intangible assets of $18.9million ($11.7 million after tax), and other non-deductible costs of $10 million.
During the fourth quarter of fiscal 1998, the Company recorded a before-tax specialcharge of $20.7 million, or equivalent to 9 cents per share after tax, for costs relatingto the Company’s response to a failed take-over attempt. The charge is comprised of$14.4 million for investment banking expenses and $6.3 million for other expensessuch as legal costs, public relations and shareholder communications.
The fiscal 1997 special charge represents costs and expenses related to the August1, 1996, acquisition of the Continuum Company, Inc. The amount of the charge, netof income tax benefits on the tax-deductible portion, is $35.3 million or 23 cents pershare. The charge is comprised of $11.0 million for investment banking and othermerger expenses; $11.8 million related to the write-off of certain capitalized software,other assets and intangibles; and $26.1 million related to the elimination of duplicatedata-processing facilities, employee severance costs and contract termination costs.
FY99
511
FY97
303
352
FY99
34
FY98
42
FY97
32
0 Income Before TaxesIn Millions of Dollars
Before Special Charges
As Reported
Net Interest ExpenseIn Millions of Dollars
FY98
0
191
420

4342
C a s h F l o w s
F i s c a l Ye a r
1 9 9 9 1 9 9 8 1 9 9 7
Percent PercentDollars in millions Amount Change Amount Change Amount
Cash from operations $(814.1 40% $(583.3 17% $(500.4Net cash used in investing (705.1) 22% (577.1) (14) (676.5)Net cash provided
by financing 219.2 35% 162.7 (7) 175.0Effect of exchange rate
changes on cash and cash equivalents (.3) (4.9) (2.1)
Net increase (decrease)in cash and cash equivalents 327.9 164.0 (3.2)
Cash at beginning of year 274.7 110.7 113.9
Cash at end of year $(602.6 $(274.7 $(110.7
Historically, the majority of the Company’s cash has been provided from operatingactivities. The increases in cash from operations during fiscal 1999 and 1998 areprimarily due to higher earnings, non-cash charges (depreciation and amortization)and lower net income tax payments, partially offset by increased working capitalrequirements.
The Company’s investments principally relate to purchases of computer equipmentand software that support the Company’s expanding global commercial operations.Investments include computer equipment purchased at the inception of outsourcingcontracts as well as subsequent upgrades, expansion or replacement of these client-supporting assets. The Company’s investments also include several acquisitions duringfiscal 1997 through 1999. The acquisitions, individually or collectively, were not materialto the Company’s consolidated financial statements.
As described above, a majority of the Company’s capital investments have beenfunded by cash from operations. During fiscal 1999 the Company issued $200 millionof 6.25% notes due in 2009. Proceeds were used for general corporate purposes and,subsequent to year end, to repay the $150 million 6.80% notes due April 1999.
L i q u i d i t y a n d C a p i t a l R e s o u r c e s
The balance of cash and cash equivalents was $602.6 million at April 2, 1999, $274.7million at April 3, 1998 and $110.7 million at March 28, 1997. During this period, theCompany’s earnings have added substantially to equity. At the end of fiscal 1999,CSC’s ratio of debt to total capitalization was 29.2%. Giving effect to theaforementioned April 1999 paydown of the $150 million notes, the ratio of debt to totalcapitalization was 25.9%.
N e t I n c o m e a n d E a r n i n g s p e r S h a r e
The Company’s net income and diluted earnings per share for fiscal years 1999,1998 and 1997 is as follows:
Dollars in millions,Dollar Amount Margin
except EPS 1 9 9 9 1 9 9 8 1 9 9 7 1 9 9 9 1 9 9 8 1 9 9 7
Net income:Before special
items $341.2 $272.6 $227.7 4.5% 4.1% 4.1%As reported 341.2 260.4 192.4 4.5% 3.9% 3.4%
Diluted earnings per share:Before special
items 2.11 1.72 1.46As reported 2.11 1.64 1.23
During fiscal 1999, the Company’s net income margin improved to 4.5% from 3.9%.The improvement is primarily related to a reduction in depreciation and amortizationas a percent of revenue, lower net interest and a lower tax rate. For 1998, theCompany’s net income margin improved to 3.9% from 3.4%. The net special itemsincurred during fiscal 1998 reduced net income by $12.2 million, principally related to the costs relating to the Company’s response to a failed take-over attemptdescribed above.
Before special items, the net earnings margin was 4.1% for fiscal 1998 and 1997.Although the net earnings margin before special items for 1998 was the same as1997, the Company registered an improvement in cost of services as a percent ofrevenue and a lower tax rate before special items.
FY99
341
FY97
192
228
Net EarningsIn Millions of Dollars
Before Special Items
As Reported
FY98
0
260273
FY99
814
FY98
583
FY97
500
0
Cash Flow fromOperationsIn Millions of Dollars

4544
activities, the Year 2000 Assurance Office was established with this charter and reportsdirectly to the Chairman, President, and Chief Executive Officer. The initial phase,which included planning, inventory and assessment, has been completed for all of theCompany’s existing business. The final phase, which consists of correction, testing,deployment and acceptance, is in process and is expected to be substantiallycompleted during the Company’s quarter ending October 1, 1999. A very smallpercentage of the final phase activities may not be completed by October 1, 1999, ascertain clients have not yet upgraded applications for which they are responsible,thereby delaying their move from a non-year 2000 ready platform.
The Company expects that its Year 2000 preparation efforts will not have a materialeffect on its overall financial position or results of operations. The Company currentlyestimates that the total fiscal 1999 and 2000 operating costs associated with makingits proprietary products, internal systems and infrastructure Year 2000 ready, as wellas estimates for contingency planning and monitoring, including the cost of Companypersonnel diverted to Year 2000 assignments, will total approximately $51 million, ofwhich approximately $25 million had been incurred as of the end of fiscal 1999. Inaddition, the Company currently estimates that related capital expenditures for fiscal1999 and 2000 will be approximately $13 million, of which approximately $8 millionhad been incurred as of the end of fiscal 1999. The Company’s total current estimatefor Year 2000 compliance has increased by approximately $7 million since the thirdquarter of fiscal 1999 due to revised remediation estimates in Australia, some clientsscheduling system changes later than originally planned, and increased estimatesfor contingency and crisis management planning.
Some of these capital expenditures represent equipment replacements that havebeen or will be accelerated due to Year 2000 issues. The operating costs describedabove are generally not incremental, but reflect the reallocation of existing resources.The Company has not deferred any significant information technology projects as aresult of the Year 2000 efforts.
As of the end of fiscal 1999, (a) the Company had completed approximately 78% ofitems it has identified as necessary to be Year 2000 ready, including activities tocorrect Year 2000 issues, contingency planning and ancillary efforts and (b) theCompany had completed approximately 89% of items it has identified as necessaryto correct critical Year 2000 items.
The Company has completed an assessment of its obligations and responsibilities toits customers in respect of Year 2000 issues arising from contractual engagementsfor computer goods and services, including obligations arising from the licensing of the Company’s proprietary software products. As a result of this assessment, it is management’s opinion that these obligations will not have a material effect on the Company.
The Company has initiated formal communications with all of its crucial suppliers todetermine whether they are or will be Year 2000 ready. By October 1, 1999, theCompany expects to have identified and replaced any such suppliers that will not beYear 2000 ready. The Company is also contacting property owners to determine the
Dollars in millions 1 9 9 9 1 9 9 8 1 9 9 7
Debt $0,990.8 $0,765.0 $0,660.8Equity 2,399.9 2,001.3 1,669.6
Total capitalization $3,390.7 $2,766.3 $2,330.4
Debt to total capitalization 29.2% 27.7% 28.4%
During fiscal 1997, the Company increased its affiliates’ credit agreement from $350 million to $490 million to provide stand-by support for commercial paper. $115million was available for borrowing under this program, at the end of both fiscal 1999and 1998.
In the opinion of management, CSC will be able to meet its liquidity and cash needsfor the foreseeable future through the combination of cash flows from operatingactivities, cash balances, unused borrowing capacity and other financing activities.If these resources need to be augmented, major additional cash requirements wouldlikely be financed by the issuance of debt and/or equity securities and /or theexercise of the put option (as described in Note 11 to the Company’s consolidatedfinancial statements).
D i v i d e n d s a n d R e d e m p t i o n
It has been the Company’s policy to invest earnings in the growth of the Companyrather than distribute earnings as dividends. This policy, under which dividends havenot been paid since fiscal 1969, is expected to continue, but is subject to regularreview by the Board of Directors.
On February 27, 1998, the Board of Directors redeemed the stock purchase rights,which had been issued under the 1988 stockholder rights plan, for one sixth of onecent per right. The redemption was paid on April 13, 1998.
Ye a r 2 0 0 0 R e a d i n e s s D i s c l o s u r e
Since its inception, CSC has dealt with ongoing significant changes in the informationtechnology industry. As a result, resources are constantly being employed to modify,upgrade and enhance systems and infrastructure on behalf of clients and for internalneeds. The Year 2000 issue represents another one of these changes. It is the resultof computer systems that represent years as a two-digit rather than a four-digit field.Any of such systems that utilize date sensitive data may not properly recognize a datefield of 00 as the year 2000, but as some other date, typically the year 1900. This couldresult in possible system failure, miscalculations, or data corruption, thereby affectingnormal business activity.
The Company has established a two-phase program to ensure that its proprietaryproducts, internal computer systems, and facilities are Year 2000 ready. In order tolaunch this program, monitor progress and coordinate the Company’s Year 2000
4746
N e w A c c o u n t i n g P r o n o u n c e m e n t s
In June 1998, the Financial Accounting Standards Board (“FASB”) issued SFAS No.133, “Accounting for Derivative Instruments and Hedging Activities.” This statementrequires all derivatives to be recorded on the balance sheet at fair value and establishesaccounting standards for hedging activities. In May 1999, the FASB proposedamending SFAS No. 133 to defer its effective date one year to fiscal years beginningafter June 15, 2000. The Company is currently assessing the impact this statementwill have and, based on preliminary estimates, does not expect the adoption to havea material impact on its consolidated financial position or results of operations.
During 1998, the American Institute of Certified Public Accountants issued Statementof Position (“SOP”) 98-1, “Accounting for the Costs of Computer Software Developedor Obtained for Internal Use.” This statement requires the capitalization of internal usecomputer software costs provided that certain criteria are met. These capitalizedsoftware costs will be amortized on a straight-line basis over the useful life of thesoftware. The Company will adopt this statement effective April 3, 1999. The adoptionof this statement is not expected to have a material impact on the company’sconsolidated financial position, results of operations or cash flows.
M a r k e t R i s k s
Interest RatesThe Company has fixed-rate long-term debt obligations, short-term commercial paperand other borrowings subject to market risk from changes in interest rates. Sensitivityanalysis is one technique used to measure the impact of changes in interest rates onthe value of market-risk sensitive financial instruments. A hypothetical 10% movementin interest rates would not have a material impact on the Company’s future earnings,fair value, or cash flows.
Foreign CurrencyDuring the ordinary course of business, the Company enters into certain contractsdenominated in foreign currency. Potential foreign currency exposures arising fromthese contracts are analyzed during the contract bidding process. The Companygenerally manages these transactions by ensuring costs to service contracts areincurred in the same currency in which revenue is received. Short-term contractfinancing requirements are met by borrowing in the same currency. By matchingrevenues, costs and borrowings to the same currency, the Company has been ableto substantially mitigate foreign currency risk to earnings. If necessary, the Companymay also use foreign currency forward contracts or options to hedge exposures arisingfrom these transactions. The Company does not foresee changing its foreign currency exposure management strategy.
During fiscal 1999, 36% of the Company’s revenue was generated outside of theUnited States. Using sensitivity analysis, a hypothetical ten-percent increase in thevalue of the U.S. dollar against all currencies would decrease revenue by 3.6% or$277 million, while a hypothetical ten-percent decrease in the value of the U.S.
readiness of its leased facilities with respect to facility infrastructure systems. As of theend of fiscal 1999, over 80% of the company’s crucial suppliers, property owners, andlandlords have been determined to have adequate programs in place to be Year 2000ready before the end of 1999. Evaluation of the remaining 20% should be completedby October 1, 1999.
In the opinion of the Company’s management, the most reasonably likely worst casescenario includes the possibility that the Company and/or its crucial suppliers areunable to complete their Year 2000 readiness efforts prior to the onset of failures, theeffects of which could have a material adverse impact on the Company’s operations.The Company could also be impacted materially by any significant economic, finan-cial market or infrastructure disruption attributable to the Year 2000 issue.
The Company has developed initial drafts of Year 2000 transition, contingency, andcrisis management plans. Final drafts will be completed during the quarter endingOctober 1, 1999. These plans include the use of exercises and drills with various rel-evant scenarios. As a result of lessons learned from the exercises, the contingencyplans may be modified. The Company has also established the infrastructure for aYear 2000 corporate command center that will be fully operational during November1999. This command center will be linked to each business unit’s Year 2000 crisis management center, which will be connected to internal and client-support help desks.
E u r o C o n v e r s i o n
On January 1, 1999 the euro currency was introduced in 11 of the 15 member coun-tries in the European Union. Although euro notes and coins will not be available untilthe latter part of the transition period in 2002, the euro is traded on the currencyexchanges and is available for non-cash transactions.
The Company established a European steering group during 1997 to determine theCompany’s approach to the euro and to develop plans to ensure that customerexpectations and statutory requirements are met. The Company was ready byJanuary 1, 1999 to deal with any customer or supplier who wished to transact ineuros and all European intercompany transactions since January 1 have beeninvoiced and settled in euros. The Company’s European Group plans to implementinfrastructure during calendar 1999 which will provide all the internal systemsfunctionality required to deal with the euro during the transition period and thereafter.The transition period lasts until July 2002 when the national currencies will no longerbe legal tender. The incremental system cost to CSC of introducing the euro will not be material.
The Company does not believe that the introduction of the euro will negatively impactthe enforceability of client contracts or require it to incur any material cost thereunderfor which it will not be paid. CSC will continue to review the impact of the euroconversion during the transition period, but does not expect it to have a material impacton its overall financial position or results of operations.

Consolidated Statements of Income Computer Sciences Corporation
F i s c a l Ye a r E n d e d
In thousands except per-share amounts April 2, 1999 April 3, 1998 March 28, 1997
Revenues $7,659,965 $6,600,838 $5,616,048
Costs of services 5,973,837 5,149,218 4,413,173Selling, general and administrative 695,828 602,708 485,113Depreciation and amortization 445,035 386,854 333,247Interest expense 48,496 50,951 40,268Interest income (14,588) (8,855) (7,995)Special charges (note 2) 229,093 48,929
Total costs and expenses 7,148,608 6,409,969 5,312,735
Income before taxes 511,357 190,869 303,313Taxes on income (notes 2 and 3) 170,200 (69,500) 110,900
Net income $0,341,157 $0,260,369 $0,192,413
Earnings per common share:Basic $0,0002.16 $0,0001.68 $0,0001.27
Diluted $0,0002.11 $0,0001.64 $0,0001.23
49
(See notes to consolidated financial statements)
dollar against all currencies would increase revenue by 3.6% or $277 million. In theopinion of management, a substantial portion of this fluctuation would be offset byexpenses incurred in local currency. As a result, a hypothetical 10% movement of thevalue of the U.S. Dollar against all currencies in either direction would not have amaterial impact on the Company’s net income.
The Company’s primary unhedged assets and liabilities consist of local currencycash balances and borrowings, respectively. At April 2, 1999, the Company hadapproximately $135 million of non-U.S. dollar denominated cash and short-terminvestments, and approximately $114 million of non-U.S. dollar borrowings.
F o r w a r d - L o o k i n g S t a t e m e n t s
All statements contained in this annual report, or in any document filed by theCompany with the Securities and Exchange Commission, or in any press release orother written or oral communication by or on behalf of the Company, that do notdirectly and exclusively relate to historical facts constitute “forward-looking state-ments” within the meaning of the Private Securities Litigation Reform Act of 1995.These statements represent the Company’s expectations and beliefs, and no assur-ance can be given that the results described in such statements will be achieved.
These statements are subject to risks, uncertainties and other factors, many of whichare outside of the Company’s control, that could cause actual results to differ materiallyfrom the results described in such statements. These factors include, without limitation,the following: (i) general economic conditions in countries in which the Company doesbusiness; (ii) competitive pressures; (iii) changes in the financial condition of theCompany’s major commercial customers; (iv) changes in the demand for informationtechnology outsourcing and business process outsourcing; (v) changes in U.S. federalgovernment spending levels for information technology services; (vi) the futureprofitability of the Company’s customer contracts; (vii) the Company’s ability toconsummate strategic acquisitions and alliances; (viii) the Company’s ability to attractand retain key personnel; (ix) the Company’s ability to continue to develop and expandits service offerings to address emerging business demands and technological trends;and (x) the ability of the Company, and the ability of its customers and suppliers tobecome Year 2000 ready.
48
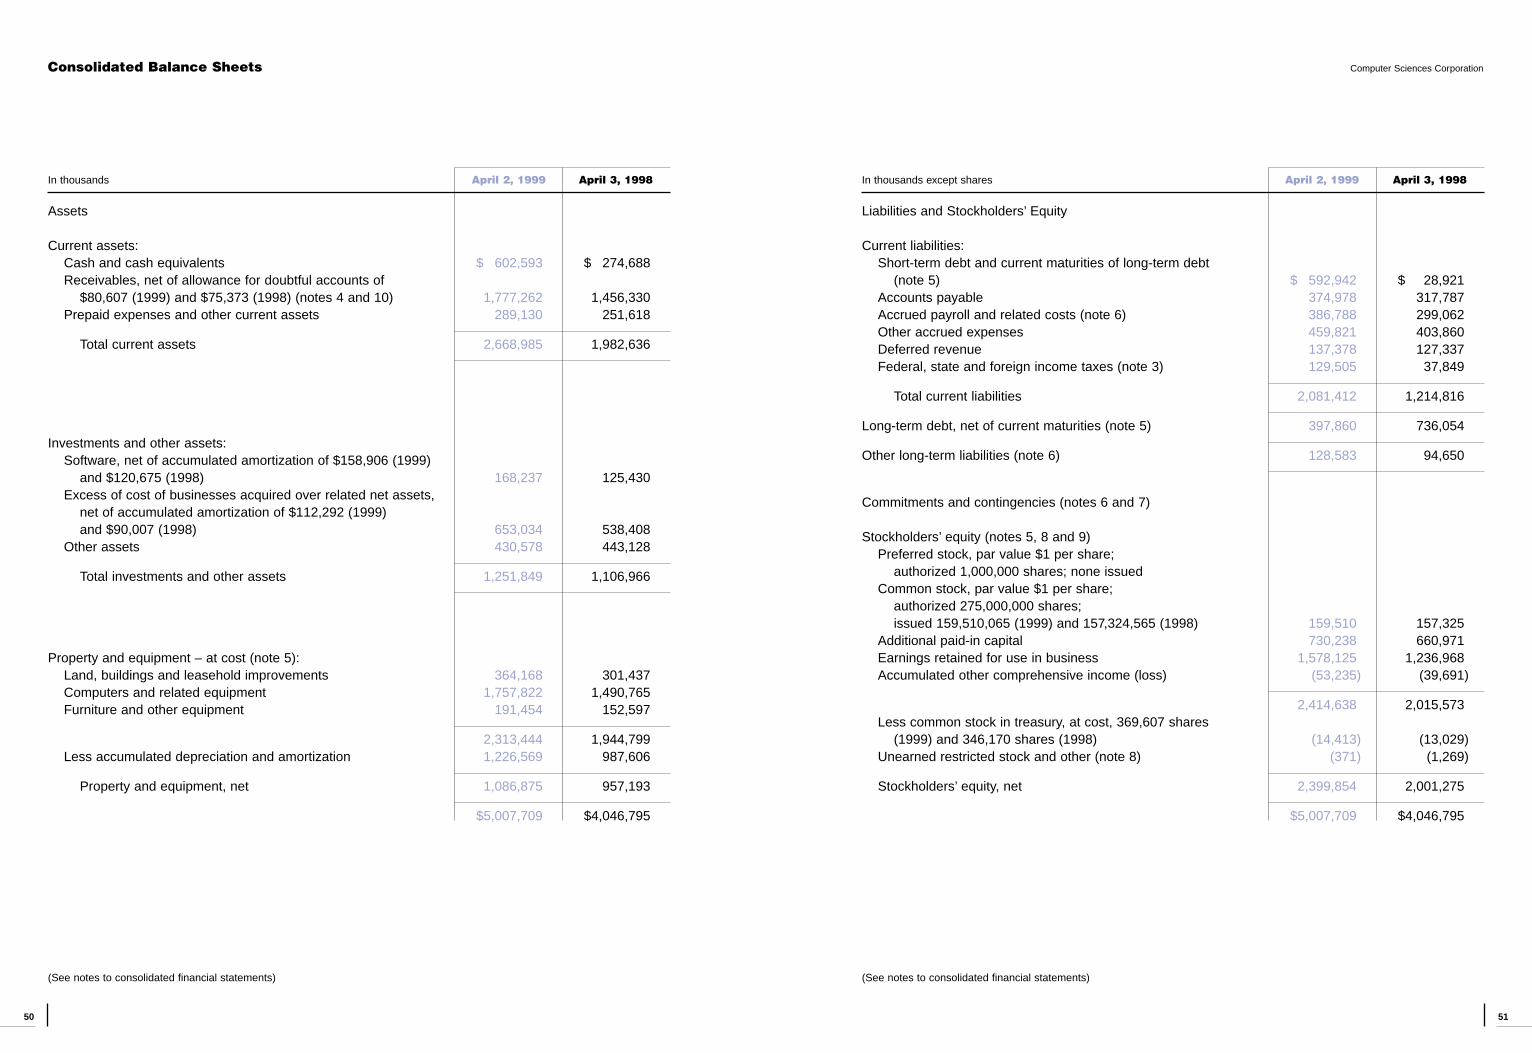
5150
Computer Sciences Corporation
In thousands except shares April 2, 1999 April 3, 1998
Liabilities and Stockholders’ Equity
Current liabilities:Short-term debt and current maturities of long-term debt
(note 5) $0,592,942 $0,028,921Accounts payable 374,978 317,787Accrued payroll and related costs (note 6) 386,788 299,062Other accrued expenses 459,821 403,860Deferred revenue 137,378 127,337Federal, state and foreign income taxes (note 3) 129,505 37,849
Total current liabilities 2,081,412 1,214,816
Long-term debt, net of current maturities (note 5) 397,860 736,054
Other long-term liabilities (note 6) 128,583 94,650
Commitments and contingencies (notes 6 and 7)
Stockholders’ equity (notes 5, 8 and 9)Preferred stock, par value $1 per share;
authorized 1,000,000 shares; none issuedCommon stock, par value $1 per share;
authorized 275,000,000 shares; issued 159,510,065 (1999) and 157,324,565 (1998) 159,510 157,325
Additional paid-in capital 730,238 660,971Earnings retained for use in business 1,578,125 1,236,968Accumulated other comprehensive income (loss) (53,235) (39,691)
2,414,638 2,015,573Less common stock in treasury, at cost, 369,607 shares
(1999) and 346,170 shares (1998) (14,413) (13,029)Unearned restricted stock and other (note 8) (371) (1,269)
Stockholders’ equity, net 2,399,854 2,001,275
$5,007,709 $4,046,795
Consolidated Balance Sheets
In thousands April 2, 1999 April 3, 1998
Assets
Current assets:Cash and cash equivalents $0,602,593 $0,274,688Receivables, net of allowance for doubtful accounts of
$80,607 (1999) and $75,373 (1998) (notes 4 and 10) 1,777,262 1,456,330Prepaid expenses and other current assets 289,130 251,618
Total current assets 2,668,985 1,982,636
Investments and other assets:Software, net of accumulated amortization of $158,906 (1999)
and $120,675 (1998) 168,237 125,430Excess of cost of businesses acquired over related net assets,
net of accumulated amortization of $112,292 (1999) and $90,007 (1998) 653,034 538,408
Other assets 430,578 443,128
Total investments and other assets 1,251,849 1,106,966
Property and equipment – at cost (note 5):Land, buildings and leasehold improvements 364,168 301,437Computers and related equipment 1,757,822 1,490,765Furniture and other equipment 191,454 152,597
2,313,444 1,944,799Less accumulated depreciation and amortization 1,226,569 987,606
Property and equipment, net 1,086,875 957,193
$5,007,709 $4,046,795
(See notes to consolidated financial statements) (See notes to consolidated financial statements)

5352
Consolidated Statements of Cash Flows Computer Sciences Corporation Consolidated Statements of Stockholders’ Equity Computer Sciences Corporation
F i s c a l Ye a r E n d e d
in cash and cash equivalents April 2, 1999 April 3, 1998 March 28, 1997
Cash flows from operating activities:Net income $(341,157 $(260,369 $(192,413Adjustments to reconcile net income to net
cash provided:Depreciation and amortization 445,035 386,854 333,247Deferred taxes 91,243 (94,473) 5,121Special items, net of tax 97,870 11,884Provision for losses on accounts
receivable 8,818 20,058 33,501Changes in assets and liabilities, net of
effects of acquisitions:Increase in receivables (249,028) (221,974) (164,184)Increase in prepaid expenses (8,674) (86,815) (39,692)Increase in accounts payable and
accruals 71,043 109,575 97,294Increase in income taxes payable 96,340 98,156 23,907Increase (decrease) in deferred
revenue 10,042 13,817 (3,304)Other changes, net 8,086 (133) 10,235
Net cash provided by operating activities 814,062 583,304 500,422
Cash flows from investing activities:Purchases of property and equipment (425,716) (349,316) (322,434)Outsourcing contracts (85,286) (145,974) (102,508)Acquisitions, net of cash acquired (156,965) (103,269) (176,693)Dispositions 37,947 75,827 6,229Software (86,835) (64,052) (77,227)Other investing cash flows, net 11,785 9,663 (3,900)
Net cash used in investing activities (705,070) (577,121) (676,533)
Cash flows from financing activities:Net (repayment) borrowing of commercial
paper (42) 77,953 50,188Borrowings under lines of credit 40,440 61,281 48,180Repayment of borrowings under lines of credit (34,679) (73,022) (99,283)Proceeds from term debt issuance 200,000 32,568 150,000Principal payments on long-term debt (34,804) (10,959) (29,843)Proceeds from stock option transactions 45,109 61,488 42,869Other financing cash flows 3,190 13,356 12,964
Net cash provided by financing activities 219,214 162,665 175,075
Effect of exchange rate changes on cash and cash equivalents (301) (4,886) (2,111)
Net increase (decrease) in cash and cash equivalents 327,905 163,962 (3,147)
Cash and cash equivalents at beginning of year 274,688 110,726 113,873
Cash and cash equivalents at end of year $(602,593 $(274,688 $(110,726
In thousands, increase (decrease)
(See notes to consolidated financial statements) (See notes to consolidated financial statements)
Earnings Accumulated UnearnedAdditional Retained Other Common Restricted
Paid-In for Use in Comprehensive Stock in Stock andIn thousands except shares Shares Amount Capital Business Income (Loss) Treasury Other Total
Balance at March 29, 1996 75,428,622 $075,429 $506,569 $0,862,770 $0(7,214) $(10,488) $(6,953) $1,420,113
Comprehensive income:Net income 192,413 192,413Currency translation adjustment (7,182) (7,182)Unfunded pension obligation (229) (229)
Comprehensive income 185,002
Stock option transactions 1,501,214 1,501 63,240 (1,494) (1,125) 62,122Amortization and forfeitures of
restricted stock (5,000) (5) (90) 813 718Repayment of notes 1,605 1,605
Balance at March 28, 1997 76,924,836 76,925 569,719 1,055,183 (14,625) (11,982) (5,660) 1,669,560
Comprehensive income:Net income 260,369 260,369Currency translation adjustment (23,287) (23,287)Unfunded pension obligation (1,779) (1,779)
Comprehensive income 235,303
Stock option transactions 2,077,103 2,077 91,252 (1,047) 92,282Amortization and forfeitures of
restricted stock 109 109Repayment of notes 4,282 4,282Effect of two-for-one stock split 78,322,626 78,323 (78,323)Stock purchase rights
redemption (261) (261)
Balance at April 3, 1998 157,324,565 157,325 660,971 1,236,968 (39,691) (13,029) (1,269) 2,001,275
Comprehensive income:Net income 341,157 341,157Currency translation adjustment (12,860) (12,860)Unfunded pension obligation (684) (684)
Comprehensive income 327,613
Stock option transactions 2,185,500 2,185 69,267 (1,384) 70,068Amortization and forfeitures of
restricted stock 893 893Repayment of notes 5 5
Balance at April 2, 1999 159,510,065 $159,510 $730,238 $1,578,125 $(53,235) $(14,413) $0,(371) $2,399,854
Common Stock

5554
N o t e 1 Summary of Significant Accounting Policies
Principles of ConsolidationThe accompanying consolidated financial statements include those of Computer Sciences Corporation, itssubsidiaries and those joint ventures and partnerships over which it exercises control, hereafter collectivelyreferred to as “CSC’’ or “the Company.’’ All material intercompany transactions and balances have beeneliminated.
Business CombinationCSC acquired The Continuum Company, Inc. (“Continuum”) on August 1, 1996. Upon consummation of themerger, Continuum became a wholly owned subsidiary of the Company. Each outstanding share ofContinuum common stock was converted into 1.58 shares of common stock of the Company and each out-standing option to purchase shares of Continuum common stock was converted into an option to purchase1.58 shares of CSC common stock. The acquisition has been accounted for as a pooling of interests, andpreviously reported consolidated financial statements of the Company for periods ended prior to August 1,1996 have been restated to include the financial position and results of operations of Continuum.
Other AcquisitionsDuring the three years ended April 2, 1999, the Company made a number of acquisitions in addition to theone described above which, either individually or collectively, are not material. In conjunction with businesscombinations accounted for as purchases, the Company acquired assets with an estimated fair value of$231,367, $61,460 and $199,302; and assumed liabilities of $191,911, $47,632 and $125,511 for fiscal1999, 1998 and 1997 respectively. The excess of cost of businesses acquired over related net assets was$152,294, $89,028 and $139,504 for the three fiscal years ended 1999.
Income RecognitionThe Company provides services under time and materials, level of effort, cost-based and fixed-price con-tracts. For time and materials and level of effort types of contracts, income is recorded as the costs areincurred, income being the difference between such costs and the agreed-upon billing amounts. For cost-based contracts, income is recorded by applying an estimated factor to costs as incurred, such factor beingdetermined by the contract provisions and prior experience. For fixed-price contracts, income is recordedon the basis of the estimated percentage of completion of services rendered. Losses, if any, on long-termcontracts are recognized during the period in which the loss is determined.
Revenues from certain information processing services are recorded at the time the service is utilized bythe customer. Revenues from sales of proprietary software are recognized upon receipt of a signed con-tract documenting customer commitment, delivery of the software and determination of the fee amount andits probable collection. However, if significant customization is part of the transaction, such revenues arerecognized over the period of delivery.
Depreciation and Amortization The Company’s depreciation and amortization policies are as follows:
Property and Equipment:Buildings 10 to 40 yearsComputers and related equipment 3 to 10 yearsFurniture and other equipment 2 to 10 yearsLeasehold improvements Shorter of lease term or useful life
Investments and Other Assets:Software 2 to 10 yearsCredit information files 10 to 20 yearsExcess of cost of businesses acquired over
related net assets Up to 40 yearsDeferred contract costs Contract life
For financial reporting purposes, computer equipment is depreciated using either the straight-line or sum-of-the-years’-digits method, depending on the nature of the equipment’s use. The cost of other propertyand equipment, less applicable residual values, is depreciated on the straight-line method. Depreciationcommences when the specific asset is complete, installed and ready for normal use. Investments and otherassets are amortized on a straight-line basis over the years indicated above.
Included in software are unamortized capitalized software development costs of $122,208 and $76,969 asof April 2, 1999 and April 3, 1998, respectively. The related amortization expense was $22,378, $17,358and $20,073 for the three fiscal years ended April 2, 1999.
Included in other assets are deferred contract costs related to the initial purchase of assets under out-sourcing contracts. The balance of such costs, net of amortization, was $92,717 and $102,723 for fiscal1999 and 1998, respectively. The related amortization expense was $18,408, $15,371 and $12,112 for thethree fiscal years ended April 2, 1999.
The Company evaluates at least annually the recoverability of its excess cost of businesses acquired overrelated net assets. In assessing recoverability, the current and future profitability of the related operationsare considered, along with management’s plans with respect to the operations and the projected undis-counted cash flows.
Notes to Consolidated Financial Statements Computer Sciences Corporation
(Dollars in thousands except per-share amounts)Notes to Consolidated Financial Statements Computer Sciences Corporation
(Dollars in thousands except per-share amounts)
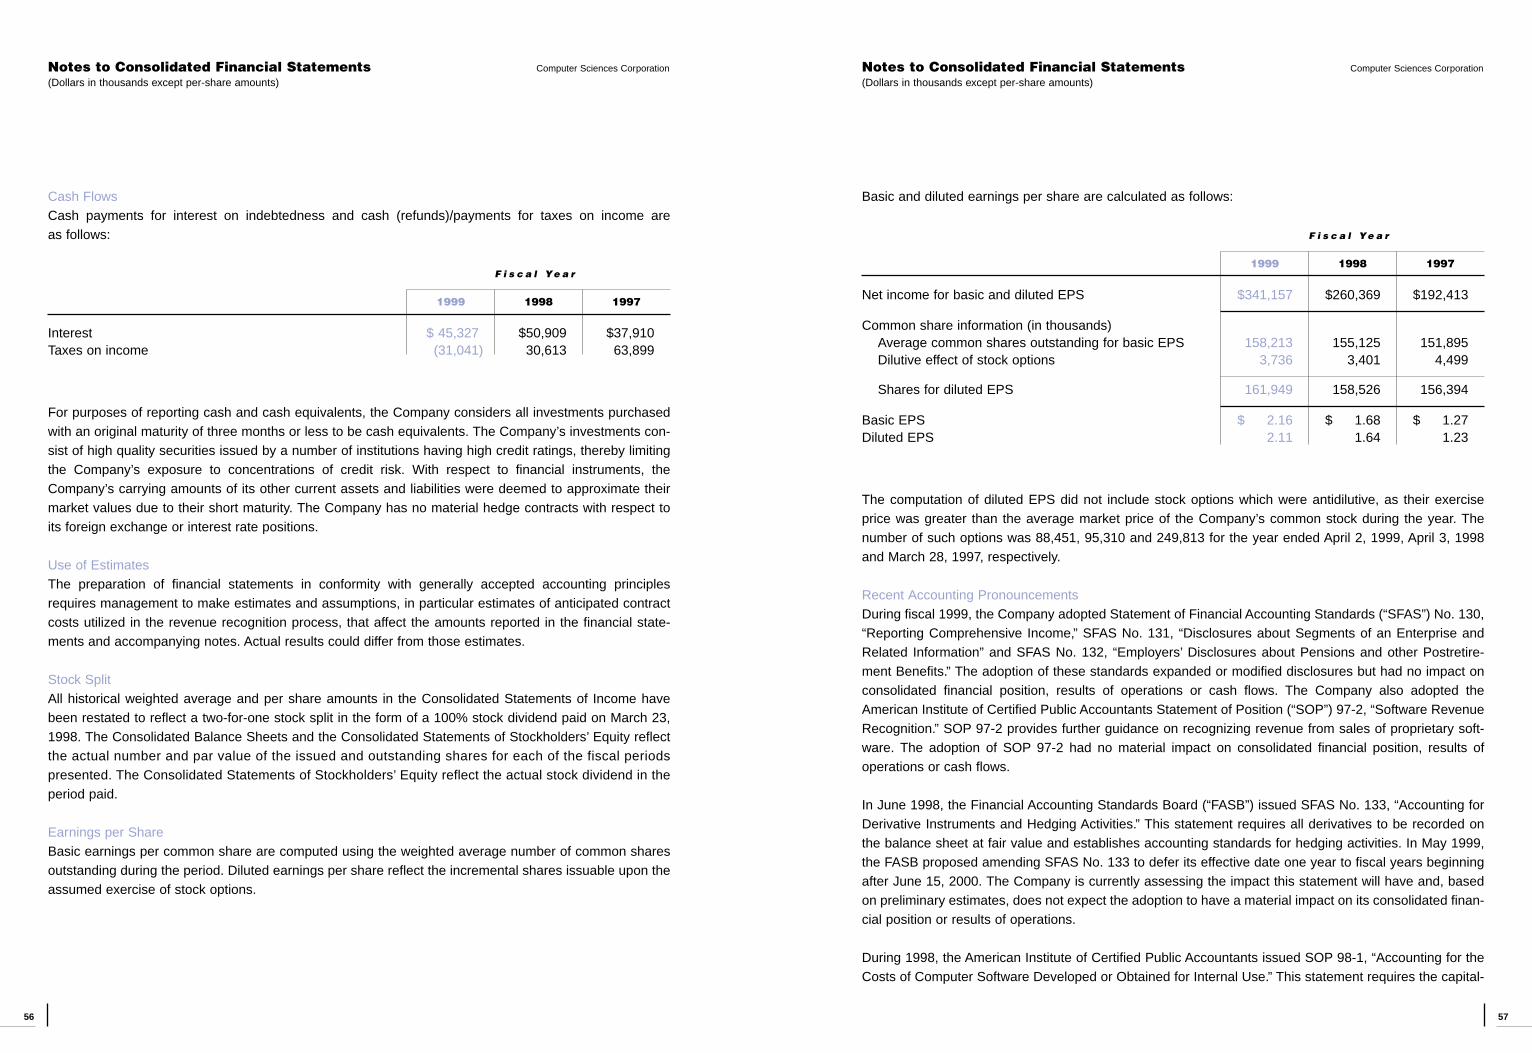
5756
Cash FlowsCash payments for interest on indebtedness and cash (refunds)/payments for taxes on income are as follows:
F i s c a l Ye a r
1999 1998 1997
Interest $(45,327 $50,909 $37,910Taxes on income (31,041) 30,613 63,899
For purposes of reporting cash and cash equivalents, the Company considers all investments purchasedwith an original maturity of three months or less to be cash equivalents. The Company’s investments con-sist of high quality securities issued by a number of institutions having high credit ratings, thereby limitingthe Company’s exposure to concentrations of credit risk. With respect to financial instruments, theCompany’s carrying amounts of its other current assets and liabilities were deemed to approximate theirmarket values due to their short maturity. The Company has no material hedge contracts with respect toits foreign exchange or interest rate positions.
Use of EstimatesThe preparation of financial statements in conformity with generally accepted accounting principlesrequires management to make estimates and assumptions, in particular estimates of anticipated contractcosts utilized in the revenue recognition process, that affect the amounts reported in the financial state-ments and accompanying notes. Actual results could differ from those estimates.
Stock SplitAll historical weighted average and per share amounts in the Consolidated Statements of Income havebeen restated to reflect a two-for-one stock split in the form of a 100% stock dividend paid on March 23,1998. The Consolidated Balance Sheets and the Consolidated Statements of Stockholders’ Equity reflectthe actual number and par value of the issued and outstanding shares for each of the fiscal periodspresented. The Consolidated Statements of Stockholders’ Equity reflect the actual stock dividend in theperiod paid.
Earnings per ShareBasic earnings per common share are computed using the weighted average number of common sharesoutstanding during the period. Diluted earnings per share reflect the incremental shares issuable upon theassumed exercise of stock options.
Basic and diluted earnings per share are calculated as follows:
F i s c a l Ye a r
1999 1998 1997
Net income for basic and diluted EPS $341,157 $260,369 $192,413
Common share information (in thousands)Average common shares outstanding for basic EPS 158,213 155,125 151,895Dilutive effect of stock options 3,736 3,401 4,499
Shares for diluted EPS 161,949 158,526 156,394
Basic EPS $0002.16 $0001.68 $0001.27Diluted EPS 2.11 1.64 1.23
The computation of diluted EPS did not include stock options which were antidilutive, as their exercise price was greater than the average market price of the Company’s common stock during the year. Thenumber of such options was 88,451, 95,310 and 249,813 for the year ended April 2, 1999, April 3, 1998and March 28, 1997, respectively.
Recent Accounting PronouncementsDuring fiscal 1999, the Company adopted Statement of Financial Accounting Standards (“SFAS”) No. 130,“Reporting Comprehensive Income,” SFAS No. 131, “Disclosures about Segments of an Enterprise andRelated Information” and SFAS No. 132, “Employers’ Disclosures about Pensions and other Postretire-ment Benefits.” The adoption of these standards expanded or modified disclosures but had no impact onconsolidated financial position, results of operations or cash flows. The Company also adopted theAmerican Institute of Certified Public Accountants Statement of Position (“SOP”) 97-2, “Software RevenueRecognition.” SOP 97-2 provides further guidance on recognizing revenue from sales of proprietary soft-ware. The adoption of SOP 97-2 had no material impact on consolidated financial position, results of operations or cash flows.
In June 1998, the Financial Accounting Standards Board (“FASB”) issued SFAS No. 133, “Accounting forDerivative Instruments and Hedging Activities.” This statement requires all derivatives to be recorded onthe balance sheet at fair value and establishes accounting standards for hedging activities. In May 1999,the FASB proposed amending SFAS No. 133 to defer its effective date one year to fiscal years beginningafter June 15, 2000. The Company is currently assessing the impact this statement will have and, basedon preliminary estimates, does not expect the adoption to have a material impact on its consolidated finan-cial position or results of operations.
During 1998, the American Institute of Certified Public Accountants issued SOP 98-1, “Accounting for theCosts of Computer Software Developed or Obtained for Internal Use.” This statement requires the capital-
Notes to Consolidated Financial Statements Computer Sciences Corporation
(Dollars in thousands except per-share amounts)Notes to Consolidated Financial Statements Computer Sciences Corporation
(Dollars in thousands except per-share amounts)

5958
ization of internal use computer software costs provided that certain criteria are met. These capitalized soft-ware costs will be amortized on a straight-line basis over the useful life of the software. The Company willadopt this statement effective April 3, 1999. The adoption of this statement is not expected to have a mate-rial impact on the company’s consolidated financial position, results of operations or cash flows.
ReclassificationsCertain reclassifications have been made to the prior years’ financial statements in order to conform to thecurrent presentation.
N o t e 2 Special Items
There were no special items during fiscal 1999.
Special items in fiscal 1998 represent costs, expenses, and benefits associated with developments at CSCEnterprises and the Company’s response to a failed take-over attempt.
During the first quarter of fiscal 1998, CSC recorded a net special credit of $1,707, or 1 cent per share, atCSC Enterprises, a general partnership of which CSC, through one of its affiliates, is the managing gen-eral partner. This net credit resulted from a tax benefit of $135,000 and an after-tax special charge of$133,293 ($208,393 before tax). During the fiscal quarter ended June 27, 1997, several partners withdrewfrom CSC Enterprises. These withdrawals caused CSC Enterprises to take actions that caused CSC torecognize an increase in the tax basis of certain assets. As required by SFAS No. 109, this tax basisincrease from the previous tax basis resulted in a deferred tax asset of $135,000 and a correspondingreduction of CSC’s provision for income taxes during the quarter ended June 27, 1997. The tax basisincrease is temporary and will be realized over time through an increase in depreciation and amortizationexpense for income tax purposes. In connection with the partner withdrawals and related developments,CSC Enterprises reviewed its operations, its market opportunities and the carrying value of its assets.Based on this review, certain offerings and assets were eliminated, primarily within its telecommunicationsoperations. As a result of these plans, CSC recognized a pre-tax special charge of $208,393 ($133,293after tax). This special charge included goodwill write-offs of $56,300 ($35,000 after tax), contracttermination costs of $54,300 ($34,000 after tax), deferred contract costs and other assets of $33,093($20,493 after tax), telecommunications software and accruals of $35,800 ($22,300 after tax), telecom-munications property, equipment and intangible assets of $18,900 ($11,700 after tax) and other non-deductible costs of $10,000.
During the fourth quarter of fiscal 1998, the Company recorded a before-tax special charge of $20,700, or9 cents per share after tax, for costs relating to the Company’s response to a failed take-over attempt. Thecharge is comprised of $14,400 for investment banking expenses and $6,300 for other expenses such aslegal costs, public relations and shareholder communications.
The fiscal 1997 special charge represents costs and expenses related to the August 1, 1996, acquisitionof Continuum. The amount of the charge, net of income tax benefits on the tax deductible portion, is$35,280, or 23 cents per share. The charge is composed of $11,040 for investment banking and othermerger expenses; $11,785 related to the write-off of certain capitalized software, other assets and intan-gibles; and $26,104 related to the elimination of duplicate data processing facilities, employee severancecosts and contract termination costs.
N o t e 3 Income Taxes
The sources of income before taxes, classified as between domestic entities and those entities domiciledoutside of the United States, are as follows:
F i s c a l Ye a r
1999 1998 1997
Domestic entities $357,090 $ 96,438 $270,353Entities outside the United States 154,267 94,431 32,960
$511,357 $190,869 $303,313
The provisions (credits) for taxes on income, classified as between current and deferred and as betweentaxing jurisdictions, consist of the following:
F i s c a l Ye a r
1999 1998 1997
Current portion:Federal $029,306 $(12,275) $083,185State 5,289 (2,051) 12,065Foreign 44,362 39,299 10,529
78,957 24,973 105,779
Deferred portion:Federal 78,930 (82,170) 3,566State 10,820 (8,812) 664Foreign 1,493 (3,491) 891
91,243 (94,473) 5,121
Total provision (credit) for taxes $170,200 $(69,500) $110,900
Notes to Consolidated Financial Statements Computer Sciences Corporation
(Dollars in thousands except per-share amounts)Notes to Consolidated Financial Statements Computer Sciences Corporation
(Dollars in thousands except per-share amounts)

6160
Included in the fiscal 1998 current portion is $27,000 (composed of $26,200 federal and $800 state) of the$135,000 deferred tax asset described in Note 2 and $81,900 related to the other fiscal 1998 special items,also described in Note 2. The fiscal 1998 deferred portion includes the remaining $108,000 (composed of$104,800 federal and $3,200 state) of the $135,000 deferred tax asset.
The major elements contributing to the difference between the federal statutory tax rate and the effectivetax rate are as follows:
F i s c a l Ye a r
1999 1998 1997
Statutory rate 35.0% 35.0% 35.0%State income tax, less effect of federal deduction 2.1 2.2 2.8Goodwill amortization .3 .4 .6Utilization of tax credits/losses (3.3) (2.2) (1.9)Special items (71.5) 1.2Other (.8) (.3) (1.1)
Effective tax rate 33.3% (36.4%) 36.6%
The fiscal 1998 special items percentage relates principally to the $135,000 tax benefit described in Note2. The fiscal 1997 special items percentage is the result of non-deductible acquisition-related costs.
The tax effects of significant temporary differences that comprise deferred tax balances are as follows:
April 2, 1999 April 3, 1998
Deferred tax assets (liabilities)Deferred income $(007,816 $(001,457Employee benefits 18,846 (1,421)Provisions for contract settlement 1,086 4,121Currency exchange 23,765 18,909Other assets 17,037 22,438Contract accounting (111,537) (109,343)Depreciation and amortization (50,922) 54,420Prepayments (79,676) (41,083)Tax loss/credit carryforwards 37,351 20,231Other assets (liabilities) 13,722 (998)
Total deferred taxes $(122,512) $0(31,269)
Of the above deferred amounts, $127,576 and $111,277 are included in current income taxes at April 2,1999 and April 3, 1998, respectively.
The Internal Revenue Service (“IRS”) has completed its examination of the Company’s consolidated fed-eral income tax returns for fiscal years 1987 through 1991. The results did not have a material effect onthe Company’s financial position or results of operations. The IRS has substantially completed its exami-nation of the Company’s federal income tax returns for fiscal years 1992 through 1994. The results are notexpected to have a material effect on the Company’s financial position or results of operations.
N o t e 4 Receivables
Receivables consist of the following:
April 2, 1999 April 3, 1998
Billed trade accounts $1,329,487 $1,043,703Recoverable amounts under contracts
in progress 414,321 366,778Other receivables 33,454 45,849
$1,777,262 $1,456,330
Recoverable amounts under contracts in progress generally become billable upon completion of a speci-fied phase of the contract, negotiation of contract modifications, completion of government audit activities,or upon acceptance by the customer. The balance at April 2, 1999 is expected to be collected during fis-cal 2000 except for $80,835 to be collected during fiscal 2001 and thereafter.
Notes to Consolidated Financial Statements Computer Sciences Corporation
(Dollars in thousands except per-share amounts)Notes to Consolidated Financial Statements Computer Sciences Corporation
(Dollars in thousands except per-share amounts)

6362
N o t e 5 Debt
Short-termAt April 2, 1999, the Company had an uncommitted line of credit of $45,000 with a domestic bank. As ofApril 2, 1999, the Company had no borrowings outstanding under this line of credit.
At April 2, 1999, the Company had uncommitted lines of credit of $171,202 with certain foreign banks. As of April 2, 1999, the Company had $46,452 of borrowings outstanding under these lines of credit. Theseshort-term lines of credit carry no commitment fees or significant covenants. The weighted average inter-est rate on borrowings under these short-term lines of credit was 3.9% and 4.7% at April 2, 1999, and April 3, 1998, respectively.
The Company also had outstanding borrowings of $4,988 with a foreign bank as of April 2, 1999. The inter-est rate on these borrowings was 3.95%.
At April 2, 1999, the Company had $374,981 of commercial paper outstanding. The weighted averageinterest rate on the Company’s commercial paper was 4.9% and 5.5% at April 2, 1999 and April 3, 1998,respectively.
The Company’s commercial paper is backed by a $490,000 multi-year committed credit facility whichexpires on September 15, 1999. The classification of the Company’s outstanding commercial paper isdetermined by the expiration date of this credit facility. In previous years, commercial paper outstanding atyear-end was classified as long-term debt because the facility had more than one year before its expira-tion. At April 2, 1999, commercial paper was classified as short-term debt. The Company intends to replacethe credit facility prior to expiration.
Long-term
April 2, 1999 April 3, 1998
Commercial paper $375,0236.80% notes, due April 1999 $150,000 150,0006.50% notes, due November 2001 150,000 150,0006.25% notes, due March 2009 200,000Capitalized lease liabilities, at varying interest
rates, payable in monthly installments through fiscal 2002 11,425 21,603
Notes payable, at varying interest rates (from 3.5% to 6.0%) through fiscal 2005 52,956 61,239
Total long-term debt 564,381 757,865Less current maturities 166,521 21,811
$397,860 $736,054
During fiscal 1999 the Company issued $200,000 of 6.25% notes due in March 2009. Proceeds were usedfor general corporate purposes and, subsequent to year end, to repay the $150,000 6.80% notes due April 1999.
Capitalized lease liabilities shown above represent amounts due under leases for the use of computers andrelated equipment. Included in property and equipment are related assets of $20,030 (1999) and $18,895(1998), less accumulated amortization of $9,892 and $5,378, respectively.
Certain of the Company’s borrowing arrangements contain covenants that require the Company tomaintain certain financial ratios and that limit the amount of dividend payments. Under the most restrictiverequirement, approximately $1,189,000 of retained earnings was available for cash dividends at April 2, 1999.
The carrying value of the Company’s long-term debt is $564,381 at April 2, 1999, as shown above. Thecorresponding fair value approximates the carrying value using the current interest rates available to theCompany for debt of the same remaining maturities.
Maturities of long-term debt by fiscal year are $166,521 (2000), $24,539 (2001), $155,842 (2002), $3,672(2003), $499 (2004) and $213,308 thereafter.
Notes to Consolidated Financial Statements Computer Sciences Corporation
(Dollars in thousands except per-share amounts)Notes to Consolidated Financial Statements Computer Sciences Corporation
(Dollars in thousands except per-share amounts)

6564
N o t e 6 Pension and Other Postretirement Benefit Plans
The Company and its subsidiaries have several pension and postretirement healthcare and life insurancebenefit plans, as described below.
A contributory, defined benefit pension plan is generally available to U.S. employees. Certain non-U.S.employees are enrolled in defined benefit pension plans in the country of domicile. In addition, theCompany has a Supplemental Executive Retirement Plan (“SERP”), which is a nonqualified, noncontribu-tory pension plan. The Company provides healthcare and life insurance retirement benefits for certain U.S.employees, generally for those employed prior to August 1992. Most non-U.S. employees are covered bygovernment sponsored programs at no direct cost to the Company other than related payroll taxes.
Net periodic cost for U.S. and non-U.S. pension and other benefit plans included the following components:
F i s c a l Ye a r
1999 1998 1997
Pensions
Service cost $(68,199 $(54,629 $(42,831Interest cost 63,050 50,469 36,553Expected return on plan assets (71,438) (54,314) (39,630)Amortization of transition obligation 482 280 (320)Amortization of prior service costs 2,829 2,830 1,703Recognized actuarial loss 1,326 965 999
Net periodic pension cost $(64,448 $(54,859 $(42,136
Other Postretirement Benefits
Service cost $(00,819 $(00,662 $(00,865Interest cost 3,384 3,044 3,031Expected return on plan assets (1,698) (944) (590)Amortization of transition obligation 1,633 1,633 1,633Amortization of prior service cost 490 490 36Recognized actuarial gain (292) (389) (44)
Net provision for postretirement benefits $(04,336 $(04,496 $(04,931
The following tables provide a reconciliation of the changes in the plans’ benefit obligations and fair valueof assets for the fiscal years ended April 2, 1999 and April 3, 1998, and a statement of the funded statusat April 2, 1999 and April 3, 1998:
Pensions Other Postretirement Benefits
1999 1998 1999 1998
Change in benefit obligation:
Benefit obligation at beginning of year $0,912,984 $655,536 $(47,826 $(36,929
Service cost 68,199 54,629 819 662Interest cost 63,050 50,469 3,384 3,044Plan participants’ contributions 30,119 34,301 943 962Amendments 13,476 71,133 4,742Actuarial loss (gain) 65,012 73,652 (5,815) 4,254Benefits paid (36,212) (27,807) (2,632) (2,767)Foreign currency exchange
rate changes (8,034) 1,071
Benefit obligation at end of year $1,108,594 $912,984 $(44,525 $(47,826
Change in plan assets:
Fair value of plan assets at beginning of year $0,902,162 $731,495 $(19,934 $(12,586
Actual return on plan assets 122,743 66,650 3,830 3,543Employer contributions 65,539 35,455 5,654 5,987Plan participants’ contributions 30,119 34,301 943 962Asset transfers 14,086 66,694Benefits paid (36,212) (27,807) (2,632) (2,767)Foreign currency exchange
rate changes 7 (4,626)
Fair value of plan assets at end of year $1,098,444 $902,162 $(27,729 $(20,311
Reconciliation of funded status to
net amount recorded
Funded status $ 0(10,150) $ (10,822) $(16,796) $(27,515)Unrecognized actuarial loss (gain) (49,644) (54,547) (15,672) (7,481)Unrecognized transition obligation 5,314 5,245 22,093 23,726Unrecognized prior service cost 20,637 22,826 4,712 4,900Contribution in fourth fiscal quarter 2,500 2,560
Net amount recorded $ 0(31,343) $ (34,738) $0(5,663) $0(6,370)
Notes to Consolidated Financial Statements Computer Sciences Corporation
(Dollars in thousands except per-share amounts)Notes to Consolidated Financial Statements Computer Sciences Corporation
(Dollars in thousands except per-share amounts)

6766
Plan assets include equity and fixed income securities and short-term investments. Pension plan assetsalso include real estate investments and insurance contracts.
The following table provides the amounts recorded in the Company’s consolidated balance sheets:
Pensions Other Postretirement Benefits
April 2, 1999 April 3, 1998 April 2, 1999 April 3, 1998
Prepaid benefit cost $(14,074 $(10,289Accrued benefit liability (54,279) (53,802) $(5,663) $(6,370)Intangible asset 2,301 3,266Accumulated other
comprehensive income 6,561 5,509
Net amount recorded $(31,343) $(34,738) $(5,663) $(6,370)
The following table lists selected information for the pension plans with accumulated benefit obligations inexcess of plan assets as of April 2, 1999 and April 3, 1998. The fair value of plan assets shown for fiscal1998 represents two plans which became fully funded in fiscal 1999. The reported amounts for fiscal 1999consist only of plans with no assets.
April 2, 1999 April 3, 1998
Projected benefit obligation $39,139 $92,594Accumulated benefit obligation 35,054 84,741Fair value of plan assets 0 53,826
Weighted average assumptions used in the accounting for the Company’s plans were:
F i s c a l Ye a r
1999 1998 1997
Discount or settlement rates 6.7% 7.1% 7.6%Rates of increase in compensation levels 5.0 5.2 5.7Expected long-term rates of return on assets 8.1 8.3 8.6
The Company sponsors several defined contribution plans for substantially all U.S. employees and certainforeign employees. The plans allow employees to contribute a portion of their earnings in accordance withspecified guidelines. At April 2, 1999, plan assets included 5,878,348 shares of the Company’s commonstock. During fiscal 1999, 1998 and 1997, the Company contributed $41,367, $35,216 and $29,772,respectively.
The assumed healthcare cost trend rate used in measuring the expected benefit obligation was 7.5% forfiscal 1999, declining to 5.0% for 2004 and subsequent years. A one-percentage point change in theassumed healthcare cost trend rate would have the following effects:
One Percentage Point
Increase Decrease
Effect on accumulated postretirement benefit obligation as of April 2, 1999 $5,835 $(3,522)Effect on net periodic postretirement benefit cost for fiscal 1999 $0,643 $0,(356)
N o t e 7 Commitments and Contingencies
Commitments The Company has operating leases for the use of certain property and equipment. Substantially all oper-ating leases are noncancelable or cancelable only by the payment of penalties. All lease payments arebased on the lapse of time but include, in some cases, payments for insurance, maintenance and propertytaxes. There are no purchase options on operating leases at favorable terms, but most leases have one ormore renewal options. Certain leases on real property are subject to annual escalations for increases inutilities and property taxes. Lease rental expense amounted to $180,783 (1999), $162,795 (1998) and$162,777 (1997).
Notes to Consolidated Financial Statements Computer Sciences Corporation
(Dollars in thousands except per-share amounts)Notes to Consolidated Financial Statements Computer Sciences Corporation
(Dollars in thousands except per-share amounts)

6968
Minimum fixed rentals required for the next five years and thereafter under operating leases in effect atApril 2, 1999 are as follows:
F i s c a l Ye a r Real Estate Equipment
2000 $102,718 $057,1742001 90,325 22,8182002 76,672 10,4082003 58,477 5,7612004 46,332 2,486Thereafter 101,128 3,094
$475,652 $101,741
DST Systems, Inc., a shareholder of the Company, provides data processing and consulting services andlicenses certain software products to the Company. During the three fiscal years ended April 2, 1999, theCompany incurred aggregate expenses of $27,065, $27,271 and $22,788, respectively, related thereto,which are included in costs of services.
ContingenciesThe primary financial instruments which potentially subject the Company to concentrations of credit risk areaccounts receivable. The Company’s customer base includes Fortune 500 companies, the U.S. Federalgovernment, and other significant, well-known companies operating in North America, Europe and thePacific Rim. Credit risk with respect to accounts receivable is minimized because of the nature and diver-sification of the Company’s customer base. Furthermore, the Company continuously reviews its accountsreceivables and records provisions for doubtful accounts as needed.
The Company is currently party to a number of disputes which involve or may involve litigation. It is theopinion of Company management that ultimate liability, if any, with respect to these disputes will not bematerial to the Company’s consolidated financial statements.
N o t e 8 Stock Incentive Plans
Stock OptionsThe Company has eight stock incentive plans which authorize the issuance of stock options, restrictedstock and other stockbased incentives to employees upon terms approved by the CompensationCommittee. At April 2, 1999, April 3, 1998 and March 28, 1997, 9,897,768, 1,938,838 and 4,588,930 shares,respectively, of CSC common stock were available for the grant to employees of future stock options,restricted stock or other stock-based incentives.
Information concerning stock options granted under stock incentive plans is as follows:
F i s c a l Ye a r
1999 1998 1997
Weighted Weighted WeightedAverage Average Average
Number Exercise Number Exercise Number Exerciseof Shares Price of Shares Price of Shares Price
Outstanding, beginning of year 11,846,858 $25.48 13,157,762 $20.23 13,972,880 $15.45
Granted 2,095,750 54.80 3,285,950 35.36 3,148,736 34.74Exercised (2,185,600) 21.51 (3,820,152) 15.20 (2,918,180) 12.77Canceled (1,075,592) 32.26 (776,702) 28.83 (1,045,674) 20.90
Outstanding, end of year 10,681,416 31.35 11,846,858 25.48 13,157,762 20.23
Exercisable, end of year 4,360,449 $19.47 4,261,089 $16.21 5,412,886 $13.79
April 2, 1999
Options Outstanding Options Exercisable
WeightedWeighted Average Weighted
Range of Number Average Remaining Number AverageOption Exercise Price Outstanding Exercise Price Contractual Life Exercisable Exercise Price
$00.17–$19.00 2,752,600 $11.79 3.6 2,530,645 $11.42019.63–033.94 3,623,810 29.71 7.2 1,135,272 26.95034.00–053.13 3,850,006 43.40 8.2 694,532 36.60053.25–072.94 455,000 60.81 9.5 None N/A
The Company uses the intrinsic value based method of accounting for stock options, under which com-pensation cost is equal to the excess, if any, of the quoted market price of the stock at the option grant dateover the exercise price, and is amortized over the vesting period. Compensation cost recognized withrespect to stock options was $300, $377 and $442 for fiscal 1999, 1998 and 1997, respectively.
Notes to Consolidated Financial Statements Computer Sciences Corporation
(Dollars in thousands except per-share amounts)Notes to Consolidated Financial Statements Computer Sciences Corporation
(Dollars in thousands except per-share amounts)

7170
Restricted StockRestricted stock awards consist of shares of common stock of the Company sold at par value ($1 pershare). Upon sale to an employee, shares of restricted stock become outstanding, receive dividends andhave voting rights. The shares are subject to forfeiture and to restrictions which limit the sale or transferduring the restriction period.
The restrictions on shares of Continuum restricted stock lapse ratably on the first five anniversaries of thedate of sale. The restrictions on shares of CSC restricted stock (other than Continuum restricted stock)generally lapse on the fifth, sixth and seventh anniversaries of the date of sale.
At April 2, 1999, April 3, 1998 and March 28, 1997, 66,304, 165,302 and 296,482 shares, respectively, of CSC restricted stock were outstanding, net of shares forfeited by or repurchased from terminatedemployees, and shares for which the restrictions have lapsed.
The Company uses the intrinsic value based method of accounting for restricted stock, under whichcompensation cost is equal to the excess, if any, of the quoted market price of the stock at the date of saleto the employee over the sales price, and is amortized over the restriction period. Compensation costrecognized with respect to restricted stock was $411, $645 and $742 during fiscal 1999, 1998 and 1997, respectively.
Restricted Stock UnitsDuring fiscal 1998, the Company adopted a stock incentive plan which authorizes the issuance of stockoptions, restricted stock and other stock-based incentives to nonemployee directors upon terms approvedby the Company’s Board of Directors. As of April 2,1999 and April 3, 1998, 22,488 restricted stock units(“RSUs”) had been awarded to nonemployee directors under this plan and were outstanding on that date.
When a holder of RSUs ceases to be a director of the Company, the RSUs are automatically redeemed forshares of CSC common stock and dividend equivalents with respect to such shares. At the holder’s elec-tion, which must be made within 30 days after the date of the award, the RSUs may be redeemed (i) asan entirety, upon the day the holder ceases to be a director, or (ii) in substantially equal amounts upon thefirst five, ten or fifteen anniversaries of such day.
There are two types of RSUs: (i) those awarded in lieu of vested retirement benefits under other plans(“Accrued Benefit RSUs”); and (ii) those awarded as a form of future retirement benefits (“Future BenefitRSUs”). When a holder of Accrued Benefit RSUs ceases to be a director of the Company, the number ofshares of CSC common stock to be delivered by the Company upon redemption of the RSUs is equal tothe number of such RSUs awarded. When a holder of Future Benefit RSUs ceases to be a director, thenumber of shares to be delivered upon redemption is equal to 20% of the number of such RSUs awarded,multiplied by the number of full years (but not in excess of 5) that the holder served as a director after thedate of award.
At April 2, 1999 and April 3, 1998, 8,778 Accrued Benefit RSUs and 13,710 Future Benefit RSUs were out-standing, and 77,512 shares of CSC common stock remained available for the grant to nonemployee direc-tors of future RSUs or other stock-based incentives.
The Company uses the intrinsic value based method of accounting for RSUs, under which compensationcost is equal to 100% of the total number of the RSUs awarded, multiplied by the quoted market price ofthe stock at the date of award, and is amortized, in the case of Future Benefit RSUs, over the vestingperiod. Compensation cost recognized with respect to RSUs was $109 for fiscal 1999.
Pro Forma InformationIn accordance with SFAS No. 123, “Accounting for Stock-Based Compensation,” the following pro formanet income and earnings per share information is presented as if the Company accounted for stock-basedcompensation awarded under the stock incentive plans using the fair value based method. Under the fairvalue method, the estimated fair value of stock incentive awards is charged against income on a straight-line basis over the vesting period.
F i s c a l Ye a r
1999 1998 1997
As Reported Pro Forma As Reported Pro Forma As Reported Pro Forma
Net income $341,157 $325,027 $260,369 $246,161 $192,413 $182,649Basic earnings
per share 2.16 2.05 1.68 1.59 1.27 1.20Diluted earnings
per share 2.11 2.01 1.64 1.55 1.23 1.17
The weighted average fair values of stock awards granted during fiscal 1999, 1998 and 1997 were $19.12,$12.08 and $11.53, respectively. The fair value of each stock award was estimated on the date of grantusing the Black-Scholes option-pricing model with the following weighted average assumptions used forgrants in 1999, 1998 and 1997, respectively: risk-free interest rates of 5.48%, 6.43% and 6.55%; expectedvolatility of 32%, 28% and 26%; and expected lives of 5.96, 6.06 and 5.75 years.
Notes to Consolidated Financial Statements Computer Sciences Corporation
(Dollars in thousands except per-share amounts)Notes to Consolidated Financial Statements Computer Sciences Corporation
(Dollars in thousands except per-share amounts)

7372
N o t e 9 Stockholder Purchase Rights Plan
On December 21, 1988, the Company adopted a stockholder rights plan pursuant to which it issued oneright for each outstanding share of its common stock. On February 27, 1998, the Company’s Board ofDirectors redeemed these rights for one sixth of one cent per right. The redemption price was paid on April13, 1998, to the holders of record of rights as of the close of business on March 30, 1998.
On February 18, 1998, the Company adopted a new stockholder rights plan pursuant to which it issuedone right for each outstanding share of its common stock. These rights, which are attached to and tradeonly together with the common stock, are not currently exercisable. On the tenth business day after anyperson or entity becomes the beneficial owner of 10% or more of CSC’s common stock, each right (otherthan rights held by the 10% stockholder, which will become void) will become exercisable to purchase, for$250, CSC common stock having a market value of $500. The rights expire February 18, 2008, and maybe redeemed by the Board of Directors at $.0005 per right at any time before they become exercisable.
N o t e 1 0 Segment and Geographic Information
The Company adopted SFAS No. 131, “Disclosures about Segments of an Enterprise and RelatedInformation,” during fiscal 1999. SFAS No. 131 establishes standards for reporting information aboutoperating segments and related disclosures about products and services, geographic areas and major customers.
All of the Company’s business involves operations which provide management and information technologyconsulting, systems integration and outsourcing. Although the Company presents estimates of revenue bybusiness service and geography, the Company’s expenses and assets are not identified or accumulated inthis manner due to, among other reasons, cross-utilization of personnel and assets across the Company.Based on SFAS No. 131 criteria, the Company’s reportable operating segments consist of the U.S. FederalSector and Global Commercial Sector. The U.S. Federal Sector operates principally within a regulatoryenvironment subject to governmental contracting and accounting requirements, including Federal AcquisitionRegulations, Cost Accounting Standards, and audits by various U.S. Federal agencies. The U.S. FederalSector revenues reported below will not agree to U.S. Federal government revenues presented elsewherein the Annual Report due to overlapping activities between segments. The Company utilizes uniformaccounting policies across all of its operating units (see Note 1). The table below presents financial informationfor the three fiscal years ended April 2, 1999, for the two reportable segments, and for financial items thatcannot be allocated to either operating segment:
Global U.S.Commercial Federal
Sector Sector Corporate Total
1 9 9 9
Revenues $5,824,427 $1,835,017 $000,521 $7,659,965Earnings (loss) before interest
and taxes 452,751 109,157 (16,643) 545,265Depreciation and amortization 411,697 25,132 8,206 445,035Assets 3,877,832 665,894 463,983 5,007,709Capital expenditures for
long-lived assets 559,080 17,343 21,414 597,837
1 9 9 8
Revenues $4,934,269 $1,666,448 $000,121 $6,600,838Earnings (loss) before interest
and taxes 392,120 93,734 (23,796) 462,058Depreciation and amortization 355,639 25,629 5,586 386,854Assets 3,096,610 586,801 363,384 4,046,795Capital expenditures for
long-lived assets 488,444 19,644 51,254 559,342
1 9 9 7
Revenues $3,929,959 $1,685,903 $000,186 $5,616,048Earnings (loss) before interest
and taxes 281,483 104,965 (1,933) 384,515Depreciation and amortization 305,643 24,417 3,187 333,247Assets 2,802,993 513,531 176,563 3,493,087Capital expenditures for
long-lived assets 459,651 17,547 24,971 502,169
A reconciliation of earnings before interest and taxes to income before taxes is as follows:
F i s c a l Ye a r
1999 1998 1997
Earnings before interest and taxes $545,265 $(462,058 $384,515Interest expense (48,496) (50,951) (40,268)Interest income 14,588 8,855 7,995Special charges (229,093) (48,929)
Total $511,357 $(190,869 $303,313
Notes to Consolidated Financial Statements Computer Sciences Corporation
(Dollars in thousands except per-share amounts)Notes to Consolidated Financial Statements Computer Sciences Corporation
(Dollars in thousands except per-share amounts)

7574
Enterprise-wide information is provided in accordance with SFAS No. 131. Revenue by country is basedon the location of the selling business unit. Property and equipment information is based on the physicallocation of the asset. Geographic revenue and property and equipment, net for the three years ended April2, 1999 is as follows:
F i s c a l Ye a r
1999 1998 1997
Property Property Propertyand and and
Equipment, Equipment, Equipment,Revenue Net Revenue Net Revenue Net
United States $4,893,730 $ 722,859 $4,406,236 $691,472 $3,795,361 $648,730Europe:
United Kingdom 1,134,923 130,577 929,717 136,062 749,203 140,982Other Europe 1,115,174 110,139 841,238 87,046 725,730 62,812
Other International 516,138 123,300 423,647 42,613 345,754 35,545
Total $7,659,965 $1,086,875 $6,600,838 $957,193 $5,616,048 $888,069
The Company derives a significant portion of its revenues from departments and agencies of the UnitedStates government. U.S. Federal government revenue accounted for 23%, 25% and 29% of theCompany’s revenue for fiscal 1999, 1998 and 1997, respectively. At April 2, 1999, approximately 28% ofthe Company’s accounts receivable were due from the federal government. No single commercial cus-tomer exceeded 10% of the Company’s revenue during fiscal 1999, 1998 and 1997, respectively.
N o t e 1 1 Agreement with Equifax
During fiscal 1989, the Company entered into an agreement (the “Operating Agreement”) with Equifax Inc.and its subsidiary, Equifax Credit Information Services, Inc. (‘‘ECIS’’), pursuant to which certain of theCompany’s subsidiaries (collectively, the ‘‘Bureaus’’) became affiliated credit bureaus of ECIS and pur-chased credit reporting services from the ECIS system for resale to their customers. The Bureaus retainownership of their credit files stored in the ECIS system and receive revenues generated from the sale ofthe credit information they contain. The Bureaus pay ECIS a fee for storing and maintaining the files andfor each report supplied by the ECIS system.
Pursuant to the Operating Agreement, the Company acquired an option to require ECIS to purchase thecollections business (the “Collections Put Option”), and a separate option to require ECIS to purchase thecredit reporting business and, if not previously sold, the collections business (the “Credit Reporting PutOption”). Both options require six months’ advance notice and expire on August 1, 2013.
On November 25, 1997, the Collections Put Option was exercised and the collections business was soldfor approximately $38,000. The transaction was completed during May 1998.
Since July 31, 1998, the exercise price of the Credit Reporting Put Option has been equal to the appraisedvalue of the credit reporting business.
The Operating Agreement has a 10-year term, which will automatically be renewed indefinitely for succes-sive 10-year periods unless the Company gives notice of termination at least six months prior to the expi-ration of any such term. In the event that on or prior to August 1, 2013 (i) the Company gives such noticeof termination and does not exercise the Credit Reporting Put Option prior to the termination of the then-current term or (ii) there is a change in control of the Company, then ECIS has an option for 60 days there-after to require the Company to sell to it the credit reporting business at the Credit Reporting Put Optionexercise price.
The Company’s rights under the Operating Agreement, including its right to exercise the Credit ReportingPut Option, remain exercisable by the Company through its affiliates.
Notes to Consolidated Financial Statements Computer Sciences Corporation
(Dollars in thousands except per-share amounts)Notes to Consolidated Financial Statements Computer Sciences Corporation
(Dollars in thousands except per-share amounts)

The Board of Directors and StockholdersComputer Sciences CorporationEl Segundo, California
We have audited the accompanying consolidated balance sheets of Computer Sciences Corporation and Subsidiaries (the Company) as of April 2, 1999 and April 3, 1998, and the related consolidatedstatements of income, stockholders’ equity, and cash flows for each of the three years in the period endedApril 2, 1999. These financial statements are the responsibility of the Company’s management. Ourresponsibility is to express an opinion on these financial statements and financial statement schedulebased on our audits.
We conducted our audits in accordance with generally accepted auditing standards. Those standardsrequire that we plan and perform the audit to obtain reasonable assurance about whether the financialstatements are free of material misstatement. An audit includes examining, on a test basis, evidence sup-porting the amounts and disclosures in the financial statements. An audit also includes assessing theaccounting principles used and significant estimates made by management, as well as evaluating the over-all financial statement presentation. We believe that our audits provide a reasonable basis for our opinion.
In our opinion, such consolidated financial statements present fairly, in all material respects, the financialposition of Computer Sciences Corporation and Subsidiaries as of April 2, 1999 and April 3, 1998, and theresults of their operations and their cash flows for each of the three years in the period ended April 2, 1999in conformity with generally accepted accounting principles.
Los Angeles, CaliforniaMay 26, 1999
7776
Report of Management Computer Sciences Corporation Independent Auditors’ Report Computer Sciences Corporation
The financial statements included in this report are the responsibility of Computer Sciences Corporationmanagement and have been prepared in conformity with generally accepted accounting principles. These financial statements include amounts that are based upon management’s best estimates andjudgement. All financial data included in this report is consistent with the information included in the finan-cial statements.
The Company maintains a system of internal accounting controls, which in the opinion of management pro-vide reasonable assurance that assets are safeguarded and that transactions are executed and recordedin accordance with management’s authorization. The system is tested and evaluated on a regular basis bythe Company’s internal auditors as well as by the independent auditors during their annual audit. To assurethe effective administration of internal controls, the Company carefully selects and trains its employees andprovides them with a written Code of Ethics and Standards of Conduct.
The Board of Directors has appointed an Audit Committee composed entirely of outside directors who arenot members of management. The Audit Committee meets regularly with management, the internal audi-tors and the independent auditors, to ensure that each is properly discharging its responsibilities. The inde-pendent auditors and internal auditors may periodically meet alone with the Audit Committee to discussappropriate matters.
Van B. Honeycutt Leon J. LevelChairman, President and Chief Financial OfficerChief Executive Officer

7978
Quarterly Financial Information (Unaudited) Computer Sciences Corporation
F i s c a l 1 9 9 9
In thousands except per-share amounts 1st Quarter 2nd Quarter 3rd Quarter 4th Quarter
Revenues $1,753,928 $1,847,771 $1,927,888 $2,130,378Income before taxes 96,435 109,547 130,418 174,957Net income 64,335 73,047 87,018 116,757Net earnings per share:
Basic 0.41 0.46 0.55 0.73Diluted 0.40 0.45 0.54 0.72
F i s c a l 1 9 9 8
1st Quarter 2nd Quarter 3rd Quarter 4th Quarter
Revenues $1,488,750 $1,578,824 $1,664,092 $1,869,172Income (loss) before taxes (127,612) 92,353 106,632 119,496Net income 52,588 58,553 69,132 80,096Net earnings per share:
Basic 0.34 0.38 0.44 0.51Diluted 0.33 0.37 0.44 0.50
A discussion of “special items” for fiscal 1998 is included in Note 2 to the consolidated financial statements.
Five-Year Review Computer Sciences Corporation
In thousands except per-share amounts April 2, 1999 April 3, 1998 March 28, 1997 March 29, 1996 March 31, 1995
Total assets $5,007,709 $4,046,795 $3,493,087 $2,936,019 $2,631,580Debt:
Long-term 397,860 736,054 630,842 426,634 335,696Short-term 426,421 7,110 20,311 71,422 128,237Current maturities 166,521 21,811 9,622 6,917 11,933
Total 990,802 764,975 660,775 504,973 475,866Stockholders’ equity 2,399,854 2,001,275 1,669,560 1,420,113 1,290,769Working capital 587,573 767,820 533,915 430,484 390,726Property and equipment:
At cost 2,313,444 1,944,799 1,668,905 1,249,729 994,520Accumulated depreciation
and amortization 1,226,569 987,606 780,836 569,670 430,249
Property and equipment, net 1,086,875 957,193 888,069 680,059 564,271Current assets to
current liabilities 1.3:1 1.6:1 1.5:1 1.5:1 1.4:1Debt to total capitalization 29.2% 27.7% 28.4% 26.2% 26.9%Book value per share $0,0015.08 $0,0012.75 $0,0010.88 $0,0009.43 $0,0008.70Stock price range (high) 74.88 56.75 43.25 40.38 26.31Stock price range (low) 46.25 28.94 30.81 23.25 17.63

8180
Five-Year Review (continued) Computer Sciences Corporation Computer Sciences Corporation
F i s c a l Ye a r
In thousands except per-share amounts 1999 1998 1997 1996 1995
Revenues $7,659,965 $6,600,838 $5,616,048 $4,740,760 $3,788,026
Costs of services 5,973,837 5,149,218 4,413,173 3,692,267 2,961,955Selling, general and
administrative 695,828 602,708 485,113 471,309 383,973Depreciation and amortization 445,035 386,854 333,247 272,058 190,240Interest, net 33,908 42,096 32,273 32,143 27,304Special charges 229,093 48,929 76,053 3,740
Total costs and expenses 7,148,608 6,409,969 5,312,735 4,543,830 3,567,212
Income before taxes 511,357 190,869 303,313 196,930 220,814Taxes on income 170,200 (69,500) 110,900 87,499 77,577
Net income $0,341,157 $0,260,369 $0,192,413 $0,109,431 $0,143,237
Basic earnings per common share $0,0002.16 $0,0001.68 $0,0001.27 $0,0000.74 $0,0001.02
Diluted earnings per common share $0,0002.11 $0,0001.64 $0,0001.23 $0,0000.71 $0,0001.00
Average common shares outstanding 158,213 155,125 151,895 148,865 140,297
Average common shares outstanding assuming dilution 161,949 158,526 156,394 153,070 143,702
Notes: A discussion of “Income Before Taxes” and “Net Income and Earnings per Share” before and after special itemsis included in Management’s Discussion and Analysis of Financial Condition and Results of Operations (“MD&A”). Adiscussion of “Special Items” for fiscal years ended 1997 and 1998 is also included in MD&A. The fiscal 1996 specialcharge of $76,053 (40 cents per share after tax) relates to two acquisitions by a company subsequently acquired byCSC and accounted for as a pooling of interests. The fiscal 1995 special charge of $3,740 (1 cent per share after tax)relates to the sale of the Company’s tax processing operations.
The selected financial data has been restated for fiscal 1995 through 1996 to include the results of business combi-nations accounted for as poolings of interests.
No dividends were paid by CSC during the five years presented. A fiscal 1996 acquisition, accounted for as a poolingof interests, paid dividends of $.17 per share during fiscal 1995.
Directors
Van B. Honeycutt (1993)Chairman, President andChief Executive Officer, CSC1
Irving W. Bailey, II (1992)President, Bailey CapitalCorporationFormer Chairman andChief Executive OfficerProvidian Corporation3
Stephen L. Baum (1999)Vice Chairman, President and Chief Operating OfficerSempra Energy2
William R. Hoover (1968)Chairman of the Executive CommitteeFormer Chairman, Presidentand Chief Executive Officer, CSC1
Leon J. Level (1989)Vice President andChief Financial Officer, CSC1
Thomas A. McDonnell (1997)President and Chief Executive OfficerDST Systems, Inc.2
F. Warren McFarlan (1989)Senior Associate Dean, Director ofExternal Relations and Albert H. Gordon Professor ofBusiness Administration,Harvard University Graduate Schoolof Business Administration2
James R. Mellor (1992)Former Chairman andChief Executive OfficerGeneral Dynamics Corporation3
William P. Rutledge (1997)Chairman, President andChief Executive OfficerCommunications & PowerIndustries Holding Corporation3
Officers
Van B. HoneycuttChairman, President andChief Executive Officer
Harvey N. BernsteinVice President andDeputy General Counsel
Edward P. BoykinVice President and President, Financial Services Group
Milton E. CooperVice President andPresident, Federal Sector
Scott M. DelantyVice President and Controller
Hayward D. FiskVice President, General Counsel and Secretary
Leon J. LevelVice President andChief Financial Officer
Ronald W. MackintoshVice President and President, European Group
C. Bruce PlowmanVice President, Corporate andMarketing Communications
Paul T. TuckerVice President,Corporate Development
Board of Directors and Officers of the Company
Committee Memberships1. Executive2. Audit3. CompensationDate in parentheses indicates year directorwas first elected to the board

Five-Year Review (continued) Computer Sciences Corporation
82
Corporate OfficeComputer Sciences Corporation2100 East Grand Ave.El Segundo, California 90245Telephone 310.615.0311
Chemical and Energy400 Commerce DriveNewark, Delaware 19713
Michael D. Beebe, PresidentTelephone 302.391.6000
Consulting29 Sawyer RoadWaltham, Massachusetts 02453
James P. Saviano, PresidentTelephone 781.647.0116
Credit Services652 North Sam Houston Parkway East, Suite 400Houston, Texas 77060
Robert M. Denny, PresidentTelephone 281.878.1900
CSC Pinnacle Alliancec/o J. P. Morgan75 Wall Street, 10th FloorNew York, New York 10260
James D. Cook, PresidentTelephone 212.235.5607
Financial Services9500 Arboretum Blvd.Austin, Texas 78759
Edward P. Boykin, PresidentTelephone 512.345.5700
Global Infrastructure3190 Fairview Park DriveFalls Church, Virginia 22042
Bernard J. Breen, PresidentTelephone 703.876.1000
Healthcare1675 Broadway, 18th Floor New York, New York 10019
Arthur H. Spiegel III, PresidentTelephone 212.903.9300
Integrated Business Services3170 Fairview Park DriveFalls Church, Virginia 22042
Gerry Dubé, President Telephone 703.876.1000
Technology Management3170 Fairview Park DriveFalls Church, Virginia 22042
Paul M. Cofoni, PresidentTelephone 703.876.1000
U.S. Federal3170 Fairview Park DriveFalls Church, Virginia 22042
Milton E. Cooper, PresidentTelephone 703.876.1000
Asia139 Cecil Street#08-00 Cecil HouseSingapore 069539Republic of Singapore
W. Brinson Weeks, PresidentTelephone 65(0) 221.9095
AustraliaSydney, Australia460 Pacific HighwaySt. Leonards, NSW 2065
George BellManaging Director andChief Executive OfficerTelephone 61(0)2.9901.1111
Europe279 Farnborough RoadFarnboroughHampshire GU147LSUnited Kingdom
Ronald W. Mackintosh,President Telephone 44(0)1252.363000
Principal Operating Units
Shareholder ServicesAll inquiries concerning registered shareholder accounts and stock transfer matters, including address changesand consolidation of duplicate accounts, should be directed to CSC’s transfer agent and registrar: ChaseMellonShareholder Services, P.O. Box 3315, South Hackensack, New Jersey 07660, Telephone 800.526.0801.
Other stock ownership questions and requests for literature, including the company’s annual report to theSecurities and Exchange Commission on Form 10-K without exhibits, are available at no charge by telephoningCSC’s shareholder services and automated literature request line at 800.542.3070. Written requests should bedirected to CSC’s Investor Relations department. Additionally, documents may be obtained online atwww.csc.com, or via facsimile service 800.962.7328.
Financial Community InformationInquiries from institutional investors, financial analysts, and portfolio managers should be directed to:Bill Lackey, Director, Investor Relations, at 310.615.1700
Inquires from individual shareholders and registered representatives should be directed to: Lisa Runge, Manager, Investor Relations, at 310.615.1680
Market Price Data Per QuarterThe table below shows the high and low intra-day prices of CSC’s common stock on the composite tape of theNew York Stock Exchange for each quarter during the last two calendar years and to date in 1999.
1 9 9 9 1 9 9 8 1 9 9 7
Calendar Quarter High Low High Low High Low
1st 74 3/8 54 15/16 56 3/4 39 31/32 41 3/16 30 13/16
2nd 68 1/8* 523/8* 65 49 1/8 40 1/16 28 15/16
3rd 74 7/8 51 1/2 41 9/16 34 1/24th 70 15/16 46 1/4 43 7/8 33 5/8* Through June 18, 1999.
Annual Meeting The Annual Meeting ofShareholders will be held at 2 p.m. on Monday, August 9, 1999,at the Sheraton Gateway Hotel, Los Angeles Airport, 6101 CenturyBlvd. Proxies for the meeting will be solicited in a separate proxystatement.
ShareholdersAs of June 18, 1999, CSC hadapproximately 123,000 sharehold-ers, including 8,818 shareholders of record.
InternetCSC’s home page address onthe Internet ishttp://www.csc.com
E-mail inquiries are welcomed. CSC’s Investor Relationsaddress is:[email protected]
Registrar and Transfer AgentChaseMellon Shareholder Services P.O. Box 3315S. Hackensack, New Jersey 07660USA: 800.526.0801 Foreign: 201.329.8660http://www.chasemellon.com
AuditorsDeloitte & Touche LLP1000 Wilshire BoulevardLos Angeles, California 90017
Stock Traded (CSC)New York Stock ExchangePacific ExchangeMidwest Stock Exchange (Chicago)Boston Stock ExchangePhiladelphia Stock Exchange
Shareholder and Investor Information

© Computer Sciences Corporation 1999 Printed in USA 6/99 175M GR CCAR99
Related Documents