1 23 Machine Vision and Applications ISSN 0932-8092 Volume 25 Number 2 Machine Vision and Applications (2014) 25:451-475 DOI 10.1007/s00138-013-0522-0 Accurate and robust localization of duplicated region in copy–move image forgery Maryam Jaberi, George Bebis, Muhammad Hussain & Ghulam Muhammad

Welcome message from author
This document is posted to help you gain knowledge. Please leave a comment to let me know what you think about it! Share it to your friends and learn new things together.
Transcript

1 23
Machine Vision and Applications ISSN 0932-8092Volume 25Number 2 Machine Vision and Applications (2014)25:451-475DOI 10.1007/s00138-013-0522-0
Accurate and robust localization ofduplicated region in copy–move imageforgery
Maryam Jaberi, George Bebis,Muhammad Hussain & GhulamMuhammad
1 23
Your article is protected by copyright and
all rights are held exclusively by Springer-
Verlag Berlin Heidelberg. This e-offprint is
for personal use only and shall not be self-
archived in electronic repositories. If you wish
to self-archive your article, please use the
accepted manuscript version for posting on
your own website. You may further deposit
the accepted manuscript version in any
repository, provided it is only made publicly
available 12 months after official publication
or later and provided acknowledgement is
given to the original source of publication
and a link is inserted to the published article
on Springer's website. The link must be
accompanied by the following text: "The final
publication is available at link.springer.com”.

Machine Vision and Applications (2014) 25:451–475DOI 10.1007/s00138-013-0522-0
FULL LENGTH PAPER
Accurate and robust localization of duplicated regionin copy–move image forgery
Maryam Jaberi · George Bebis ·Muhammad Hussain · Ghulam Muhammad
Received: 22 October 2012 / Revised: 1 March 2013 / Accepted: 15 May 2013 / Published online: 4 June 2013© Springer-Verlag Berlin Heidelberg 2013
Abstract Copy–move image forgery detection has recentlybecome a very active research topic in blind image forensics.In copy–move image forgery, a region from some imagelocation is copied and pasted to a different location of thesame image. Typically, post-processing is applied to betterhide the forgery. Using keypoint-based features, such as SIFTfeatures, for detecting copy–move image forgeries has pro-duced promising results. The main idea is detecting dupli-cated regions in an image by exploiting the similarity betweenkeypoint-based features in these regions. In this paper, wehave adopted keypoint-based features for copy–move imageforgery detection; however, our emphasis is on accurate androbust localization of duplicated regions. In this context, weare interested in estimating the transformation (e.g., affine)between the copied and pasted regions more accurately aswell as extracting these regions as robustly by reducing thenumber of false positives and negatives. To address theseissues, we propose using a more powerful set of keypoint-based features, called MIFT, which shares the propertiesof SIFT features but also are invariant to mirror reflectiontransformations. Moreover, we propose refining the affine
M. Jaberi · G. Bebis (B)Computer Science and Engineering Department,University of Nevada, Reno, USAe-mail: [email protected]
M. Jaberie-mail: [email protected]
M. HussainComputer Science Department, King Saud University,Riyadh, Saudi Arabiae-mail: [email protected]
G. MuhammadComputer Engineering Department, King Saud University,Riyadh, Saudi Arabiae-mail: [email protected]
transformation using an iterative scheme which improves theestimation of the affine transformation parameters by incre-mentally finding additional keypoint matches. To reduce falsepositives and negatives when extracting the copied and pastedregions, we propose using “dense” MIFT features, instead ofstandard pixel correlation, along with hysteresis thresholdingand morphological operations. The proposed approach hasbeen evaluated and compared with competitive approachesthrough a comprehensive set of experiments using a largedataset of real images (i.e., CASIA v2.0). Our results indicatethat our method can detect duplicated regions in copy–moveimage forgery with higher accuracy, especially when the sizeof the duplicated region is small.
Keywords Blind image forensics, Copy–move imageforgery, SIFT, MIFT, Matching
1 Introduction
Recent advances in imaging technologies, both in hardware(e.g., digital cameras) and software (e.g., image editing appli-cations), have enabled manipulating digital image contentseasily in order to hide or create misleading images with noobservable trace [1]. Establishing the authenticity of images,however, is of essence in many applications such as crimi-nal investigation, medical imaging, journalism, intelligenceservices, and surveillance systems [7,24]. Recently, the fieldof digital forgery detection has been introduced to addressthis issue and has become a very important field in imageprocessing. Digital altering has already appeared in manydisturbing forms [1] and there have been several researchstudies on improving image forgery techniques [25]. Thesetechniques usually include deleting or hiding a region in theimage, adding a new object to the image or representing the
123
Author's personal copy
452 M. Jaberi et al.
image information in an incorrect way. Based on the oper-ation used to create a tampered image, techniques can becategorized into three main groups: image retouching, copy–paste (i.e., splicing), and copy–move (i.e., cloning) [2].
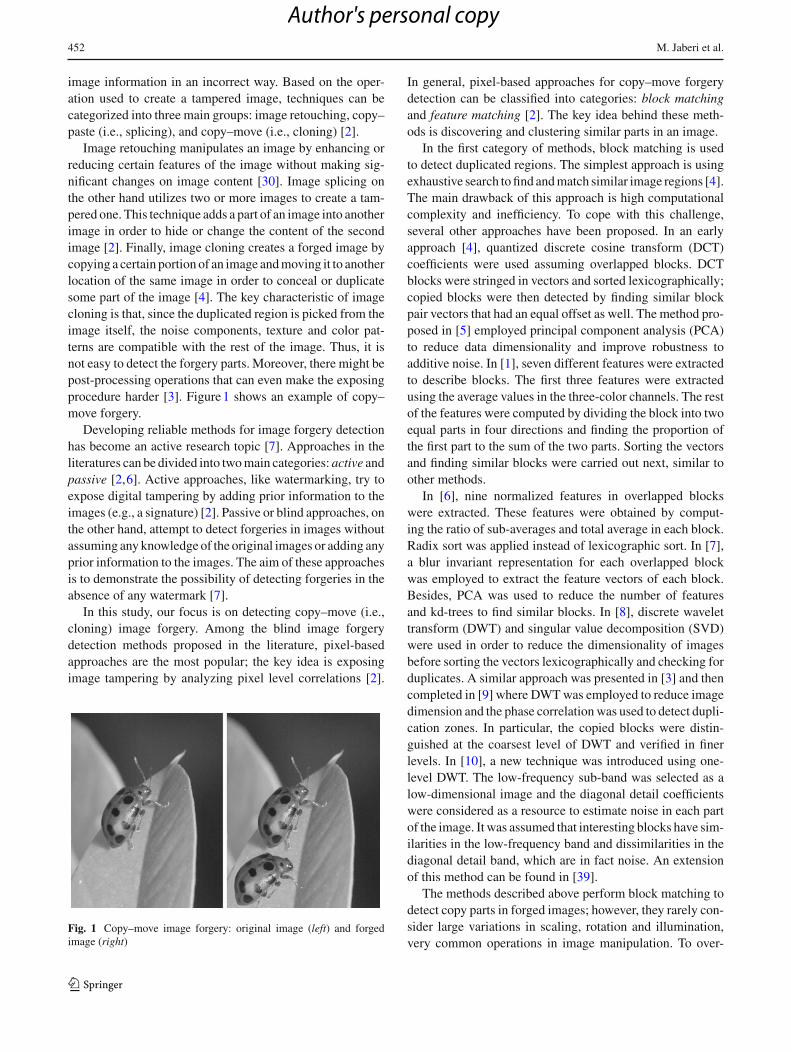
Image retouching manipulates an image by enhancing orreducing certain features of the image without making sig-nificant changes on image content [30]. Image splicing onthe other hand utilizes two or more images to create a tam-pered one. This technique adds a part of an image into anotherimage in order to hide or change the content of the secondimage [2]. Finally, image cloning creates a forged image bycopying a certain portion of an image and moving it to anotherlocation of the same image in order to conceal or duplicatesome part of the image [4]. The key characteristic of imagecloning is that, since the duplicated region is picked from theimage itself, the noise components, texture and color pat-terns are compatible with the rest of the image. Thus, it isnot easy to detect the forgery parts. Moreover, there might bepost-processing operations that can even make the exposingprocedure harder [3]. Figure 1 shows an example of copy–move forgery.
Developing reliable methods for image forgery detectionhas become an active research topic [7]. Approaches in theliteratures can be divided into two main categories: active andpassive [2,6]. Active approaches, like watermarking, try toexpose digital tampering by adding prior information to theimages (e.g., a signature) [2]. Passive or blind approaches, onthe other hand, attempt to detect forgeries in images withoutassuming any knowledge of the original images or adding anyprior information to the images. The aim of these approachesis to demonstrate the possibility of detecting forgeries in theabsence of any watermark [7].
In this study, our focus is on detecting copy–move (i.e.,cloning) image forgery. Among the blind image forgerydetection methods proposed in the literature, pixel-basedapproaches are the most popular; the key idea is exposingimage tampering by analyzing pixel level correlations [2].
Fig. 1 Copy–move image forgery: original image (left) and forgedimage (right)
In general, pixel-based approaches for copy–move forgerydetection can be classified into categories: block matchingand feature matching [2]. The key idea behind these meth-ods is discovering and clustering similar parts in an image.
In the first category of methods, block matching is usedto detect duplicated regions. The simplest approach is usingexhaustive search to find and match similar image regions [4].The main drawback of this approach is high computationalcomplexity and inefficiency. To cope with this challenge,several other approaches have been proposed. In an earlyapproach [4], quantized discrete cosine transform (DCT)coefficients were used assuming overlapped blocks. DCTblocks were stringed in vectors and sorted lexicographically;copied blocks were then detected by finding similar blockpair vectors that had an equal offset as well. The method pro-posed in [5] employed principal component analysis (PCA)to reduce data dimensionality and improve robustness toadditive noise. In [1], seven different features were extractedto describe blocks. The first three features were extractedusing the average values in the three-color channels. The restof the features were computed by dividing the block into twoequal parts in four directions and finding the proportion ofthe first part to the sum of the two parts. Sorting the vectorsand finding similar blocks were carried out next, similar toother methods.
In [6], nine normalized features in overlapped blockswere extracted. These features were obtained by comput-ing the ratio of sub-averages and total average in each block.Radix sort was applied instead of lexicographic sort. In [7],a blur invariant representation for each overlapped blockwas employed to extract the feature vectors of each block.Besides, PCA was used to reduce the number of featuresand kd-trees to find similar blocks. In [8], discrete wavelettransform (DWT) and singular value decomposition (SVD)were used in order to reduce the dimensionality of imagesbefore sorting the vectors lexicographically and checking forduplicates. A similar approach was presented in [3] and thencompleted in [9] where DWT was employed to reduce imagedimension and the phase correlation was used to detect dupli-cation zones. In particular, the copied blocks were distin-guished at the coarsest level of DWT and verified in finerlevels. In [10], a new technique was introduced using one-level DWT. The low-frequency sub-band was selected as alow-dimensional image and the diagonal detail coefficientswere considered as a resource to estimate noise in each partof the image. It was assumed that interesting blocks have sim-ilarities in the low-frequency band and dissimilarities in thediagonal detail band, which are in fact noise. An extensionof this method can be found in [39].
The methods described above perform block matching todetect copy parts in forged images; however, they rarely con-sider large variations in scaling, rotation and illumination,very common operations in image manipulation. To over-
123
Author's personal copy
Accurate and robust localization of duplicated region 453
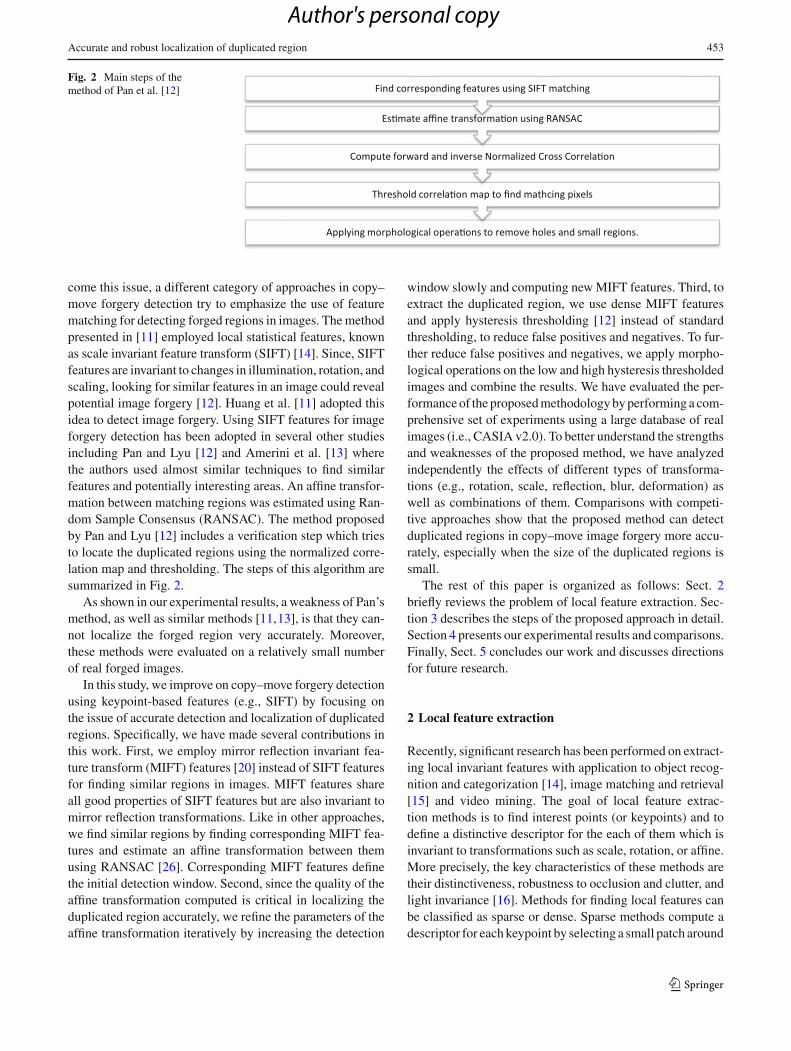
Fig. 2 Main steps of themethod of Pan et al. [12]
come this issue, a different category of approaches in copy–move forgery detection try to emphasize the use of featurematching for detecting forged regions in images. The methodpresented in [11] employed local statistical features, knownas scale invariant feature transform (SIFT) [14]. Since, SIFTfeatures are invariant to changes in illumination, rotation, andscaling, looking for similar features in an image could revealpotential image forgery [12]. Huang et al. [11] adopted thisidea to detect image forgery. Using SIFT features for imageforgery detection has been adopted in several other studiesincluding Pan and Lyu [12] and Amerini et al. [13] wherethe authors used almost similar techniques to find similarfeatures and potentially interesting areas. An affine transfor-mation between matching regions was estimated using Ran-dom Sample Consensus (RANSAC). The method proposedby Pan and Lyu [12] includes a verification step which triesto locate the duplicated regions using the normalized corre-lation map and thresholding. The steps of this algorithm aresummarized in Fig. 2.
As shown in our experimental results, a weakness of Pan’smethod, as well as similar methods [11,13], is that they can-not localize the forged region very accurately. Moreover,these methods were evaluated on a relatively small numberof real forged images.
In this study, we improve on copy–move forgery detectionusing keypoint-based features (e.g., SIFT) by focusing onthe issue of accurate detection and localization of duplicatedregions. Specifically, we have made several contributions inthis work. First, we employ mirror reflection invariant fea-ture transform (MIFT) features [20] instead of SIFT featuresfor finding similar regions in images. MIFT features shareall good properties of SIFT features but are also invariant tomirror reflection transformations. Like in other approaches,we find similar regions by finding corresponding MIFT fea-tures and estimate an affine transformation between themusing RANSAC [26]. Corresponding MIFT features definethe initial detection window. Second, since the quality of theaffine transformation computed is critical in localizing theduplicated region accurately, we refine the parameters of theaffine transformation iteratively by increasing the detection
window slowly and computing new MIFT features. Third, toextract the duplicated region, we use dense MIFT featuresand apply hysteresis thresholding [12] instead of standardthresholding, to reduce false positives and negatives. To fur-ther reduce false positives and negatives, we apply morpho-logical operations on the low and high hysteresis thresholdedimages and combine the results. We have evaluated the per-formance of the proposed methodology by performing a com-prehensive set of experiments using a large database of realimages (i.e., CASIA v2.0). To better understand the strengthsand weaknesses of the proposed method, we have analyzedindependently the effects of different types of transforma-tions (e.g., rotation, scale, reflection, blur, deformation) aswell as combinations of them. Comparisons with competi-tive approaches show that the proposed method can detectduplicated regions in copy–move image forgery more accu-rately, especially when the size of the duplicated regions issmall.
The rest of this paper is organized as follows: Sect. 2briefly reviews the problem of local feature extraction. Sec-tion 3 describes the steps of the proposed approach in detail.Section 4 presents our experimental results and comparisons.Finally, Sect. 5 concludes our work and discusses directionsfor future research.
2 Local feature extraction
Recently, significant research has been performed on extract-ing local invariant features with application to object recog-nition and categorization [14], image matching and retrieval[15] and video mining. The goal of local feature extrac-tion methods is to find interest points (or keypoints) and todefine a distinctive descriptor for the each of them which isinvariant to transformations such as scale, rotation, or affine.More precisely, the key characteristics of these methods aretheir distinctiveness, robustness to occlusion and clutter, andlight invariance [16]. Methods for finding local features canbe classified as sparse or dense. Sparse methods compute adescriptor for each keypoint by selecting a small patch around
123
Author's personal copy
454 M. Jaberi et al.
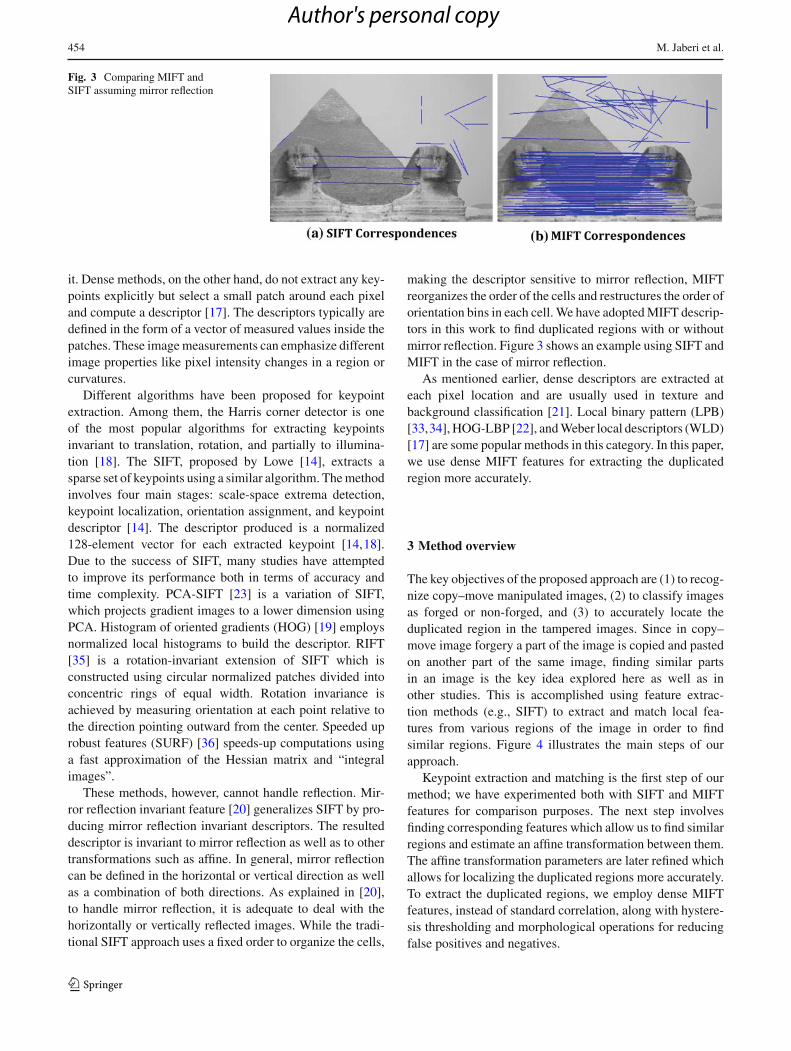
Fig. 3 Comparing MIFT andSIFT assuming mirror reflection
it. Dense methods, on the other hand, do not extract any key-points explicitly but select a small patch around each pixeland compute a descriptor [17]. The descriptors typically aredefined in the form of a vector of measured values inside thepatches. These image measurements can emphasize differentimage properties like pixel intensity changes in a region orcurvatures.
Different algorithms have been proposed for keypointextraction. Among them, the Harris corner detector is oneof the most popular algorithms for extracting keypointsinvariant to translation, rotation, and partially to illumina-tion [18]. The SIFT, proposed by Lowe [14], extracts asparse set of keypoints using a similar algorithm. The methodinvolves four main stages: scale-space extrema detection,keypoint localization, orientation assignment, and keypointdescriptor [14]. The descriptor produced is a normalized128-element vector for each extracted keypoint [14,18].Due to the success of SIFT, many studies have attemptedto improve its performance both in terms of accuracy andtime complexity. PCA-SIFT [23] is a variation of SIFT,which projects gradient images to a lower dimension usingPCA. Histogram of oriented gradients (HOG) [19] employsnormalized local histograms to build the descriptor. RIFT[35] is a rotation-invariant extension of SIFT which isconstructed using circular normalized patches divided intoconcentric rings of equal width. Rotation invariance isachieved by measuring orientation at each point relative tothe direction pointing outward from the center. Speeded uprobust features (SURF) [36] speeds-up computations usinga fast approximation of the Hessian matrix and “integralimages”.
These methods, however, cannot handle reflection. Mir-ror reflection invariant feature [20] generalizes SIFT by pro-ducing mirror reflection invariant descriptors. The resulteddescriptor is invariant to mirror reflection as well as to othertransformations such as affine. In general, mirror reflectioncan be defined in the horizontal or vertical direction as wellas a combination of both directions. As explained in [20],to handle mirror reflection, it is adequate to deal with thehorizontally or vertically reflected images. While the tradi-tional SIFT approach uses a fixed order to organize the cells,
making the descriptor sensitive to mirror reflection, MIFTreorganizes the order of the cells and restructures the order oforientation bins in each cell. We have adopted MIFT descrip-tors in this work to find duplicated regions with or withoutmirror reflection. Figure 3 shows an example using SIFT andMIFT in the case of mirror reflection.
As mentioned earlier, dense descriptors are extracted ateach pixel location and are usually used in texture andbackground classification [21]. Local binary pattern (LPB)[33,34], HOG-LBP [22], and Weber local descriptors (WLD)[17] are some popular methods in this category. In this paper,we use dense MIFT features for extracting the duplicatedregion more accurately.
3 Method overview
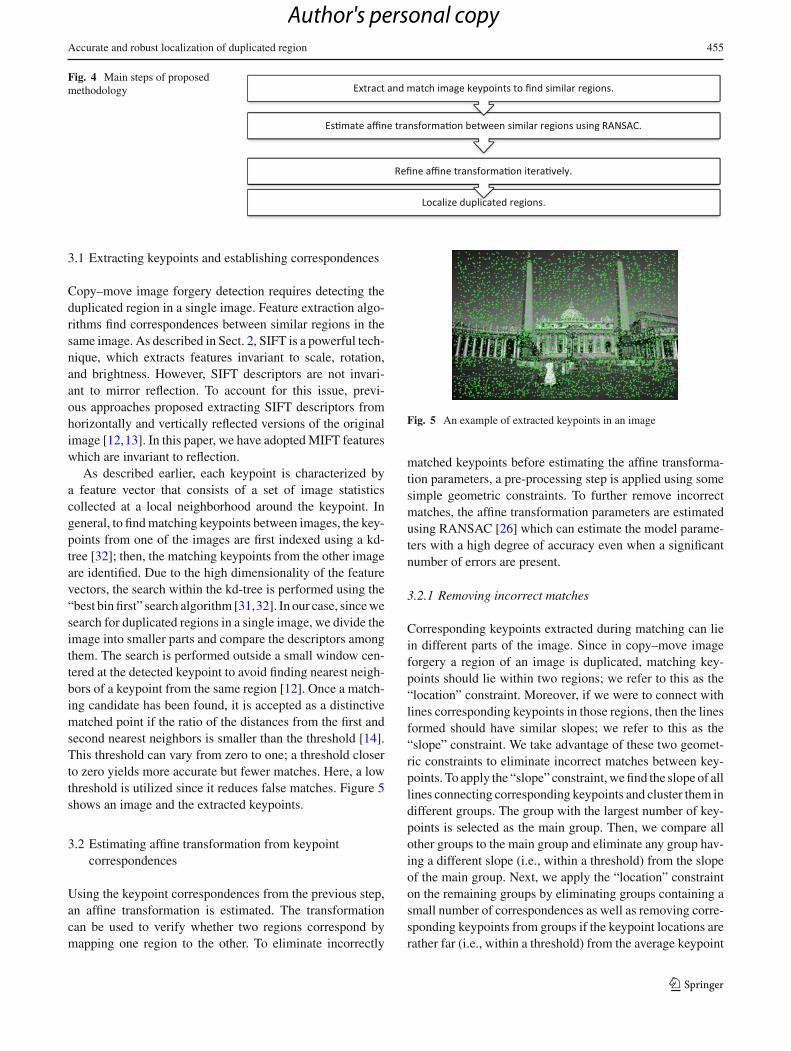
The key objectives of the proposed approach are (1) to recog-nize copy–move manipulated images, (2) to classify imagesas forged or non-forged, and (3) to accurately locate theduplicated region in the tampered images. Since in copy–move image forgery a part of the image is copied and pastedon another part of the same image, finding similar partsin an image is the key idea explored here as well as inother studies. This is accomplished using feature extrac-tion methods (e.g., SIFT) to extract and match local fea-tures from various regions of the image in order to findsimilar regions. Figure 4 illustrates the main steps of ourapproach.
Keypoint extraction and matching is the first step of ourmethod; we have experimented both with SIFT and MIFTfeatures for comparison purposes. The next step involvesfinding corresponding features which allow us to find similarregions and estimate an affine transformation between them.The affine transformation parameters are later refined whichallows for localizing the duplicated regions more accurately.To extract the duplicated regions, we employ dense MIFTfeatures, instead of standard correlation, along with hystere-sis thresholding and morphological operations for reducingfalse positives and negatives.
123
Author's personal copy
Accurate and robust localization of duplicated region 455
Fig. 4 Main steps of proposedmethodology
3.1 Extracting keypoints and establishing correspondences
Copy–move image forgery detection requires detecting theduplicated region in a single image. Feature extraction algo-rithms find correspondences between similar regions in thesame image. As described in Sect. 2, SIFT is a powerful tech-nique, which extracts features invariant to scale, rotation,and brightness. However, SIFT descriptors are not invari-ant to mirror reflection. To account for this issue, previ-ous approaches proposed extracting SIFT descriptors fromhorizontally and vertically reflected versions of the originalimage [12,13]. In this paper, we have adopted MIFT featureswhich are invariant to reflection.
As described earlier, each keypoint is characterized bya feature vector that consists of a set of image statisticscollected at a local neighborhood around the keypoint. Ingeneral, to find matching keypoints between images, the key-points from one of the images are first indexed using a kd-tree [32]; then, the matching keypoints from the other imageare identified. Due to the high dimensionality of the featurevectors, the search within the kd-tree is performed using the“best bin first” search algorithm [31,32]. In our case, since wesearch for duplicated regions in a single image, we divide theimage into smaller parts and compare the descriptors amongthem. The search is performed outside a small window cen-tered at the detected keypoint to avoid finding nearest neigh-bors of a keypoint from the same region [12]. Once a match-ing candidate has been found, it is accepted as a distinctivematched point if the ratio of the distances from the first andsecond nearest neighbors is smaller than the threshold [14].This threshold can vary from zero to one; a threshold closerto zero yields more accurate but fewer matches. Here, a lowthreshold is utilized since it reduces false matches. Figure 5shows an image and the extracted keypoints.
3.2 Estimating affine transformation from keypointcorrespondences
Using the keypoint correspondences from the previous step,an affine transformation is estimated. The transformationcan be used to verify whether two regions correspond bymapping one region to the other. To eliminate incorrectly
Fig. 5 An example of extracted keypoints in an image
matched keypoints before estimating the affine transforma-tion parameters, a pre-processing step is applied using somesimple geometric constraints. To further remove incorrectmatches, the affine transformation parameters are estimatedusing RANSAC [26] which can estimate the model parame-ters with a high degree of accuracy even when a significantnumber of errors are present.
3.2.1 Removing incorrect matches
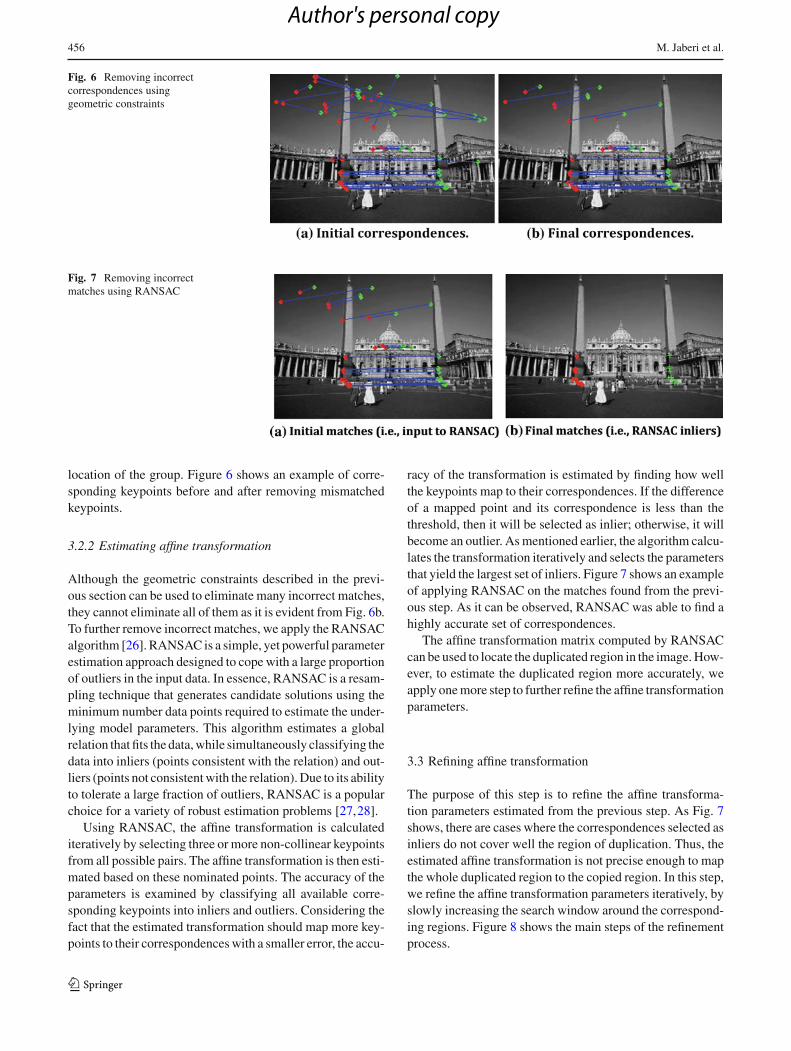
Corresponding keypoints extracted during matching can liein different parts of the image. Since in copy–move imageforgery a region of an image is duplicated, matching key-points should lie within two regions; we refer to this as the“location” constraint. Moreover, if we were to connect withlines corresponding keypoints in those regions, then the linesformed should have similar slopes; we refer to this as the“slope” constraint. We take advantage of these two geomet-ric constraints to eliminate incorrect matches between key-points. To apply the “slope” constraint, we find the slope of alllines connecting corresponding keypoints and cluster them indifferent groups. The group with the largest number of key-points is selected as the main group. Then, we compare allother groups to the main group and eliminate any group hav-ing a different slope (i.e., within a threshold) from the slopeof the main group. Next, we apply the “location” constrainton the remaining groups by eliminating groups containing asmall number of correspondences as well as removing corre-sponding keypoints from groups if the keypoint locations arerather far (i.e., within a threshold) from the average keypoint
123
Author's personal copy
456 M. Jaberi et al.
Fig. 6 Removing incorrectcorrespondences usinggeometric constraints
Fig. 7 Removing incorrectmatches using RANSAC
location of the group. Figure 6 shows an example of corre-sponding keypoints before and after removing mismatchedkeypoints.
3.2.2 Estimating affine transformation
Although the geometric constraints described in the previ-ous section can be used to eliminate many incorrect matches,they cannot eliminate all of them as it is evident from Fig. 6b.To further remove incorrect matches, we apply the RANSACalgorithm [26]. RANSAC is a simple, yet powerful parameterestimation approach designed to cope with a large proportionof outliers in the input data. In essence, RANSAC is a resam-pling technique that generates candidate solutions using theminimum number data points required to estimate the under-lying model parameters. This algorithm estimates a globalrelation that fits the data, while simultaneously classifying thedata into inliers (points consistent with the relation) and out-liers (points not consistent with the relation). Due to its abilityto tolerate a large fraction of outliers, RANSAC is a popularchoice for a variety of robust estimation problems [27,28].
Using RANSAC, the affine transformation is calculatediteratively by selecting three or more non-collinear keypointsfrom all possible pairs. The affine transformation is then esti-mated based on these nominated points. The accuracy of theparameters is examined by classifying all available corre-sponding keypoints into inliers and outliers. Considering thefact that the estimated transformation should map more key-points to their correspondences with a smaller error, the accu-
racy of the transformation is estimated by finding how wellthe keypoints map to their correspondences. If the differenceof a mapped point and its correspondence is less than thethreshold, then it will be selected as inlier; otherwise, it willbecome an outlier. As mentioned earlier, the algorithm calcu-lates the transformation iteratively and selects the parametersthat yield the largest set of inliers. Figure 7 shows an exampleof applying RANSAC on the matches found from the previ-ous step. As it can be observed, RANSAC was able to find ahighly accurate set of correspondences.
The affine transformation matrix computed by RANSACcan be used to locate the duplicated region in the image. How-ever, to estimate the duplicated region more accurately, weapply one more step to further refine the affine transformationparameters.
3.3 Refining affine transformation
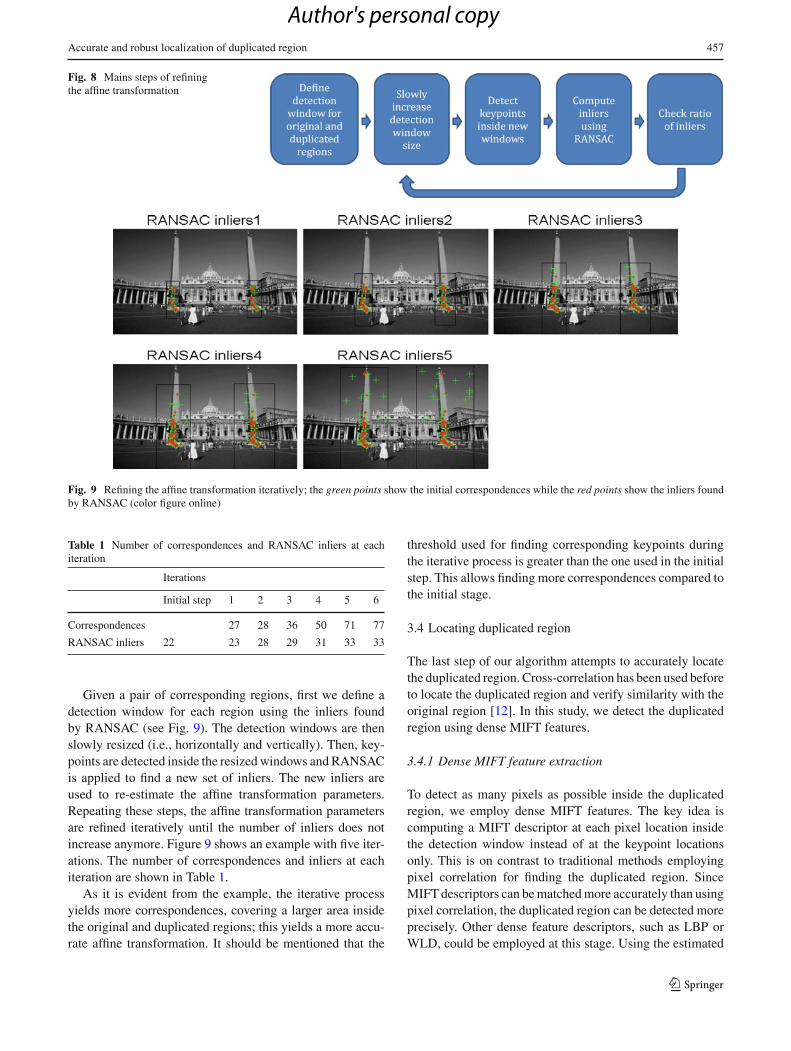
The purpose of this step is to refine the affine transforma-tion parameters estimated from the previous step. As Fig. 7shows, there are cases where the correspondences selected asinliers do not cover well the region of duplication. Thus, theestimated affine transformation is not precise enough to mapthe whole duplicated region to the copied region. In this step,we refine the affine transformation parameters iteratively, byslowly increasing the search window around the correspond-ing regions. Figure 8 shows the main steps of the refinementprocess.
123
Author's personal copy
Accurate and robust localization of duplicated region 457
Fig. 8 Mains steps of refiningthe affine transformation
Fig. 9 Refining the affine transformation iteratively; the green points show the initial correspondences while the red points show the inliers foundby RANSAC (color figure online)
Table 1 Number of correspondences and RANSAC inliers at eachiteration
Iterations
Initial step 1 2 3 4 5 6
Correspondences 27 28 36 50 71 77
RANSAC inliers 22 23 28 29 31 33 33
Given a pair of corresponding regions, first we define adetection window for each region using the inliers foundby RANSAC (see Fig. 9). The detection windows are thenslowly resized (i.e., horizontally and vertically). Then, key-points are detected inside the resized windows and RANSACis applied to find a new set of inliers. The new inliers areused to re-estimate the affine transformation parameters.Repeating these steps, the affine transformation parametersare refined iteratively until the number of inliers does notincrease anymore. Figure 9 shows an example with five iter-ations. The number of correspondences and inliers at eachiteration are shown in Table 1.
As it is evident from the example, the iterative processyields more correspondences, covering a larger area insidethe original and duplicated regions; this yields a more accu-rate affine transformation. It should be mentioned that the
threshold used for finding corresponding keypoints duringthe iterative process is greater than the one used in the initialstep. This allows finding more correspondences compared tothe initial stage.
3.4 Locating duplicated region
The last step of our algorithm attempts to accurately locatethe duplicated region. Cross-correlation has been used beforeto locate the duplicated region and verify similarity with theoriginal region [12]. In this study, we detect the duplicatedregion using dense MIFT features.
3.4.1 Dense MIFT feature extraction
To detect as many pixels as possible inside the duplicatedregion, we employ dense MIFT features. The key idea iscomputing a MIFT descriptor at each pixel location insidethe detection window instead of at the keypoint locationsonly. This is on contrast to traditional methods employingpixel correlation for finding the duplicated region. SinceMIFT descriptors can be matched more accurately than usingpixel correlation, the duplicated region can be detected moreprecisely. Other dense feature descriptors, such as LBP orWLD, could be employed at this stage. Using the estimated
123
Author's personal copy

458 M. Jaberi et al.
Fig. 10 Detection of original and duplicated regions using dense SIFTdescriptors
affine transformation, the correspondences between the orig-inal and forged regions can be computed for each pixel loca-tion. The similarity between corresponding locations is thencalculated using dense MIFT descriptors. Thresholding thedistance between corresponding MIFT descriptors can thenreveal the duplicated region. Figure 10 shows an exampleusing this process.
3.4.2 Hysteresis thresholding
Using a single threshold to determine the similarity betweencorresponding MIFT descriptors in the original and dupli-cated regions might compromise detection results. In thiswork, we have opted for using hysteresis thresholding [37],a process based on two thresholds, one low and one high,which takes into consideration spatial information. Hystere-sis thresholding has been used before in the context of edgedetection [37]. The high threshold is used to detect “strong”edges while the low threshold is used to fill in gaps between“strong” edges using “weak” edges. The key idea is to includeedge points whose strength exceeds the low threshold but arealso adjacent to “strong” edge points. In a similar manner,we use the high threshold to detect “strong” correspondingpixels, that is, corresponding pixels from the original andduplicated region having very similar MIFT descriptors (i.e.,very likely to belong to the duplicated region). Additionalpixels (i.e., “weak” pixels”) are detected if they are adjacentto “strong” pixels and the distance between the correspond-ing MIFT descriptors in the original and duplicated regionsexceeds the low threshold. In our experiments, the low thresh-old is chosen to be R times lower than the high one, where Ris a parameter.
3.4.3 Morphological operations
The output of the previous step is a group of pixels, whichmight still include holes or contain isolated pixels. To dealwith these issues, we apply morphological operations (i.e.,dilation and erosion) to remove small holes and eliminate
isolated pixels. These operations are applied separately on theimages obtained using the high and low thresholds describedin the previous section. Then, we simply combine the resultsto obtain the final duplicated region.
4 Experimental results
In this section, the performance of the proposed approach isanalyzed through a comprehensive set of experiments. Forcomparison purposes, we have also compared our methodwith the method of Pan and Lyu [12].
4.1 Dataset
To examine digital forgery detection methods, a dataset con-taining different types of forgery is required. In this study,we have used a realistic dataset, the CASIA tampered imagedetection evaluation database V2.0 (CASIA, 2010) [29].CASIA v2.0 includes samples of copy–move and copy–pastedigital forgeries applied in color images of different sizes,varying from 240 × 160 to 900 × 600. The tampered imageshave been generated by cutting-and-pasting image region(s).The image region(s) selected for duplication can be trans-formed before copying them by applying scaling, rotation,reflection, or distortion. The duplicated region can vary insize (e.g., small, medium, or large). The resulted image canbe post-processed (e.g., by applying blurring) in order tocreate the final tampered image. Information about the typeof transformations applied to generate a tampered image isencoded in its filename.
In this paper, we have only used images corresponding tocopy–move forgery. Since the dataset includes both the orig-inal and forged images, we have applied pixel subtractionfollowed by binary thresholding and morphological closingto extract the duplicated region (i.e., ground truth) for evalu-ating the accuracy of our method. We have also added a newflag to identify images where the duplicated region has under-gone mirror reflection. A sample of forged images and theground truth indicating the forged area is shown in Fig. 11.
4.2 Implementation details
As mentioned earlier, the first step of our approach is toextract a set of keypoint descriptors. In this study, we extractMIFT features; the window centered at keypoints is definedto be 15 × 15 pixels. Since our aim in his step is to findquite accurate correspondences, we use threshold equal to0.2 for comparing MIFT descriptors which gives less butmore accurate matches. If the number of correspondenceswas less than 10, then we increase the threshold to 0.3 withstep of 0.05. When removing incorrect matches using geo-metric constraints, we group corresponding points based on
123
Author's personal copy

Accurate and robust localization of duplicated region 459
Fig. 11 A sample of imagesand the ground truth in theCASIA dataset
their slope in 10 groups. In addition, to refine the affine trans-formation, the search windows are resized with a rate of 0.2(i.e., both horizontally and vertically) in each iteration. Inthis step, we match the MIFT descriptors using a thresholdequal to 0.3 in order to allow more matches to be found. Inhysteresis thresholding, the high threshold is defined to beR = 2 times smaller than the low one.1
To evaluate the performance of our method, we employprecision–recall (PR) curves [38]. Equations (1) and (2) showhow the precision and recall rates are calculated; TP repre-sents the number of true positives while FP represents thenumber of false positives. The number of pixels selectedincorrectly as non-duplicated represents the number of falsenegatives (FN).
Recall = TP/(TP + FN) (1)
Precision = TP/(TP + FP) (2)
4.3 Detailed results
As mentioned earlier, the CASIA dataset includes variousimages where operations have been applied on the copiedregion to generate the duplicated region. To better evaluatethe performance of our method, we have classified imagesinto different categories based on the size of the duplicatedregion and the operations used to create the forgery. Tables 2and 3 show the different categories and the number of imageswithin each category. We have evaluated our method on thecolored entries of the tables since the other entries contain avery small number of images. For each experiment, we reportthe average PR curves over all the images of the dataset.
1 Since in finding correspondences, a higher threshold yields a lowernumber of matches, we define the high and low values of hysteresisthresholding in opposite order compared to their definition in the liter-ature.
Table 2 Image categories when duplicated region size is medium
Operations Total
Translation Blurring 0
Translation Rotate 15
Translation Rotate Blurring 2
Translation Scale 30
Translation Scale Blurring 5
Translation Scale Rotate 17
Translation Scale Rotate Blurring 3
Translation Deform 3
Translation Deform Blurring 3
Translation Rotate Deform 2
Translation Rotate Deform Blurring 0
Translation Scale Deform 2
Translation Scale Deform Blurring 1
Translation Scale Rotate Deform 3
Translation Scale Rotate Deform Blurring 0
Translation Reflection 0
Translation Reflection Blurring 0
Translation Reflection Rotate 169
Translation Reflection Rotate Blurring 6
Translation Reflection Scale 9
Translation Reflection Scale Blurring 0
Translation Reflection Scale Rotate 48
Translation Reflection Scale Rotate Blurring 4
Translation Reflection Deform 1
Translation Reflection Deform Blurring 0
Translation Reflection Rotate Deform 2
Translation Reflection Rotate Deform Blurring 1
Translation Reflection Scale Deform 0
Translation Reflection Scale Deform Blurring 0
Translation Reflection Scale Rotate Deform 4
Translation Reflection Scale Rotate Deform Blurring 1
Sum 331
4.3.1 Effect of thresholding
First, we compare standard thresholding with hysteresisthresholding. Since the output of thresholding is a groupof pixels that might contain holes or isolated pixels, weapply morphological operations, as mentioned earlier, to
123
Author's personal copy

460 M. Jaberi et al.
Table 3 Image categories whenduplicated region size is small
Operations Total
Translation Blurring 0
Translation Rotate 168
Translation Rotate Blurring 22
Translation Scale 336
Translation Scale Blurring 60
Translation Scale Rotate 87
Translation Scale Rotate Blurring 8
Translation Deform 48
Translation Deform Blurring 8
Translation Rotate Deform 9
Translation Rotate Deform Blurring 3
Translation Scale Deform 48
Translation Scale Deform Blurring 33
Translation Scale Rotate Deform 19
Translation Scale Rotate Deform Blurring 4
Translation Reflection 0
Translation Reflection Blurring 0
Translation Reflection Rotate 50
Translation Reflection Rotate Blurring 6
Translation Reflection Scale 12
Translation Reflection Scale Blurring 3
Translation Reflection Scale Rotate 35
Translation Reflection Scale Rotate Blurring 2
Translation Reflection Deform 66
Translation Reflection Deform Blurring 16
Translation Reflection Rotate Deform 12
Translation Reflection Rotate Deform Blurring 2
Translation Reflection Scale Deform 20
Translation Reflection Scale Deform Blurring 11
Translation Reflection Scale Rotate Deform 6
Translation Reflection Scale Rotate Deform Blurring 4
Sum 1, 098
reduce false positives and negatives. Hysteresis threshold-ing includes a low and a high threshold which are appliedto threshold the distance between MIFT features; the resultsare then combined to make the final region. The morpholog-ical operations are applied prior to combining the results ofthe high and low thresholds. Figure 12 shows two examplescomparing standard with hysteresis thresholding. The dupli-cated regions have been produced using scaling in the topimage and reflection in the bottom image. Figure 13 showsthe corresponding PR curves. Clearly, hysteresis threshold-ing can locate the duplicated region more accurately. Addi-tional experiments are reported in Sect. 4.5.3.
4.3.2 Effect of scale and rotation
In this set of experiments, we have evaluated the proposedapproach assuming that the duplicated regions have been
created using rotation and/or scale transformations. We haveconsidered both medium and small size duplicated regions.
Scale or rotation Scale and rotation represent the simplestoperations for creating duplicated regions. Figure 14 showssome examples; as it can be observed, the duplicated regionshave been located quite accurately. Figures 15 and 16 showthe corresponding average PR curves; as the results indicate,the proposed method performs considerably better than themethod of [12].
Scale–rotation In this set of experiments, we consider thecase where both scale and rotation have been applied to cre-ate the image forgery. Figure 17 shows an example alongwith detection results for our method and the method of [12].Figure 18 shows the corresponding average PR curves; as the
123
Author's personal copy

Accurate and robust localization of duplicated region 461
Fig. 12 Comparison between standard and hysteresis thresholding
Fig. 13 Comparison between standard (single) and hysteresis thresh-olding
results indicate, the proposed method performs considerablybetter than the method of [12], especially when the size ofthe duplicated region is small.
4.3.3 Effect of reflection
As described earlier, mirror reflection is a common opera-tion used in copy–move image forgery. MIFT is robust tothe reflection. However, SIFT which was used in [12] isnot robust to reflection. To make SIFT robust to reflection,the feature vector of each keypoint is translated horizontallyand vertically before finding the similarities among the vec-tors. The accuracy of the proposed method and the methodof [12] are examined in this set of experiments assumingmedium and small duplicated region sizes as well as mirror
reflection, rotation and scale. Our results indicate that theaccuracy of proposed method is noticeably better than themethod of [12], especially when the duplication region sizeis small.
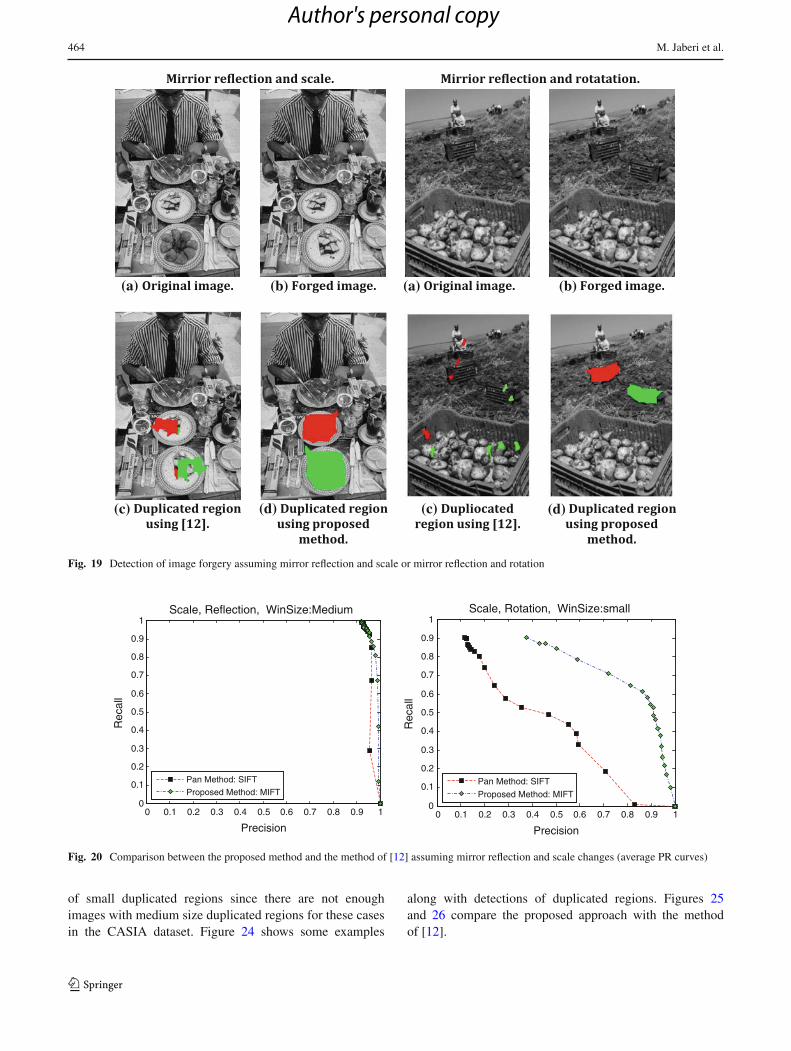
Reflection–scale and reflection–rotation In the first set ofexperiments, we considered the case of mirror reflection andscale in creating the image forgery, assuming both mediumand small duplication region sizes. In the second set of exper-iments, we considered the case of mirror reflection and rota-tion, assuming both medium and small duplication regionsizes. Some example images in these two categories areshown in Fig. 19.
The method of [12] uses SIFT features, which are notrobust to mirror reflection. As described earlier, to make theSIFT algorithm robust to mirror reflection, we find SIFT cor-respondences both in the original image as well as in its mir-ror reflected image (i.e., obtained by filliping the originalimage horizontally and vertically). The accuracy of the pro-posed method and the method of [12] are shown in Figs. 20and 21. For medium size regions, the two methods have simi-lar performance; however, the proposed method outperformsthe method of [12] for large size regions.
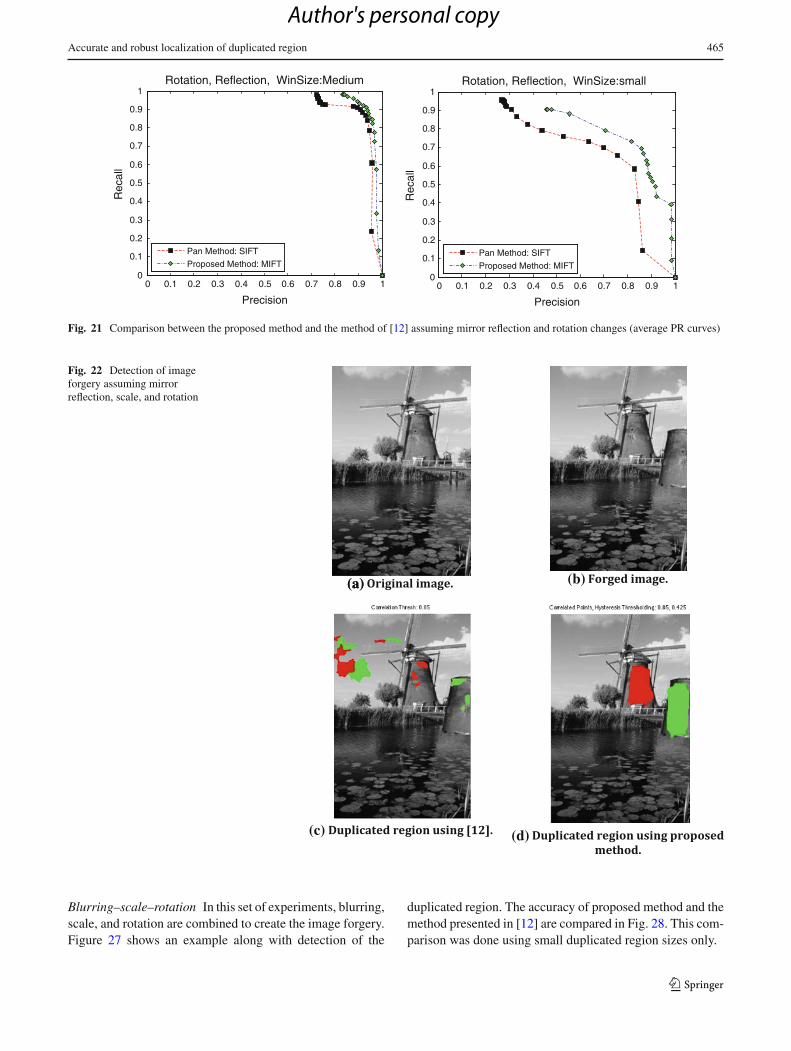
Reflection–scale–rotation Combining mirror reflection withscale and rotation to create the duplicated region is investi-gated next. Figure 22 shows an example along with detectionresults. The accuracy of proposed method and the method of[12] are compared in Fig. 23. The proposed method out-performs the method of [12], especially when the size of theduplicated region is small. When region size is medium, bothmethods perform about the same.
123
Author's personal copy

462 M. Jaberi et al.
(c) (d) (c) (d)
(a) (b) (a) (b)
Fig. 14 Detection of image forgery assuming scale or rotation
0 0.1 0.2 0.3 0.4 0.5 0.6 0.7 0.8 0.9 10
0.1
0.2
0.3
0.4
0.5
0.6
0.7
0.8
0.9
1
Rec
all
Precision
Scale, WinSize:Medium
Pan Method: SIFT
Proposed Method: MIFT
0 0.1 0.2 0.3 0.4 0.5 0.6 0.7 0.8 0.9 10
0.1
0.2
0.3
0.4
0.5
0.6
0.7
0.8
0.9
1
Rec
all
Precision
Scale, WinSize:small
Pan Method: SIFT
Proposed Method: MIFT
Fig. 15 Comparison between the proposed method and the method of [12] assuming scale differences (average PR curves)
4.3.4 Effect of blurring
Retouching the duplicated region is a common operation forremoving inconsistencies and hiding the forgery. To achievethis goal, blurring is used often. In the CASIA dataset, blur-ring has been applied either on the edges of the duplicated
region or on the whole region. This operation is typicallycombined with other operations such as scale and rotation.
Blurring–scale and blurring–rotation In this section, weconsider combining blurring with scale or with rotationfor creating the image forgery. We only consider the case
123
Author's personal copy

Accurate and robust localization of duplicated region 463
0 0.1 0.2 0.3 0.4 0.5 0.6 0.7 0.8 0.9 10
0.1
0.2
0.3
0.4
0.5
0.6
0.7
0.8
0.9
1
Rec
all
Precision
Rotation, WinSize:Medium
Pan Method: SIFT
Proposed Method: MIFT
0 0.1 0.2 0.3 0.4 0.5 0.6 0.7 0.8 0.9 10
0.1
0.2
0.3
0.4
0.5
0.6
0.7
0.8
0.9
1
Rec
all
Precision
Rotation, WinSize:small
Pan Method: SIFT
Proposed Method: MIFT
Fig. 16 Comparison between the proposed method and the method of [12] assuming rotation changes (average PR curves)
Fig. 17 Detection of imageforgery assuming both scaleand rotation
(c) (d)
(b)(a)
0 0.1 0.2 0.3 0.4 0.5 0.6 0.7 0.8 0.9 10
0.1
0.2
0.3
0.4
0.5
0.6
0.7
0.8
0.9
1
Rec
all
Precision
Scale, Rotation, WinSize:Medium
Pan Method: SIFT
Proposed Method: MIFT
0 0.1 0.2 0.3 0.4 0.5 0.6 0.7 0.8 0.9 10
0.1
0.2
0.3
0.4
0.5
0.6
0.7
0.8
0.9
1
Rec
all
Precision
Scale, Rotation, WinSize:small
Pan Method: SIFT
Proposed Method: MIFT
Fig. 18 Comparison between the proposed method and the method of [12] assuming scale and rotation changes (average PR curves)
123
Author's personal copy
464 M. Jaberi et al.
(a) (b) (a) (b)
(d)(c)(d)(c)
Fig. 19 Detection of image forgery assuming mirror reflection and scale or mirror reflection and rotation
0 0.1 0.2 0.3 0.4 0.5 0.6 0.7 0.8 0.9 10
0.1
0.2
0.3
0.4
0.5
0.6
0.7
0.8
0.9
1
Rec
all
Precision
Scale, Reflection, WinSize:Medium
Pan Method: SIFT
Proposed Method: MIFT
0 0.1 0.2 0.3 0.4 0.5 0.6 0.7 0.8 0.9 10
0.1
0.2
0.3
0.4
0.5
0.6
0.7
0.8
0.9
1
Rec
all
Precision
Scale, Rotation, WinSize:small
Pan Method: SIFT
Proposed Method: MIFT
Fig. 20 Comparison between the proposed method and the method of [12] assuming mirror reflection and scale changes (average PR curves)
of small duplicated regions since there are not enoughimages with medium size duplicated regions for these casesin the CASIA dataset. Figure 24 shows some examples
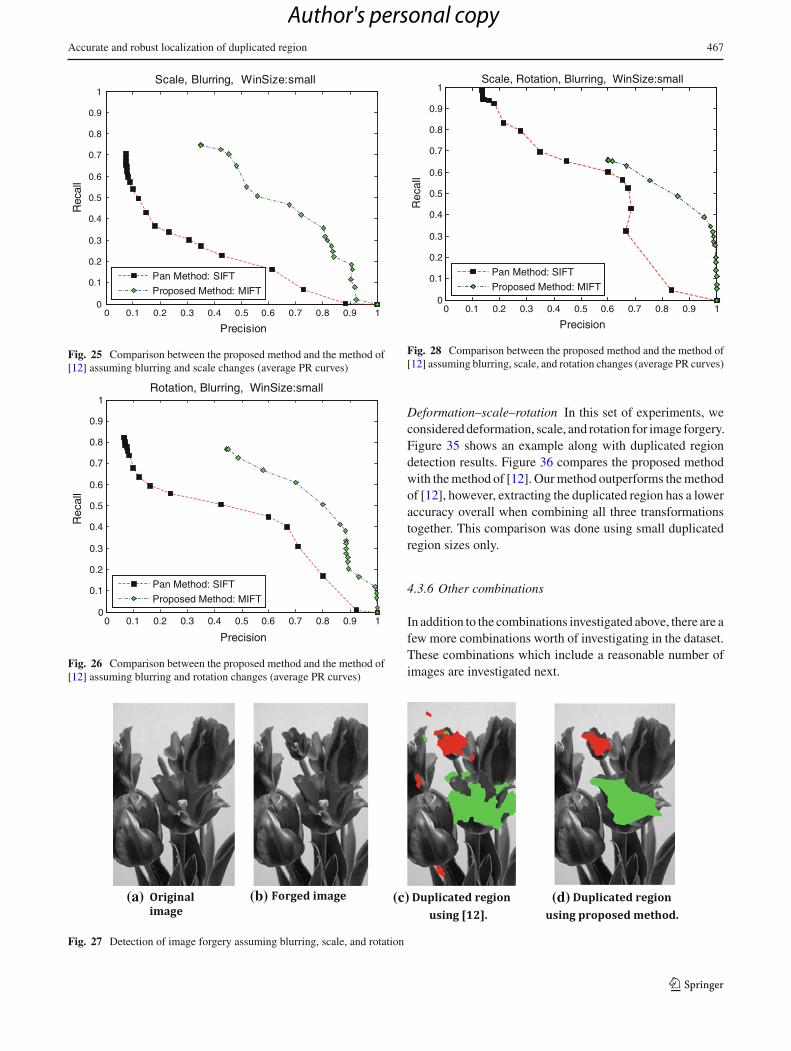
along with detections of duplicated regions. Figures 25and 26 compare the proposed approach with the methodof [12].
123
Author's personal copy
Accurate and robust localization of duplicated region 465
0 0.1 0.2 0.3 0.4 0.5 0.6 0.7 0.8 0.9 10
0.1
0.2
0.3
0.4
0.5
0.6
0.7
0.8
0.9
1
Rec
all
Precision
Rotation, Reflection, WinSize:Medium
Pan Method: SIFT
Proposed Method: MIFT
0 0.1 0.2 0.3 0.4 0.5 0.6 0.7 0.8 0.9 10
0.1
0.2
0.3
0.4
0.5
0.6
0.7
0.8
0.9
1
Rec
all
Precision
Rotation, Reflection, WinSize:small
Pan Method: SIFT
Proposed Method: MIFT
Fig. 21 Comparison between the proposed method and the method of [12] assuming mirror reflection and rotation changes (average PR curves)
Fig. 22 Detection of imageforgery assuming mirrorreflection, scale, and rotation
(a)(a) (b)
(c) (d)
Blurring–scale–rotation In this set of experiments, blurring,scale, and rotation are combined to create the image forgery.Figure 27 shows an example along with detection of the
duplicated region. The accuracy of proposed method and themethod presented in [12] are compared in Fig. 28. This com-parison was done using small duplicated region sizes only.
123
Author's personal copy

466 M. Jaberi et al.
0 0.1 0.2 0.3 0.4 0.5 0.6 0.7 0.8 0.9 10
0.1
0.2
0.3
0.4
0.5
0.6
0.7
0.8
0.9
1
Rec
all
Precision
Scale, Rotation, Reflection, WinSize:Medium
Pan Method: SIFT
Proposed Method: MIFT
0 0.1 0.2 0.3 0.4 0.5 0.6 0.7 0.8 0.9 10
0.1
0.2
0.3
0.4
0.5
0.6
0.7
0.8
0.9
1
Rec
all
Precision
Scale, Rotation, Reflection, WinSize:small
Pan Method: SIFT
Proposed Method: MIFT
Fig. 23 Comparison between the proposed method and the method of [12] assuming mirror reflection, scale, and rotation changes (average PRcurves)
(a) (b) (a) (b)
(c) (d) (c) (d)
Fig. 24 Detection of image forgery assuming blurring, scale, or rotation
4.3.5 Effect of deformation
Deformation is another operation applied on the images of theCASIA dataset. This operation is typically a non-linear trans-formation. As shown below, detecting this kind of forgery haslower accuracy than forgery detection in other categories.This is due to the fact that we employ a linear transfor-mation (e.g., affine) to bring similar regions into correspon-dence. Nevertheless, the proposed method still outperformsthe method of [12].
Deformation In this set of experiments, image forgery hasbeen created using deformation only. Figure 29 shows anexample along with duplicated region detection results.
Figure 30 compares the proposed method with the methodof [12]. This comparison was done using small duplicatedregion sizes only.
Deformation–scale and deformation–rotation In this cate-gory of experiments, image forgery was created using defor-mation and scale as well deformation and rotation. Figure 31shows an example of deformation and scale along with dupli-cated region detection results. Figure 33 shows an example ofdeformation and rotation along with duplicated region detec-tion results. Figures 32 and 34 compare the proposed methodwith the method of [12]. These comparisons were done usingsmall duplicated region sizes only.
123
Author's personal copy
Accurate and robust localization of duplicated region 467
0 0.1 0.2 0.3 0.4 0.5 0.6 0.7 0.8 0.9 10
0.1
0.2
0.3
0.4
0.5
0.6
0.7
0.8
0.9
1
Rec
all
Precision
Scale, Blurring, WinSize:small
Pan Method: SIFT
Proposed Method: MIFT
Fig. 25 Comparison between the proposed method and the method of[12] assuming blurring and scale changes (average PR curves)
0 0.1 0.2 0.3 0.4 0.5 0.6 0.7 0.8 0.9 10
0.1
0.2
0.3
0.4
0.5
0.6
0.7
0.8
0.9
1
Rec
all
Precision
Rotation, Blurring, WinSize:small
Pan Method: SIFT
Proposed Method: MIFT
Fig. 26 Comparison between the proposed method and the method of[12] assuming blurring and rotation changes (average PR curves)
0 0.1 0.2 0.3 0.4 0.5 0.6 0.7 0.8 0.9 10
0.1
0.2
0.3
0.4
0.5
0.6
0.7
0.8
0.9
1
Rec
all
Precision
Scale, Rotation, Blurring, WinSize:small
Pan Method: SIFT
Proposed Method: MIFT
Fig. 28 Comparison between the proposed method and the method of[12] assuming blurring, scale, and rotation changes (average PR curves)
Deformation–scale–rotation In this set of experiments, weconsidered deformation, scale, and rotation for image forgery.Figure 35 shows an example along with duplicated regiondetection results. Figure 36 compares the proposed methodwith the method of [12]. Our method outperforms the methodof [12], however, extracting the duplicated region has a loweraccuracy overall when combining all three transformationstogether. This comparison was done using small duplicatedregion sizes only.
4.3.6 Other combinations
In addition to the combinations investigated above, there are afew more combinations worth of investigating in the dataset.These combinations which include a reasonable number ofimages are investigated next.
(a) (b) (c) (d)
Fig. 27 Detection of image forgery assuming blurring, scale, and rotation
123
Author's personal copy

468 M. Jaberi et al.
Fig. 29 Detection of imageforgery assuming deformation
(a) (b)
(c) (d)
0 0.1 0.2 0.3 0.4 0.5 0.6 0.7 0.8 0.9 10
0.1
0.2
0.3
0.4
0.5
0.6
0.7
0.8
0.9
1
Rec
all
Precision
Deformation, WinSize:small
Pan Method: SIFT
Proposed Method: MIFT
Fig. 30 Comparison between the proposed method and the method of[12] assuming deformation changes (average PR curves)
Deformation–reflection–scale In this set of experiments, weconsider applying deformation, reflection, and scale togetherfor image forgery. Figure 37 shows an example along withduplicated region detection results. Figure 38 compares theproposed method with the method of [12]. Our method out-performs the method of [12]. This comparison was doneusing small duplicated region sizes only.
Deformation–reflection–rotation In this set of experiments,we consider deformation, reflection, and rotation for image
(a) (b)
(c) (d)
Fig. 31 Detection of image forgery assuming deformation and scale
123
Author's personal copy

Accurate and robust localization of duplicated region 469
0 0.1 0.2 0.3 0.4 0.5 0.6 0.7 0.8 0.9 10
0.1
0.2
0.3
0.4
0.5
0.6
0.7
0.8
0.9
1R
ecal
l
Precision
Scale, Deformation, WinSize:small
Pan Method: SIFT
Proposed Method: MIFT
Fig. 32 Comparison between the proposed method and the method of[12] assuming deformation and scale changes (average PR curves)
(a) (b)
(c)
Fig. 33 Detection of image forgery assuming deformation and rotation
forgery. Figure 39 shows an example along with duplicatedregion detection results. Figure 40 compares the proposedmethod with the method of [12]. This comparison was doneusing small duplicated region sizes only.
Deformation–reflection–blurring This category of imagescombines the deformation, reflection, and blurring trans-formations to make the forged images. Figure 41 showsan example along with duplicated region detection results.Figure 42 compares the proposed method with the methodof [12]. This comparison was done using small duplicatedregion sizes only.
0 0.1 0.2 0.3 0.4 0.5 0.6 0.7 0.8 0.9 10
0.1
0.2
0.3
0.4
0.5
0.6
0.7
0.8
0.9
1
Re
call
Precision
Rotation, Deformation, WinSize:small
Pan Method: SIFT
Proposed Method: MIFT
Fig. 34 Comparison between the proposed method and the method of[12] assuming deformation and rotation changes (average PR curves)
(a) (b)
(d)(c)
Fig. 35 Detection of image forgery assuming deformation, scale, androtation
4.4 F-measure
When computing recall and precision rates, it might be usefulto define a relative cost α between these quantities, whichfocuses attention to a specific point on the PR curve. TheF-measure [40], defined below, captures this tradeoff as theweighted harmonic mean of P and R.
F = P R/(a R + (1 − a)P)
The location of the maximum F-measure along the PR curveprovides the optimal detector threshold for the applicationgiven α. The higher the F-measure is, the better the methodperforms. Table 4 shows the F-measure for the experimentsreported in the previous section, assuming α = 0.5. As it canbe observed, the proposed method yields a higher F-measurethan the method of Pan [12] in all cases.
123
Author's personal copy

470 M. Jaberi et al.
0 0.1 0.2 0.3 0.4 0.5 0.6 0.7 0.8 0.9 10
0.1
0.2
0.3
0.4
0.5
0.6
0.7
0.8
0.9
1
Rec
all
Precision
Scale, Rotation, Deformation, WinSize:small
Pan Method: SIFT
Proposed Method: MIFT
Fig. 36 Comparison between the proposed method and the method of[12] assuming deformation, scale, and rotation changes (average PRcurves)
(a) (b)
(c) (d)
Fig. 37 Detection of image forgery assuming deformation, reflection,and scale
4.5 Effect of different algorithmic steps
In this section, we investigate the effect on performanceof different algorithmic steps of the proposed method. Inparticular, we investigate the effect of MIFT features, itera-tive affine refinements, and hysteresis thresholding. In theseexperiments, we have used the ‘Translation Reflection, Scale,Rotate’ category assuming both medium and small size offorged regions.
4.5.1 Effect of MIFT features
As mentioned earlier, to resolve the issue of mirror reflec-tion and find correspondences in duplicated regions, pervi-
0 0.1 0.2 0.3 0.4 0.5 0.6 0.7 0.8 0.9 10
0.1
0.2
0.3
0.4
0.5
0.6
0.7
0.8
0.9
1
Rec
all
Precision
Scale, Reflection, Deformation, WinSize:small
Pan Method: SIFT
Proposed Method: MIFT
Fig. 38 Comparison between the proposed method and the method of[12] assuming deformation, reflection, and scale changes (average PRcurves)
(c) (d)
(b)(a)
Fig. 39 Detection of image forgery assuming deformation, reflection,and rotation
ous methods [12] used SIFT descriptors extracted both fromhorizontally and vertically reflected versions of the originalimage. However, MIFT descriptors are invariant to mirrorreflection transformations. To evaluate the effect of usingMIFT features, we have performed experiments comparingMIFT with SIFT features assuming that all other steps are
123
Author's personal copy

Accurate and robust localization of duplicated region 471
0 0.1 0.2 0.3 0.4 0.5 0.6 0.7 0.8 0.9 10
0.1
0.2
0.3
0.4
0.5
0.6
0.7
0.8
0.9
1
Rec
all
Precision
Rotation, Reflection, Deformation, WinSize:small
Pan Method: SIFT
Proposed Method: MIFT
Fig. 40 Comparison between the proposed method and the method of[12] assuming deformation, reflection, and rotation changes (averagePR curves)
(a) (b)
(d)(c)
Fig. 41 Detection of image forgery assuming deformation, reflection,and blurring
the same. Figure 43 shows the average PR curves for eachcase. As it can be observed, the performance using MIFT fea-tures does not degrade performance; on the contrary, thereis a slight performance improvement using MIFT features.
0 0.1 0.2 0.3 0.4 0.5 0.6 0.7 0.8 0.9 10
0.1
0.2
0.3
0.4
0.5
0.6
0.7
0.8
0.9
1
Rec
all
Precision
Reflection, Deformation, Blurring, WinSize:small
Pan Method: SIFT
Proposed Method: MIFT
Fig. 42 Comparison between the proposed method and the method of[12] assuming deformation, reflection, and blurring changes (averagePR curves)
Moreover, Table 5 shows that MIFT features have lower aver-age time requirements compared to SIFT features.
4.5.2 Effect of iterative affine refinements
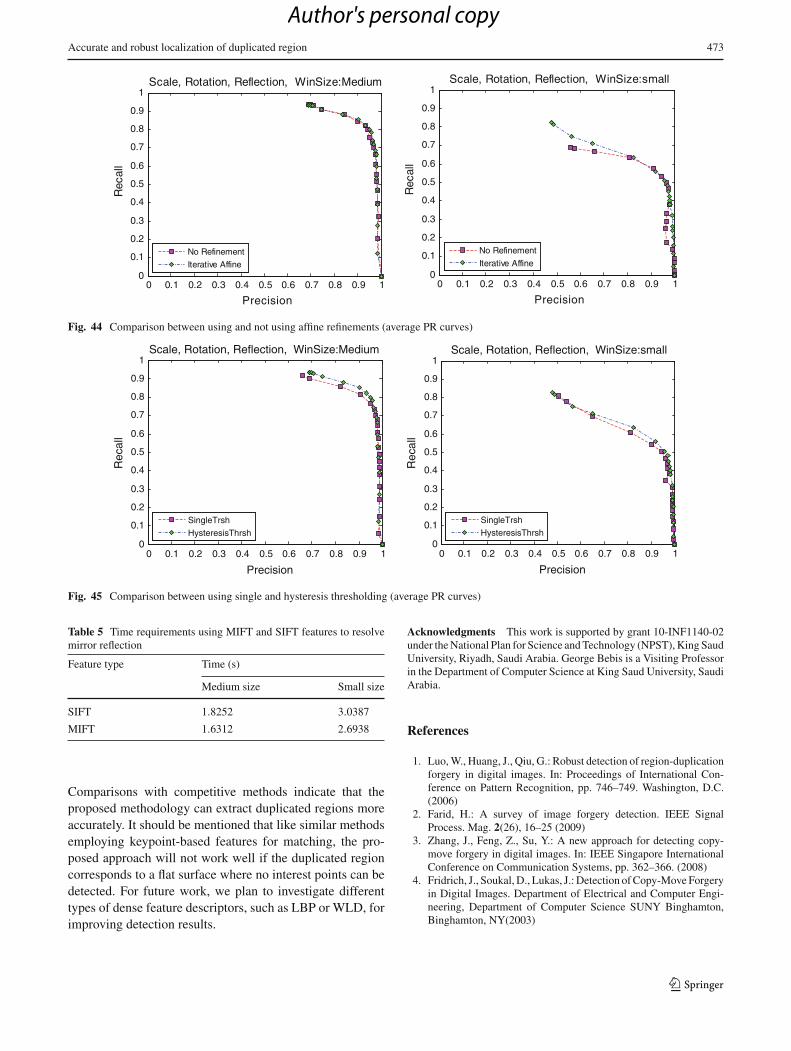
As discussed in Sect. 3.3, we iteratively refine the parametersof the affine transformation which is estimated using MIFTmatches and RANSAC for removing outliers. In addition torefining the affine transformation parameters, we also deter-mine the size of the search window both for the copy andmoved regions. In this experiment, we examine the effect ofrefining the affine transformation parameters. For this, wecompare the performance of the method with and withoutusing affine refinements. Figure 44 shows the average PRcurves for each case. As it can be observed, affine refinementsimprove performance in the case of small-size regions.
4.5.3 Effect of hysteresis thresholding
We have already illustrated the effect of hysteresis threshold-ing in Sect. 4.3.1. For completeness purposes, we have alsotested the effect of hysteresis thresholding on the ‘Trans-lation Reflection, Scale, Rotate’ category. Figure 45 showsthe average PR curves; clearly, hysteresis thresholding canlocate the duplicated region more accurately than using sin-gle thresholding.
5 Conclusions
In this paper, we have considered the problem of copy–moveimage forgery detection. Our emphasis was on detecting
123
Author's personal copy

472 M. Jaberi et al.
Table 4 F-measure for the different datasets used in our experiments
Transformations Datasets
Proposed method Pan’s method
Medium size Small size Medium size Small size
Effect of scale and rotation Scale 0.7969 0.6834 0.6412 0.5572
Rotation 0.7831 0.6634 0.6384 0.4369
Scale Rotation 0.7299 0.7217 0.6115 0.4893
Effect of reflection Scale Reflection 0.9576 0.8127 0.9569 0.5987
Rotation Reflection 0.9063 0.7735 0.8792 0.7042
Scale Rotation Reflection 0.8766 0.7206 0.7699 0.5293
Effect of blurring Scale Blurring − 0.5534 − 0.3061
Rotation Blurring − 0.6522 − 0.5139
Scale Rotation Blurring − 0.6494 − 0.3597
Effect of deformation Deformation − 0.4451 − 0.2506
Scale Deformation − 0.4917 − 0.1937
Rotation Deformation − 0.4490 − 0.1747
Scale Rotation Deformation − 0.3436 − 0.1728
Other combinations Deformation Blurring − 0.4009 − 0.1957
Scale Deformation Blurring − 0.3433 − 0.1421
Reflection Deformation − 0.6022 − 0.4589
Reflection Deformation Blurring − 0.7060 − 0.5115
Rotation Reflection Deformation − 0.6407 − 0.4622
Scale Reflection Deformation − 0.6458 − 0.4977
0 0.1 0.2 0.3 0.4 0.5 0.6 0.7 0.8 0.9 10
0.1
0.2
0.3
0.4
0.5
0.6
0.7
0.8
0.9
1
Rec
all
Precision
Scale, Rotation, Reflection, WinSize:Medium
Proposed Method: SIFT
Proposed Method: MIFT
0 0.1 0.2 0.3 0.4 0.5 0.6 0.7 0.8 0.9 10
0.1
0.2
0.3
0.4
0.5
0.6
0.7
0.8
0.9
1
Rec
all
Precision
Scale, Rotation, Reflection, WinSize:small
Proposed Method: SIFT
Proposed Method: MIFT
Fig. 43 Comparison between MIFT and SIFT features to resolve mirror reflection (average PR curves)
and extracting duplicated regions with higher accuracy androbustness. The proposed methodology employs a new setof keypoint-based features, called MIFT, for finding similarregions in an image. To estimate the affine transformationbetween similar regions more accurately, we have proposedan iterative scheme which refines the affine transformationparameter by finding more keypoint matches incrementally.To reduce false positives and negatives when extracting theduplicated region, we have proposed using dense MIFTfeatures in conjunction with hysteresis thresholding and
morphological operations. We have performed comprehen-sive experiments using a large dataset of real images toevaluate the proposed approach. In particular, we have inves-tigated the effect of different transformations in creating theimage forgery on detection accuracy. Among all transfor-mation considered, blurring and deformation affect detec-tion results most. Obviously, blurring affects the accuracy ofmatching keypoint-based features while deformation cannotbe modeled well by the affine transformation model beingused here for bringing similar regions into correspondence.
123
Author's personal copy
Accurate and robust localization of duplicated region 473
0 0.1 0.2 0.3 0.4 0.5 0.6 0.7 0.8 0.9 10
0.1
0.2
0.3
0.4
0.5
0.6
0.7
0.8
0.9
1
Rec
all
Precision
Scale, Rotation, Reflection, WinSize:Medium
No Refinement
Iterative Affine
0 0.1 0.2 0.3 0.4 0.5 0.6 0.7 0.8 0.9 10
0.1
0.2
0.3
0.4
0.5
0.6
0.7
0.8
0.9
1
Rec
all
Precision
Scale, Rotation, Reflection, WinSize:small
No Refinement
Iterative Affine
Fig. 44 Comparison between using and not using affine refinements (average PR curves)
0 0.1 0.2 0.3 0.4 0.5 0.6 0.7 0.8 0.9 10
0.1
0.2
0.3
0.4
0.5
0.6
0.7
0.8
0.9
1
Rec
all
Precision
Scale, Rotation, Reflection, WinSize:Medium
SingleTrsh
HysteresisThrsh
0 0.1 0.2 0.3 0.4 0.5 0.6 0.7 0.8 0.9 10
0.1
0.2
0.3
0.4
0.5
0.6
0.7
0.8
0.9
1
Rec
all
Precision
Scale, Rotation, Reflection, WinSize:small
SingleTrsh
HysteresisThrsh
Fig. 45 Comparison between using single and hysteresis thresholding (average PR curves)
Table 5 Time requirements using MIFT and SIFT features to resolvemirror reflection
Feature type Time (s)
Medium size Small size
SIFT 1.8252 3.0387
MIFT 1.6312 2.6938
Comparisons with competitive methods indicate that theproposed methodology can extract duplicated regions moreaccurately. It should be mentioned that like similar methodsemploying keypoint-based features for matching, the pro-posed approach will not work well if the duplicated regioncorresponds to a flat surface where no interest points can bedetected. For future work, we plan to investigate differenttypes of dense feature descriptors, such as LBP or WLD, forimproving detection results.
Acknowledgments This work is supported by grant 10-INF1140-02under the National Plan for Science and Technology (NPST), King SaudUniversity, Riyadh, Saudi Arabia. George Bebis is a Visiting Professorin the Department of Computer Science at King Saud University, SaudiArabia.
References
1. Luo, W., Huang, J., Qiu, G.: Robust detection of region-duplicationforgery in digital images. In: Proceedings of International Con-ference on Pattern Recognition, pp. 746–749. Washington, D.C.(2006)
2. Farid, H.: A survey of image forgery detection. IEEE SignalProcess. Mag. 2(26), 16–25 (2009)
3. Zhang, J., Feng, Z., Su, Y.: A new approach for detecting copy-move forgery in digital images. In: IEEE Singapore InternationalConference on Communication Systems, pp. 362–366. (2008)
4. Fridrich, J., Soukal, D., Lukas, J.: Detection of Copy-Move Forgeryin Digital Images. Department of Electrical and Computer Engi-neering, Department of Computer Science SUNY Binghamton,Binghamton, NY(2003)
123
Author's personal copy

474 M. Jaberi et al.
5. Popescu, A.C., Farid, H.: Exposing digital forgeries by detectingduplicated image regions. In: Technical Report TR2004-515, Dart-mouth College, August (2004)
6. Lin, Z., Wang, R., Tang, X., Shum, H.-V.: Detecting doctoredimages using camera response normality and consistency. In: Pro-ceedings of Computer Vision and Pattern Recognition. San Diego,CA, (2005)
7. Mahdian, B., Saic, S.: Detection of copy move forgery using amethod based on blur moment invariants. Forensic Sci. Int. 171,180–189 (2007)
8. Li, G., Wu, Q., Tu, D., Sun, S.: A sorted neighborhood approachfor detecting duplicated regions in image forgeries based on DWTand SVD. In: IEEE International Conference on Multimedia andExpo, pp. 1750–1753. Beijing, China (2007)
9. Khan, S., Kulkarni, A.: An efficient method for detection of copy-move forgery using discrete wavelet transform. Int. J. Comput. Sci.Eng. (IJCSE) 2(5), 1801–1806 (2010)
10. Muhammad, G., Hussain, M., Khawaji, K., Bebis, G.: Blindcopy move image forgery detection using dyadic uncedimatedwavelet transfor. In: 17th International Conference on Digital Sig-nal Processing. Corfu, Greece, July (2011)
11. Huang, H., Guo, W., Zhang, Y.: Detection of copy-move forgeryin digital images using SIFT algorithm. In: IEEE Pacific-AsiaWorkshop on Computational Intelligence and Industrial Applica-tion (2008)
12. Pan, X., Lyu, S.: Region duplication detection using image featurematching. IEEE Trans. Inf. Forensics Secur. 5(4), 857–867 (2010)
13. Amerini, I., Ballan, L., Caldelli, R., Del Bimbo, A., Serra, G.:A SIFT-based forensic method for copy-move attack detection andtransformation recovery. IEEE Trans. Inf. Forensics Secur. 6(3),1099–1110 (Jun. 2011)
14. Lowe, D.G.: Distinctive image features from scale-invariant key-points. IJCV 60(2), 91–110 (2004)
15. Mikolajczyk, K., Schmid, C.: Indexing based on scale invariantinterest points. In: Proceedings of Eighth International Conferenceon Computer Vision, pp. 525–531. (2001)
16. Mikolajczyk, K., Schmid, C.: A performance evaluation of localdescriptors. IEEE Trans. Pattern Anal. Mach. Intell. 27(10), 1615–1630 (2005)
17. Chen, J., Shan, S., He, C., Zhao, G., Pietikainen, M., Chen, X., Gao,W.: WLD: a robust local image descriptor. IEEE Trans. PatternAnal. Mach. Intell 32, 1705–1720 (2010)
18. Moreels, P., Perona, P.: Evaluation of features detectors anddescriptors based on 3D objects. Int. J. Comput. Vis. 73(3), 800–807 (2007)
19. Dalal, N., Triggs, B.: Histograms of oriented gradients for humandetection. In: Computer Vision and Pattern Recognition. SanDiego, CA, June 20–25 (2005)
20. Guo, X., Cao, X., Zhang, J., Li, X.: Mift: A mirror reflection invari-ant feature descriptor. In: Proceedings of ACCV (2009)
21. Ojala, T., PietikaÈinen, M., Harwood, D.: A comparative study oftexture measures with classification based on feature distributions.Pattern Recognit. 29, 51–59 (1996)
22. Chung, Y.C., Tony, H.X., He, Z.: Building recognition using sketch-based representations and spectral graph matching. In: IEEE Inter-national Conference on Computer Vision (ICCV 2009), Kyoto
23. Ke, Y., Sukthankar, R.: PCA-SIFT: A More Distinctive Represen-tation for Local Image Descriptors. CVPR, Washington, DC (2004)
24. Mahdian, B., Siac, S.: A bibliography on blind methods for identi-fying image forgery. In: Signal Processing: Image Communication,pp. 389–399. (2010)
25. Kumar, S., Das, P.K.: Copy-move forgery detection in digitalimages: progress and challenges. Int. J. Comput. Sci. Eng. 3(2),652–663 (February 2011)
26. Fischler, M.A., Bolles, R.C.: Random sample consensus: a par-adigm for model fitting with applications to image analysis andautomated cartography. Commun. ACM 24, 381–395 (1981)
27. Raguram, R., Frahm, M., Pollefeys, M.: A comparative analysis ofRANSAC techniques leading to adaptive real-time random sampleconsensus. In: ECCV 2008, Part II, LNCS, vol. 5305, pp. 500–503.Springer, Heidelberg (2008)
28. Provost, F., Fawcett, T., Kohavi, R.: The case against accuracyestimation for comparing induction algorithms. In: Proceeding ofthe 15th International Conference on Machine Learning, pp. 445–453. Morgan Kaufmann, San Francisco (1998)
29. CASIA Image Tampering Detection Evaluation Database, ver. 2.0.http://forensics.idealtest.org. (2010)
30. Granty, R., Aditya, T., Madhu, S.: Survey on passive methodsof image tampering detection. In: 2010 International Conferenceon Communication and Computational Intelligence (INCOCCI),Dec., pp. 431–436. (2010)
31. Vedaldi, A., Fulkerson, B.: An Open and Portable Library of Com-puter Vision Algorithms. http://www.vlfeat.org/. (2008)
32. Beis, J., Lowe, D.G.: Shape indexing using approximate nearest-neighbor search in high-dimensional spaces. In: Conference onComputer Vision and Pattern Recognition, Puerto Rico, pp. 1000–1006. (1997)
33. Ojala, T., Pietikainen, M., Maenpaa, T.: Multiresolution gray-scaleand rotation invariant texture classification with local binary pat-terns. IEEE Trans. Pattern Anal. Mach. Intell. 24(7), 971–987(2002)
34. Huang, D., Shan, C., Ardabilian, M., Wang, Y., Chen, L.: Localbinary patterns and its application to facial image analysis: a survey.IEEE Trans. Syst. Man Cybern. Part C Appl. Rev. 41(6), 765–781(2011)
35. Lazebnik, S., Schmid, C., Ponce, J.: A sparse texture representationusing local affine regions. In: Technical Report CVR-TR-2004-01,Beckman Institute, University of Illinois (2004)
36. Bay, H., Tuytelaars, T., Van Gool, L.: SURF: speeded up robust fea-tures. In: European Computer Vision Conference (ECCV) (2006)
37. Canny, J.: A computational approach to edge detection. IEEE TransPattern Anal. Mach. Intell. 8(6), 679–698 (1986)
38. Powers, D.M.W.: Evaluation: from precision, recall and f-factorto roc, informedness, markedness & correlation. J. Mach. Learn.Technol. 2(1), 37–63 (2011)
39. Muhammad, G., Hussain, M., Bebis, G.: Passive copy move imageforgery detection using undecimated dyadic wavelet transform.Digital Investig. 9, 49–57 (2012)
40. Martin, D., Fowlkes, C., Malik, J.: Learning to detect natural imageboundaries using local brightness, color and texture cues. IEEETrans. Pattern Anal. Mach. Intell. 26(5), 530–549 (2004)
Author Biographies
Maryam Jaberi holds a B.S. degree in Software Engineering fromTarbiat Moallem University of Tehran, Iran (2004), an M.S. degree inComputer Engineering from AmirKabir University of Technolology,Iran (2007), and an M.S. degree in Computer Science and Engineeringfrom the University of Nevada, Reno (2012). Currently, she is a Ph.D.student in the Department of Electrical Engineering and Computer Sci-ence at the University of Central Florida, Orlando. Her research interestsinclude Computer Vision and Image Processing, Machine Learning,Knowledge Discovery and Data Mining.
George Bebis received a B.S. degree in mathematics and a M.S.degree in computer science from the University of Crete, Greece,in 1987 and 1991, respectively, and a Ph.D. degree in electrical and
123
Author's personal copy

Accurate and robust localization of duplicated region 475
computer engineering from the University of Central Florida, Orlando,in 1996. Currently, he is a Professor in the Department of ComputerScience and Engineering at the University of Nevada, Reno (UNR),Director of the UNR Computer Vision Laboratory (CVL), and Visit-ing Professor at King Saud University. Prior to joining UNR, he wasa Visiting Assistant Professor in the Department of Mathematics andComputer Science at the University of Missouri-St. Louis (UMSL).His research interests include computer vision, image processing, pat-tern recognition, machine learning, and evolutionary computing. Hisresearch has been funded by NSF, NASA, ONR, NIJ, and Ford MotorCompany. Dr. Bebis is an Associate Editor of the Machine Vision andApplications journal and serves in the editorial boards of the Interna-tional Journal on Artificial Intelligence Tools and the Computer Meth-ods in Biomechanics and Biomedical Engineering: Imaging and Visu-alization journal. He has served in the program committees of variousnational and international conferences and has organized and chairedseveral conference sessions. In 2002, he received the Lemelson Awardfor Innovation and Entrepreneurship.
Muhammad Hussain is an Associate Professor in the Department ofComputer Science, King Saud University, Saudi Arabia. He received
both his M.Sc. and M.Phil., from the University of the Punjab, Lahore,Pakistan, in 1990 and 1993, respectively. In 2003, he received a Ph.D.in Computer Science, specializing in Computer Graphics from KyushuUniversity, Fukuoka, Japan. He worked as a researcher at Japan Scienceand Technology Agency from April 2003 to September 2005. In Sep-tember 2005, he joined King Saud University as an Assistant Professor.He worked on a number of funded projects in Kyushu University, Japanand King Saud University, Saudi Arabia. His current research interestsinclude multiresolution techniques in Computer Graphics and ImageProcessing.
Ghulam Muhammad received his Bachelor degree in Computer Sci-ence and Engineering from Bangladesh University of Engineering andTechnology in 1997, and M.E. and Ph.D. degrees in 2003 and 2006,respectively, from Toyohashi University of Technology, Japan. Afterserving as a JSPS (Japan Society for the Promotion of Science) fellow,he joined as a faculty member in the College of Computer and Infor-mation Sciences at King Saud University, Saudi Arabia. His researchinterests include digital signal processing, automatic speech recogni-tion, and multimedia forensics.
123
Author's personal copy
Related Documents