This PDF is a selection from a published volume from the National Bureau of Economic Research Volume Title: Hard-to-Measure Goods and Services: Essays in Honor of Zvi Griliches Volume Author/Editor: Ernst R. Berndt and Charles R. Hulten, editors Volume Publisher: University of Chicago Press Volume ISBN: 0-226-04449-1; 978-0-226-04449-1 Volume URL: http://www.nber.org/books/bern07-1 Conference Date: September 19-20, 2003 Publication Date: October 2007 Title: Computer Input, Computer Networks, and Productivity Author: B. K. Atrostic, Sang Nguyen URL: http://www.nber.org/chapters/c0884

Welcome message from author
This document is posted to help you gain knowledge. Please leave a comment to let me know what you think about it! Share it to your friends and learn new things together.
Transcript

This PDF is a selection from a published volume from theNational Bureau of Economic Research
Volume Title: Hard-to-Measure Goods and Services: Essaysin Honor of Zvi Griliches
Volume Author/Editor: Ernst R. Berndt and Charles R. Hulten,editors
Volume Publisher: University of Chicago Press
Volume ISBN: 0-226-04449-1; 978-0-226-04449-1
Volume URL: http://www.nber.org/books/bern07-1
Conference Date: September 19-20, 2003
Publication Date: October 2007
Title: Computer Input, Computer Networks, and Productivity
Author: B. K. Atrostic, Sang Nguyen
URL: http://www.nber.org/chapters/c0884
383
13.1 Introduction
Computer networks may be a new technology that shifts the productionfunction. Our previous research (Atrostic and Nguyen 2005) found a pos-itive and significant relationship between computer networks and laborproductivity in U.S. manufacturing, using the first survey data on the pres-ence of computer networks in manufacturing plants, collected in the 1999Computer Network Use Survey (CNUS). We controlled for other inputs toproduction, plant characteristics, and the endogeneity of computer net-works. However, because no data to proxy for the capital stocks of com-puters were available, our previous estimate of the relationship betweencomputer networks and plants’ labor productivity may be subject to anomitted variable bias.
This paper extends our previous model to include computer capital as aseparate input in the production function. We use new plant-level dataon computer investment from the 2000 Annual Survey of Manufactures(ASM) to develop a proxy for computer capital input. An important con-
13Computer Input, ComputerNetworks, and Productivity
B. K. Atrostic and Sang Nguyen
B. K. Atrostic is a senior economist at the Center for Economic Studies at the U.S. CensusBureau. Sang Nguyen is a senior economist at the Center for Economic Studies at the U.S.Census Bureau.
This paper reports the results of research and analysis undertaken by the authors. It has un-dergone a more limited review than official publications. Opinions expressed are those of theauthors and do not necessarily represent the official position of the U.S. Census Bureau. Thisreport is distributed to inform interested parties of research and to encourage discussion.
We have benefited from comments by Randy Becker and Jack Triplett; Mark Roberts, theeditors, and other participants at the NBER Conference on Research in Income and Wealthon Hard-to-Measure Goods and Services: Essays in Memory of Zvi Griliches; seminar par-ticipants at the National Institute for Social and Economic Research, London, England,March 2004; and the referees; but all errors are, of course, the authors’ own.

tribution of this paper is to define the sample for which the measures ofcomputer and conventional physical capital available in the data—com-puter investment and book value—are good proxies for these inputs. Weshow that these measures are good proxies only for plants that are new. Fornew plants, computer investment should equal the value of the plant’s com-puter stock, and book values of buildings and machinery equal the valueof the plant’s physical capital stock.
We create a sample of new plants with the best proxies possible with theavailable data. Using this sample, we find positive and significant relation-ships between labor productivity and both computer networks and com-puter capital inputs. Our findings suggest that understanding the relation-ship between computers and productivity requires measures of howbusinesses use computers.
13.2 Computers, Computer Networks, and Productivity:Measurement Issues
Estimating plant-level relationships among computers, computer net-works, and productivity requires overcoming many empirical challenges.Researchers must address the substantial standard measurement issuesthat arise in using plant-level data (see Griliches 1994; Griliches andMairesse 1995). Serious data gaps specific to the quest to understand theeconomic role of computers, electronic devices, and computer networksplague the resulting empirical literature on computers and productivity(see, for example, Atrostic, Gates, and Jarmin 2000; Haltiwanger and Jar-min 2000). These gaps likely contribute to its divergent findings on data is-sues (Stiroh 2004). In this section, we focus on three specific measurementissues—measuring capital inputs in general, measuring computer inputs,and defining a sample with good measures of both—and on using thatsample to estimate the relationship between computer networks and pro-ductivity.
13.2.1 Measuring Capital Input
Our productivity model requires a measure of capital inputs or capitalservices. Such a measure, or the data needed to create it, is hard to get di-rectly. Researchers have developed ways to use the information that is typ-ically available to create proxies for capital inputs that are widely used inboth time series and cross-section analyses. However, our data lack the in-formation needed to create these standard proxies.
For time series analysis, a measure of capital services can be generatedfrom information on the capital stock. The perpetual inventory methodusually builds the capital measure up from data on capital investments, de-preciation, and asset prices. That is, Kt � K0 � Σ �K � (� � 0, . . . , � – 1),where �K � � (It – Dt) /Pt and I, D, and P denote capital investments, depre-
384 B. K. Atrostic and Sang Nguyen
ciation, and asset prices. A problem with the perpetual inventory method,especially at the plant level, is the lack of plant-level data on depreciationand asset prices.
An alternative method uses the book value of capital as a proxy for thecapital stock. An advantage of this approach is that book values are fre-quently collected directly from respondents. A major shortcoming of bookvalues is that they are evaluated at the purchase prices, regardless of whenthe capital good was bought. Book values therefore reflect the true value ofcapital stocks only for special cases.1
The plant-level study by Baily, Hulten, and Campbell (1992) finds thatboth perpetual inventory and book value measures lead to similar empiri-cal results for topics such as productivity dispersion. Doms (1996) alsofinds that book values and service flows measures yield similar results fora specific set of advanced technologies. Because of these empirical regu-larities, many researchers using plant-level data (e.g., Doms, Dunne, andTroske 1997; McGuckin, Streitwieser, and Doms 1998; Dunne et al. 2000;Greenan, Mairesse, and Topiol-Bensaid 2001) use the book values of theplant’s total capital stock directly as a proxy for service flows. Stiroh’s re-cent analysis (2004) also finds little empirical difference between the twomeasures.
For cross-section analysis, it is often impossible to construct a measureof capital services using the perpetual inventory method because the nec-essary time series of capital investment data are not available. Empiricalcross-section studies often use book values of the capital stock as a proxyfor capital services. Using book values requires assuming capital input isproportional to book values. This assumption may be correct if all plantsin the sample have the same age. But this is not likely to be the case. Be-cause book values are evaluated at the purchase price and plants in thesample differ in ages, book values of capital seriously mismeasure theplant’s capital inputs.
Data gaps for recent years make it more difficult to use either perpetualinventory or book value measures of capital (see table 13A.1). Book valuesof physical capital (buildings and machinery) are now collected less fre-quently in U.S. manufacturing and for a smaller group of plants. Book val-ues were collected annually in both the Census of Manufactures (CM) andASM until 1986. Since then, these data are collected only in the EconomicCensus years (e.g., 1987, 1992, and 1997), and are collected only for theplants that are in the ASM sample in those years. The ASM sample isroughly 55,000 plants, far smaller than the roughly 350,000 plants in the1997 CM (U.S. Census Bureau 2001).
Computer Input, Computer Networks, and Productivity 385
1. To alleviate this problem, researchers often use plant ages and other plant characteristicsas controls in their regression models when using book values as a proxy for capital inputs.
13.2.2 Measuring Computer Input
Computers should be treated as a separate input in production and pro-ductivity analysis, as suggested by studies such as Jorgenson and Stiroh(2000) and Oliner and Sichel (2000). Computer services are the theoreti-cally appropriate measure of computer input. Computer services, likeother capital services, are not observed, and measures approximating thisservice flow must be constructed. Computer service flows are normally es-timated from measures of the computer capital stock in aggregate andindustry-level productivity studies (e.g., Jorgenson, Ho, and Stiroh 2005;Triplett and Bosworth 2003). However, book values of computer capitalare not collected in government data, so studies using plant-level data of-ten approximate computer service flows with measures of computer in-vestment.
Investment has been used as a measure of the presence of computers, orof computer intensity, or as a measure of the intensity of technology use inmany recent plant-level studies. Computer investment is used as a proxyfor computer input in the plant in Berman, Bound, and Griliches (1994).Doms, Dunne, and Troske (1997) control for computer investment in theiranalysis of how adopting various technologies affects a series of plant-leveleconomic outcomes. Dunne et al. (2000) examine the role of computer in-vestment in the dispersion of productivity and wages in U.S. manufactur-ing. Haltiwanger, Jarmin, and Schank (2003) use computer investment asa factor separate from total equipment investment in estimating produc-tivity.
Computer investment is a good proxy for computer capital stock underthe assumption that this investment is equal or proportional to a plant’sstock of computer capital. This assumption allows researchers to use theonly measure at hand. However, it may not be correct. Total plant-level in-vestment typically is lumpy, while service flows are not. Cooper, Halti-wanger, and Power (1999) find that plant-level investment surges are fol-lowed by periods of low investment. Becker et al. (2004) look at morerecent data and find investment spikes in both firm- and plant-level data forinvestment in general. Recent research by Wilson (2004) suggests that firm-level investment may be lumpy across specific kinds of investment, includ-ing computers and communications equipment. However, this result isbased on the single available cross section of detailed investment data, sothe lumpiness of investment can only be defined in terms of the share of afirm’s investment in specific kinds of capital goods, rather than variationover time in the amount and kind of investment.
Actual investment to make computers usable in the workplace (coinven-tion) may be less lumpy than measured computer equipment investment.Coinvention includes expenditures developing and implementing softwarethat engages and connects computers and adapts them to plant-specific
386 B. K. Atrostic and Sang Nguyen

uses, for example, Bresnahan and Greenstein (1997), as well as changes inworkplace organization, management, and other organizational capitalthat make more effective use of computers, labor, and other inputs, for ex-ample, Brynjolfsson and Hitt (2003). Some of these expenditures may becapitalized, but others may be expensed. Coinvention may continue in pe-riods when there is no investment in computer hardware and software. Be-cause the scale of coinvention over the life of the computer asset can be asmuch as the original computer equipment investment (Bresnahan andGreenstein 1997), or up to ten times the investment in computer hardware(Brynjolfsson and Hitt 2003), the joint effect may be to smooth or exacer-bate investment lumpiness. These unmeasured complementary computerinvestments may cause estimated returns to measured computer invest-ments to exceed actual returns to measured computer investments, partic-ularly in the long run (e.g., Brynjolfsson and Hitt 2003). However, any ef-fect of coinvention on actual computer investment will not be captured inour measure because only data for investments in computer hardware andperipherals are collected in the 2000 ASM.
Data gaps for recent years also limit the available computer investmentdata. These data are collected only occasionally and in recent years werenot collected at the same time as book values of capital. While computerinvestment data were collected in the CM for 1977 through 1992, they werenot collected at all in 1997 (when book values of physical capital were col-lected) and were only collected again in the ASM in 2000 and 2001 (whenbook values of physical capital were not collected). The lumpiness of plant-and firm-level investment means that investment data for a single year arenot a good proxy for the plant’s (or firm’s) stock, except for new plants. Ina new plant, capital investment would be equal to the value of the plant’scapital stock.
13.2.3 Developing a Sample with Good Proxies for Computer and Capital Inputs
The data gaps for recent years make it difficult to argue that the data wehave available on book values of capital and computer investment provideequally plausible proxies for total capital and computer services for allplants that responded to the CNUS. In this paper, we develop the bestsample of CNUS respondents that our measures of computer and totalcapital allow us to make: a sample of plants that first appeared in the 1997CM. When a plant is new, the book values of physical capital (buildingsand machinery) and computer investment should equal the value of theplant’s capital stock and the plant’s computer capital stock, respectively.
If we were estimating productivity in 1997, it would be straightforwardto use the book values of total capital that these new plants report in the1997 CM as a proxy for their total capital services in 1997, making the stan-dard assumption that capital services are proportional to the value of the
Computer Input, Computer Networks, and Productivity 387

capital stock. That is, for physical capital, KT1997 � BVT1997, where K is thevalue of the plant’s total physical capital stock, T indexes total capital, andBV is book value.2 However, we estimate productivity in 2000 (rather than1997) because computer capital input is measured in 2000, and most of theremaining variables, particularly the variable of interest, computer net-works, are measured in 1999.3 We therefore use standard capital theory torelate the flow of total capital services in 2000, ST (KT2000), to total bookvalue in 1997 for our sample of plants new in 1997:
(1) ST (KT 2000) ≈ �T � BVT1997 � �T� .
The proportionality factor, �T , represents services per unit of total capital.The approximation error, �T�, increases as 1997 differs from the year forwhich we wish to measure capital services. That is, �T� �T when ⏐� –1997⏐⏐ – 1997⏐ for plants observed in year � compared to year .
For computer capital stock in 2000, we use computer investment in 2000as a proxy under the assumption that the total computer capital stock isproportional to observed investment:
(2) KC2000 ≈ � � IC2000 ,
where KC2000 represents the plant’s actual computer capital stock, and IC2000
is the plant’s computer investment in 2000. The proportionality factor, �,is positive (� � 0) and assumed to be the same for all plants in our samplebecause they opened in the same year, 1997. If � � 1, the plant completelyreplaces its old computing stock with new computers.
We again use standard capital theory to relate the flow of computer cap-ital services in 2000, SC (KC2000), to our proxy for the computer capitalstock:
(3) SC (KC2000) ≈ �C � IC2000 � �C�,
388 B. K. Atrostic and Sang Nguyen
2. We first link all observations that have both information on computer networks in the1999 CNUS and information on computer investment in the 2000 ASM. Because the 1999CNUS and 2000 ASM samples each are drawn from a sample frame based on the 1997 CM,the probability-proportionate-to-size sampling strategy leads to a high overlap between thetwo samples, and the 1999–2000 linking rate is high. Haltiwanger, Jarmin, and Schank (2003)find little sample reduction when they link the 1999 CNUS and the 2000 ASM. Their finalsizes range from 22,700 to 22,900, depending on specification. Because the data as entered inthe CES data storage system do not allow us to distinguish between plants that do not reportcomputer investment and those that report zero, we exclude both. This means that the plantsin our sample all have positive computer investment. We find that roughly one-third of thelinked plants report positive computer investment. This response pattern is consistent withthe historical pattern when this item was collected in 1977, 1982, 1987, and 1992 (e.g., Dunneet al. 2000). From the linked sample we select plants that first appeared in the 1997 CM (thatis, they did not appear in the 1992 CM or the 1993 through 1996 ASMs).
3. Because computer networks are major investments and U.S. manufacturing plants haveused some form of networks for decades, it seems reasonable to assume that plants with net-works in 1999 will continue to have networks in 2000.

where the proportionality factor, �C , represents services per unit of com-puter capital, and �C� is the approximation error from using investmentdata in 2000 to measure computer service flows in 1999.
Using these proxies yields the best sample that the data will allow us tocreate. The sample of plants new in 1997 has 849 observations. We addressthe concern that the sample is small by constructing a second sample basedon a broader alternative definition of new that includes plants betweenthree and eight years old. The broader definition includes plants that firstappeared in the 1993 through 1996 ASMs and have positive computer in-vestment. These plants are between three and eight years old in 2000, be-low the ten-year average age of plants in the 1999 CNUS–2000 ASM linkeddata set.4 The value of the capital approximation errors, �T� and �C�, will behigher for these plants than for plants that are new in 1997, but includingthem yields a larger sample of 1,755 observations.
To test the importance of using the sample of plants for which we haverelatively better proxies for total and computer capital stock, we use thelinked data to construct a data set containing plants of all ages. Our sampleof plants of all ages that report positive computer investment has 12,386observations.
13.2.4 Estimating the Impact of Computer Networks
Because computers have been in commercial use in the U.S. for fiftyyears, they might be viewed as just another capital input. If so, we wouldexpect to find that computer and noncomputer capital yield similar con-tributions to productivity. Computer networks also have been used fordecades. But the networks that came into use more recently are thought tobe qualitatively different (e.g., Bresnahan and Greenstein 1997). Brynjolf-sson and Hitt (2000) argue that the effects of organizational changescaused by the newer computer networks may rival the effects of changes inthe production process. Viewed this way, computer networks are a produc-tivity-enhancing–general-purpose technology (Bresnahan and Trajten-berg 1995). The question for productivity and other measures of economicperformance may no longer be whether computers matter, but whether itmatters how computers are used.
Despite the importance of understanding whether computer networksmatter for productivity, information on networks is scarce. The computernetwork information collected in the 1999 CNUS is the first such collectionfor a large and representative national sample of plants in U.S. manufac-turing. The CNUS asked about the presence of several kinds of networks,including Internet, Intranet, Local Area Networks (LAN), ElectronicData Interchange (EDI), Extranet, and “other.” We create a dummy vari-
Computer Input, Computer Networks, and Productivity 389
4. See Haltiwanger, Jarmin, and Schank (2003).
able for the presence of computer networks that takes on a value of one ifthe plant reports having any of these kinds of computer network and zerootherwise.
The 1999 CNUS network data, together with the computer investmentinformation collected in the 2000 ASM, allow us for the first time to spec-ify an empirical model of labor productivity with separate measures of thepresence of computers (computer investment) and how computers areused (computer networks). Using only the information on how businessesuse computers (the presence of computer networks), as in our previous re-search, may overstate the importance of those uses because it is picking upthe importance of having computers.
13.3 Empirical Implementation
We focus on estimating whether labor productivity is related both tocomputer networks and computer inputs by estimating the followingCobb-Douglas production function:
(4) log� � � 0 � 1CNET � �1clog� � � �1nclog� �� �2log� � � �3log(MIX) � �4MULTI
� ∑ �jSIZEj � ∑ �iINDi � ε
where Q, Kc, Knc, L, and M represent output, computer capital input, non-computer capital input, labor, and materials. CNET denotes computernetworks, and 0 � 1CNET � A, the technological change term, that is,the Solow residual or total factor productivity (TFP). SIZE denotes thesize class of the plant. MIX denotes the mix of production and nonpro-duction workers, and MULTI represents plants that belong to a multiunitfirm. IND denotes three-digit NAICS industries. Knc /L, noncomputer cap-ital input in 1999, is proxied by K/L97, the book value of total capital in1997, divided by 1997 employment. Kc /L computer capital input in 1999,is proxied by KC2000 /L, computer investment in 2000, divided by employ-ment in 1999.
Our model distinguishes between the productive effect of computer in-put in the plant and a technological shift resulting from using computernetworks. Equation (4) directly relates computer networks and computercapital to (log) labor productivity. In this formulation, 1, is one of our twoparameters of interest. It can be interpreted as measuring the relationshipbetween computer networks and labor productivity, controlling for the in-
M�L
Knc�L
Kc�L
Q�L
390 B. K. Atrostic and Sang Nguyen
tensities of computer and noncomputer capital (Kc /L and Knc /L), materi-als intensity (M/L), and other plant characteristics.
The second parameter of interest is �1c, the coefficient on the intensity ofcomputer capital. This coefficient can be interpreted as a return to the flowof services from the stock of computer capital.
Labor productivity is defined as output per worker (Q/L). We use totalvalue of shipments (TVS) as a measure of Q. Our measure of labor, L, is thetotal number of employees in the plant. Our model differs from those inmost previous related plant-level studies in specifying a four-factor pro-duction function in which output is defined as gross output (rather thanvalue added), and materials are incorporated as a separate input in pro-duction.
We described earlier how we use the CNUS, ASM, and CM to specifycomputer networks, computer inputs, and total capital inputs. We use thesame empirical specifications of materials, skill mix, size, multiunit plantstatus, and industry as Atrostic and Nguyen (2005). The CNUS data arepart of a Census Bureau measurement initiative to fill some of the datagaps on the growing use of electronic devices and networks in the economy(Mesenbourg 2001). The appendix contains more information on the 1999CNUS, 2000 ASM, and the 1992 and 1997 CM.
13.4 Empirical Findings
We estimate relationships among computer networks, computer input,and labor productivity using three alternative specifications. The preferredspecification includes both computer networks and computer inputs. Aspecification that parallels our prior research includes computer networksbut not computer inputs. The third specification parallels specifications inthe literature that include computer inputs but not computer networks.
The three specifications are estimated first for the cohort of 849 plantsthat newly opened their operations in 1997 and had positive computer in-vestment in 2000. We report these results in table 13.1. To assess whether itmatters that we restrict our sample to plants that were new in 1997, we es-timate the same three specifications using two other samples. Estimatesfrom the sample of 1,755 relatively new plants that opened between 1993and 1997 and have positive computer investment in 2000 are reported intable 13.2.5 Estimates from the sample of 12,836 plants of all ages that havepositive computer investment in 2000 are also reported in table 13.2. Thisdata set allows us to assess the empirical importance of using proxies for
Computer Input, Computer Networks, and Productivity 391
5. We also create four subsamples of plants that are new in each year between 1997 and1992. The results are similar to the results for plants new in 1997 and all plants that are newbetween 1992 and 1997, so we do not report them separately.
capital services when they are unlikely to be good measures. Because in-formation on computer networks was collected only in 1999, our analysesare all cross-sectional.
It matters empirically whether data are available to proxy for both com-puter networks and computer inputs. Each coefficient is higher in the spec-ification that excludes the other measure, suggesting that when each is usedalone, it picks up part of the impact of the other.6 Computer input andcomputer networks both have positive and significant relationships to la-
392 B. K. Atrostic and Sang Nguyen
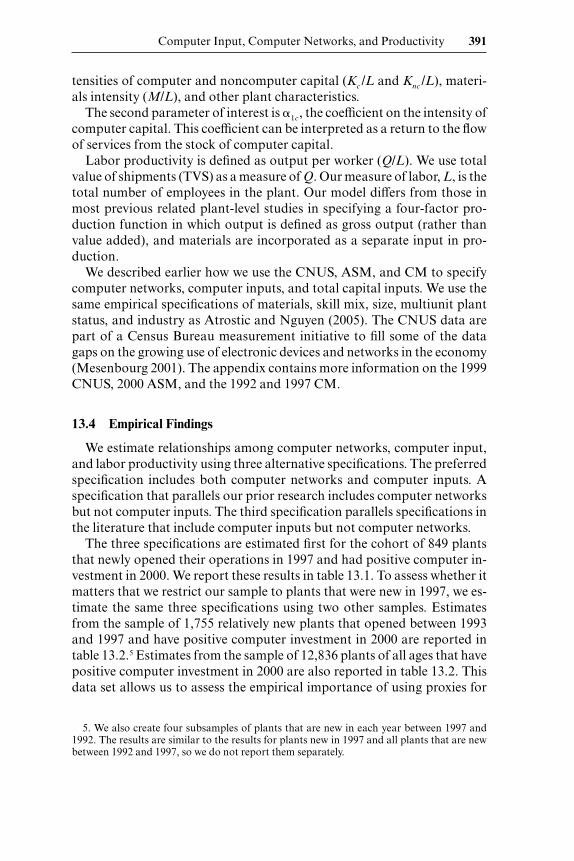
Table 13.1 Labor productivity OLS regression results: Plants new in 1997
Plants with positive computer investment in 2000
New in 1997 All plants
Independent variable (1) (2) (3) (4)
Intercept 3.769∗∗∗ 3.051∗∗∗ 3.266∗∗∗ 2.949∗∗∗(32.63) (32.36) (38.00) (106.03)
CNET .117∗∗ .136∗∗∗ .004(2.12) (2.44) (0.25)
Log(Knc /L) .086∗∗∗ .093∗∗∗ .088∗∗∗ .098∗∗∗(6.02) (6.42) (6.13) (26.92)
Log(Kc /L) .050∗∗∗ .052∗∗∗ .0478∗∗∗(4.36) (4.53) (16.03)
Log(M/L) .409∗∗∗ .422∗∗∗ .409∗∗∗ .478∗∗∗(28.00) (29.15) (27.96) (121.97)
MIX .040∗ .061∗∗∗ .044∗ 0.04∗∗∗(1.69) (2.64) (1.85) (7.08)
MULTI .161∗∗∗ .155∗∗∗ .167∗∗∗ .102∗∗∗(4.81) (4.59) (5.00) (11.45)
Plant size Yes Yes Yes YesIndustry (3-digit NAICS) Yes Yes Yes Yes
R2 .655 .647 .653 .740No. of plants 849 849 849 12,386
Notes: Dependent variable � labor productivity. T-statistics in parentheses. Notation in thetable is the same as in the estimating equation (4). Knc /L, noncomputer capital input in 1999,is proxied by K/L97, the book value of total capital in 1997, divided by 1997 employment.Kc /L, computer capital input in 1999, is proxied by Kc2000 /L, computer investment in 2000 di-vided by employment in 1999. All other variables are measured in 1999.∗∗∗Significant at the 1 percent level.∗∗Significant at the 5 percent level.∗Significant at the 10 percent level.
6. We report only OLS estimates. Because we use new, or relatively new, plants, we have nogood instruments. The two-stage estimates reported in our prior research did not have the ex-pected result of reducing the estimated effect of computer networks. When we estimate OLSspecifications on the same sample used in the two-stage estimates, coefficients of variablesother than networks and computer investment are stable.

bor productivity in estimates from our preferred specification, as reportedin column (1) of table 13.1. The coefficient on computer networks is 0.117,controlling for computer and other inputs and plant characteristics.7 Non-computer inputs (Knc /L) and computer inputs (Kc /L) have separate andsignificant relationships to productivity, with coefficients of 0.085 and0.050.8 Computer networks are significant when they enter the estimationalone, and the coefficient of 0.136, reported in column (2), is higher thanwhen computer input is included. When computer networks are excluded,
Computer Input, Computer Networks, and Productivity 393
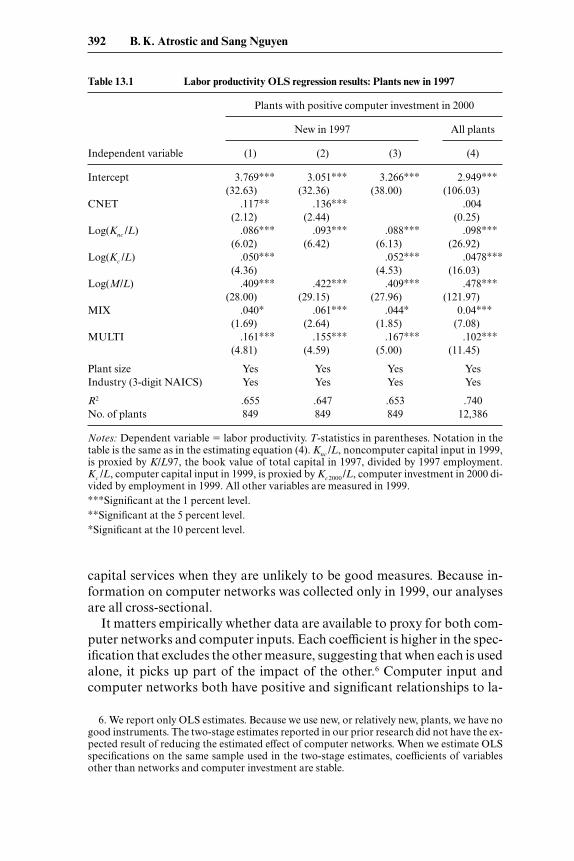
Table 13.2 Labor productivity OLS regression results: Plants new between 1992and 1997
Plants with positive computer investment in 2000
New between 1992 and 1997 All plants
Independent variable (1) (2) (3) (4)
Intercept 3.009∗∗∗ 2.916∗∗∗ 3.117∗∗∗ 2.949∗∗∗(39.78) (39.26) (47.90) (106.03)
CNET .126∗∗∗ .1510∗∗∗ .004(2.78) (3.31) (0.25)
Log(Knc/L) .084∗∗∗ .088∗∗∗ .085∗∗∗ .098∗∗∗(8.91) (9.28) (9.01) (26.92)
Log(Kc/L) .046∗∗∗ .049∗∗∗ .0478∗∗∗(5.42) (5.71) (16.03)
Log(M/L) .456∗∗∗ .466∗∗∗ .457∗∗∗ .478∗∗∗(43.38) (44.54) (43.34) (121.97)
MIX .036∗∗ .057∗∗∗ .038∗∗ 0.04∗∗∗(2.13) (3.51) (2.25) (7.08)
MULTI .143∗∗∗ .137∗∗∗ .149∗∗∗ .102∗∗∗(5.71) (5.43) (5.98) (11.45)
Plant size Yes Yes Yes YesIndustry (3-digit NAICS) Yes Yes Yes Yes
R2 .678 .672 .665 .740No. of plants 1,755 1,755 1,755 12,386
Notes: See notes to table 13.1.∗∗∗Significant at the 1 percent level.∗∗Significant at the 5 percent level.
7. The exponential of the coefficient 0.117 is 1.124, or a differential of 12.4 percent. How-ever, because the differences between the exponential and the coefficient are not large, we dis-cuss the coefficient rather than the exponential in the text.
8. The cost shares of Knc and Kc are 0.28 and 0.005, while the ratio Kc /Knc is 0.09. Given thelow cost share (0.5 percent) of computer capital, its coefficient of 0.050 indicates that com-puter capital input is a highly productive input relative to noncomputer input. Indeed, whilethe cost share of noncomputer input is 27.7 percent, it contributes only 8.6 percent to totaloutput. In contrast, the cost share of computer input is only 0.5 percent, but it contributes 5percent to total output.
computer intensity is significant, with the slightly higher coefficient of0.052 as reported in column (3) of table 13.1.9
The coefficient of one other variable, MIX, the ratio of nonproductionto production workers, changes appreciably across these specifications. Inour preferred specification that includes both computer input and net-works (column [1] of table 13.1), the coefficient of MIX is 0.040, but is notsignificant. An estimate similar in size, 0.044, and in lack of significance,comes from the specification that includes only computer input (column[3]). By comparison, in the specification that only includes computer net-works, the coefficient of MIX increases to 0.061, suggesting that computerinputs may be positively related to the worker mix ratio (column [3]). Otherresearchers find similar relationships between worker mix and computerinvestment (e.g., Dunne et al. 2000; Haltiwanger, Jarmin, and Schank2003). Coefficients of most other inputs, plant characteristics, and R2
change little across the three specifications reported in table 13.1, suggest-ing that the computer network and computer input measures are indepen-dent of other inputs or plant characteristics.
We assess how sensitive these estimates are to the assumption that ourproxies for capital and computer service flows are best for new plants by es-timating the same three specifications for the largest sample of 1,755 plantsthat are new between 1992 and 1997. Estimates based on this broader def-inition of “new” plants yield similar findings. Computer input and com-puter networks both have positive and significant relationships to laborproductivity, as reported in column (1) of table 13.2. The computer net-work coefficient of 0.126 is significant for relatively new plants with com-puters, controlling for computer and other inputs and plant characteris-tics. Computer input has a separate and significant effect, with a coefficientof computer intensity (Kc /L) of 0.046. When computer networks are ex-cluded, computer intensity remains significant, with a slightly higher co-efficient of 0.049, as reported in column (2) of table 13.2. When computerinputs are excluded, computer networks remain significant, with a highercoefficient of 0.1510.
Having good proxies for all forms of capital services is empirically im-portant. Coefficients of both computer networks and computer input aresignificant in all the estimates based on new plants, as reported in tables13.1 and 13.2. A very different picture emerges from estimates based onplants of all ages. In these estimates, computer networks and computer in-puts do not each have empirically separate relationships with labor pro-ductivity. The network coefficient of 0.004, reported in column (4) of table13.2, is not statistically significant. Computer input, however, is positivelyand significantly related to productivity, with a coefficient of 0.0478. Re-
394 B. K. Atrostic and Sang Nguyen
9. While we calculate coefficients for industry dummies � and for size dummies �, we do notreport them because such coefficients present standard microdata disclosure problems.
sults based on this sample of plants of all ages suggest that computer net-works are not a technology that shifts the production function, distinctfrom the productive effect of computer inputs. Instead, computer networksappear simply to be a measure of computer inputs. However, it is for thissample that our proxies for total and computer capital inputs are mostproblematic.
13.5 Discussion
Our empirical findings suggest that computer networks may be a newtechnology that shifts the production function, not just an alternative mea-sure of the presence of computers. The measurement issues we raise aboutcapital inputs have important empirical consequences because those find-ings hold only when we have good proxies for capital inputs. When we lackgood proxies, we would conclude instead that our cross-section estimatesof the separate relationships of productivity with computer networks andcomputer inputs are subject to omitted variable bias and that the new net-work variable yields no additional information about the relationship be-tween computer use and productivity in U.S. manufacturing.
We assess these findings by comparing them with results we obtained inour previous study using these data, when only information on computernetworks was available, and with results of other researchers. The finalportion of this section discusses how remaining data gaps may affect ourestimates and what our findings imply for priorities in filling them.
13.5.1 Comparison with Prior Research Using These Data
While we do not deal with causality issues, our findings are consistentwith our previous research using these data, which showed a significantand positive relationship between computer networks on labor productiv-ity in both ordinary least squares (OLS) and two-stage regressions (Atros-tic and Nguyen 2005). Note that our previous and new estimates are not di-rectly comparable because the samples differ in two ways. The sample weuse in this paper is for plants that are new in 1997 and have positive com-puter investment. Our previous research includes plants of all ages, re-gardless of whether they had computer investment, because data on com-puter investment in 2000 were not available.10 In addition, the previousresearch includes computer networks but not computer inputs. With thosedifferences in mind, we compare the specifications that are most similar inthe new and previous research.
Computer Input, Computer Networks, and Productivity 395
10. We also perform parallel sensitivity assessments between the 12,836-observation dataset of plants of all ages that we use in this paper and the 10,496-observation 1999 CNUS-onlydata used in our previous research (Atrostic and Nguyen 2005). Because the same specifica-tion estimated on these two data sets yield similar results to those reported here, we do notdiscuss them separately.

The appropriate comparison from our previous research is with com-puter network coefficients from OLS regressions on the 10,496 observa-tions that we also used in the two-stage estimates. Those OLS estimates, re-peated here in column (2) of table 13.3, show that labor productivity is 3.9percent higher in plants with networks.11
For plants new in 1997, the estimated computer network impact is 14.6percent (the exponential of the coefficient 0.136 in column [2] in table 13.1).This is nearly four times the 3.9 percent impact of networks for plants ofall ages. The higher coefficient for new plants might mean that newer plantsopen with the newest embodied technology.12 We note that new plants inour data have lower average productivity, regardless of whether they havenetworks. What our research finds is that productivity is higher in newerplants that have computer networks, compared to newer plants withoutnetworks.
The coefficient of the MIX term, the ratio of nonproduction to produc-tion workers, also is higher for the new plants (0.061 versus 0.039). Thissuggests that newer plants that are more productive have a higher propor-tion of nonproduction workers. Higher ratios of nonproduction to pro-duction workers are frequently taken as proxies for higher levels of skillsembodied in the workers. Careful research linking the broad groupings ofproduction and nonproduction workers with reports from the 1990 De-cennial Census of actual worker education suggests that there can be suchembodiment (Doms, Dunne, and Troske 1997). However, we cannot makesuch linkages with our data. The broad worker classification in the MIXterm makes it difficult to read too much into any estimated difference inthis coefficient between groups of plants of different ages.
13.5.2 Comparisons with the Information Technology Literature
Our finding of positive and significant relationships between computersand computer networks and productivity is consistent with the recent em-pirical literature at the plant and firm level. Previous research using com-
396 B. K. Atrostic and Sang Nguyen
11. In contrast to standard findings in estimates from OLS versus two-stage regressions,our previous research shows a positive and significant relationship between computer net-works and productivity in both estimates, and the estimate in the two-stage regression, 7.2percent, exceeds the OLS estimate of 3.8 percent. We obtain the 7.2 percent estimate by eval-uating the significant coefficient of the predicted network variable (0.669) at the mean of thenetwork variable.
12. The vintage capital model says that newer plants open with the newest, embodied tech-nology and that plants exit when their productivity becomes too low relative to the new en-trants. Consistent with the model are results in the literature suggesting that older plants aremore likely to exit, but more productive plants are more likely to continue. However, Baily,Hulten, and Campbell (1992) find little evidence for the vintage capital model in examiningtransition matrices across years in U.S. manufacturing. They and other researchers find thatplants entering an industry have low productivity on average but move within a few years toboth the highest and lowest productivity groups. Similarly, Power (1998) finds that produc-tivity increases with plant age, but finds almost no relationship between productivity and theage of investments.

puter investment data for U.S. manufacturing through 1992 found a posi-tive link between computer investment and plant-level productivity, withmuch variation among industries (Stolarick 1999a,b). Two recent reviewsof plant- or firm-level empirical studies of information technology (in-cluding but not limited to computers) and economic performance (De-drick, Gurbaxani, and Kraemer 2003; Stiroh 2004) conclude that the lit-
Computer Input, Computer Networks, and Productivity 397
Table 13.3 Labor productivity OLS and two-stage regressions: Plants of all ages
All CNUS plantsa
OLS estimatesTwo-stage estimates
Standardb Corrected errorsb
Independent variable (1) (2)b (3) (4)
Intercept 2.948∗∗∗ (114.95) 2.92∗∗∗ (90.85) 2.362∗∗∗ (17.23) 2.363∗∗∗ (14.68)CNET 0.037∗∗∗ (3.00) 0.038∗∗∗ (2.76) c c
Pr(CNET) 0.669∗∗∗ (4.39) 0.669∗∗∗ (3.88)Log(K/L) 0.078∗∗∗ (24.19) 0.083∗∗∗ (22.42) 0.082∗∗∗ (22.10) 0.082∗∗∗ (17.52)Log(M/L) 0.451∗∗∗ (118.96) 0.458∗∗∗ (105.21) 0.459∗∗∗ (105.39) 0.459∗∗∗ (52.21)Log(L) –0.005∗ (1.78) –0.004∗∗ (–1.25) –0.003 (–0.94) –0.003 (–0.082)Log(RLP92) 0.276∗∗∗ (32.80) 0.277∗∗∗ (29.91) 0.289∗∗∗ (29.86) 0.289∗∗∗ (21.47)Log(MIX) 0.035∗∗∗ (7.25) 0.032∗∗∗ (5.83) 0.034∗∗∗ (6.27) 0.040∗∗∗ (2.74)MULTI 0.088∗∗∗ (10.04) 0.082 (8.55) 0.04∗∗∗ (2.85) 0.0482*∗∗ (3.63)New 0.203∗∗∗ (7.15)New � interactions
with inputs above Yes Yes Yes YesIndustry (3-digit
NAICS) Yes Yes Yes Yes
R2 0.8133 0.7811 0.7724 0.7819No. of plants 29,840 10,496 10,496 10,496
Notes: Dependent variable � labor productivity. T-statistics in parentheses. L � employment at theplant. RLP92 � the plant’s labor productivity in 1992 (1997 for plants new in 1997), relative to its 4-digitSIC industry. New indicates a zero–one dummy variable equal to one for plants new since 1997. K/L, to-tal capital input in 1999, is proxied by K/L97, the book value of total capital in 1997. Other variables de-fined as in tables 13.1 and 13.2.aAll coefficients are reported in Atrostic and Nguyen (2005).bThe number of observations in columns (2), (3), and (4) is smaller than that in column (1) for severalreasons. Estimating the probit in the first stage of the two-stage estimates reported in columns (3) and(4) required variables from prior periods that are not used in the OLS estimates. One of these variables,computer expenditures, is reported by only about half of all plants. Additionally, many plants are newsince the prior period, 1992. The OLS regression reported in column (2) uses the same reduced samplethat is used in the two-stage estimates.cEvaluating the coefficient of the predicted probability at a point consistent with our data yields an esti-mated network effect of 7.2 percent. This estimated network effect is higher than the OLS estimate of 3.9percent from the coefficients in column (2).∗∗∗Significant at the 1 percent level.∗∗Significant at the 5 percent level.∗Significant at the 10 percent level.

erature shows positive relationships between information technology andproductivity.
Dedrick, Gurbaxani, and Kraemer (2003) review over 50 articles pub-lished between 1985 and 2002, many of which are firm-level studies withproductivity as the performance measure. They conclude that firm-levelstudies show positive relationships, and that gross returns to informationtechnology (IT) investments exceed returns to other investments.13
Stiroh (2004) conducts a meta-analysis of twenty recent empirical stud-ies of the relationship between information technology and the productionfunction. He also estimates a number of specifications used in those stud-ies on a single industry-level database. The meta-analysis of nineteen firm-level studies that use gross output productivity measures yields a meanelasticity of information technology of 0.042, with large variability aroundthat coefficient. His estimates using the single industry-level database yieldOLS estimates of computer capital elasticity of 0.047.14 The coefficient es-timate, however, is sensitive to econometric specifications that account, forexample, for unobserved heterogeneity.
Stiroh’s (2004) meta-analysis and basic OLS regression estimates areclose to the coefficient of 0.050 that we report for computer capital elastic-ity in new plants in our preferred specification in column (1) of table 13.1.His estimates are the same as the coefficient of 0.046 that we report in esti-mates based on our larger sample of plants that are new between 1993 and1997.
While we are reassured by this empirical regularity, we do not makeoverly much of it. The estimates in Stiroh’s (2004) analysis may not be ad-justed for the high obsolescence rate of computers, the well-known contin-uing decline in computer prices, or coinvention. Our estimates are for thespecific sample for which our data have reasonable proxies, plants that arenew in 1997. While we obtain similar results for a larger sample of plantsthat are new since 1992 (0.117 versus 0.126), we note that both these esti-mates far exceed the coefficient estimates for the full sample of plants thatreport computer investment (0.004), or the network coefficient for the fullsample of plants, omitting computer investment (0.037). It also is subjectto other biases whose net effects may be of any sign. There is some down-ward bias because computer prices continue to fall at a roughly 30 percentannual rate of decline, so the plant’s computer investment in 2000 buysmuch more computer input than the same dollar investment would have
398 B. K. Atrostic and Sang Nguyen
13. They warn against concluding that higher gross returns mean that plants are underin-vesting in information technology. Most studies do not adjust for the high obsolescence rateof information technology capital, which lowers net returns. Also, total investment in infor-mation technology may be understated because most studies measure only computer hard-ware, but not related labor or software, or costs of coinvention, such as reengineering busi-ness processes to take advantage of the new information technology.
14. Both Dedrick, Gurbaxani, and Kraemer (2003) and Stiroh (2002) attribute the failureof early microdata studies to find a relationship to inadequate data with small sample sizes.
bought even in 1999. We assume this price decline affects all plants in theCNUS equally. There is an upwards bias in our estimates, as in the esti-mates in Stiroh (2004), because we do not measure coinvention. Coinven-tion is estimated to equal roughly the cost of the hardware and peripheralequipment investment over the life of the investment, so omitting it under-states computer inputs.
Our findings also are consistent with a relatively new literature in plant-or firm-level research conducted in other countries and summarized in Pi-lat (2004). Many studies cited there find positive relationships between in-formation technology and productivity. Several of those studies also findpositive relationships between using computer networks and productivity(e.g., Baldwin and Sabourin (2001) for Canada; Bartelsman, van Leeuwen,and Nieuwenhuijsen (1996) for the Netherlands; and Clayton et al. (2004)for the United Kingdom). Recent research by Motohashi (2003) finds sep-arate positive effects of computer expenditures and computer networksin Japan during the 1990–2001 period, with larger effects in more recentyears, but also with much heterogeneity in those effects over time andacross industries. Many of these new plant- and firm-level studies concludethat computers are not the only factors contributing to productivity. Theyfind important roles for complementary inputs and investments, such asorganizational capital, worker skills, and innovation.15
While our coefficient estimates for the computer and total capital vari-ables are consistent with the literature, we note again that our computerand total capital variables are proxies for the desired capital input mea-sures. It is difficult to interpret coefficients of these proxy variables as thetheoretically specified marginal products of computer and total capital.Stiroh (2004) concludes that information technology matters, but “[r]ea-sonable differences in econometric techniques yield a wide range of esti-mates,” (23) and “one must be careful about putting too much weight onany given estimate” (24). We agree.
13.5.3 Parallels to the Growth Accounting Literature
We can use our econometric estimates to quantify the contributions ofinputs and computer networks to the change in productivity (both laborand total factor productivity). To get a sense of the contribution of net-works, we perform a “productivity change accounting” or decompositionexercise at the microlevel similar to the growth accounting exercise that isoften performed to explain the growth of output of goods and services. Theconventional “growth accounting” equation can be written as16
Computer Input, Computer Networks, and Productivity 399
15. Recent research for the United States using detailed firm-level investment in comput-ers, communications equipment, software, and other capital goods finds that many compo-nents of investment, including information technology investments, are related to productiv-ity (Wilson 2004).
16. See, for example, Schreyer (1999) and Jorgenson and Stiroh (2000).
(5) �Q � ∑ �i�Xi � �A
where �Q � ln(Qt /Qt�1) � output growth,�i � the output elasticity of input i,
�Xi � ln(Xit /Xit�1) � the growth of input i, and�A � ln(At /At�1) � total factor productivity (TFP) change.
Within the context of our cross-section productivity model, the preced-ing equation can be rewritten in terms of moving from the 25th to the 75thpercentile of the distributions of outputs and inputs:17
�q � ∑ �i�xi � �A
where �q � ln[(Q/L)75 /(Q/L25 )] � the rate of change of output between the25th and 75th percentiles,
� i � the output elasticity of input i,�xi � ln[(X/L)i 75 /(X/L)i25 ] � the rate of change of input i between
the 25th and 75th percentiles; and�A � ln[A75(CNET )/A25(CNET )] � the rate of change of TFP,
which in this model is a function of computer networks, orCNET.18
The results of this accounting exercise for U.S. manufacturing plants’ laborproductivity are in table 13.4. We perform the exercise for the plants withpositive computer investment in 2000. We look separately at plants that arenew in 1997, plants that are new between 1992 and 1997, and all plants withpositive computer investment. For each group of plants, we estimate thepercentage increases in labor productivity due to moving from the 25th tothe 75th percentile of the three input variables of interest, log of computerintensity (Kc /L), log of noncomputer capital intensity (Knc /L), and log ofmaterials intensity (M/L). The Solow residual (TFP), �A(CNET), is de-composed into the contribution of the presence of a computer network(CNET) and other factors. The decomposition results in table 13.4 arebased on the estimated coefficients in our preferred specifications of equa-tion (4).
Consider the first entry in column (2) of the first panel for new plants,12.20 percent. This entry suggests that differences in the intensity of non-computer capital (Knc /L) contribute about 12 percent to the total change
400 B. K. Atrostic and Sang Nguyen
17. Criscuolo, Haskell, and Slaughter (2005) perform a similar exercise for a single periodof cross-section microdata, but in a different context. They focus on accounting for how muchdifferences in the sources of innovation that they measure explain differences in firm output.
18. We actually estimate the effect of differences in computer networks at the 10th and 75thpercentiles because networks are present in roughly 90 percent of the plants in our sample. Tosimplify notation and presentation, we use the “25th to 75th percentile” description for allvariables in this section of the paper.

Table 13.4 Contributions of factor inputs and computer network to U.S.manufacturing plants’ productivity change
Moving from Contribution 25th to 75th to change in percentilea productivityb (%)
Variables (elasticities) (1) (2)
Plants new in 1997 (N � 849)d
�q 0.9098 100.00�Knc/L (0.086) [0.086(1.29)]/0.9098 = 0.1220 12.20�Kc/L (0.050) [0.050(1.95)]/0.9098 = 0.1072 10.72�M/L (0.409) [0.409(1.31)]/0.9098 = 0.5910 59.10�Total input 82.02Residual c 17.98�CNET/�q .117/.9098 12.86(�CNET/�q)/residual 12.86/17.98 = 0.7152 71.52
Plants new between 1992 and 1997 (N � 1,775)e
�q 0.9859 100.00�Knc/L (0.084) [0.084(1.41)]/0.9859 = 0.1198 11.98�Kc/L (0.046) [0.046(2.01)]/0.9859 = 0.0995 9.95�M/L (0.456) [0.046(1.36)]/0.9859 = 0.6282 62.82�Total input 84.75Residual c 15.25�CNET/�q .126/.9859 = .1278 12.78(�CNET/�q)/residual 12.78/15.25 = 0.8380 83.80
Plants of all ages with positive capital investment in 2000 (N � 12,386)f
�q 0.9181 100.00�Knc/L (0.098) [0.098(1.24)]/0.9181 = 0.1323 13.23�Kc/L (0.0478) [0.048(1.94)]/0.9181 = 0.1073 10.73�M/L (0.478) [0.478(1.20)]/0.9181 = 0.6248 62.48�Total input 86.44Residual c 13.56�CNET/�q .004/.9181 = 0.0043 0.43(�CNET/�q)/residual 0.43/13.56 = 0.0317 3.17
aWe estimate the effect of differences in computer networks at the 10th and 75th percentilesbecause networks are present in roughly 90 percent of the plants in our sample. To simplifynotation and presentation, we use the “25th to 75th percentile” description for all variablesin this section of the paper.bThe estimated increase in labor productivity in column (2) are calculated by comparingplants at different points in the distribution of the variables. Specifically, the second numberin column (2) minus the contribution of �Knc /L to �q, is calculated as: [0.086(1.29)]/.9098 �0.1220 (� 12.20%).c The residual in this table includes the share explained by the plant characteristics, such as in-dustry, included in our empirical specification and the share unexplained by any variables in-cluded in the regression.d The estimated elasticities are taken from column (1), table 13.1.eThe estimated elasticities are taken from column (1), table 13.2.f The estimated elasticities are taken from column (4), table 13.2.

in plant-level labor productivity. Differences in the intensity of computercapital, Kc /L, account for about 11 percent of the productivity differential,and differences in materials intensity, M/L, account for about 59 percent.These three inputs together account for 82 percent of the change in laborproductivity as the plant moves from the 25th to the 75th percentile of thedistributions of each input. The residual (TFP) contributes about 18 per-cent of the change in labor productivity.
We decompose the residual into the share explained by the presence ofcomputer networks and the share that remains unexplained.19 The tableshows that the presence of computer networks explains 71.5 percent of theresidual, or about 13 percent of the change in the plant’s labor productiv-ity. Computer networks and computer and noncomputer capital have com-parable contributions to labor productivity.
The second panel of table 13.4 repeats this decomposition exercise forplants that were new between 1992 and 1997. The productivity contribu-tions of inputs and computer networks for these plants, shown in column(2), are similar to those for new plants: the presence of a computer networkhas an impact analogous to an increase in the intensity of either noncom-puter or computer capital.
In the third panel of table 13.4, we apply this decomposition to all plantsthat had positive computer investment in 2000, regardless of plant age. Thecontribution of either kind of capital intensity ranges from of 10 to 14 per-cent, similar to the increases for the two groups of younger plants. How-ever, unlike the results for new plants, the decomposition for plants of allages shows no role for computer networks. This lack of productivity impactis analogous to the lack of statistical significance we found for computernetworks in the OLS regression for plants of all ages in column (4) of table13.2. The lack of significance may reflect an inability of older plants tomake effective use of new technologies. However, as we argue in the pre-ceding, it also reflects serious measurement errors in both computer andnoncomputer capital.
This decomposition exercise gives a sense of the relative importance ofstandard input variables and the computer network variable in our data.Comparisons with other studies are problematic. Most studies in the stan-dard growth accounting literature use different models, different data, anda different unit of analysis. Standard production function models underlayboth our research and growth accounting, but our empirical model focuses
402 B. K. Atrostic and Sang Nguyen
19. Because we estimate our model using detailed microdata, the residual has three com-ponents: (a) the share that is explained by our variable of interest, the computer network termCNET; (b) the share explained by the other plant characteristics, such as industry, includedin our empirical specification; and (c) the share unexplained by any variables included in theregression. The “unexplained” residual we report in table 13.4 and discuss in this section in-cludes both the second and third of these components. Because our interest is in examiningthe share of the residual explained by CNET, we do not decompose further the 15 to 20 per-cent of the residual that is not explained by CNET.
on labor productivity, while growth accounting often looks at outputgrowth. Our data are cross-section data at the plant level and limited tomanufacturing, while the growth accounting literature is based on time se-ries data aggregated to the industry or economy level and often includesmost or all sectors of the economy.20
With these important differences in mind, some broad comparisonsshow that our empirical results are consistent with those in the growth ac-counting literature. Jorgenson and Stiroh (2000) calculate the contribu-tions of four inputs—capital, labor, energy, and materials—to U.S. eco-nomic growth by industry for the period 1958 through 1996. To illustrate,we use the contributions they report to calculate the share of outputgrowth due to each input, and the unexplained share, for three of thesemanufacturing industries. The industries we choose—paper products, pri-mary metals, and industrial machinery and equipment—differ in inputmix and economic performance. The share of output growth that is due tocapital ranges from 11 percent (Primary Metals and Industrial Machineryand Equipment) to 17 percent (for Paper Products). Our estimates of thecontribution of noncomputer capital range from 12 to 13 percent, wellwithin the same ballpark. The share of growth unexplained by these inputsin Jorgenson and Stiroh ranges from a low of 14 percent in Paper Productsto a high of 31 percent for Industrial Machinery and Equipment. Our esti-mates of the residual’s share of the change in labor productivity run from14 to 18 percent, at the low end of their estimates.
A second comparison is with growth accounting exercises by Oliner andSichel (2000) and Jorgenson and Stiroh (2000) for the entire economy thatinclude IT as a separate element of capital services. These studies use dif-ferent source data and cover slightly different time periods. We choose theresults for the period nearest our data, 1996–1999 for Oliner and Sichel and1995–1998 for Jorgenson and Stiroh, as reported in tables 1A and 1B ofBosworth and Triplett (2001). We again calculate the share of each input tothe reported growth of output, and the share of growth that is unexplained.The IT share of output growth is 23 percent in Oliner and Sichel and 20percent for Jorgenson and Stiroh, with the residual accounting for 24 and21 percent of output growth. The shares of IT are roughly twice as high inboth of these studies as in ours, but the residual shares are similar.
13.5.4 Important Data Gaps and Implications for Data Collections
The new network data in the 1999 CNUS and the computer investmentdata in the 2000 ASM are critical to understanding how IT affects plant-level productivity. Assessments of the data needed to understand the
Computer Input, Computer Networks, and Productivity 403
20. A series of plant-level studies, beginning with Baily, Hulten, and Campbell (1992) andincluding studies cited in Schreyer (1999), perform growth decompositions using panel databut do not include computers as a separate input.
emerging electronic economy, for example, Atrostic, Gates, and Jarmin(2000), and Haltiwanger and Jarmin (2000), identified the lack of informa-tion on these variables as critical gaps. Recent data initiatives attempted tofill these gaps by collecting this information for large and nationally repre-sentative samples (Mesenbourg 2001).
Early microdata studies lacked large representative national samplescollected by official statistical organizations. For example, Dedrick, Gur-baxani, and Kraemer (2003) report that Barua, Kriebel, and Mukhopad-hyay (1995) draws on sixty business units in twenty U.S. companies. Simi-larly, Brynjolfsson and Hitt (2000, 2003) and Brynjolfsson et al. (2002)analyze between 500 and 600 firms for which they combine informationfrom a private database on the firms’ computer capital stock with public in-formation on other inputs and financial variables from Compustat.
Larger samples of roughly 38,000 plants became available in the 1988 and1993 Surveys of Manufacturing Technology (SMT), but were limited to fivetwo-digit Standard Industrial Classification (SIC) industries. Also, whilethe SMT collected data on the use of a number of technologies, Doms,Dunne, and Troske (1997) stress that they are process and control technol-ogies, and not measures based directly on the use of computers. The com-puter network and investment data that we use in this paper, by contrast,were asked of the roughly 50,000 plants in the ASM sample, and theseplants are distributed among all the NAICS manufacturing industries.
The gap in information on computer capital is being addressed in severalways. Plant-level data on computer investment is collected in the 2001,2002, 2003, and 2004 ASM. The 2002 Economic Census collected data onboth the book values of assets and capital expenditures, with separate in-formation on expenditures on computer equipment and peripherals. In ad-dition, beginning in 2003, the Annual Capital Expenditures Survey (ACES)collects information on both capitalized and expensed expenditures oninformation and communications technology structures and equipment, in-cluding computer software. Because ACES data are collected at the com-pany level, neither totals nor separate detail for expenditures on these in-formation technology expenditures will be available at the plant level.
However, our empirical findings suggest that the key new variable in ouranalysis is computer networks. Computer network information was onlycollected in 1999. Lacking network information for multiple periodsmeans that we cannot conduct logical next steps in empirical work. Paneldata techniques address many standard plant-level measurement issues,including unobserved heterogeneity beyond those input and plant charac-teristics we control for, such as managerial ability. Nor can we investigatehow the presence of computers and computer networks affect the dynam-ics of plant performance.
The 1999 CNUS shows that filling this gap is not difficult. The networkmeasure we use was constructed from a few pieces of information (U.S.
404 B. K. Atrostic and Sang Nguyen
Census Bureau 2002). Our empirical findings show that this measure aloneconveys important information about firm heterogeneity in the uses ofcomputers and, in particular, on the newest uses. Room for its componentsshould be eked out of survey instruments and respondent burden calcula-tions.
13.6 Conclusions
We find that it is important empirically to have a separate measure of howbusinesses use computers. Production functions estimates using variablesderived from new data on computer networks and computer investmentshow that both variables have positive and significant relationships withplant-level labor productivity. This finding suggests that computer networksare a new technology that shifts the production function, distinct from theproductive effect of computer inputs in the production process. We alsoshow that it is important empirically to have good proxies for computer net-works and computer and total capital inputs. When we lack good proxies,computer networks appear to be just an alternate measure of computers.
New data raise the level in the statistical glass but also raise our expec-tations for the questions we can answer, without enabling us to address allthem (Griliches 1994). These new data allow us to estimate single-periodmodels, but not panel or other multiperiod models, and we lack any mea-sures of other variables, such as worker or managerial quality, that havebeen found important in other empirical studies. The statistical glass nev-ertheless is filled higher for U.S. manufacturing than for other sectors. Dataon variables critical to this analysis, such as computer networks, computerinput, book value of capital, and other inputs, are rare in official U.S. datacollections for sectors outside of manufacturing.
Appendix
Data and Empirical Specification of Variables
Data
The 1999 Annual Survey of Manufactures Computer Network Use Sup-plement was mailed to the plants in the ASM sample in mid-2000. The sup-plement asked about the presence of computer networks and the kind ofnetwork (EDI, Internet, both). It also collected information about manu-facturers’ e-commerce activities and use of e-business processes. The ques-tionnaire asked if the plant allowed online ordering and the percentage oftotal shipments that were ordered online. Information on online purchases
Computer Input, Computer Networks, and Productivity 405

was also asked. In addition, information was collected about the plant’s cur-rent and planned use of about twenty-five business processes conductedover computer network (such as procurement, payroll, inventory, etc.—“e-business processes”) and the extent to which the plant shared informa-tion online with vendors, customers, and other plants within the company.
The Annual Survey of Manufactures (ASM) is designed to produce es-timates for the manufacturing sector of the economy. The manufacturinguniverse consists of approximately 365,000 plants. Data are collected an-nually from a probability sample of approximately 50,000 of the 200,000manufacturing plants with five or more employees. Data for the remaining165,000 plants with fewer than five employees are imputed using informa-tion obtained from administrative sources. Approximately 83 percent ofthe plants responded to this supplement. All CNUS data are on the NorthAmerican Industry Classification System (NAICS) basis. Because the dataare only from respondents to the CNUS and are not weighted (see the dis-cussion in http://www.census.gov/estats), our results may apply only toresponding plants. We note, however, that the plants responding to theCNUS account for a substantial share of the U.S. manufacturing employ-ment and output (about 50 to 60 percent) represented in the ASM.
Variables
• Capital (KT): Data on capital services are the appropriate measure forproduction function estimation and productivity analysis. Becausesuch data are not available at the micro level, we use book values ofgross capital stocks (including buildings and machinery assets) col-lected in the 1997 CM as a proxy for K. We use 1997 data on capital in-tensity (K/L) because data on total capital stock are collected in the1997 Economic Census but not in the ASM (see table 13A.1). Althoughwe recognize that these data have limitations as measures of capitalservices, it is widely recognized that it is difficult to handle these prob-lems in cross-sectional analysis. We therefore follow many previousstudies (e.g., McGuckin, Streitwieser, and Doms 1998; Greenan,Mairesse, and Topiol-Bensaid 2001) and use book values of capital asa proxy for capital input, K. This implies that services are proportionalto the book value of capital. This assumption is made more reasonableby the controls for plant characteristics in our regressions.
• Computer Investment (IC): This is computer investment as reported inthe 2000 ASM.
• Materials (M ): These are the sum of values of materials and parts, val-ues of energy consumed (including electricity and fuels), and values ofcontract work.
• Skill Mix (MIX): This variable is defined as the number of nonpro-duction workers (OW) divided by total employment (TE) in the plant,as reported on the 1999 ASM. Computer networks require highly
406 B. K. Atrostic and Sang Nguyen

skilled workers to develop and maintain them. Productivity mightthus be higher at plants with a higher proportion of skilled labor be-cause these workers are able to develop, use, and maintain advancedtechnologies, including computer networks. But applications such asexpert systems may allow a function to be carried out with employeeswho have lower skill levels or with fewer employees.21
• SIZE: Plant size is specified as a standard series of six dummy vari-
Computer Input, Computer Networks, and Productivity 407
Table 13A.1 Computer and capital input and computer network data in the AnnualSurvey of Manufactures and the Census of Manufactures, 1987–2002
Year Total capitala,b Computer investment Computer network
Data available when study was conducted1987 X X1988198919901992 X X19931994199519961997 X19981999 X2000 X
2001 X2002 X X
aBook value.bAnnual Survey of Manufactures sample of the Census of Manufactures only.
21. Occupational detail would be desirable to test the relationship among productivity, net-works, and the presence of such skilled occupations as computer programmers and systemssupport staff (e.g., Greenan, Mairesse, and Topiol-Bensaid (2001) and Motohashi (2001).However, the ASM only collects information on the total numbers of production and nonpro-duction workers in the plant, with no further detail by process, function, or worker character-istic. Dunne and Schmitz (1995) found that plants in the 1988 SMT that used advanced tech-nologies had higher ratios of nonproduction to total workers. Doms, Dunne, and Troske(1997) find that plants that adopt new technologies have more skilled workforces both beforeand after adoption. As with many other plant-level studies, we use this employment ratio toproxy for skill mix in our productivity estimates. Production workers accounted for about one-quarter (27 percent) of employment among CNUS respondents in manufacturing. This shareis similar to shares reported for the five two-digit U.S. Standard Industrial Classification (SIC)industries in the 1988 and 1993 SMTs (e.g., McGuckin, Streitwieser, and Doms 1998).
However, some production workers are in highly skilled occupations, and some nonpro-duction workers are in relatively less-skilled jobs such as janitors, and the literature is scarcelyunanimous that the nonproduction labor share is a measure of skill (e.g., Dunne, Halti-wanger, and Troske [1997]; Berman, Bound, and Griliches [1994]). We follow Dunne et al.(2000) in both using this measure and being cautious in interpreting it as an indicator of skill.
ables. About 30 percent of the plants in our core CNUS sample havefewer than 50 employees, 20 percent have between 50 and 99 employ-ees, about 30 percent have between 100 and 250 employees, and the re-maining 20 percent are in larger plants.
• Multiunit Firms’ Plants (MULTI): Many manufacturing plants arepart of multiunit firms, so employment size alone is an inadequate in-dicator of available resources, managerial expertise, and scale. Weconstruct a dummy variable, MULTI, that takes on the value of one ifthe plant is part of a multiunit firm, and equals zero otherwise. Nearlytwo-thirds of the plants in our sample are part of a multiunit firm.
• Industries (IND): All previous studies of plant-level behavior notesubstantial heterogeneity among plants within detailed manufactur-ing industries as well as between detailed industries. There are twenty-one three-digit NAICS manufacturing industry groups in our sample(NAICS codes 311–316, 321–327 and 331–337). Industry dummies(IND) are included in the basic empirical model specifications to cap-ture industry-specific effects on plant-level labor productivity.
References
Atrostic, B. K., J. Gates, and R. Jarmin. 2000. Measuring the electronic economy:Current status and next step. Center for Economic Studies Discussion Papers inEconomics no. CES 00-10. Washington, DC: U.S. Bureau of the Census, June.
Atrostic, B. K., and S. Nguyen. 2005. IT and productivity n U.S. manufacturing:Do computer networks matter. Economic Inquiry 43 (30): 493–506.
Baily, M. N., C. Hulten, and D. Campbell. 1992. Productivity dynamics in manu-facturing plants. Brookings Papers on Economic Activity, Microeconomics: 187–267.
Baldwin, J., and D. Sabourin. 2004. Impact of the adoption of advanced infor-mation and communication technologies on firm performance in the Cana-dian manufacturing sector. Analytical Studies Research Paper no.11F0019MIE20001174. Ottowa, Canada: Statistics Canada.
Bartelsman, E., G. van Leeuwen, and H. R. Nieuwenhuijsen. 1996. Advancedmanufacturing technology and firm performance in the Netherlands. Nether-lands Official Statistics 11 (autumn): 40–51.
Barua, A., D. J. Kriebel, and T. Mukhopadhyay. 1995. Information technologiesand business value: An analytic and empirical investigation. Information Sys-tems Research 6 (1): 3–23.
Becker, R., J. Haltiwanger, R. Jarmin, S. Klimek, and D. Wilson. 2004. Micro andmacro data integration: The case of capital. Paper presented at the NBER/CRIW conference on the Architecture of the National Accounts, Washington,DC.
Berman, E., J. Bound, and Z. Griliches. 1994. Changes in the demand for skilled la-bor within U.S. manufacturing: Evidence from the Annual Survey of Manufac-turers. The Quarterly Journal of Economics 109 (2): 367–97.
Bosworth, B., and J. Triplett. 2001. What’s new about the new economy? IT, eco-
408 B. K. Atrostic and Sang Nguyen
nomic growth and productivity. International Productivity Monitor 2 (spring):19–30.
Bresnahan, T., and S. Greenstein. 1997. Technical progress and coinvention incomputing and the uses of computers. Brookings Papers on Economic Activity,Macroeconomics: 1–78.
Bresnahan, T., and M. Trajtenberg. 1995. General purpose technologies: Enginesof Growth? Journal of Econometrics 65:83–108.
Brynjolfsson, E., and L. M. Hitt. 2000. Beyond computation: Information tech-nology, organizational transformation and business performance. Journal ofEconomic Perspectives 14 (fall): 23–48.
———. 2003. Computing productivity: Firm-level evidence. Review of Economicsand Statistics 84 (4): 793–808.
Brynjolfsson, E., L. Hitt, S. Yang, M. N. Baily, and R. Hall. 2002. Intangible assets:Computers and organizational capital/comments and discussion. Brookings Pa-pers on Economic Activity, Issue no. 1:137–99.
Clayton, T., C. Criscuolo, P. Goodridge, and K. Waldron. 2004. Enterprise e-commerce: Measurement and impact. In The economic impact of ICT, ed. D. Pi-lat, 241–60. Paris: Organization for Economic Cooperation and Development.
Cooper, R., J. Haltiwanger, and L. Power. 1999. Machine replacement and the busi-ness cycle: Lumps and bumps. American Economic Review 89 (5): 921–46.
Criscuolo, C., J. E. Haskel, and M. J. Slaughter. 2005. Global engagement and theinnovation activities of firms. NBER Working Paper no. 11479. Cambridge,MA: National Bureau of Economic Research.
Dedrick, J., V. Gurbaxani, and K. Kraemer. 2003. Information technology and eco-nomic performance: A critical review of the empirical evidence. ACM Comput-ing Surveys 35 (1): 1–28.
Doms, M. 1996. Estimating capital efficiency schedules within production func-tions. Economic Inquiry 34 (1): 78–92.
Doms, M., T. Dunne, and K. Troske. 1997. Workers, wages, and technology. TheQuarterly Journal of Economics 112 (1): 253–90.
Dunne, T., L. Foster, J. Haltiwanger, and K. Troske. 2000. Wage and productivitydispersion in U.S. manufacturing: The role of computer investment. NBERWorking Paper no. 7465. Cambridge, MA: National Bureau of Economic Re-search.
Dunne, T., J. Haltiwanger, and K. R. Troske. 1997. Technology and jobs: Secularchanges and cyclical dynamics. Carnegie-Rochester Conference Series on PublicPolicy 46 (June): 107–48.
Dunne, T., and J. A. Schmitz, Jr. 1995. Wages, employment structure and employersize-wage premia: Their relationship to advances-technology usage at U.S. man-ufacturing establishments. Economica 62 (245): 89–107.
Greenan, N., J. Mairesse, and A. Topiol-Bensaid. 2001. Information technologyand research and development impacts on productivity and skills: Looking forcorrelations on French firm level data. NBER Working Paper no. 8075. Cam-bridge, MA: National Bureau of Economic Research, January.
Griliches, Z. 1994. Productivity, R&D, and the data constraint. American Eco-nomic Review 84 (1): 1–23.
Griliches, Z., and J. Mairesse. 1995. Production functions: The search for identifi-cation. In Practicing econometrics: Essays in method and application, ed. ZviGriliches, 383–411. Cheltenham, UK: Edgar Elgar, 1998.
Haltiwanger, J., and R. Jarmin. 2000. Measuring the digital economy. In Under-standing the digital economy, ed. E. Brynjolfsson and B. Kahin, 13–33. Cam-bridge, MA: MIT Press.
Computer Input, Computer Networks, and Productivity 409
Haltiwanger, J., R. Jarmin, and T. Schank. 2003. Productivity, investment in ICTand market experimentation: Micro evidence from Germany and the U.S. Cen-ter for Economic Studies Discussion Papers in Economics no. CES-03-06. Wash-ington, DC: U.S. Bureau of the Census, February.
Jorgenson, D., M. Ho, and K. Stiroh. 2005. Growth of U.S. industries and invest-ments in information technology and higher education. In Measuring capital inthe new economy, ed. C. Corrado, J. Haltiwanger, and D. Sichel, 403–78. Studiesin Income and Wealth, vol. 65. Chicago: University of Chicago Press.
Jorgenson, D. W., and K. J. Stiroh. 2000. Industry-level productivity and competi-tiveness between Canada and the United States. American Economic Review 90(May): 161–67.
McGuckin, R. H., M. L. Streitwieser, and M. E. Doms. 1998. The effect of tech-nology use on productivity growth. Economic Innovation and New TechnologyJournal, 7 (October): 1–26.
Mesenbourg, T. 2001. Measuring electronic business. http://www.census.gov/estats.Motohashi, K. 2001. Economic analysis of information network use: Organiza-
tional and productivity impacts on Japanese firms. METI Research and Statis-tics Department Working Paper. Tokyo: METI, January.
———. 2003. Firm-level analysis of information network use and productivity inJapan. Paper presented at Comparative Analysis of Enterprise Data (CAED)conference, London.
Oliner, S. D., and D. E. Sichel. 2000. The resurgence of growth in the late 1990s: Isinformation technology the story? Journal of Economic Perspectives 14 (4): 3–22.
Pilat, D., ed. 2004. The economic impact of ICT. Paris: Organization for EconomicCooperation and Development.
Power, L. 1998. The missing link: Technology, investment, and productivity. Reviewof Economics and Statistics 80 (2): 300–313.
Schreyer, P. 1999. OECD manual on productivity measurement: A guide to the mea-surement of industry-level and aggregate productivity growth. Paris: Organizationfor Economic Cooperation and Development.
Stiroh, K. J. 2004. Reassessing the impact of IT in the production function: A meta-analysis. New York: Federal Reserve Bank of New York.
Stolarick, K. M. 1999a. Are some firms better at IT? Differing relationships be-tween productivity and IT spending. Center for Economic Studies Working Pa-per no. 99-13. Washington, DC: U.S. Bureau of the Census.
———. 1999b. IT spending and firm productivity: Additional evidence from themanufacturing sector. Center for Economic Studies Working Paper no. 99-10.Washington, DC: U.S. Bureau of the Census.
Triplett, J., and B. Bosworth. 2003. Baumol’s disease has been cured: IT and multi-factor productivity in U.S. services industries. Federal Reserve Bank of New YorkEconomic Policy Review 9 (3): 23–33.
U.S. Census Bureau. 2001. General summary: 1997 Economic Census, manufactur-ing. http://www.census.gov/prod/ec97/97m31s-gs.pdf.
———. 2002. E-stats. http://www.census.gov/estats.Wilson, D. 2004. Productivity and capital heterogeneity: A firm-level analysis. Fed-
eral Reserve Bank of San Francisco. Unpublished Mimeograph.
410 B. K. Atrostic and Sang Nguyen
Related Documents