DU-05982-001_v03 | November 2011 User Guide COMPUTE COMMAND LINE PROFILER

Compute Command Line Profiler User Guide
Oct 23, 2014
Welcome message from author
This document is posted to help you gain knowledge. Please leave a comment to let me know what you think about it! Share it to your friends and learn new things together.
Transcript
DU-05982-001_v03 | November 2011
User Guide
COMPUTE COMMAND LINE PROFILER

www.nvidia.com
Compute Command Line Profiler DU-05982-001_v03 | ii
DOCUMENT CHANGE HISTORY
DU-05982-001_v03
Version Date Authors Description of Change
01 September 9, 2011 SS, VS Initial release. Note: Some of this content was published as part of the Compute Visual Profiler User Guide DU-05162-001_v04.
v02 October 14, 2011 SS, VS Minor updates for CUDA 4.1 RC1 release:
Removed list of counters.
Added a reference to the CUPTI users guide.
Updated sample output.
v03 November 14, 2011 SS, VS Added new section, “Command Line Profiler Default Output”.
Updated command line profiler options table, Table 2.
www.nvidia.com
Compute Command Line Profiler DU-05982-001_v03 | iii
TABLE OF CONTENTS
Compute Command Line Profiler ........................................................... 4
Overview ....................................................................................................... 4
Command Line Profiler Control ............................................................................. 4
Command Line Profiler Default Output .................................................................... 6
Command Line Profiler Configuration ..................................................................... 7
Command Line Profiler Options ......................................................................... 7
Command Line Profiler Counters .......................................................................... 10
Command Line Profiler Output ............................................................................ 11
LIST OF TABLES
Table 1. Command Line Profiler Default Columns ...................................................... 6
Table 2. Command Line Profiler Options ................................................................ 7

www.nvidia.com
Compute Command Line Profiler DU-05982-001_v03 | 4
COMPUTE COMMAND LINE PROFILER
OVERVIEW
This document is intended for users of Compute Command Line Profiler for NVIDIA®
CUDATM technology. Compute Command Line Profiler is a command line based profiling
tool that can be used to measure performance and find potential opportunities for
optimization in order to achieve maximum performance from NVIDIA® GPUs.
The command line profiler allows users to gather timing information about kernel
execution and memory transfer operations for CUDA and OpenCL applications. Profiling
options are controlled through environment variables and a profiler configuration file.
Profiler output is generated in text files either in Key-Value-Pair (KVP) or Comma
Separated (CSV) format.
COMMAND LINE PROFILER CONTROL
The command line profiler is controlled using the following environment variables:
COMPUTE_PROFILE: is set to either 1 or 0 (or unset) to enable or disable profiling.
COMPUTE_PROFILE_LOG: is set to the desired file path for profiling output. In case of
multiple contexts you can add ‘%d’ in the COMPUTE_PROFILE_LOG name. This will
generate separate profiler output files for each context - with ‘%d’ substituted by the
context number. Contexts are numbered starting with zero. In case of multiple processes
you can add ‘%p’ in the COMPUTE_PROFILE_LOG name. This will generate separate
profiler output files for each process - with ‘%p’ substituted by the process id. If there is no
log path specified, the profiler will log data to ‚cuda_profile_%d.log‛ in case of a CUDA
context and ‚opencl_profile_%d.log‛ in case of a OpenCL context (‘%d’ is substituted by
the context number).
Compute Command Line Profiler
www.nvidia.com
Compute Command Line Profiler DU-05982-001_v03 | 5
COMPUTE_PROFILE_CSV: is set to either 1 (set) or 0 (unset) to enable or disable a
comma separated version of the log output.
COMPUTE_PROFILE_CONFIG: is used to specify a config file for enabling performance
counters in the GPU.
Configuration details are covered in a subsequent section.
The old environment variables, which were used specifically for CUDA/OpenCL are still
supported. The old environment variables for the above functionalities are:
CUDA_PROFILE/OPENCL_PROFILE
CUDA_PROFILE_LOG/OPENCL_PROFILE_LOG
CUDA_PROFILE_CSV/OPENCL_PROFILE_CSV
CUDA_PROFILE_CONFIG/OPENCL_PROFILE_CONFIG
If CUDA_PROFILE or OPENCL_PROFILE are explicitly set and the
COMPUTE_PROFILE environment variable is not set, the profiler outputs only the
corresponding contexts. If both are set, the COMPUTE_PROFILE environment variables
take precedence over CUDA_PROFILE/OPENCL_PROFILE environment variable.

Compute Command Line Profiler
www.nvidia.com
Compute Command Line Profiler DU-05982-001_v03 | 6
COMMAND LINE PROFILER DEFAULT OUTPUT
Table 1 describes the columns that are output in the profiler log by default.
Table 1. Command Line Profiler Default Columns
Column Description
method This is character string which gives the name of the GPU kernel or memory copy method. In case of kernels the method name is the mangled name generated by the compiler.
gputime This column gives the execution time for the GPU kernel or memory copy method. This value is calculated as (gpuendtimestamp – gpustarttimestamp)/1000.0. The column value is a single precision floating point value in microseconds.
cputime For non-blocking methods the cputime is only the CPU or host side overhead to launch the method. In this case:
walltime = cputime + gputime
For blocking methods cputime is the sum of gputime and CPU overhead. In this case:
walltime = cputime
Note all kernel launches by default are non-blocking. But if any of the profiler counters are enabled kernel launches are blocking. Also asynchronous memory copy requests in different streams are non-blocking.
The column value is a single precision floating point value in microseconds.
occupancy This column gives the multiprocessor occupancy which is the ratio of number of active warps to the maximum number of warps supported on a multiprocessor of the GPU. This is helpful in determining how efficient the kernel will be on the GPU. This column is output only for GPU kernels and the column value is a single precision floating point value in the range 0.0 to 1.0.

Compute Command Line Profiler
www.nvidia.com
Compute Command Line Profiler DU-05982-001_v03 | 7
COMMAND LINE PROFILER CONFIGURATION
The profiler configuration file is used to select the profiler options and counters which are
to be collected during application execution. The configuration file is a simple format text
file with one option on each line. Options can be commented out using the ‘#’ character at
the start of a line. The profiler configuration options are same for CUDA and OpenCL, but
the column names in the profiler output is different for some options. Refer the command
line profiler options table for the column names.
Command Line Profiler Options
Table 2 contains the options supported by the command line profiler. Note the following
regarding the profiler log that is produced from the different options:
Typically, each profiler option corresponds to a single column is output. There are a
few exceptions in which case multiple columns are output; these are noted where
applicable in Table 2.
In most cases the column name is the same as the option name; the exceptions are listed
in Table 2.
In most cases the column values are 32-bit integers in decimal format; the exceptions
are listed in Table 2.
Table 2. Command Line Profiler Options
Option Description
gpustarttimestamp Time stamp when a kernel or memory transfer starts.
The column values are 64-bit unsigned value in nanoseconds in hexadecimal format.
gpuendtimestamp Time stamp when a kernel or memory transfer completes.
The column values are 64-bit unsigned value in nanoseconds in hexadecimal format.
timestamp Time stamp when a kernel or memory transfer starts. The column values are single precision floating point value in microseconds. Use of the gpustarttimestamp column is recommended as this provides a more accurate time stamp.

Compute Command Line Profiler
www.nvidia.com
Compute Command Line Profiler DU-05982-001_v03 | 8
Option Description
gridsize Number of blocks in a grid along the X and Y dimensions for a kernel launch.
This option outputs the following two columns:
CUDA:
gridsizeX
gridsizeY
OpenCL:
ndrangesizeX
ndrangesizeY
gridsize3d Number of blocks in a grid along the X, Y and Z dimensions for a kernel launch.
This option outputs the following three columns:
CUDA:
gridsizeX
gridsizeY
gridsizeZ
OpenCL:
ndrangesizeX
ndrangesizeY
ndrangesizeZ
threadblocksize Number of threads in a block along the X, Y and Z dimensions for a kernel launch.
This option outputs the following three columns:
CUDA:
threadblocksizeX
threadblocksizeY
threadblocksizeZ
OpenCL:
workgroupsizeX
workgroupsizeY
workgroupsizeZ
dynsmemperblock Size of dynamically allocated shared memory per block in bytes for a kernel launch. (Only CUDA)
stasmemperblock Size of statically allocated shared memory per block in bytes for a kernel launch.
This option outputs the following columns:
CUDA:
stasmemperblock
OpenCL:
Stasmemperworkgroup
Compute Command Line Profiler
www.nvidia.com
Compute Command Line Profiler DU-05982-001_v03 | 9
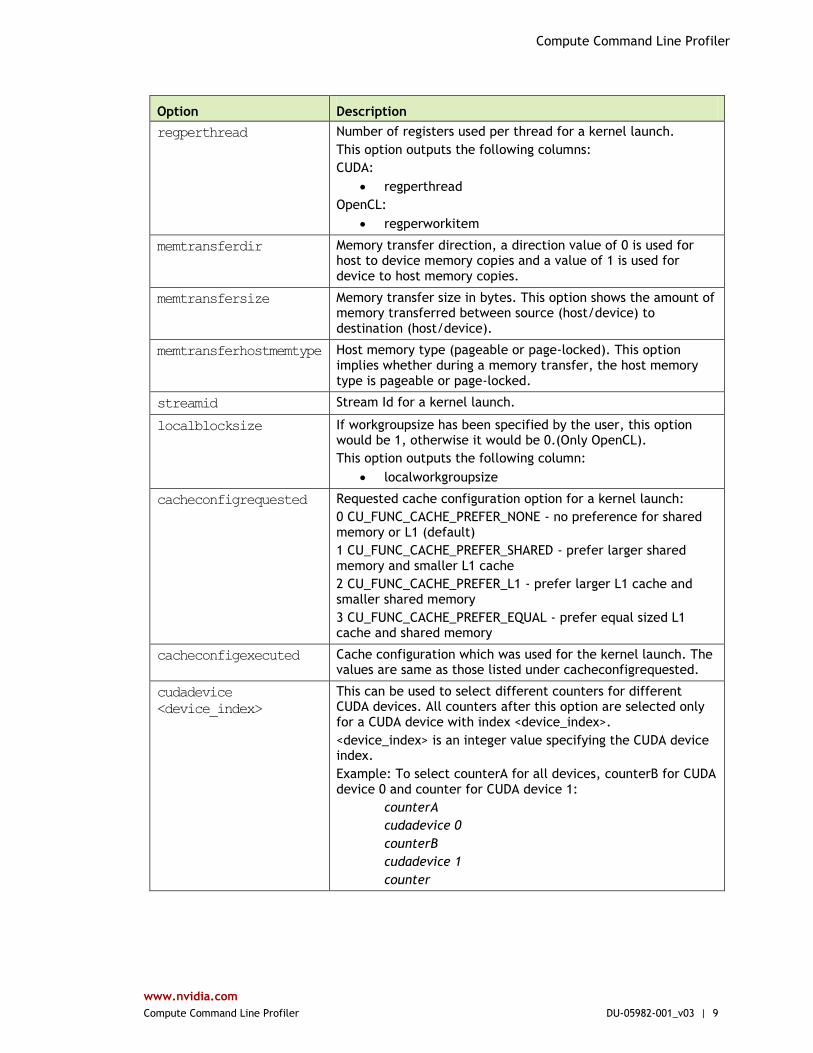
Option Description
regperthread Number of registers used per thread for a kernel launch.
This option outputs the following columns:
CUDA:
regperthread
OpenCL:
regperworkitem
memtransferdir Memory transfer direction, a direction value of 0 is used for host to device memory copies and a value of 1 is used for device to host memory copies.
memtransfersize Memory transfer size in bytes. This option shows the amount of memory transferred between source (host/device) to destination (host/device).
memtransferhostmemtype Host memory type (pageable or page-locked). This option implies whether during a memory transfer, the host memory type is pageable or page-locked.
streamid Stream Id for a kernel launch.
localblocksize If workgroupsize has been specified by the user, this option would be 1, otherwise it would be 0.(Only OpenCL).
This option outputs the following column:
localworkgroupsize
cacheconfigrequested Requested cache configuration option for a kernel launch:
0 CU_FUNC_CACHE_PREFER_NONE - no preference for shared memory or L1 (default)
1 CU_FUNC_CACHE_PREFER_SHARED - prefer larger shared memory and smaller L1 cache
2 CU_FUNC_CACHE_PREFER_L1 - prefer larger L1 cache and smaller shared memory
3 CU_FUNC_CACHE_PREFER_EQUAL - prefer equal sized L1 cache and shared memory
cacheconfigexecuted Cache configuration which was used for the kernel launch. The values are same as those listed under cacheconfigrequested.
cudadevice
<device_index>
This can be used to select different counters for different CUDA devices. All counters after this option are selected only for a CUDA device with index <device_index>.
<device_index> is an integer value specifying the CUDA device index.
Example: To select counterA for all devices, counterB for CUDA device 0 and counter for CUDA device 1:
counterA
cudadevice 0
counterB
cudadevice 1
counter

Compute Command Line Profiler
www.nvidia.com
Compute Command Line Profiler DU-05982-001_v03 | 10
Option Description
profilelogformat
[CSV|KVP]
Choose format for profiler log.
CSV: Comma separated format
KVP: Key Value Pair format
The default format is KVP.
This option will override the format selected using the environment variable COMPUTE_PROFILE_CSV.
countermodeaggregate If this option is selected then aggregate counter values will be output. For a SM counter the counter value is the sum of the counter values from all SMs. For l1*, tex*, sm_cta_launched, uncached_global_load_transaction and global_store_transaction counters the counter value is collected for 1 SM from each GPC and it is extrapolated for all SMs. This option is supported only for CUDA devices with compute capability 2.0 or higher.
conckerneltrace This option should be used to get gpu start and end timestamp values in case of concurrent kernels. Without this option execution of concurrent kernels is serialized and the timestamps are not correct. Only CUDA devices with compute capability 2.0 or higher support execution of multiple kernels concurrently. Also if profiler counters are enabled than execution of kernels is serialized. When this option is enabled additional code is inserted for each kernel and this will result in some additional execution overhead and also it will have an impact on some profiler counter values such as “inst_issued”.
COMMAND LINE PROFILER COUNTERS
The command line profiler supports logging of counters during kernel execution. Refer
the CUPTI User’s Guide ‚Event Reference‛ sections for supported counters on GPU
devices with different compute capabilities. Note that CUPTI events are referred to as
profiler counters in the command line profiler. The event name listed in the name can be
used in the command line profiler configuration file. In every application run only a few
counter values can be collected. The number of counters depends on the specific counters
selected.

Compute Command Line Profiler
www.nvidia.com
Compute Command Line Profiler DU-05982-001_v03 | 11
COMMAND LINE PROFILER OUTPUT
If the COMPUTE_PROFILE environment variable is set to enable profiling, the profiler
log records timing information for every kernel launch and memory operation performed
by the driver. The profiler determines dynamically whether the context is CUDA or
OpenCL, and produces the output log accordingly.
The default log syntax shown in Example 1 is part of the profiler log for a CUDA
application with no profiler configuration file specified.
Example 1. CUDA Default Profiler Log- No Options or Counters Enabled (File name: “cuda_profile_0.log”)
# CUDA_PROFILE_LOG_VERSION 2.0
# CUDA_DEVICE 0 Tesla C2075
# CUDA_CONTEXT 1
# TIMESTAMPFACTOR fffff6de60e24570
method,gputime,cputime,occupancy
method=[ memcpyHtoD ] gputime=[ 80.640 ] cputime=[ 278.000 ]
method=[ memcpyHtoD ] gputime=[ 79.552 ] cputime=[ 237.000 ]
method=[ _Z6VecAddPKfS0_Pfi ] gputime=[ 5.760 ] cputime=[ 18.000 ]
occupancy=[ 1.000 ]
method=[ memcpyDtoH ] gputime=[ 97.472 ] cputime=[ 647.000 ]
The log above in Example 1 shows data for memory copies and a kernel launch. The
‘method’ label specifies the name of the memory copy method or kernel executed. The
‘gputime’ and ‘cputime’ labels specify the actual chip execution time and the driver
execution time, respectively. Note that gputime and cputime are in microseconds. The
‘occupancy’ label gives the ratio of the number of active warps per multiprocessor to the
maximum number of active warps for a particular kernel launch. This is the theoretical
occupancy and is calculated using kernel block size, register usage and shared memory
usage.

Compute Command Line Profiler
www.nvidia.com
Compute Command Line Profiler DU-05982-001_v03 | 12
Example 2 shows the profiler log of a CUDA application. There are a few options and
counters enabled in this example using the profiler configuration file:
gpustarttimestamp
gridsize3d
threadblocksize
dynsmemperblock
stasmemperblock
regperthread
memtransfersize
memtransferdir
streamid
countermodeaggregate
active_warps
active_cycles
Example 2. CUDA Profiler Log- Options and Counters Enabled
# CUDA_PROFILE_LOG_VERSION 2.0
# CUDA_DEVICE 0 Tesla C2075
# CUDA_CONTEXT 1
# TIMESTAMPFACTOR fffff6de5e08e990
gpustarttimestamp,method,gputime,cputime,gridsizeX,gridsizeY,gridsizeZ,t
hreadblocksizeX,threadblocksizeY,threadblocksizeZ,dynsmemperblock,stasme
mperblock,regperthread,occupancy,streamid,active_warps,active_cycles,mem
transfersize,memtransferdir
gpustarttimestamp=[ 124b9e484b6f3f40 ] method=[ memcpyHtoD ] gputime=[
80.800 ] cputime=[ 280.000 ] streamid=[ 1 ] memtransfersize=[ 200000 ]
memtransferdir=[ 1 ]
gpustarttimestamp=[ 124b9e484b7517a0 ] method=[ memcpyHtoD ] gputime=[
79.744 ] cputime=[ 232.000 ] streamid=[ 1 ] memtransfersize=[ 200000 ]
memtransferdir=[ 1 ]
gpustarttimestamp=[ 124b9e484b8fd8e0 ] method=[ _Z6VecAddPKfS0_Pfi ]
gputime=[ 10.016 ] cputime=[ 57.000 ] gridsize=[ 196, 1, 1 ]
threadblocksize=[ 256, 1, 1 ] dynsmemperblock=[ 0 ] stasmemperblock=[ 0
] regperthread=[ 4 ] occupancy=[ 1.000 ] streamid=[ 1 ]active_warps=[
1545830 ] active_cycles=[ 40774 ]
gpustarttimestamp=[ 124b9e484bb5a2c0 ] method=[ memcpyDtoH ] gputime=[
98.528 ] cputime=[ 672.000 ] streamid=[ 1 ] memtransfersize=[ 200000 ]
memtransferdir=[ 2 ]
The default log syntax is easy to parse with a script, but for spreadsheet analysis it might
be easier to use the comma separated format.

Compute Command Line Profiler
www.nvidia.com
Compute Command Line Profiler DU-05982-001_v03 | 13
When COMPUTE_PROFILE_CSV is set to 1, this same test produces the output log
shown in Example 3.
Example 3. CUDA Profiler Log- Options and Counters Enabled in CSV Format
# CUDA_PROFILE_LOG_VERSION 2.0
# CUDA_DEVICE 0 Tesla C2075
# CUDA_CONTEXT 1
# CUDA_PROFILE_CSV 1
# TIMESTAMPFACTOR fffff6de5d77a1c0
gpustarttimestamp,method,gputime,cputime,gridsizeX,gridsizeY,gridsizeZ,t
hreadblocksizeX,threadblocksizeY,threadblocksizeZ,dynsmemperblock,stasme
mperblock,regperthread,occupancy,streamid,active_warps,active_cycles,mem
transfersize,memtransferdir
124b9e85038d1800,memcpyHtoD,80.352,286.000,,,,,,,,,,,1,,,200000,1
124b9e850392ee00,memcpyHtoD,79.776,232.000,,,,,,,,,,,1,,,200000,1
124b9e8503af7460,_Z6VecAddPKfS0_Pfi,10.048,59.000,196,1,1,256,1,1,0,0,4,
1.000,1,1532814,42030
124b9e8503d4f280,memcpyDtoH,97.888,672.000,,,,,,,,,,,1,,,200000,2
The following examples are for OpenCL applications. Example 4 is part of the log from a
test of the scan application without any counters enabled.
Example 4. OpenCL Default Profiler Log- No Options or Counters Enabled (File name: “opencl_profile_0.log”)
# OPENCL_PROFILE_LOG_VERSION 2.0
# OPENCL_DEVICE 0 Tesla C2075
# OPENCL_CONTEXT 1
# TIMESTAMPFACTOR fffff6de5cc2c1d0
method,gputime,cputime,occupancy
method=[ memcpyDtoHasync ] gputime=[ 72409.602 ] cputime=[ 73403.000 ]
method=[ memcpyDtoHasync ] gputime=[ 72764.414 ] cputime=[ 73674.000 ]
method=[ VectorAdd ] gputime=[ 1256.480 ] cputime=[ 18.000 ] occupancy=[
1.000 ]
method=[ memcpyHtoDasync ] gputime=[ 124819.328 ] cputime=[ 129170.000 ]
The description of the output is same as that in Example 1.

Compute Command Line Profiler
www.nvidia.com
Compute Command Line Profiler DU-05982-001_v03 | 14
Example 5 shows the profiler log for a OpenCL application with some options and
counters enabled using the same configuration file as for Example 2:
Example 5. OpenCL Profiler Log- Options and Counters Enabled
# OPENCL_PROFILE_LOG_VERSION 2.0
# OPENCL_DEVICE 0 Tesla C2075
# OPENCL_CONTEXT 1
# TIMESTAMPFACTOR fffff6de5c479690
gpustarttimestamp,method,gputime,cputime,ndrangesizeX,ndrangesizeY,ndran
gesizeZ,workgroupsizeX,workgroupsizeY,workgroupsizeZ,stapmemperworkgroup
,regperworkitem,occupancy,streamid,active_warps,active_cycles,memtransfe
rsize,memtransferdir
gpustarttimestamp=[ 124b9f03b0a9c540 ] method=[ memcpyDtoHasync ]
gputime=[ 71607.328 ] cputime=[ 72573.000 ] streamid=[ 6 ]
memtransfersize=[ 45779968 ] memtransferdir=[ 2 ]
gpustarttimestamp=[ 124b9f03b51376a0 ] method=[ memcpyDtoHasync ]
gputime=[ 72692.258 ] cputime=[ 73589.000 ] streamid=[ 6 ]
memtransfersize=[ 45779968 ] memtransferdir=[ 2 ]
gpustarttimestamp=[ 124b9f03b9881940 ] method=[ VectorAdd ] gputime=[
1255.936 ] cputime=[ 1310.000 ] ndrangesize=[ 44707, 1, 1 ]
workgroupsize=[ 256, 1, 1 ] stapmemperworkgroup=[ 0 ] regperworkitem=[ 4
] occupancy=[ 1.000 ] streamid=[ 6 ]active_warps=[ 388164035 ]
active_cycles=[ 10046628 ]
gpustarttimestamp=[ 124b9f03b9c7ffa0 ] method=[ memcpyHtoDasync ]
gputime=[ 125990.852 ] cputime=[ 130365.000 ] streamid
=[ 6 ] memtransfersize=[ 45779968 ] memtransferdir=[ 1 ]
When COMPUTE_PROFILE_CSV is set to 1, this same test produces the following
output:
Example 6. OpenCL Profiler Log- Options and Counters Enabled in CSV Format
# OPENCL_PROFILE_LOG_VERSION 2.0
# OPENCL_DEVICE 0 Tesla C2075
# OPENCL_CONTEXT 1
# OPENCL_PROFILE_CSV 1
# TIMESTAMPFACTOR fffff6de5c12c270
gpustarttimestamp,method,gputime,cputime,ndrangesizeX,ndrangesizeY,ndran
gesizeZ,workgroupsizeX,workgroupsizeY,workgroupsizeZ,stapmemperworkgroup
,regperworkitem,occupancy,streamid,active_warps,active_cycles,memtransfe
rsize,memtransferdir
124b9f19a3d23840,memcpyDtoHasync,71908.961,72946.000,,,,,,,,,,6,,,457799
68,2
124b9f19a83f5be0,memcpyDtoHasync,72832.125,73732.000,,,,,,,,,,6,,,457799
68,2
124b9f19acb65a40,VectorAdd,1255.648,1311.000,44707,1,1,256,1,1,0,4,1.000
,6,387752953,10045923
124b9f19acf1a780,memcpyHtoDasync,126117.953,129953.000,,,,,,,,,,6,,,4577
9968,1

www.nvidia.com
Notice
ALL NVIDIA DESIGN SPECIFICATIONS, REFERENCE BOARDS, FILES, DRAWINGS, DIAGNOSTICS, LISTS, AND OTHER DOCUMENTS (TOGETHER AND SEPARATELY, “MATERIALS”) ARE BEING PROVIDED “AS IS.” NVIDIA MAKES NO WARRANTIES, EXPRESSED, IMPLIED, STATUTORY, OR OTHERWISE WITH RESPECT TO THE MATERIALS, AND EXPRESSLY DISCLAIMS ALL IMPLIED WARRANTIES OF NONINFRINGEMENT, MERCHANTABILITY, AND FITNESS FOR A PARTICULAR PURPOSE.
Information furnished is believed to be accurate and reliable. However, NVIDIA Corporation assumes no responsibility for the consequences of use of such information or for any infringement of patents or other rights of third parties that may result from its use. No license is granted by implication of otherwise under any patent rights of NVIDIA Corporation. Specifications mentioned in this publication are subject to change without notice. This publication supersedes and replaces all other information previously supplied. NVIDIA Corporation products are not authorized as critical components in life support devices or systems without express written approval of NVIDIA Corporation.
OpenCL
OpenCL is a trademark of Apple Inc. used under license to the Khronos Group Inc.
Trademarks
NVIDIA, the NVIDIA logo, and <add all the other product names listed in this document> are trademarks and/or registered trademarks of NVIDIA Corporation in the U.S. and other countries. Other company and product names may be trademarks of the respective companies with which they are associated.
Copyright
© 2012 NVIDIA Corporation. All rights reserved.
Related Documents