Compressive Holography David J. Brady, Kerkil Choi, Daniel L. Marks, Ryoichi Horisaki and Sehoon Lim Department of Electrical and Computer Engineering and The Fitzpatrick Institute for Photonics, Duke University, Durham, NC 27708. [email protected] Abstract: Compressive sampling enables signal reconstruction using less than one measurement per reconstructed signal value. Compressive measurement is particularly useful in generating multidimensional images from lower dimensional data. We demonstrate single frame 3D tomography from 2D holographic data. © 2009 Optical Society of America OCIS codes: (090.1995) Digital holography; (070.0070) Fourier optics and signal processing. References and links 1. C. E. Shannon, “Communications in the presence of noise,” in Proc.of the IREv 37, 10–21 (1949). 2. M. Golay, “Multislit spectroscopy,” J. Opt. Soc. Am. 39, 437–444 (1949). 3. E. J. Candes, J. K. Romberg, and T. Tao, “Stable signal recovery from incomplete and inaccurate measurements,” Communications on Pure and Applied Mathematics 59, 1207–1223 (2006). 4. E. J. Candes and T. Tao, “Near-optimal signal recovery from random projections: Universal encoding strategies?,” IEEE Transactions on Information Theory 52(12), 5406–5425 (2006). 5. D. L. Donoho, “Compressed sensing,” IEEE Transactions on Information Theory 52(4), 1289–1306 (2006). 6. D. Takhar, J. N. Laska, M. B. Wakin, M. F. Duarte, D. Baron, S. Sarvotham, K. F. Kelly, and R. G. Baraniuk, “A new compressive imaging camera architecture using optical-domain compression,” in Computational Imaging IV, 6065, (San Jose, CA, USA), p. 606509, SPIE, 2006. 7. M. E. Gehm, R. John, D. J. Brady, R. M. Willett, and T. J. Schulz, “Single-shot compressive spectral imaging with a dual-disperser architecture,” Opt. Express 15(21), 14013–14027 (2007). 8. A. Wagadarikar, R. John, R. Willett, and D. J. Brady, “Single disperser design for coded aperture snapshot spectral imaging,” Appl. Opt. 47(10), B44–B51 (2008). 9. D. Gabor, “A new microscopic principle,” Nature 161, 777–778 (1948). 10. E. N. Leith and J. Upatnieks, “Reconstructed wavefronts and communication theory,” J. Opt. Soc. Am. 52, 1123–1130 (1962). 11. S. Seo, T. W. Su, D. K. Tseng, A. Erlinger, and A. Ozcan, “Lensfree holographic imaging for on-chip cytometry and diagnostics,” Lab on a Chip 9(6), 777–787 (2009). 12. W. Jueptner and U. Schnars, Digital Holography, (New York, Springer-Verlag, Berlin Heidelberg, 2005). 13. T. C. Poon, Digital holography and three-dimensional display, (New York; London: Springer, 2006). 14. M. E. Brezinski, Optical coherence tomography. (Amsterdam; Boston: Academic Press, 2006). 15. D. L. Marks, R. A. Stack, D. J. Brady, D. C. Munson, and R. B. Brady, “Visible cone-beam tomography with a lensless interferometric camera,” Science 284(5423), 2164–2166 (1999). 16. J. Sharpe, U. Ahlgren, P. Perry, B. Hill, A. Ross, and J. Hecksher-Sorensen, R. Baldock, and D. Davidson, “Optical projection tomography as a tool for 3d microscopy and gene expression studies,” Science 296(5567), 541–545 (2002). 17. A. J. Devaney, “Nonuniqueness in the inverse scattering problem,” Journal of Mathematical Physics 19(7), 1526–1531 (1978). 18. A. J. Devaney, “Geophysical diffraction tomography,” IEEE Transactions on Geoscience and Remote Sensing GE-22, 3–13 (1984). 19. W. L. Chan, M. L. Moravec, R. G. Baraniuk, and D. M. Mittleman, “Terahertz imaging with compressed sensing and phase retrieval,” Opt. Lett. 33(9), 974–976 (2008). 20. I. Yamaguchi, K. Yamamoto, G. A. Mills, and M. Yokota, “Image reconstruction only by phase data in phase- shifting digital holography,” Appl. Opt. 45(5), 975–983 (2006). (C) 2009 OSA 20 July 2009 / Vol. 17, No. 15 / OPTICS EXPRESS 13040 #111469 - $15.00 USD Received 18 May 2009; revised 2 Jul 2009; accepted 5 Jul 2009; published 15 Jul 2009

Welcome message from author
This document is posted to help you gain knowledge. Please leave a comment to let me know what you think about it! Share it to your friends and learn new things together.
Transcript
Compressive Holography
David J. Brady, Kerkil Choi, Daniel L. Marks, Ryoichi Horisaki andSehoon Lim
Department of Electrical and Computer Engineering and The Fitzpatrick Institute forPhotonics,
Duke University, Durham, NC 27708.
Abstract: Compressive sampling enables signal reconstruction usingless than one measurement per reconstructed signal value. Compressivemeasurement is particularly useful in generating multidimensional imagesfrom lower dimensional data. We demonstrate single frame 3D tomographyfrom 2D holographic data.
© 2009 Optical Society of America
OCIS codes: (090.1995) Digital holography; (070.0070) Fourier optics and signal processing.
References and links1. C. E. Shannon, “Communications in the presence of noise,” in Proc.of the IREv 37, 10–21 (1949).2. M. Golay, “Multislit spectroscopy,” J. Opt. Soc. Am. 39, 437–444 (1949).3. E. J. Candes, J. K. Romberg, and T. Tao, “Stable signal recovery from incomplete and inaccurate measurements,”
Communications on Pure and Applied Mathematics 59, 1207–1223 (2006).4. E. J. Candes and T. Tao, “Near-optimal signal recovery from random projections: Universal encoding strategies?,”
IEEE Transactions on Information Theory 52(12), 5406–5425 (2006).5. D. L. Donoho, “Compressed sensing,” IEEE Transactions on Information Theory 52(4), 1289–1306 (2006).6. D. Takhar, J. N. Laska, M. B. Wakin, M. F. Duarte, D. Baron, S. Sarvotham, K. F. Kelly, and R. G. Baraniuk, “A
new compressive imaging camera architecture using optical-domain compression,” in Computational ImagingIV, 6065, (San Jose, CA, USA), p. 606509, SPIE, 2006.
7. M. E. Gehm, R. John, D. J. Brady, R. M. Willett, and T. J. Schulz, “Single-shot compressive spectral imagingwith a dual-disperser architecture,” Opt. Express 15(21), 14013–14027 (2007).
8. A. Wagadarikar, R. John, R. Willett, and D. J. Brady, “Single disperser design for coded aperture snapshot spectralimaging,” Appl. Opt. 47(10), B44–B51 (2008).
9. D. Gabor, “A new microscopic principle,” Nature 161, 777–778 (1948).10. E. N. Leith and J. Upatnieks, “Reconstructed wavefronts and communication theory,” J. Opt. Soc. Am. 52,
1123–1130 (1962).11. S. Seo, T. W. Su, D. K. Tseng, A. Erlinger, and A. Ozcan, “Lensfree holographic imaging for on-chip cytometry
and diagnostics,” Lab on a Chip 9(6), 777–787 (2009).12. W. Jueptner and U. Schnars, Digital Holography, (New York, Springer-Verlag, Berlin Heidelberg, 2005).13. T. C. Poon, Digital holography and three-dimensional display, (New York; London: Springer, 2006).14. M. E. Brezinski, Optical coherence tomography. (Amsterdam; Boston: Academic Press, 2006).15. D. L. Marks, R. A. Stack, D. J. Brady, D. C. Munson, and R. B. Brady, “Visible cone-beam tomography with a
lensless interferometric camera,” Science 284(5423), 2164–2166 (1999).16. J. Sharpe, U. Ahlgren, P. Perry, B. Hill, A. Ross, and J. Hecksher-Sorensen, R. Baldock, and D. Davidson,
“Optical projection tomography as a tool for 3d microscopy and gene expression studies,” Science 296(5567),541–545 (2002).
17. A. J. Devaney, “Nonuniqueness in the inverse scattering problem,” Journal of Mathematical Physics 19(7),1526–1531 (1978).
18. A. J. Devaney, “Geophysical diffraction tomography,” IEEE Transactions on Geoscience and Remote SensingGE-22, 3–13 (1984).
19. W. L. Chan, M. L. Moravec, R. G. Baraniuk, and D. M. Mittleman, “Terahertz imaging with compressed sensingand phase retrieval,” Opt. Lett. 33(9), 974–976 (2008).
20. I. Yamaguchi, K. Yamamoto, G. A. Mills, and M. Yokota, “Image reconstruction only by phase data in phase-shifting digital holography,” Appl. Opt. 45(5), 975–983 (2006).
(C) 2009 OSA 20 July 2009 / Vol. 17, No. 15 / OPTICS EXPRESS 13040#111469 - $15.00 USD Received 18 May 2009; revised 2 Jul 2009; accepted 5 Jul 2009; published 15 Jul 2009
21. R. Baraniuk and P. Steeghs, “Compressive radar imaging,” IEEE Radar Conference, pp. 128-133, April, (2007).22. L. Li, W. Zhang, F. Li, “Compressive diffraction tomography for Weakly Scattering,” Submitted to IEEE Trans.
on Geosciences and Remote Sensing (2009).23. D. L. Donoho and M. Elad, “Optimally sparse representation in general (nonorthogonal) dictionaries via �1
minimization,” Proceedings of the National Academy of Sciences of the United States of America, 100(5),2197–2202 (2003).
24. R. E. Blahut, Theory of Remote Image Formation, (Cambridge University Press, 2004).25. J. W. Goodman, Introduction to Fourier optics, 3rd Ed., (Roberts and Company Publishers, 2005).26. D. M. Paganin, Coherent X-ray Optics, (Oxford Science Publications, 2006).27. A. C. Kak and M. Slaney, Principle of Computerized Tomographic Imaging, (Society for Industrial and Applied
Mathematics, 2001).28. D. J. Brady, Optical Imaging and Spectroscopy, (Wiley, 2009).29. L. I. Rudin, S. Osher, and E. Fatemi, “Nonlinear total variation based noise removal algorithms,” Physica D
60(1-4), 259–268 (1992).30. J. M. Bioucas-Dias and M. A. T. Figueiredo, “A new twist: Two-step iterative shrinkage/thresholding algorithms
for image restoration,” , IEEE Transactions on Image Processing 16, 2992–3004 (2007).31. V. Mico, J. Garcıa, Z. Zalevsky, and B. Javidi, “Phase-shifting Gabor holography,” Opt. Express 17, 1492–1494
(2009).32. T. Latychevskaia and H. W. Fink, “Solution to the Twin Image Problem in Holography,” Phys. Rev. Lett. 98,
233901 (2007).
1. Introduction
Studies presented in 1949 by Shannon and Golay have recently collided in a major revisionto signal and image measurement theory. Shannon is traditionally cited to support the claimthat the sampling rate in a high fidelity imaging system must be greater than twice the spa-tial bandwidth [1]. Golay introduced the idea of artificial discrete multiplex coding in opticalmeasurements [2]. Candes, Tao and Romberg [3, 4] and Donoho [5] have demonstrated that sig-nals, assumed to be sparse in some basis, sampled by multiplex encodings may be accuratelyinfered with high probability using many fewer measurements than suggested by Shannon’ssampling theorem. Takhar et al. applied compressive sampling algorithms in demonstrating asingle pixel camera [6]. We have previously applied these methods with Golay-inspired codedaperture spectroscopy to demonstrate compressive measurement of 3D spectral datacubes from2D measurements [7, 8].
This paper explores the relationship between compressive sampling and a third paper fromthe late 1940’s, Gabor’s invention of holography [9]. Gabor holography is an amazingly sim-ple and effective encoder for compressive sampling. Decompressive inference improves holo-graphic systems by increasing the number of pixels or voxels one can infer from a singlehologram and by resolving reconstruction ambiguities. Holography is a comparatively effec-tive encoder for compressive imaging because holographic multiplex measurement weights arecomplex valued.
After the invention of the laser, Gabor holography was generally supplanted by off-axisLeith-Upatnieks holograpy[10]. Signal reconstruction from off-axis holograms may be under-stood simply using Shannon sampling and linear filtering theory. As illustrated by recent studiesof holographic cytometry [11], however, the simplicity of the Gabor geometry remains attrac-tive and competitive. We demonstrate in this paper that interference terms that may not beremoved from Gabor holograms by linear filtering may be removed by imposing a sparsityconstraint.
Computational imaging from electronically recorded holograms recorded on electronic de-tector arrays is called digital holography [12, 13]. Digital holography typically relies onmonochromatic laser illumination. Optical coherence tomography is a closely related tech-nique relying on multispectral illumination for 3D interferometric tomography [14]. Alternativeapproaches to optical 3D imaging include projection tomography [15, 16] and confocal mi-croscopy. Digital holography is not regarded as a 3D tomographic imaging technique because
(C) 2009 OSA 20 July 2009 / Vol. 17, No. 15 / OPTICS EXPRESS 13041#111469 - $15.00 USD Received 18 May 2009; revised 2 Jul 2009; accepted 5 Jul 2009; published 15 Jul 2009
3D object estimation from coherent scattering data is ill-posed [17]. This problem is tradition-ally addressed by recording holograms of objects illuminated by a sequence of plane waves,which forms the basis of diffraction tomography [18].
Our main result is that decompressive inference enables 3D tomography from a single 2Dmonochromatic digital hologram. While this result is in apparent conflict with Devaney’s proofthat holographic tomography is ill-posed, the overthrow of Devaney’s objection using a sparsityprior and convex optimization parallels the overthrow of Shannon sampling by similar methods.
Our results also suggest that holography may have general advantages in compressive op-tical imaging. Since the irradiance is the only observable in conventional optical imaging,multiplex measurement codes are constrained to nonnegative weights. This results in rela-tively poor measurement conditioning. Holography, in contrast, is an interferometric modalityin which both the amplitude and the phase of a field can be obtained as in radar or MRI. Thecomplex-valued encodings may provide a more direct application of compressive sensing. Chanet al. [19] have previously described phase-sensitive terahertz compressive imaging.
We note that our approach is fundamentally different than hologram data compression [20].Our approach is to directly collect a smaller number of measurements than the number ofvoxels (or pixels) in the reconstructions, whereas the hologram data compression applies datacompression to the holograms that are already obtained. The word “compressive” in this pa-per emphasizes that our holographic sampling or sensing process encodes and compresses 3Ddatacube information into 2D holographic measurements. This encoding is inverted using com-pressive sampling theory [4, 5]. Similar terminology appears in related studies [21, 22].
2. Compressive sensing background
Compressive sensing theory ensures highly accurate reconstruction for multiplex encoders thatsatisfy a sufficient condition called the restricted isometry property (RIP) [3, 4]. Let a S-sparsesignal be defined by a signal that has only S nonzero components and (N −S) coefficients thatare exactly zero. A matrix H ∈ RM×N is said to satisfy S-RIP with constant δS ∈ (0,1) if, forany S-sparse f ,
(1−δS)‖ fT‖22 ≤ ‖HT fT‖2
2 ≤ (1+δS)‖ fT‖22, (1)
where T denotes the set of indices on which the S-sparse signal is supported, and ‖·‖2 denotesthe Euclidean norm. This condition implies that for any S-sparse object to be reconstructedaccurately and reliably, the corresponding sub-matrix HT of H composed of S columns of Hhas to form a nearly isometry transformation. Note that the condition also implies that all theeigenvalues of the Gram matrix of any S-column sub-matrix HT are distributed near 1 (in factin the range of [1−δS 1 + δS]), which consequently ensures that any S-column sub-matrix HT
is well-conditioned.Let μ1(H,Ψ) be defined by
μ1(H,Ψ) =√
N max1≤m≤M1≤n≤N
|〈hm,ψn〉| , (2)
where hm and ψn denote the m-th row of H and the n-th column of Ψ, respectively. Candes etal. [3] and Donoho [5] showed that if f is S-sparse in Ψ, and M satisfies
M ≥C ·μ21 (H,Ψ) ·S · logN, (3)
then an accurate reconstruction can be obtained with high probability by solving
θe = argminθ
||θ ||1 such that g = H fe = HΨθe, (4)
(C) 2009 OSA 20 July 2009 / Vol. 17, No. 15 / OPTICS EXPRESS 13042#111469 - $15.00 USD Received 18 May 2009; revised 2 Jul 2009; accepted 5 Jul 2009; published 15 Jul 2009
where ||θ ||1 = ∑i |θi|. S denotes the number of nonzero (or significant) coefficients of f in theΨ domain. As clear from Eqn. (3), the smaller μ1 is, the more accurate the reconstruction wouldbe for the same M.
An alternative definition of coherence is given by
μ2(D) = maxi= j,1≤i, j≤N
{dT
i d j
‖di‖2‖d j‖2
}, (5)
where di is the i-th column of the sensing matrix D = HΨ. This can also be interpreted asthe maximum off-diagonal element of the Gram matrix of D, whose columns are normalized.When μ2(D) is minimal such that
S <12
(1+
1μ2(D)
), (6)
then the S-sparse is necessarily the sparsest solution that satisfies minθ‖θ‖0, and hence can beobtained by solving Eqn. (4) [23].
Note that for Ψ = I with I being an identity matrix (i.e., the canonical basis), μ1(H, I) = 1for a discrete Fourier transform (DFT) matrix H. Hence, the DFT matrix that generates Fouriersamples distributed uniformly at random over the frequency domain satisfies the so-called re-stricted isometry property with high probability given that M ≥CS logN is satisfied. Our Gaborhologram multiplex encoder may be considered as 3D Fourier transform encoder. However,our Fourier samples are limited to a certain band volume, which may produce a relatively largeμ1, larger than 1 in general. Holographic measurements using illumination with multiple wave-lengths and/or angles can provide the Fourier samples over a larger band volume improving μ1
and, consequently, the RIP for our Gabor hologram multiplex encoder.
3. Theory and Methods
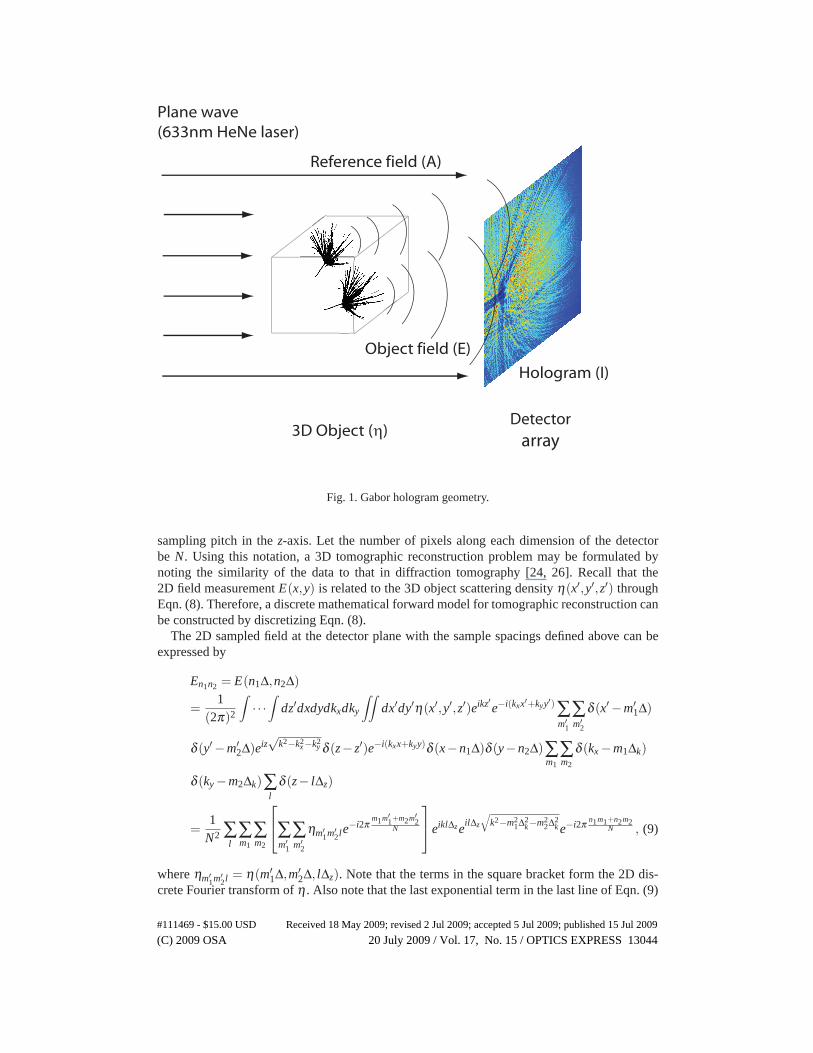
As illustrated in Fig. 1, a Gabor hologram is formed in interference between a plane wave Aand a 3D object with scattering density η(x′,y′,z′). A 2D detector array records the irradiance
I(x,y) = |A+E(x,y)|2= |A|2 + |E(x,y)|2 +A∗E(x,y)+AE∗(x,y), (7)
where the scattered field E is defined under the Born approximation as
E(x,y) =∫∫∫
dx′dy′dz′η(x′,y′,z′)h(x− x′,y− y′,z− z′), (8)
where h is the product of exp(ikz) representing the phase delay at a distance z [24] and the in-
verse Fourier transform of the propagation transfer function exp(iz√
k2 − k2x − k2
y) [25, Eqn. (3-
74)]. Note that the squared field term |E(x,y)|2 produces the autocorrelation of the Fouriertransform of the field E in the Fourier domain. In Eqn. (7), the term |A|2 is simply a con-stant, and hence the effect of |A|2 can be removed by eliminating the DC term (the term atthe origin) from the Fourier transform of the interference irradiance measurements I(x,y).Also, we may assume that A is 1 without loss of generality. Then, we may proceed withA∗E(x,y)+ AE∗(x,y)+ |E(x,y)|2 = 2Re{E(x,y)}+ |E(x,y)|2 = 2Re{E(x,y)}+ e(x,y). If weneglect the nonlinearity caused by |E(x,y)|2 and regard e(x,y) as model error, then Eqn. (7)represents a linear mapping between the object scattering density and measurement data.
Let a 3D object (i.e., the scattering potential) be denoted by η(x′,y′,z′) with the conventionthat z′ = 0 at the detector plane. Let the sample spacings be Δx = Δy = Δ. Also, let Δz be the
(C) 2009 OSA 20 July 2009 / Vol. 17, No. 15 / OPTICS EXPRESS 13043#111469 - $15.00 USD Received 18 May 2009; revised 2 Jul 2009; accepted 5 Jul 2009; published 15 Jul 2009
Plane wave(633nm HeNe laser)
3D Object (η)Detector
array
Object field (E)
Hologram (I)
Reference field (A)
Fig. 1. Gabor hologram geometry.
sampling pitch in the z-axis. Let the number of pixels along each dimension of the detectorbe N. Using this notation, a 3D tomographic reconstruction problem may be formulated bynoting the similarity of the data to that in diffraction tomography [24, 26]. Recall that the2D field measurement E(x,y) is related to the 3D object scattering density η(x′,y′,z′) throughEqn. (8). Therefore, a discrete mathematical forward model for tomographic reconstruction canbe constructed by discretizing Eqn. (8).
The 2D sampled field at the detector plane with the sample spacings defined above can beexpressed by
En1n2 = E(n1Δ,n2Δ)
=1
(2π)2
∫· · ·
∫dz′dxdydkxdky
∫∫dx′dy′η(x′,y′,z′)eikz′e−i(kxx′+kyy′) ∑
m′1
∑m′
2
δ (x′ −m′1Δ)
δ (y′ −m′2Δ)eiz
√k2−k2
x−k2y δ (z− z′)e−i(kxx+kyy)δ (x−n1Δ)δ (y−n2Δ)∑
m1
∑m2
δ (kx −m1Δk)
δ (ky −m2Δk)∑l
δ (z− lΔz)
=1
N2 ∑l
∑m1
∑m2
⎡⎣∑
m′1
∑m′
2
ηm′1m′
2le−i2π
m1m′1+m2m′
2N
⎤⎦eiklΔze
ilΔz
√k2−m2
1Δ2k−m2
2Δ2k e−i2π n1m1+n2m2
N , (9)
where ηm′1m′
2l = η(m′1Δ,m′
2Δ, lΔz). Note that the terms in the square bracket form the 2D dis-crete Fourier transform of η . Also note that the last exponential term in the last line of Eqn. (9)
(C) 2009 OSA 20 July 2009 / Vol. 17, No. 15 / OPTICS EXPRESS 13044#111469 - $15.00 USD Received 18 May 2009; revised 2 Jul 2009; accepted 5 Jul 2009; published 15 Jul 2009
also forms the inverse 2D Fourier transform in conjunction with the summations over m1 andm2. Hence, this equation can simply be written as
En1n2 = F−12D
{∑l
ηm1m2leiklΔze
ilΔz
√k2−m2
1Δ2k−m2
2Δ2k
}, (10)
where η denotes the Fourier transform of η , and F−1 denotes the inverse Fourier transformoperator. Equation (10) is called a multislice approximation [26]. Eqn. (9) may also be viewedas a 2D slice of the 3D Fourier transform of η . The 2D slice can be interpreted as a surfacepatch of the Ewald k-sphere as in traditional diffraction tomography [27]. Note that while the3D Fourier transform interpretation requires 3D interpolation of either the 3D Fourier transformof η or the 3D spatial scattering density η , the multiscale approximation requires no suchinterpolation and is less sensitive to errors that would result from 3D interpolation.
Define g(n2−1)×Nx+n1= En1,n2 and f(l−1)×(Nx×Ny)+(m′
2−1)×Nx+m′1= ηm′
1,m′2,l , where Nx and Ny
denote the numbers of pixels of the detector in the x-direction and y-direction, respectively.With these definitions, Eqn. (10) may be rewritten as
g = G2DQB f , (11)
where B = bldiag(F2D,F2D, · · · ,F2D) with F2D being the matrix representing the 2D DFT whosesize is (Nx×Ny)×(Nx×Ny) and “bldiag” denoting the block diagonal matrix, Q = [P1P2 · · ·PNz ]
with [Pl ]m1m2 = eiklΔzeilΔz
√k2−m2
1Δ2k−m2
2Δ2k ; [Pl ]m1m2 represents the element of the matrix Pl at the
intersection of the row m1 and the column m2, and G2D represents the 2D inverse DFT matrix.As discussed earlier, ignoring the non-linearity of Eqn. (10) caused by the squared field term e,the Gabor hologram measurement may be algebraically written as
g = 2Re{g} = 2Re{G2DQB f} = 2Re{H f}+ e+n, (12)
where g ∈RNx×Ny represents the Gabor hologram from which the DC component is removed,Hi j = [G2DQB]i j, and e and n denote vectorized |E(x,y)|2 and additive noise, respectively.The nonlinear term is traditionally removed using off-axis holography. As demonstrated below,however, this term may be eliminated algorithmically from Gabor data using decompressiveinference. We discuss the effects of e in Sec. 5.
We remark that the elements of the measurement matrix H (e.g., see Eqn. (12)) in holographyare complex valued. In contrast, the typical optical imaging modality provides only nonnegativevalues because the only observable are the intensities. Such nonnegativity constraints confinethe measurement basis space to be only the nonnegative orthant, which limits the angles be-tween the measurement basis vectors (the columns of H) and effectively makes the coherencevalues large. On the other hand, interferometric imaging modalities such as holography allowthe measurement vectors to reside in the entire space as opposed to the nonnegative orthant byallowing for negative values in the measurement basis vectors. Such negative values may enableus to design a sensing system with a small coherence value. This advantage with holographyfor compressive sensing remains valid in Gabor holography because although the f and g maybe assumed to be real, the elements of the multiplex encoder H are still complex valued. Wealso note that in other holography such as the Leith-Upatnieks holography [25], the f and g aswell as H are, in general, all complex valued.
Prior to discussing experimental estimation of f from Eqn. (12), we briefly consider the spa-tial resolution expected in the reconstruction and a sparsity constraint to enable decompressiveinference. Optical measurement over a finite aperture is bandlimited. The band volume is thesupport in the 3D Fourier space of η(x′,y′,z′) for sampling E(x,y) over a finite aperture. Spa-tial resolution in imaging systems is assumed to be inversely proportional to the limits of the
(C) 2009 OSA 20 July 2009 / Vol. 17, No. 15 / OPTICS EXPRESS 13045#111469 - $15.00 USD Received 18 May 2009; revised 2 Jul 2009; accepted 5 Jul 2009; published 15 Jul 2009
band volume, which yields transverse resolution Δx = λ z/D for objects at range z observedover aperture D and the axial resolution is Δz = λ (2z)2/D2 [28]. Our objective is to achievethis resolution over the 3D datacube using decompressive inference of a 2D hologram.
If the entire diffraction pattern is captured by the hologram, the effective aperture size Dfor a Gabor hologram observed in the Fresnel diffraction zone is determined by size of theobject feature observed. A feature of cross section w produces a diffraction pattern with crosssection D ≈ λ z/w. This implies that Δx ≈ w and Δz ≈ 4w2/λ . The dependence of axial reso-lution on feature size is the result of the ”missing cone” in the paraxial band volume [28]. Themissing cone may be removed by recording holograms along multiple axes. In the experimentsdescribed here, however, we are satisfied with the single axis band limited resolution. We an-ticipate, for example, that object features of approximately 100μ cross section will be observedunder visible light with approximately 1 cm axial resolution.
Forward models such as Eqn. (12) have been inverted by decompressive inference by eitherselecting a basis, typically a particular wavelet basis, on which f may be assumed to be sparseor by enforcing a sparsity constraint on the total variation, as defined by Rudin et al [29], of f .We choose the second approach here and estimate f as
f = argminf
|| f ||TV such that g = H f , (13)
where ‖ f‖TV is defined by
‖ fk‖TV = ∑k
∑n1
∑n2
|∇( fk)n1,n2 |, (14)
where fk denotes a 2D plane of the 3D object datacube. We adapt the two-step iterative shrink-age/thresholding algorithm (TwIST) [30] to solve this optimization problem.
4. Experimental results
The light scattered from the object and the collimated beam, which served as the referencebeam, overlapped on a Lumenera LU100 1280×1040 pixel focal plane array with pixel pitchof 5.2 μm. We cropped the array of measurements to a 1024×1024 array, which is then down-sampled to a 512×512 array using B-spline functions. The hologram, which is the interferencepattern produced on the sensor, was digitized with 10 bits accuracy. The measurement vectorg is then zero-padded on all four sides to create a 712× 712 array to avoid the artifact of thecircular convolution caused by using FFT. For our simulations, the matrix H has the size of(712×712)× (712×712×10) with 10 being the number of object planes that can be changedby adjusting the related parameter. The reconstruction was performed on a digital computerwith Intel Core2 Quad CPU Q9300 at 2.5 GHz and 8 GB of RAM. The data processing takesabout 4 hours for H with the size of (712× 712)× (712× 712× 10). The codes were writtenin Matlab 7.7.
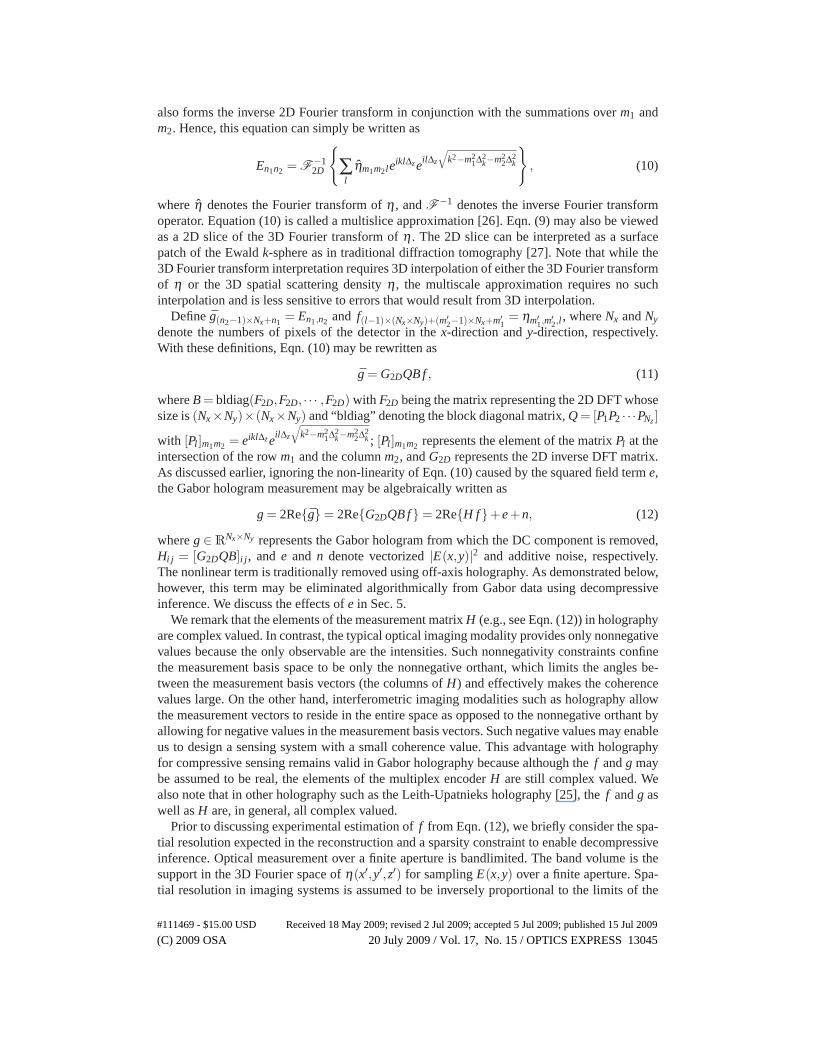
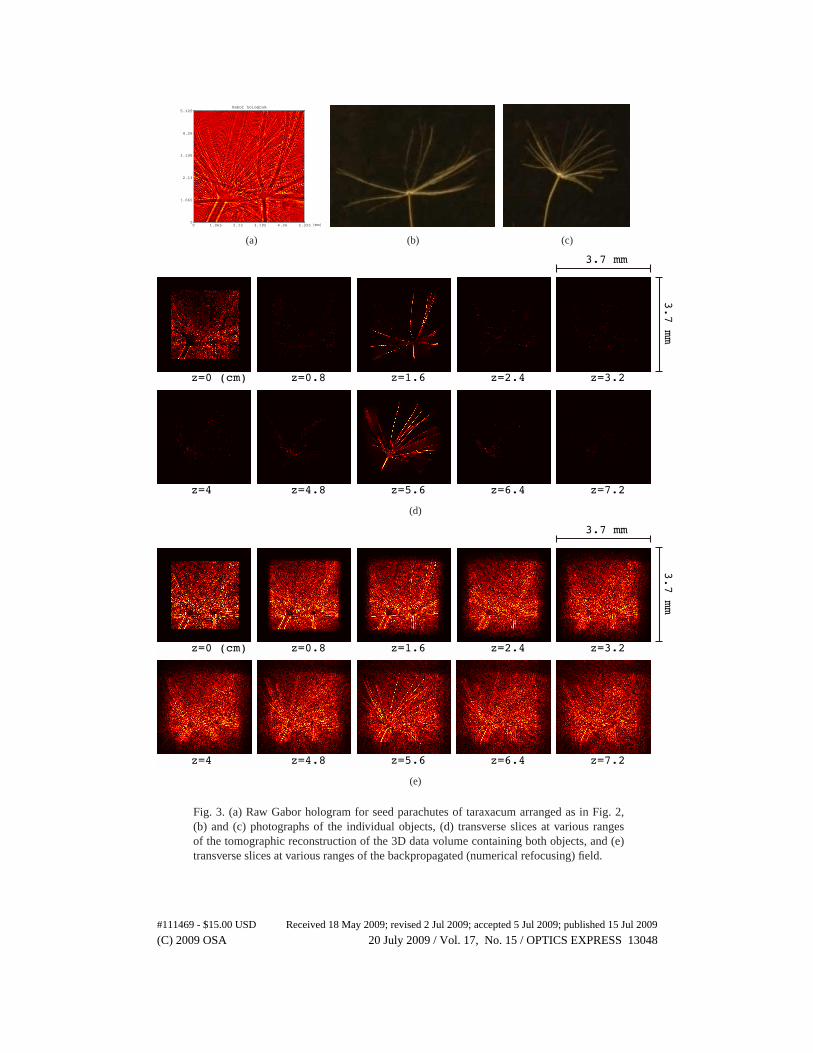
As illustrated in Fig. 2, we illuminated two seed parachutes of common dandelions (tarax-acum) with a collimated, spatially filtered Helium-Neon laser of 632.8 nm wavelength. Oneobject is placed 1.5 cm away from the detector array, and the other dandelion is placed 5.5 cmaway from the detector array. Figures 3(b) and 3(c) are photographs of the two seed parachutes.The illumination and scattered fields were captured in the Gabor hologram shown in Fig. 3(a).Figure 3(d) is the 3D datacube estimated from the Gabor recording by the TV-minimization al-gorithm. As the reconstruction shows, the stem and the petals, representing the high-frequencyfeatures in the image, are reconstructed well. In addition, the distance between the detectorplane and the first parachute and the distance between the two parachutes are also accuratelyestimated. We notice that there are still some errors in some reconstruction planes including the
(C) 2009 OSA 20 July 2009 / Vol. 17, No. 15 / OPTICS EXPRESS 13046#111469 - $15.00 USD Received 18 May 2009; revised 2 Jul 2009; accepted 5 Jul 2009; published 15 Jul 2009
5.5 cm
1.5 cm
Fig. 2. Experimental apparatus.
planes in which the two seed parachutes. We conjecture that the errors are mainly reconstruc-tion errors and the effects of noise, and they occur because of the rather insufficient numberof measurements. The reconstruction errors can be suppressed by exploiting the phase-shiftingholography that can increase the effective SNR and the effective number of measurements [31].The reconstruction error in the plane of z = 0 is explained in Sec. 5. Figure 3(e) shows thebackpropagated (or digital refocusing) field that is obtained by digitally backpropagating thehologram using the propagation kernel h in Eqn. (8) [25]. In contrast to the reconstruction inFig. 3(d), the backpropagated field shows messy planes full of out-of-focus features obscuringthe object features of the two parachutes.
5. Discussion
To understand the effects of the squared field e(x,y) on the reconstruction, we consider thebehavior of the algorithm. The algorithm determines how much portion of the measurement(or measurement estimate) should be placed in which object plane based on the amount ofcorrelation that the diffraction patterns of the measurement and the diffraction pattern that theestimate at a particular object plane would produce. The squared field e is inclined to producethe diffraction patterns that bear little correlation with all of the object planes. Consequently,most of the reconstruction error caused by e tends to remain in the plane of z = 0. In this way,we may effectively isolate most of the errors that result from the squared field term. Since theseerrors are concentrated in the plane of z = 0 (measurement plane), such reconstruction valuesare not part of the object scattering density η by definition. Therefore, we may effectivelyremove most of the errors that would result from the squared field (zero-order) term in thereconstructions.
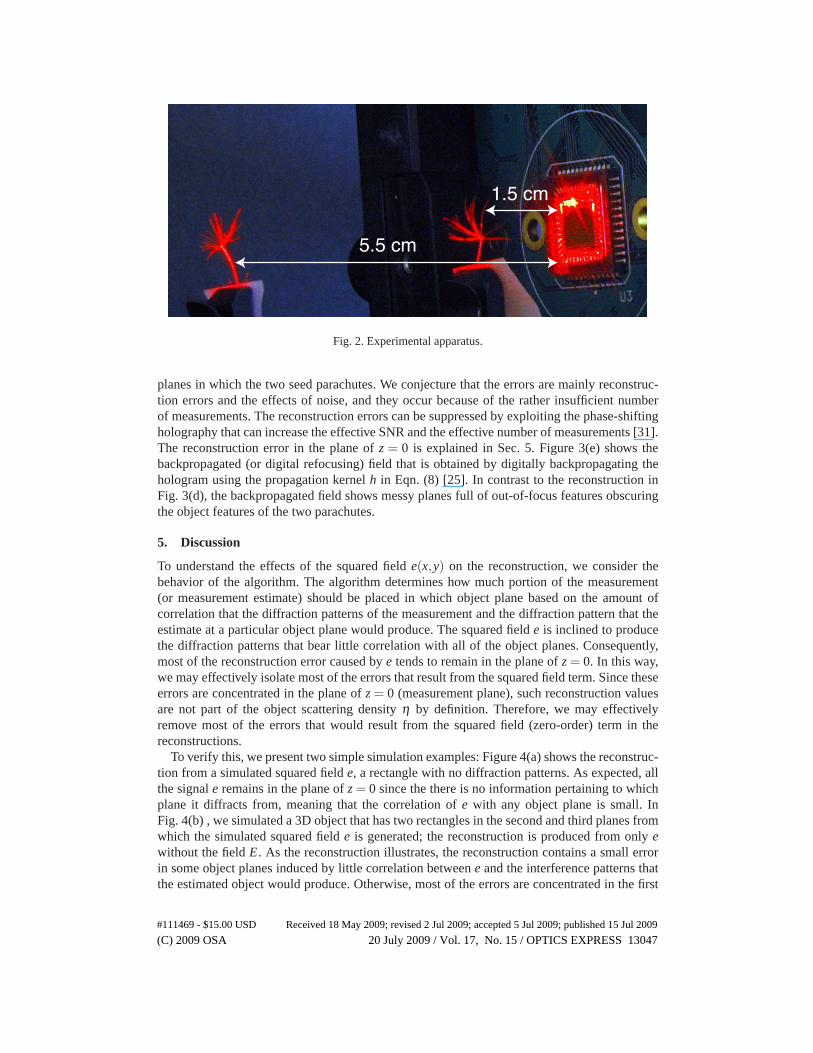
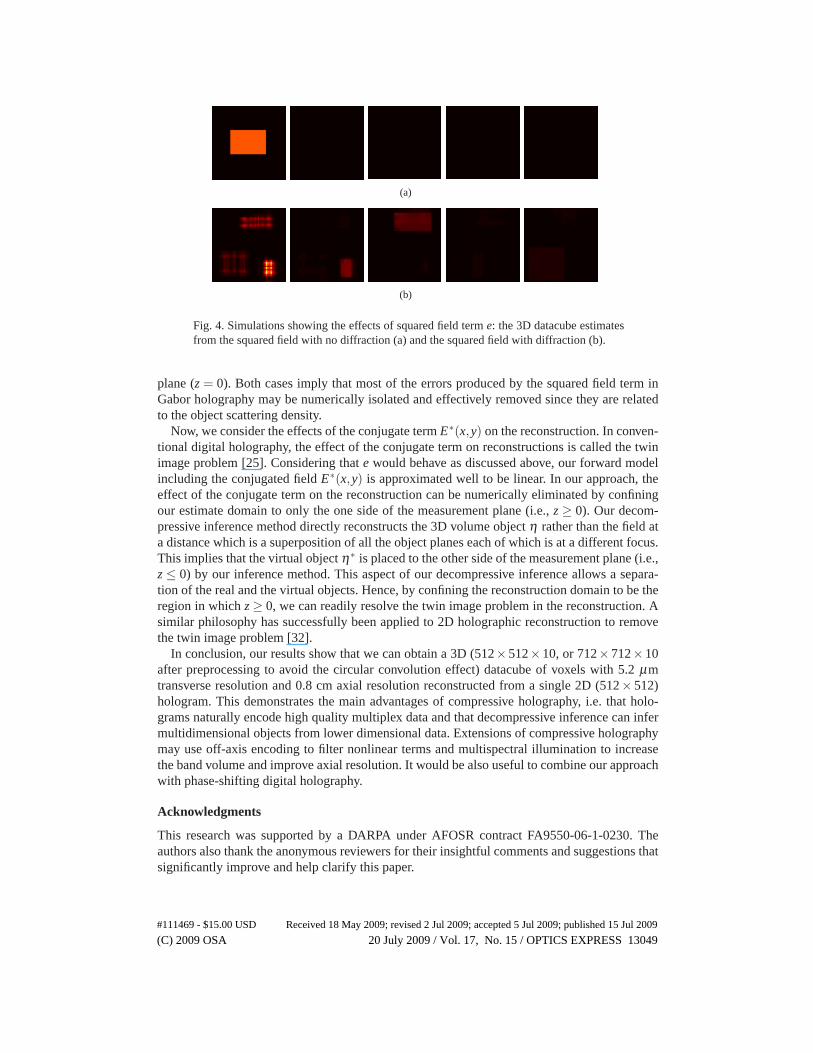
To verify this, we present two simple simulation examples: Figure 4(a) shows the reconstruc-tion from a simulated squared field e, a rectangle with no diffraction patterns. As expected, allthe signal e remains in the plane of z = 0 since the there is no information pertaining to whichplane it diffracts from, meaning that the correlation of e with any object plane is small. InFig. 4(b) , we simulated a 3D object that has two rectangles in the second and third planes fromwhich the simulated squared field e is generated; the reconstruction is produced from only ewithout the field E. As the reconstruction illustrates, the reconstruction contains a small errorin some object planes induced by little correlation between e and the interference patterns thatthe estimated object would produce. Otherwise, most of the errors are concentrated in the first
(C) 2009 OSA 20 July 2009 / Vol. 17, No. 15 / OPTICS EXPRESS 13047#111469 - $15.00 USD Received 18 May 2009; revised 2 Jul 2009; accepted 5 Jul 2009; published 15 Jul 2009
Gabor hologram
(mm)0 1.065 2.13 3.195 4.26 5.325
5.325
4.26
3.195
2.13
1.065
0
(a) (b) (c)
z=0 (cm) z=0.8 z=1.6 z=2.4 z=3.2
z=4 z=4.8 z=5.6 z=6.4 z=7.2
3.7 mm
3.7 mm
(d)
z=0 (cm) z=0.8 z=1.6 z=2.4 z=3.2
z=4 z=4.8 z=5.6 z=6.4 z=7.2
3.7 mm
3.7 mm
(e)
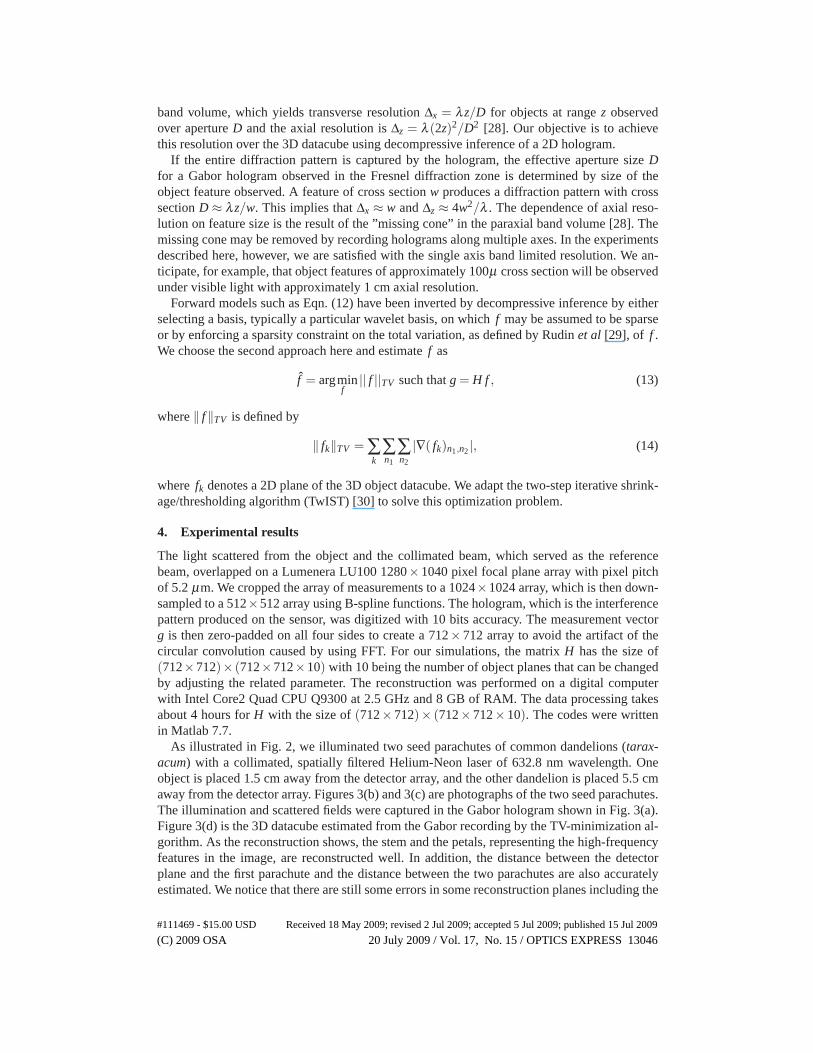
Fig. 3. (a) Raw Gabor hologram for seed parachutes of taraxacum arranged as in Fig. 2,(b) and (c) photographs of the individual objects, (d) transverse slices at various rangesof the tomographic reconstruction of the 3D data volume containing both objects, and (e)transverse slices at various ranges of the backpropagated (numerical refocusing) field.
(C) 2009 OSA 20 July 2009 / Vol. 17, No. 15 / OPTICS EXPRESS 13048#111469 - $15.00 USD Received 18 May 2009; revised 2 Jul 2009; accepted 5 Jul 2009; published 15 Jul 2009
(a)
(b)
Fig. 4. Simulations showing the effects of squared field term e: the 3D datacube estimatesfrom the squared field with no diffraction (a) and the squared field with diffraction (b).
plane (z = 0). Both cases imply that most of the errors produced by the squared field term inGabor holography may be numerically isolated and effectively removed since they are relatedto the object scattering density.
Now, we consider the effects of the conjugate term E∗(x,y) on the reconstruction. In conven-tional digital holography, the effect of the conjugate term on reconstructions is called the twinimage problem [25]. Considering that e would behave as discussed above, our forward modelincluding the conjugated field E∗(x,y) is approximated well to be linear. In our approach, theeffect of the conjugate term on the reconstruction can be numerically eliminated by confiningour estimate domain to only the one side of the measurement plane (i.e., z ≥ 0). Our decom-pressive inference method directly reconstructs the 3D volume object η rather than the field ata distance which is a superposition of all the object planes each of which is at a different focus.This implies that the virtual object η∗ is placed to the other side of the measurement plane (i.e.,z ≤ 0) by our inference method. This aspect of our decompressive inference allows a separa-tion of the real and the virtual objects. Hence, by confining the reconstruction domain to be theregion in which z ≥ 0, we can readily resolve the twin image problem in the reconstruction. Asimilar philosophy has successfully been applied to 2D holographic reconstruction to removethe twin image problem [32].
In conclusion, our results show that we can obtain a 3D (512×512×10, or 712×712×10after preprocessing to avoid the circular convolution effect) datacube of voxels with 5.2 μmtransverse resolution and 0.8 cm axial resolution reconstructed from a single 2D (512× 512)hologram. This demonstrates the main advantages of compressive holography, i.e. that holo-grams naturally encode high quality multiplex data and that decompressive inference can infermultidimensional objects from lower dimensional data. Extensions of compressive holographymay use off-axis encoding to filter nonlinear terms and multispectral illumination to increasethe band volume and improve axial resolution. It would be also useful to combine our approachwith phase-shifting digital holography.
Acknowledgments
This research was supported by a DARPA under AFOSR contract FA9550-06-1-0230. Theauthors also thank the anonymous reviewers for their insightful comments and suggestions thatsignificantly improve and help clarify this paper.
(C) 2009 OSA 20 July 2009 / Vol. 17, No. 15 / OPTICS EXPRESS 13049#111469 - $15.00 USD Received 18 May 2009; revised 2 Jul 2009; accepted 5 Jul 2009; published 15 Jul 2009
Related Documents